final report: evaluation of tools and metrics to support
TRANSCRIPT
Research Report
Final Report: Evaluation of Tools and Metrics to Support Employer Selection of Health Plans Soeren Mattke, Kristin R. Van Busum, Grant Martsolf
Sponsored by the U.S. Department of Labor
The RAND Corporation is a nonprofit institution that helps improve policy and decisionmaking through research and analysis. RAND’s publications do not necessarily reflect the opinions of its research clients and sponsors. Support RAND—make a tax-deductible charitable contribution at www.rand.org/giving/contribute.html
R® is a registered trademark.
© Copyright 2013 RAND Corporation
This document and trademark(s) contained herein are protected by law. This representation of RAND intellectual property is provided for noncommercial use only. Unauthorized posting of RAND documents to a non-RAND website is prohibited. RAND documents are protected under copyright law. Permission is given to duplicate this document for personal use only, as long as it is unaltered and complete. Permission is required from RAND to reproduce, or reuse in another form, any of our research documents for commercial use. For information on reprint and linking permissions, please see the RAND permissions page (http://www.rand.org/pubs/permissions.html).
RAND OFFICESSANTA MONICA, CA • WASHINGTON, DC
PITTSBURGH, PA • NEW ORLEANS, LA • JACKSON, MS • BOSTON, MADOHA, QA • CAMBRIDGE, UK • BRUSSELS, BE
The research described in this report was sponsored by the U.S. Department of Labor, and was produced within RAND Health, a division of the RAND Corporation.
iii
Preface
This Research Report was sponsored by the U.S. Department of Labor. It is based on a review of the trade and scientific literature and health insurers’ websites; an analysis of product and service offerings from a random sample of 70 health insurance companies; an expert panel meeting with 15 individuals representing a variety of perspectives, including academia, consumer advocacy groups, measures developers, and employer coalitions; and case study interviews with nine employers and business coalitions. The report describes a conceptual framework of health plan features, evaluates the current availability of quality measures and decision tools to employers, and describes how employers make decisions when choosing a health plan. This report will be of interest to national and state policymakers, employers and employer coalitions, consumer advocacy organizations, measures developers and health researchers, and others with responsibilities related to achieving better transparency on the quality that different health plans provide and facilitate employer decisionmaking.
This research was conducted under contract #DOLJ089327414 with the Employee Benefits Security Administration of the U.S. Department of Labor, as part of a study to help employers understand the structural differences between health plans and the performance dimensions along which plans can differ, as well as to educate them about tools and resources that can be used to compare plan options. The Task Order Officer for the project is Elaine Zimmerman of the Employee Benefits Security Administration, Department of Labor. We thank the Task Order Officer for her guidance and reviews of the document; however, we note that the material contained in this report is the responsibility of the research team and does not necessarily reflect the beliefs or opinions of the Task Order Officer, the Employee Benefits Security Administration, the Department of Labor, or the federal government.
This research was conducted in RAND Health, a division of the RAND Corporation. A profile of RAND Health, abstracts of its publications, and ordering information can be found at www.rand.org/health. Comments or inquiries concerning this report should be sent to the lead author, Soeren Mattke, at [email protected] or to his address at RAND: RAND Corporation, 20 Park Plaza, Suite 920, Boston, MA 02116.
iv
Contents
Preface ............................................................................................................................................ iii Figures............................................................................................................................................ vi Tables ............................................................................................................................................ vii Summary ...................................................................................................................................... viii Acknowledgments ...................................................................................................................... xviii Abbreviations ............................................................................................................................... xix 1. Introduction ............................................................................................................................... 1
1.1 Background: The Role of Employers Under the National Quality Strategy ...................................... 1 1.2 Purpose of the Report ......................................................................................................................... 2
2. Technical Approach .................................................................................................................. 4 2.1 Development of Conceptual Framework ........................................................................................... 4 2.2 Environmental Scan ........................................................................................................................... 4 2.3 Expert Panel Meeting ......................................................................................................................... 5 2.4 Interviews with Employers and Business Coalition Representatives ................................................ 5
3. Conceptual Framework ............................................................................................................. 7 3.1 Understanding the Anatomy of a Health Plan ................................................................................... 7 3.2 Defining Care Processes for Measurement Purposes ........................................................................ 8 3.3 Defining Outcomes for Measurement Purposes ................................................................................ 9 3.4 Measuring Quality of Health Care ..................................................................................................... 9
4. Provider-Facing Structural Characteristics of Health Plans ................................................... 11 4.1 Network Management ...................................................................................................................... 11 4.2 Payment Arrangements .................................................................................................................... 12
5. Member-Facing Structural Characteristics of Health Plans .................................................... 18 5.1 Customer Service ............................................................................................................................. 18 5.2 Cost-Sharing Provisions ................................................................................................................... 18 5.3 Care Management ............................................................................................................................ 19
Products and Services for Chronic Condition Management .............................................................. 20 Products and Services for Curative Care ............................................................................................ 21 Products and Services for Health Promotion ...................................................................................... 23
5.4 Evaluation of Member-Facing Characteristics of Health Plans ....................................................... 24 6. Process Measures .................................................................................................................... 27
6.1 Safe Practices ................................................................................................................................... 28 Definition ............................................................................................................................................ 28 State of Measurement Science ............................................................................................................ 29
6.2 Adherence to Evidence-Based Care Guidelines .............................................................................. 29 Definition ............................................................................................................................................ 29 State of Measurement Science ............................................................................................................ 30

v
6.3 Overuse of Medical Services ........................................................................................................... 31 Definition ............................................................................................................................................ 31 State of Measurement Science ............................................................................................................ 32
6.4 Evaluation of Current State of Process Quality Measurement ........................................................ 33 7. Outcomes Measures ................................................................................................................ 35
7.1 Medical Outcomes ........................................................................................................................... 36 Definition ............................................................................................................................................ 36 State of Measurement Science ............................................................................................................ 36
7.2 Patient-Centeredness ........................................................................................................................ 37 Definition ............................................................................................................................................ 37 State of Measurement Science ............................................................................................................ 38
7.3 Efficiency ......................................................................................................................................... 38 Definition ............................................................................................................................................ 38 State of Measurement Science ............................................................................................................ 39
7.4 Evaluation of Current State of Outcomes Measurement ................................................................. 39 8. State of Practice in Employer Decisionmaking About Health Plans ...................................... 42
8.1 Information Sources ......................................................................................................................... 42 Decision Tools .................................................................................................................................... 42 Employer Coalitions ........................................................................................................................... 43 Benefits Consultants ........................................................................................................................... 44 Evaluation of Tools and Resources to Support Employer Decisionmaking ...................................... 45
8.2 Decision Criteria for Health Plan Selection ..................................................................................... 45 Cost Is the Primary Driver .................................................................................................................. 45 Employers Aim to Ensure Network Adequacy .................................................................................. 46 General Reputation of Plans Influences Purchasing Decisions. ......................................................... 46 Quality of a Health Plan Is Rarely Factored Explicitly into Decisions .............................................. 47 Quality-Enhancing Products and Services Are Considered Low Priority .......................................... 47
9. Conclusions ............................................................................................................................. 48 9.1 Current State of Measurement Science ............................................................................................ 48 9.2 Current State of Employer Decision Tools Regarding Quality of Care .......................................... 48 9.3 Current State of Employer Decision Process for Quality of Care ................................................... 49 9.4 Implications for Research Agenda ................................................................................................... 50
Appendix A: Description of Summary of Benefits and Coverage and Glossary of Terms .......... 52 Appendix B: Description of Search Strategies and Tools ............................................................ 55 Appendix C: Descriptions of Quality Measurement and Reporting Organizations ..................... 58 Appendix D: Descriptions of Quality Measurement and Reporting Organizations ..................... 63 References ..................................................................................................................................... 67
vi
Figures
Figure S.1. Conceptual Framework to Categorize Differences Between Health Plans .................. x Figure S.2. Spectrum of Provider Payment Arrangements ........................................................... xii Figure 3.1. Conceptual Framework to Categorize Differences Between Health Plans .................. 7 Figure 3.2. Levels of Health Care Quality Measurement ............................................................... 9 Figure 4.1. Spectrum of Provider Payment Arrangements ........................................................... 16 Figure 5.1. Health Plan Offerings to Improve Chronic Care* ...................................................... 21 Figure 5.2. Health Plan Offerings in Curative Care ...................................................................... 22 Figure 5.3. Health Promotion Service Offerings .......................................................................... 23
vii
Tables
Table 2.1. Characteristics of Case Study Employers ...................................................................... 6 Table 6.1. Examples of Process Measures for Safety ................................................................... 29 Table 6.2. Examples of Effectiveness Process Measures: Care During Office Visit ................... 30 Table 6.3. Examples of Effectiveness Process Measures: Care During Hospital Stay ................. 31 Table 6.4. Examples of NQF-Endorsed Measures of Overuse ..................................................... 33 Table 7.1. Example of Intermediate Outcome Measures .............................................................. 37 Table 7.2. Examples of Health Outcome Measures ...................................................................... 37 Table 7.3. Examples of Patient-Experience Measures in the CAHPS, CG-CAPHS, and
H-CAHPS Measure Sets ....................................................................................................... 38 Table A.1. Summary of Benefits and Coverage* ......................................................................... 53 Table A.2. Coverage Examples* .................................................................................................. 54 Table D.1. Effectiveness Process Measures: Care During Office Visit ....................................... 63 Table D.2. Effectiveness Process Measures: Care During Hospital Stay ..................................... 64 Table D.3. NQF-Endorsed Measures of Overuse ......................................................................... 65 Table D.4. Patient Experience Measures in the CAHPS and H-CAHPS Measure Sets ............... 66
viii
Summary
Background: The Role of Employers Under the National Quality Strategy
The Patient Protection and Affordable Care Act (Affordable Care Act) places strong emphasis on quality of care as a means to improve outcomes for Americans and promote the financial sustainability of our health care system. Notably, Section 3011 of the Affordable Care Act mandates the Secretary of Health and Human Services to establish the National Quality Strategy with the aim to increase access to high-quality, affordable health care for all Americans. The National Quality Strategy is centered on the Institute of Medicine’s (IOM’s) so-called “Triple Aim”: better care, better health, and lower cost.
Executing such a strategy requires participation from a wide range of stakeholders, such as providers, federal agencies, health plans,1 and employers. More than half of the U.S. population receives employment-based health plan coverage, and the Affordable Care Act will expand employment-based coverage. Employers are in a unique position to communicate health-related information to employees during the workday and through company communications and can therefore exert positive influence on health and health care related decisions. Employers stand to benefit from better quality of care through improved productivity and less illness-related work loss. Further, employers and employee organizations offering health coverage to employees have a fiduciary duty under the Employee Retirement Income Security Act of 1974 (ERISA) to manage plans solely in the interest of participants and beneficiaries.
The Affordable Care Act supports employers in procuring high-value coverage options by codifying new disclosure requirements that require health plans to provide a summary of benefits and coverage (SBC) that accurately describes the benefits under the plan or coverage. In addition, plan or insurers must provide a uniform glossary, which provides definitions of common terms used in health coverage. In the SBC, group health plans and health insurance issuers are required to provide disclosures to illustrate potential financial exposure of plan participants and beneficiaries based on real-world examples.2
These new disclosure requirements are critical to achieve better transparency on the coverage that different health plans provide and thus serve as a welcome new tool for employers, employee organizations (e.g., multi-employer plans), participants, and beneficiaries to make
1 We recognize that employers may self-insure or be fully insured. Some self-insured plans may use health insurance companies only to administer their plan as a third-party administrator but not to insure them against financial risk. To improve readability, we are using the term “plan or coverage” throughout the report to reflect both insured and self-insured health plan coverage offered by employers. 2 Affordable Care Act, section 2715
ix
informed choices. In the long run, the expectation is that the information will foster an environment, in which health plans compete on value, with the potential to reduce overall health spending while improving quality.
Against this background, this report attempts to help employers understand the structural differences between health plans and the performance dimensions along which plans can differ, as well as to educate them about tools and resources that can be used to compare plan options. We used an environmental scan, which consisted of a review of scientific and trade literature and health insurance companies’ websites; expert panels; and case studies to evaluate the current availability of quality measures and decision tools that can inform employers’ choices of health plans and today’s actual practice of plan selection.
Understanding the Anatomy of a Health Plan As health plans can differ along numerous characteristics, we started by creating a simplified
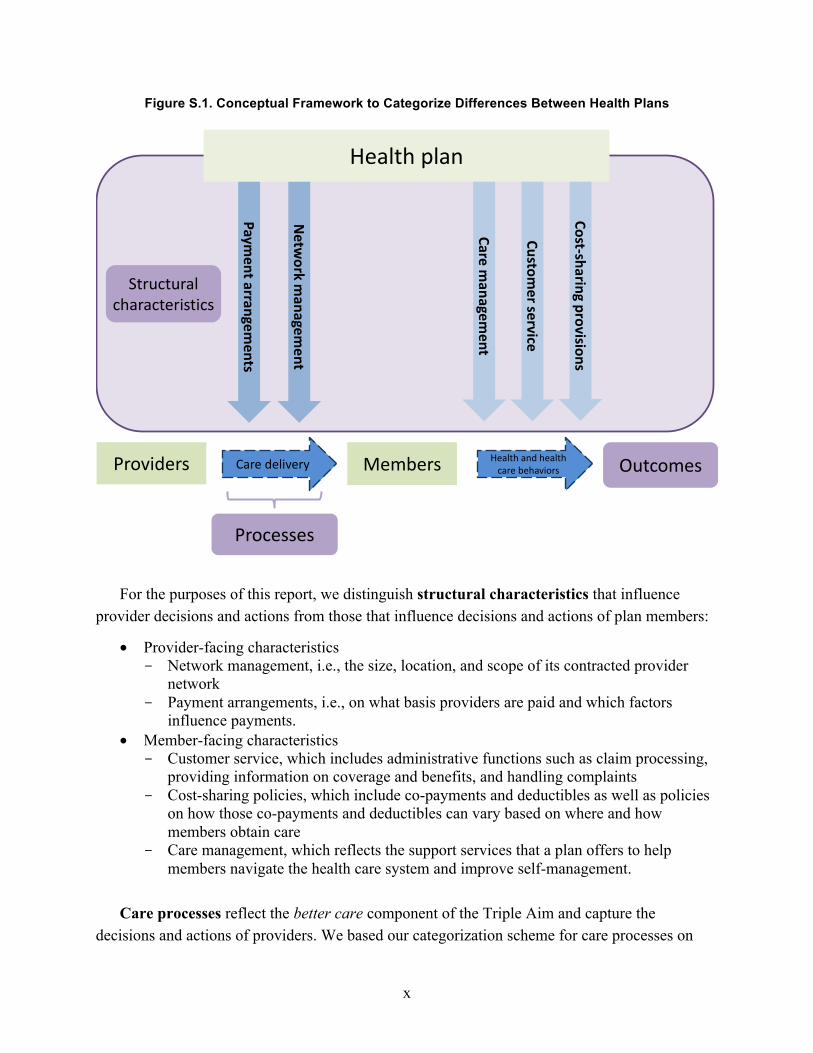
framework that allows employers to understand these differences and the results that health plans achieve (Figure S.1). In short, the framework reflects the fact that the structural characteristics of a health plan set the context under which health care providers deliver care (or which processes they use) and how those care processes, combined with health and health care–related decisions and choices of plan members, result in outcomes. In this report, we emphasize a review of structural characteristics as those are commonly marketed as product differentiators to employers.
x
Figure S.1. Conceptual Framework to Categorize Differences Between Health Plans
For the purposes of this report, we distinguish structural characteristics that influence
provider decisions and actions from those that influence decisions and actions of plan members:
• Provider-facing characteristics - Network management, i.e., the size, location, and scope of its contracted provider
network - Payment arrangements, i.e., on what basis providers are paid and which factors
influence payments. • Member-facing characteristics
- Customer service, which includes administrative functions such as claim processing, providing information on coverage and benefits, and handling complaints
- Cost-sharing policies, which include co-payments and deductibles as well as policies on how those co-payments and deductibles can vary based on where and how members obtain care
- Care management, which reflects the support services that a plan offers to help members navigate the health care system and improve self-management.
Care processes reflect the better care component of the Triple Aim and capture the decisions and actions of providers. We based our categorization scheme for care processes on
Health plan
MembersProviders
Care managem
ent
Cost-‐sharing provisions
Care delivery
Customer service
Structural characteristics
Processes
Health and health care behaviors Outcomes
Netw
ork managem
ent
Payment arrangem
ents
xi
work by the Agency for Healthcare Research and Quality (AHRQ) that describes high-value care processes as “striking the right balance of services by eliminating misuse (for example, providing medications that may have dangerous interactions), avoiding overuse (for example, performing tests that a patient does not need), and avoiding underuse (for example, not screening a person for high blood pressure)” (Agency for Healthcare Research and Quality, 2008). The categorization scheme is as follows:
• Safe practices (e.g., use of electronic prescribing) • Adherence to evidence-based guidelines and current standards of care (e.g., percentage of
plan participants who receive mammograms) • Avoidance of overuse (e.g., avoidance of unnecessary and potentially harmful medical
services (Institute of Medicine Committee on Quality of Health Care in America, 2001) We based our categorization scheme for care outcome measures on the IOM report entitled
Crossing the Quality Chasm, and use three domains for outcomes measurement:
• Medical outcomes, reflecting safety, timeliness, and effectiveness, can be captured at two levels - Intermediate (or proxy) outcomes, such as control of hypertension - Health outcomes, which can be positive, such as functional status, and negative, such
as surgical complications • Patient experience, a measure used to capture a health plan’s patient-centeredness • Efficiency measures, which reflect resource use per relevant outcome (or value), as
opposed to cost measures that do not consider medical or patient-centered outcomes.
Provider-Facing Structural Characteristics of Health Plans
Network management captures how well a plan matches providers to the needs of plan participants and their dependents, with respect to the extent of the network (i.e., number and specialty mix of physicians and hospitals) and the capacity of the network to accept new patients. The quality of network management is commonly measured by metrics for network adequacy. The Affordable Care Act has brought significant attention to the issue of network adequacy, and requires the Secretary of Health and Human Services to establish certification criteria for qualified health plans participating in a state’s Health Insurance Marketplace (National Association of Insurance Commissioners, 2012).3 In response to the requirements of the Affordable Care Act, the Secretary issued a final rule stating that, in order to qualify for the Health Insurance Marketplace, health plans must
• include essential community providers • maintain a network that is sufficient in number and types of providers, including
providers that specialize in mental health and substance-abuse services, to assure that all services will be accessible without unreasonable delay
3 Affordable Care Act, section 1311(c)

xii
• be consistent with the network adequacy provisions of section 2702(c) of the Public Health Services Act (PHSA).
Although the law and resulting rules have brought significant attention to measuring and reporting of network adequacy, standardized and widely accepted measures for network adequacy are still lacking and a broad range of operational definitions is used by different entities.
Payment arrangements are the ways in which health plans compensate providers for services delivered. As different arrangements imply different incentives for providers, it is important for health plan purchasers to understand various payment arrangements and their implications for provider behavior. Since the historically dominant fee-for-service arrangement is increasingly considered suboptimal for patients with chronic conditions (who require care coordination and ongoing disease management rather than episodic encounters), public and private payers have started to explore alternative payment models to better align care delivery with patient needs. Figure S.2 displays commonly used payment arrangements, in order of increasing financial risk to providers.4
Figure S.2. Spectrum of Provider Payment Arrangements
* This includes the scenario in which provider and payer are completely integrated (e.g., a Health Maintenance Organization) and providers are salaried. Under this circumstance, there is no distinction between provider and payer. ** Pay for performance elements can be used under any payment arrangement. Given the increasing variety of provider payment models, it is important for employers,
employee organizations (e.g., union plans), participants, and beneficiaries to have a general understanding of how providers under a given health plan option are paid. However, because there are many possible payment arrangements, employers are unlikely to have a deep
4 It should be noted that the actual degree of risk sharing will depend on the contractual details of the payment arrangements.
xiii
understanding of each payment arrangement, and are therefore less likely to choose the “best” option. Furthermore, it is also important to keep in mind that the payment models are not unambiguously defined—the same term can have different meanings in different contexts. For example, the Centers for Medicare and Medicaid Services (CMS) has a very detailed definition and regulations for Medicare Accountable Care Organizations (ACOs), the National Committee for Quality Assurance (NCQA) has put forth its own accreditation standards for ACOs, and individual health plans are using their own definitions. Employers should review each plan’s actual details to gain a general understanding of how providers are paid under a given arrangement and how that payment arrangement may influence provider decisionmaking. For example, shifting financial risk to providers may reduce the cost of care, but can also create concerns about underuse, as providers do not benefit financially from additional services.
Member-Facing Structural Characteristics of Health Plans
Customer service is the part of a health plan that is most directly member-facing, and is therefore of critical importance to overall patient experience. It includes communication with members about benefits and network, the handling of claims, the appeals process for denied claims or denied authorization of services, and other services.
Cost-sharing provisions attempt to create incentives for plan participants and beneficiaries toward desirable health and health care–related decisions. Such incentives can be part of the benefit design and differential co-payments, based on consumer decisions on how and where to seek care, can be used to steer enrollees to care options that are seen as offering improved quality and/or efficiency. Two commonly seen types of such benefit designs are Consumer Directed Health Plans and tiered benefit designs. Incentives can also take the form of direct rewards or penalties that are linked to participation in wellness programs, which can include participatory programs or health-contingent programs focused on incentivizing individuals for achieving specific health targets (e.g., reduced tobacco use, weight loss).
Care management services are increasingly offered by health plans and include support for members with chronic care needs, assistance in patient recovery from acute illness, and programs to encourage healthier lifestyles. The two most common services for patients suffering from chronic conditions are disease management, which targets patients with defined chronic diseases such as diabetes, and case management, which supports patients with high costs of care, irrespective of the underlying conditions. Patients who experience a severe acute illness can get support through nurse advice lines, acute care case management, cancer treatment management, and discharge planning. The most commonly offered products and services to promote health and prevent disease include health risk assessments (HRAs), fitness club membership discounts, biometric screenings, and smoking cessation programs.

xiv
Current State of Process Quality Measurement Process measures capture whether providers are following safe practices, deliver all
guideline-recommended care and avoid services that have no proven clinical benefit. According to our technical expert panel, early efforts to measure quality were driven by providers largely for the purpose of quality-improvement projects, as opposed to payment or driving patients’ selection of providers. This has led to the development of a large number of process measures that reflect how well care is aligned with evidence and standards. Using such granular and highly technical measures is difficult for employers, but the emergence of rigorous standards for measure evaluation, particularly the National Quality Forum (NQF) process, implies that measures in national use can be assumed to be scientifically sound and relevant. The endorsement process has also led to convergence, as organizations prioritize endorsed measures rather than creating their own.
Our review suggests that many process measures have been developed and are being developed. While several domains of care remain insufficiently represented, we identified the lack of measures for overuse of care as the most important gap in process measurement. With increasing evidence that selected medical services are overused (i.e., services that are unlikely to have clinical benefit or can be potentially harmful), there is a growing interest in measures that would capture such overuse and help efforts to address it. But efforts to develop additional overuse measures are often met with resistance, as providers view them as interfering with independent clinical decisionmaking. To establish acceptable measures for overuse, medical specialists, professional societies, and the research community need to collaborate to incorporate explicit standards for appropriate and inappropriate use into guidelines, especially of high-cost and high-volume procedures. An example for such an effort is the Choosing Wisely campaign.
Current State of Outcomes Measurement
Of the three areas of relevant outcomes (medical, patient experience, and efficiency), only the area of patient experience has a widely accepted measure set, in the form of the AHRQ Consumer Assessment of Healthcare Providers and Systems (CAHPS) instruments. Some measures for intermediate and health outcomes have been developed, but substantial gaps remain. Most notably, little progress has been made to date in the measurement of efficiency of care. Available measures mostly consider cost or utilization, but do not assess resource per relevant outcome, and the state of the measurement science is too underdeveloped to suggest that scientifically sound efficiency measures will become available soon. Hence, providing side-by-side cost and quality information to employers is currently seen as the best alternative to reporting efficiency of care.
xv
State of Practice in Employer Decisionmaking About Health Plans While the measurement science for most domains of quality has evolved substantially, our
findings suggest that employers do not factor quality measures into their decisions about health plans. The main reason appears to be that employers find it difficult to interpret the complex and detailed information that is embedded in individual quality measures. Several tools have emerged that integrate complex information on quality, and further development is ongoing in this area. Examples are standardized information requests with health plan scoring algorithms, accreditation by external organizations, and ratings systems. While such tools can theoretically help employers to make informed decisions on health plans, we did not find published evidence on actual use of these tools, and our interviews suggest that employers have not yet adopted them widely. Rather, they tend to rely on the advice of benefits consultants and, to a lesser degree, input obtained through employer coalitions.
We also learned that employers primarily consider their cost of coverage when choosing a health plan. Second only to costs, employers consider network adequacy when choosing health plans. General reputation arose as another important criterion when choosing a health plan, as it serves as heuristic for quality and matters for employee satisfaction, even though lower cost or higher quality options may be available from a less well-known health plan. The concern for wide network access and overall reputation holds important implications for how employers think about and consider the issues of quality and quality improvement. Because all health plans in employers’ choice sets have large networks that include most relevant hospitals and physicians, employers perceive that there is no meaningful variation in quality across plans. Therefore, employer representatives are reluctant to consider the “quality” of a health plan as a decision criterion. Instead, employers focus on using consumer engagement strategies to steer their employees to the highest-quality providers within those broad networks.
Conclusions
Our findings suggest that our understanding of what differentiates health plans structurally and how we measure their performance has improved, and that tools and resources to help employers use such information are emerging. In theory, this evolution put employers into a position to select health plans based on quality.
In practice, however, employers base their decisions mostly on cost considerations, the reputation of a plan, and their employees’ preference to have access to a broad provider network. While a small set of sophisticated employers may conduct a complex evaluation process that is based on multiple criteria, the typical employer, simply speaking, balances its own desire to control cost of coverage with its employees’ desire for provider choice, with limited explicit regard for quality of care. This simple decision rule limits the degree to which employer decisions on health plans can influence quality of care. If most employers in a market demand access to a broad provider network, health plans will try to offer coverage products that exclude
xvi
only few providers. Thus, there will be considerable overlap between the provider networks with which competing plans contract. The overlap in turn implies that the employer’s choice of a health plan becomes less consequential: Most care decisions, and thus quality of care, are determined by providers, and, if plans share most providers, quality and cost will converge and so will the value offered by different plans.
This trend leaves two possible pathways through which health plan design and employer choices can lead to better value for money. The first would be closer integration between health plans and providers to improve quality and efficiency of care. Plans would contribute their ability to analyze data at the population level, benchmark providers and track patients across different providers, and collaborate with providers to lift the average quality and efficiency in a given market. The second path would be to steer plan participants and beneficiaries selectively to high-performing providers, with the expectation that market forces would push the low performers out or make them improve.
Implications for Research Agenda
Performance measures can, in principle, be applied at different levels of aggregation, from the national level to the level of individual providers. Thus, the gaps in measurement science that we identified, most notably in measuring overuse and efficiency, are as relevant for provider choice as they are for plan comparisons. Yet three methodological challenges make it more difficult to apply measures at the provider level:
• Sample size: In contrast to health insurers, who may have millions of members, individual providers only care for relatively small numbers of patients, particularly for any given condition (e.g. diabetes), which makes it difficult to calculate quality measures reliably
• Attribution: Quality measures must be attributable to a provider. Many evidence-based processes of care are under the control of an individual provider and thus can be attributed to her or him, but particular outcomes may be influenced by several providers and need to be properly attributed
• Risk adjustment: For outcome measures, rates will be affected by patient-level factors. These factors must be included in a multivariate model that generates risk-adjusted measure rates.
Given the complexity of those methodological challenges, it is not surprising that provider-level measurement is still in its infancy and needs to be developed further, as will our understanding on how to engage plan participants and beneficiaries in selection of providers through financial and non-financial means.
To summarize, our analysis points to four areas in which further research and development should be pursued:
xvii
• Efficiency measurement at different levels of the health care system (providers, provider networks, hospitals, and health plans)
• Methods to apply measures validly and reliably at the provider level • Tools to consolidate complex information on provider quality and cost to inform
decisions by plan participants and beneficiaries • Financial and non-financial strategies to increase plan participants’ and beneficiaries’
engagement in choosing high-quality and low-cost providers.
Progress in these four areas will strengthen our ability to improve the quality of care, while promoting the sustainability of the health care system.

xviii
Acknowledgments
We would like to thank our Task Order Officer, Elaine Zimmerman of the Employee Benefits Security Administration, Department of Labor, for her guidance of this report and many others at the Department of Labor and Department of Health and Human Services for their input and review of this report.
We want to express our appreciation to the participants of our Expert Panel Meeting, Dr. Irene Fraser of the Agency for Healthcare Research and Quality, Mr. Dennis White, Dr. Peter Hussey, Dr. Connie Hwang, Mr. Alan Hoffman, Dr. John Santa, Dr. Peter Briss, Dr. Andrew Baskin, Dr. David Veroff, Dr. Karen Sepucha, Dr. Timothy Quill, Dr. Judd Kessler, Dr. Kavita Patel, Dr. Robert Brook, and Mr. Daniel Wolfson, who provided valuable input to the research team; to Dr. Barbara Rudolph, Dr. Meredith Rosenthal and others who wished to remain anonymous who took the time to offer guidance at the initiation of our project; and to the employers and employer coalitions who participated in case study interviews anonymously.
Many staff members at RAND helped us to realize this project. In particular, we thank Hangsheng Liu, Liz Sloss, Tewodaj Mengistu, Racine Harris, Lisa Klautzer, and Lauren Hunter for their contribution to the environmental scan and Patrick Orr for supporting the project team and the production of the report. The RAND Health Quality Assurance process employs peer reviewers, including at least one reviewer who is external to the RAND Corporation. This study benefited from rigorous technical reviews by Dr. Peter Hussey of the RAND Corporation, Dr. Pierre Young of the Department of Health and Human Services, and Dr. Larry Becker of Xerox, and legal reviews by Roberta Casper Watson and Marcia Wagner of the Wagner Law Group.

xix
Abbreviations
ACO Accountable Care Organization AHRQ Agency for Healthcare Research and Quality AMA-PCPI American Medical Association-Physician’s Consortium for Performance
Improvement AMI acute myocardial infarction CAHPS Consumer Assessment of Healthcare Providers and Systems CMS Centers for Medicare and Medicaid Services COPD chronic obstructive pulmonary disease DMP disease management program EMR electronic medical record ERISA Employee Retirement Income Security Act of 1974 HEDIS Healthcare Effectiveness Data and Information Set HQA Hospital Quality Alliance HRA health risk assessment IOM Institute of Medicine IQR Inpatient Quality Reporting NBCH National Business Coalition on Health NCQA National Committee for Quality Assurance NQF National Quality Forum OQR Outpatient Quality Reporting PBGH Pacific Business Group on Health PCMH patient-centered medical home PCP primary care provider PHR personal health record PHSA Public Health Services Act PICU pediatric intensive care unit PQA Pharmacy Quality Alliance PQI pediatric quality indicators PSI patient safety indicators RFP request for proposals TJC The Joint Commission URAC Utilization Review Accreditation Commission VBID value-based insurance design

1
1. Introduction
1.1 Background: The Role of Employers Under the National Quality Strategy
The Patient Protection and Affordable Care Act (Affordable Care Act) places strong emphasis on quality of care as a means to improve outcomes for Americans and promote the financial sustainability of our health care system. Notably, Section 3011 of the Affordable Care Act mandates the Secretary of Health and Human Services to establish the National Quality Strategy (U.S. Department of Health and Human Services, 2012) with the aim of increasing access to high-quality, affordable health care (value) for all Americans. The National Quality Strategy is centered on the Institute of Medicine’s (IOM’s) so-called “Triple Aim” of better care, better health, and lower cost:
• Better Care: Improve overall quality by making health care more patient-centered, reliable, accessible, and safe
• Healthy People/Healthy Communities: Improve the health of the U.S. population by supporting proven interventions to address behavioral, social, and environmental determinants of health, in addition to delivering higher-quality care
• Affordable Care: Reduce the cost of quality health care for individuals, families, employers, and government.
Executing such a strategy requires participation from a wide range of stakeholders, such as providers, federal agencies, health plans,5 and employers. More than half of the U.S. population receives employment-based health plan coverage, and the Affordable Care Act will expand employment-based coverage. Employers are in a unique position to communicate health-related information to employees during the workday and through company communications and can therefore exert positive influence on health and health care related decisions. Employers stand to benefit from better quality of care through improved productivity and less illness-related work loss. Further, employers and employee organizations offering health coverage to employees have a fiduciary duty under the Employee Retirement Income Security Act of 1974 (ERISA) to manage plans solely in the interest of participants and beneficiaries.
The Affordable Care Act supports employers in procuring high-value coverage options by codifying new disclosure requirements that require health plans to provide a summary of benefits
5 We recognize that employers may self-insure or be fully insured. Some self-insured plans may use health insurance companies only to administer their plan as a third-party administrator but not to insure them against financial risk. To improve readability, we are using the term “plan or coverage” throughout the report to reflect both insured and self-insured health plan coverage offered by employers.

2
and coverage (SBC) that accurately describes the benefits under the plan or coverage. In addition, plan or insurers must provide a uniform glossary, which provides definitions of common terms used in health coverage. In the SBC, group health plans and health insurance issuers are required to provide disclosures to illustrate potential financial exposure of plan participants and beneficiaries based on real-world examples.6
These new disclosure requirements are critical to achieve better transparency on the coverage that different health plans provide and thus serve as a welcome new tool for employers, employee organizations (e.g., multi-employer plans), participants, and beneficiaries to make informed choices. In the long run, the expectation is that the information will foster an environment, in which health plans compete on value, with the potential to reduce overall health spending while improving quality.
1.2 Purpose of the Report Even with the availability of those disclosures, deciding between plan options is a daunting
task for employers because of the great variety of coverage products in the market. Health plans vary along a number of important structural dimensions, such as the degree to which they restrict provision of care to their network, how they pay providers, what the cost-sharing requirements for members are, and which services beyond coverage of health care cost they offer. They also differ in the results that they achieve with respect to member health, cost of coverage, and member experience.
Against this background, the report attempts to help employers understand the structural differences between health plans and the performance dimensions along which plans can differ, as well as to educate them about available tools that can be used to compare plan options. The report also discusses the extent to which these and other tools or resources are used by employers to inform choices between health plans.
The report is structured as follows. In Chapter Two, we describe our research approach. In Chapter Three, we present a conceptual framework that lays out the structural characteristics of a health plan and the performance dimensions along which value or results achieved relative to cost can be measured. Chapters Four and Five walk employers through the provider-facing and member-facing, respectively, structural characteristics of health plans. Chapters Six and Seven document and then evaluate the state of the measurement science for health plan performance, with respect to process and outcomes, respectively. Tools and resources that can help employers integrate and understand those structural and performance differences to inform decisions are discussed in Chapter Eight. Chapter Nine summarizes how employers actually select health plans, based on feedback from an expert panel and key informant interviews. Finally, the report
6 Affordable Care Act, section 2715

3
summarizes these findings in Chapter Ten, pointing out which gaps in measurement science need to be closed and which tools and resources should be made available to support employer decisions when selecting among health plan options.

4
2. Technical Approach
2.1 Development of Conceptual Framework
As health plans can differ along multiple dimensions, we started by developing a conceptual framework that organizes those dimensions to give employers a structure with which they can compare plan options. One part of the framework captures the structural characteristics that can distinguish plans, another captures the processes of care that plans’ contracted providers deliver, and the final part captures the outcomes that are accomplished for plan participants and beneficiaries. The components of the framework informed a subsequent environmental scan.
2.2 Environmental Scan The goals for the environmental scan were (1) to understand how health plans differ along
the structural characteristics set forth in our framework and (2) to establish the state of the measurement science for our performance dimensions. The scan covered multiple sources.
First, to orient our search strategy, we consulted with six experts who represented a variety of perspectives, including health plans, employer groups, academia, wellness program vendors, and business associations.
Second, we reviewed the websites of measure developers that are recognized as credible in the research and policy community and maintain rigorous measure selection and development processes, as well as the websites of measure aggregators, which are organizations that serve as clearinghouses for measures developed by other organizations. We created an inventory of measures with documentation of the attributes of each, drawing information primarily from the developers’ websites. In Appendix C, we describe each organization, the measure sets it maintains, and any affiliated reporting programs.
Third, we generated a nationally representative random sample of 70 health insurers, stratified by size, and searched their websites for information on structural characteristics, such as services provided to members and provider payment arrangements.
Fourth, we reviewed the websites of organizations that support employer decisionmaking on health plans and other benefits (e.g., the National Business Group on Health, the LeapFrog Group) and of government agencies (e.g., the Centers for Medicare and Medicaid Services [CMS]) to identify existing quality measurement and reporting initiatives.
Finally, we reviewed the scientific and trade literature, such as publications on health plan administration and benefits management and market research reports, to obtain information on
• the current state of development of quality measures for health plans • types of quality-enhancing products and services that health plans offer and evidence for
their effect

5
• the current range of provider payment and member cost-sharing approaches used by health plans
• the current use of quality information by employers and tools that help employers in the health plan selection process.
Appendix B provides details on our search of the scientific literature and lists the specific search tools and websites used in our scientific and trade literature review.
2.3 Expert Panel Meeting
After completing the environmental scan, we conducted a one-day expert panel meeting to generate insights into the reality of employer decisionmaking on health plans, and to inform a research and development agenda for quality measures and tools that can help employers with health plan selection. Fifteen experts, representing academia, consumer advocacy groups, employer groups, federal agencies, health plans, measures developers, product vendors, and providers, participated in separate panels discussing the following four topics pertaining to quality of care reporting requirements:
• State of measurement science to determine quality of employment-based health coverage • Approaches to generate better and more timely evidence on structural characteristics of
health plans • Non-financial avenues to increase employee engagement in health-related decisions and
behaviors • Mechanisms to optimize healthcare utilization and coordination, in particular to reduce
unwarranted variation in use and overuse of medical services.
2.4 Interviews with Employers and Business Coalition Representatives
After completing the environmental scan and conducting our review of the peer-reviewed and trade literature, we concluded that very little is known about how employers gather and use information to choose health plans. Therefore, we decided to interview a limited number of employer representatives to better understand employers’ decisions when purchasing health plans.
We interviewed a total of nine individuals from mid- and large-sized organizations and representatives from employer purchasing coalitions. Six interviewees represented employers, while three were directors of regional or national business coalitions. The business coalitions included a national business coalition and two regional coalitions. The employer organizations primarily consisted of employers of various sizes across the country and were drawn from the professional networks of the study authors, but deliberately avoided companies that are well known for being vocal and proactive in their approach to health coverage (see Table 2.1). We asked to interview the individual most familiar with the decision process when choosing a health

6
plan. Interviewees included one chief financial officer, four benefits managers, and one human resource manager.
Table 2.1. Characteristics of Case Study Employers
Interview (INT) Employer Size Region Industry INT1 1,700 West Services INT2 15,000 Northeast Manufacturing INT3 2,000 West Manufacturing INT4 28,000 Northeast Services INT5 600 Midwest Services INT6 13,000 Midwest Retail Trade
NOTE: In addition to six employer interviews, we interviewed three representatives from business coalitions, which included one national coalition and two regional coalitions.
Interviews were open-ended and based on a discussion guide that covered how employers
choose health plans, what metrics they consider, what sources of information they use, and the extent to which they provide employees with information on health plan options. The interviews were conducted by one main interviewer, with one note taker, and lasted approximately 45 minutes.

7
3. Conceptual Framework
3.1 Understanding the Anatomy of a Health Plan
We created a simplified framework that allows employers to understand differences between health plans and the results that they achieve (Figure 3.1). We based our framework on Donabedian’s structure, process, and outcomes categorization scheme, which has emerged as a standard approach in health care performance measurement (Donabedian, 1966). In short, the framework reflects the fact that the structural characteristics can be thought of as the “context” established by the health plan, under which health care providers deliver care (or which processes they use) and how those care processes, combined with health and health care–related decisions and choices of plan members, result in outcomes. In this report, we emphasize a review of structural characteristics as those are commonly marketed as product differentiators to employers.
Figure 3.1. Conceptual Framework to Categorize Differences Between Health Plans
Health plan
MembersProviders
Care managem
ent
Cost-‐sharing provisions
Care delivery
Customer service
Structural characteristics
Processes
Health and health care behaviors Outcomes
Netw
ork managem
ent
Payment arrangem
ents
8
For the purposes of this report, we distinguish structural characteristics that influence provider decisions and actions from those that influence decisions and actions of plan members (Birkmeyer, Dimick and Birkmeyer, 2004):
• Provider-facing characteristics - Network management, i.e., the size, location, and scope of its contracted provider
network - Payment arrangements, i.e., on what basis providers are being paid and which factors
influence payments • Member-facing characteristics
- Customer service, which includes the administrative functions, such as claim processing, providing information on coverage and benefits, and handling complaints
- Cost-sharing policies, which include co-payments and deductibles as well as policies on how those co-payments and deductibles can vary based on where and how members obtain care
- Care management, which reflects the support services that a plan offers to help members navigate the health care system and improve self-management.
We recognize that there are many ways to characterize the structural characteristics of health plans, and we developed a scheme that appeared to be logical and illustrative. Obviously, understanding processes of care and outcomes for measurement purposes requires categorizing those complex constructs in further detail, as we explain in the next two subsections.
3.2 Defining Care Processes for Measurement Purposes Care processes reflect the better care component of the Triple Aim and capture the decisions
and actions of providers. We based our categorization scheme for care processes on work by the Agency for Healthcare Research and Quality (AHRQ) that describes high-value care processes as “striking the right balance of services by eliminating misuse (for example, providing medications that may have dangerous interactions), avoiding overuse (for example, performing tests that a patient does not need), and avoiding underuse (for example, not screening a person for high blood pressure)” (Agency for Healthcare Research and Quality, 2008). In alignment with this definition, we used three subcategories that reflect whether care is provided according to evidence-based and professional standards to inform our scan for existing performance measures (Birkmeyer, Dimick and Birkmeyer, 2004):
• Safe practices (e.g., use of electronic prescribing) • Adherence to evidence-based guidelines and current standards of care (e.g., percentage of
plan participants who receive mammograms) • Avoidance of overuse (e.g., avoidance of unnecessary and potentially harmful medical
services (Institute of Medicine Committee on Quality of Health Care in America, 2001).

9
3.3 Defining Outcomes for Measurement Purposes We based our categorization scheme for care outcome measures on the landmark IOM report
entitled Crossing the Quality Chasm (Institute of Medicine Committee on Quality of Health Care in America, 2001), which lists six aims for providing high-value health care, sometimes referred to as the STEEEP model:
• Safety: "avoiding injuries to patients from the care that is intended to help them" • Timeliness: "reducing waits and sometimes harmful delays for both those who receive
and those who give care" • Effectiveness: "providing services based on scientific knowledge to all who could benefit
and refraining from providing services to those not likely to benefit (avoiding underuse and overuse, respectively)"
• Efficiency: "avoiding waste, including waste of equipment, supplies, ideas, and energy" • Equity: "providing care that does not vary in quality because of personal characteristics
such as gender, ethnicity, geographic location, and socioeconomic status" • Patient-centeredness: "providing care that is respectful of and responsive to individual
patient preferences, needs, and values and ensuring that patient values guide all clinical decisions."
We group those aims into three domains for outcomes measurement:
• Medical outcomes, reflecting safety, timeliness, and effectiveness, can be captured at two levels
• Intermediate (or proxy) outcomes, such as control of hypertension • Health outcomes, which can be positive, such as functional status, and negative, such as
surgical complications • Patient experience, a measure used to capture a health plan’s patient-centeredness • Efficiency measures, which reflect resource use per relevant outcome (or value), as
opposed to cost measures that do not consider medical or patient-centered outcomes.
Of note, equity is typically not determined with dedicated measures, but based on variation on other measures based on factors other than medical need and/or health risks.
3.4 Measuring Quality of Health Care Quality measures are initially applied at the member/patient level, e.g., they may reflect
whether an individual received a recommended test or whether a patient’s blood pressure was adequately controlled. They can then be rolled up to different levels of aggregation, as Figure 3.2 illustrates.
Figure 3.2. Levels of Health Care Quality Measurement
Individual provider
Provider group
Health system Health plan Region State Country
10
But such aggregation must be conceptually plausible and methodologically feasible.
Conceptual plausibility implies that a measure should only be aggregated to a certain level if it can reasonably be assumed that performance along the measure is sufficiently controlled at that level. For example, it is typically plausible to assume that individual providers control care processes for their patients and can therefore be held accountable for process measures, such as whether a diabetic patient receives an annual eye exam. In contrast, individual providers may not have sufficient control over a patient’s long-term trajectory for outcome measures to be attributed to them. To illustrate, whether a diabetic patient loses his or her eyesight is the result of many care decisions over several years. It may thus be plausible to attribute loss of eyesight to health systems and/or health plans, but not to individual providers.
From a methodological perspective, the ability to apply measures at lower levels of aggregation, such as individual providers or provider groups, may be limited because of sample size considerations. Most quality measures reflect the rate at which certain events (e.g., preventive tests or adverse outcomes) occur in a population. If the underlying population that can be included in a measure (i.e., the denominator for the measure) becomes too small, it is difficult to construct meaningful measures, because the rates will be influenced too much by the occurrence of individual events in the numerator of the measure and measures become unreliable. As a rule of thumb, constructing reliable measures requires a denominator of at least 20–30 patients. In other words, a provider must treat at least 20–30 patients with the condition that a quality measure addresses, which is typically the case for common diseases, like diabetes, and common services, like preventive tests. But a typical primary care physician, for example, may not have enough patients with less common conditions, like rheumatoid arthritis or bipolar disorder, to construct reliable measures. It is therefore easier to apply the same measure to a health plan with hundreds of thousands of members than to a provider with around 2,000 patients.
11
4. Provider-Facing Structural Characteristics of Health Plans
4.1 Network Management
Network management captures how well a plan matches providers to the needs of plan participants and their dependents, with respect to the extent of the network (i.e., number and specialty mix of physicians and hospitals) and the capacity of the network to accept new patients. The quality of network management is commonly measured by metrics for network adequacy.
The Affordable Care Act has brought significant attention to the issue of network adequacy and requires the Secretary of Health and Human Services to establish certification criteria for qualified health plans participating in state’s Health Insurance Marketplace (National Association of Insurance Commissioners, 2012).7 To be in compliance with the law, plans must ensure network adequacy by ensuring that
• a sufficient number of providers are covered under the plan • information is offered to enrollees on the availability of in-network and out-of-network
providers • “essential community providers” that provide care for vulnerable populations, such as the
poor and medically underserved, are included.
In response to the requirements of the Affordable Care Act, the Secretary of Health and Human Services issued a final rule (Federal Register, 2012b) stating that, to qualify for the Health Insurance Marketplace, health plans must
• include essential community providers • maintain a network that is sufficient in number and types of providers, including
providers that specialize in mental health and substance abuse services, to assure that all services will be accessible without unreasonable delay
• be consistent with the network adequacy provisions of section 2702(c) of the Public Health Services Act (PHSA).
Although the law and resulting rules have brought significant attention to measuring and reporting of network adequacy, standardized and widely accepted measures for network adequacy are lacking. To illustrate, CMS developed network adequacy standards for Medicare Advantage Plans that specify the number of physicians in different specialties per beneficiary, as well as maximum travel distance and time in different markets (Moon, 2010). For example, a Medicare Advantage Plan operating in Nassau County, NY, must have 26 primary care providers (PCPs) within 20 minutes or five miles of every enrollee, but five general surgeons within 20 minutes or five miles. In Fayette County, TX, plans must have at least one PCP within 45 7 Affordable Care Act, section 1311(c)

12
minutes or 25 miles, and one general surgeon within 60 minutes or 60 miles. Additionally, as many as 20 state health departments have network adequacy standards to which certain health plan products must adhere. However, there is great variation around these standards. For example, in Minnesota, Health Maintenance Organizations must demonstrate that all enrollees are able to reach a PCP within 30 minutes or 30 miles and a specialist within 60 minutes or 60 miles (Minnesota Department of Commerce, 2012) by submitting maps showing the location of the providers in their network. In both Massachusetts (Blue Cross Blue Shield of Massachusetts Foundation, 2009) and North Carolina (North Carolina Institute of Medicine, 2011), health plans have been able to create their own network adequacy standards and report on those.
The National Committee for Quality Assurance (NCQA) and the Utilization Review Accreditation Commission (URAC), two organizations that accredit commercial health plans and have been deemed by the Department of Health and Human Services to accredit health plans for state Marketplaces (Federal Register, 2012a), have their own standards for determining network adequacy. NCQA requires that health plans set their own standards for network adequacy and demonstrate that they have met these goals (Blue Cross Blue Shield of Massachusetts Foundation, 2009). For URAC accreditation, plans must report the number of primary care and specialist physicians presently accepting new patients. These standards are consistent with those established by CMS for measuring network adequacy for Medicare Advantage Plans. These are included in URAC’s mandatory list of reported measures for Marketplace-qualified health plans (URAC, 2012).
Reflecting the variation in state and federal network adequacy standards, the final rules related to the Affordable Care Act allow states significant flexibility to establish network adequacy standards within their own Marketplaces (National Association of Insurance Commissioners, 2012). States can maintain their own standards if they are consistent with the final rules or adopt other network adequacy models, such as those developed by the National Association of Insurance Commissioners, NCQA, URAC, and CMS for Medicare Advantage plans (Federal Register, 2012a).
4.2 Payment Arrangements Payment arrangements are the ways in which health plans compensate providers for
services delivered. As different arrangements imply different incentives for providers, it is important for health plan purchasers to understand various payment arrangements and their implications for provider behavior.
Historically, physicians and institutional providers, such as hospitals, have been paid on a fee-for-service basis, which remains widely used today. However, the limitations of this arrangement are becoming increasingly recognized. Since additional services trigger additional payments, it rewards the provision of more services but not coordination of care between providers or improved patient health and experience. In addition, payment rates are typically
13
higher for specialty care and technology-based services, such as imaging, compared to primary and preventive care services (Guterman et al., 2009). Thus, fee-for-service payment arrangements have driven the development of a high-volume, high-intensity care delivery system with limited attention to ongoing care management and prevention.
Since the fee-for-service payment arrangement is increasingly considered suboptimal for patients with chronic conditions (who require care coordination and ongoing disease management rather than episodic encounters), public and private payers have started to explore alternative payment models to better align care delivery with patient needs (Davis and Guterman, 2007; Draper, Tynan and Christianson, 2008). For many years, hospitals and other health care institutions, such as rehabilitation facilities, have been subject to prospective payments, which are risk-adjusted fixed payments at the expected cost of treating a patient. Similar payment models are now being explored for individual health care providers as well as groups of providers that are currently paid separately (i.e., hospitals and rehabilitation facilities). Below we describe some of the most common alternative payment arrangements that have emerged in recent years; however, the exact payment rules differ from plan to plan. Patient-Centered Medical Home (PCMH): A PCMH “is a team-based model of care led by a personal physician who provides continuous and coordinated care throughout a patient's lifetime to maximize health outcomes” (American College of Physicians, 2006). Essentially, in a PCMH, a physician or a physician practice group takes responsibility for the care of patients and coordinates each individual’s care with a team of other health care professionals. The primary aim is to provide the patient with continuous and comprehensive care while focusing on the patient’s health care needs in a holistic manner. Key features of the compensation model under a PCMH include reimbursement for care coordination (e.g., a case-management fee), as well as for the establishment of enhanced practice capabilities with respect to health information technologies for better integration, coordination, and communication and pay-for-performance–based payments to incentivize optimal care (American College of Physicians, 2006; Rosenthal, 2008). A number of large demonstration projects are testing the effectiveness and feasibility of the PCMH model. For example, under the Pennsylvania Chronic Care Initiative (PACCI) program, primary care practices that achieve NCQA accreditation receive additional payments from a coalition of regional payers, which includes commercial and Medicaid-managed care plans (Gabbay et al., 2011). Episode-Based Payment: An episode-based payment (also known as a bundled payment) “provides payment for all of the care a patient needs over the course of a defined clinical episode, instead of paying for each discrete service” (Hussey, Ridgely and Rosenthal, 2011). The aim is to incentivize providers to only provide services needed and reduce the duplication of services. Another objective is to encourage care coordination in the event that multiple providers
14
are involved in caring for the patient during a defined clinical episode (Evans, 2010; Hussey, Ridgely and Rosenthal, 2011).
Geisinger’s ProvenCare and the Healthcare Incentives Improvement Institute’s PROMETHEUS (the Provider Payment Reform for Outcomes, Margins, Evidence, Transparency, Hassle Reduction, Excellence, Understandability, and Sustainability) are well-known initiatives using bundled payments. ProvenCare, which is currently in use within the Geisinger Health System, accepts episode-based payments for several procedures—elective coronary artery bypass graft, percutaneous transluminal coronary angioplasty, total hip replacement, cataract surgery, and lower back pain treatment. The rate for payment is set on the basis of the cost of routine services plus an amount equal to half the average cost of complication. PROMETHEUS, which is currently being tested in ten pilot programs, sets rates for 21 conditions, including chronic and acute conditions, as well as procedures such as hip replacements, based on clinical standards for appropriate care and “evidence-informed case rates,” which are risk-adjusted, prospective, or retrospective payments, and an allowance or warranty for care in the event of complications (de Brantes and Camillus, 2007; Rosenthal, 2008; Evans, 2010; Hussey, Ridgely and Rosenthal, 2011). Accountable Care Organizations (ACOs): The Affordable Care Act establishes ACOs as a new payment model under Medicare and also encourages private payers to adopt the model (Fisher and Shortell, 2010). According to McClellan et al. (2010), “ACOs consist of providers who are jointly held accountable for achieving measured quality improvements and reductions in the rate of spending growth.” In essence, an ACO is a provider-led organization with a strong primary care component, in which part of the payment is linked to care quality and efficiency.
Current arrangements usually assign patients to an ACO based on their choice of a PCP. In contrast to a Health Maintenance Organization, which is paid a risk-adjusted capitation fee for each patient, an ACO is paid on a fee-for-service schedule but held accountable for the overall cost of care: Expected medical costs of providing care for its assigned population are estimated with statistical models. If the ACO manages to hold costs below the projection, it receives a share of the estimated savings. Like PCMHs, an ACO can earn pay-for-performance rewards, if it achieves, for example, adequate blood glucose control in its diabetic patients and agreed-upon targets for member satisfaction.
Currently, CMS is testing several types of ACO payment models, including the Shared Savings Program, Advanced Payment Model, and Pioneer ACO Model (Centers for Medicare and Medicaid Services, 2011). All three programs have the above-described payment structure but differ in the degree of risk that providers assume. Primary Care Capitation Models: The basic idea behind capitation models is “for a provider (or a group of providers, working in a coordinated fashion) to receive a single payment to cover all of the services their patients need during a specific period of time, regardless of how many or
15
few episodes of care the patients experience” (Miller, 2009). Thus, under a capitation model, providers are paid a fixed amount for each person assigned to the physician or physician group. However, because this payment model can have the adverse effect of providers choosing the less sick patients, the risk-adjusted capitation model, also called comprehensive care payment, can be used. The idea behind this model is to adjust the per-patient fee paid to the provider based on the patients’ health and other characteristics, such as need for social support (Miller, 2009).
Starting in 2009, a new primary care capitation model is being tested by BlueCross BlueShield of Massachusetts, called an Alternative Quality Contract (AQC), which capitated payments with rewards for meeting performance targets on several quality indicators, such as performing glucose testing and eye exams for patients with diabetes, as well as breast, cervical, and colorectal cancer screening for eligible patients. The capitated payment is calculated based on a provider’s historical costs, rather than a regional average, to incorporate the difference in patient panels. Further adjustments will be made for the changes in patient population during a contract period. In addition, the contract has a five-year agreement between the insurer and providers, rather than the one-year contract used for a typical capitation model. To reduce the financial risk of providers, all participating groups are required to buy reinsurance for high-cost cases. The insurer also provides the flexibility to negotiate the amount of financial risk born by providers (Blue Cross Blue Shield of Massachusetts). Pay-for-Performance: Pay-for-performance is the process of linking payments to specific targets, for both quality improvement along process measures for technical quality and efficiency gains, as negotiated by the payer and the provider (Glickman and Peterson, 2009). The main mechanism under pay-for-performance is the use of quality bonuses, but other mechanisms exist, including compensation at risk, performance fee schedules, reimbursement for specific services that are not usually covered, and nonpayment for treatment of preventable complications (Bailit Health Purchasing and National Health Care Purchasing Institute, 2002).
• Quality bonuses: Under this arrangement, providers are given a yearly bonus payment if they reach pre-established cost and quality targets, such as cancer screening rates, after a baseline performance is established based on agreed-upon quality and/or cost measures. Bonuses are generally small and typically represent about 5–10 percent of the provider’s total compensation.
• Compensation at risk: Compensation at risk is the reverse of a quality bonus—it withholds a portion, 5–10 percent, of the provider’s compensation if the provider does not meet the agreed-upon targets. The compensation withheld is kept in an interest-accruing account, which is given back to the provider completely or partially if all or some of the targets are met or is fully withheld if performance measures fall below a certain floor, as negotiated by the payer and provider. This type of arrangement is rarely used, as penalties tend to be unpopular with providers.
• Performance fee schedule: In this arrangement, the organization that contracts with providers (i.e., health plans and other payers) establishes a fee schedule and pays providers according to their quality level, which is typically determined with measures of

16
technical process quality. For example, the highest-quality providers would get above 100 percent of the fee as established in the fee schedule, average providers would be paid 100 percent of the fee, and the lowest-quality providers below 100 percent of the fee.
• Reimbursement for specific services: Under this mechanism, providers are reimbursed for services that improve patient care, in particular for those with chronic conditions, but are typically not paid for under fee-for-service. These services include care coordination and planning, the promotion of the use of shared-decisionmaking tools, and the use of preventive screenings.
• Nonpayment for treatment of preventable complications: Another mechanism under pay-for-performance is nonpayment for the treatment of preventable complications. The idea behind implementing such a rule is to “reduce or eliminate the occurrence of ‘never events’—serious and costly errors in the provision of health care services that should never happen” (Centers for Medicare and Medicaid Services, 2006). “Never events” can include preventable complications, such as surgical errors (e.g., surgery on the wrong patient or wrong body part); care-management errors (e.g., Stage 3 or 4 pressure ulcers acquired after admission to a health care facility); and environmental factors (e.g., patient death associated with a fall in a health care facility).
Figure 4.1 displays commonly used payment arrangements, in order of increasing financial risk to providers.8
Figure 4.1. Spectrum of Provider Payment Arrangements
* This includes the scenario in which provider and payer are completely integrated (e.g., a Health Maintenance Organization) and providers are salaried. Under this circumstance, there is no distinction between provider and payer. ** Pay for performance elements can be used under any payment arrangement. Given the increasing variety of provider payment models, it is important for employers,
employee organizations (e.g., union plans), participants, and beneficiaries to have a general
8 It should be noted that the actual degree of risk sharing will depend on the contractual details of the payment arrangements.

17
understanding of how providers under a given health plan option are paid. However, as we noted, there are many possible payment arrangements and employers are unlikely to have a deep understanding of each payment arrangement and are therefore less likely to choose the “best” option. Furthermore, it is also important to keep in mind that the payment models are not unambiguously defined and that the same term can have different meanings in different contexts. For example, CMS has a very detailed definition and regulations for Medicare ACOs, NCQA has put forth its own accreditation standards for ACOs, and individual health plans are using their own definitions. However, employers should still review the actual details of a plan to gain a general understanding of how providers are paid under a given arrangement and how that payment arrangement may influence provider decisionmaking. For example, shifting financial risk to providers may reduce the cost of care, but can create concerns about underuse, as providers do not benefit financially from additional services. It is particularly important for employers to help their employees understand prospectively the reimbursement scheme under which their providers are functioning and to understand the related implications for out-of-pocket costs and the decisions that physicians will make on their behalf.

18
5. Member-Facing Structural Characteristics of Health Plans
5.1 Customer Service
Customer service is the part of a health plan that is most directly member-facing, and is therefore of critical importance to member experience. It includes communication with members about benefits and quality of care, handling of claims, appeals processes for denied claims or denied authorization of services, and other services. Our experts mentioned that some health plans try to improve customer experience by providing hospital quality reports and health plan comparison tools online, while others post factsheets explaining the appeals process to educate consumers about their rights. Others have well-organized information hotlines to educate consumers about the various products and services available through the health plan.
5.2 Cost-Sharing Provisions A recent trend in health coverage is the use of financial incentives, or risk-sharing provisions,
to steer plan participants toward desirable health and health care-related decisions (Volpp et al., 2011; Osilla et al., 2012). According to expert panelists, incentive programs have been gaining popularity among large, self-insured employers. Health plans are starting to adopt these programs as well and in fact have purchased a number of companies that have developed innovations to link incentives with health and wellness programs.
Incentives can take the form of direct rewards or penalties that are linked to participation in wellness programs, which can include participatory programs or health-contingent programs focused on incentivizing individuals for achieving specific health targets (e.g., reduced tobacco use, weight loss). Incentives are offered in a variety of forms, such as discounts, premium rebates, and cash rewards (Volpp et al., 2009). Employers may provide wellness program incentives themselves or provide the incentive in connection with the group health plan coverage. A recent RAND survey of U.S. employers found that approximately half of employers with a wellness program administer incentives to encourage program uptake through a health plan. Risk-sharing provisions for health coverage to incentivize program participation and/or attainment of health goals, including employees’ share of health plan premiums (37 percent), contributions to health savings accounts (HSAs) (5 percent), and cost-sharing (3 percent) were reported as common incentives offered in connection with health plans (Mattke et al., 2013).
Alternatively, incentives can be part of the benefit design, and differential co-payments based on consumer decisions on how and where to seek care can be used to steer enrollees to care options that are seen as offering improved quality and/or efficiency. Two types of such benefit designs have emerged:
19
• Consumer-directed health plans (CDHPs): CDHPs are high-deductible plans accompanied by some form of a pre-tax payment account, usually an HSA (McClellan et al., 2010). The individual pays for care using the funds in the pre-tax account. Importantly, the money rolls over from year to year. Therefore, HSAs do not incentivize employees to overuse or misuse health care resources just to spend the money by the end of the year. If that runs out, he/she pays for care out of pocket until the deductible is met. This approach gives individuals greater control over their own health care budgets, and intends to motivate them to factor cost into choices about providers and services and to adopt health-related behaviors to avoid future cost (Buntin et al., 2005; NBGH, 2010).
• Tiered benefits: Tiered plan designs vary cost-sharing to encourage prudent care use. Almost ubiquitously today, prescription drug plans use differential co-payments to promote the use of generic drugs and branded drugs in the plan’s formulary. Other types of tiered benefits are reduced cost-sharing if members use preferred providers and tiered service coverage built around individual treatment choices. For example, co-payments can be reduced to encourage step therapy: a patient with lower back pain might face a lower co-payment for an MRI (magnetic resonance imaging) if he or she agrees to a trial of physical therapy first (Jones, Caloyeras and Mattke, 2012). Some tiered benefit designs are referred to as value-based insurance design (VBID). While the concept of VBID sounds attractive, according to expert panelists current offerings under this label tend to have only a few such features, but leave most of medical care covered under traditional arrangements. VBID plans also vary with respect to which patients or services they address. It is therefore difficult to assess the potential of VBID as a policy option at this point, and those designs would have to become more standardized and more comprehensive to evaluate them.
5.3 Care Management
Today, health insurance companies are offering a variety of services and products beyond financial coverage to improve quality, and employers are interested in learning which additional offerings are part of a health plan product to make informed decisions. To support those decisions, we compiled a list of the most common products and services to improve quality and efficiency, based on a review of a nationally representative random sample of 70 health insurance companies.
We organize those products and services based on the IOM’s categories of chronic care, curative care, and health promotion (Institute of Medicine Committee on Quality of Health Care in America, 2001).
• Chronic condition management: living with illness or disability. This includes programs and activities that help patients manage an ongoing chronic condition or deal with a disability that affects their daily lives. For example, disease management programs are used to promote disease self-management, medication adherence, and appropriate use of medications, as well as to help patients recognize warning signs of and avoid exacerbations.
• Curative care: recovery from an illness or injury. This category includes programs and activities to provide acute care with the objective of helping patients “recover and

20
reestablish their daily activities” after an illness or injury, as well as to prevent complications and hospital readmissions and to improve patient safety. For example, health plans may implement a comprehensive program to prevent hospital readmission through planning, education, and discharge follow-up.
• Health promotion: staying healthy to avoid illness and remain well. Typical products and services include programs and activities that “encourage the development of healthy behaviors, facilitate early detection of illness, and educate individuals about how they can reduce health risks.” As specified in the Affordable Care Act Section 2717, this category should include, but is not limited to, smoking cessation, weight management, stress management, physical fitness, nutrition, heart disease prevention, healthy lifestyle support, and diabetes prevention.
Products and Services for Chronic Condition Management
The two most common services for patients suffering from chronic conditions are disease management, which targets patients with defined chronic diseases such as diabetes, and case management, which supports patients with high costs of care, irrespective of the underlying conditions. Disease management is described as “a system of coordinated healthcare interventions and communications for populations with conditions in which patient self-care efforts are significant” (URAC, undated). Disease management programs support care-planning through specific interventions that aim to improve patient self-management (e.g., medication adherence, behavior change, recognition of signs and symptoms) and reduce the risk of exacerbation of disease. These interventions typically include regular (mostly telephonic) interaction with a nurse, educational material on patient self-management, and in-person counseling.
Members are identified for a DMP if they have one or multiple chronic diseases. These programs can either be disease-specific or take a so-called “whole-person approach,” which means that all chronic illnesses of a patient are managed together. Currently, DMPs are usually disease focused, but insurers are moving towards a “whole-person approach”; 24 percent of the reviewed insurers are taking this approach toward disease management. DMPs have become standard in the industry: 86 percent of health plans offer a DMP. The most widespread DMPs are for diabetes, asthma, and congestive heart failure (74, 70, and 62 percent of the plans, respectively), followed by chronic obstructive pulmonary disease (COPD) and coronary artery disease (56 and 55 percent of plans, respectively). A DMP for depression is less common (26 percent of plans reviewed) but this may be due to the fact that depression is often treated as co-morbidity with the other chronic diseases (Figure 5.1).
Chronic care case management targets the highest-risk members—characterized by high utilization, multiple hospital admissions, and/or specific diagnoses—and typically offers them more-intensive interventions as compared to patients in disease management. Examples for members in case management are patients with advanced cancer or debilitating central nervous system disorders. The aim is to first stabilize members after an acute exacerbation, provide them
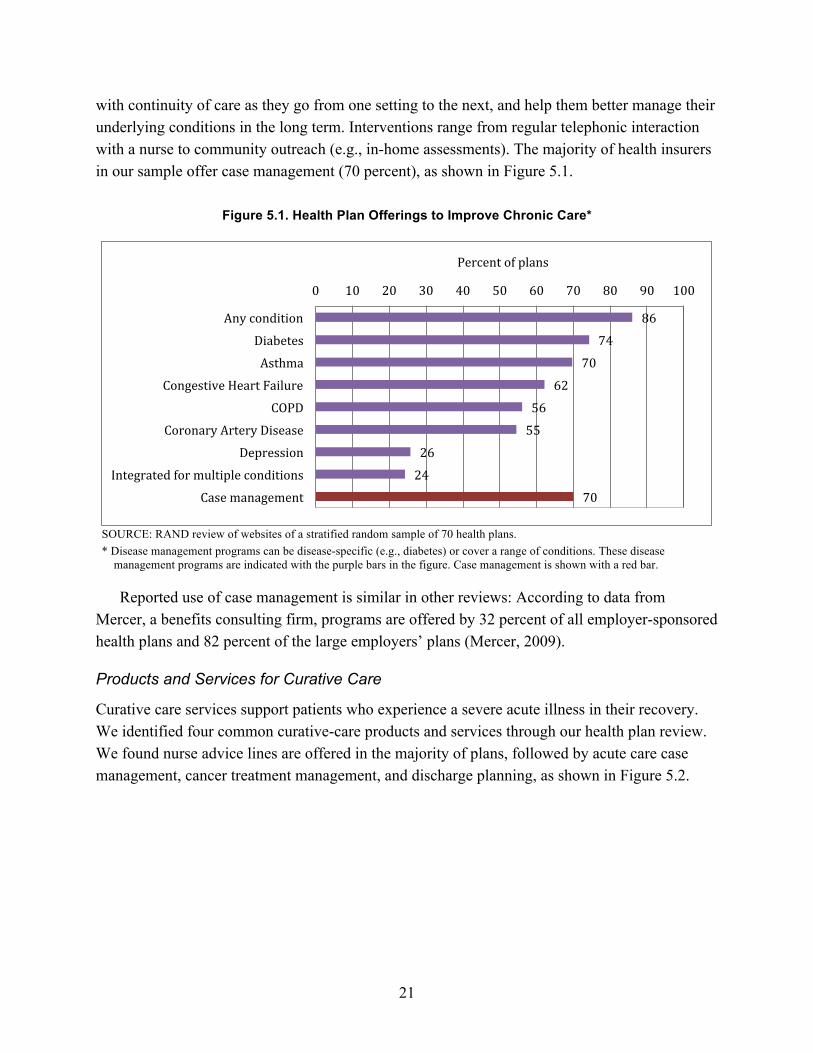
21
with continuity of care as they go from one setting to the next, and help them better manage their underlying conditions in the long term. Interventions range from regular telephonic interaction with a nurse to community outreach (e.g., in-home assessments). The majority of health insurers in our sample offer case management (70 percent), as shown in Figure 5.1.
Figure 5.1. Health Plan Offerings to Improve Chronic Care*
SOURCE: RAND review of websites of a stratified random sample of 70 health plans. * Disease management programs can be disease-specific (e.g., diabetes) or cover a range of conditions. These disease
management programs are indicated with the purple bars in the figure. Case management is shown with a red bar.
Reported use of case management is similar in other reviews: According to data from Mercer, a benefits consulting firm, programs are offered by 32 percent of all employer-sponsored health plans and 82 percent of the large employers’ plans (Mercer, 2009).
Products and Services for Curative Care
Curative care services support patients who experience a severe acute illness in their recovery. We identified four common curative-care products and services through our health plan review. We found nurse advice lines are offered in the majority of plans, followed by acute care case management, cancer treatment management, and discharge planning, as shown in Figure 5.2.
86
74
70
62
56
55
26
24
70
0 10 20 30 40 50 60 70 80 90 100
Any condition
Diabetes
Asthma
Congestive Heart Failure
COPD
Coronary Artery Disease
Depression
Integrated for multiple conditions
Case management
Percent of plans

22
Figure 5.2. Health Plan Offerings in Curative Care
SOURCE: RAND review of websites of a stratified random sample of 70 health plans.
Nurse advice lines, typically staffed 24 hours a day, offer health plan members health care
information or advice, triage, or immediate medical assistance. This service is common: three-fourths of health insurers in our sample have a nurse advice line (see Figure 5.2), as do 52 percent of all and 78 percent of the large (≥500 employees) employer-sponsored health plans.
According to the Case Management Society of America (CMSA), case management is defined as a “collaborative process of assessment, planning, facilitation, care coordination, evaluation, and advocacy for options and services to meet an individual’s and family’s comprehensive health needs through communication and available resources to promote quality cost-effective outcomes.” In the acute care setting, this translates into nurses being assigned to high-risk patients to facilitate their treatment, insurance-related paperwork, and any other related services (White and Gundrum, 2007). Acute case management is a fairly common program: 60 percent of the 70 insurers in our sample offer acute case management (see Figure 5.2).
Cancer treatment management provides members diagnosed with cancer with support, care coordination, and counseling as they go through the treatment process. Services can include 24-hour access to specialized nurses, nurse coaches to make patients aware of common side effects of treatment and to help them manage those side effects, financial counseling, and services to make sure that prescriptions are being filled. The main goal is “to keep patients out of the emergency department or inpatient bed” (Butcher, 2007). These programs are not yet common; only 23 percent of the health plans in our sample offer the program. These services are more
75
60
23
6
0 20 40 60 80 100
Nurse advice line
Acute care case management
Cancer treatment management
Discharge planning
Percent of plans

23
widely offered by large employer-sponsored health plans, with nearly half (43 percent) offering a DMP specifically for cancer (Mercer, 2009).9
Discharge planning facilitates a patient’s release from a health care facility (e.g., hospital). The goal of this service is to improve the coordination of care and enhance continuity of care post-discharge to improve the patient’s health outcomes and reduce the risk of preventable readmission. Discharge planning appears to be offered rarely by health insurers; only 6 percent of our sample listed this as a service to its members.
Products and Services for Health Promotion
We identified the most commonly offered products and services to promote health and prevent disease. As shown in Figure 5.3, the most common offerings include HRAs, fitness club membership discounts, biometric screenings, and smoking cessation.
Figure 5.3. Health Promotion Service Offerings
SOURCE: RAND review of websites of a stratified random sample of 70 health plans
An HRA is a questionnaire administered to a member to probe his or her health behaviors
and to identify any potential health risks and areas for health-related behavior modification. The HRA serves the dual function of making individuals aware of health risks and of directing them to tailored program offerings (Kaiser Family Foundation and Health Research & Educational Trust, 2011; Towers Watson and NBGH, 2011). HRAs have become a standard offering, as almost 90 percent of the health insurers in our sample offer this service. 9 As large employers may contract directly with third-party vendors to offer disease management, prevalence of these programs among large employers is higher than among health plans.
88 75
71 71
65 48 46
42 38
34 26
0 20 40 60 80 100
Health risk assessment Health club membership discount
Biometric screening Smoking cessation
Pregnancy/newborn management Weight management
Personal health record Healthy eating
Wellness product discount Fitness program
Stress management
Percent of plans

24
Biometric screenings are used to identify common health conditions and often include measures such as heart rate, blood pressure, blood lipid levels, blood glucose levels, and weight and body mass index (Buck Consultants, 2008). Seventy-one percent of the insurers in our sample offer biometric screenings to members.
A weight management or weight loss program is a type of individualized lifestyle intervention to promote a healthy diet and/or regular physical exercise. Programs are multi-faceted and vary widely, but frequently consist of group and individual-level counseling. Nearly half of the 70 health insurers in our sample (48 percent) offer weight loss programs or nutrition and healthy-eating programs (42 percent), while one-third offer a fitness program (34 percent).
Smoking cessation programs typically offer education and counseling, while some programs include discounts on prescription medication or nicotine replacement therapy. Smoking cessation programs were offered by 71 percent of the health insurers in our sample.
Prenatal and/or newborn management programs target women who are new mothers, planning a pregnancy, or are currently pregnant. For a high-risk pregnancy, a woman can be assigned a dedicated nurse case manager throughout the pregnancy. Such programs are fairly widespread; 65 percent of the 70 plans in our sample offer a pregnancy or newborn management program.
A personal health record (PHR) is an “electronic application through which individuals can access, manage and share their health information, and that of others for whom they are authorized, in a private, secure, and confidential environment” (The Markle Foundation, as cited in Tang et al., 2006). PHRs were designed to have an individual’s medical history stored in one location and empower them to take ownership of their care. Members typically manage their own PHR by entering their health data and other information relevant to medical care (e.g., information on allergies and family history). The availability of PHRs is less frequent than the other products and services discussed above. About 46 percent of the plans in our sample make PHRs available to their members.
5.4 Evaluation of Member-Facing Characteristics of Health Plans Our review has shown that health plan options can vary substantially with respect to products
and services beyond financial coverage, provider payment arrangements, and cost-sharing with plan participants and beneficiaries. In theory, health plans can easily supply information on those structural characteristics to employers, as they could simply state the presence or absence of a complex case management program or the number of providers in their network. The challenge, however, is that no explicit and universally accepted criteria exist that define, for example, the term “case management program.” Plan characteristics evolve rapidly and it remains hard to judge which are truly important to improve quality and efficiency of care and which are “marketing gimmicks,” in the words of an expert panelist. Thus, comparing different health plan options based on those characteristics is a difficult task. Employers can get support from experts,

25
such as benefits consultants, as well as seek information from insurance brokers, and industry associations that have deeper insights into how various options work and what unfamiliar terms mean. Several tools are also available to help employers understand what is behind those labels:
• Industry self-standardization: For common and established offerings, such as DMPs, trade associations may attempt to develop a shared understanding of a service into explicit requirements that provide information and assurance to employers. For example, the Care Continuum Alliance, the trade organization for the care management industry, is developing a standard nomenclature for DMPs (Care Continuum Alliance, 2013).
• Accreditation/certification: Organizations like NCQA and URAC have developed standardized criteria for offerings like disease management that cover, for example, the scientific rigor of content development, program staff training, and quality improvement initiatives (NCQA, 2013; URAC, 2013). Health plans or vendors that seek accreditation or certification of a program have to provide detailed documentation and submit to an audit. For programs that pass the evaluation, employers can rely on the fact that they meet pre-defined minimum standards.
• Request for information protocols: Rather than requiring employers to try and understand the exact nature of structural features of a health plan, request for information tools and resources require health plans to provide such quality information in a standardized fashion, making it easier for employers to compare options. For example, the eValue8 tool gathers health plan quality information in areas such as chronic disease management, health promotion programs, and adoption of health information technology (eValue8 Health Care, 2009).
An important question, however, is to what degree employers need to understand detailed differences in structural characteristics to select a health plan, and our expert panel meeting provided important insights to answer this question.
• Results matter most. In the view of our experts at the panel meeting, the primary question to be asked regarding quality of care should be whether care provided under a health plan meets evidence-based standards of care, achieves adequate disease control and member experience, and ensures prudent stewardship of resources. Thus, details on structural characteristics, although important, should not be a central component of evaluating quality of care in relation to other measures of quality. In addition, a focus on detailing structural characteristics carries the risk of stifling innovation, as health insurers might feel compelled to design plans that have certain criteria rather than try out novel ideas that improve results. Therefore, the expert panelists recommended that information on structural characteristics of a health plan relating to health plan quality should focus on common and well-established services, in particular those that are grounded in solid evidence, and to characteristics that plan participants and beneficiaries care about, such as network adequacy.
• Financial risks to plan participants and beneficiaries need to be understood and communicated. Our experts emphasized that plan designs can vary substantially with respect to cost-sharing, which can further depend on whether a member choses an in-network or out-of-network provider, and sometimes even on the tier into which a plan puts a provider. Deductible and maximum cost-sharing amounts can also vary, and employers need to understand those differences and communicate them to plan
26
participants and beneficiaries so that they can know prospectively the financial risk that they bear. The disclosure requirements for financial features of health plans in the Summary of Benefits and Coverage10 that have been mandated by the Affordable Care Act are important tools in that regard, because they illustrate potential financial exposure of plan participants and beneficiaries based on real-world examples (Federal Register, 2012).
• Plan participants and beneficiaries need to be made aware of possible charges for non-participating providers. The guidance in the Affordable Care Act requires disclosures that compare cost to patients for in-network and out-of-network providers (Federal Register, 2012c). In the opinion of our panelists, however, out-of-network charges for so-called non-participating providers represent an important issue that still needs to be addressed. This term refers to providers of auxiliary services that practice in an in-network institution but do not participate in the network. For example, independent radiologists that practice in a hospital may not have a contract with the same health plans that contract with the hospital. Thus, a patient might select a hospital in his or her network for a procedure, not realizing that all radiology services around that procedure will be considered out-of-network services and thus subject to substantial cost-sharing requirements. As patients have no choice of radiologists once admitted—and are unlikely to be aware of these intricacies—clear information and education on this issue should be provided to employers as well as plan participants and beneficiaries.
• Provider incentives matter. Finally, our expert panelists remarked that employers need to understand and communicate to plan participants and beneficiaries regarding the incentives that a plan’s provider arrangements create and its implications for provider decisions. For example, it matters whether providers are rewarded for providing additional services or for reducing care and whether incentives for providers are tied to financial performance or to quality of care.
10 See information on Summary of Benefits and Coverage guidance and templates published by HHS, DOL, and Treasury at http://www.cms.gov/cciio/Resources/Forms-Reports-and-Other-Resources/index.html

27
6. Process Measures
According to our technical expert panel, early efforts to measure quality were driven by providers largely for the purpose of quality improvement projects, as opposed to payment or driving patients’ selection of providers. Providers sought tools to identify and address gaps in care and developed measures that reflect how well actual care processes align with recommended processes. Gaps in care were then used to target and monitor quality improvement projects. Given the complexity of medical care, a great number of individual measures are required to comprehensively capture process quality for distinct conditions. For example, the Assessing Care of Vulnerable Elders (ACOVE) measurement system has a total of 392 individual process measures for 26 conditions (RAND Corporation, 2007). The RAND Quality Assessment Tools consist of a total of 439 individual measures for general medical conditions, oncology and HIV, cardiopulmonary conditions, children and adolescent health care, and women's health (RAND Corporation, 2000). The American Medical Association’s Physician Consortium for Performance Improvement has developed more than 280 individual measures (American Medical Association, 2013), and many specialty societies, such as the American College of Cardiology, have developed and are developing measure sets. Our search of the National Quality Measures Clearinghouse yielded 1186 individual process measures.
In the context of health plan quality measures, the most visible institution to develop process measures is NCQA. NCQA is a non-profit organization that participates in and conducts a number of programs aimed to improve health care quality. Central to its work is the accreditation of health plans and care management products that health plans provide, such as disease management, as described in Chapter Five. One of its most visible activities is developing and maintaining the Healthcare Effectiveness Data and Information Set (HEDIS) measures, which are the most widely used quality measures for assessing health plan quality. Presently, there are 75 HEDIS measures in eight domains, which are used by roughly 90 percent of health plans to measure and track their quality of care (NCQA). NCQA utilizes an extensive 26-month process to develop new HEDIS measures (NCQA). Any candidate measure is extensively vetted by expert panels to ensure that the measure focuses on an important clinical area, is valid, and uses appropriate methodological techniques.
Obviously, using extremely granular measurement systems is of limited value for health plan comparisons by employers, as they would find it difficult to understand such highly technical information and base decisions on it. For a review, we therefore focused on a selected set of process measures that is endorsed by the National Quality Forum (NQF). We did this because it allows employers to focus on measures that have already been deemed to be useful and valid, as opposed to having to make their own determinations of the validity of available measures.
28
NQF is a public-private partnership that does not develop its own measures, but instead endorses measures that have been developed by other organizations. For example, NQF has endorsed a substantial portion of NCQA’s HEDIS measures, and CMS contracts with NQF to review and endorse measures for its public reporting and accountability programs. NQF uses its formal Consensus Development Process (CDP) for endorsement, which takes into consideration not only the soundness of a measure’s scientific rationale but also its usability for decisionmaking (National Quality Forum, 2013). This rigorous evaluation process ensures that only a limited number of measures get endorsement status and that the NQF measures represent a reasonably parsimonious collection of measures for evaluation of health plans. We therefore centered our review of the measurement science on the 232 process measures that have been endorsed by NQF to date.
As pointed out in Chapter Three, care processes reflect the better care component of the Triple Aim. We used three subcategories that reflect whether care is provided according to evidence-based and professional standards to inform our scan for existing performance measures (Birkmeyer, Dimick and Birkmeyer, 2004):
• Safe practices (e.g., use of electronic prescribing) • Adherence to evidence-based guidelines and current standards of care (e.g., percentage of
plan participants who receive mammograms) • Avoidance of overuse (e.g., avoidance of unnecessary and potentially harmful medical
services (Institute of Medicine Committee on Quality of Health Care in America, 2001). The three subcategories are discussed in the three following subsections. In each, we first
provide an expanded conceptual definition and then discuss the state of the measurement science.
6.1 Safe Practices
Definition
Safety of care is defined as "avoiding injuries to patients from the care that is intended to help them" (Institute of Medicine, 2001). Put simply, safe care can be described as "care that does not cause harm" (Hibbard J and Sofaer S, 2010). The IOM’s seminal study To Err is Human brought the issue of patient safety to the forefront of the public’s attention (Kohn, Corrigan and Donaldson, 2000). Its findings suggest that medical errors resulted in between 44,000 and 98,000 deaths annually, ranking them as the eighth leading cause of death in the United States, and medication errors alone account for over 7,000 deaths per year (Levinson and Inspector General, 2010). No patient is immune from the effects of patient safety deficits, though some patients may be at increased risk for unsafe events because of their clinical characteristics (e.g., having multiple chronic conditions) or demographic characteristics (e.g., being elderly). Safety remains a crosscutting issue that affects patients with any medical condition(s).
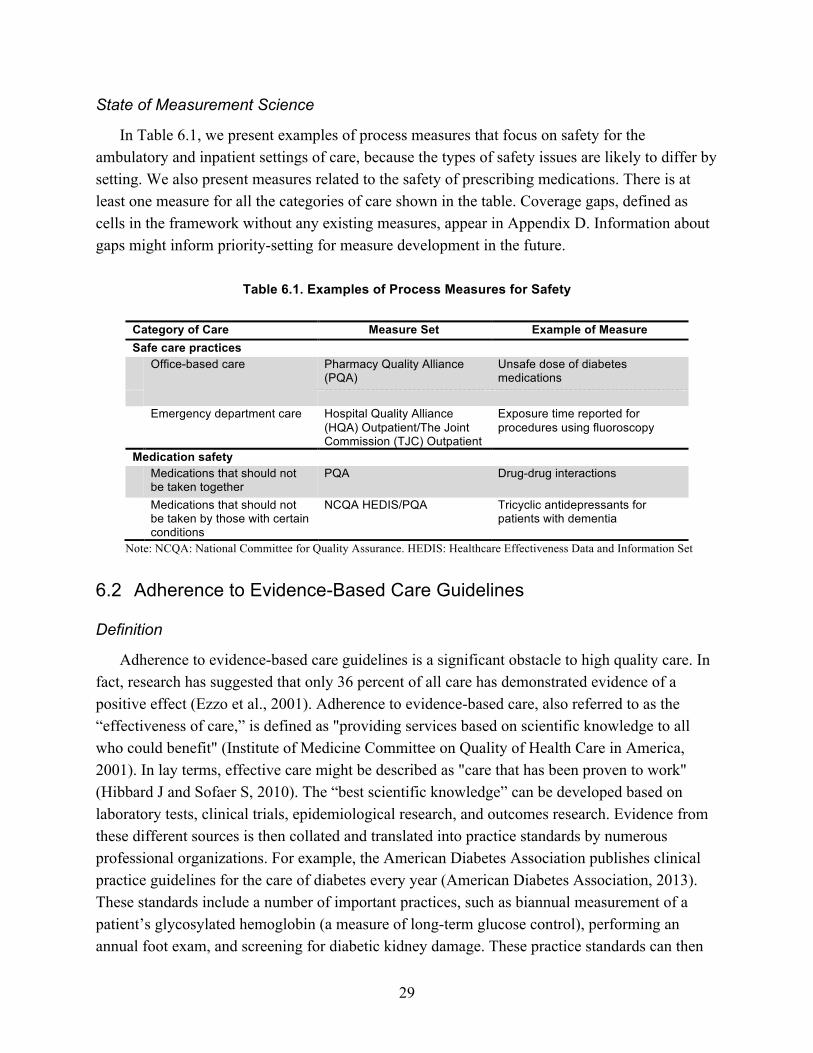
29
State of Measurement Science
In Table 6.1, we present examples of process measures that focus on safety for the ambulatory and inpatient settings of care, because the types of safety issues are likely to differ by setting. We also present measures related to the safety of prescribing medications. There is at least one measure for all the categories of care shown in the table. Coverage gaps, defined as cells in the framework without any existing measures, appear in Appendix D. Information about gaps might inform priority-setting for measure development in the future.
Table 6.1. Examples of Process Measures for Safety
Category of Care Measure Set Example of Measure Safe care practices Office-based care Pharmacy Quality Alliance
(PQA) Unsafe dose of diabetes medications
Emergency department care Hospital Quality Alliance
(HQA) Outpatient/The Joint Commission (TJC) Outpatient
Exposure time reported for procedures using fluoroscopy
Medication safety Medications that should not
be taken together PQA Drug-drug interactions
Medications that should not be taken by those with certain conditions
NCQA HEDIS/PQA Tricyclic antidepressants for patients with dementia
Note: NCQA: National Committee for Quality Assurance. HEDIS: Healthcare Effectiveness Data and Information Set
6.2 Adherence to Evidence-Based Care Guidelines
Definition
Adherence to evidence-based care guidelines is a significant obstacle to high quality care. In fact, research has suggested that only 36 percent of all care has demonstrated evidence of a positive effect (Ezzo et al., 2001). Adherence to evidence-based care, also referred to as the “effectiveness of care,” is defined as "providing services based on scientific knowledge to all who could benefit" (Institute of Medicine Committee on Quality of Health Care in America, 2001). In lay terms, effective care might be described as "care that has been proven to work" (Hibbard J and Sofaer S, 2010). The “best scientific knowledge” can be developed based on laboratory tests, clinical trials, epidemiological research, and outcomes research. Evidence from these different sources is then collated and translated into practice standards by numerous professional organizations. For example, the American Diabetes Association publishes clinical practice guidelines for the care of diabetes every year (American Diabetes Association, 2013). These standards include a number of important practices, such as biannual measurement of a patient’s glycosylated hemoglobin (a measure of long-term glucose control), performing an annual foot exam, and screening for diabetic kidney damage. These practice standards can then
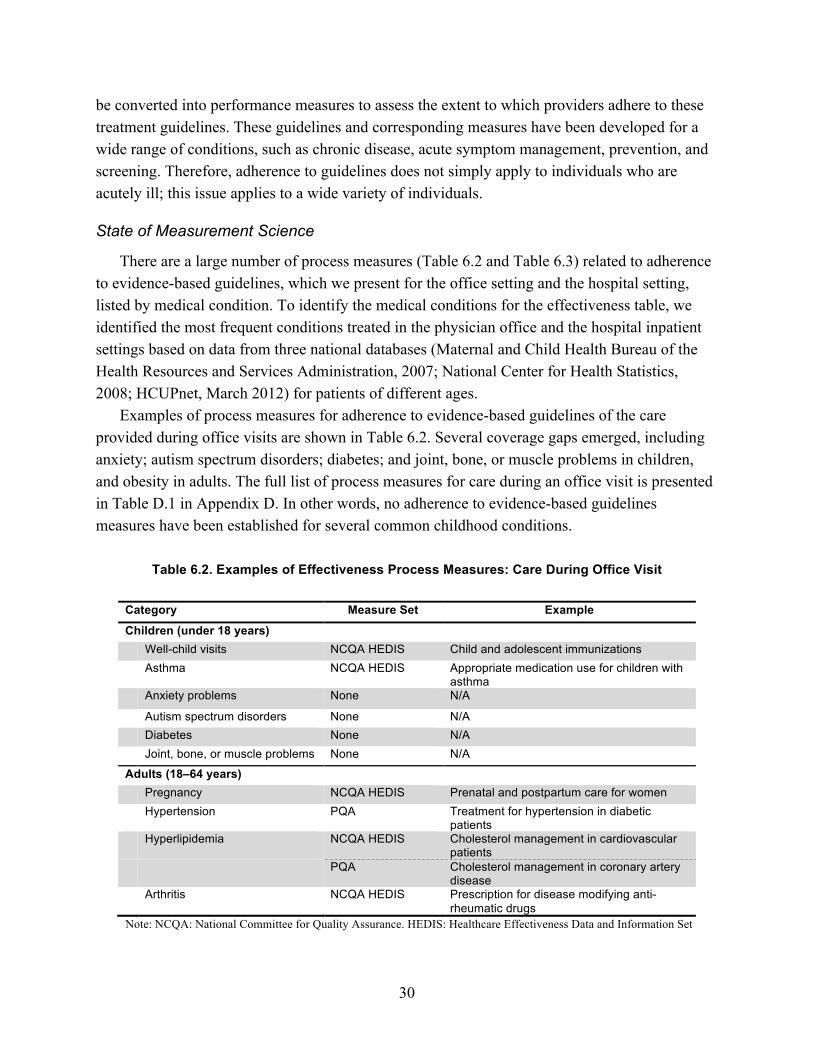
30
be converted into performance measures to assess the extent to which providers adhere to these treatment guidelines. These guidelines and corresponding measures have been developed for a wide range of conditions, such as chronic disease, acute symptom management, prevention, and screening. Therefore, adherence to guidelines does not simply apply to individuals who are acutely ill; this issue applies to a wide variety of individuals.
State of Measurement Science
There are a large number of process measures (Table 6.2 and Table 6.3) related to adherence to evidence-based guidelines, which we present for the office setting and the hospital setting, listed by medical condition. To identify the medical conditions for the effectiveness table, we identified the most frequent conditions treated in the physician office and the hospital inpatient settings based on data from three national databases (Maternal and Child Health Bureau of the Health Resources and Services Administration, 2007; National Center for Health Statistics, 2008; HCUPnet, March 2012) for patients of different ages.
Examples of process measures for adherence to evidence-based guidelines of the care provided during office visits are shown in Table 6.2. Several coverage gaps emerged, including anxiety; autism spectrum disorders; diabetes; and joint, bone, or muscle problems in children, and obesity in adults. The full list of process measures for care during an office visit is presented in Table D.1 in Appendix D. In other words, no adherence to evidence-based guidelines measures have been established for several common childhood conditions.
Table 6.2. Examples of Effectiveness Process Measures: Care During Office Visit
Category Measure Set Example
Children (under 18 years) Well-child visits NCQA HEDIS Child and adolescent immunizations Asthma NCQA HEDIS Appropriate medication use for children with
asthma Anxiety problems None N/A
Autism spectrum disorders None N/A Diabetes None N/A Joint, bone, or muscle problems None N/A
Adults (18–64 years) Pregnancy NCQA HEDIS Prenatal and postpartum care for women Hypertension PQA Treatment for hypertension in diabetic
patients Hyperlipidemia NCQA HEDIS Cholesterol management in cardiovascular
patients PQA Cholesterol management in coronary artery
disease Arthritis NCQA HEDIS Prescription for disease modifying anti-
rheumatic drugs Note: NCQA: National Committee for Quality Assurance. HEDIS: Healthcare Effectiveness Data and Information Set

31
Table 6.3 presents select process measures for the effectiveness of care provided during a hospital stay. Several gaps emerged, including pneumonia, acute bronchitis, mood disorders, skin and subcutaneous tissue infections, and epilepsy in children, and musculoskeletal conditions, complications of devices, and COPD in adults. The full list of process measures for care during a hospital stay, including diagnoses without corresponding measures, is listed in Table D.2 in Appendix D.
Table 6.3. Examples of Effectiveness Process Measures: Care During Hospital Stay
Age Group and Diagnosis Measure Set Example
Children (under 18 years) Live births and perinatal conditions HQA inpatient Pediatric intensive care unit (PICU) pain
assessment Leapfrog Newborn bilirubin screening prior to
discharge Adults (18–44 years) Conditions and complications related
to pregnancy and/or delivery HQA inpatient Appropriate deep vein thrombosis
prophylaxis in women undergoing cesarean delivery
Mood disorders HQA inpatient Patients discharged on multiple antipsychotic medications
Adults (45–64 years) Musculoskeletal conditions (including
osteoarthritis and back problems) None N/A
Cardiovascular conditions HQA inpatient Statin prescribed at discharge for acute myocardial infarction (AMI) patients
Note: HQA: Hospital Quality Assurance
6.3 Overuse of Medical Services
Definition
Overuse of medical services remains a substantial obstacle to high-quality health care. Not only does overuse waste resources, but it also creates risk to patient safety, for example, through exposure to radiation for discretionary imaging or through potential complications from invasive procedures. The IOM defines overuse as “the provision of care for which the potential risks outweigh the potential benefits” (Institute of Medicine Committee on Quality of Health Care in America, 2001). Several decades of research have demonstrated that overuse is a substantial problem in health care, and two branches of research in particular have quantified its magnitude. Researchers at Dartmouth discovered the phenomenon of small area variation in the usage rates for a broad range of common medical procedures, from cesarean sections and overuse of magnetic resonance imaging to heart surgery (The Dartmouth Institute for Health Policy and Clinical Practice, 2012). They showed that variation is much higher than what could be
32
explained by variation in patient need and also that usage patterns are inconsistent (i.e., one region could have high rates of one procedure but low rates of another).
The second branch is the appropriateness research that originated at RAND (Brook, 1995). This research used evidence and expert opinion to define explicit criteria to judge the appropriateness of certain medical procedures, given the symptoms, comorbidities, and diagnostic findings in a patient. Using those tools, researchers typically find that about a third of high-cost, high-risk procedures, such as carotid surgery or cardiac catheterization, are performed in patients without an appropriate indication. Interestingly, researchers usually find a similar proportion of inappropriate procedures irrespective of whether the overall utilization rate for a procedure is high or low. In other words, it does not appear that providers in areas with low utilization rates are more selective and more inclined to base decisions on evidence; rather, they are have a lower propensity to use health care services overall. Taken together, this research points to inconsistencies in medical decisionmaking, and demonstrates a failure to incorporate evidence into decisions. While this problem is widely recognized—and solving it could reduce cost and improve quality—a solution has yet to be found.
State of Measurement Science
The NQF database focuses on overuse of high-cost diagnostic tests and overuse of services for cancer, obstetrics, lower back pain, and respiratory infections (Table 6.4). A total of 19 measures were identified: six HEDIS measures; three measures each from the American College of Cardiology Foundation and CMS; two measures each from the American Medical Association-Physician Consortium for Performance Improvement (AMA-PCPI) and Partners HealthCare System; and one measure each from the Hospital Corporation of America, Christiana Care Health System, and California Maternal Quality Care Collaborative. The full list of NQF-endorsed measures of overuse measures is listed on Table D.3 in Appendix D.

33
Table 6.4. Examples of NQF-Endorsed Measures of Overuse
Measure Measure Set Cardiac diagnostic tests Cardiac stress imaging not meeting appropriate use criteria:
preoperative evaluation in low risk surgery patients American College of Cardiology Foundation
Diagnostic imaging use Inappropriate pulmonary CT imaging for patients at low risk
for pulmonary embolism Partners HealthCare System
Cancer care Prostate cancer: avoidance of overuse measure – isotope
bone scan for staging low-risk patients AMA-PCPI
Obstetric care Cesarean section rate for low-risk first birth women California Maternal Quality
Care Collaboration Back pain care Lower-back pain: surgical timing NCQA Antibiotic use Avoidance of antibiotic treatment in adults with acute
bronchitis NCQA
Emergency care Risk-adjusted rate of emergency room use CMS Note: AMA-PCPI: American Medical Association-Physician’s Consortium for Performance Improvement. NCQA: National Committee for Quality Assurance. CMS: Centers for Medicare and Medicaid Services.
6.4 Evaluation of Current State of Process Quality Measurement
As discussed earlier, efforts to measure quality were driven largely by providers for the purpose of quality improvement projects, as opposed to payment or driving patients’ selection of providers. This has led to the development of a large number of process measures, which are arguably most useful for quality improvement purposes. Using those granular and highly technical measures is difficult for employers, but the emergence of rigorous standards for measures evaluation, particularly the NQF process, implies that measures in national use can be assumed to be scientifically sound and relevant. The endorsement process has also led to convergence, as organizations prioritize endorsed measures rather than creating their own.
Our review suggests that many process measures have been developed and are being developed. While several domains of care remain insufficiently represented, we identified the lack of measures for overuse of care as the most important gap in process measurement. With increasing evidence that selected medical services are overused (i.e., for indications where they are unlikely to have clinical benefit or they can be potentially harmful) there is a growing interest in measures that would capture such overuse and help to address it. But, given the above-mentioned focus on process measures to guide providers’ quality improvement efforts, most process measures to date capture gaps in care or underuse rather than potentially discretionary care or overuse. Thus, there is a gap in current measurement science regarding measures for overuse of care, such as utilization of diagnostic and therapeutic services that are unnecessary and potentially harmful, as well as the use of unnecessary procedures, such as elective pre-term
34
cesarean sections. Selected overuse measures have been developed, such as on antibiotics use for upper respiratory infections. In addition, reporting of population rates for potentially discretionary procedures, such as cesarean section rate, is used to identify potential overuse by benchmarking health plans or providers. The problem, however, is that crude utilization rates that do not account for patient characteristics and health risks are unable to provide conclusive evidence for overuse.
Efforts to develop additional overuse measures are often met with resistance. Providers dislike such measures because they view them as interfering with independent clinical decisionmaking and are concerned about revenue implications. As a consequence, overuse measures get challenged during the development and review process as potentially creating obstacles to appropriate care, and it is difficult to get them accepted by review committees unless they can specify precisely under which condition a procedure is and is not appropriate. Our panel discussion revealed that overuse measures commonly get rejected in the NQF review process for that very reason. At the same time, patients’ demand for services and their pervasive belief that “more care is better care” can undermine the rationale for the development of overuse measures.
To establish acceptable measures for overuse, medical specialists, professional societies, and the research community need to collaborate to incorporate explicit standards for appropriate and inappropriate use into guidelines, especially of high-cost and high-volume procedures. The Choosing Wisely Campaign, led by the American Board of Internal Medicine Foundation, is an effort that attempts to address issues of overuse (Choosing Wisely Campaign, 2013). As part of the campaign, a number of specialty societies are identifying frequently ordered tests or procedures commonly used in their field that provide little benefit or potential harm. Consumer Reports has partnered with the Choosing Wisely Campaign to develop tools and resources for individuals to help physicians discuss issues of overuse or misuse in clinical settings. Such “upstream” approaches create an evidence base allowing developers to support the scientific credibility of overuse measures (Mathias and Baker, 2013).

35
7. Outcomes Measures
Outcome measures reflect the actual results that a health plan achieves in the following three areas:
• Medical outcomes, reflecting safety, timeliness, and effectiveness, can be captured at two levels - Intermediate (or proxy) outcomes, such as control of hypertension - Health outcomes, such as rates of surgical complications
• Patient experience, a measure used to capture a health plan’s patient-centeredness • Efficiency measures to reflect resource use per relevant outcomes (or value) as opposed
to cost measures that do not consider medical or patient-centered outcomes. Outcome measures are more intuitive and easier to understand for a non-technical audience,
like employers, than process measures that reflect technical details of medical care delivery. However, as the development of quality measures has been primarily driven by health care providers who sought tools to identify and address gaps in care, as pointed out in the previous section, measures were primarily based on how well actual care processes align with guideline-recommended processes. Less emphasis has been given to developing outcomes measures, because they do not point to a specific gap in care and are thus less useful for quality improvement purposes. Further, outcomes occur with a certain time lag; are often rare, since only a small subset of patients, for example, will have surgical complications; and are difficult to attribute to particular clinical decisions of a provider. Therefore, providers have been reluctant to be assessed on measures that may not be directly impacted by their decisions.
To illustrate, the NQF database contains 94 outcomes measures (compared to 232 process measures) and the National Quality Measures Clearinghouse has 341 outcomes measures (compared to 1,186 process measures). Recognizing this gap, many prominent measures developers are currently focusing on outcomes measurement. Federal agencies, such as CMS and AHRQ, have made substantial investments in projects to develop outcomes measures. NQF gives outcomes measures preferential treatment during its review process, in that it requires a lower burden of proof for endorsement. For example, in 2012, in an effort to make health care safer, NQF endorsed two measures related to all-cause unplanned readmissions in hospitals that could be used for quality improvement and accountability. The development of outcomes measures, such as the ones mentioned above, is seen as a critical step, not only to provide actionable information to plan participants and beneficiaries—as well as employers—but because growing evidence suggests a disconnect between processes of care and outcomes (i.e., providers with a good track record based on process measures do not always achieve excellent outcomes, and vice versa). As with process measures, we focus our review on NQF-endorsed measures.
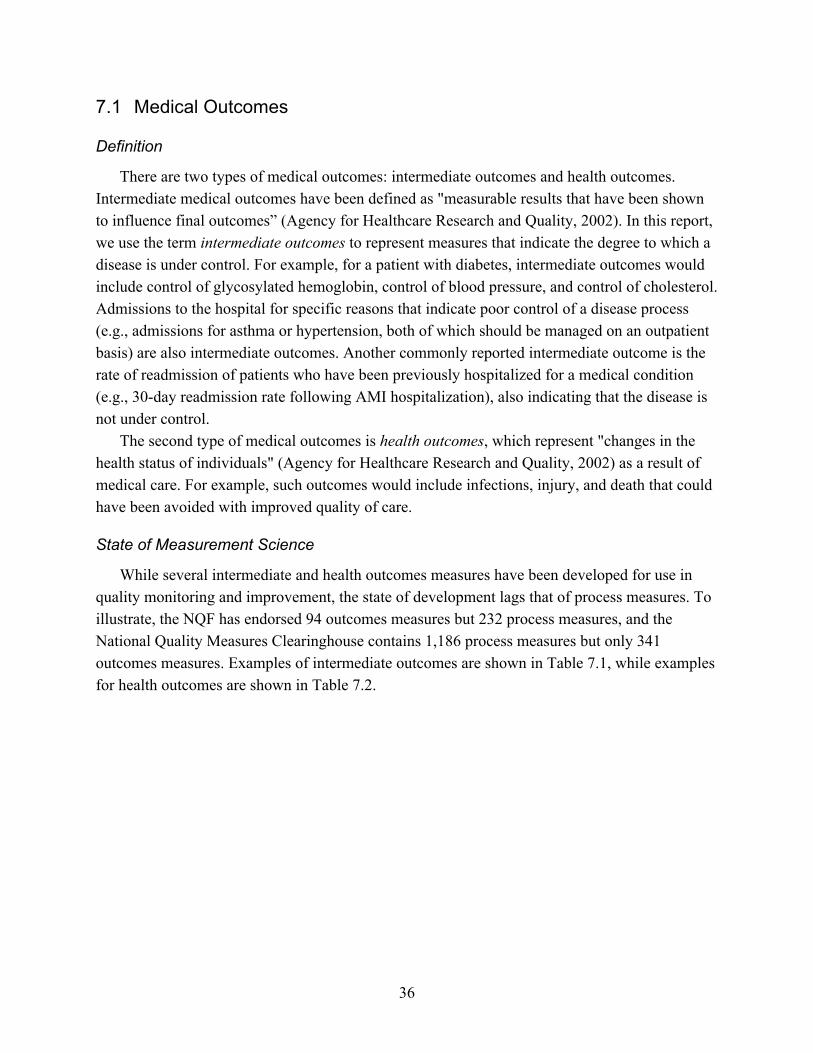
36
7.1 Medical Outcomes
Definition
There are two types of medical outcomes: intermediate outcomes and health outcomes. Intermediate medical outcomes have been defined as "measurable results that have been shown to influence final outcomes” (Agency for Healthcare Research and Quality, 2002). In this report, we use the term intermediate outcomes to represent measures that indicate the degree to which a disease is under control. For example, for a patient with diabetes, intermediate outcomes would include control of glycosylated hemoglobin, control of blood pressure, and control of cholesterol. Admissions to the hospital for specific reasons that indicate poor control of a disease process (e.g., admissions for asthma or hypertension, both of which should be managed on an outpatient basis) are also intermediate outcomes. Another commonly reported intermediate outcome is the rate of readmission of patients who have been previously hospitalized for a medical condition (e.g., 30-day readmission rate following AMI hospitalization), also indicating that the disease is not under control.
The second type of medical outcomes is health outcomes, which represent "changes in the health status of individuals" (Agency for Healthcare Research and Quality, 2002) as a result of medical care. For example, such outcomes would include infections, injury, and death that could have been avoided with improved quality of care.
State of Measurement Science
While several intermediate and health outcomes measures have been developed for use in quality monitoring and improvement, the state of development lags that of process measures. To illustrate, the NQF has endorsed 94 outcomes measures but 232 process measures, and the National Quality Measures Clearinghouse contains 1,186 process measures but only 341 outcomes measures. Examples of intermediate outcomes are shown in Table 7.1, while examples for health outcomes are shown in Table 7.2.

37
Table 7.1. Example of Intermediate Outcome Measures
Intermediate Outcome Measure Set Example of Measure Control of biometric marker NCQA HEDIS HbA1c control for patients with
diabetes
AQA LDL cholesterol level >130md/dL for patients with hyperlipidemia
Hospital admission AHRQ pediatric quality indicators (PQI)
Admissions for hypertension
AHRQ PQI Asthma admissions
Hospital readmission HQA inpatient (TJC inpatient) 30-day readmission rate following AMI hospitalization
Notes: NCQA HEDIS: National Committee for Quality Assurance Healthcare Effectiveness Data and Information Set. AQA: Formerly Ambulatory Care Quality Alliance, now AQA. AHRQ: Agency for Healthcare Research and Quality
Table 7.2. Examples of Health Outcome Measures
Health Outcome Measure Set Example of Measure Health care–associated infection AHRQ patient safety indicators (PSI) Central venous catheter-related
bloodstream infections AHRQ pediatric quality indicators (PQI)
Postoperative sepsis
Health care–associated injury AHRQ PSI Postoperative hip fracture AHRQ PQI Accidental puncture or laceration
Avoidable mortality AHRQ PSI Deaths in low-mortality diagnostic related groups (DRGs)
AHRQ PQI Deaths after partial or full hip replacement
Notes: AHRQ: Agency for Healthcare Research and Quality
7.2 Patient-Centeredness
Definition
Patient-centeredness of care is defined as "providing care that is respectful of and responsive to individual patient preferences, needs, and values and ensuring that patient values guide all clinical decisions" (Institute of Medicine Committee on Quality of Health Care in America, 2001). In lay terms, patient-centered care might be described as "care that is responsive to a patient’s needs" (Hibbard and Sofaer, 2010). Practitioners are increasingly recognizing the importance of the patient in the care process. Patient participation in the care process might include using public reports to choose providers, seeking second opinions from other providers, and being included in the decisions about which procedure or service to pursue. This focus on patient-centeredness has contributed to the growth and primacy of measures of patient experience.
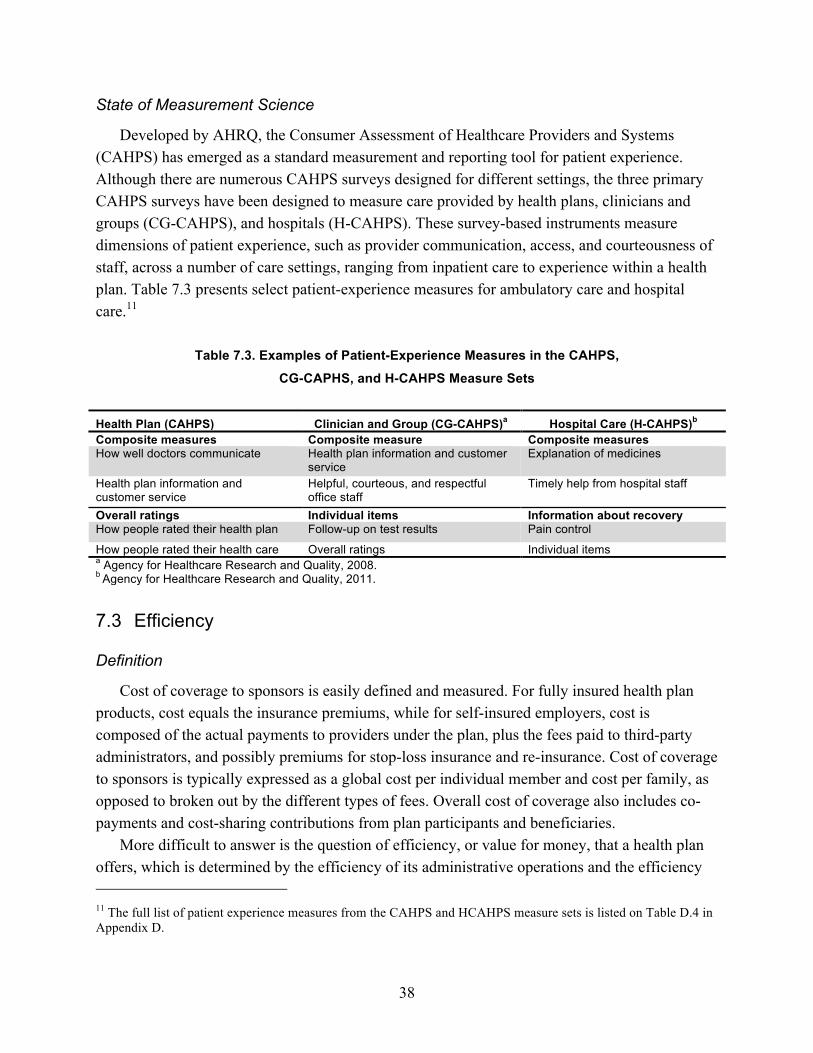
38
State of Measurement Science
Developed by AHRQ, the Consumer Assessment of Healthcare Providers and Systems (CAHPS) has emerged as a standard measurement and reporting tool for patient experience. Although there are numerous CAHPS surveys designed for different settings, the three primary CAHPS surveys have been designed to measure care provided by health plans, clinicians and groups (CG-CAHPS), and hospitals (H-CAHPS). These survey-based instruments measure dimensions of patient experience, such as provider communication, access, and courteousness of staff, across a number of care settings, ranging from inpatient care to experience within a health plan. Table 7.3 presents select patient-experience measures for ambulatory care and hospital care.11
Table 7.3. Examples of Patient-Experience Measures in the CAHPS,
CG-CAPHS, and H-CAHPS Measure Sets
Health Plan (CAHPS) Clinician and Group (CG-CAHPS)a Hospital Care (H-CAHPS)b Composite measures Composite measure Composite measures How well doctors communicate Health plan information and customer
service Explanation of medicines
Health plan information and customer service
Helpful, courteous, and respectful office staff
Timely help from hospital staff
Overall ratings Individual items Information about recovery How people rated their health plan Follow-up on test results Pain control
How people rated their health care Overall ratings Individual items a Agency for Healthcare Research and Quality, 2008. b Agency for Healthcare Research and Quality, 2011.
7.3 Efficiency
Definition
Cost of coverage to sponsors is easily defined and measured. For fully insured health plan products, cost equals the insurance premiums, while for self-insured employers, cost is composed of the actual payments to providers under the plan, plus the fees paid to third-party administrators, and possibly premiums for stop-loss insurance and re-insurance. Cost of coverage to sponsors is typically expressed as a global cost per individual member and cost per family, as opposed to broken out by the different types of fees. Overall cost of coverage also includes co-payments and cost-sharing contributions from plan participants and beneficiaries.
More difficult to answer is the question of efficiency, or value for money, that a health plan offers, which is determined by the efficiency of its administrative operations and the efficiency 11 The full list of patient experience measures from the CAHPS and HCAHPS measure sets is listed on Table D.4 in Appendix D.

39
of care that is provided under the plan’s rules and through its network. Employers can compare administrative efficiency by looking at third-party administrator fees for self-insured plans and the medical loss ratio12 of fully insured plans.
Efficiency of care represents the results, in terms of health outcomes and member experience, that a plan achieves per dollar of total cost of coverage spent. It is defined by the IOM as "avoiding waste, including waste of equipment, supplies, ideas, and energy" (Institute of Medicine Committee on Quality of Health Care in America, 2001). In lay terms, an efficient provider might be described as one who “uses health care dollars wisely,” or “is careful with your health care dollars” (Hibbard and Sofaer, 2010).
State of Measurement Science
While it is widely accepted that current patterns of medical care are inefficient,13 no accepted approach for measuring and reporting efficiency for the purpose of selecting health plans has been established. A 2008 RAND review found that no efficiency measures identified a quality dimension. The authors proposed that all efficiency measures should incorporate information about quality, or at least be presented with a paired quality measure. If the measure does not address quality, they argued that the measure should be called a cost or utilization measure and not an efficiency measure (McGlynn, 2008).
While still technically measures for utilization, the NCQA Relative Resource Use measures are often used as proxy for efficiency. They represent how intensively plans use office visits, hospitalizations, and other health care resources to care for individuals with one of six medical conditions (diabetes, asthma, hypertension, COPD, cardiovascular conditions, and acute lower back pain).
7.4 Evaluation of Current State of Outcomes Measurement Of the three areas of relevant outcomes (medical, patient experience, and efficiency), only
the area of patient experience has a widely accepted measure set, in the form of the AHRQ CAHPS instruments. While several measures for intermediate and health outcomes have been developed, the state of measurement science is far less advanced than for process measures and substantial gaps remain to be addressed. Most notably, little progress has been made to date in
12 Medical loss ratio refers to the percentage of premium received by a health plan that is paid to cover beneficiary health care costs. The Accountable Care Act requires that the minimum medical loss ratio for individual and small group markets be no less than at 80 percent, and 85 percent for the large group market 13 For example, Mello et al. found that adverse events alone account for as much as $1,775 in costs for each admission (Mello et al., 2007), while Berwick and Hackbarth estimated that waste accounted for roughly $910 billion, or 34 percent of all health spending, with that estimate ranging anywhere from $558 billion to $1.2 trillion (21–47 percent) in 2011 (Berwick and Hackbarth, 2012).
40
the measurement of efficiency of care. Available measures mostly consider cost or utilization, but do not assess resource per relevant outcome.
Thus, even when measures were beginning to be employed for public reporting and pay-for-performance schemes, the emphasis remained on process measures. At the same time, employers prefer information on outcomes to make informed decisions about health plans, since they are less interested in the details of the care process and more interested in the results that providers can achieve. Finally, outcomes measures, such as functional status or mortality rates, are typically more intuitive and relevant for non-technical audiences.
The current state of health data infrastructure imposes significant limitations on measurement of health outcomes. Clinical data are typically owned by separate providers or provider groups, such as hospitals and physician offices, so tracking patients across settings and over time is difficult, which limits the ability to ascertain long-term outcomes. Consequently, many outcomes measures that are currently in use focus on short-term outcomes that are clearly under the control of distinct providers. Examples are hospital-acquired infections after major surgery or in-hospital mortality after admission for AMI. In addition, clinical data are often recorded in paper form in the patients’ medical records and therefore not integrated into any electronic database or readily accessible for outcomes measurement.
Health information technology can fundamentally improve data availability and, therefore, outcomes measurement. Electronic medical records (EMRs) store patient records electronically and (to some degree) in coded variables; PHRs can also add patient-entered information, such as symptoms. A limitation remains in that today’s systems tend not to be interoperable, meaning that data cannot easily be transferred between providers with different EMR/PHR products, which restricts the ability to track patients and their outcomes over time and across providers.
Efforts are currently under way to promote interoperability and, if successful, could substantially improve the ability to measure outcomes. The ability to track patients over time and across various health care providers would allow basing outcomes measurement on changes over time rather than status at one point in time. For example, range-of-motion outcomes after joint replacement surgery would take pre-operative mobility of the patient into account rather than limiting evaluation to whether a certain clinical standard was met throughout the care process. Such patient-centric outcomes measurement would help to address the challenge of risk adjustment that often limits the usability of outcomes measures. Richer datasets would also allow extending the use of outcomes measures beyond the state and hospital levels and go to an even lower level of aggregation, such as individual providers, and measuring performance of specialists.
The continuous rise in health care cost has increased the interest in efficiency measures that could help employers and consumers select providers who provide the best value for money. But the state of the measurement science continues to lag far behind. Currently, there is an active research agenda on methods to capture overall cost of care and cost per episode. In addition, NCQA has developed a set of “relative resource use” measures to compare health plans’ use of

41
services, medication, visits, and procedures for patients with a specific condition. The measures compare actual use of those resources against expected use, based on the plan’s population.
However, actual efficiency measures that would capture outcomes achieved per resources used have yet to be developed, and numerous obstacles remain to be addressed. First, there is no universally accepted framework that defines a shared understanding of efficiency. Researchers and measures developers disagree on the perspective from which to determine efficiency (e.g., societal versus payer), which costs and outcomes to include, and which methodology to use. Second, sufficiently granular data on cost of care (as opposed to charges for care) are not widely available. Third, as with overuse measures, consumers tend to equate efficient care with inferior care, and might be reluctant to base decisions on efficiency measures. Finally, participants in our expert panel pointed out that it is difficult to impose efficiency measures on providers while the payment system rewards inefficient care patterns.
Thus, providing side-by-side cost and quality information to employers is currently seen as the best alternative to reporting “efficiency” of care. Experts remarked that consumers tend to prefer the most expensive plan when they are shown information on quality and cost, because they use price as a proxy for quality. To overcome this misconception and to allow employers to make informed decisions and communicate the rationale of those decisions to plan participants and beneficiaries, explanatory information, or “cues,” can be used to communicate cost-quality considerations in a user-friendly fashion.

42
8. State of Practice in Employer Decisionmaking About Health Plans
The previous four chapters have shown that our understanding of the structural characteristics of health plans has greatly improved, along with the measurement science to evaluate plan performance. This chapter discusses how employers are actually making decisions about health plans today, and is based on expert interviews, a review of the trade literature, and an assessment of existing decision tools. First, we discuss the key sources of information used by employers to make health plan choices. Second, we discuss employers’ key considerations in health plan selection.
8.1 Information Sources
Employers discussed several information sources that they use most commonly to inform health plan choices. We found three key types of information sources: decision tools that summarize quality information in a user-friendly format, employer coalitions, and benefits consultants.
Decision Tools
In our review, we identified three types of decision tools that can help employers make decisions on health plans.
1. Accreditation: Organizations like NCQA, a private not-for-profit organization that accredits health plans, also offer tools to purchasers to compare health plans. NCQA, for example, awards three levels of accreditation for health plans that meet specific requirements for consumer protection and quality improvement: “accredited” for meeting basic requirements, “commendable” for meeting rigorous requirements, and “excellent” for plans that meet or exceed these rigorous requirements and rank among the best performers. Plan performance is evaluated on the basis of onsite surveys, document review, and HEDIS and CAHPS measures. Furthermore, NCQA releases rankings of those plans that agree to the publication of their performance and for which sufficient data are available. These rankings currently cover nearly 500 plans, which are compared to the other plans in their line of business (e.g., commercial, Medicare, Medicaid). The scores combine clinical quality measures (HEDIS measures), which account for up to 60 points of the overall score; experience measures (based on CAHPS), which account for up to 25 points; and the results from an onsite audit of plan policies and procedures, which account for up to 15 points. Based on how the plan’s scores compare with the national average of plans in the same product line, plans are assigned ratings in each of the three types of quality measures (treatment, consumer satisfaction, and prevention). These ratings apply a scale from 1 to 5, with 5 being assigned to the “top 10 percent of
43
plans which are also statistically different from the mean,” 4 to the “top one-third that are not in the top 10 percent of plans, and are statistically different from the mean,” 3 to the “middle one-third of plans and plans that are not statistically different from the mean,” 2 to the “bottom one-third that are not in the bottom 10 percent and are statistically different from the mean,” and 1 to the “bottom 10 percent of plans which are also statistically different from the mean.”
2. Standardized information-gathering tools: As an example, eValue8 is a health care assessment tool created by the National Business Coalition on Health (NBCH), in partnership with a group of large employers. It aims to “measure and evaluate health plan performance” and “advance value-based purchasing.” It is a standardized and proprietary request for information (RFI) survey that requests specific pieces of information from health plans, which is subsequently analyzed by “NBCH trained reviewers and scored based on best practice standards.” eValue8 is a tool that benchmarks quality domains such as health promotion, adoption of health information technology, member and provider support, disease management, provider performance measurement, and behavioral health (eValue8 Health Care, 2009). The summary identifies "best in class" vendors and “prepares easy-to-compare performance reports that allow participants to assess health care vendors” along a range of areas, including the adoption of health information technology, member and provider communication, disease management, program administration, provider performance, patient safety, pharmacy benefit management, behavioral health, and financial stability (eValue8 Health Care, 2009; Silow-Caroll and Alteras, 2007).
3. Health plan rating systems: While not designed explicitly for evaluation of commercial health plans, the Five Star Quality Rating System, which CMS created for Medicare Advantage Plans, is the best-known rating system. It uses data from surveys and claims data, and the ratings are based on measures from HEDIS, CAHPS, and CMS. The aim is to provide information on the quality of health plans and scores are publicly available through a web portal. Stars are assigned at measure level (up to 55 measures), domains (five for health and four for drug plans), and overall plan level. The ratings range from 1 to 5 stars (poor, below average, average, above average, excellent)—there are half-star ratings for the overall health plan and drug plan ratings and a special high-performing icon (for 5 star plans) and low-performing icon (for plans with a 2.5 rating or lower in the past three years). Medicare Advantage Plans are rated on how well they perform in five different domains: (1) staying healthy (screenings, tests, and vaccines); (2) managing chronic (long-term) conditions; (3) member experience; (4) member complaints, problems getting services, and improvement in plan performance; and (5) customer service.
Employer Coalitions
Business coalitions for purchasing health coverage and related services have become increasingly common. These organizations are voluntary associations of businesses that work together to improve the quality and reduce the cost of health coverage products through collective action. The activities of a business coalition include anything from participating in group purchases of health coverage and related services (e.g., prescription drug benefits) and measuring quality of health care providers to providing a unified voice for interacting with health

44
insurance companies and acting as a central repository for tools and information to help member employers make decisions related to their employees’ health care. These business coalitions are generally comprised of medium to large employers and are mostly regional. The NBCH is an umbrella organization that includes 54 regional coalitions. According to feedback from our interviews, however, employer coalitions mostly collaborate to develop tools and evaluate quality metrics and/or pool purchasing power to help their members make decisions, but are typically not involved in purchasing decisions.
Benefits Consultants
While employers can draw on many information sources, their primary source is benefits consultants. In our interviews, employers considered health insurance to be an extremely important, but complex, product to assess. Benefits consultants served the purpose of helping employers with the decision process. One employer explained that expertise was the key reason for utilizing a consultant, because “they know the marketplace better than I do, they drill down into the quality. They are able to determine who has the better financial deals.” One benefits manager said that, for products such as life or dental coverage, he usually vets the products himself, but felt that health insurance was generally too complicated to assess without the help of consultants. Another benefits manager expressed a similar sentiment, “You’re not going to be able to discriminate very well from one carrier to another on your own. You’re going to get a consultant to do that. You’re going to get a full-blown RFP [Request for Proposals]. It’s quite an endeavor to do this without a consultant. You need experts, with the right tools.”
Consultants typically collect information from health plans on employers’ behalf through an RFP. As part of the RFP process, employers provide consultants with basic information, such as their preferred plan attributes (e.g., large network, low cost, maternity coverage), some basic demographics on their employees (e.g., number of employees, average age, proportion of each gender), and often the employer’s previous claims history. The consultants use this information to develop a series of questions that they will ask and data that they will request from prospective health plans. Depending on what the employer has requested, these questions may be related to the presence or absence of DMPs, network size and included providers, and NCQA accreditation. Employers also find consultants to be especially helpful when estimating expected costs across potential health plans. The consultant can ask health plans to re-run the prior claims and re-price those claims based on the health plan’s pricing structure. Health plans will generally provide these price estimates using their entire book of business, but savvy employers will push to have the re-pricing performed with their own claims. One business coalition leader stated, “One problem is that health plans often try to estimate trends on a book of business rather than your own claim experience. We are trying to get health plans to use employers’ past data to estimate future trends. We want to make sure we are comparing apples to apples.” Consultants present all of this information to the employers and make recommendations on which plan(s) the employer should consider.

45
However, benefits consultants can be expensive and, therefore, are generally used by medium and large employers. Smaller employers are more likely to use insurance brokers. We did not interview small employers, so little is known about the quality and effectiveness of insurance brokers. Anecdotal evidence suggests that the quality and knowledge of brokers is unknown and variable.
Evaluation of Tools and Resources to Support Employer Decisionmaking
A number of employers reported using tools such as eValue8 or NCQA accreditation status. In fact, some employers require health plans to respond to the eValue8 survey before they can submit an RFP, or they will ask benefits consultants to consider such tools in their assessments. Such tools provide potentially important information to employers, such as the presence of quality-enhancing products (wellness or care management programs), consumer engagement tools, and the equality of the network, at a level of detail that is often not available through benefits consultants. In fact, a representative from a national business coalition estimated that the information in a consultant’s standard RFP covers only 20 percent of what is available in eValue8. However, because plans generally placed relatively higher emphasis on cost versus quality and quality-enhancing products, these tools were generally considered supplemental material—if they were used at all. For example, one employer who did not believe in the importance of wellness programs stated that, “I understand what the eValue8 tool is, but we have not used it. It doesn’t make a lot of sense based on how we see health care, which is in terms of minimizing costs with less focus on wellness or other programs.” The employers we interviewed did not report using eValue8, Medicare Stars, or NCQA accreditation status independent of information provided by benefits consultants.
8.2 Decision Criteria for Health Plan Selection
Cost Is the Primary Driver
All interviewees reported that they primarily considered cost of coverage when choosing a health plan. One interviewee pointed out that she favored purchasing decisions based on quality, but frequently got overruled by senior managers who focus solely on cost: “I differ from some of my colleagues that purchase based on size of discount. I’d rather have care be managed rather than get a bigger discount. Quality plays out at a higher value, because that’s the right path to manage cost down the road.” The following metrics are used to assess health plan cost:
1. Provider discounts: The degree to which plans could negotiate discounts from the main providers in an area turned out to be the first and foremost metric for cost. One employer stated candidly that “even a 1-percent bigger discount is huge; that adds up in the long run.”
2. Administrative cost: Employers emphasized the importance of minimizing the administrative cost of health plans (i.e., for marketing), as reflected in the medical loss
46
ratio. In the words of one interviewee, “How much [premium] are we going to pay [to the insurance company] that doesn’t go to health care [expenses]?”
3. Performance guarantees: Many employers ask health plans to provide performance guarantees to avoid health plans from providing low initial prices to “bait-and-switch” to higher prices in subsequent years. One employer stated, “We say to health plans, ‘Put money where your mouth is, give us guarantees that with your programs, after year 1, the trend will be X percent.’”
Employers Aim to Ensure Network Adequacy
Second only to costs, employers consider network adequacy when choosing health plans. A number of employer representatives noted that they are constantly balancing network breadth with costs, as plans are trying to reduce costs by narrowing physician and hospital networks. There is always some degree of imperfection in networks; a certain proportion of employees will not be able to access their primary care doctor or specialist in the network due to contracting or other issues (e.g., retirement). Employers, especially national employers, are very concerned about network sufficiency for their employees. In particular, national employers, with an employee population dispersed throughout the country, are especially sensitive to network size and aim to ensure that their employees, especially those in remote locations, have adequate access. One national employer stated, “Our philosophy is not to provide a narrow network. A lot of our employees live in remote areas, such as New Hampshire, so network access is important to employees.”
Though employers cited expansive provider networks as an important consideration when selecting health plans, the approach to determining network adequacy varied greatly. Two large employers, with an employee population dispersed across the country, stated they requested GeoAccess reports, which analyze network size and provider accessibility. For example, one benefits manager at a large national employer shared that, “[the reports] show the number of primary care physicians within a certain distance and we know that plans that dominate the local market will have more doctors.” Other employers assessed network in a largely ad hoc manner. At one employer, the benefits manager asks employees to confirm that their specific physician is still in the network, if their plans announced network changes. This employer downplayed the importance of metrics: “I don’t care how many primary care docs per 1,000 there are, if the network doesn’t include one of my employees’ doctors.” This interviewee merely assumed that large national carriers contract with most of the key providers.
General Reputation of Plans Influences Purchasing Decisions.
General reputation arose as another important criterion when choosing a health plan, as it serves as heuristic for quality and matters for employee satisfaction, even though lower-cost or higher-quality options may be available from a less well-known health plan. One employer representative stated, “Nobody wants to carry around a card of a company they have never heard

47
of.” However, employers had a difficult time expressing how they define “reputation.” One employer stated that “because there are only so few players, you kind of know their reputation.”
Quality of a Health Plan Is Rarely Factored Explicitly into Decisions
Our review suggests that employers rarely based health plan decisions on a comprehensive review of quality. One reason is that they find it difficult to understand the more technical domains of quality, such as adherence to evidence-based processes and health outcomes, and to decide how to trade off performance along those domains with performance along more salient and accessible domains, such as member experience, network adequacy, and cost. More importantly, employers believe that there is no meaningful variation in quality across plans, especially when the networks are largely overlapping. The employers largely believed that “quality” was determined by the providers, rather than the health plan, meaning that if the network was the same then quality should be the same. One employer coalition representative, who worked in a market with two dominant payers who both had very broad networks, stated that, “Employers in this market never really look at HEDIS scores. In reality, there are only two payers and they essentially have every provider in their network. So, the quality is likely pretty similar.” The same holds true of employers who were selecting national carriers. A representative from a large employer stated, “All of the carriers we deal with have quality hospitals in their system. Our plan may even have too many. Anyone we use is going to have similar quality due to the fact they include so many hospitals in the network.”
Quality-Enhancing Products and Services Are Considered Low Priority
We learned that quality-enhancing products and services typically do not play an important role in employers’ selection of health plans. Although some employer representatives stated that they saw value in these services, such as workplace wellness and disease management, none of the employers we interviewed cited these programs as a major decision criterion. One reason is that they do not believe that health plans are differentiated by the quality of their workplace wellness and disease management programs. One employer representative noted, “All [health plans] have wellness programs, but we did not go with them for that reason. They all have disease management programs too. . . . We chose them because they give you a product at a low price.” Another reason is that employers can also develop such programs themselves or procure them through a third-party vendor, rather than from their health plan.

48
9. Conclusions
We used an environmental scan, which consisted of a review of scientific and trade literature and health insurance companies’ websites; expert panels; and case studies to evaluate the current availability of quality measures and decision tools that can inform employers’ choices of health plans and today’s actual practice of plan selection. We find that our understanding of what differentiates health plans structurally and how we measure their performance has improved and that tools and resources to help employers use such information are emerging. In theory, this evolution put employers into a position to select health plans based on quality, but in practice employers are not basing decisions on health plans on those sources of information.
9.1 Current State of Measurement Science
Much progress has been made on measuring care processes—i.e., how well care is aligned with current standards of practice. Measures in national use, such as the HEDIS set maintained by NCQA, are being developed based on rigorous standards and can be assumed to be scientifically sound and relevant. Despite a large number of existing process measures, gaps remain for selected conditions and most importantly for overuse of care: Measures development has historically focused on care gaps (i.e., underuse of medically appropriate care), while measures for overuse (i.e., use of medically unnecessary care) have only recently been proposed.
An important recent focus for developers is outcomes measures, based on the realization that outcomes, such as health status, disease control, member experience, and financial sustainability, are ultimately what stakeholders care about (Boyce, 1996; Smith, Mossalios and Papanicolas, 2008; Porter, 2010). A robust set of measures for health outcomes has been introduced to the field and additional measures are being developed. Under the leadership of AHRQ, the CAHPS instruments have emerged as the most commonly used measures for member experience. But an important remaining gap is an absence of measures for health plan efficiency, which would express what results a plan achieves relative to its resource use. The state of measurement science is too underdeveloped to suggest that scientifically sound efficiency measures will become available soon. Presently, health plans rely on discounts and premium to judge “efficiency.” However, understanding the “cost” that an employer pays is different than understanding the outcomes that have been achieved relative to the money spent.
9.2 Current State of Employer Decision Tools Regarding Quality of Care While our review shows that measurement science for most domains of quality has evolved
substantially, our interviews and published evidence suggest that employers do not factor quality measures into their decisions about health plans (Marshall et al., 2000; Fung et al., 2008;

49
Ketelaar et al., 2011). The main reason appears to be that employers find it difficult to interpret the complex and detailed information that is embedded in individual quality measures. For example, there are over 70 measures in the HEDIS set alone by which the quality of a provider might be evaluated. Digesting such granular and often technical information is challenging for employers, in particular when they have to make trade-offs (e.g., choose between a plan that performs very well on some measures but poorly on others and a plan with average performance on all measures). This observation is consistent with the literature on decisionmaking, which suggests that people can only interpret and integrate a limited number of pieces of information (Hibbard, Slovic and Jewett, 1997; Peters et al., 2007). In the presence of overwhelming complexity, people tend to rely on heuristics or rules of thumb, such as using the reputation of a health plan as proxy for quality (Tversky, Sattah and Slovic, 1988).
Several tools have emerged that integrate complex information on quality, and further development is ongoing in this area. Examples are standardized information requests with health plan scoring algorithms, accreditation by external organizations, and ratings systems that are communicated in a way that is understandable to the end user. While such tools can theoretically help employers make informed decisions on health plans, we did not find published evidence on actual use of these tools, and our interviews suggest that employers have not yet adopted them widely. Rather, they tend to rely on the advice of benefits consultants and, to a lesser degree, input obtained through employer coalitions.
9.3 Current State of Employer Decision Process for Quality of Care In practice, employers rely on the advice of the benefits consultants to select plans and base
their decisions mostly on cost considerations, the reputation of a plan, and their employees’ preference to have access to a broad provider network. While a small set of sophisticated employers may conduct a complex evaluation process that is based on multiple criteria, the typical employer, simply speaking, balances its own desire to control cost of coverage with its employees’ desire for provider choice—with limited regard for quality of care. This simple decision rule limits the degree to which employer decisions on health plans can influence quality of care. If most employers in a market demand access to a broad provider network, health plans will try to offer coverage products that exclude only few providers. Thus, there will be considerable overlap between the provider networks with which competing plans contract. The overlap in turn implies that the employer’s choice of a health plan becomes less consequential: Most care decisions and thus quality of care are determined by providers, and, if plans share most providers, quality and cost will converge and so will the value offered by different plans. In fact, a recent study by Maeng et al. showed that in the presence of a higher degree of provider network overlap, plan performance measures tend to converge to a lower level of quality (Maeng et al., 2010). The authors argued that provider-level performance measurement and provider selection would therefore be the more logical approach to achieve better quality.
50
Our findings are consistent with their conclusion. From our interviews, employers perceive that their employees would oppose restrictive networks and prefer access to a broad range of providers. This finding is supported by the experience with managed care in the 1990s, where access restrictions led to much discontent and ultimately contributed to the migration toward more-flexible plan designs. The market trend leaves two possible pathways through which health plan design and employer choices can lead to better value for money. The first would be closer integration between health plans and providers to improve quality and efficiency of care. Plans would contribute their ability to analyze data at the population level, benchmark providers, and track patients across different providers and collaborate with providers to lift the average quality and efficiency in a given market (Mattke 2013). An example for this approach is ACOs. The second path would be to steer plan participants and beneficiaries selectively to high-performing providers, with the expectation that market forces would push bottom performers out or make them improve. Examples of such designs are tiered networks, which designate certain providers as preferred, and centers of excellence designations, which identify preferred hospitals for complex procedures. This path requires the ability to score providers on performance dimensions like quality and efficiency, tools to communicate such technical information to plan participants and beneficiaries, and plan designs that encourage the selection of top-performing providers. For example, co-payments could be lower for preferred providers.
9.4 Implications for Research Agenda As we pointed out earlier in this report, the same performance measures can, in principle, be
applied at different levels of aggregation, from the national level to the level of individual providers. Thus, the gaps in measurement science that we identified, most notably in measuring overuse and efficiency, are as relevant for provider choice as they are for plan comparisons. Yet three methodological challenges make it more difficult to apply measures at the provider level:
• Sample size: In contrast to health insurers, who may have millions of members, individual providers care only for relatively small numbers of patients. To illustrate, the typical panel size for a PCP is about 2,300 patients (Alexander, Kurlander and Wynia, 2005). Even for common chronic conditions, an individual provider will have a small number of patients,14 which makes it difficult to calculate quality measures reliably (Hofer et al., 1999).
• Attribution: Quality measures provide a basis for assessing how individual health care providers are performing compared to a benchmark, other providers, or over time. However, the focus of the quality measure must be attributable to a provider. Many
14 As an example, the prevalence of heart failure is about 1 percent, implying that a typical PCP will care for about 20 patients with heart failure, which implies that an event in one patient changes a rate-based quality measure by 5 percentage points. Thus, random events can translate into substantial changes in measure rates and make measures unstable.
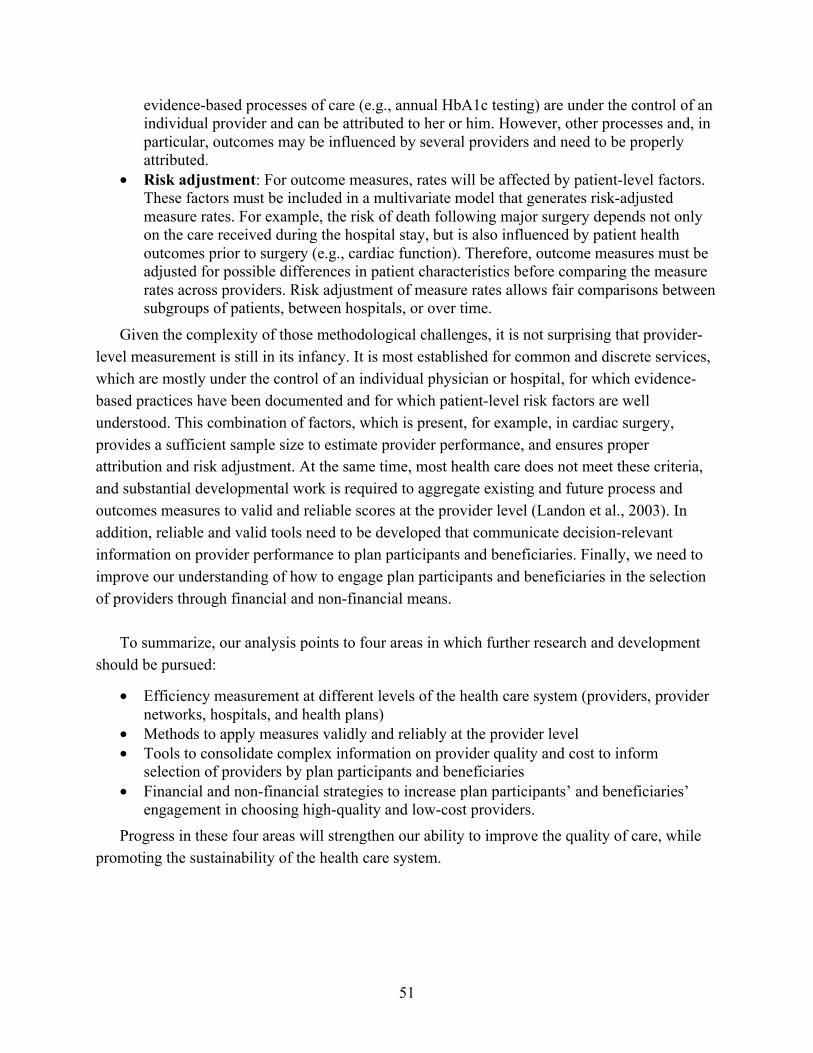
51
evidence-based processes of care (e.g., annual HbA1c testing) are under the control of an individual provider and can be attributed to her or him. However, other processes and, in particular, outcomes may be influenced by several providers and need to be properly attributed.
• Risk adjustment: For outcome measures, rates will be affected by patient-level factors. These factors must be included in a multivariate model that generates risk-adjusted measure rates. For example, the risk of death following major surgery depends not only on the care received during the hospital stay, but is also influenced by patient health outcomes prior to surgery (e.g., cardiac function). Therefore, outcome measures must be adjusted for possible differences in patient characteristics before comparing the measure rates across providers. Risk adjustment of measure rates allows fair comparisons between subgroups of patients, between hospitals, or over time.
Given the complexity of those methodological challenges, it is not surprising that provider-level measurement is still in its infancy. It is most established for common and discrete services, which are mostly under the control of an individual physician or hospital, for which evidence-based practices have been documented and for which patient-level risk factors are well understood. This combination of factors, which is present, for example, in cardiac surgery, provides a sufficient sample size to estimate provider performance, and ensures proper attribution and risk adjustment. At the same time, most health care does not meet these criteria, and substantial developmental work is required to aggregate existing and future process and outcomes measures to valid and reliable scores at the provider level (Landon et al., 2003). In addition, reliable and valid tools need to be developed that communicate decision-relevant information on provider performance to plan participants and beneficiaries. Finally, we need to improve our understanding of how to engage plan participants and beneficiaries in the selection of providers through financial and non-financial means.
To summarize, our analysis points to four areas in which further research and development
should be pursued:
• Efficiency measurement at different levels of the health care system (providers, provider networks, hospitals, and health plans)
• Methods to apply measures validly and reliably at the provider level • Tools to consolidate complex information on provider quality and cost to inform
selection of providers by plan participants and beneficiaries • Financial and non-financial strategies to increase plan participants’ and beneficiaries’
engagement in choosing high-quality and low-cost providers. Progress in these four areas will strengthen our ability to improve the quality of care, while
promoting the sustainability of the health care system.

52
Appendix A: Description of Summary of Benefits and Coverage and Glossary of Terms
Under the Patient Protection and Affordable Care Act, group health plans and health insurers are required to provide certain disclosures to health plan participants about their health plan benefits and coverage. Specifically, the regulations guarantee health plans provide patients access to two resources to improve their understanding of health coverage and benefits: a summary of benefits and a uniform glossary of terms commonly used in health coverage.
The Summary of Benefits and Coverage describes key features of the plan or coverage, such as covered benefits, cost-sharing provisions, and coverage limitations using clear and concise language in an understandable format (Table A.1). It will also include a health comparison tool with “coverage examples” demonstrating how much financial protection a patient might get for common benefits scenarios (Table A.2). Health plans also be required to make the Uniform Glossary of Terms available to all plan participants. The glossary lists words commonly used when discussing health insurance coverage, like “co-insurance” and “deductible” and provides a basic illustration of examples of cost-sharing arrangements. (Centers for Medicare and Medicaid Services).
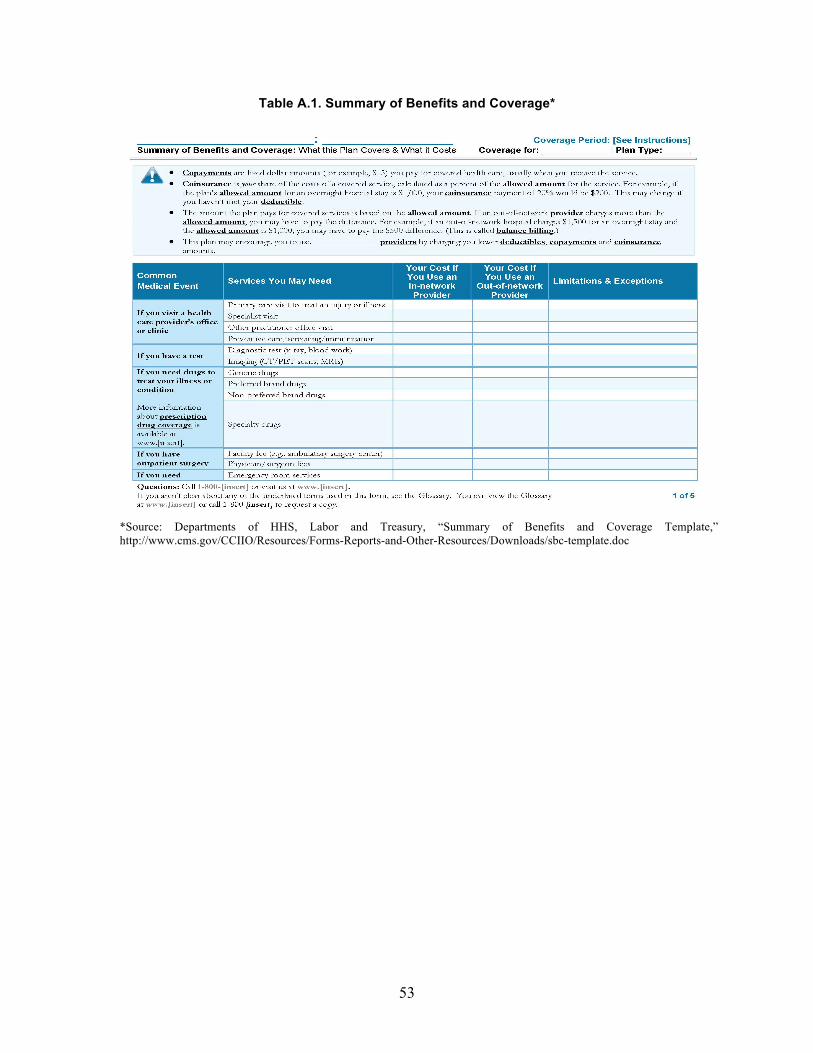
53
Table A.1. Summary of Benefits and Coverage*
*Source: Departments of HHS, Labor and Treasury, “Summary of Benefits and Coverage Template,” http://www.cms.gov/CCIIO/Resources/Forms-Reports-and-Other-Resources/Downloads/sbc-template.doc

54
Table A.2. Coverage Examples*
Source: Departments of HHS, Labor and Treasury, “Summary of Benefits and Coverage Template,” http://www.cms.gov/CCIIO/Resources/Forms-Reports-and-Other-Resources/Downloads/sbc-template.doc

55
Appendix B: Description of Search Strategies and Tools
Academic and Trade Literature Databases
• Peer-reviewed literature review
− PubMed, Academic Search Elite, EconLit, Cochrane database − Search supplemented with the search platform EBSCOhost − Ad hoc search on specific topics on Google Scholar
• Trade and grey literature review
− Business Source Premier − The New York Academy of Medicine Library Online Catalog-Grey Literature Report − Google (several consultancy reports such as PwC, Buck Consultants, Deloitte, etc.) − Search supplemented with the search platform ProQuest
Targeted Website Search
• Purchaser/employer organizations
− America's Health Insurance Plans, National Business Group on Heath (NBGH), National Business Coalition on Health (NBCH), eValue8 (part of NGCH), National Healthcare Purchasing Institute, Leapfrog Group, the National Health Leadership Council, FAIR Health Access, Pacific Business Group on Health (PBGH)
• Third-party wellness groups
− IncentOne, StayWell
• Market research/Consulting firms
− Towers Watson, Towers Perrin, AonHewitt, Mercer
• Foundations
− Kaiser Family Foundation, Commonwealth Fund, Robert Wood Johnson Foundation
• Government agencies
− Agency for Healthcare Research and Quality (AHRQ), Government Accountability Office, Centers for Disease Control (CDC)- Healthier Worksite Initiative, Centers for Medicare & Medicaid Services (CMS), Federal Employee Health Benefits, State governments (e.g., California)
• Academia/research institutes
− Center for Value Based Insurance Design–University of Michigan, Harvard School of Public Health–Research highlights
− RAND online Catalog System (RAND publications)
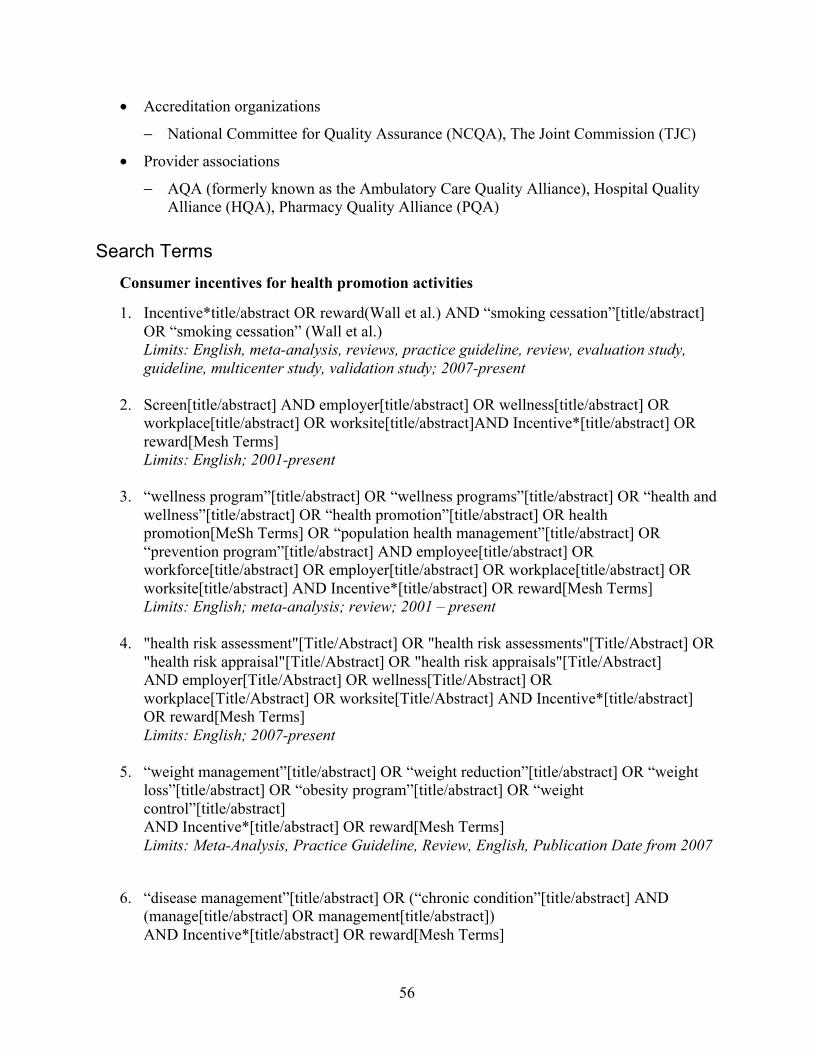
56
• Accreditation organizations
− National Committee for Quality Assurance (NCQA), The Joint Commission (TJC)
• Provider associations
− AQA (formerly known as the Ambulatory Care Quality Alliance), Hospital Quality Alliance (HQA), Pharmacy Quality Alliance (PQA)
Search Terms Consumer incentives for health promotion activities
1. Incentive*title/abstract OR reward(Wall et al.) AND “smoking cessation”[title/abstract] OR “smoking cessation” (Wall et al.) Limits: English, meta-analysis, reviews, practice guideline, review, evaluation study, guideline, multicenter study, validation study; 2007-present
2. Screen[title/abstract] AND employer[title/abstract] OR wellness[title/abstract] OR workplace[title/abstract] OR worksite[title/abstract]AND Incentive*[title/abstract] OR reward[Mesh Terms] Limits: English; 2001-present
3. “wellness program”[title/abstract] OR “wellness programs”[title/abstract] OR “health and wellness”[title/abstract] OR “health promotion”[title/abstract] OR health promotion[MeSh Terms] OR “population health management”[title/abstract] OR “prevention program”[title/abstract] AND employee[title/abstract] OR workforce[title/abstract] OR employer[title/abstract] OR workplace[title/abstract] OR worksite[title/abstract] AND Incentive*[title/abstract] OR reward[Mesh Terms] Limits: English; meta-analysis; review; 2001 – present
4. "health risk assessment"[Title/Abstract] OR "health risk assessments"[Title/Abstract] OR "health risk appraisal"[Title/Abstract] OR "health risk appraisals"[Title/Abstract] AND employer[Title/Abstract] OR wellness[Title/Abstract] OR workplace[Title/Abstract] OR worksite[Title/Abstract] AND Incentive*[title/abstract] OR reward[Mesh Terms] Limits: English; 2007-present
5. “weight management”[title/abstract] OR “weight reduction”[title/abstract] OR “weight loss”[title/abstract] OR “obesity program”[title/abstract] OR “weight control”[title/abstract] AND Incentive*[title/abstract] OR reward[Mesh Terms] Limits: Meta-Analysis, Practice Guideline, Review, English, Publication Date from 2007
6. “disease management”[title/abstract] OR (“chronic condition”[title/abstract] AND (manage[title/abstract] OR management[title/abstract]) AND Incentive*[title/abstract] OR reward[Mesh Terms]
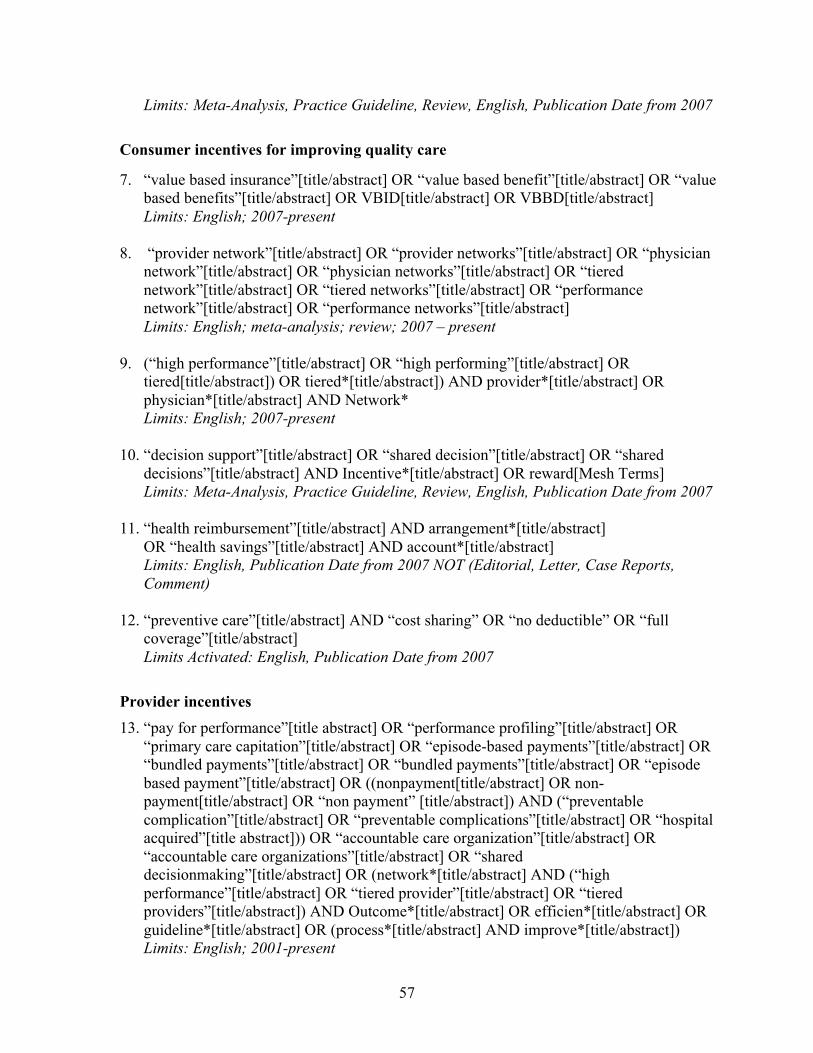
57
Limits: Meta-Analysis, Practice Guideline, Review, English, Publication Date from 2007 Consumer incentives for improving quality care
7. “value based insurance”[title/abstract] OR “value based benefit”[title/abstract] OR “value based benefits”[title/abstract] OR VBID[title/abstract] OR VBBD[title/abstract] Limits: English; 2007-present
8. “provider network”[title/abstract] OR “provider networks”[title/abstract] OR “physician network”[title/abstract] OR “physician networks”[title/abstract] OR “tiered network”[title/abstract] OR “tiered networks”[title/abstract] OR “performance network”[title/abstract] OR “performance networks”[title/abstract] Limits: English; meta-analysis; review; 2007 – present
9. (“high performance”[title/abstract] OR “high performing”[title/abstract] OR tiered[title/abstract]) OR tiered*[title/abstract]) AND provider*[title/abstract] OR physician*[title/abstract] AND Network* Limits: English; 2007-present
10. “decision support”[title/abstract] OR “shared decision”[title/abstract] OR “shared decisions”[title/abstract] AND Incentive*[title/abstract] OR reward[Mesh Terms] Limits: Meta-Analysis, Practice Guideline, Review, English, Publication Date from 2007
11. “health reimbursement”[title/abstract] AND arrangement*[title/abstract] OR “health savings”[title/abstract] AND account*[title/abstract] Limits: English, Publication Date from 2007 NOT (Editorial, Letter, Case Reports, Comment)
12. “preventive care”[title/abstract] AND “cost sharing” OR “no deductible” OR “full coverage”[title/abstract] Limits Activated: English, Publication Date from 2007
Provider incentives 13. “pay for performance”[title abstract] OR “performance profiling”[title/abstract] OR
“primary care capitation”[title/abstract] OR “episode-based payments”[title/abstract] OR “bundled payments”[title/abstract] OR “bundled payments”[title/abstract] OR “episode based payment”[title/abstract] OR ((nonpayment[title/abstract] OR non-payment[title/abstract] OR “non payment” [title/abstract]) AND (“preventable complication”[title/abstract] OR “preventable complications”[title/abstract] OR “hospital acquired”[title abstract])) OR “accountable care organization”[title/abstract] OR “accountable care organizations”[title/abstract] OR “shared decisionmaking”[title/abstract] OR (network*[title/abstract] AND (“high performance”[title/abstract] OR “tiered provider”[title/abstract] OR “tiered providers”[title/abstract]) AND Outcome*[title/abstract] OR efficien*[title/abstract] OR guideline*[title/abstract] OR (process*[title/abstract] AND improve*[title/abstract]) Limits: English; 2001-present

58
Appendix C: Descriptions of Quality Measurement and Reporting Organizations
Provider Associations
The AQA (formerly known as the Ambulatory Care Quality Alliance) is a conglomerate of over 100 organizations, including physicians, clinicians, consumers, purchasers, health insurance plans, and agencies such as AHRQ. The alliance aims to implement performance measurement, collect data, and report information to consumers and stakeholders (Ambulatory Care Quality Alliance, 2010). The AQA has selected a starter set of 26 clinical performance measures for priority ambulatory care conditions that were developed by either the NCQA or AMA-PCPI (Agency for Healthcare Research and Quality, 2005). All of the measures included in the set have been endorsed by the NQF.
The Hospital Quality Alliance (HQA) is a coalition of public and private consumer representatives, provider organizations, employers, payers, governing organizations, and federal agencies (QualityNet, HQA Program Overview, 2012). With the goal of providing accessible hospital performance information to the public, the HQA has adopted inpatient and outpatient measures, which have been endorsed by the NQF (Hospital Quality Alliance, 2011). The HQA has adopted 107 inpatient quality measures and 24 outpatient quality measures developed by various entities, such as CMS, TJC, and various health systems and partnerships (HQA, HQA Approved Inpatient Measures, 2011; HQA, HQA Approved Outpatient Measures, 2011). These measures cover domains including quality, patient experience, efficiency, and cost information. One hundred of the 107 inpatient quality measures and all 24 outpatient quality measures have been endorsed by the NQF.
The Pharmacy Quality Alliance (PQA) works to improve patient health through the development and implementation of performance measures as well as the recognition of exceptional performance of pharmacies (Pharmacy Quality Alliance, 2012). The PQA currently maintains 25 approved measures, which assess aspects of pharmacy operations and medication use in patients. The measures provide insight on gaps in medication use, use of medication therapy for treatment and management of disease, and potentially inappropriate use of medications in specific populations (Pharmacy Quality Alliance, PQA Approved Measures, 2012). Ten of the 25 measures have been endorsed by the NQF.
Purchaser/Employer Organizations The Leapfrog Group was started in 1998 as a conglomerate of employers seeking to
influence the quality and affordability of health care. The Leapfrog Group provides information
59
on health safety, quality, and value to employers and purchasers while also rewarding hospitals that meet quality standards (The Leapfrog Group, About Us, 2011). The Leapfrog Hospital Survey was launched in 2001 to assess hospital performance based on four NQF-endorsed areas of quality and safety, which include the following: computerized physician order entry, intensive care unit physician staffing, evidence-based hospital referral for certain high-risk procedures, and safe practices. In 2011, the Leapfrog Hospital Survey assessed computerized physician order entry use; evidence-based hospital referral, which includes measures for coronary artery bypass graft, percutaneous coronary intervention, aortic valve replacement, abdominal aortic aneurysm repair, pancreatic resection, esophagectomy, bariatric surgery, and high-risk deliveries; common acute conditions, including AMI, pneumonia, and normal deliveries; intensive care unit physician staffing; the Leapfrog safe practices score, which contains 17 of the 31 NQF-endorsed safe practices; managing serious errors; smooth patient scheduling; and patient experience of care (The Leapfrog Group, The Leapfrog Hospital Survey, 2011). In addition to questions about performance in these areas, the survey contains 22 process and outcome quality measures, 19 of which are NQF-endorsed. Hospitals also report on three of the ten composite scores from the H-CAHPS survey, including pain management, communication about medication, and discharging patients.
The National Business Coalition on Health (NBCH) was formed in 1992 and is a purchaser-led coalition consisting of 54 member coalitions made up of employers. The coalition seeks to promote value-based purchasing and improve safety, efficiency, and quality of health care. As a coalition, the NBCH engages stakeholders, identifies best practices in purchasing, and provides resources to the coalitions through the use of six programs: the NBCH eValue8 RFI, Bridges to Excellence, Leapfrog Hospital Rewards Program, Community Health Partnerships, the NBCH Opportunity Knocks Program, and the NBCH Preferred PBMs program (National Business Coalition on Health, 2009).
The Pacific Business Group on Health (PBGH) was founded in 1989 and is comprised of 50 large purchasers in California who work to improve quality and affordability of health care (Pacific Business Group on Health, 2011). PBGH works with purchasers to assess consumer evaluation of health programs in addition to employing key strategies, which include engaging customers, ensuring providers are rewarded for performance, redesigning care delivery, and advancing value-based government policy. PBGH engages consumers by requesting health care experience information through a patient assessment survey that reports experience at the medical-group level. These data are publicly reported to aid consumers in choosing providers. The California Physician Performance Initiative, which aids consumers in selecting their providers by reporting on provider use of evidence-based practice and performance, is a program that is endorsed by the PGBH as a way to engage consumers. A final initiative, the Health Plan Chooser, provides information about a health plan to consumers, including cost information, doctors covered by the plan, services, and special coverage available through the plan (PBGH, 2011).

60
Government Agencies Under the Patient Protection and Affordable Care Act of 2010, CMS is required to create a
voluntary program for ACOs (Shortell, Casalino, and Fisher, 2010). ACOs are comprised of doctors, hospitals, and other health care providers who voluntarily work together to provide coordinated and quality care to a defined group of Medicare patients. The goal of these organizations is to improve the quality of care received by Medicare patients while also increasing the efficiency of health care spending. Each ACO will be required to submit data on cost and quality, on which the ACO will be assessed. CMS offers an opportunity to designated ACOs to share in these savings if they achieve certain levels of success. ACOs are responsible for reporting on 33 quality performance measures, 31 of which are endorsed by NQF. These measures require the submission of survey, claims, and incentive program reporting data.
The Hospital Inpatient Quality Reporting (IQR) program, formerly the Reporting Hospital Quality Data for Annual Payment Update (RHQDAPU) program, was mandated under the Medicare Prescription Drug Improvement and Modernization Act of 2003 (Public Law 108-173). The IQR program collects performance data from hospitals on a set of hospital inpatient measures of clinical quality (both process of care and outcomes) and patient experience with care. The Hospital IQR program requires hospitals to submit data relevant to health conditions that typically result in hospitalization among Medicare patients (Centers for Medicare and Medicaid Services, 2010). In 2011, hospitals reported on 46 measures required for the program: 42 clinical measures (27 chart-abstracted measures and 15 claims-based measures), one survey measure (patient experience from H-CAHPS), and three structural measures (Centers for Medicare and Medicaid Services, Handbook II, 2011).
The results for a subset of the performance measures are publicly reported for participating hospitals on the CMS Hospital Compare website, an interactive Web-based tool for patients to use in selecting a hospital. The Hospital Compare website was designed to provide information on hospital performance to consumers. The website provides recommended care for adults with selected conditions, such as heart failure or pneumonia, while providing an account of how well hospitals provide this recommended care. Hospital Compare uses the results from the H-CAHPS survey, readmission and mortality measures, and Hospital Outpatient Medical Imaging measures to report performance.
The Hospital Outpatient Quality Reporting (OQR) program was developed out of the Tax Relief and Healthcare Act of 2006 (QualityNet, Hospital OQR Overview). The Hospital OQR program is unlike the IQR in that it does not incentivize hospitals for reporting; rather it allows them to receive their full annual update (QualityNet, Hospital OQR Overview). The programs are similar, however, in that they both penalize non-participating hospitals with a reduction in their annual payment update. Effective April 2008, hospitals were required to submit performance data on a set of seven measures related to care provided in the hospital outpatient setting to receive their full annual update in calendar year 2009 (Centers for Medicare and

61
Medicaid Services, Hospital Outpatient Quality Reporting Program, 2011). Those hospital outpatient departments that do not participate in the program receive a reduction of 2 percentage points in their annual payment update factor. The information obtained from the Hospital OQR is reported to consumers through the Hospital Compare website produced by CMS. In 2011, the reporting program was comprised of 23 measures: 14 clinical performance measures, seven Medicare fee-for-service claims-based measures, and two structural measures (QualityNet, Measures: Hospital Outpatient Reporting Program).
The Physician Quality Reporting System, formerly the Physician Quality Reporting Initiative, was formed as a result of the Tax Relief and Healthcare Act of 2006 (Public Law 109-432, December 20, 2006), which required Congress to establish a physician quality reporting program (Centers for Medicare and Medicaid Services, Overview: Physician Quality Reporting System, 2012). The Physician Quality Reporting Initiative was established in 2007 as a voluntary program for physicians, practitioners, and therapists to report data on quality measures. The Medicare Improvements for Patients and Providers Act of 2008 (MIPPA) (Public Law 110-275, July 15, 2008) made the program for physician quality reporting permanent and authorized the extension of the incentive payments through 2010 and increased the payment for 2009 and 2010. The Patient Protection and Affordable Care Act (Public Law 111-148, March 23, 2010) extends the incentive payments through 2014 for professionals who report under the Physician Quality Reporting System, but requires a penalty for professionals who do not report starting in 2015. Those who satisfy the reporting requirements during calendar year 2011 will receive an “incentive payment” equal to 1 percent of their total allowed charges for covered Medicare Physician Fee Schedule services during the reporting period (CMS, Overview: PQRS, 2012). It also provides for an additional incentive payment related to qualifying for or maintaining board certification. In the 2012 Physician Quality Reporting measure set, 315 measures are organized into 22 measure groups corresponding to clinical specialty areas. The 14 measure groups are as follows: Diabetes Mellitus, Chronic Kidney Disease (CKD), Preventive Care, Coronary Artery Bypass Graft (CABG), Rheumatoid Arthritis (RA), Perioperative Care, Back Pain, Hepatitis C, Heart Failure (HF), Coronary Artery Disease (CAD), Ischemic Vascular Disease (IVD), HIV/AIDS, Community-Acquired Pneumonia (CAP), Asthma, Chronic Obstructive Pulmonary Disease (COPD), Inflammatory Bowel Disease (IBD), Sleep Apnea, dementia, Parkinson’s Disease, Hypertension, Cardiovascular Prevention, and Cataracts (Centers for Medicare and Medicaid Services, PQRS Measure List 2011).
The programs of Federal Employee Health Benefits are overseen by the Office of Personnel Management, which provides information on health plan quality to consumers, including a listing of accredited plans, NCQA report cards for the plans, and HEDIS results. The Office of Personnel Management also provides a link to a publication developed by AHRQ entitled “Your Guide to Choosing Quality Health Care.” This publication provides information to consumers to aid in their choice of health plans, providers, treatments, hospitals, and long-term care.

62
Like the federal health benefits page hosted by the Office of Personnel Management, some state governments provide information about health care benefits to their employees. The state of California provides an example of extensive information available to state employees about their health plan choices. California provides information via the CalPERS website, which features PBGH’s Health Plan chooser. This health plan chooser aids consumers in selecting a plan based on estimated costs, in-network providers, performance rating, and features and services covered. This user-friendly site provides the opportunity for consumers to make informed decisions in choosing a plan while equipping them with the knowledge of direct and indirect costs associated with care received.
Accreditation Organizations The National Committee for Quality Assurance (NCQA) is an organization that seeks to
improve health care quality through the development and implementation of performance measurement tools, as well as establish achievement and accreditation programs (National Committee for Quality Assurance, About NCQA, 2011). The Healthcare Effectiveness Data and Information Set (HEDIS) is a collection of 76 measures of performance in care and service developed by NCQA. HEDIS includes the CAHPS survey to measure member satisfaction with care in addition to measures that use administrative data to measure performance in the following domains: effectiveness of care, access to and availability of care, utilization and relative resource use, and health plan descriptive information (NCQA, HEDIS & Quality Measurement, 2011). Many of the HEDIS measures have been endorsed by the NQF.
The Joint Commission (TJC) is an independent organization that provides accreditation and certification to health care organizations in recognition of exceptional quality. In an effort to further improve quality, TJC has developed 11 core measure sets consisting of 77 quality measures that address care provided in the hospital inpatient and outpatient settings. The core sets address specific conditions, populations, and services, including AMI, children’s asthma care, heart failure, hospital-based inpatient psychiatric services, hospital outpatient department measures, immunization, perinatal care, pneumonia, stroke, surgical care, and venous thromboembolism (Centers for Medicare and Medicaid Services and The Joint Commission, 2011). TJC worked jointly with CMS to develop measures for AMI and heart failure, which are common to both organizations (CMS and TJC, 2011). Fifty-six of the 77 core measures have been endorsed by the NQF.
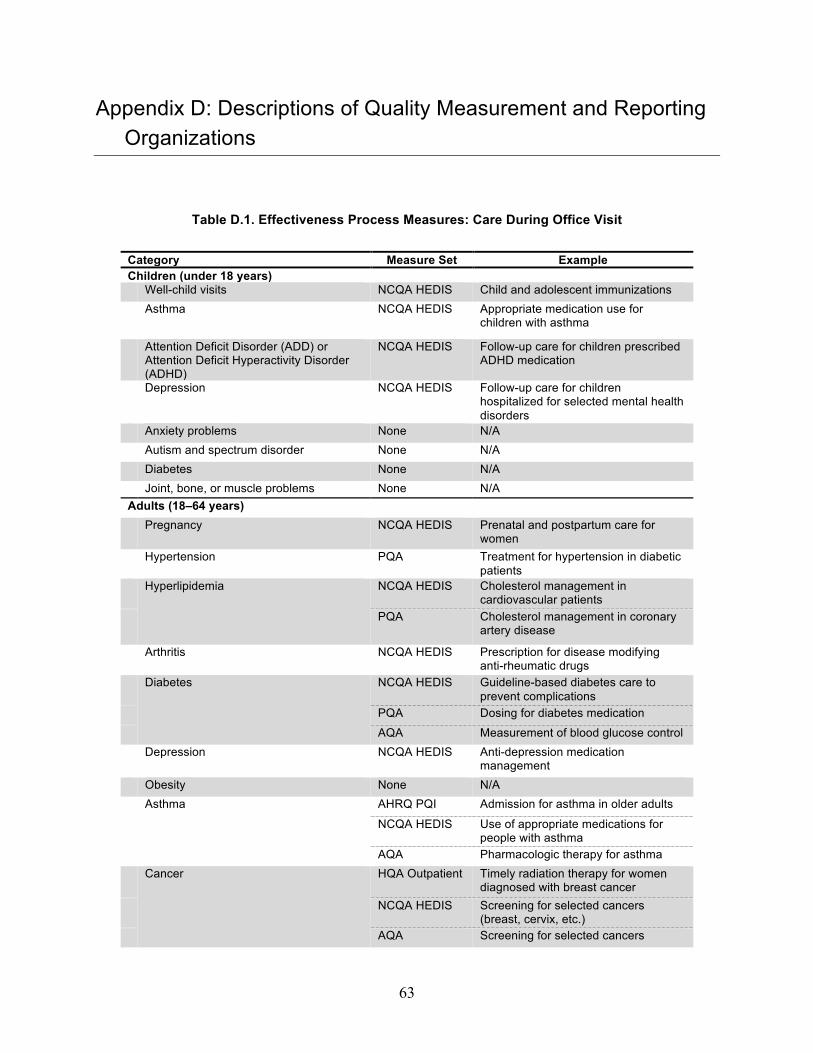
63
Appendix D: Descriptions of Quality Measurement and Reporting Organizations
Table D.1. Effectiveness Process Measures: Care During Office Visit
Category Measure Set Example Children (under 18 years) Well-child visits NCQA HEDIS Child and adolescent immunizations Asthma NCQA HEDIS Appropriate medication use for
children with asthma
Attention Deficit Disorder (ADD) or Attention Deficit Hyperactivity Disorder (ADHD)
NCQA HEDIS Follow-up care for children prescribed ADHD medication
Depression NCQA HEDIS Follow-up care for children hospitalized for selected mental health disorders
Anxiety problems None N/A Autism and spectrum disorder None N/A Diabetes None N/A Joint, bone, or muscle problems None N/A Adults (18–64 years) Pregnancy NCQA HEDIS Prenatal and postpartum care for
women Hypertension PQA Treatment for hypertension in diabetic
patients Hyperlipidemia NCQA HEDIS Cholesterol management in
cardiovascular patients PQA Cholesterol management in coronary
artery disease
Arthritis NCQA HEDIS Prescription for disease modifying anti-rheumatic drugs
Diabetes NCQA HEDIS Guideline-based diabetes care to prevent complications
PQA Dosing for diabetes medication
AQA Measurement of blood glucose control Depression NCQA HEDIS Anti-depression medication
management Obesity None N/A Asthma AHRQ PQI Admission for asthma in older adults
NCQA HEDIS Use of appropriate medications for people with asthma
AQA Pharmacologic therapy for asthma Cancer HQA Outpatient Timely radiation therapy for women
diagnosed with breast cancer NCQA HEDIS Screening for selected cancers
(breast, cervix, etc.) AQA Screening for selected cancers
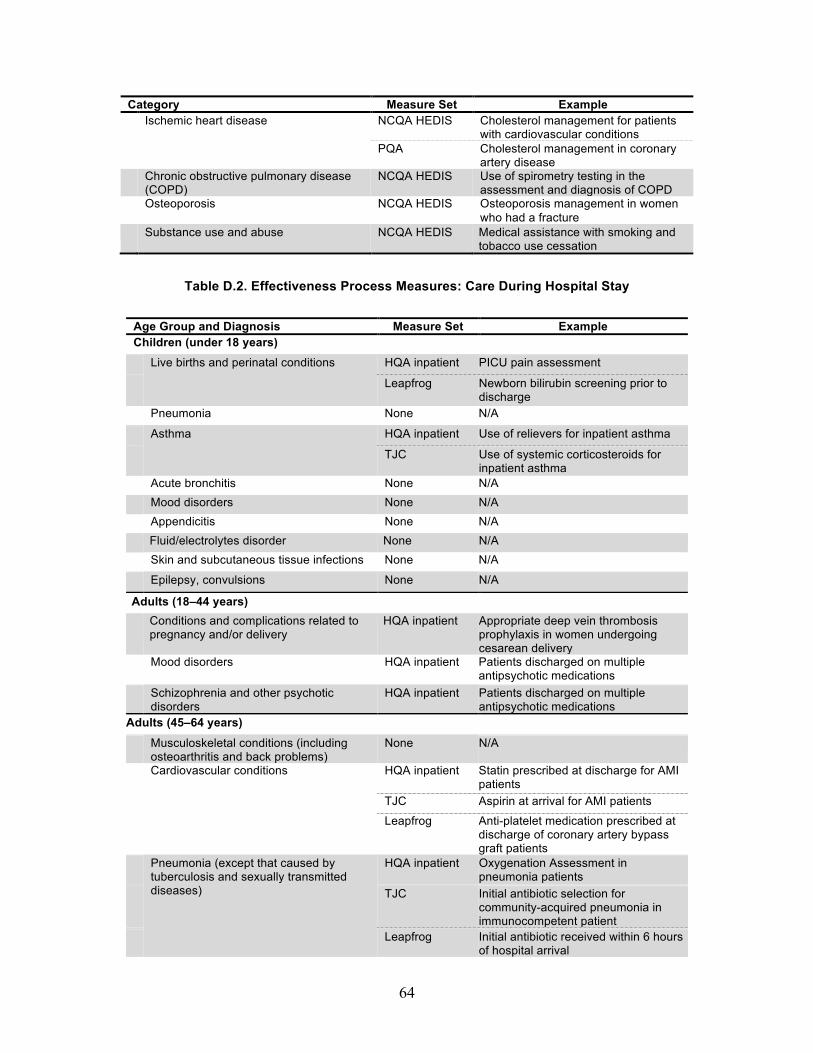
64
Category Measure Set Example Ischemic heart disease NCQA HEDIS Cholesterol management for patients
with cardiovascular conditions PQA Cholesterol management in coronary
artery disease Chronic obstructive pulmonary disease
(COPD) NCQA HEDIS Use of spirometry testing in the
assessment and diagnosis of COPD Osteoporosis NCQA HEDIS Osteoporosis management in women
who had a fracture Substance use and abuse NCQA HEDIS Medical assistance with smoking and
tobacco use cessation
Table D.2. Effectiveness Process Measures: Care During Hospital Stay
Age Group and Diagnosis Measure Set Example Children (under 18 years)
Live births and perinatal conditions HQA inpatient PICU pain assessment
Leapfrog Newborn bilirubin screening prior to discharge
Pneumonia None N/A
Asthma HQA inpatient Use of relievers for inpatient asthma
TJC Use of systemic corticosteroids for inpatient asthma
Acute bronchitis None N/A Mood disorders None N/A Appendicitis None N/A
Fluid/electrolytes disorder None N/A Skin and subcutaneous tissue infections None N/A
Epilepsy, convulsions None N/A
Adults (18–44 years) Conditions and complications related to
pregnancy and/or delivery HQA inpatient Appropriate deep vein thrombosis
prophylaxis in women undergoing cesarean delivery
Mood disorders HQA inpatient Patients discharged on multiple antipsychotic medications
Schizophrenia and other psychotic disorders
HQA inpatient Patients discharged on multiple antipsychotic medications
Adults (45–64 years) Musculoskeletal conditions (including
osteoarthritis and back problems) None N/A
Cardiovascular conditions HQA inpatient Statin prescribed at discharge for AMI patients
TJC Aspirin at arrival for AMI patients
Leapfrog Anti-platelet medication prescribed at discharge of coronary artery bypass graft patients
Pneumonia (except that caused by tuberculosis and sexually transmitted diseases)
HQA inpatient Oxygenation Assessment in pneumonia patients
TJC Initial antibiotic selection for community-acquired pneumonia in immunocompetent patient
Leapfrog Initial antibiotic received within 6 hours of hospital arrival

65
Age Group and Diagnosis Measure Set Example Mood disorders HQA inpatient Patients discharged on multiple
antipsychotic medications Complication of device, implant, or graft None N/A
COPD and bronchiectasis None N/A
Table D.3. NQF-Endorsed Measures of Overuse
Measure Measure Set Cardiac diagnostic tests Cardiac stress imaging not meeting appropriate use
criteria: Preoperative evaluation in low-risk surgery patients
American College of Cardiology Foundation
Cardiac stress imaging not meeting appropriate use criteria: Routine testing after percutaneous coronary intervention (PCI)
American College of Cardiology Foundation
Cardiac stress imaging not meeting appropriate use criteria: Testing in asymptomatic, low-risk patients
American College of Cardiology Foundation
Cardiac Imaging for Preoperative Risk-Assessment for Non-Cardiac Low-Risk Surgery
CMS
Diagnostic imaging use Inappropriate pulmonary CT imaging for patients at low
risk for pulmonary embolism Partners HealthCare System
Appropriate head CT imaging in adults with mild traumatic brain injury
Partners HealthCare System
MRI lumbar spine for lower back pain CMS Cancer care Prostate cancer: avoidance of overuse measure –
isotope bone scan for staging low-risk patients AMA-PCPI
Over utilization of imaging studies in stage 0-1A melanoma
AMA-PCPI
Obstetric care Cesarean section rate for low-risk first birth women California Maternal Quality Care
Collaboration Incidence of episiotomy Christiana Care Health System Elective delivery prior to 39 completed weeks gestation Hospital Corporation of America Back pain care Lower back pain: surgical timing NCQA Lower back pain: appropriate use of epidural steroid
injections NCQA
Lower back pain: repeat imaging studies NCQA Lower back pain: appropriate imaging for acute back
pain NCQA
Antibiotic use Avoidance of antibiotic treatment in adults with acute
bronchitis NCQA
Appropriate treatment for children with upper respiratory infection
NCQA
Emergency care Emergent care (risk-adjusted) CMS

66
Table D.4. Patient Experience Measures in the CAHPS and H-CAHPS Measure Sets
Health Plan (CAHPS) Clinician and Group (CG-CAHPS) Hospital Care (H-CAHPS)
Composite measures Composite measures Composite measures Getting needed care Getting timely appointments, care, and
information Nurse communication
Getting care quickly How well doctors communicate Doctor communication How well doctors communicate Health plan information and customer
service Explanation of medicines
Health plan information and customer service
Helpful courteous, and respectful office staff
Timely help from hospital staff
Overall ratings Individual items Information about recovery How people rated their health plan Follow-up on test results Pain control How people rated their health care Overall ratings Individual items How people rated their personal doctor How people rated their physician Cleanliness How people rated their specialist Quiet at night Overall ratings Patients' rating of hospital Would recommend hospital

67
References
Agency for Healthcare Research and Quality (2002). Evaluating the Impact of Value-Based Purchasing: A Guide for Purchasers. Rockville, MD. http://www.ahrq.gov/qual/valuebased/evalvbp1.htm
Agency for Healthcare Research and Quality (2008). Reporting Measures for the CAHPS Health Plan Survey 4.0.
Agency for Healthcare Research and Quality (2011). Items in the Reporting Measures for the CAHPS® Hospital Survey (H-CAHPS). As of March 11, 2012: https://www.cahps.ahrq.gov/Surveys-Guidance/Hospital/About-Hospital-Survey/Items-in-the-Reporting-Measures-for-the-CAHPS-Hospital-Survey.aspx
Alexander, G. C., J. Kurlander, et al. (2005). "Physicians in retainer (“Concierge”) practice." Journal of general internal medicine 20(12): 1079-1083.
American College of Physicians (2006). The Advanced Medical Home: A patient-Centered, Physician-Guided Model of Health Care. Philadelphia: American College of Physicians.
American Diabetes Association (2013). "Position Statement: Standards of Medical Care in Diabetes- 2013." Diabetes Care 36(Supplement 1): S11-S66.
American Medical Association (2013). "PCPI® and PCPI-Approved Quality Measures." As of September 12, 2013: http://www.ama-assn.org/ama/pub/physician-resources/physician-consortium-performance-improvement/pcpi-measures.page
Bailit Health Purchasing, and National Health Care Purchasing Institute (2002). "Ensuring Quality Health Plans: A Purchaser’s Toolkit for Using Incentives."
Berwick, D. M., and A. D. Hackbarth (2012). "Eliminating waste in US health care." JAMA 307(14): 1513-1516.
Birkmeyer, J. D., J. B. Dimick, et al. (2004). "Measuring the quality of surgical care: Structure, process, or outcomes?" Journal of the American College of Surgeons 198(4): 626-632.
Blue Cross Blue Shield of Massachusetts. "Alternative QUALITY Contract: Year One Results." As of September 13, 2013: http://www.nationalehealth.org/sites/default/files/6-2-11nehcunvblueaqc-results-white-paper.pdf
Blue Cross Blue Shield of Massachusetts Foundation (2009). Network Adequacy in the Commonwealth Care Program. As of September 12, 2013: http://bluecrossmafoundation.org/sites/default/files/090422NetworkStandardsFINAL.pdf
Boyce, N. (1996). "Using outcome data to measure quality in health care." International Journal for Quality in Health Care 8(2): 101-104.
Brook, R. H. (1995). "The RAND/UCLA appropriateness method." Buck Consultants (2008). "Working Well: A Global Survey of Health Promotion and Workplace
Wellness Strategies." Buntin, M. B., C. Damberg, et al. (2005). “Consumer-directed” health plans: Implications for
health care quality and cost. Santa Monica, Calif.: RAND Corporation for the California HealthCare Foundation. As of September 12, 2013: http://news.ehealthinsurance.com/pr/ehi/document/06_2005_RAND.pdf
68
Butcher, L. (2007). "Workers fail to exploit health savings accounts. HSAs offer an easy way to save money, have it grow, and not be taxed when it is withdrawn. Why don't more people take advantage of this?" Manag Care 16(10): 51-52.
Care Continuum Alliance (2013). "Population Health: Care Continuum Alliance (CCA) Definition of Disease Management." As of September 12, 2013: http://www.carecontinuumalliance.org/dm_definition.asp
Centers for Medicare and Medicaid Services (2006). "Press release: Eliminating serious, preventable, and costly medical errors – never events." As of March 6, 2012: http://www.cms.gov/apps/media/press/release.asp?Counter=1863
Centers for Medicare and Medicaid Services (2011). Medicare program; Medicare Shared Savings Program: Accountable Care Organizations. Final rule. As of September 12, 2013: http://www.ncbi.nlm.nih.gov/pubmed/22046633
Choosing Wisely Campaign (2013). "Homepage." ABIM Foundation. As of September 12, 2013: http://www.choosingwisely.org/
Davis, K., and S. Guterman (2007). "Rewarding excellence and efficiency in Medicare payments." Milbank Q 85(3): 449-468.
de Brantes, F., and J. A. Camillus (2007). Evidence-informed case rates: A new health care. The Commonwealth Fund.
Donabedian, A. (1966). "Evaluating the quality of medical care." The Milbank Memorial Fund quarterly 44(3): Suppl:166-206.
Draper, D. A., A. Tynan, et al. (2008). "Health and wellness: The shift from managing illness to promoting health." Issue Brief Cent Stud Health Syst Change(121): 1-4.
eValue8 Health Care (2009). "eValue8 for Health Plans." National Business Coalition on Health As of September 12, 2013: http://www.nbch.org/Evalue8-for-Health-Plans
eValue8 Health Care (2009). "Spend healthier with eValue8." As of September 12, 2013: http://www.nbch.org/EValue8-for-Employers
Evans, J. (2010). "The Current State of Bundled Payments." American Health & Drug Benefits 3(4).
Federal Register (2012a). Patient Protection and Affordable Care Act; Data Collection To Support Standards Related to Essential Health Benefits; Recognition of Entities for the Accreditation of Qualified Health Plans. Final Rule. As of September 12, 2013: https://www.federalregister.gov/articles/2012/07/20/2012-17831/patient-protection-and-affordable-care-act-data-collection-to-support-standards-related-to-essential
Federal Register (2012b). Patient Protection and Affordable Care Act; Establishment of Exchanges and Qualified Health Plans; Exchange Standards for Employers. Washington, D.C. Final Rule and Interim Final Rule. As of September 12, 2013: http://www.gpo.gov/fdsys/pkg/FR-2012-03-27/pdf/2012-6125.pdf
Federal Register (2012c). Public Health Service (PHS) Act, section 2707(b). Washington, D.C.: Final Rule. As of September 13, 2013: http://www.gpo.gov/fdsys/pkg/FR-2013-02-25/html/2013-04084.htm
Fisher, E. S., and S. M. Shortell (2010). "Accountable Care Organizations." JAMA: The Journal of the American Medical Association 304(15): 1715-1716.
69
Fung, C. H., Y. W. Lim, et al. (2008). "Systematic review: The evidence that publishing patient care performance data improves quality of care." Annals of internal medicine 148(2): 111-123.
Gabbay, R. A., M. H. Bailit, et al. (2011). "Multipayer patient-centered medical home implementation guided by the chronic care model." Jt Comm J Qual Patient Saf 37(6): 265-273.
Glickman, S. W., and E. D. Peterson (2009). "Innovative Health Reform Models: Pay-for-Performance Initiatives " The American Journal Of Managed Care 15(December): 300-305.
Guterman, S., K. Davis, et al. (2009). Reforming provider payment: Essential building block for health reform. Commonwealth Fund.
HCUPnet (March 2012). Healthcare Cost and Utilization Project. Rockville, MD: Agency for Healthcare Research and Quality. As of March 11, 2011: http://hcup-us.ahrq.gov/
Hibbard, J., and S. Sofaer (2010). Best practices in public reporting no. 1: How to effectively present health care performance data to consumers. Rockville, MD: Agency for Healthcare Research and Quality.
Hibbard, J. H., P. Slovic, et al. (1997). "Informing consumer decisions in health care: Implications from Decision-‐Making research." Milbank Quarterly 75(3): 395-414.
Hussey, P. S., M. S. Ridgely, et al. (2011). "The PROMETHEUS Bundled Payment Experiment: Slow Start Shows Problems In Implementing New Payment Models." Health Affairs 30(11): 2116-2124.
Institute of Medicine (2001). "Envisioning the National Healthcare Quality Report." Washington, DC: National Academy Press.
Institute of Medicine Committee on Quality of Health Care in America (2001). "Crossing the quality chasm: A new health system for the 21st century." Washington, D.C.: National Academies Press.
Jones, S., J. Caloyeras, et al. (2012). Power to the People: The Role of Consumer-Controlled Personal Health Management Systems in the Evolution of Employer-Based Health Care Benefits. Santa Monica, CA: RAND Corporation. As of September 12, 2013: http://www.rand.org/pubs/occasional_papers/OP352.html
Kaiser Family Foundation, and Health Research & Educational Trust (HRET) (2011). "Employer health benefits- 2011 Annual Survey."
Ketelaar, N., M. J. Faber, et al. (2011). "Public release of performance data in changing the behaviour of healthcare consumers, professionals or organisations." Cochrane Database Syst Rev 11.
Kohn, L. T., J. M. Corrigan, et al. (2000). "To err is human: Building a safer health system." National Academies Press.
Landon, B. E., S.-L. T. Normand, et al. (2003). "Physician clinical performance assessment." JAMA: the Journal of the American Medical Association 290(9): 1183-1189.
Levinson, D. R., and Inspector General (2010). Adverse events in hospitals: National incidence among Medicare beneficiaries: U.S. Department of Health & Human Services. As of January 3, 2013: http://oig.hhs.gov/oei/reports/oei-06-09-00090.pdf
Marshall, M. N., P. G. Shekelle, et al. (2000). "The public release of performance data." JAMA: the Journal of the American Medical Association 283(14): 1866-1874.
70
Maternal and Child Health Bureau of the Health Resources and Services Administration (2007). National Survey of Children's Health. As of September 12, 2013: http://www.cdc.gov/nchs/slaits/nsch.htm#2007nsch
Mathias, J. S., and D. W. Baker (2013). "Developing Quality Measures to Address Overuse." JAMA 309(18): 1897-1898.
Mattke, S., H. Liu, et al. (2013). "Workplace Wellness Programs Study." McClellan, M., A. N. McKethan, et al. (2010). "A National Strategy To Put Accountable Care
Into Practice." Health Affairs 29(5): 982-990. McGlynn, E. A. (2008). Identifying, Categorizing, and Evaluating Health care Efficiency
Measures (prepared by the Southern California Evidence-based Practice Center—RAND Corporation, under Contract No. 282-00-0005-21) Rockville, MD: Agency for Healthcare Research and Quality.
Mello, M. M., D. M. Studdert, et al. (2007). "Who pays for medical errors? An analysis of adverse event costs, the medical liability system, and incentives for patient safety improvement." Journal of Empirical Legal Studies 4(4): 835-860.
Mercer (2009). "National Survey of Employer-Sponsored Health Plans." Miller, H. D. (2009). "From Volume To Value: Better Ways To Pay For Health Care." Health
Affairs 28(5): 1418-1428. Minnesota Department of Commerce (2012). Background Paper on Network Adequacy and
Essential Community Providers. Prepared by Exchange Staff. As of September 12, 2013: http://mn.gov/commerce/insurance/images/ExchPlanBkgndPaper6-27-12.pdf
Moon, D. (2010). Assessing Network Adequacy in the Medicare Advantage Program: Presentation at National Health Policy Forum. As of September 12, 2013: http://www.nhpf.org/library/handouts/Moon.slides_02-26-10.pdf
National Association of Insurance Commissioners (2012). Plan Management Function: Network Adequacy White Paper. As of September 12, 2013: http://www.naic.org/documents/committees_b_related_wp_network_adequacy.pdf
National Center for Health Statistics (2008). National Ambulatory Medical Care Survey: 2008 Summary Tables. Centers for Disease Control and Prevention. As of December 7, 2011: http://www.cdc.gov/nchs/data/ahcd/namcs_summary/namcssum2008.pdf
National Quality Forum (2013). "Consensus Development Process." As of September 12, 2013: http://www.qualityforum.org/Measuring_Performance/Consensus_Development_ Process.aspx
NBGH (2010). "Large Employers’ 2011 Health Plan Design Changes." NCQA (2013). "Disease Management." As of September 12, 2013:
http://www.ncqa.org/Employers/DiseaseManagement.aspx NCQA. "HEDIS and Quality Measurement: HEDIS and Performance Measurement Homepage."
As of September 12, 2013: http://www.ncqa.org/HEDISQualityMeasurement.aspx
NCQA. "HEDIS Measure Development Process." As of September 12, 2013: http://www.ncqa.org/Portals/0/HEDISQM/Measure_evelopment.pdf
North Carolina Institute of Medicine, “Meeting of the Health Benefit Exchange Workgroup,” October 26, 2011. As of September 24, 2013:
http://www.nciom.org/wp-content/uploads/2011/07/HBE-summary_final_2011-10-26.pdf
71
Osilla, K. C., K. V. Busum, et al. (2012). "Systematic Review of the Impact of Worksite Wellness Programs." Am J Manag Care 18(2): e68-e81.
Peters, E., N. Dieckmann, et al. (2007). "Less is more in presenting quality information to consumers." Medical Care Research and Review 64(2): 169-190.
Porter, M. E. (2010). "What is value in health care?" New England Journal of Medicine 363(26): 2477-2481.
Public Law 108-173 (2003). Medicare Prescription Drug Improvement and Modernization Act of 2003.
RAND Corporation (2007). "Quality Indicators - ACOVE 3." As of September 12, 2013: http://www.rand.org/health/projects/acove/acove3.html
RAND Corporation (2000). "Quality of Care Assessment Tools (QA Tools)." As of September 12, 2013: http://www.rand.org/health/surveys_tools/qatools.html
Rosenthal, M. B. (2008). "Beyond Pay for Performance — Emerging Models of Provider-Payment Reform." New England Journal of Medicine 359(12): 1197-1200.
Silow-Caroll, S. and Alteras, T (2007). Value-Driven Health Care Purchasing: Four States that are Ahead of the Curve. Health Management Associates.
Smith, P. C., E. Mossalios, et al. (2008). "Performance measurement for health system improvement: Experiences, challenges, and prospects."
Tang, P. C., J. S. Ash, et al. (2006). "Personal Health Records: Definitions, Benefits, and Strategies for Overcoming Barriers to Adoption." Journal of the American Medical Informatics Association 13(2): 121-126.
The Darmouth Institute for Health Policy and Clinical Practice (2012). "The Dartmouth Atlas." Geisel School of Medicine at Dartmouth: http://www.dartmouthatlas.org/
Towers Watson, and NBGH (2011). "The Road Ahead- Shaping Health Care Strategy in a Post-Reform Environment."
Tversky, A., S. Sattah, et al. (1988). "Contingent weighting in judgeship and choice." Psychology Review 95: 371-384.
U.S. Department of Health and Human Services (2012). 2012 Annual Progress Report to Congress: National Strategy for Quality Improvement in Health Care. Washington, D.C. As of September 12, 2013: http://www.ahrq.gov/workingforquality/nqs/nqs2012annlrpt.pdf
URAC (2012). Health Plan 7.0 & Health Insurance Exchange Version 7.1, Measures Version 1.3. Presentation. As of September 12, 2013: https://www.urac.org/healthplan/wp-content/uploads/HP_HIX_Measures_At_A_Glance_v1-3_06012012FINAL.pdf
URAC (2013). "URAC's Disease Management Accreditation." As of September 12, 2013: https://www.urac.org/programs/prog_accred_dm_po.aspx
URAC (undated). "What is Care Management?" As of March 3, 2012: https://www.urac.org/resources/caremanagement.aspx
Volpp, K. G., D. A. Asch, et al. (2011). "Redesigning Employee Health Incentives — Lessons from Behavioral Economics." New England Journal of Medicine 365(5): 388-390.
Volpp, K. G., M. V. Pauly, et al. (2009). "P4P4P: An agenda for research on pay-for-performance for patients." Health Aff (Millwood) 28(1): 206-214.

72
Wall, J., C. N. Mhurchu, et al. (2006). "Effectiveness of monetary incentives in modifying dietary behavior: A review of randomized, controlled trials." Nutr Rev 64(12): 518-531.
White, M., and G. Gundrum (2007). “Case management.” In C. Evashwick. Continuum of Long-Term Care. Delmar and Thomas Learning.