final report for kaska dena council the muskwa-kechika ... final... · management summary this...
TRANSCRIPT

Kaska Dena Northern Rockies Archaeological Project,North Central British Columbia: An Archaeological Site Location
Predictive Model and Field Test Survey Results.Permit 2000-191
Final Report
for
Kaska Dena CouncilP. O. Box 9
Watson Lake, The YukonY0A 1C0
and
The Muskwa-Kechika Trust Fund150 - 10003 - 110th Avenue
Fort St. John, British ColumbiaV1J 6M7
June 11, 2001
by
C. Jason HarrisMasters Candidate
Department of Archaeology, University of Calgary2500 University Drive NW
Calgary, AlbertaT2N 1N4

Project Leader: Jean GleasonChair, Kaska Dena CouncilBox 9Watson Lake, The YukonY0A 1C0
Project Leader: Bill LuxVice Chair, Kaska Dena CouncilBox 9Watson Lake, The YukonY0A 1C0
Project Director: C. Jason HarrisMasters CandidateDepartment of ArchaeologyUniversity of Calgary2500 University Drive NWCalgary, AlbertaT2N 1N4
Project Financial Administrator: Shirley LaverdureVice Chair, Finance, Kaska Dena
CouncilBox 9Watson Lake, The YukonY0A 1C0
Project Assistant: Judith A. S. BannermanCalgary, Alberta
Project Trainee & Boat Operator: Fabian PorterLower Post, British Columbia
Project Informant: Dennis PorterLower Post, British Columbia
Muskwa-Kechika Trust Fund Liaison Paul J. Mitchell-BanksMuskwa-Kechika Program Manager,The Muskwa-Kechika Trust Fund150 - 10003 - 110th AvenueFort St. John, British ColumbiaV1J 6M7
Report Author: C. Jason HarrisMasters CandidateDepartment of ArchaeologyUniversity of Calgary2500 University Drive NWCalgary, AlbertaT2N 1N4
Kaska Dena Northern Rockies Archaeological Project Final Report, June 11, 2001
Kaska Dena Council Page 1

Management Summary
This project aimed at two major goals. The first goal was to create and test a predictive model identifying areas of likelihood for locating archaeological sites. The second goal of this project was to train individuals of the Kaska Dena community in the basics of field archaeology.
A preliminary predictive model was created using Geographic Information Systems (GIS) and used to identify areas for field testing in the summer of 2000. This intuitive associational model was also tested against known archaeological sites as a measure of its predictive strength. Field testing indicates that the model and/or testing methodology requires some considerable refinement in order to be used to increase the efficiency of archaeological field work. Testing the model against the inventory of known archaeological sites indicates further research is required to determine if there are any correlative relationships between archaeological site locations and modern geographic features. However, 80.28% of the known sites in the test inventory did indeed fall within the predicted high potential zones. But, since the high potential zone covered 82.36% of the overall study area, it is unlikely that this model would increase the efficiency of archaeological survey to a significant degree. Surprisingly, 14.93 % of the known sites are located in the Low potential zone. Examining this unexpected result will undoubtedly be the subject of some interesting future research.
The field testing portion of this project was intended to train members of the Kaska Dena community interested in learning more about archaeology in their homeland. This training was intended to not only satisfy the curiosity of trainees but to provide them with employable skills in the Cultural Resource Management (CRM) industry. Unfortunately, the unexpected, premature departure of the former Vice Chair of Kaska Dena Council combined with the late notice of project funding resulted in a protracted recruiting period. The end effect of this situation was that only one full-time Project Trainee was recruited instead of the anticipated six or more trainees. A part-time trainee volunteered with the project for one week. However, a lucky coincidence enabled the project participants to introduce archaeological methods and goals to members of the Kaska Dena community, Provincial representatives and Federal officials who attended the Main Table meeting at Sandpile Camp in July.
Another, secondary goal of this project was to evaluate the effectiveness of Traditional Native Knowledge (TNK) in predicting the detectable location of prehistoric archaeological sites. This season’s field work suggests that the incorporation of TNK in archaeological field work is an effective method for locating archaeological sites. Of the eight sites identified during the field study, only two were located without the assistance of the Project Informant.
The unfortunately small size of the field crew resulted in a failure to extensively test the GIS model with a statistically valid sample. Similarly, logistical difficulties did not allow for a more extensive testing of Traditional activity areas. This season’s field investigations have highlighted the need for more in depth preliminary study with knowledgeable members of the Kaska community prior to engaging in field work. Similarly, the need to begin recruiting trainees from the community early was made abundantly clear this season.
Recommended improvements to the GIS predictive model include: using base data from 1:50,000 scale maps instead of 1:250,000 scale maps; including more in-depth consultation with Kaska knowledgeable in Traditional Activities in areas of study interest; directing effort toward determining what correlative relationships each of the model criteria have with site location in order to determine appropriate weight scores in future model iterations.
Kaska Dena Northern Rockies Archaeological Project Final Report, June 11, 2001
Kaska Dena Council Page 2

Table of Contents
Management Summary 2Table of Contents 3List of Figures, Tables and Appendices 4Acknowledgements 5Introduction 6Study Area 8Methodology 19Results 27Evaluation and Discussion 49Recommendations 58References Cited 61Appendices 65
Kaska Dena Northern Rockies Archaeological Project Final Report, June 11, 2001
Kaska Dena Council Page 3
List of Figures, Tables and Appendices
Figure 1: Overall Study Area 9Figure 2: Proposed Study Area 10Figure 3: Area of Actual Field Work 11Table 1: Thresholds Used to Determine Criteria Potential 20Table 2: Model Criteria Weighted Scoring 21Figure 4: Map of Preliminary Model Likelihood Areas insertFigure 5: Quadrat Shovel Test Placements, IgSv-009 (HiQuad 2) 25Figure 6: IgSx-001 (Sandpile Creek 4) Sketch Map 29Figure 7: IgSx-002 (Sandpile Creek 3) Sketch Map 31Figure 8: IgSx-003 (Sandpile Creek 2) Sketch Map 32Figure 9: IgSx-004 (Sandpile Camp) Sketch Map 34Figure 10: Black Obsidian Biface Fragment 36Figure 11: Black Obsidian Thumbnail Scraper 37Figure 12: Grey Chert Biface Fragment 37Figure 13: Dark Grey Thumbnail Scraper 38Figure 14: Light Brown/Grey Chert Thumbnail Scraper 39Figure 15: Dark Grey Chert Blade Fragment 40Figure 16: Dark Grey Chert Microblade(?) Fragment 41Figure 17: IgSx-005 (Mosquito Creek 1) Sketch Map 42Figure 18: Sketch map of IgSx-006 (Mosquito Creek 2) & IgSx-007 (Mosquito Creek 3)44Figure 19: Grey/Green Mottled Scraper 45Figure 20: Comparison of Land Area to Known Site Frequencies 46Table 3: Percentages of Area and Sites in Each of the Likelihood Categories 47Figure 21: Likelihood Score Frequencies by Site Class 48Table 4: Likelihood Score Frequencies by Site Class 48Figure 22: 30˚ Slope at MedQuad2 55Figure 23: 34˚ Slope. 55Appendix A: Glossary 65Appendix B: Artifact Catalogue 66Appendix C: Artifact Descriptions 67
Kaska Dena Northern Rockies Archaeological Project Final Report, June 11, 2001
Kaska Dena Council Page 4

Acknowledgements
I would like to thank Walter Carlick and Steven Jakesta for beginning this project and Eric Gunderson for introducing me to Kaska Dena Council and the beautiful country whose people they represent. A great debt of appreciation is owed to Shirley Laverdure who has always ensured that I was organized and planned thoughtfully. Thank you to Roma Tibbet who made sure that the administrative details were covered. Corrine Porter was particularly valuable in solving many logistical problems and is a managerial role model for me.
Thanks also to Emil Dendys whose boat contributed greatly to solving our logistical problems. A great debt of gratitude goes to Judith Bannerman and Fabian Porter who made a diligent and hardworking crew in spite of the various difficulties we encountered. Judith is also responsible for the drawings of the artifacts in this report. Similarly, a thank you goes to Floyd “Rabbit” Frank who not only worked hard but entertained us during his week in the field. I would like to thank Dennis Porter who probably taught me more about archaeological field work than I taught him. A special thanks goes to Robbie Porter, without whose help we might still be in the field.
Certain appreciation must go to Bill Lux and Jean Gleason who have supported this project despite having it dropped in their laps, without warning, halfway through its realization. Also, I must thank LGL Consulting Ltd. for providing me with the bulk of the digital data used to build the preliminary model.
The greatest appreciation must go to my advisor, Dr. Gerald Oetelaar in the Department of Archaeology, University of Calgary, whose support and guidance has kept me working hard when I would have otherwise given up.
Funding provided by the Muskwa-Kechika Trust Fund is greatly acknowledged. Without the financial support of the Muskwa-Kechika Trust Fund, this project never would have seen the light of day.
Kaska Dena Northern Rockies Archaeological Project Final Report, June 11, 2001
Kaska Dena Council Page 5

Introduction
The undeveloped terrain of the interior of British Columbia has always made it
difficult for people to get around. This is particularly so when one is carrying a shovel, a
screen and other gear during an archaeological survey. The need for the archaeologist to
cover a lot of this difficult terrain in a short period of time under a load of equipment has lead
to a desire to limit the amount of this terrain one must cover in order to locate cultural
heritage resources in need of protection under the Heritage Conservation Act (McCullough
& Fedirchuk 1991). To do this, the methods of predictive modeling have been employed.
Recently, Geographic Information Systems (GIS) have been used to build and visualize
predictive models. For the most part, in British Columbia, these predictive models have been
based on the combined experience of archaeologists working in the southern and coastal
regions of the province. As archaeologists moved into lesser studied areas of the province,
they brought their predictive models with them (either consciously or unconsciously). These
intuitive models were then modified to fit the new study areas. Recent proposals for
resource and recreation development in the Muskwa-Kechika area have highlighted the need
to develop a formalized predictive model for this unique area. The rapid pace of
contemporary development does not allow for the development of the traditionally slow
paced archaeological models. Therefore, the need to employ emerging techniques in
resource management is recognized. It is for this reason that the Kaska Dena Northern
Rockies Archaeological Project has begun with a focus on developing a useful model for
predicting the location of areas where archaeological resources are likely to be detected.
“The ability to determine the relative probability of site location without continuous and
expensive field survey is without question beneficial to the administration of any resource
inventory” (Moon 1993:1).
Unlike the approach to predictive modeling in other parts of British Columbia, this
project has aimed to identify those areas where archaeological sites are likely to be
discovered (i.e. modern archaeologist behaviour) rather than where they were likely to be
formed (i.e. past human behaviour). This is a critical difference which at first appears to be
Kaska Dena Northern Rockies Archaeological Project Final Report, June 11, 2001
Kaska Dena Council Page 6

very subtle. The current model not only takes into consideration the modern geographic
features believed to be associated with cultural heritage resources but also the operational
behaviour of investigators seeking to locate those resources. Therefore, those areas that
may have been likely for the formation of an archaeological site but are not currently
conducive to archaeological survey do not show up as areas of high potential.
Similarly, in the past decade or more, archaeologists have recognized that their
predictive ability is not as efficient as one would hope. Couple this with the common
situation that the archaeologist is not always personally familiar with the landscape he or she
is working in and the need to cover even more ground increases despite the use of predictive
models. Archaeologists have addressed this issue by attempting to work more closely with
local Native inhabitants. After all, who knows an area better than the people who have lived
there the longest? The inclusion of knowledgeable First Nations people in archaeological
field investigations have lead (in some cases) to a higher degree of site recovery than without
their guidance (French 1980, Greer 1997, Hanks & Winter 1986, Loy 1983, McCullough &
Fedirchuk 1991). Therefore, it is a long term goal of this project to enhance the predictive
modeling approach with Traditional Native Knowledge (TNK) to reduce the need to
investigate unnecessarily large areas of the isolated and particularly rugged terrain of the
Muskwa-Kechika region of the Northern Rockies.
Kaska Dena Northern Rockies Archaeological Project Final Report, June 11, 2001
Kaska Dena Council Page 7

Study Area
The overall study area is that portion of northern British Columbia that is the
intersection of the Muskwa-Kechika Management Area and Kaska Dena Traditional
Territory (Figure 1). However, for this season, the study area chosen was originally intended
to focus on the area around Scoop Lake (Figure 2), using the Kechika River as the main route
of travel. Unfortunately, this decision was based on some misinformation regarding the
likely location of our base camp. Therefore, the actual area focused on for this summer’s
field activity was on the periphery of the proposed study area (Figure 2) along the Turnagain
River (Figure 3). I only mention this to account for why our 2000 field investigations fell
short of the proposed project goals. Our camp on the Turnagain River turned out to be a
relatively significant factor in how much of the study area we were able to access readily.
Rapids down river near our camp limited the number of trips we dared to venture toward
the Kechika River. This illustrates my earlier point about the ability of researchers to move
about efficiently in unfamiliar territory. If I had prior experience of the difficulty passing the
Earl Boose rapids on a regular basis, I would have chosen a more appropriate site for our
base camp.
The region is one of the unique wilderness areas of Canada. It is virtually untouched
by resource development. Currently, the most prominent human activity of significant
impact is guide outfitting. These outfits build airstrips and maintain camps throughout the
area. In fact, the largest archaeological site located during this summer’s investigations now
hosts the abandoned Turnagain Outfitter’s lodge and airstrip. However, this relatively
pristine environment is targeted for resource development by forest companies on all sides.
In addition, the Rocky Mountain Trench (which runs through the middle of the study area) is
regarded as an ideal transmission corridor for natural resources and utilities (Gunderson
1999:15).
Physiography
The dominant landforms of the study area are, of course, the Rocky Mountains. This
Kaska Dena Northern Rockies Archaeological Project Final Report, June 11, 2001
Kaska Dena Council Page 8

Kaska Dena Northern Rockies Archaeological Project Final Report, June 11, 2001
Kaska Dena Council Page 9

Kaska Dena Northern Rockies Archaeological Project Final Report, June 11, 2001
Kaska Dena Council Page 10

Kaska Dena Northern Rockies Archaeological Project Final Report, June 11, 2001
Kaska Dena Council Page 11

land form dominates the entire eastern portion of the study area. I do not intend to provide
an in-depth account of the geology of this area as there are more appropriate sources for this
information than an archaeological report. However, I will provide a generalized summary
of the formation of the landscape in order to establish a frame of reference.
Approximately 140 million years ago the collision of tectonic plates began a gradual
mountain building process which pushed up the sedimentary rock of the continental shelf to
form the high peaks of the Rockies (Gadd 1995:14). This uplifting continued to about 45
million years ago (Gadd 1995:13). From this time to around two million years ago the forces
of uplift were countered only by the slow forces of erosion punctuated by the occasional
brief glaciation. Beginning approximately two million years ago to about ten thousand years
ago, the major shaping force of this great formation was glacial ice in a series of glaciations.
There appears to be little that can be said definitively regarding the most recent
geologic events that formed the landscape that we see today in the Northern Rocky
Mountains area. In a recent summary of Quaternary geological research, Bobrowsky and
Rutter (1992) reviewed 577 works produced between 1877 and 1991, 68 (11.8%) of which
applied to the Northern Rockies. Of these, only 23 (4%) are directly applicable to the current
study area and then only in a general way.
From this information, the authors were able to infer that the Northern Rockies saw
the latest episode of glaciation begin around 15,000 years ago. Similarly, deglaciation was
determined to have probably begun approximately 14,000 years ago (Bobrowsky & Rutter
1992:36). Therefore, the Northern Rocky Mountains could have experienced as few as 1,000
years of recent glaciation. In contrast, other parts of the Rocky Mountain chain (not to
mention most of northern Canada) may have experienced between five and fifteen thousand
years of glaciation during the latest glacial event, the Wisconsinan (Bobrowsky & Rutter
1992:36).
Such a short period of glaciation may explain how hard shale formations in the
Northern Rockies can have sandstone and conglomerate caps. In the Southern and Central
Rockies these softer formations have been scoured away by the ice (Gadd 1995:39). This
relatively light glacial treatment may also account for the survival of the numerous small
Kaska Dena Northern Rockies Archaeological Project Final Report, June 11, 2001
Kaska Dena Council Page 12

stream channels which had been carved into wide valleys further south (Gadd 1995:39). At
any rate, more work is needed by geologists and geographers to more fully illuminate the
recent geologic past of this area.
Since deglaciation began approximately 14,000 years ago, the climate has shifted to
become warmer (obviously) and drier (Wicander & Monroe 1993:520). Supported by this
climate change, willow tundra has given way to the mixed conifer deciduous boreal forest.
Between 8,000 and 6,000 years ago the climate became considerably warmer and drier than
any time before or since (Wicander & Monroe 1993:521). After 6,000 years ago the climate
returned to cooler and wetter conditions but not nearly as cool and wet as the period before
10,000 years ago (also known as the great ice age) (Wicander & Monroe 1993:521). However,
between A.D. 1500 and A.D. 1900 “the Little Ice Age” caused many mountain glaciers to
advance far down the valleys in which they had been previously retreating (Wicander &
Monroe 1993:571, 521).
The north and east portion of the study area is dominated by brunisols while podzols
dominate the southern and west portion. Archaeologically, brunisols make dating difficult
because they lack the horizon development required to distinguish episodes of soil
development (Soil Classification Working Group 1998:53). On the other hand, podzols are
typically associated with acidic conditions that are not generally conducive to artifact
preservation (Soil Classification Working Group 1998:107-108).
The study area can be separated into three biogeoclimatic zones, primarily by
elevation. The lowest valley bottoms fall into the Boreal White and Black Spruce
biogeoclimatic zone (Skoda et al 1999). This zone occupies the least area of the three
biogeoclimatic zones. The Spruce-Willow-Birch biogeoclimatic zone occupies higher valley
bottoms and most of the slopes in the study area (Skoda et al 1999). The highest slopes and
most of the peaks in the study area fall into the Alpine Tundra zone. The Spruce-Willow-
Birch zone and the Alpine Tundra zone occupy roughly an equal amount of territory in the
study area (Skoda et al 1999).
The mean daily temperature in July is less than 16˚ C. In January, the average daily
temperature is between -15˚ C and -20˚ C. Annually, there are less than 60 frost free days. In
Kaska Dena Northern Rockies Archaeological Project Final Report, June 11, 2001
Kaska Dena Council Page 13

the northern part of the study area the average annual precipitation is only 30-50 cm. The
southern portion of the study area can range between 50 and 100 centimeters of
precipitation.
While the statistics for annual precipitation may suggest this to be a dry land, it is
actually quite wet due to the ground being frozen for most of the year. Thus, the water table
is very near the surface as evidenced by the numerous sloughs, swamps, ponds, lakes,
streams and rivers in the area. The harsh climate associated with these biogeoclimatic zones
means that the land recovers slowly from impact activities. In other words, the growing
season is so short that widespread vegetation growth and consequent soil development is
quite slow. Therefore, activities that have a lasting impact on the surface (e.g. trails, camp site
clearing etc.) are visible for many years after that activity has ceased. Having said that, the
common exception is in wetter areas where willows grow quickly, often forming an almost
impenetrable verdure wall.
Flora
Numerous plants occupy the study area. Many of these plants are important to
humans or animals or both. Trees important for food, medicine and materials include: Birch
(Betula papyrifera humilis, Betula glandulosa), cottonwood (Populus balsamifera, Populus
trichocarpa), jackpine (Pinus banksiana), lodgepole pine (Pinus contorta latifolia), spruce (Picea
mariana, Picea glauca) and trembling aspen (Populus tremuloides) (Honigmann 1964: 14,
McIntyre & McIntyre 1983:14-15).
Shrubs have been and continue to be very important sources of food and medicine.
The berries produced on many shrubs were once the only source of vitamin C, important in
preventing scurvy. The roots of many shrubs were important food items as well as used for
medicine. Teas made from the roots, leaves and stalks of many shrubs provided essential
nutrients and vital medicines. Moreover, some of the woody shrubs were, and are,
important sources of material for snares and other items. Included in a long list of important
shrubs are: alder (Alnus tenuifolia, Alnum sinuata), ash (Sorbus sitchensis), black hawthorn
(Crataegus douglarii), black twinberry (Lonicera involucrata), high bush cranberry (or squash
Kaska Dena Northern Rockies Archaeological Project Final Report, June 11, 2001
Kaska Dena Council Page 14

berry, Viburnum edule), low bush cranberry (Vaccinium oxycoccos), crow berry (Empetrum
nigrum), huckleberry (Vaccinium caespitosum), juniper (Juniper communis, Juniper horizontalis),
kinnikinnick (or common bear berry, Arctostaphylos uva-ursi), Labrador tea (Ledum
groenlandicum), prickly rose (Rosa acicularis), raspberry (Rubus idaeus), Saskatoon berry
(Amelanchier alnifolia), soap berry (or soopolallie, Shepherdia canadensis), swamp gooseberry
(Ribes lacustre), velvety buckbrush (Ceanothus velutinus) and willow ( Salix pedicellaris, Salix
spp) (Honigmann 1964: 14, McIntyre & McIntyre 1983:14-15, Kershaw 2000).
Herbs have also provided essential nutrients to both humans and animals in the study
area. As with the shrubs, many medicines were derived from herbs. Today, many grasses
and other associated herbs are encouraged to grow through prescribed burning (Charlie
Boya 1999 pers. comm., Fabian Porter 2000 pers. comm., Kevin Frank 2000 pers. comm.).
While local consumption of wild herbs may not be as prevalent in the past, the wildlife of the
area depend on them. Many of the most important herbs are: fern (Pteridium aquilinum
pubescens, athyrium filix-femina, Cryptogramma acrostichoides), fireweed (Epilobium angustifolium,
Epilobium alpinum), grasses (Agrostis humilis, Bromus pumpellianus, Hierochloe odorata, Luetkea
pactinata, Spirea densiflora), heather (Phyllodoce empetriformis, Cassiope mertensiana), horsetail
(equisetum scirpoides, Equisetum arvense), moorwort (Andromeda polifolia), sedge (Carex
pyrenaica), shrubby cinquefoil (Potentilla fruticosa), stinging nettle (Urtica lyallii), strawberry
(Fragaria virginiana) and wild chives (Allium schoenoprasum) (Honigmann 1964: 14, McIntyre &
McIntyre 1983:14-15, Kershaw 2000).
Fauna
Obviously, in order to support the guide outfitters, the wildlife population is relatively
large and diverse. Therefore, more is known about game species than other animal
populations. Similarly, the recent historical prominence of fur trapping in the area has led to
a greater local knowledge of fur bearing species. Fish and birds were also important
resources for the people of the area and continue to be so to some extent today.
The largest mammals of the country are probably the bears. Bears are almost
ubiquitous in the area. While in the field this summer, not a day passed without the sighting
Kaska Dena Northern Rockies Archaeological Project Final Report, June 11, 2001
Kaska Dena Council Page 15

of at least one bear. Grizzly (Ursus arctos horribilis) was the most commonly sighted bear by
the project crew. However, black bear (Ursus americanus americanus) were also sighted in
abundance. According to Honigmann, brown bear (Ursus americanus cinnamomum) were also
present in the area (Honigmann 1964:14).
Other known predators (aside from humans) include: mountain lion (Felis concolor),
wolf (Canis lupus columbianus), coyote (Canis latrans incolatus), lynx (Lynx lynx canadensis) and
red fox (Vulpes vulpes abietorum) (Honigmann 1964:14, McIntyre & McIntyre 1983:15-16,
Friesen 1985:20).
The wood buffalo (Bison bison athabascae), now extinct in the area, may have been a
very important game species in the past. While there are no reports of wood buffalo
remains found in the study area itself, reported remains nearby (Friesen 1985:20) make this a
definite possibility. Only future investigations can shed more light on this particular matter.
Of the important game species, moose (Alces alces) are typically regarded as a recent
immigrant. “Various authors as well as local Indians agree that at some time in the past
moose were lacking in the country” (Honigmann 1964:14). However, despite its recent
appearance in the area, moose have become one of the most important game species to the
inhabitants of the area. Once encountered, a moose will be tracked until it is either lost or
killed (Charlie Boya 1999 pers. comm., Dennis Porter 2000 pers. comm.).
Other important game species are caribou (Rangifer tarandus caribou and Rangifer
tarandus osborni) and elk (Cervus elaphus nelsoni). Elk appear to be quite scarce in the area
while caribou tend to be more prevalent in the northern and eastern portions.
Probably the next most important game species is stone sheep (Ovis dalli stonei).
Sheep trails can be found everywhere in the study area and were often used by the field crew
to travel through the forest. While bagging a big ram is the primary goal of many hunters
using the guide outfitters’ services, local inhabitants regard sheep as tasty but nutritionally
poor (Dennis Porter, personal communication). Mountain goats (Oreamus americanus
columbiae) are not as common as sheep but are sought after in a similar vein.
Many Smaller species were hunted or trapped not only for food but for their fur.
These reported important species are: beaver (Castor canadensis spp), otter (Lontra canadensis
Kaska Dena Northern Rockies Archaeological Project Final Report, June 11, 2001
Kaska Dena Council Page 16
spp), porcupine (Erethizon dorsatum), hoary marmot (Marmota caligata okanagana), muskrat
(Ondatra zibethicus spatulatus), weasel (Mustela nivalis rixosa), marten (Martes americana
actuosa), mink (Mustela vison energumenos), hare (referred to locally as rabbit, Lepus
americanus), red squirrel (Ramiasiurus hudsonicus spp) and chipmunk (Eutamias minimus spp)
(Honigmann 1964:14, McIntyre & McIntyre 1983:15-16, Friesen 1985:20). Predators such as
the red fox and lynx were also taken for their fur (Honigmann 1964).
While some of these animals are protected species and can no longer be taken, some,
like the beaver, have increased in such numbers since the decline of the fur trade that they
are invading areas they have never been before (i.e. smaller streams at higher elevations)
(Kevin Frank pers. comm.).
A decline in the fur market as well as a decline in Traditional practices have lead to a
decrease in the numbers of these animals trapped or hunted. However, the fur market is
experiencing a slight resurgence. Combine this with a rekindled interest in Traditional
practices and the importance of these animals to the lives and livelihood of residents will
continue to increase.
Fish have always been an important food source in this area. While fish were an
essential winter resource in the past, they are now mostly taken as a leisure activity for both
residents and visitors of the area. While no fish were caught during our stay in the field (not
for lack of trying), species reported to be important in the area are grayling (Thymallus
arcticus), loche or ling (Lota lota), pike (Esox lucius), sucker (Catostomus spp), lake
trout (Salvelinus namayoush), rainbow trout (Salmo gairdneri) and whitefish (Prosopium
cylindraceum) (Honigmann 1964:15, Friesen 1985:21). While salmon do not run in this area
they have been and, to a lesser extent, still are sought after by local inhabitants. People with
relatives in salmon spawning areas travel to participate in annual catches and bring home
what they can.
Birds have always been important sources of food and feathers. In the past, swans
(Cygnus columbianus) were taken for food (Honigmann 1964:14) but today they are not
sought after and tend to be quite rare. Other important bird species are Canada goose
(Branta canadensis), eagle (Haliaeetus leucocephalus), owl (Aegolius spp), loon (Favia immer), crow
Kaska Dena Northern Rockies Archaeological Project Final Report, June 11, 2001
Kaska Dena Council Page 17

(Crovus brachyrhynchos), ducks (Anas platyrhynchos, Anas acuta, Anas carolinensis, Anas discors,
Mareca americana, Spatula clypeata, Aythya valisineria, Aythya affinis, Bucephala clangula, Bucephala
albeola, Melanitta deglandi, Melanitta perspicillata, Mergus merganser), grouse (Dendragapus
obscurus, Dendragapus umbellus, Pedioecetes phasianellus) willow ptarmigan (Lagopus lagopus)
and spruce hens (Dendragapus canadensis) (Honigmann 1964, Godfrey 1966, McIntyre &
McIntyre 1983, Friesen 1985).
Grouse, ptarmigan and spruce hens are collectively referred to as “chickens”. They
can be found nearly everywhere and are an excellent source of protein while traveling and
camping (Charlie Boya 1999 pers. comm.).
The relatively cold climate ensures that animal, vegetable resources are widely
distributed. While the tumultuous past of the landscape has left a rough and rugged country,
it is not as formidable as the steep glacier carved walls of the Central and Southern Rockies.
This is fortuitous for the past and present inhabitants of the area as travel is facilitated by the
comparatively low valleys and passes, including the major Rocky Mountain Trench corridor.
The recent geologic history suggests that recent human occupation could have began
as early as 14,000 years ago. The suggestion that the Northern Rockies experienced a
relatively light treatment during the Wisconsinan glaciation, invokes thoughts of the
possibility of deeply buried preclacial sediments in the valleys which may be important
sources of information regarding the earliest plant and animal (including human)
colonization of the area.
Kaska Dena Northern Rockies Archaeological Project Final Report, June 11, 2001
Kaska Dena Council Page 18

Methodology
Preliminary Model
The preliminary model was created from digital base data provided by LGL
Consulting Ltd. of Victoria, British Columbia. This base data consisted of twenty meter
contours digitized from 1:250,000 scale NTS maps. Also digitized from these maps were
small streams (represented by a single line), large streams and rivers (represented by closed
polygons), standing bodies of water, such as lakes (also represented by closed polygons) and
transportation features (e.g. roads, trails, railways, pipelines etc.) represented as lines. The
main features used to build the preliminary model were contours, water (streams, rivers,
standing bodies) and trails. These features were used as the basis of the four main predictive
criteria of the model: degree slope, slope aspect, proximity to water and proximity to a trail.
The result of these criteria is an associational model. “Associational models provide a means
of operationalizing the environmental variables that may be related to site location” (Moon
1993:9).
The associational model presented here represents one theoretical construct based on
widely varying practices used to conduct archaeological overview assessments in the
province of British Columbia. The goal in doing this is to evaluate, in a generalized way, the
effectiveness of the overview assessment process with regard to protecting archaeological
heritage resources in the northern Rocky Mountains area. Further to this goal, the
preliminary model was constructed prior to any comparison of the geographic setting of the
known archaeological sites. This was done primarily to avoid colouring the model outcome
based on the test inventory of known archaeological sites. That is to say, that the inventory
of known sites was ignored during the preliminary model creation process to preserve the
objective testability of the known sites inventory.
Models of site location based on existing data can lead to predictions with very high accuracy rates. After all, if people have only looked for sites in certain types of places, then it is inevitable that site locations will be highly correlated with specific environmental attributes. [Moon 1993:19]
In so doing, it is possible to avoid the tautological trap or circular reasoning associated with
Kaska Dena Northern Rockies Archaeological Project Final Report, June 11, 2001
Kaska Dena Council Page 19

using a sample of the test inventory to create a model then using the remainder of that
inventory as a test sample. In my opinion, the method of testing a hypothetical model with
real world data is more theoretically informative than this alternative.
The four model criteria were each divided into measures of low, medium and high
likelihood of site recovery. That is to say, for example, that the measure of degree slope was
divided into assigned thresholds of low, medium and high potential. These criteria
thresholds are best summarized in Table 1:
At this point it should be pointed out that I am deliberately avoiding the use of the
term probability in discussing this preliminary model. The scores used in this model are not
derived from probability statistics and are for this reason not strictly probabilities. The scores
used here are hypothetical and arbitrary quantifications of the criteria for experimental
purposes. Therefore, in effort to avoid technical confusion over what this model means, I
shall attempt to restrict myself to the terms likelihood and potential. I think that it is important
to make clear that what is being evaluated here is not necessarily the specific model but the
underlying concepts which are used to create it and many archaeological overview
assessments in British Columbia. This process is necessary to achieve the goal of creating an
effective and useful model for archaeologists, land managers and First Nations people.
With four major criteria divided into three thresholds of likelihood, any particular
parcel of land within the study area could have any combination of twelve different potential
scores. Each of these potential scores were weighted based on their perceived importance to
this research project. The importance of a particular criterion in this case was shaped by
consulting numerous project reports for this area (Apland 1980, Balcom 1986, Eldridge 1983,
Kaska Dena Northern Rockies Archaeological Project Final Report, June 11, 2001
Kaska Dena Council Page 20
Potential Score 1 10 100CriterionProximity to Trails Greater than 100 m 25 m - 100 m Less than 25 mProximity to Water Greater than 200 m 100 m - 200 m Less than 100 mAspect of Slope 315˚ - 45˚ 45˚ - 135˚ and 225˚ - 315˚ 135˚ - 225˚Degree Slope Greater than 30˚ 10˚ - 30˚ Less than 10˚Thresholds used to determine low, medium and high potential for each of the chosen criteria.
Table 1

Friesen 1985, Friesen 1983, Ham 1987, Ham 1988a, Ham 1988b, Lawhead & Stryd 1987, Loy
1977, Loy 1983, Loy 1984, Magne 1981, McCullough & Fedirchuk 1991, McIntyre & McIntyre
1983, Mitchell & Eldridge 1983, Mitchell & Loy 1981, Simonsen 1986, Van Dyke 1981, Van
Dyke & Reeves 1978, Walde 1988, Walde 1990, Walde 1991, Walde 1992, Wilson 1984, Wilson
1990a, Wilson 1990b). This formed the intuitive base upon which a mappable model was
constructed.
There is good reason to consider intuitive thought in a discussion of predictive modelling. Many models for site location or settlement behaviour are intuitive or not fully operationalized. If a model can be objectively replicated and mapped, it is operationalized; a model consisting of the statement that “sites are located near rivers on dry, level ground,” for example, is not mappable until site, near, river, dry, level, and ground have been rigorously defined (Kohler 1988:35). [Moon 1993:8]
In this view, the preliminary model presented here goes a long way toward operationalizing
a functional model that can be used and replicated by others interested in predicting
archaeological site locations in the northern Rockies area. Therefore, each of the twelve
categories (e.g. slope high, water low etc.) were given a score out of 100 (Table 2).
The specific weight values are arbitrary assignments based on the generalized intuitive
model derived from the above cited reports. From these reports it appears as though all
researchers perceive that high site potential coincides with ‘level ground near water’.
Therefore, the criteria slope and proximity to water were given the same weight. The
general northwest-southeast trend of the major valleys of this area suggested that aspect
choice was limited. Add to this the coarse resolution of the terrain model generated by the
Kaska Dena Northern Rockies Archaeological Project Final Report, June 11, 2001
Kaska Dena Council Page 21
Likelihood High Medium LowCriterion (100) (10) (1)Trail (0.20) T (20.00) T (2.00) T (0.20)Water (0.35) W (35.00) W (3.50) W (0.35)Aspect (0.10) A (10.00) A (1.00) A (0.10)Slope (0.35) S (35.00) S (3.50) S (0.35)
Total Range 10.00 - 100.00 1.00 - 9.99 0.10 - 0.99This table more clearly shows the scoring system for each category in the preliminary model. Each level of likelihood is given a score out of 100. Each criterion is weighted according to its perceived contribution in predictive power.
h
h
h
h
m
m
m
m
l
l
l
l
Table 2

1:250,000 scale base data it was decided that while slope aspect was an important criterion to
include in the model, it should not be given so much weight as to heavily influence scores
that would be marginal based on the other three criteria. Therefore, the aspect criterion was
given the least weight. Trails were weighted according to the view that they very roughly
approximate the sort of mappable data that can be gleaned from TNK. Since the trails
criterion accounted for such a small portion of the study area it was not seen to be a major
source of error if it was given a weight twice that of aspect.
With these weight scores, the coverages for each criterion class (i.e. Trail, Water,
Aspect and Slope) were combined using the following ArcInfo Map Algebra equation:
siteprob = (0.20 x trailprob) + (0.35 x waterprob) + (0.10 x aspectprob) + (0.35 x slopeprob)
Where: trailprob = the scored grid coverage of cells relating to trail proximity,
waterprob = the scored grid coverage of cells relating to proximity to water,
aspectprob = the scored grid coverage of cells relating to the calculated
aspect of slope polygons,
slopeprob = the scored grid coverage of cells relating to the degree slope,
siteprob = the polygon coverage of composite scores for the entire study
area.
From the resulting composite scores, the medium and high categories were
subdivided further into low, medium and high. In so doing, it was intended that the model
reflect the assumed natural distribution of sites through these zones. The low potential
category was not subdivided this way because of the short range of scores. The final
resultant categories and subcategories were Low (0-0.999), Low-Medium (1.000-3.999),
Medium-Medium (4.000-6.999), High-Medium (7.000-9.999), Low-High (10.000-39.999),
Medium-High (40.000-69.999) and High-High (70.000-100.000). These ranges of decimal
scores were then converted to integer scores to facilitate the ArcInfo overlay query
procedure with the inventory of known archaeological sites. Therefore, the final integer
Kaska Dena Northern Rockies Archaeological Project Final Report, June 11, 2001
Kaska Dena Council Page 22

scores for each of the likelihood categories are: Low (0), Low-Medium (1), Medium-Medium
(2), High-Medium (3), Low-High (4), Medium-High (5), High-High (6). Figure 4 (insert)
shows the areal extent of these likelihood zones.
For example, let us take a 25 m x 25 m parcel of land (the minimum size of a grid cell
for any of the coverages), and label it ∂. First each of the four criteria is scored according to
Table 1. ∂ is closer than 25 m to a trail, score 100. Water can be found 160 m away, score 10.
The aspect is 210˚, score 100. The slope is 34˚, score 1. Next we weight the score of each
criterion according to the scheme outlined in Table 2. This gives us:
∂ = Th + Wm + Ah + Sl = (100 x 0.20) + (10 x 0.35) + (100 x 0.10) + (1 x 0.35)
∂ = 20 + 3.5 + 10 + 0.35 = 33.85
10.0000 < 33.85 < 39.999
Therefore:
∂ has a likelihood score which places it into the Low-High category and is assigned an integer score of 4 for the overlay procedure.
Of course, all 2.5+ billion cells that make up the study area are calculated in the single ArcInfo
Map Algebra procedure.
The contours were used to create a triangulated irregular network (TIN) from which
the degree slope and slope aspect of the terrain could be measured. The accuracy of such
measurements are determined by the accuracy of the digitized contours (i.e. the ability of the
person doing the digitizing to accurately follow the paper map), the accuracy of the original
map sheets and the best resolution that it is possible to generate from the base data scale of
1:250,000. It has been noted elsewhere (Eldridge & Mackie 1993, Moon 1993) that 1:250,000
scale base data is not accurate enough for most of the terrain in British Columbia. However,
since much of the terrain in this study area exhibits dramatic elevation changes, it was
assumed that the most important geographical features in this predictive model would
indeed be expressed. This assumption has yet to be fully examined and/or verified.
Field Testing
The field testing was carried out in 100 m X 100 m quadrats with shovel tests placed 20
Kaska Dena Northern Rockies Archaeological Project Final Report, June 11, 2001
Kaska Dena Council Page 23

meters apart. This resulted in at least 36 shovel tests per quadrat (Figure 5). Shovel tests
were placed at five meter intervals upon locating cultural material. The quadrats were
selected by dividing the UTM grid into 100 meter blocks then randomly choosing seven
quadrats in each of the high, medium and low potential areas identified in the preliminary
model. The soil from each shovel test was screened using a 3 mm wire mesh when the soil
was dry and a 6 mm wire mesh when the soil was too damp for the finer screen.
However, after the actual location of the base camp was identified, some of the test
quadrats were moved closer to the camp in order to increase the possibility of actually
getting to them during the field season (Figure 3). However, this turned out to be
unnecessary as we were unable to test most of the quadrats anyway (Figure 3) in our short
four week field season.
In addition to shovel testing, any exposed ground encountered was examined. Such
ground exposures included tree throws, river and stream cut banks, trails and erosion areas
along the edges of terraces or on hill sides. In many of these cases, the lack of vegetation
indicated the generally poor level of soil development for that location. That is to say, that
the rate of erosion was faster than the rate at which vegetation growth could stabilize and
replenish the soil.
The decision was made in the field that a higher return for the remaining limited field
time would have come from testing traditional use areas. This decision was made partly on
the limited time available for our informant to accompany us in the field (two weeks) and the
likely possibility that we would be unable to obtain a statistically valid field test sample in the
remaining two weeks. Therefore, the latter two weeks of fieldwork were spent assessing the
archaeological potential of Traditional Use Areas (TUA) identified by our informant, Dennis
Porter. In so doing, we split our field time evenly between the random sampling
methodology and the Traditional Use directed judgmental methodology.
Testing Against Known Archaeological Sites
The preliminary model was tested against known archaeological sites by simply
overlaying the known locations on the model. Archaeological sites were tested separately by
Kaska Dena Northern Rockies Archaeological Project Final Report, June 11, 2001
Kaska Dena Council Page 24

Kaska Dena Northern Rockies Archaeological Project Final Report, June 11, 2001
Kaska Dena Council Page 25

site class. This was done primarily under the assumption that since the development of the
fur trade economy, the occupation pattern shifted to focus on this rather than the previous
subsistence pattern. Therefore, the base data then became the numbers of sites that fell in
the High, Medium and Low zones respectively for the different site classes. Four site classes
were represented in the available digital data provided by LGL Consulting Ltd. These were:
prehistoric sites, historic sites, culturally modified trees (CMTs) and other heritage sites. The
‘other sites’ class resulted from several sites for which no information was given in the
description field as to its actual site class. Fortunately, these represent only six of the 201
known sites in the test inventory.
The test inventory of 201 known sites was chosen as all those sites that fell within the
Kaska Dena Culture area in British Columbia (i.e. Kaska Dena Traditional Territory). Of
course, to some, this belies an a priori bias that any archaeological remains represent those of
Kaska Dena forebears. However, “models are most easily interpreted and understood if
they relate in a defined way to cultural boundaries or to major environmental zones” (Moon
1993:27). This simply reflects a need to choose boundaries for test data rather than a
particular interpretive desire on my part. Similarly, this boundary limit was convenient as
well as geographically consistent. It is for these reasons that the test inventory was limited in
this way.
Kaska Dena Northern Rockies Archaeological Project Final Report, June 11, 2001
Kaska Dena Council Page 26
Results
Field Testing
The field survey resulted in the location of eight previously unrecorded sites. The
largest of these sites was found by chance at the Turnagain Camp where we stayed while in
the field. One site was located in HiQuad2 (Figure 5) during the random sampling stage of
the field work. The small size of our crew meant that, at best, we were only able to complete
one quadrat in a day. The roughness of the terrain and the time required to get to some of
the quadrats actually resulted in more than one day of testing for most of the quadrats. Of
the 21 chosen test quadrats, only six were actually tested in a two week period. This results
in an average of 2.33 days per quadrat by a three person crew. The remaining six sites were
located while testing Traditional activity areas (Figure 3) during our final two weeks in the
field. Descriptions of all the artifacts collected are found in Appendix C.
IgSv-009 HiQuad2
This was the only site located during the random sampling portion of the field testing.
Shovel tests were placed according to the methodology previously outlined (Figure 5). As
expected, this site is situated close to water (approximately 100 m from Turnagain River) and
is less than 100 meters from a trail that leads from the Turnagain River to a Traditional camp
site at the Porter Lakes, northwest of this site. The slope of the land at this site is
approximately 3˚ and its aspect is about 48˚.
Of 46 shovel tests placed in this test quadrat, only two contained cultural material.
Representing that cultural material are three small grey chert flakes (in shovel test 5W/0N)
and one large black obsidian flake (in shovel test 0E/0N). In both shovel tests, the cultural
material was found approximately five centimeters below the surface. The first two
centimeters is black soil. Below this is approximately 46 centimeters of fine to medium grain
light brown sand with no rocks. Under this layer is very fine grain muddy sand to an
unknown depth.
Unfortunately, the cultural materials found are not particularly diagnostic of culture or
Kaska Dena Northern Rockies Archaeological Project Final Report, June 11, 2001
Kaska Dena Council Page 27

date and their number does not suggest a long term occupation. However, the location of
the site close to the river and a nearby trail leading to an important camp may indicate that
this site was part of a regular travel route. More judgmental testing around this site may
produce more substantial evidence of past activity. The site extent is approximately five
meters (N-S) by ten meters (E-W).
IgSx-001 Sandpile Creek 4
As with the IgSx-002 and IgSx-003 described below, this site was found along a trail
that leads from the Sandpile Camp to a known traditional campsite on Major Hart River
(Mosquito Creek or Bridge Creek). While the surrounding area appears to have been
leveled somewhat with a bulldozer, shovel tests indicate that the trail itself experienced little
disturbance and that the stratigraphy is intact. The approximately two centimeter thick root
layer is underlain by approximately one centimeter of brown sandy soil. Under this is very
rocky light brown/red sandy soil to an unknown depth (at least 20 cm).
No cultural materials were found in any of the shovel tests. The cultural material that
was found consists of two dark grey chert flakes on the surface of the trail. Vegetation
surrounding the trail prevented any further surface examination. The trail itself, at the edge
of the terrace (Figure 6), is prone to erosion which may account for the surface find. Our
informant, Dennis Porter, suggests that the terrace adjacent to the trail is an ideal location for
a traditional camp site. The presence of artifacts here suggests that this is a possibility.
This site is approximately 30 meters from the high water cut on the bank of the
Turnagain River. The slope of the land is between 0˚ and 5˚ and an aspect of 359˚. The
approximate extent of the site is ten meters (N-S) by one meter (E-W).
IgSx-002 Sandpile Creek 3
This site, located on the trail between Sandpile camp and Major Hart River (Mosquito
Creek or Bridge Creek), is the largest (at least in number of artifacts collected) of the three
sites located along this trail. It is approximately 20 m from the high water cut bank of the
Turnagain River. The slope of the land is between 0˚ and 5˚ and an aspect of 359˚. The
Kaska Dena Northern Rockies Archaeological Project Final Report, June 11, 2001
Kaska Dena Council Page 28

Kaska Dena Northern Rockies Archaeological Project Final Report, June 11, 2001
Kaska Dena Council Page 29

approximate extent of the site is one meter (N-S) by six meters (E-W).
A total of 22 black obsidian flakes were recovered. IgSx-002 is on the edge of the same
terrace as IgSx-001, described above. As this location is ideal for a Traditional campsite
(Figure 7), it is likely that more extensive investigations around this site may lead to more
substantial discoveries. Vegetation growth along the trail ensures that surficial detection is
impossible and shovel testing is necessary. On the other hand, if the river has eroded much
of the bank away, the more substantial site may have already been carried away by the
water and that this site represents the periphery of what was once a larger Traditional camp.
Of course, this could also be a one time event on a well used trail and nothing more. In any
case, this site along with IgSx-001 and IgSx-003, shows that this trail had been in use before
European contact.
The subsurface material is comprised of approximately two to three centimeters of
brown sandy soil. Below this, to a depth of at least 22 centimeters, is light brown sandy soil
matrix with many pebble and cobble size rocks.
IgSx-003 Sandpile Creek 2
Despite a relatively high degree of investigation (compared to IgSx-001 and IgSx-002),
this site only yielded four flakes. With so little cultural material found, it is difficult to
determine the exact nature of this site. However, its location less than one kilometer from
the large site of IgSx-004 (Sandpile Camp), on a well defined trail at the edge of the first
terrace above the river (Figure 8) suggests that it may be part of a regular travel route for
hunting or other resource gathering. Its proximity to Sandpile Camp may suggest that these
four flakes may be the result of a single event such as sharpening a tool; perhaps during a
foraging expedition from the larger site. Unfortunately, without datable material or context,
such a hypothesis is not testable.
Shovel tests indicate that the stratigraphy is intact. The upper two to four centimeters
is dark brown sandy soil (root layer). Below this, to an unknown depth (at least 50 cm), is
light brown sandy soil matrix with many pebble to cobble size rocks.
The site is approximately 26 m from the high water cut bank of the Turnagain River.
Kaska Dena Northern Rockies Archaeological Project Final Report, June 11, 2001
Kaska Dena Council Page 30

Kaska Dena Northern Rockies Archaeological Project Final Report, June 11, 2001
Kaska Dena Council Page 31

Kaska Dena Northern Rockies Archaeological Project Final Report, June 11, 2001
Kaska Dena Council Page 32

The slope of the land is between 0˚ and 5˚ and an aspect of 359˚. The approximate extent of
the site is twelve meters (N-S) by three meters (E-W).
IgSx-004 Sandpile Camp (Turnagain Outfitter Lodge)
This site was found entirely by accident while not entirely unexpected. The project
field crew used the abandoned cabins as a base camp for the entire period of field testing.
While there, we were joined for several days by members of the Kaska Dena community as
well as officials from the Provincial and Federal governments attending the Kaska Dena Main
Table Meeting, July 8 to July 14.
Situated on the northwest bank of the Turnagain River, this site is above normal
spring run off levels (approximately 50 m, Figure 9) evidenced by the river cut bank. The
area is largely level (between 0˚ and 5˚) and probably was so even before the airstrip was
built. The aspect of this area is 359˚. The selection of this location for the airstrip and
outfitter’s lodge was probably due to the relative flatness of the locale. The use of the
outfitter lodge has resulted in an amount of exposed ground (i.e. not covered by vegetation)
not encountered anywhere else in our investigations this summer.
Additionally, since the first finds, several evening hours were spent by the crew and
the many visitors to the camp looking for more artifacts. Many of the visitors to the camp
were very eager to look for and find artifacts at the site after learning how to identify them.
Unfortunately, not all visitors were able to precisely relocate where they found a particular
artifact after bringing it to my attention upon my return to camp each afternoon. However,
the numerous surface scatters of flaked stone made it possible to estimate the likely origin in
conjunction with the collectors’ descriptions.
It was difficult to maintain a control on where many of the artifacts were coming
from. Often, a visitor would find something in the morning after the crew left camp. By the
time we returned in the afternoon, the individual had forgotten exactly where the item was
found. To curb this situation, a grid was laid out over the entire camp area covering the
furthest extents of reported artifact finds, approximately 120 m x 240 m. Stations were placed
at 20 meter intervals to aid mapping and for placing shovel tests (Figure 9). It was felt that
Kaska Dena Northern Rockies Archaeological Project Final Report, June 11, 2001
Kaska Dena Council Page 33

Kaska Dena Northern Rockies Archaeological Project Final Report, June 11, 2001
Kaska Dena Council Page 34

placing stations closer together would become a hazard to the many visitors (over 18)
walking around the area.
After digging fifteen shovel tests (on July 13), I realized that we would have more
success and a higher discovery rate if we made an intensive surface survey based on our grid
layout. Also, by abandoning the shovel tests we would be preserving what little intact
subsurface material there may be. After all, the location is already designated an
archaeological site by the identification of artifactual material on the surface. Not to mention,
the primary goal of this field testing was simply to locate sites. By doing this we were able to
distinguish five concentrations of lithic scatters on the surface.
The largest and most productive of the lithic scatters is at the proximal end of the
airstrip. Not satisfied with the results of our surface survey approach, I decided that we
should return to shovel testing on July 22 to determine how much of this site remains intact
and whether or not there were definable extents to any intact remains. Again, this approach
was quickly abandoned after consecutively digging nine sterile shovel tests north of the
corral and at the proximal end of the airstrip, which appeared to have the highest artifact
density. We were still only finding artifacts on the surface rather than in any of our shovel
tests.
Shovel tests were not dug to a specific depth but were dug to a depth at which gravel
and rocks were encountered. In some cases, such as those shovel tests between 0E/0N,
0E/40N, 80E/0N and 80E/40N, this was as deep as 53 cm. Most other shovel tests reached
gravel and rocks about 20 cm. In the deeper shovel tests, light brown/yellow sandy soil
extended from the surface to approximately 20 cm below the surface. Fine grey sand
extended from approximately 20 cm b.s. to about 30 cm b.s.. From approximately 30 cm b.s.
to 43 cm b.s. is another layer of light brown sandy soil. Below this is approximately 10 cm of
grey coarse sand which grades into gravel and large rocks to an unknown depth.
There was so much material on the surface that to collect it all would have taken a
concentrated effort over many days. Therefore, most of the surface material was observed
and left in situ for future examination while the bulk of the material that was recovered was
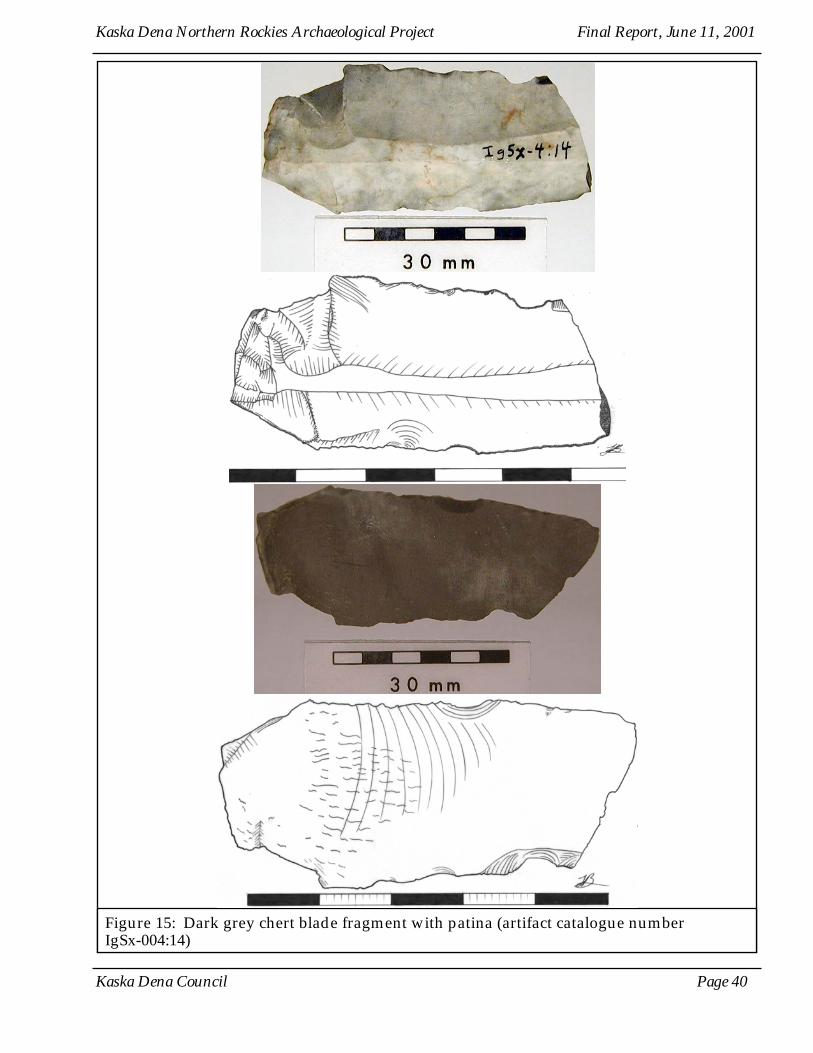
collected by visitors to the camp. Among the numerous flakes were seven tools and biface
Kaska Dena Northern Rockies Archaeological Project Final Report, June 11, 2001
Kaska Dena Council Page 35

fragments (Figures 10-16, drawings by Judith Bannerman, see Appendix C for artifact
descriptions). No artifacts were found along the river cut bank nor on any of the exposed
ground between the river and the cabins.
Kaska Dena Northern Rockies Archaeological Project Final Report, June 11, 2001
Kaska Dena Council Page 36
Figure 10: Black obsidian biface fragment (artifact catalogue number IgSx-004:09).

Kaska Dena Northern Rockies Archaeological Project Final Report, June 11, 2001
Kaska Dena Council Page 37
Figure 11: Black obsidian thumbnail scraper (artifact catalogue number IgSx-004:10).
Figure 12: Grey chert biface fragment (artifact catalogue number IgSx-004:11).

Kaska Dena Northern Rockies Archaeological Project Final Report, June 11, 2001
Kaska Dena Council Page 38
Figure 13: Dark grey chert thumbnail scraper with patina (artifact catalogue number IgSx-004:12)

Kaska Dena Northern Rockies Archaeological Project Final Report, June 11, 2001
Kaska Dena Council Page 39
Figure 14: Light brown/grey chert thumbnail scraper (artifact catalogue number IgSx-004:13)
Kaska Dena Northern Rockies Archaeological Project Final Report, June 11, 2001
Kaska Dena Council Page 40
Figure 15: Dark grey chert blade fragment with patina (artifact catalogue number IgSx-004:14)

IgSx-005 Mosquito Creek 1
Twenty-one shovel tests resulted in three that yielded artifacts from this site (Figure
17). All the artifacts were found approximately two to three centimeters below the surface or
just under the vegetation mat. This site is on a well used game trail that may have also been
used as a horse trail by the Turnagain outfitter. Unlike the other sites described here, this site
is about 275 meters away from a water source. The slope of the site area is between 0˚ and 5˚
and an aspect of 359˚. The approximate extent of the site is eight meters (N-S) by ten meters
(E-W).
This area was pointed out to us by the project informant as an ideal hunting camp site.
The location on a terrace, with views up the Turnagain and Major Hart Rivers, a steep bluff
behind and along well traveled trail, is ideal for spotting game on an extended hunt.
Only five obsidian and chert flakes were recovered from the shovel testing. Soil
development on this site is poor with very rocky gravel near the surface. Overlaying the
Kaska Dena Northern Rockies Archaeological Project Final Report, June 11, 2001
Kaska Dena Council Page 41
Figure 16: Dark grey chert microblade(?) fragment (artifact catalogue number IgSx-004:15).

Kaska Dena Northern Rockies Archaeological Project Final Report, June 11, 2001
Kaska Dena Council Page 42

gravel is approximately two to three centimeters of rocky, dark brown/red sandy soil.
There were no surficial signs of human activity at this site. Therefore, this site most likely
represents a temporary stop during a subsistence trip.
IgSx-006 Mosquito Creek 2
Overlooking the confluence of the Major Hart River (Mosquito Creek or Bridge
Creek) and Hidden Valley (Charcoal Flats) Creek, this site was also identified by the project
informant as an ideal hunting camp location (Figure 18). The site is approximately 90 m from
the Major Hart River as the closest water. The slope of the land is between 0˚ and 5˚ and an
aspect of 359˚. The approximate extent of the site is five meters (N-S) by five meters (E-W).
Dennis Porter also pointed out that a traditional camp site and graveyard were located on the
opposite side of Major Hart River, directly across from the mouth of Hidden Valley Creek.
Unfortunately, we were unable to make it across the river that day to test the area and failed
to return later to do any subsurface testing.
Only two flakes were found in one shovel test. A total of five shovel tests were made
to try and determine site extent but no more artifacts were recovered. Shovel testing
indicates that the first two to three centimeters is dark brown soil. Below this to an unknown
depth is fine to medium grain red/brown sandy soil matrix with a high quantity of cobble
size rocks.
IgSx-007 Mosquito Creek 3
A scraper made of black streaked, grey/green obsidian (Figure 19) and a black
obsidian flake found on the surface by the project informant prompted shovel testing at this
location (Figure 18). Two chert flakes were then found in one shovel test in the trail. This
location is similar to IgSx-006 but does not have a view to Hidden Valley Creek. The site is
approximately 110 m from the Major Hart River. The slope of the land is between 0˚ and 5˚
and an aspect of 359˚. The approximate extent of the site is ten meters (N-S) by five meters
(E-W).
Under the root layer is approximately two to four centimeters of fine black soil.
Kaska Dena Northern Rockies Archaeological Project Final Report, June 11, 2001
Kaska Dena Council Page 43

Kaska Dena Northern Rockies Archaeological Project Final Report, June 11, 2001
Kaska Dena Council Page 44

Below this, to an unknown depth, is fine to medium grain red/brown sandy soil matrix with
many cobble size rocks.
Preliminary Model
The test of the preliminary model against the inventory of known archaeological sites
showed that the model performed inconsistently over the range of likelihood scores. The
locations of sites were unevenly distributed among the potential areas. Of the 201 known
sites in the test inventory, 30 (14.93%) were in the low potential zone (score of 0). Only three
sites (1.49%) were located in zones determined to have a medium likelihood (scores of 1-3)
Kaska Dena Northern Rockies Archaeological Project Final Report, June 11, 2001
Kaska Dena Council Page 45
Figure 19: Grey/green mottled obsidian scraper (artifact catalogue number IgSx-007:03).

and 168 sites (80.38%) were located in high likelihood zones (scores of 4-6). This appears that
the model performed well in identifying areas of high potential for locating archaeological
material but performed poorly in identifying areas with low and medium potential.
However, if we look at the land area covered by each of the low, medium, and high potential
areas, we see that the low potential area accounts for 0.59% of the study area. Medium
potential areas cover only 17.05% of the study area and the high potential areas cover 82.36%
(Figure 20).
By comparing the percentage distributions of land area with the number of sites we
see that the model actually performed poorly in identifying areas of high potential. That is to
say that 80.38% of known sites are located in 82.36% of the study area, suggesting the model
has no predictive strength for this level of likelihood. This figure appears to coincide with the
expected outcome of a random site distribution. Conversely, with regard to medium
potential areas, only 1.49% of sites are located in 17.05% of the study area. Similarly, in the
case of low potential areas, an astounding 14.93% of sites are located in 0.59% of the study
area. Even without further statistical testing, we can see that something significant is
occurring in the low potential areas. Clearly, these areas of “low” potential are anything but
low potential. We can look at these distributions at the sub-category level as well.
Kaska Dena Northern Rockies Archaeological Project Final Report, June 11, 2001
Kaska Dena Council Page 46
70.00%65.00%60.00%55.00%50.00%45.00%40.00%35.00%30.00%25.00%20.00%15.00%10.00%
5.00%0.00%
Likelihood Score
0 1 2 3 4 5 6
Area
All Sites
Figure 20: Comparison of land area to known site frequencies.

The low (0) zone accounts for 0.59% of the study area and contains 14.93% of known
sites, as previously mentioned. The low-medium (1) zone contains 0.50% of sites and covers
0.48% of the study area. One percent of the sites are located in the medium-medium (2) zone
which covers 15.20% of the study area. No sites (0.00%) are located in the 1.37% of the study
area designated as high-medium (3) potential. More than half of the known sites (53.23%)
are located in the zone designated as low-high (4) potential; covering 67.97% of the land
area. The medium-high (5) zone covers 4.76% of the area and contains 6.97% of the sites. A
summary of this information is in Table 3.
If we look at these distributions by site class, we see a similar pattern of distribution
among all four site classes (Figure 21). This information is summarized in Table 4.
The unexpectedly high number of sites in the low zone merits further investigation.
These sites are split evenly between the prehistoric and historic site classes, suggesting that
there may be an important continuity of occupational practices before and after European
contact. However, we must be prepared to accept the possibility that these prehistoric sites
may also represent very late sites. In such a case, the occupants may have already been
engaged in the new fur trade economy, accounting for their location. If so, the inhabitants
had not yet adopted European style goods or building techniques which would have lead the
site recorders to a prehistoric site designation. In order to assess this possibility, each site
would have to be evaluated individually against this hypothesis.
Kaska Dena Northern Rockies Archaeological Project Final Report, June 11, 2001
Kaska Dena Council Page 47
Likelihood Score 0 1 2 3 4 5 6
Area 0.59% 0.48% 15.20% 1.37% 67.97% 4.76% 9.63%
All Sites 14.93% 0.50% 1.00% 0.00% 53.23% 6.97% 23.38%
Percentages of area and number of sites in each of the likelihood categories.
Table 3

Kaska Dena Northern Rockies Archaeological Project Final Report, June 11, 2001
Kaska Dena Council Page 48
Likelihood Prehistoric Sites Historic Sites CMTs Other Sites TOTALS
Low (0) 6.97% 6.97% 1.00% 0.00% 14.93%
Low-Med (1) 0.50% 0.00% 0.00% 0.00% 0.50%
Med-Med (2) 0.00% 1.00% 0.00% 0.00% 1.00%
Hi-Med (3) 0.00% 0.00% 0.00% 0.00% 0.00%
Low-Hi (4) 23.38% 25.87% 1.49% 2.49% 53.23%
Med-Hi (5) 5.47% 1.00% 0.00% 0.50% 6.97%
Hi-Hi (6) 12.94% 10.45% 0.00% 0.00% 23.38%
Likelihood score frequencies by site class.
Table 4

Evaluation and Discussion
Field Testing
The two principal goals of the 2000 field season were to test the preliminary predictive
model with a statistically valid random sample and to evaluate the effectiveness of
incorporating Traditional Use information in the practice of archaeological survey. The
methodology used to achieve the former goal was intended to ensure the equivalent level of
investigation in each of the likelihood areas. And, in this way, avoid the tendency of
researchers to look harder in places where they expect to find something and to not look as
hard in areas where they do not expect to find anything. As for the latter goal, an
unrestricted methodology of judgmentally testing areas identified by the project informant
as areas of Traditional Use was employed. The third goal of this season’s field work was to
train interested individuals from the Kaska community in the skills used during typical
archaeological survey work. To this end, anyone and everyone who was interested was
invited to join the project.
One of the major issues with the field testing conducted in the 2000 field season is the
inadequate size of the field crew. The result of this was that we were unable to complete a
useful number of test quadrats in order to evaluate the model with new data. Had we been
successful in recruiting a sufficient number of people for three crews of three people, as it
was originally hoped, we would have been able to test at least 18 quadrats in two weeks
(assuming testing at the same rate described earlier). This would have only been three
quadrats short of the goal of 21 for this season.
Clearly, in the future, recruiting must begin in earnest earlier and prior to the field
season. Additionally, unlike the southern parts of British Columbia and Alberta, where
people are willing to pay for the experience freely offered by the Kaska Dena Northern
Rockies Archaeological Project (KDNRAP), it was apparent that people were unwilling and
unable to commit their time to the project unless wages were paid in addition to the food,
travel and accommodation offered. Future project proponents should take this into
consideration and budget accordingly. Part of the reason why people may have been
Kaska Dena Northern Rockies Archaeological Project Final Report, June 11, 2001
Kaska Dena Council Page 49

reluctant to participate in the KDNRAP is a general unfamiliarity with the purpose and value
of archaeological research in general and as it applies to this area in particular. Another
reason for the poor recruitment rate of participants was certainly due in part to the
unexpected loss of the KDC Vice Chair overseeing the project. This resulted in the failure of
notices and advertisement being placed in Kaska communities calling for individuals
interested in the project. Unfortunately, I was unaware of this until I arrived at Lower Post
to begin the field study. Therefore, our recruitment period ended up being only one week
rather than the expected minimum of six weeks previously planned.
Further to the field survey problem was that of the six quadrats tested, four were in
the High potential zone, one was in the Medium potential zone and one was in the Low
potential zone. Clearly, this sample is not statistically valid and its usefulness extremely
limited. This lopsided sampling is directly attributable to my own overly optimistic view of
how productive our three person crew would be coupled with my short sighted assessment
of how much time in the field we would be allowed.
Another shortcoming with the random sampling methodology was the shovel test
intervals. The choice of shovel test intervals at 20 meters was intended to strike a balance
between needlessly over testing low potential areas and under testing high potential areas.
This choice was duly influenced by my experience with archaeological surveys in the Central
Interior Plateau region of British Columbia. This interval, in conjunction with the
examination of any exposed ground encountered, as previously outlined, was felt to be
sufficient to locate any sites in a quadrat. Retrospectively however, it is clear that the 20
meter interval chosen is not sufficient to locate most of the sites that may be present in a 100
m x 100 m quadrat. As others have noted, small site size and low site density make it difficult
to locate sites using this random sampling method (McCullough & Fedirchuk 1991, Mitchell &
Eldridge 1983, Wilson 1984). Having said that, I feel that it is necessary to use this or a similar
method to ensure consistent testing in all the potential zones, as noted previously.
In a telephone conversation with Keary Walde (an archaeologist who has worked
very close to the study area for many years), it was suggested that the typical site density
and size in this area is such that random test intervals of five meters is necessary in order to
Kaska Dena Northern Rockies Archaeological Project Final Report, June 11, 2001
Kaska Dena Council Page 50

ensure the location of just 15% of the sites in a 100 m x 100 m quadrat in a high potential
location. This interval raises the number of shovel tests per quadrat from 36 to 441! At the
rate of 2.33 days per quadrat of 36 shovel tests achieved by our three person crew, each
quadrat of 441 shovel tests would have taken 28.54 days. The six quadrats tested this season
would have taken 171.26 days.
Even at our most productive rate, each quadrat of 441 shovel tests would have taken
12.25 days. Under ideal conditions with the originally hoped for three crews of three people,
we would have only completed 3.43 quadrats of 441 shovel tests in the two weeks spent
employing the random sampling methodology. The four week total of our time in the field
would have resulted in 6.86 quadrats being tested (that’s 3024 shovel tests!).
Of the 251 shovel tests we dug over a four week period, only 11 resulted in cultural
material. The combined productivity of both the random sampling and informant directed
methodology gave a positive return of 4.38%. Looking at each methodology separately we
see that the random sampling method results in a positive return of 1.29% while the
informant directed method nets a return of 9.38%. While the informant directed judgmental
testing provided us with a return over seven times greater than random testing, the
overwhelming majority of shovel tests are sterile. This leads to a motivational problem.
The quality of any archaeological survey is as much due to the attentiveness of those
conducting the survey as it is the survey strategy. Without continued interest and attention
of the survey crew, small artifacts can be easily missed in a hastily performed shovel test.
The use of screens helps to maintain some consistency in this process but the reality of the
situation is that much may still be overlooked without due care and attention. This problem
can be particularly acute when the soil is moist and does not screen well, requiring additional
time and effort to break up clumps.
As the project director, I endeavoured to remain positive about the possible outcome
of each of our shovel test locations. By presenting a positive expectation to my comrades, I
sought to keep their motivation level high (and subsequently the quality of work) in spite of
the difficult and often disappointing conditions. This was not particularly easy on those days
that were cold and wet. However, since this was a research project with some degree of
Kaska Dena Northern Rockies Archaeological Project Final Report, June 11, 2001
Kaska Dena Council Page 51

flexibility, we had the luxury of not digging on the more rainy days. But, with only finding
artifactual material in only 11 of the 251 shovel tests dug, it is challenging to maintain a
continuously plausible appearance of hopeful expectation.
Consider the case of CRM surveys. In this situation, crews must survey a prescribed
area of land in a specified time frame. This often means that crews do not have the luxury of
sitting out rainy or even snowy days. Add to this the need for long working periods with
little time off in order to get as much work done in the very short field season afforded by
the climate of northern British Columbia. At some point motivation inevitably becomes a
factor in the quality of work being performed.
If we look at our ideal shovel test frequency above (5 m intervals) and allow them to
be placed judgmentally (with an observed return of 9.38%) in the 6.86 quadrats over a four
week period, our hypothetical crews would get 284 shovel tests with cultural material.
However, they would also dig 2740 sterile ones! In the CRM world, many of these shovel
tests would be done under unpleasant conditions adding to the potential for missed sites due
to inattentiveness.
Certainly, this situation is not unique to this study area and is partly responsible for
archaeologists’ attempts at predictive modeling elsewhere. The desire to maximize one’s
returns for time spent in the field is great. Add to this the danger to an already scarce
cultural heritage resource if sites are missed during CRM work and the stimulus to develop a
useful and accurate predictive model becomes imperative.
Predictive Modeling
The first question that should be asked about predictive models is “why create them in
the first place”. As we have seen above, the conditions under which archaeology is practiced
necessitates it. From the archaeologist’s perspective the goal of a predictive model is either
to reduce the amount of field survey required to find sites or to explain why sites are located
where they are. With this in mind, the goal of the model presented here is to enable
archaeologists to design their survey strategy more effectively and in turn spend less time in
the field digging sterile shovel tests in favour of more shovel tests delineating site extents and
Kaska Dena Northern Rockies Archaeological Project Final Report, June 11, 2001
Kaska Dena Council Page 52

types. Eventually, this should translate into more value per dollar spent on CRM and
archaeological research.
From the land manager’s perspective, the goal of an archaeological predictive model is
to identify areas that should be avoided or to identify how much archaeological investigation
will be required in a particular parcel of land. The model presented here is intended to
provide land managers with just this kind of information. Primarily, it is intended to
highlight those areas in which cultural heritage resources are likely to be found. In other
words, to provide land managers and project developers with “red flags” where they should
be particularly concerned with regard to minimizing the potential impact on as yet unknown
resources. By identifying such areas, managers and developers will be able to seek
consultation with First Nations people and archaeologists earlier in the planning process,
thereby reducing possible costs of mitigation or redesigning a project later on.
From the perspective of First Nation’s interests, access to such a model would enable
them to evaluate an appropriate level of concern regarding development proposals affecting
areas of interest to them. By having this informational tool at hand, First Nations leaders will
not have to wait for, nor totally rely on, outside reports in order to form an opinion on and
development proposal early in the process. This will enable them to more fully participate in
the land management process. However, it should be kept in mind that such modelling can
only deal with material remains and can not identify areas of particular spiritual importance.
In the case of the current study area where there is little published information, the
creation of a predictive model must begin with the available CRM reports. The descriptions
of what the report authors view as likely site locations are cobbled together to create a
generalized intuitive model. Out of this, operationalized criteria must be chosen and
quantified. The most common of these criteria are: “elevation, slope, aspect, and distance to
water” (Dalla Bona 1993:16). While three of these most common criteria are used in the
model presented here, elevation is not used as a predictive criterion for two reasons. Firstly,
elevation was not noted to be a recurring factor mentioned in the reports reviewed before
commencing this project. Secondly, elevation was seen to be a redundant variable for the
terrain. Proximity to water was regarded to have the most predictive weight. In the
Kaska Dena Northern Rockies Archaeological Project Final Report, June 11, 2001
Kaska Dena Council Page 53

northern Rockies, the general steepness of the land ensures that water is shed relatively
quickly and accumulates in stream channels. These stream channels appear primarily (at
least on 1:250, 000 maps) on the lower and flatter valley slopes. To have modelled this
elevation related situation would have added much more work that would have outweighed
any additional predictive power.
In the place of elevation, the proximity to trails criterion was used. Since one goal of
this project was to evaluate the incorporation of TNK in archaeological investigation, one
small mappable aspect was chosen to approximate this knowledge. Trails were identified in
several reports as being the most readily identifiable and valuable sources of site location
information provided by First Nation informants (Friesen 1983, Ham 1987, 1988a, 1988b, Loy
1977).
The slope steepness criterion appears to require little explanation, at first. After all,
people do not typically occupy cliffs. And, if they were to, it is unlikely that anything more
than a visual inspection a short distance away would reveal the evidence of such an
occupation. Certainly, no archaeologist would conduct subsurface testing on a cliff face
during a routine survey. Not to mention that as yet, there is no evidence for human cliff face
occupation at any time in British Columbia. However, while everyone will agree that there
are slopes that are “too steep” to be considered likely site locations, few have ventured to
quantify what they mean by “too steep”. Therefore, the chosen thresholds for the low,
medium and high likelihood levels were determined using the figure of 30˚ as the absolute
upper limit for slopes that may be safely traversed and shovel tested (i.e. slopes steeper than
30˚ are unstable) during the course of an ordinary survey (Plummer & McGeary 1991:223,
Selby 1985:230-236).
During the field portion of this project several steeper slopes were measured with a
clinometer to gauge what we considered as “too steep”. Figure 22 shows a 30˚ slope at the
test quadrat MedQuad2 and Figure 23 shows a 34˚ slope we had to traverse en route to
LowQuad2. We felt very unsafe standing on the 30˚ slope which dropped very quickly to a
near vertical rock face. Digging shovel tests on such a slope would have been unwise and
was therefore not continued. We did not walk so much as crawl up the 34˚ slope pictured in
Kaska Dena Northern Rockies Archaeological Project Final Report, June 11, 2001
Kaska Dena Council Page 54

Figure 23. Despite a relatively sound blanket of vegetation stabilizing the slope, each of our
footsteps propelled us only a few centimeters forward as the ground slumped under our
weight. Without a doubt, slopes over 30˚ are too steep. Perhaps the absolute predictive
Kaska Dena Northern Rockies Archaeological Project Final Report, June 11, 2001
Kaska Dena Council Page 55
Figure 22: 30˚ slope at MedQuad2.
Figure 23: 34˚ slope.

threshold for slope should be less than 30˚.
As a predictive criterion, aspect seeks to indicate the climatic suitability of a particular
area for occupation. Southern facing slopes are regarded as the ideal aspect in the northern
hemisphere, especially with respect to providing the most sunlight in the winter months.
This model reflects this view in the threshold divisions chosen for slope aspect. However, the
general northwest-southeast tendency of the major valleys in this area may have imposed
another, unidentified, ideal aspect on past inhabitants. In this case, slopes that face the
southwest would be chosen more often because they are simply more abundant than
southern facing slopes on major travel routes. Similarly, northeast facing slopes would be
the least ideal as they would be on the opposite side of the valley from the sought after
southwest facing slopes.
The proximity to water criterion is greatly generalized in this model for the sake of
simplicity. The fact remains that different classes of water have varying impacts on the
likelihood of finding a site. For example, water that represents a large meandering river may
not truly have higher site potential closer to it. While past humans may have indeed sought
to inhabit the banks of such rivers, the ever changing course of the river constantly erodes
and redeposits the bank sediments. As a result, sites are washed away and artifacts are
redeposited according to their shape and size just like any other debris carried by the stream.
Additionally, smaller streams that appear on the map as permanent water courses may be
ephemeral or seasonal in reality (Dalla Bona 1993:82). In this case, areas adjacent to such
streams would get a false higher likelihood score.
Additionally, not all water bodies have equal predictive weight with regard to
seasonal site distributions. As mentioned previously, fish were a very important winter
resource. Therefore, fish bearing lakes and swamps would have a higher predictive weight
for winter campsites than sloughs or shallower swamps that could not support a large
enough fish population through the winter. Identifying and distinguishing these differences
for an area the size of the one addressed here is just short of a monumental task.
One of the problems with this preliminary model is that the thresholds for each
weighted criterion were arbitrarily based on reported qualitative descriptions such as ‘too
Kaska Dena Northern Rockies Archaeological Project Final Report, June 11, 2001
Kaska Dena Council Page 56

steep’ and ‘near water’. Clearly from the results presented here some work needs to be
done in identifying appropriate thresholds for these criteria and the possible inclusion
different criteria. One way of doing so would be to profile the geographic status of each of
the known sites and to calculate correlation coefficients for use in a discriminant function
capable of producing real statistical probabilities for the model.
Other criteria may also be used for calculating likelihood scores. These data may
include the ranges of particularly important resources or soil types, where this information is
available at a sufficient scale.
The reliability of a model depends on the accuracy of the data on which it is based.
Where the order and class of streams is important it is also important to verify map data. In
the KDNRAP model, proximity to water is very important; leading to many areas being
identified as having a higher potential than they actually do as a result of no distinction being
made between seasonal and permanent streams or other bodies of water. Additionally,
important locations such as the margins of swamps or sloughs are not identified through the
non-distinction of such water features. A similar case may be made for those trails that
appear on maps as trails but are actually remnants of more recent activities such as bulldozed
fire line breaks.
A note of caution concerning the use of the current model by those in decision making
positions with regard to land management: “If models must be built without the benefit of a
probabilistic sample, they should not be used for serious planning purposes until they have
been validated or revised according to rigorous sampling procedures” (Moon 1993:10). This
preliminary model still requires extensive testing in the field and currently serves as a
generalized “heads up” for those responsible for land altering project proposals.
An additional point may be raised concerning a predictive model supplanting archaeological field work. As an academic modelling exercise, the negative implications of a poor model are relatively minor. However, in the cultural resource management arena, the implications of applying a poorly tested model could be substantially negative. [Dalla Bona 1993:41]
It should be noted that for the near future, consultation with archaeologists will be necessary
to ensure the protection and preservation of cultural heritage resources. This model aims to
make that consultation process a more balanced exchange.
Kaska Dena Northern Rockies Archaeological Project Final Report, June 11, 2001
Kaska Dena Council Page 57

Recommendations
Since the project was not able to fulfill the goal of effectively evaluating the
incorporation of TNK this past season, an effort should be made for future archaeological
research to begin with discussions with knowledgeable Kaska well before the onset of the
field season. In this way, the focal areas of field work can be determined in advance and
logistical planning can take into account these pre-identified areas of interest. This point is
key in that much valuable time can be wasted in the field deciding where to go next.
Judgmental shovel test placement should continue to dominate the TUA testing
methodology but these areas should be tested more rigorously. For example, a previously
determined minimum number of shovel tests should be placed within a defined area. The
area defined for each identified TUA could be determined in the field in discussion with an
accompanying informant. Shovel test intervals within this defined area should be between
five and ten meters over the entire area. Intervals of one meter should be used around
shovel tests which yield cultural materials in order to identify site extent.
As for the predictive model, it is clear that several iterations of model refinement and
field testing are required before managers will be able to use it confidently for informing
management decisions.
Modelling is a cyclical process of ongoing refinement, rather than a one-time event, and thus models cannot be developed by archaeologists and then simply “turned over” to land managers for “application”. Predictive modelling is potentially the most cost-effective way to combine sound management practices with valuable research programs (Judge/Martin 1988:580). [Moon 1993:33]
However, the current model is useful to stakeholders of the Muskwa-Kechika Management
Area in that it provides at least some frame of reference with which they can form their
discussions with their archaeologist consultants. “[O]ne cannot expect a model to be
simplistic in its makeup or to be developed in a single effort” (Dalla Bona 1993:37).
To this end, future model refinements should include data based criterion thresholds.
The criteria used to form the model should not only come from a generalized intuitive model
as it is here but also from correlations of site locations with TUA. In so doing, mappable
resources identified as being important to Traditional activities can be identified and
Kaska Dena Northern Rockies Archaeological Project Final Report, June 11, 2001
Kaska Dena Council Page 58

incorporated into the model.
Criteria based on terrain data must be derived from base information at a scale of
1:50,000 or smaller. The scale used in this project was insufficient to identify important
features such as the bench occupied by the sites IgSx-001, IgSx-002, IgSx-003, IgSx-006 and
IgSx-007. The relatively poor resolution of smaller important features was the impetus for
choosing a composite score system of likelihood calculation. With better terrain resolution a
discriminant function should be used to calculate the site location potential of land areas. By
using a discriminant function, areas that have a criterion value which overrides the values of
the other criteria can determine the category classification of a parcel of land. For example,
for slopes that are determined to be ‘too steep’ it does not matter whether or not that
particular area scores high in all the other criteria. Because of the slope alone, this area will
not be tested and will therefore have a low potential for the discovery of an archaeological
site. The model presented here is unable to account for this situation which is undoubtedly
partly responsible for the high amount of land area designated as high potential. This one
change alone should significantly improve the predictive strength of the model presented
here. Of course, the development of such a discriminant function is dependent upon the
afore mentioned data based correlations.
Randomized field testing of the model should continue to be the same for all the
potential zones but the shovel test intervals should be shortened from 20 m to 10 m within
100 m x 100 m quadrats. While it was previously identified that 5 m intervals would be ideal,
it was also shown that this interval would create a massive increase in the work required.
Therefore, an interval of 10 m is recommended as a compromise between the inadequate 20
m interval and the unwieldy 5 m interval. Upon discovering cultural material in a shovel test,
an interval of 1 m should be used to determine the site extent.
Water features used as criteria in the model should be separated into appropriately
weighted classes. As previously discussed, smaller and seasonal streams should have little or
no predictive weight while fish bearing lakes should be considered as important predictors.
Ultimately, there will come a point in the modelling process where there ceases to be
any significant improvement in predicting site locations. However, models which seek to
Kaska Dena Northern Rockies Archaeological Project Final Report, June 11, 2001
Kaska Dena Council Page 59

explain why such predictions work could go on ad infinitum. In the mean time, other
archaeologists with experience in the northern Rockies area should be invited to test this
model during their future field investigations.
With regard to community involvement in future projects, effort and budgeted funds
should be put toward informational sessions in communities within the study area. Not only
will this provide information to interested individuals but may also stimulate important
spontaneous feed back on areas which may be of particular concern to residents. These areas
may or may not have already been identified in previous Traditional Use studies. In the case
of those areas that have been previously identified, spontaneous feedback could reinforce
their perceived importance or illuminate new aspects of their importance. Feedback on areas
that have not been previously identified in Traditional Use studies can identify areas of
possible future investigation.
Information sessions will also aid in the recruitment of individuals interested in taking
part in future field research. Similarly, questions regarding the purpose and value of taking
part in the research can be answered immediately. Additionally, by providing local
information sessions on the research being conducted in their area, informed residents can
form a sense of ownership of the research and in turn continuously monitor the scarce
archaeological resources.
Kaska Dena Northern Rockies Archaeological Project Final Report, June 11, 2001
Kaska Dena Council Page 60

References Cited
Apland, Brian C.1980 Preliminary Archaeological Study of the Proposed Stikine/Iskut Hydroelectric
Development, Permit No. 1979-29, Draft Report. Calgary: Aresco Ltd.
Balcom, Rebecca J.1986 Heritage resources Impact Assessment Mount Klappan Coal Property. Permit
1985-8. Calgary: Aresco Ltd.
Bobrowsky, Peter and Nathaniel W. Rutter1992 The Quaternary Geologic History of the Canadian Rocky Mountains.
Géographie Physique et Quaternaire 46(1):5-50.
Dalla Bona, Luke R.1993 A Predictive Model of Prehistoric Activity Location for the Souris River,
Saskatchewan. Unpublished Masters thesis. Winnipeg: Department of Anthropology, University of Manitoba.
Eldridge, Morley1983 Archaeological Salvage Investigations at IiSk-3: The Devil’s Gorge Quarry Site.
Permit 1981-30.
Eldridge, Morley and Alexander Mackie1993 Predictive Modelling and the Existing Archaeological Inventory in British
Columbia. Non-permit report prepared for Archaeology Task Group of Geology, Soils, and Archaeology Task Force Resources Inventory Committee. Sidney: Millennia Research.
French, Diana E.1980 Preliminary Assessment of Heritage Resources in the Telegraph Creek Land
Management Area of Northwestern British Columbia. Permit 1978-7.
Friesen, David E.1983 Archaeological Investigations of the Upper Stikine River Basin and Spatsizi
Plateau Region, Northwestern British Columbia. Permit 1982-10. Calgary: Department of Archaeology, University of Calgary.
1985 Aboriginal Settlement Patterns in the Upper Stikine River Drainage, Northwestern British Columbia. Unpublished Masters thesis. Calgary: Department of Archaeology, University of Calgary.
Gadd, Ben1995 Handbook of the Canadian Rockies, Second Edition. Jasper, AB: Corax Press.
Godfrey, W. Earl1976 The Birds of Canada. Ottawa: Minister of Supply and Services Canada.
Greer, Sheila C.1997 Traditional Knowledge in Site Recognition. In At a Crossroads: Archaeology
Kaska Dena Northern Rockies Archaeological Project Final Report, June 11, 2001
Kaska Dena Council Page 61

and First Peoples in Canada. George P. Nicholas and Thomas D. Andrews, eds. Pp 145-159. Burnaby, BC: Archaeology Press, Simon Fraser University.
Gunderson, Eric1999 Kaska Dena Heritage Trails Project. Volume One: A Management Plan for
Davie Trail North McDame Trail. Williams Lake: North West Environmental Group Ltd.
Ham, Leonard C.1987a A Detailed Heritage Resource Impact Assessment of the Al Property,
Toodoggone Region, North Central British Columbia. Permit 1987-18. Vancouver: Norecol Environmental Consultants Ltd.
1987b A Detailed Heritage Resource Impact Assessment of the Golden Bear Project Access Road, Telegraph Creek Area, Northwestern British Columbia. Permit 1987-27. Vancouver: Norecol Environmental Consultants Ltd.
1988a A Detailed Heritage Resource Impact Assessment of the Revised Golden Bear Access Route, Telegraph Creek Area, Northwestern British Columbia. Permit 1988-24. Richmond: Norecol Environmental Consultants Ltd.
1988b a Heritage Overview and Detailed Heritage Resource Impact Assessment of the Moon Property, Hackett River, Northwestern British Columbia. Permit 1988-32. Richmond: Norecol Environmental Consultants Ltd.
Hanks, Christopher C. and Barbara J. Winter1986 Local Knowledge and Ethnoarchaeology: An Approach to Dene Settlement
Systems. Current Anthropology 27(3):272-275.
Honigmann, John J.1964 The Kaska Indians: An Ethnographic Reconstruction. Yale University
Publications in Anthropology, Number 51. Washington: Human Relations Area Files, Inc.
Kershaw, Linda2000 Edible and Medicinal Plants of the Rockies. Edmonton: Lone Pine Publishing.
Lawhead, Stephen and Arnoud H. Stryd1987 Cheni Mine Project: Detailed Heritage Resource Inventory and Impact
Assessment. Permit 1987-25. Kamloops: Arcas Associates Heritage Resource Consultants.
Loy, Thomas H.1977 Report of Archaeological Investigations Mile 390 to Mile 514 of the Alaska
Highway, Including Muncho Lake. Permit 1977-25.
1983 An Overview Report Concerning the Archaeology of Muncho Lake, B.C. and Hudson’s Bay Post Fort Halkett: Preliminary Version. Permit 1981-15.
1984 Report of Investigations of Graveyard Lake, B.C.. Victoria, BC: Archaeology Division of the British Columbia Provincial Museum.
Kaska Dena Northern Rockies Archaeological Project Final Report, June 11, 2001
Kaska Dena Council Page 62

Magne, Martin1981 Heritage Resource Inventory and Assessment: The Alaska Highway Gas
Pipeline North British Columbia Segment. Permit 1981-8. Brentwood Bay, B.C.: Aresco Ltd.
McCullough, Edward J. and Gloria J. Fedirchuk1991 Archaeological Overview: Westcoast Energy Inc., Tommy Lakes Project, Permit
1991-91. Calgary: Fedirchuk McCullough & Associates Ltd.
McIntyre, Kenneth G. And Marion Christie McIntyre1983 The Gataga Project: An Overview Assessment Report of Heritage Resource
Investigations Conducted in the Finlay River Valley and Eastward into the Muskwa Range of the Rocky Mountains in North Central British Columbia. Permit 1981-24. Vancouver: Chichimec Research Associates Incorporated.
Mitchell, Donald H. and Morley Eldridge1983 A Heritage Resource Survey in the Liard River Valley. Permit 1981-13. Victoria:
University of Victoria.
Mitchell, Donald H. and Thomas Loy1981 An Overview of Liard River Valley Heritage Resources: A Report Submitted to
British Columbia Hydro and Power Authority. Permit 1979-30. Victoria: University of Victoria.
Moon, Heather1993 Archaeological Predictive Modelling: An assessment. Report prepared for The
Earth Sciences Task Force Resources Inventory Committee. Victoria: Archaeology Branch.
Plummer, Charles C.1991 Physical Geology, Fifth Edition. Dubuque, IA: Wm. C. Brown Publishers.
Selby, M. J.1985 Earth’s Changing Surface: An Introduction to Geomorphology. Oxford:
Clarendon Press.
Simonsen, Bjorn O.1986 Report on the Results of a Heritage Impact Assessment of the Mount Klappan
Coal Project Access Road. Permit 1986-24. Victoria: Bastion Group Heritage Consultants.
Skoda, L., et al1999 Biogeoclimatic Zones of British Columbia, 1999. Victoria: Canadian
Cartographics Ltd.
Soil Classification Working Group1998 The Canadian system of Soil Classification. Ottawa: National Research Council
of Canada.
Van Dyke, Stan
Kaska Dena Northern Rockies Archaeological Project Final Report, June 11, 2001
Kaska Dena Council Page 63

1981 Archaeological Inventory Alaska Highway Pipeline Project Yukon Territory Alignment Studies. Permit 1981-21. Calgary: Lifeways of Canada Ltd.
Van Dyke, Stan and Barney O. K. Reeves1978 Historical Site Reconnaissance, 1977 Alaska Highway Gas Pipeline Route,
Province of British Columbia. Permit 1977-37. Calgary: Lifeways of Canada Ltd.
Walde, Keary1988 Heritage Resources Impact and Inventory Assessment Raspberry Creek Gravel
Pit Locality, NTS Map Sheet 94J/14 (Min. Lands File #0315145) and Graham River/Halfway River Gravel Pit Locality, NTS Map Sheet 94B/8 and 94B/9 (Min. Lands File #004345). Permit 1988-67. Fort St. John: Heritage North Consulting Services.
1990 Heritage Resource Inventory and Impact Assessment of Three Ministry of Transportation and Highways Projects in Northeastern British Columbia. Permit 1990-71. Fort St. John: Heritage North Consulting Services.
1991 Archaeological Investigation in the Gundy and Townsend Creeks Area, Northeast B.C., NTS Map Sheet 94B/16. Permit 1991-62. Fort St. John: Heritage North Consulting Services.
1992 Heritage Resource Inventory and Impact Assessment of a Petro-Canada Inc. Pipeline R/W from the Wellsite D-12-K to Wellsite B-22-H Tie-in NTS Map Sheet 94G/5, Peace River District. Permit 1990-5e. Fort St. John: Heritage North Consulting Services.
Wicander, Reed and James S. Monroe1993 Historical Geology: Evolution of the Earth and Life Through Time, Second Edition.
Minneapolis/Saint Paul: West Publishing Company.
Wilson, Ian R.1984 Stikine-Iskut Development Heritage Resources Impact Assessment Summary
Volume. Permit 1983-35. Brentwood Bay, BC: I.R. Wilson Consultants Ltd.
1990a Heritage Resource Inventory and Impact Assessment Proposed Adsett Pipeline, Northern B.C.. Permit 1990-118. Brentwood Bay, BC: I.R. Wilson Consultants Ltd.
1990b Heritage Resource Inventory and Impact Assessment Proposed Umbach Pipeline Extension, Northeastern B.C.. Permit 1990-119. Brentwood Bay, BC: I.R. Wilson Consultants Ltd.
Kaska Dena Northern Rockies Archaeological Project Final Report, June 11, 2001
Kaska Dena Council Page 64

Appendices
Appendix A: Glossary
Coverage - A computer GIS file that contains a particular class of data. Can contain points, lines, polygons or some combinations of all three (network).
Geographic Information System(s) (GIS) - The tools and method by which a variety of data are entered, stored, manipulated and output with the preservation of their geographic aspect throughout.
Informant - An individual who is perceived to possess special knowledge regarding (in this case) First Nations culture and is willing to share this knowledge with researchers.
Traditional - Of or referring to activities and/or things assumed to be reflective or representative of those activities and/or things as they appeared about or before the time of European contact.
Traditional Native Knowledge (TNK) - The information held by some members of the First Nations community that is assumed to be reflective of cultural and subsistence practices in place about or before the time of European contact.
Traditional Use Areas (TUA) - Areas identified by First Nations people as being the location of Traditional activities or the long term location of a particular activity.
Kaska Dena Northern Rockies Archaeological Project Final Report, June 11, 2001
Kaska Dena Council Page 65

Appendix B: Artifact Catalogue.
Kaska Dena Northern Rockies Archaeological Project Final Report, June 11, 2001
Kaska Dena Council Page 66

Appendix C: Artifact Descriptions
IvSv-009 - IgSv-009:1 - Three grey chert flakes (0.5 x 0.5 cm, 1.2 x 0.7 cm & 1.1 x 0.7 cm). One with a possible platform. These flakes are debitage. They were found in shovel test 5W/0N at approximately seven centimeters below the surface. The surrounding sediment was sandy light brown soil with no clear layering. This hole was dug to a depth of 45 cm below surface.
IgSv-009:2 - One large black obsidian flake (2.4 cm x 2.2 cm). All the edges are broken. This artifact is of a size that could have been used as a tool but since the edges are missing there is no evidence for such a classification. This flake was found in the first shovel test dug at this location (0E/0N) at a depth of approximately five centimeters below the surface. The surrounding sediment was light brown soil with no clear layering. This shovel test ended at a depth of 58 cm below surface.
IgSx-001 - IgSx-001:1 - Two dark grey chert flakes (1.8 cm x 1.1 cm & 1.6 cm x 1.1 cm). Neither flake shows a platform and are characteristic of shatter debitage. These flakes were found on the surface of the trail between Sandpile Creek and Major Hart River (Mosquito Creek or Bridge Creek).
IgSx-002 - IgSx-002:1 - 22 black obsidian flakes (range in size from 0.5 cm x 0.4 cm to 2.3 cm x 1.3 cm). Two flakes appear to retain some cortex, several flakes exhibit bulbs of percussion but no platforms. Most of these flakes have flake scars on their dorsal surfaces. They can be classified as early and middle stage reduction flakes. These flakes were found along the surface of the trail between Sandpile Creek and Major Hart River (Mosquito or Bridge Creek).
IgSx-003 - IgSx-003:1 - Three grey chert flakes (1.2 cm x 0.8 cm, 1.9 cm x 1.2 cm & 2.9 cm x 2.1 cm). The largest of these flakes has flake scars on both surfaces suggesting that it is a biface. However, all its edges are broken. The other two flakes show flakes scars on one surface only. One flake has a bulb of percussion but no remaining platform. These flakes were found on the surface of the trail between Sandpile Creek and Major Hart River (Mosquito or Bridge Creek).
IgSx-003:2 - One black obsidian flake (2.45 cm x 2.1 cm). Flake scars are evident on one surface and the edges are cleanly broken, perhaps after deposition. No platform is evident. This artifact appears to be a large fragment of reduction debitage. This flake was found on the surface of the trail between Sandpile Creek and Major Hart River (Mosquito or Bridge Creek).
IgSx-004 - IgSx-004:1 - Five black obsidian flakes (range in size from 0.8 cm x 0.8 cm to 1.1 cm x 0.9 cm). All five flakes show flake scars or step fractures on one surface and do not exhibit a platform. These are reduction debitage flakes. These flakes were found in the shovel test at 20E/50N approximately two centimeters below the surface.
IgSx-004:2 - Eight black obsidian flakes (range in size from 0.70 cm x 0.8 cm to 1.25 cm x 1.4 cm). No platforms are evident on any of these flakes while nearly all show flake scars on one surface. These flakes can be classified as reduction debitage These flakes were found in the shovel test at 50E/40N approximately two centimeters below the surface.
IgSx-004:3 - One black obsidian flake (1.95 cm x 1.2 cm). A bulb of percussion is clearly visible on the ventral surface while the flake scars on the dorsal surface
Kaska Dena Northern Rockies Archaeological Project Final Report, June 11, 2001
Kaska Dena Council Page 67

all appear to have been removed in the same direction. This could be a middle to late stage reduction flake. This flake was found on the surface of the grid location 20W/90N.
IgSx-004:4 - One black chert flake (0.9 cm x 0.6 cm). Showing flake scars on the dorsal surface and a small remnant of a bulb of percussion, this flake is an early to middle stage reduction flake. This flake was found approximately two centimeters below the surface of the shovel test location 20E/0N. The sediment in which the flake was found is light brown sandy soil which terminates at an eroding surface. Below this, approximately 20 cm below the surface, is a layer of grey fine sand. Approximately 10 cm below this (30 cm b.s.) is a layer of light brown sandy soil underlain by grey coarse sand approximately 13 cm below (43 cm b.s.). The final depth of this shovel test was 53 cm below the surface.
IgSx-004:5 - Two grey chert flakes (0.6 cm x 0.7 cm & 1.0 cm x 0.6 cm). With no platform evident and flake scars on the dorsal surface of one flake, these two flakes can be classified as early to middle stage reduction flakes. These flakes were found on the surface of the shovel test location 40E/20N.
IgSx-004:6 - Two black chert flakes (1.25 cm x 0.7 cm & 1.7 cm x 1.1 cm). Both of these flakes show flake scaring on one surface and are generally in a very battered condition. These flakes can be classified as shatter debitage or early to middle stage reduction debitage. These flakes were found on the surface of the grid location 40E/10N.
IgSx-004:7 - One brown dacite flake (2.3 cm x 1.6 cm). With step fractures dominating the dorsal surface and evident on the ventral surface, this flake is perhaps best classified as shatter debitage. This flake was found on the surface of the grid location 40E/10N.
IgSx-004:8 - Two large quartzite flakes (5.6 cm x 4.4 cm & 3.7 cm x 2.6 cm). The larger of these two flakes retains a considerable amount of cortex on the platform. Its dorsal surface shows flake scars. The smaller flake exhibits a large hinge fracture on its dorsal surface and maybe one edge of the ventral surface. These flakes can be considered early stage reduction flakes. However, the larger flake has two edges sharp enough to be used an expedient cutting tool, although no macroscopic wear is evident. These flakes were found on the surface of the path adjacent to the main cabin, approximately 20E/5N.
IgSx-004:9 - One black obsidian biface fragment (lanceolate point base? 2.0 cm x 2.9 cm). This biface fragment may have been hafted like a knife as one edge is clearly ground while the opposite edge does not appear to be so ground. It is cleanly broken at it widest point as if the break occurred while still hafted. The narrowest edge is thinned more than the adjacent intact edges. This artifact was found on the surface within the lithic scatter area at the proximal end of the airstrip.
IgSx-004:10 - One black obsidian end scraper (3.5 cm x 2.6 cm). Unifacially flaked, this tool also shows some microchipping along its edges. This scraper was reportedly found on the surface in the vicinity of the airstrip.
IgSx-004:11 - One grey chert biface fragment (2.95 cm x 1.8 cm). All the edges of this tool have been broken post discard. This is evident by the slight patina on one side which is overlapped by a more recent break. This artifact was reportedly found on the surface in the vicinity of the lithic scatter near 40E/40N.
IgSx-004:12 - One dark grey chert thumbnail scraper with patina (3.2 cm x 3.3 cm). Perhaps not a true thumbnail scraper, it is broken along its distal end. The
Kaska Dena Northern Rockies Archaeological Project Final Report, June 11, 2001
Kaska Dena Council Page 68

used edge is perpendicular to the broken edge. The patina is on the ventral surface which also shows a bulb of percussion. Flake scars on the dorsal surface appear to show that most of the flakes were removed longitudinally from the same direction. This scraper was reportedly found on the surface in the vicinity of the lithic scatter around 20W/20N.
IgSx-004:13 - One light brown/grey chert thumbnail scraper (2.9 cm x 2.5 cm). Unifacially flaked, this scraper shows very little modification along the used edge. This tool was reportedly found on the surface in the vicinity of the airstrip.
IgSx-004:14 - One dark grey chert blade fragment with patina (5.5 cm x 2.5 cm). This blade is cleanly broken at its distal end and has a patina on the dorsal surface. This patina shows that the lateral edges have a combination of pre-deposition and post-deposition breakage. This blade was reported to have been found on the surface in the vicinity of 25W/15N.
IgSx-004:15 - One dark grey microblade (?) fragment (1.6 cm x 0.6 cm). Because this artifact is broken at its proximal end true classification as a microblade is not possible and this blade description refers primarily to dimension proportions rather than intended manufacture. This artifact was reportedly found on the surface in the vicinity of the airstrip.
IgSx-004:16 - 17 grey chert flakes (range in size from 0.8 cm x 0.6 cm to 2.7 cm x 2.1 cm). Nearly all of these flakes have flake scarring on one size. One or two show clear bulbs of percussion. These flakes are middle to late stage reduction flakes. These flakes were reportedly found on the surface between the airstrip and 100E/60N.
IgSx-004:17 - 32 black obsidian flakes(range in size from 0.15 cm x 0.1 cm to 3.6 cm x 2.0 cm). Early to late stage reduction flakes are present in this set as evidenced by thick flakes with no platform or bulb of percussion and thin flakes with several flake scars and evident bulbs of percussion. These flakes were found on the surface at the proximal end of the airstrip.
IgSx-005 - IgSx-005:1 - One black obsidian flake (1.8 cm x 1.2 cm). A very thin flake with several flake scars on its dorsal surface suggests this flake is a middle to late stage reduction flake. This flake was found in shovel test #9, approximately two centimeters below the surface.
IgSx-005:2 - One black chert flake (0.8 cm x 0.9 cm). Appearing to have a fragment of a bulb of percussion on its ventral surface and flake scars on its dorsal surface, this thin flake is a middle to late stage reduction flake. This flake was found in shovel test #9, approximately two centimeters below the surface.
IgSx-005:3 - One black obsidian flake (1.3 cm x 0.95 cm). This very thin flake has several flake scars on its dorsal surface but does not show a bulb of percussion or platform. It is likely that this is a middle to late stage reduction flake. This flake was found in shovel test #7, approximately three centimeters below the surface.
IgSx-005:4 - One grey chert flake (1.1 cm x 0.8 cm). There appears to be a remnant of a bulb of percussion on this very thin flake which also has several flake scars on its dorsal surface. This is a middle to late stage reduction flake. This flake was found in shovel test #10, approximately three centimeters below the surface.
IgSx-005:5 - One brown chert (chalcedony?) flake ( 1.0 cm x 0.7 cm). A clearly visible platform on this small thin flake, combined with several visible flake scars on its dorsal surface classify this flake as a middle to late stage reduction
Kaska Dena Northern Rockies Archaeological Project Final Report, June 11, 2001
Kaska Dena Council Page 69

flake. This flake was found in shovel test #10, approximately three centimeters below the surface.
IgSx-006 - IgSx-006:1 - One black obsidian flake (1.6 cm x 0.5 cm). This battered flake is cleanly broken on one edge and roughly broken on two other edges. Some flake scarring is visible but there are no other clearly discernible features. This fragment may be classified as shatter. This flake was found in shovel test #1, approximately two centimeters below the surface.
IgSx-006:2 - One light grey chert flake (1.05 cm x 0.8 cm). This very thin flake may retain a platform remnant and has several flake scars on its dorsal surface. Classification of this artifact can be described as middle to late stage reduction debitage. This flake was found in shovel test #1, approximately two centimeters below the surface.
IgSx-007 - IgSx-007:1 - Two grey chert flakes (1.1 cm x 0.8 cm & 2.3 cm x 2.0 cm). With no discernible platform or bulb of percussion and very few flake scars these flakes can be classified as early to middle stage reduction debitage. This flake was found in shovel test #5, approximately two centimeters below the surface.
IgSx-007:2 - One black obsidian flake (1.5 cm x 1.2 cm). A thin curving flake with several flake scars and no identifiable platform or bulb of percussion, this piece can be classified as early to middle stage reduction debitage. This flake was found on the surface of the trail between Hidden Valley (Charcoal Flats) Creek and Turnagain River.
IgSx-007:3 - One grey mottled obsidian scraper (4.5 cm x 3.3 cm). Unifacially flaked, this end scraper has considerable retouching and use related microflaking along the distal edge. There also appears to be some retouch along part of the distal edge. The material appears to be an opaque green/grey obsidian (pitchstone?) with black streaks. This tool was found on the surface of the trail between Hidden Valley (Charcoal Flats) Creek and Turnagain River.
Kaska Dena Northern Rockies Archaeological Project Final Report, June 11, 2001
Kaska Dena Council Page 70