final report from academic standards committee’s ... · final report from academic standards...
TRANSCRIPT

Final Report from Academic Standards Committee’s Exploration Plus/Minus Grading System – November 1, 2016
Our Charge
At the meeting of the Steering Committee on August 4, 2016, the Academic Standards Committee was charged to study whether Auburn should adopt a grading system that includes plus and minus grades.
In deciding whether to make such a recommendation, your committee should gather information about the grading systems used by some of our peer universities, including major universities in our region. It was suggested in the meeting that much of this data is already available in the Registrar’s Office for the purpose of assigning transfer credit.
Our Process
We met August 29, September 26, and October 24, 2016 and we communicated over email.
First we reviewed SEC and SREB school grading practices, collecting data from the Transfer Evaluation System and school websites. See summary of data collected. (Constance – willing to share your notes?)
We then reviewed empirical literature on the topic. (see annotated bibliography)
We developed a summary of pros and cons from the literature and our perspectives (see Pros/Cons table)
We developed a Qualtrics survey to gather faculty and student opinions on a possible revision of our current whole letter grading system to a plus/minus grading system. (see final surveys)
We summarized the survey results (see survey results) – 620 Faculty (approximately 95% completed) and 2180 Students (approximately 81% completed) participated as of 10:00AM on October 25, 2016
We discussed and developed our recommendation based on peer institutions, published research, and survey results. The final draft of our recommendation will be approved over email.
Our Recommendation
Our committee recommends keeping the current, whole-letter grading system in place at Auburn University. Committee support for this decision is 100%.
Peer Institutions
The majority of our SEC and SREB peers (18/24, not including Auburn) use some version of plus/minus grading. In our review of our peers, we found that there were many different approaches to plus/minus grading. For example, some schools use A+ and others do not; some use C- and others do not; and some use pluses only. Auburn’s use of whole letter grading places us in the minority among our peer institutions. However, as we reviewed the literature and
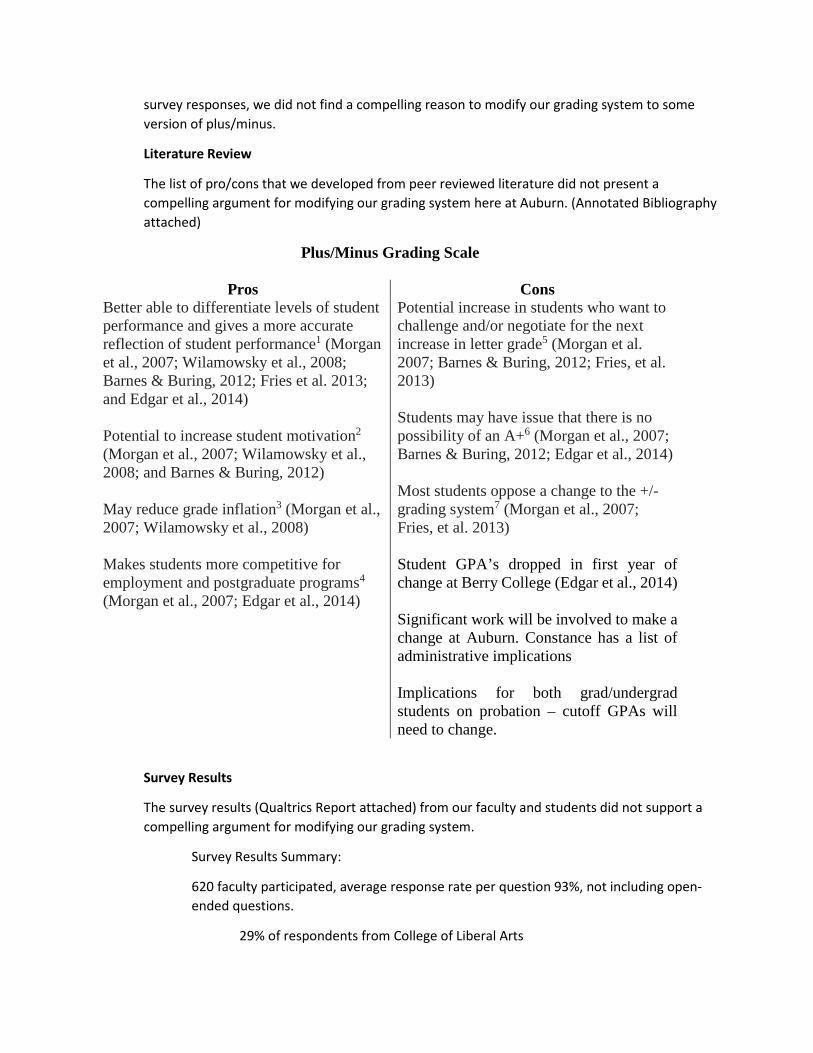
survey responses, we did not find a compelling reason to modify our grading system to some version of plus/minus.
Literature Review
The list of pro/cons that we developed from peer reviewed literature did not present a compelling argument for modifying our grading system here at Auburn. (Annotated Bibliography attached)
Plus/Minus Grading Scale
Pros Cons Better able to differentiate levels of student performance and gives a more accurate reflection of student performance1 (Morgan et al., 2007; Wilamowsky et al., 2008; Barnes & Buring, 2012; Fries et al. 2013; and Edgar et al., 2014) Potential to increase student motivation2 (Morgan et al., 2007; Wilamowsky et al., 2008; and Barnes & Buring, 2012) May reduce grade inflation3 (Morgan et al., 2007; Wilamowsky et al., 2008) Makes students more competitive for employment and postgraduate programs4
(Morgan et al., 2007; Edgar et al., 2014)
Potential increase in students who want to challenge and/or negotiate for the next increase in letter grade5 (Morgan et al. 2007; Barnes & Buring, 2012; Fries, et al. 2013) Students may have issue that there is no possibility of an A+6 (Morgan et al., 2007; Barnes & Buring, 2012; Edgar et al., 2014) Most students oppose a change to the +/- grading system7 (Morgan et al., 2007; Fries, et al. 2013) Student GPA’s dropped in first year of change at Berry College (Edgar et al., 2014) Significant work will be involved to make a change at Auburn. Constance has a list of administrative implications Implications for both grad/undergrad students on probation – cutoff GPAs will need to change.
Survey Results
The survey results (Qualtrics Report attached) from our faculty and students did not support a compelling argument for modifying our grading system.
Survey Results Summary:
620 faculty participated, average response rate per question 93%, not including open-ended questions.
29% of respondents from College of Liberal Arts

13% of respondents from College of Engineering
10% of respondents from College of Sciences and Mathematics
All others less than 10%
Student Survey:
2180 students participated, average response rate was 81% per question, not including open-ended questions.
18% of respondents from College of Engineering
16% of respondents from the College of Business
16% of respondents from College of Science and Mathematics
15% of respondents from College of Liberal Arts
Percentage response per question by Faculty and Students
Strongly Disagree
Disagree Neutral Agree Strongly Agree
…more fair FACULTY 10 9 14 26 41 STUDENTS 63 17 6 8 6
…increases motivation FACULTY 12 15 25 24 23 STUDENTS 56 21 8 8 7
…important to grad school applications
FACULTY 13 15 31 21 20 STUDENTS 57 20 13 5 5
…students more likely to challenge grades
FACULTY 7 19 19 28 26 STUDENTS 44 13 12 16 16
…prefer to KEEP FACULTY 25 22 20 11 22 STUDENTS 4 4 5 7 80
…support a CHANGE FACULTY 20 10 17 21 32 STUDENTS 74 12 5 4 5
FACULTY support changing the grading system to plus/minus, but not overwhelmingly – 53% (agree/strongly agree); about 17% of the faculty are neutral and 30% disagree/strongly disagree with changing the current grading system.
Asked another way – 33% of faculty agree/strongly agree with the preference to keep our current grading system. 20% reported being neutral. And 47% strongly disagree/disagree with preferring to keep our current grading system.
Either way we ask the question, faculty responses are quite close (prefer to keep/support change).
Change: 47%/53%

Neutral: 20%/17%
Status Quo: 33%/30%
If we add the neutral respondents (not actively seeking change) to the status quo respondents, then we see approximately 53%/47% support the status quo and 47%/53% support making a change. Our faculty is split. This is not compelling justification for making a change from a faculty perspective. [Variation among colleges… Strong support to change from: College of Architecture, Design, and Construction-78%; College of Liberal Arts-61%; College of Human Sciences-59%; all others <50% support for change]
STUDENTS are united AGAINST making a change. 87%/86%, with 5% of students neutral, and only 8%/9% supporting a change towards plus/minus grading. [Student responses did not vary across college, year, or intent to apply for graduate school]

Academic Standards ‐ Grading System Comparison
Data collected from Transfer Evaluation System, Aug 29, 2016
SEC/SREB Institution Grading System ‐ TES System Key
CR’s notes
SEC Missouri plus/minus A+=4.0/C‐=1.7
SEC Arkansas Whole letter, 4pt
Whole grades https://registrar.uark.edu/faculty‐staff/grading.php
SEC Texas A&M whole letter, 4pt
SEC LSU plus/minus Plus/minus began 2015; A+=4.3/C‐=1.7
SEC Miss State whole letter, 4pt
SEC Ole Miss plus/minus Plus/minus began 2011; no A+/A=4.0/C‐=1.7
SEC Vanderbilt plus/minus A+=4.3/C‐=1.7
SEC Kentucky plus/minus A=4.0 (no A+); C‐=1.7
SEC Tennessee plus/minus A=4.0 (no A+); C‐=1.7
SEC Georgia plus/minus Plus/minus began 2006; A=4.0 (no A+); C‐=1.7
SEC Alabama plus/minus A+=4.33/C‐=1.67
SEC Auburn whole letter, 4pt
SEC Florida plus/minus A=4.0 (no A+); C‐=1.67
SEC South Carolina Plus only—no minus A=4.0/B+=3.5/B=3/C+=2.5
SREB Florida State plus/minus A=4.0 (no A+)/A‐=3.75/B+=3.25/C‐=1.75
SREB Georgia Tech whole letter, 4pt
SREB University of Maryland plus/minus
Plus/minus began 2012/A+=4.0/A=4.0/C‐=1.7
SREB UNC plus/minus A=4.0/C‐=1.7
SREB North Carolina State plus/minus
A+=4.333/C‐=1.667
SREB OSU plus/minus A=4.0 (no A+)/C‐=1.7
SREB University of Oklahoma whole letter, 4pt
SREB Clemson University whole letter, 4pt
whole letter, 4pt
SREB UT at Austin plus/minus A=4.0 (no A+)/C‐=1.67
SREB Virginia Tech plus/minus A=4.0 (no A+)/C‐=1.7
SREB UVA plus/minus A+=4.0/A=4.0/C‐=1.7
TOTALS: 7 whole letter, 4pt
18 plus/minus (some variation)

Plus/Minus Grading Scale
Pros Cons
Better able to differentiate levels of student
performance and gives a more accurate
reflection of student performance1 (Morgan
et al., 2007; Wilamowsky et al., 2008;
Barnes & Buring, 2012; Fries et al. 2013;
and Edgar et al., 2014)
Potential to increase student motivation2
(Morgan et al., 2007; Wilamowsky et al.,
2008; and Barnes & Buring, 2012)
May reduce grade inflation3 (Morgan et al.,
2007; Wilamowsky et al., 2008)
Makes students more competitive for
employment and postgraduate programs4
(Morgan et al., 2007; Edgar et al., 2014)
Potential increase in students who want to
challenge and/or negotiate for the next
increase in letter grade5 (Morgan et al.
2007; Barnes & Buring, 2012; Fries, et al.
2013)
Students may have issue that there is no
possibility of an A+6 (Morgan et al., 2007;
Barnes & Buring, 2012; Edgar et al., 2014)
Most students oppose a change to the +/-
grading system7 (Morgan et al., 2007;
Fries, et al. 2013)
Student GPA’s dropped in first year of
change at Berry College (Edgar et al., 2014)
Significant work will be involved to make a
change at Auburn.
Implications for both grad/undergrad
students on probation – cutoff GPAs may
need to change.

Barnes, K.D., & Buring, S.M. (2012). The effect of various grading scales on grade point averages. American Journal of Pharmaceutical Education, 76(3), 1-7.
The purpose of this study is to investigate the effects of using a +/- grading scale and to understand faculty and student perceptions of whole-letter and +/- grading scales on cumulative GPA in required courses.
Course directors submitted grading scales used in 2010 and compared them to grading scales used in 2005. Percentage grade for each student were also submitted and data were used to retrospectively calculate grades. Twenty-four faculty members and 351 students participated in a survey about their perceptions regarding the use of +/- grading system.
There were 9 different +/- grading scales being used during this 5-year period. Survey results showed that students felt the grade scale used should be consistent throughout the program. “Although most faculty members and students believed implementation of the +/- system would decrease GPA, the study showed no difference in cumulative-mean GPA (when calculated using retrospective application (p.7).
“A possible disadvantage of the use of the +/- system is the potential increase in students who want to negotiate for the next increase in letter grade. Twice as many students indicated that they were more likely to challenge their final letter grade if a +/- system were used for assessment rather than whole-letter grading scale (p.6). Barnes et al. (2012) is in agreement with previous research from Morgan et al. (2007) and Wilamowsky et al. (2008) that identify three common reasons why universities implement a +/- grading system: (1) differentiating levels of student performance, (2) increasing student motivation, and (3) reducing grade inflation.

Edgar, L.D, Johnson, D.M., Graham, D.L., & Dixon, B.L. (2014). Student and faculty perceptions of plus/minus grading and its effect on course grade point averages. College Student Journal, 48, 184-197.
The purpose of this article to understand and compare student and faculty perceptions of the +/- grading system and to analyze the effects on course grade point average.
Participants included all ranked faculty that responded (82) and undergraduates with a major (338) stratified by department who were chosen using a random clustering sample. Researchers also did an analysis of 12 years of student grades. This included 5 years of data before and 7 years of data after the +/- system was implemented. After the first 5 years, the instructors were divided into three groups. One group stayed the same and kept using whole-letter grades, one group changed to +/- system, and the other group was mixed. The mixed group consisted of faculty that taught two of the same course and used a whole-letter scale for one class and a +/- scale for the other.
End of course GPAs for courses using the whole-letter grading system were higher throughout the whole study. The end of course GPA was lower for the courses that did switch to the +/- system. Research suggests “reverse grade inflation (p.195)” as the possible reason for the lower GPA with the implementation of the +/- system. The survey indicated that some of the negative perceptions of the +/- system were due to the inconsistent use of grading systems during this study. They recommend using one grading system for all courses and stress the importance of instructors explaining how grades are earned in their course syllabus at the beginning of each semester. Some faculty and students felt there should be the possibility of an A+ in order to make them more competitive for scholarships, jobs, getting into graduate school, etc. (Barnes, et al. 2012). A majority of the faculty felt positive about the use of the +/- system.
Edgar et al.’s (2014) research includes the same reasons as Morgan et al. (2007) and Barnes et al. (2012) behind implementing +/- grading system: (1) differentiating levels of student performance, (2) increasing student motivation, and (3) reducing grade inflation. They also include student and faculty acceptance of this grading scale. Edgar et al uses Barnes et al.’s (2012) argument as to why the system used is so important, which is “because cumulative GPA condenses academic performance into a single statistic and is used to evaluate applicants for employment and post graduate programs (p. 185). Edgar et al. (2014) use Vroom’s (1964) Expectancy Theory of Motivation to “suggest that students’ perceived view on an outcome will determine their level of motivation (p.186)”.

Fries, R.N., Krim, J.S., Conkin, J., & Smith, D.A. (2013). Student and faculty perceptions on plus-minus grading: A case study. Educational Research Quarterly, 36(4), 49- 67.
The purpose of this article is to investigate whether faculty prefers whole-letter grading, which is currently used, or will they prefer a +/- grading system. The committee did an analysis of peer institutions regarding their grading practices and policies by reviewing online handbooks and syllabi available online and a survey was conducted for all students and faculty at a university to ask them whether they prefer whole-letter grading, which is currently used, or if they would prefer a +/- grading system.
The committee analyzed 23 institutions. 12 used the whole-letter system, 7 used +/- system, and 4 reported using both. Of the 4 reporting both were used, 3 indicated it was up to the professors and 1 indicated that students were able to choose which system they wanted for each course they took.
Findings from the survey supported research of Morgan et al. (2007) and Wilamowsky et al. (2008): most students oppose a change to the +/- grading system. This did not support Morgan et al. (2007)’s ‘resistance to change’ theory as the reason and close to half the students that opposed the change felt the whole-letter system accurately reflected their performance. And even though more than half the faculty was in favor of changing the grading system, only 17% of students indicated being dissatisfied with the current grading system being used. This was enough reason for the faculty to stay with the whole-letter system along with the fact all faculty agreed changing would lead to an increase in the number of student grade appeals, which would increase their workload.

Morgan, J., Tallman, G., & Williams, R. (2007). Students and faculty views of plus-minus grading systems [White paper]. Retrieved September 7, 2016, from Northern Arizona University The W.A. Franke College of Business: http://franke.nau.edu/images/uploads/fcb/07-11.pdf.
The purpose of this study is to understand how faculty and student perceptions of the benefits of a +/- grading system differ and the reasoning behind these differences.
The researchers did a review of studies of institutions and the prevalence of the plus/minus grading system. They also conducted surveys with faculty and students about their feelings about introducing a plus/minus grading system. An online Qualtrics survey was emailed to faculty while students were randomly asked questions as they were entering and exiting buildings on campus.
According to the American Association of College Registrar and Admissions Offices, 56% of two- and four-year colleges used a pluses or minuses in their grading system. Based on trends, they predict another 10% increase in the next 10 years. Studies have shown three main reasons for changing to +/- system: (1) ability to differentiate student performance, (2) student motivation, and (3) possibly reduce grade inflation. These same reasons were discussed in Wilamowsky et al.’s (2008) research and were evident in Morgan’s study. Over 50% of faculty were in support of introducing a +/- system while only15% of students agreed. Although, they ‘cited similar reasons.’ (as listed above). A majority of students who were opposed thought that it would negatively affect their GPA and felt there was no reason the change. Faculty who were opposed also felt change was unnecessary and also thought it would make grading more difficult. A majority of upper classman and students with the highest average GPAs were strongly opposed. An explanation for the difference in perspective is based on the ‘resistance to change theory’ and the ‘expectancy theory.’ “Student opposition to a +/- grading system could be reduced by implementing it in a phased manner (starting with a freshmen class) and finding a way to incorporate a grade of A+. In addition, resistance to change theory suggests that is important that the reasons why the use of +/- grades might be in the best interest of students be effectively communicated throughout the process and that student groups should be involved early in any proposal to the institute. (p.12).”

Wilamowsky, Y., Dickman, B.H., & Epstein, S. (2008). The effect of plus/minus grading on GPA. Journal of College Teaching & Learning, 5(9), 1-7.
The purpose of this study is to investigate changing to a plus/minus grading system and the effects this has on overall student grade point average.
Student data was collected for an additional two semesters and analyzed along with data from a previous study at the same university, which was from two semesters before and two semesters after the change to a plus/minus grading system. The university had the plus system in place for two semesters before adopting the plus/minus system.
“The single most important reason for including plus and minus grades is to be able to differentiate between the performances of different students (p.1).”
“Simulation studies have shown that under certain conditions the reported grades are a more accurate reflection of student performance when using plus/minus grades. (p.1)”
“A number of studies have been done which imply that grade inflation is either eliminated or reduced with the introduction of plus/minus grades (p.1).”
Wilamowsky et al’s initial findings were consistent with the original study and found overall student GPA decreased after switching to the plus/minus grading system. However after the second year, overall student GPA returned to what it was before the plus/minus grading was implemented. This led researchers to analyze by course type: undergraduate, elective, and graduate, and then by department. There was only one department that had a decrease in GPA consistently with the adoption of the plus/minus grading. There seems to be other factors that could effect changes in student GPA when implementing new grading systems. Are instructors adjusting their grading to accommodate changes in grading system? There is more to learn about ‘the psychology of grading.’ What is happening within each department? Wilamowsky et al. suggest further research for any university considering making grading system changes.
References

Barnes, K.D., & Buring, S.M. (2012). The effect of various grading scales on grade point
averages. American Journal of Pharmaceutical Education, 76(3), 1-7.
Edgar, L.D, Johnson, D.M., Graham, D.L., & Dixon, B.L. (2014). Student and faculty
perceptions of plus/minus grading and its effect on course grade point averages.
College Student Journal, 48, 184-197.
Fries, R.N., Krim, J.S., Conkin, J., & Smith, D.A. (2013). Student and faculty perceptions
on plus-minus grading: A case study. Educational Research Quarterly, 36(4), 49-
67.
Morgan, J., Tallman, G., & Williams, R. (2007). Students and faculty views of plus-minus
grading systems [White paper]. Retrieved September 7, 2016, from Northern
Arizona University The W.A. Franke College of Business:
http://franke.nau.edu/images/uploads/fcb/07-11.pdf.
Wilamowsky, Y., Dickman, B.H., & Epstein, S. (2008). The effect of plus/minus grading
on GPA. Journal of College Teaching & Learning, 5(9), 1-7.
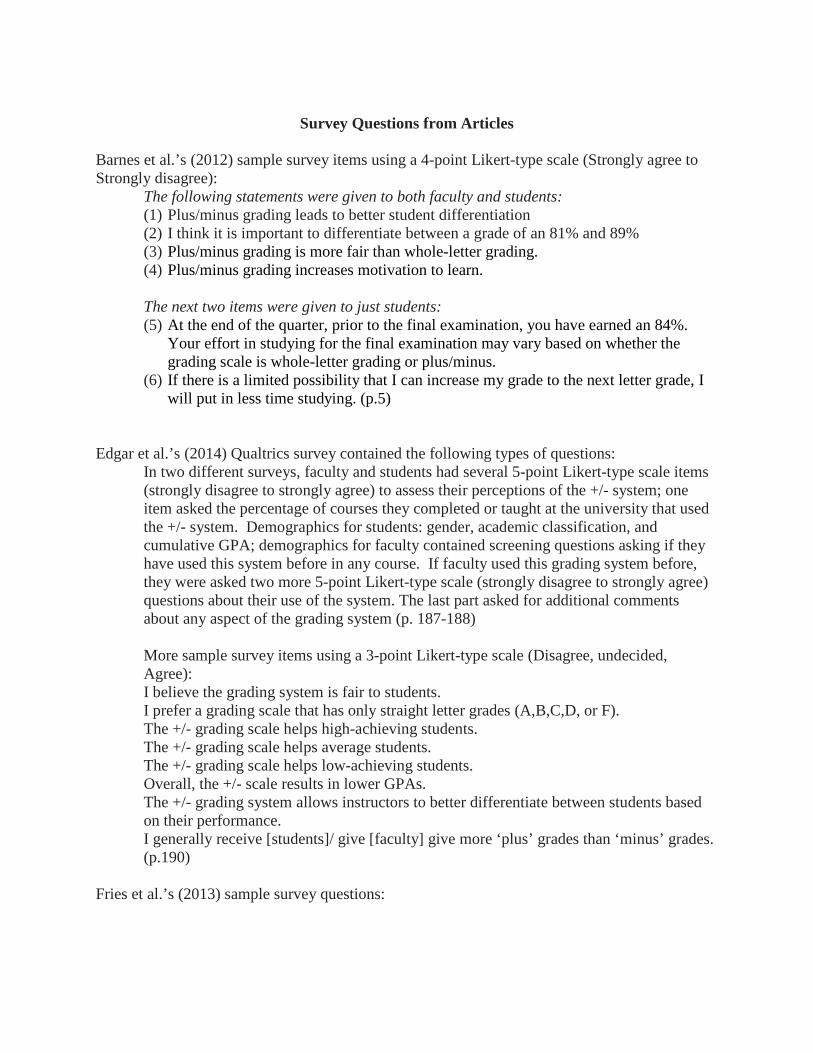
Survey Questions from Articles
Barnes et al.’s (2012) sample survey items using a 4-point Likert-type scale (Strongly agree to Strongly disagree):
The following statements were given to both faculty and students: (1) Plus/minus grading leads to better student differentiation (2) I think it is important to differentiate between a grade of an 81% and 89% (3) Plus/minus grading is more fair than whole-letter grading. (4) Plus/minus grading increases motivation to learn.
The next two items were given to just students: (5) At the end of the quarter, prior to the final examination, you have earned an 84%.
Your effort in studying for the final examination may vary based on whether the grading scale is whole-letter grading or plus/minus.
(6) If there is a limited possibility that I can increase my grade to the next letter grade, I will put in less time studying. (p.5)
Edgar et al.’s (2014) Qualtrics survey contained the following types of questions:
In two different surveys, faculty and students had several 5-point Likert-type scale items (strongly disagree to strongly agree) to assess their perceptions of the +/- system; one item asked the percentage of courses they completed or taught at the university that used the +/- system. Demographics for students: gender, academic classification, and cumulative GPA; demographics for faculty contained screening questions asking if they have used this system before in any course. If faculty used this grading system before, they were asked two more 5-point Likert-type scale (strongly disagree to strongly agree) questions about their use of the system. The last part asked for additional comments about any aspect of the grading system (p. 187-188) More sample survey items using a 3-point Likert-type scale (Disagree, undecided, Agree):
I believe the grading system is fair to students. I prefer a grading scale that has only straight letter grades (A,B,C,D, or F). The +/- grading scale helps high-achieving students. The +/- grading scale helps average students. The +/- grading scale helps low-achieving students. Overall, the +/- scale results in lower GPAs.
The +/- grading system allows instructors to better differentiate between students based on their performance. I generally receive [students]/ give [faculty] give more ‘plus’ grades than ‘minus’ grades. (p.190)
Fries et al.’s (2013) sample survey questions:

“Which statement best describes your reason for being a) satisfied with the current whole-letter grading system or b) your dissatisfaction with the current whole-letter grading system (select all that apply)?” Friends at other schools also receive whole-letter grades, I am used to whole-letter grades from high school and/or community college, The current grading system motivates me to work harder, Other (please explain). (p.60) Sample question based on stratification: If Satisfied, they were asked, “If you applied for jobs that asked for college transcript, do you feel that the current grading system helped you in any way (for example, being viewed more favorably)? If Dissatisfied, “If you applied for jobs that asked for college transcript, do you feel that the current grading system would put you at a disadvantage in any way (for example, being viewed less favorably)? Another 5-point Likert-type scale question (satisfied to dissatisfied) was asked based on student opinion of impact of whole-letter grading on competiveness regarding a) their job obtainment and b) scholarship awards. (p.61) If Dissatisfied, students were asked, “On average, how many times a year do you feel the current grading system inaccurately represented your final class grade on your transcript?” (p.62)
Wilamowsky et al.’s (2008) survey contained the following questions:
The variant of +/- grading system being considered is one that adds grades of A-, B+, B-, and C+ to the set of potential grades with + grades being recorded as .3 points higher than the base grade (ex. 3.3 points for a B+) and – grades being recorded as .3 points less than the base grade.
Respondents were asked whether they Favored, Opposed or Didn’t Know About or Care About a change to the grading system that would utilize the +/- grading scheme described above. Those who either Favored or Opposed were then asked to rate the strength of their opinions as either: Care only slightly, Care somewhat strongly or Care very strongly. The results of these two questions were combined to produce a 7 point scale with values ranging from Very Strongly Support to Very Strongly Oppose. Respondents were also asked to describe the reasons for their support or opposition. Results of this open ended question were recorded and categorized with up to two reasons being recorded for each respondent. In addition, respondents were asked to provide additional information that might be related to their views of the proposed system. Students were asked to indicate their class standing, their GPA, and the college of their major. Faculty members were asked to indicate their college and their length of service at the university. (p. 5)

Default ReportGrading System FACULTY SURVEYOctober 25th 2016, 10:16 am CDT
Q2 - Please read the following statements and indicate your level of agreement.
QuestionStrongl
yAgree
Agree Neutral Disagree Strongly Disagree Total
Plus/minus grading is
40.96%
238 25.82% 150 14.11% 82 8.95% 52 10.15% 59 581
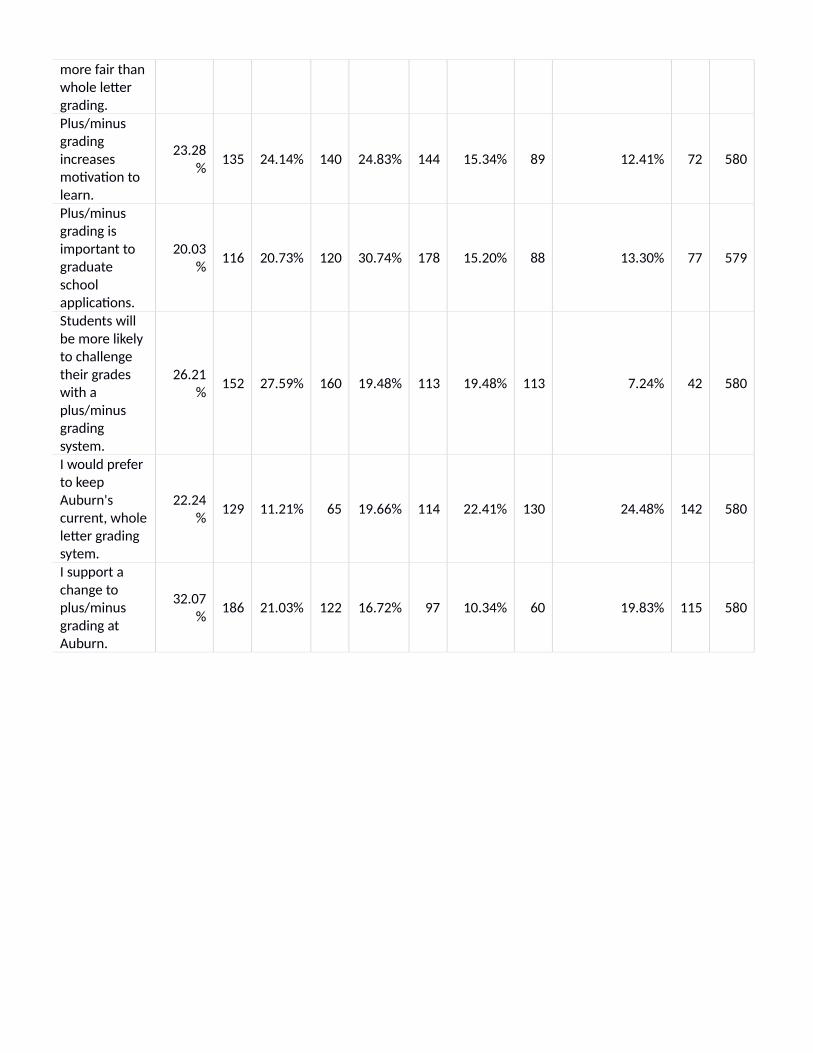
more fair thanwhole letter grading.Plus/minus grading increases motivation to learn.
23.28% 135 24.14% 140 24.83% 144 15.34% 89 12.41% 72 580
Plus/minus grading is important to graduate school applications.
20.03% 116 20.73% 120 30.74% 178 15.20% 88 13.30% 77 579
Students will be more likely to challenge their grades with a plus/minus grading system.
26.21% 152 27.59% 160 19.48% 113 19.48% 113 7.24% 42 580
I would prefer to keep Auburn's current, wholeletter grading sytem.
22.24% 129 11.21% 65 19.66% 114 22.41% 130 24.48% 142 580
I support a change to plus/minus grading at Auburn.
32.07% 186 21.03% 122 16.72% 97 10.34% 60 19.83% 115 580

Q4 - Unit (College or School)
Answer % Count
College of Agriculture 9.89% 54
College of Architecture, Design & Construction 7.69% 42
Raymond J. Harbert College of Business 6.96% 38
College of Education 6.59% 36
Samuel Ginn College of Engineering 13.19% 72
School of Forestry and Wildlife Sciences 2.38% 13

Graduate School 0.55% 3
University College 0.18% 1
Honors College 0.37% 2
College of Human Sciences 4.95% 27
College of Liberal Arts 29.49% 161
School of Nursing 1.28% 7
Harrison School of Pharmacy 2.56% 14
College of Sciences and Mathematics 10.07% 55
College of Veterinary Medicine 3.85% 21
Total 100% 546

Q5 - Rank
Answer % Count
Non-tenure Track/Clinical/Instructor 22.20% 123
Assistant Professor 18.95% 105
Associate Professor 26.71% 148
Full Professor 32.13% 178
Total 100% 554

Q6 - I have experience teaching at another university that used a plus/minus grading system.
Answer % Count
Yes 56.33% 316
No 43.67% 245
Total 100% 561

Q8 - I prefer a plus/minus grading system (respondents who taught at institution with plus/minus grading system)
Answer % Count
Strongly Agree 46.84% 148
Agree 21.84% 69
Neutral 9.49% 30
Disagree 4.75% 15
Strongly Disagree 17.09% 54
Total 100% 316
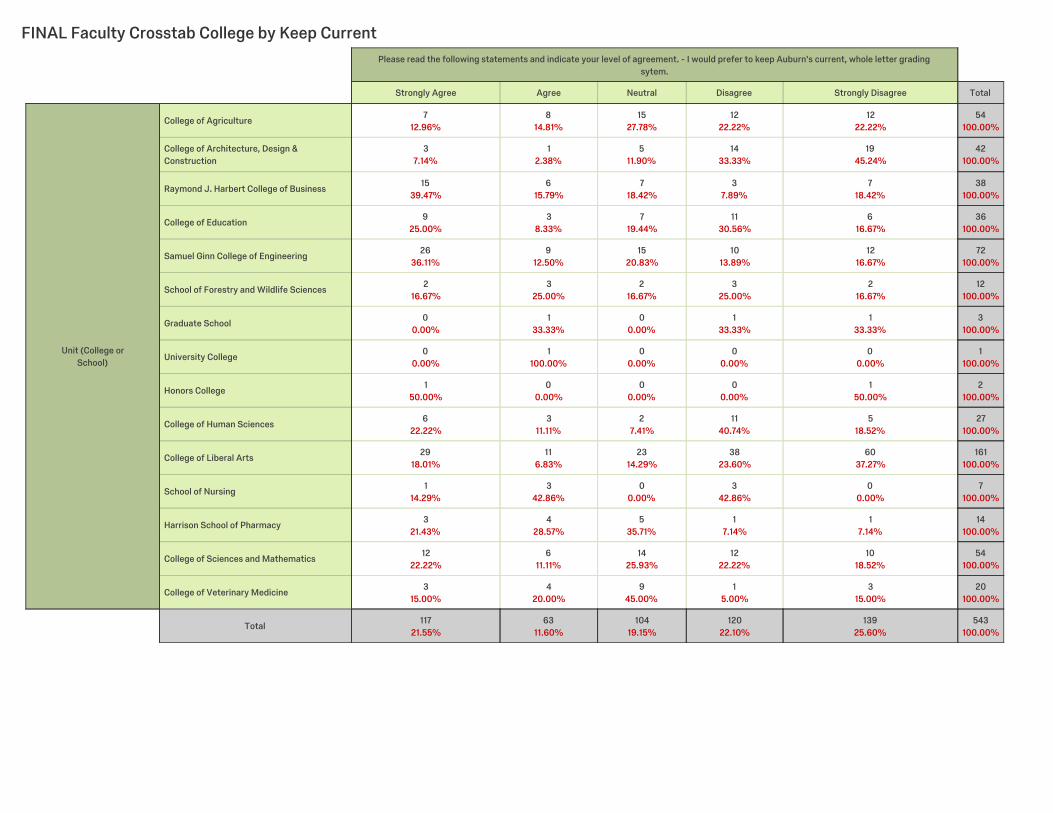
FINAL Faculty Crosstab College by Keep Current
Strongly Agree Agree Neutral Disagree Strongly Disagree Total
College of Agriculture 712.96%
814.81%
1527.78%
1222.22%
1222.22%
54100.00%
College of Architecture, Design &Construction
37.14%
12.38%
511.90%
1433.33%
1945.24%
42100.00%
Raymond J. Harbert College of Business 1539.47%
615.79%
718.42%
37.89%
718.42%
38100.00%
College of Education 925.00%
38.33%
719.44%
1130.56%
616.67%
36100.00%
Samuel Ginn College of Engineering 2636.11%
912.50%
1520.83%
1013.89%
1216.67%
72100.00%
School of Forestry and Wildlife Sciences 216.67%
325.00%
216.67%
325.00%
216.67%
12100.00%
Graduate School 00.00%
133.33%
00.00%
133.33%
133.33%
3100.00%
University College 00.00%
1100.00%
00.00%
00.00%
00.00%
1100.00%
Honors College 150.00%
00.00%
00.00%
00.00%
150.00%
2100.00%
College of Human Sciences 622.22%
311.11%
27.41%
1140.74%
518.52%
27100.00%
College of Liberal Arts 2918.01%
116.83%
2314.29%
3823.60%
6037.27%
161100.00%
School of Nursing 114.29%
342.86%
00.00%
342.86%
00.00%
7100.00%
Harrison School of Pharmacy 321.43%
428.57%
535.71%
17.14%
17.14%
14100.00%
College of Sciences and Mathematics 1222.22%
611.11%
1425.93%
1222.22%
1018.52%
54100.00%
College of Veterinary Medicine 315.00%
420.00%
945.00%
15.00%
315.00%
20100.00%
Total 11721.55%
6311.60%
10419.15%
12022.10%
13925.60%
543100.00%
Please read the following statements and indicate your level of agreement. - I would prefer to keep Auburn's current, whole letter gradingsytem.
Unit (College orSchool)

Please read the followingstatements and indicate
your level of agreement. - Iwould prefer to keep
Auburn's current, wholeletter grading sytem.
Unit (College or School)
Chi Square 117.03*
Degrees of Freedom 56
p-value 0.00
*Note: The Chi-Square approximation may be inaccurate - expected frequency less than 5.

FINAL Faculty Crosstab College by Change
Strongly Agree Agree Neutral Disagree Strongly Disagree Total
College of Agriculture 1425.93%
1527.78%
1324.07%
611.11%
611.11%
54100.00%
College of Architecture, Design &Construction
2764.29%
819.05%
37.14%
49.52%
00.00%
42100.00%
Raymond J. Harbert College of Business 821.05%
615.79%
513.16%
513.16%
1436.84%
38100.00%
College of Education 1233.33%
513.89%
822.22%
513.89%
616.67%
36100.00%
Samuel Ginn College of Engineering 1419.44%
1318.06%
1013.89%
912.50%
2636.11%
72100.00%
School of Forestry and Wildlife Sciences 433.33%
216.67%
325.00%
216.67%
18.33%
12100.00%
Graduate School 133.33%
133.33%
00.00%
133.33%
00.00%
3100.00%
University College 00.00%
00.00%
00.00%
1100.00%
00.00%
1100.00%
Honors College 150.00%
00.00%
00.00%
00.00%
150.00%
2100.00%
College of Human Sciences 725.93%
1037.04%
311.11%
13.70%
622.22%
27100.00%
College of Liberal Arts 7445.96%
3219.88%
1911.80%
106.21%
2616.15%
161100.00%
School of Nursing 00.00%
228.57%
114.29%
342.86%
114.29%
7100.00%
Harrison School of Pharmacy 17.14%
321.43%
642.86%
17.14%
321.43%
14100.00%
College of Sciences and Mathematics 1425.45%
1425.45%
916.36%
712.73%
1120.00%
55100.00%
College of Veterinary Medicine 315.79%
315.79%
947.37%
315.79%
15.26%
19100.00%
Total 18033.15%
11420.99%
8916.39%
5810.68%
10218.78%
543100.00%
Please read the following statements and indicate your level of agreement. - I support a change to plus/minus grading atAuburn.
Unit (College orSchool)

Please read the followingstatements and indicate
your level of agreement. - Isupport a change to
plus/minus grading atAuburn.
Unit (College or School)
Chi Square 125.78*
Degrees of Freedom 56
p-value 0.00
*Note: The Chi-Square approximation may be inaccurate - expected frequency less than 5.

FINAL Faculty Crosstab Rank by Change
Strongly Agree Agree Neutral Disagree Strongly Disagree Total
Non-tenure Track/Clinical/Instructor 2822.95%
2117.21%
2520.49%
2016.39%
2822.95%
122100.00%
Assistant Professor 4139.42%
2524.04%
1615.38%
1211.54%
109.62%
104100.00%
Associate Professor 5436.49%
3120.95%
2114.19%
128.11%
3020.27%
148100.00%
Full Professor 6234.83%
3921.91%
2715.17%
147.87%
3620.22%
178100.00%
Total 18533.51%
11621.01%
8916.12%
5810.51%
10418.84%
552100.00%
Please read the followingstatements and indicate
your level of agreement. - Isupport a change to
plus/minus grading atAuburn.
Rank
Chi Square 21.17
Degrees of Freedom 12
p-value 0.05
Please read the following statements and indicate your level of agreement. - I support a change to plus/minus grading atAuburn.
Rank

FINAL Faculty Crosstab Experience by Change
Strongly Agree Agree Neutral Disagree Strongly Disagree Total
Yes 14445.57%
6721.20%
3511.08%
144.43%
5617.72%
316100.00%
No 4016.39%
5020.49%
5522.54%
4418.03%
5522.54%
244100.00%
Total 18432.86%
11720.89%
9016.07%
5810.36%
11119.82%
560100.00%
Please read the followingstatements and indicate
your level of agreement. - Isupport a change to
plus/minus grading atAuburn.
I have experience teachingat another university thatused a plus/minus grading
system.
Chi Square 73.18
Degrees of Freedom 4
p-value 0.00
Please read the following statements and indicate your level of agreement. - I support a change to plus/minus grading atAuburn.
I have experience teaching at another university that used a plus/minus gradingsystem.

Default ReportGrading System STUDENT SURVEYOctober 25th 2016, 9:58 am CDT
Q2 - Please read the following statements and indicate your level of agreement.
QuestionStrongl
yAgree
Agree Neutral DisagreeStronglyDisagree Total
Plus/minus grading is
6.27% 115 8.35% 153 5.67% 104 16.80% 308 62.90% 1153 1833

more fair than whole letter grading.Plus/minus grading increases motivation to learn.
6.62% 121 8.48% 155 7.99% 146 21.12% 386 55.80% 1020 1828
Plus/minus grading is important tograduate school applications.
4.76% 87 4.60% 84 13.36% 244 20.25% 370 57.03% 1042 1827
I would be more likely to challengemy grade with a plus/minus grading system.
15.90%
291 15.36% 281 11.80% 216 13.39% 245 43.55% 797 1830
I would prefer to keep Auburn's current, whole letter grading sytem.
80.34% 1471 7.21% 132 4.81% 88 3.77% 69 3.88% 71 1831
I support a change to plus/minus grading at Auburn.
5.07% 93 4.20% 77 4.80% 88 11.50% 211 74.44% 1366 1835

Q4 - Current College/School of your major
Answer % Count
College of Agriculture 2.93% 50
College of Architecture, Design & Construction 4.11% 70
Raymond J. Harbert College of Business 16.19% 276
College of Education 9.38% 160
Samuel Ginn College of Engineering 18.18% 310
School of Forestry and Wildlife Sciences 0.82% 14

Graduate School 0.82% 14
University College 0.70% 12
Honors College 0.53% 9
College of Human Sciences 5.22% 89
College of Liberal Arts 14.78% 252
School of Nursing 6.92% 118
Harrison School of Pharmacy 0.94% 16
College of Sciences and Mathematics 15.72% 268
College of Veterinary Medicine 2.76% 47
Total 100% 1705

Q5 - Current academic standing
Answer % Count
Freshman 26.91% 458
Sophomore 32.84% 559
Junior 20.04% 341
Senior 14.75% 251
graduate student 5.46% 93
Total 100% 1702

Q6 - I intend to apply for graduate/professional school in the future.
Answer % Count
Yes 61.16% 1022
No 15.92% 266
Unsure 22.92% 383
Total 100% 1671

FINAL Student Crosstab College by Keep Whole Letter
Strongly Agree Agree Neutral Disagree Strongly Disagree Total
College of Agriculture 4386.00%
00.00%
12.00%
48.00%
24.00%
50100.00%
College of Architecture, Design &Construction
5275.36%
710.14%
22.90%
45.80%
45.80%
69100.00%
Raymond J. Harbert College of Business 21979.06%
217.58%
165.78%
124.33%
93.25%
277100.00%
College of Education 12879.50%
95.59%
84.97%
63.73%
106.21%
161100.00%
Samuel Ginn College of Engineering 24077.67%
299.39%
185.83%
144.53%
82.59%
309100.00%
School of Forestry and Wildlife Sciences 1392.86%
17.14%
00.00%
00.00%
00.00%
14100.00%
Graduate School 857.14%
00.00%
214.29%
214.29%
214.29%
14100.00%
University College 975.00%
18.33%
00.00%
18.33%
18.33%
12100.00%
Honors College 9100.00%
00.00%
00.00%
00.00%
00.00%
9100.00%
College of Human Sciences 7788.51%
44.60%
44.60%
22.30%
00.00%
87100.00%
College of Liberal Arts 20682.07%
155.98%
103.98%
93.59%
114.38%
251100.00%
School of Nursing 9783.62%
54.31%
54.31%
32.59%
65.17%
116100.00%
Harrison School of Pharmacy 1487.50%
00.00%
212.50%
00.00%
00.00%
16100.00%
College of Sciences and Mathematics 22282.84%
228.21%
103.73%
41.49%
103.73%
268100.00%
College of Veterinary Medicine 3574.47%
714.89%
00.00%
24.26%
36.38%
47100.00%
Total 137280.71%
1217.12%
784.59%
633.71%
663.88%
1700100.00%
Please read the followingstatements and indicate
your level of agreement. - Iwould prefer to keep
Auburn's current, wholeletter grading sytem.
Current College/School ofyour major
Chi Square 63.82*
Degrees of Freedom 56
p-value 0.22
Please read the following statements and indicate your level of agreement. - I would prefer to keep Auburn's current, whole letter gradingsytem.
Current College/School of yourmajor

Student Crosstab College by Change
Strongly Agree Agree Neutral Disagree Strongly Disagree Total
College of Agriculture 510.00%
36.00%
00.00%
510.00%
3774.00%
50100.00%
College of Architecture, Design &Construction
57.25%
34.35%
11.45%
1014.49%
5072.46%
69100.00%
Raymond J. Harbert College of Business 165.82%
124.36%
165.82%
2810.18%
20373.82%
275100.00%
College of Education 116.83%
53.11%
74.35%
1911.80%
11973.91%
161100.00%
Samuel Ginn College of Engineering 144.52%
165.16%
206.45%
4113.23%
21970.65%
310100.00%
School of Forestry and Wildlife Sciences 00.00%
17.14%
00.00%
17.14%
1285.71%
14100.00%
Graduate School 214.29%
321.43%
00.00%
17.14%
857.14%
14100.00%
University College 18.33%
00.00%
00.00%
433.33%
758.33%
12100.00%
Honors College 00.00%
00.00%
00.00%
111.11%
888.89%
9100.00%
College of Human Sciences 22.25%
33.37%
33.37%
88.99%
7382.02%
89100.00%
College of Liberal Arts 135.18%
103.98%
135.18%
207.97%
19577.69%
251100.00%
School of Nursing 65.13%
10.85%
54.27%
108.55%
9581.20%
117100.00%
Harrison School of Pharmacy 00.00%
212.50%
00.00%
00.00%
1487.50%
16100.00%
College of Sciences and Mathematics 93.36%
124.48%
124.48%
2910.82%
20676.87%
268100.00%
College of Veterinary Medicine 24.26%
12.13%
24.26%
817.02%
3472.34%
47100.00%
Total 865.05%
724.23%
794.64%
18510.87%
128075.21%
1702100.00%
Please read the following statements and indicate your level of agreement. - I support a change to plus/minus grading atAuburn.
Current College/School of yourmajor
Please read the followingstatements and indicate
your level of agreement. - Isupport a change to
plus/minus grading atAuburn.
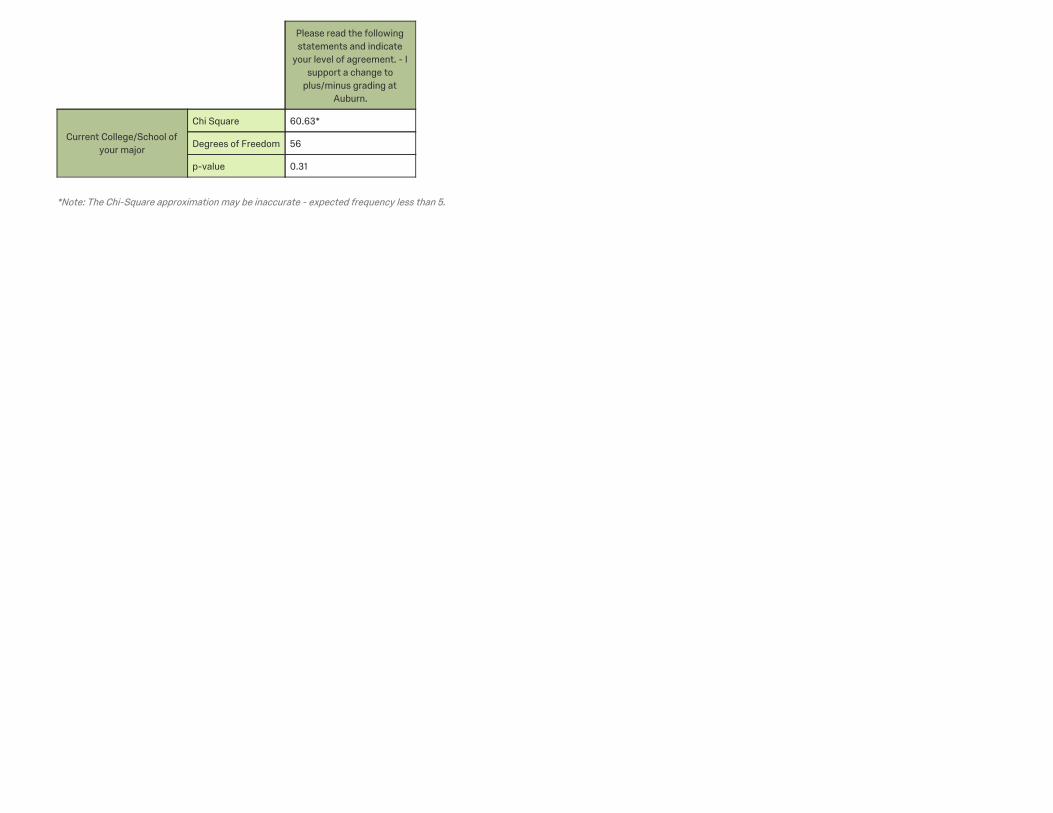
Current College/School ofyour major
Chi Square 60.63*
Degrees of Freedom 56
p-value 0.31
*Note: The Chi-Square approximation may be inaccurate - expected frequency less than 5.

FINAL Student Standing by Change
Strongly Agree Agree Neutral Disagree Strongly Disagree Total
Freshman 132.85%
173.73%
153.29%
408.77%
37181.36%
456100.00%
Sophomore 285.00%
183.21%
244.29%
508.93%
44078.57%
560100.00%
Junior 257.33%
113.23%
144.11%
3510.26%
25675.07%
341100.00%
Senior 155.98%
176.77%
197.57%
4517.93%
15561.75%
251100.00%
graduatestudent
66.45%
88.60%
55.38%
1111.83%
6367.74%
93100.00%
Total 875.11%
714.17%
774.53%
18110.64%
128575.54%
1701100.00%
Please read the followingstatements and indicate
your level of agreement. - Isupport a change to
plus/minus grading atAuburn.
Current academic standing
Chi Square 51.73*
Degrees of Freedom 16
p-value 0.00
*Note: The Chi-Square approximation may be inaccurate - expected frequency less than 5.
Please read the following statements and indicate your level of agreement. - I support a change to plus/minus grading atAuburn.
Current academic standing

FINAL Student Crosstab Intent Grad by Change
Strongly Agree Agree Neutral Disagree Strongly Disagree Total
Yes 504.89%
414.01%
454.40%
999.68%
78877.03%
1023100.00%
No 134.91%
176.42%
114.15%
3412.83%
19071.70%
265100.00%
Unsure 225.77%
153.94%
174.46%
4912.86%
27872.97%
381100.00%
Total 855.09%
734.37%
734.37%
18210.90%
125675.25%
1669100.00%
Please read the followingstatements and indicate
your level of agreement. - Isupport a change to
plus/minus grading atAuburn.
I intend to apply forgraduate/professional
school in the future.
Chi Square 8.28
Degrees of Freedom 8
p-value 0.41
Please read the following statements and indicate your level of agreement. - I support a change to plus/minus grading atAuburn.
I intend to apply for graduate/professional school in thefuture.