final report investigation of fatal motor vehicle …€¦ · · 2015-03-12final report...
TRANSCRIPT

FINAL REPORT
Investigation of Fatal Motor
Vehicle Crashes
on Two-Lane Rural Highways
in Georgia By:
Simon Washington, Ph.D.
Karen Dixon, Ph.D., P.E.
David White
and
Chi-Hung E. Wu, Ph.D
The Georgia Institute of Technology
July 2002
Prepared for the
Georgia Department of
Transportation

TECHNICAL REPORT STANDARD TITLE PAGE 1.Report No.: FHWA-GA-02-9905
2. Government Accession No.:
3. Recipient's Catalog No.:
5. Report Date: July 2002
4. Title and Subtitle: Investigation of Fatal Motor Vehicle Crashes on
Two- Lane Rural Highways in Georgia 6. Performing Organization Code:
7. Author(s): Simon Washington, Ph.D. Karen Dixon, Ph.D., P.E. David White Chi-Hung E. Wu, Ph.D.
8. Performing Organ. Report No.: 9905
10. Work Unit No.:
9. Performing Organization Name and Address: Georgia Institute of Technology School of Civil & Environmental Engineering Atlanta, Georgia 30332-0355
11. Contract or Grant No.: 13. Type of Report and Period Covered: Final; June 1999-August 2001
12. Sponsoring Agency Name and Address: Georgia Department of Transportation Office of Materials and Research 15 Kennedy Drive Forest Park, Georgia 30297-2599
14. Sponsoring Agency Code:
15. Supplementary Notes: Prepared in cooperation with the U.S. Department of Transportation, Federal Highway Administration. 16. Abstract: The objective of this study was to determine why a disproportionate number of fatal crashes occur on Georgia two-lane rural highways and identify possible countermeasures (from a host of feasible roadway or roadside improvements) that are the most effective for reducing these fatal crashes. To understand the nature of the crashes, researchers evaluated 150 randomly chosen fatal crashes from 1997. The observed crash characteristics were divided into human, vehicle, roadway, or environmental related characteristics. In an effort to determine potentially effecive countermeasures, researchers combined past knowledge of countermeasure effectivenes with new knowledge gained from engineering evaluations of approximately 30 roadway and roadside countermeasures asessed for the 150 fatal crashes. Through this approach, several countermeasures (under specific conditions) were found to be potentially effective in minimizing crash severity. The report concludes with short-term and long-term safety investment strategies for Georgia. 17. Key Words: fatal crashes, safety improvements, rural highways
18. Distribution Statement:
19. Security Classification (of this report): Unclassified
20. Security Classification (of this page): Unclassified
21. Number of Pages:
204
22. Price:
Form DOT 1700.7 (8-69)

i
TABLE OF CONTENTS
LIST OF TABLES ........................................................................................................... iii
LIST OF FIGURES ......................................................................................................... iv
ABSTRACT....................................................................................................................... v
1.0 EXECUTIVE SUMMARY ....................................................................................... 1
2.0 BACKGROUND ........................................................................................................ 5
3.0 DATA DESCRIPTION ............................................................................................. 9 INTRODUCTION TO CRASH DATABASE........................................................................................................ 9 CRASH DATA SAMPLING PROCEDURE ........................................................................................................ 9
4.0 DESCRIPTION OF FATAL CRASH DATA ....................................................... 13 HUMAN-RELATED CHARACTERISTICS...................................................................................................... 15
Injury Severity .................................................................................................................................... 15 Age Distribution ................................................................................................................................. 16 Seating Position .................................................................................................................................. 17 Safety Restraint System Usage ........................................................................................................... 19 Driving Under the Influence of Alcohol or Drugs .............................................................................. 20 Driver Condition ................................................................................................................................. 22
VEHICLE-RELATED CHARACTERISTICS .................................................................................................... 22 Vehicle Type....................................................................................................................................... 24 Vehicle Age ........................................................................................................................................ 24
ROADWAY-RELATED CHARACTERISTICS ................................................................................................. 25 Horizontal Alignment ......................................................................................................................... 25 Vertical Alignment.............................................................................................................................. 30 Lane Width ......................................................................................................................................... 31 Shoulder Type and Shoulder Width.................................................................................................... 34 Type of Roadway Junction ................................................................................................................. 37 Roadside Hazard Rating ..................................................................................................................... 38 Speed Limit......................................................................................................................................... 40 Average Daily Traffic Volume ........................................................................................................... 43
ENVIRONMENT-RELATED CHARACTERISTICS........................................................................................... 44 Day of Week ....................................................................................................................................... 44 Weather Conditions ............................................................................................................................ 44 Lighting Conditions ............................................................................................................................ 44
5.0 COUNTERMEASURE EVALUATION ............................................................... 45 INTRODUCTION......................................................................................................................................... 45 ANALYSIS PROCEDURE............................................................................................................................. 45 INITIAL RESULTS ...................................................................................................................................... 47 REDUCTION OF COUNTERMEASURE LIST.................................................................................................. 50 IDENTIFICATION OF EFFECTIVE COUNTERMEASURES ............................................................................... 51 IDENTIFYING CANDIDATE IMPROVEMENT LOCATIONS IN GEORGIA ......................................................... 54 IMPLEMENTATION OF COUNTERMEASURES FOR SAFETY IMPROVEMENT IN GEORGIA: SHORT-TERM STRATEGY ................................................................................................................................................ 57

ii
IMPLEMENTATION OF COUNTERMEASURES FOR SAFETY IMPROVEMENT IN GEORGIA: LONG-TERM STRATEGY ................................................................................................................................................ 61
6.0 CONCLUSIONS ....................................................................................................... 65
7.0 REFERENCES......................................................................................................... 67
8.0 APPENDIX A -- SAMPLE CRASH FILE ............................................................ 71
9.0 APPENDIX B -- DATA DICTIONARY FOR GDOT RCFILE.......................... 89
10.0 APPENDIX C -- META-ANALYSIS PROCESS ............................................... 99 INTRODUCTION......................................................................................................................................... 99 PROBLEM SPECIFICATION AND STUDY RETRIEVAL ................................................................................ 102
Study Overview ................................................................................................................................ 102 Combining Research Results ............................................................................................................ 102 Identify Artifacts and Associated Attenuation Factors ..................................................................... 103
Attenuation factor for safety study duration (year) ....................................................................................... 103 Attenuation factor for selection bias ............................................................................................................. 103 Attenuation factor for omitted variables........................................................................................................ 104
Determine the appropriate weight for each safety study................................................................... 104 Measuring safety effect size.............................................................................................................. 104 Examining and Reducing Bias.......................................................................................................... 107 Problem Specification and Safety Study Retrieval ........................................................................... 107 Safety Study Eligibility Criteria........................................................................................................ 108
IDENTIFYING, LOCATING, AND RETRIEVING RESEARCH REPORTS.......................................................... 110 Finding References ........................................................................................................................... 110 Retrieving Research Reports............................................................................................................. 111
11.0 APPENDIX D – CLASSIFICATION AND REGRESSION TREE (CART) PROCESS ...................................................................................................................... 115
12.0 APPENDIX E – COUNTERMEASURE HANDBOOK .................................. 121

iii
LIST OF TABLES
Table 1: Distribution of Contributing Crash Cause in the Study’s Crashes ....................... 14
Table 2: Distribution of Most Harmful Event in the Study’s Crashes ............................... 14
Table 3: Severity Distribution for Different Type of People.............................................. 15
Table 4: Association between Seating Position and Type of Severity............................... 18
Table 5: Distribution of Safety Restraint System Usage .................................................... 19
Table 6: The Association between Safety Restraint System Usage and Ejection..............20
Table 7: Distribution of Alcohol/ Drug Involvement ......................................................... 21
Table 8: Summary of Driver Conditions.............................................................................22
Table 9: Vehicle Type Distribution in the Study’s Crashes ................................................23
Table 10: Association between Horizontal Alignment and Estimated Curve Radius .......26
Table 11: Distribution of Crash Locations, Direction of Curves, and Curve Radius .........27
Table 12: Distribution of Location, Curve Direction, Shoulder, and Striping...................30
Table 13: Characteristics of Vertical Alignment of Crash Locations.................................. 31
Table 14: Lane Width Distribution for 150 Fatal Crashes..................................................32
Table 15: Lane Width Distribution for Different Horizontal Alignments .........................33
Table 16: The Average Lane Width for Different Types of Shoulders ...............................36
Table 17: Summary of Roadside Hazard Rating at Crash Locations .................................39
Table 18: Distribution of Speed Limits and Lane Widths .................................................. 41
Table 19: Countermeasure List ...........................................................................................46
Table 20: Countermeasure List for Meta-Analysis ............................................................48
Table 21: Countermeasure Theta List for Engineering Evaluation ..................................49
Table 22: Reduced “Effective” Countermeasure List from Meta-Analysis........................ 51
Table 23: Reduced “Effective” Countermeasures List from CART (based on Engineering
Evaluations).................................................................................................................52
Table 24: Georgia Candidate Roadway and Sections.........................................................56
Table 25: “Most Promising” Countermeasure List.............................................................59
Table 26: Fatal Crashes’ Relationship to “Effective” Countermeasures............................59
Table 27. Data Dictionary for R C File .............................................................................. 90
Table 28. Sample Meta-Analysis Table............................................................................113

iv
LIST OF FIGURES
Figure 1: Data Sampling Procedure .................................................................................... 12
Figure 2: Age Distribution of Drivers and Non-Drivers in the Study Crashes................. 16
Figure 3: At-fault Rates by Types of Vehicles in the Study’s Crashes...............................25
Figure 4: Comparison of Mean and 95% Confidence Intervals on Lane Widths ..............34
Figure 5: Shoulder Type Distribution .................................................................................35
Figure 6: Distribution of Types of Roadway Junction of Crash Locations........................37
Figure 7: Distribution of Roadside Hazard Rating.............................................................39
Figure 8: Distribution of Speed Limits ............................................................................... 41
Figure 9: Comparison of Mean and 95% Confidence Intervals on Speed Limits..............42
Figure 10: Distribution of Average Daily Traffic Volume ..................................................43
Figure 11: CART for Countermeasure 22 ...........................................................................117
Figure 12: Pruned CART for Countermeasure 22 ............................................................ 118

v
ABSTRACT
Fatal crashes nationwide on two-lane rural highways, the largest single class of
highways in the United States, comprised 19,680 in 1997, with 751 of those
occurring in Georgia. When faced with a number of highway safety projects and
working with a limited budget, transportation safety managers choose projects
that result in the greatest reduction of fatalities, injuries, and property damage
resulting from motor vehicle crashes. Prior to the implementation of any given
safety countermeasure a safety manager would be best served to know, with the
highest degree of certainty possible, the expected effect of a countermeasure on
highway safety. The options currently available to the safety manager for
managing road safety investments can make decision-making difficult and safety
managers clearly benefit from a repeatable and objective process that facilitates
the evaluation of a number of safety countermeasures at the same time, while
providing with greater confidence an estimate of the expected effect on highway
safety in their local jurisdiction.
This research includes an evaluation of 150 randomly selected fatal crashes for
public two-lane roads in Georgia—including both state and non-state maintained
facilities. Two-lane rural roads are the focus of this research due to an over-
representation of fatal crashes on this type of highway. The intent of this
research is to identify engineering countermeasures that will be most beneficial
in the state of Georgia, and to identify and describe conditions under which fatal
crashes have been occurring in the state.
The technical approach presented in this paper and undertaken in this research
involves Bayesian techniques. This methodology is an advanced analytical
technique for assessing countermeasures in regional safety programs and
combines crash reconstruction analysis with statistical results from past studies
to determine countermeasures from a host of feasible roadway or roadside
improvements that are the most effective for reducing fatal crashes on two-lane

vi
rural highways in Georgia, and to prioritize them with respect to the highest
expected number of lives saved.
Five recommended countermeasures are presented as a product of this analysis.
In addition, two safety investment strategies (short-term and long-term) are
recommended to the Georgia Department of Transportation (GDOT).

1
1.0 EXECUTIVE SUMMARY
The objective of this research was to determine why a disproportionate number
of fatal crashes occur on Georgia two-lane rural highways, and identify possible
countermeasures (from a host of feasible roadway or roadside improvements)
that are the most effective for reducing these fatal crashes. This executive
summary presents the key findings of this research. Throughout this executive
summary references to supporting details later in the document are provided.
To determine the best way to reduce the number or severity of crashes, the nature
of these crashes must first be understood. For this effort, the research team
evaluated 150 randomly chosen fatal motor vehicle crashes for 1997.
The observed crash characteristics can be generally divided into human, vehicle,
roadway, or environmental related characteristics. In general, the 150 crashes
were characterized by the following:
Human Related Characteristics:
• 71% of the involved drivers were male,
• 11 pedestrians were involved (8 fatally injured),
• Approximately one-third of the crashes were directly associated with
drivers under the influence of alcohol (also, toxicology results were not
available for 20% of the 150 crashes, so alcohol involvement was
conceivably much greater),
• Approximately 20% of the crashes were due to driver error or
inattention, and
• Almost 50% of the people involved in the crash did not use safety
restraints.
Vehicle Related Characteristics:
• Approximately 41% of the crashes occurred between two moving
vehicles, 35% occurred when a vehicle impacted a roadside object, and
17% of the crashes resulted in overturned vehicles (generally due to
roadside conditions),

2
• 66% of the at-fault vehicles were single-occupant vehicles, and
• 55% of the involved vehicles were passenger cars and 24% were pickup
trucks.
Roadway Related Characteristics:
• 59% of the crashes occurred on state routes, and 41% occurred on
county or local roads,
• 49% of the crashes occurred at horizontal curve locations (more than
half of these curves were sharp enough to require speed reduction),
• About two-thirds of the crashes occurred at roads with lane widths of
11’ or less,
• Only 29% of the crash sites had either a paved shoulder or a raised curb
adjacent to the road,
• Only 12% of the sites had traversable roadside conditions suitable for
the driver of an errant vehicle to correct the path of the vehicle,
• Almost 77% of the crashes occurred on roads with speed limits of 55
mph, and
• Almost 98% of the crashes occurred on roads with average daily traffic
volumes of 10,000 vehicles per day or less.
Environmental Related Characteristics:
• 54% of the crashes occurred during daylight conditions, and
• 81% of the crashes occurred on dry days (no inclement weather).
In an effort to determine potentially effective countermeasures, the research
team undertook a technical approach that combined past knowledge of
countermeasure effectiveness with new knowledge gained from engineering
evaluations of approximately 30 roadway and roadside countermeasures
assessed for the 150 fatal crashes.
Through this approach several countermeasures (under specific conditions) were
found to be potentially effective in minimizing crash severity, with the
recommended countermeasures summarized as:

3
1. Addition of advisory speed signs or other speed controls,
2. Geometric alignment improvements,
3. Widening of lanes/pavement widths,
4. Adding and/or widening graded/stabilized shoulders, and
5. Widening/improvement of clear zones.
Appendix E contains the “Countermeasure Handbook” developed for this study
with more specific information about the individual countermeasures and their
placement.
Addition of advisory speed signs or other speed controls are applicable at sharp
curve locations or locations where reduced operating speed is prudent, for
example locations where sight distance is restricted.
Geometric alignment improvements include potential improvements to either
horizontal and vertical alignment or both, such as increasing curve radius or
length. These improvements should be considered when other less costly
countermeasures are not effective, and when the current roadway geometric
design can significantly benefit from alignment improvements.
Widening of lanes/pavement widths specifically relates to the roadway lane or
pavement width and excludes consideration of paving the shoulder. The lanes
should not be widened at the expense of eliminating an existing paved shoulder.
Adding and/or widening graded/stabilized shoulders specifically relates to
graded or stabilized shoulders and excludes consideration of paving the shoulder.
Shoulders are not widened at the expense of an existing paved shoulder. It also
suggests that problems such as edge-rutting, commonly seen at rural road
locations with roadside mailboxes, would be addressed with this countermeasure.
Widening/improvement of clear zones is associated with improving the
survivability of run-of-road type crashes. It may involve flattening the side slopes,

4
removal of roadside obstacles such as trees, rocks, and increasing available
stopping distance adjacent to the road.
The authors identified these countermeasures and the specific conditions under
which they are effective (see Table 25) as the most beneficial roadway and/or
roadside improvements for reducing fatal motor vehicle crashes on two-lane
rural roads in Georgia.
The report concludes with a short-term and long-term safety investment strategy
to guide the Georgia Department of Transportation (GDOT) with making safety
improvement decisions. These strategies are discussed in detail in Section 5 (see
pages 57-64).

5
2.0 BACKGROUND
Fatal crashes nationwide on two-lane rural highways, the largest single class of
highways in the United States, comprised 19,680 in 1997, with 751 of those
occurring in Georgia (NHTSA, 1999). When faced with a number of highway
safety projects and working with a limited budget, transportation safety
managers choose projects that result in the greatest reduction of fatalities,
injuries, and property damage resulting from motor vehicle crashes. Prior to the
implementation of any given safety countermeasure a safety manager would be
best served to know, with the highest degree of certainty possible, the expected
effect on highway safety. The options currently available to the safety manager
include locally funded research, an extensive literature review to identify and
locate similar studies transferable to local jurisdictions, and less formal
techniques such as anecdotal “lessons learned.”
These approaches for managing road safety investments can make decision-
making difficult. First, past studies may only provide insight into the effects of a
single countermeasure, may have been conducted on roadways with significantly
different features, roadside environment, or driving population, or may be
conflicting. Anecdotal evidence is hard to support publicly, while conducting new
lengthy studies is costly and time consuming, and usually does not provide timely
information for immediate safety investment decisions.
Safety managers clearly benefit from a repeatable and objective process that
facilitates the evaluation of a number of safety countermeasures at the same time,
while providing with greater confidence an estimate of the expected effect on
highway safety in their local jurisdiction.
This research aims to evaluate the nature of fatal crashes on rural two-lane
highways in Georgia, determine recommended countermeasures for minimizing
these crashes, and provide a robust decision-making tool for safety managers to
help identify which countermeasures to select. The technical approach presented

6
in this paper and undertaken in this research involves Bayesian techniques and is
termed the Bayesian Safety Analysis Framework (B-SAF) (Hauer, 1997; Harlow,
Mulaik, & Steiger, 1997; Greene, 1990). This methodology is an advanced
analytical technique for assessing countermeasures in regional safety programs.
Bayesian approaches, in general, combine “objective” prior expert knowledge or
information such as literature reviews, with “subjective” current information
such as engineering evaluations to derive meaningful “posterior” information on
probability distributions of Crash Reduction Factors (CRF’s). To apply Bayes’
theorem in the B-SAF methodology, prior and current estimates of CRF’s are
combined to obtain posterior estimates of CRF’s. In general, Bayesian statistical
philosophy asserts that useful information can be learned about specific
observable events through subjective, expert evaluation or insight. It is thought
that past information can always be updated with current information, and the
process of research is iterative. A fundamental element in the Bayesian
framework is the requirement for useful and meaningful ‘subjective’ or ‘prior’
expert information. This element is critical for the process to be informative. In
fact the most significant criticism of the Bayesian philosophy is the manner in
which subjective information is obtained. In the B-SAF methodology, subjective
information is obtained from engineering evaluation of crashes and
countermeasures, termed Iterative Countermeasure Analysis Technique, A
Microscopic Analysis Method, discussed in detail in a companion paper.
There is a considerable interpretive advantage of Bayesian statistical inference
because posterior estimates of CRF’s reflect different probabilities than do
classical confidence or prediction intervals (Hauer, 1983; Pruzek, 1997). In other
words, the most likely value of a CRF for a specific countermeasure is obtained
from B-SAF, whereas classical statistical methods, such as regression and
ANOVA, provide the probability that a CRF lies within a range of values—a
considerable philosophical and practical difference.
This methodology also combines crash reconstruction analysis, which is based
purely on engineering and physics principles and logic, with statistical results

7
from past studies. It is this combination of information that provides faith to the
safety management engineer that countermeasure effectiveness estimates are
grounded in engineering fundamentals, while relying also on past empirical
studies that have been conducted to assess countermeasure effectiveness.
While this approach has considerable advantages over alternative approaches for
assessing countermeasures, it is subject to some shortcomings, none of which are
new to the field of road safety. For example, it is not known precisely how much
weight to give to past study results (in conventional studies zero weight is
given)—in our study we tried to give equal weight to engineering evaluations and
past research findings. However, by conducting careful analysis by highly
experienced and trained professionals, the B-SAF methodology offers a sound
theoretical and practical framework for assessing safety-related
countermeasures.

8
This Page Left Blank Intentionally

9
3.0 DATA DESCRIPTION
This section describes the fatal crashes used for this research.
INTRODUCTION TO CRASH DATABASE
In the State of Georgia, the GDOT acquires and maintains information on all
reported traffic crashes (including fatal, injury, and property-damage-only
crashes) in a comprehensive database. In the following sections, the “GDOT
crash database” denotes this comprehensive crash database.
The Georgia Department of Public Safety initially constructed this crash database
on the basis of the Georgia Uniform Motor Vehicle Accident Report Form (police
crash report) and provided this data to GDOT who, in turn, coordinated the
database with the Road Characteristic (RC) data file (a statewide roadway
inventory database). In the GDOT crash database, traffic crashes are categorized
by six main classifications: crash, commercial vehicle (if commercial vehicles
were involved), occupant, roadway, ramp (if the crash occurred on ramp), and
driver and vehicle related information. All of the crash-related information in
any of these six major categories can be retrieved using Microsoft Access.
CRASH DATA SAMPLING PROCEDURE
This section describes the data sampling process that generated the selected
sample crash database developed for this study. As mentioned previously, the
research is limited to the study of fatal crashes occurring on rural two-lane
highways. Per the GDOT crash database, in 1997 there were 640 fatal crashes on
rural two-lane highways in the state of Georgia. These 640 fatal crashes make up
the target crash database of interest in this study, and were used to provide the
data for the engineering evaluations. Due to time and budget limitations, 150
fatal crashes from the crash database were randomly selected. This sample
represents approximately 23.7% of the total fatal crashes observed in the Georgia
database.

10
First, the research team collected basic information on the target crashes using
the 1997 Fatal Analysis Reporting System (FARS) database. The FARS system
was created by the United States Department of Transportation (U.S. DOT)
National Highway Traffic Safety Administration (NHTSA) in 1975 in order to
improve traffic safety and record keeping. The research team downloaded the
target crash database by specifying those fatal crashes occurring on rural two-
lane highways without median separation in the state of Georgia.
Next, the research team employed a random number generator to create a
shortened list of 175 crash cases. Researchers cross-referenced the 175 FARS
fatal crashes on rural two-lane highways from the GDOT crash database. Due to
apparent discrepancies between the GDOT and FARS database, six out of the 175
FARS crashes were not displayed in the retrieved data set from the GDOT crash
database, resulting in 169 successful matches. After checking these ‘missing’
crashes, researchers found that in these six cases, one of them was mis-recorded
in its roadway functional classification, two were mis-recorded with respect to the
number of lanes, and three of them had an unknown number of lanes. Therefore,
the research team added these 6 cases into the “target” crash database. GDOT
provided copies of the police reports for these 175 pre-selected fatal crashes.
For the next analysis step, the research team checked each of these pre-selected
fatal crashes to verify complete crash data information, successfully matched
conditions (e.g. rural two-lane highways), etc. The research team identified 12
cases with mismatched information or unavailable/incomplete police reports,
and replaced them with randomly selected crash cases from the remainder of the
target crash database.
Next, the Georgia Tech (GT) team prepared a site data collection form and
performed field surveys for approximately 75% of these 175 pre-selected fatal
crashes, in particular those sites with a non-state route as at least one of the
intersecting roadways. An example of the data collection form is provided in the

11
example crash file contained in Appendix A. The research team utilized the
GDOT video library for the remaining 25% state-route sites to obtain site-related
information such as direction of curve, cross-section, roadside hazard rating, etc.
At this stage, the research team removed several incomplete crash cases from this
175 pre-selected crash database. This left the sample size at 159 crashes. The
research team utilized the random generator again to select 150 crash cases out of
these 159 crash cases. These 150 final selected fatal crashes account for 23.4% of
the target database.
Finally, the research team created a detailed crash database on the basis of this
150-case final selected crash database, supplementing it with original police
reports, crash site investigation reports, and crash site photos. Figure 1 shows
the data sampling procedure used in the study.

12
Figure 1: Data Sampling Procedure
Download 1997 FARSDatabase (Georgia)
Fatal Crashes on RuralTwo-Lane Highways
• Number of Lanes• Median Separation• Function Classification of Road Type
Random Generator
A list of 175-CrashCase Number
175 Pre-Selected Crashes
Original Police Reports ofthese 175 Pre-Selected
Crashes
Check these 175 Pre-Selected Cases • Completion• Matched Conditions
Crash Site Survey
GDOT Crash Database
Query
Select Samples
150 Final SelectedCrash Database
Random Generator
159 UsableFatal Crashes
Yes
No
Removed Fromthe Pre-SelectedCrash Database
NoPhysical RoadwayConditions of Interest?
Available
NotAvailable
Create a Detailed150-Case Database
• Original Police Reports• Site Investigation• Site Photos• Emergency Medical Records
Select Samples
Field Site Survey
GDOT Video Log Yes
Query

13
4.0 DESCRIPTION OF FATAL CRASH DATA
In the 150 studied fatal crashes, the crash reports indicated 350 people and 235
involved vehicles. Out of these 235 vehicles, 3 were parked vehicles that were
struck by at-fault drivers. In addition, 11 of the involved people were pedestrians
(coded on crash reports as a second vehicle). Therefore, the number of actual
moving vehicles involved in the 150 fatal crashes is 221 vehicles.
The 150 crashes actually included only 347 people (3 “drivers” eliminated since 3
parked vehicles did not actually have drivers in the vehicles when the crashes
occurred). Two drivers included in the remaining 347 people fled the crash
scenes. Due to insufficient information regarding these two drivers, they are not
included in driver specific statistics. One of the two drivers fled the crash scenes
on foot (left the vehicle on scene) and one drove away with the vehicle involved in
the crash. Therefore, in the crash database, the information regarding this
missing vehicle is incomplete. As a result, the remaining number of people and
vehicles add up to 345 and 220, respectively.
Out of these 150 fatal crashes, 80 (53.3%) were single-vehicle crashes, 62 (41.3%)
crashes involved multiple vehicles, and 8 (5.4%) crashes involved pedestrians. Of
the 345 people in the final crash database, 219 were drivers, 115 were passengers,
and 11 were pedestrians.
Table 1 shows the perceived primary causes for the 150 fatal crashes of which
more than one-third (58) were related to DUI and more than one-fifth (32) were
caused by driver error.
Table 2 depicts the reported most harmful event for the 150 fatal crashes.
“Impact moving vehicles” (41.3%), “impact roadside obstacle” (34.7%), and
“overturned vehicle” (16.7%) account for the majority of most harmful events.

14
Table 1: Distribution of Contributing Crash Cause in the Study’s Crashes
Contributing Cause Frequency Percent
DUI- Alcohol & Drugs 58 38.7%
Driver Error 32 21.3%
Driver Condition (Fatigue/Drowsy) 12 8.0%
Too Fast for Weather 11 7.3%
Speeding 9 6.0%
Horizontal Curve 8 5.3%
Driver Inexperience 5 3.3%
Pedestrian Related 5 3.3%
Foreign Object in Road 4 2.7%
Drinking (Not Legally Impaired) 3 2.0%
In-Vehicle Distraction 1 0.7%
Environment Related 1 0.7%
Vehicle Related 1 0.7%
Total 150 100%
Table 2: Distribution of Most Harmful Event in the Study’s Crashes
Most Harmful Event Frequency Percent
Impact Moving Vehicle 62 41.3 %
Impact Roadside Obstacle 52 34.7 %
Overturned Vehicle 25 16.7 %
Injured in Vehicle 5 3.3 %
Immersion 2 1.3 %
Fell From Vehicle 2 1.3 %
Impact Parked Vehicle 1 0.7 %
Fire 1 0.7 %
Total 150 100%

15
HUMAN-RELATED CHARACTERISTICS
Injury Severity
Out of the 345 people involved in the fatal crashes, 173 (50.1%) were killed, 39
(11.3%) suffered incapacitating injuries, 60 (17.4%) had non-incapacitating
injuries, 29 (8.4%) were possibly incapacitating injuries, and 44 (12.8%) people
were not injured. Of these 345 people, 226 (65.5%) were male and 119 (34.5%)
were female. A total of 156 of the 219 drivers (71.2%) were male. Similarly, 64 of
the 115 involved passengers (55.7%) were male, and 6 of the 11 pedestrians
(54.5%) were male.
Table 3: Severity Distribution for Different Type of People
Severity Type Driver Passenger Pedestrian Total
Killed (K) 126
(57.5%)
39
(33.9%)
8
(72.7%)
173
(50.1%)
Nonfatal Injury,
Incapacitating (A)
16
(7.3%)
22
(19.1%)
1
(9.1%)
39
(11.3%)
Nonfatal Injury, Non-
incapacitating (B)
31
(14.2%)
27
(23.5%)
2
(18.2%)
60
(17.4%)
Nonfatal Injury, Possible (C) 18
(8.2%)
11
(9.6%)
0
(0.0%)
29
(8.4%)
Not Injury (O) 28
(12.8%)
16
(13.9%)
0
(0.0%)
44
(12.8%)
Total 219* 115 11 345
* Note: Two drivers fled the crash scenes.

16
Of these 219 drivers, 126 (57.5%) did not survive the crashes, 65 (29.7%) were
injured, and 28 (12.8%) were not injured. Among these 115 passengers, 39
(33.9%) were killed during the crashes, 60 (52.2%) were injured, and 16 (13.9%)
were not injured. Unfortunately, 8 out of 11 involved pedestrians (72.7%) did not
survive the crashes. The 3 surviving pedestrians were all survivors of multi-
pedestrian crashes.
Age Distribution
Among the 345 people involved in the crashes, their ages were randomly
distributed between 0 and 92 years old.
There were 4 drivers (1.8%) under the age of 16 years old. Of these 4 drivers, one
15-year-old driver was driving a large van, one 11-year-old driver was driving a
go-cart, one 11-year-old driver was driving a 4-door sedan, and one 15-year-old
was driving a 4-door sedan.
Figure 2: Age Distribution of Drivers and Non-Drivers in the Study Crashes
0%
5%
10%
15%
20%
25%
30%
35%
40%
<16 16 to 20 21 to 25 26 to 35 36 to 45 46 to 55 56 to 65 66 to 75 Over 75
Age
Perc
ent
Driver Non_Driver

17
Figure 2 shows the age distribution of drivers and non-drivers of the 345
involved people. Essentially, the driver ages were distributed in a “bell” shape.
The average driver age was 37.3 year-old and the standard deviation was 17.4.
The highest frequency (55 drivers) occurred between age 26 and 35 years old and
the second highest frequency was between age 36 and 45 years old. Generally
speaking, the distribution of driver age is skewed to the right. For 30 young
drivers aged between 16 and 20 years old and 31 aged between 21 and 25 years
old, this study shows that the probability of young driver involvement in fatal
crashes is very high as compared to the bell shaped “normal” curve of the other
drivers. In addition, among these 219 drivers, 8 (3.7%) were aged over 75 years
old and 14 (6.4%) drivers were aged between 66 and 75 years old. These figures
indicate that senior drivers are less likely to survive serious crashes than the
healthier, less fragile younger driving population.
A total of 46 out of 126 of the non-driving passengers (36.5%) were younger than
16 years old. The age distribution is skewed to the right and follows an
exponential distribution. The average non-driver age was 27.5 years old with a
standard deviation of 21.2 years. For those non-drivers aged between 26 and 55,
the number of people involved in fatal crashes was evenly distributed.
Seating Position
As previously indicated, 219 of the 345 involved people were drivers, 115 were
passengers, and 11 were pedestrians. Out of the 115 passengers, 6 (5.2%) were
seated in the front center, 71 (61.7%) were in the front right, 15 (13.0%) were in
the second-row-left, 10 (8.7%) in the second-row-center, 10 (8.7%) in the second-
row-right seats, and 3 (2.6%) in the unenclosed or cargo areas.
Table 4 demonstrates that in the study crashes, drivers experienced a probability
of approximately 57.5% of being killed and an 87.2% of injury. For people seated
in the front middle seats, the probability of fatal injury was zero but the chance of
injury was 83.8%. The likelihood that the front-right passengers might be fatally
injured was 43.7% with a 90.1% likelihood of injury. For passengers seated in the

18
second-row, the right-side passengers had a 30.0% probability of fatal injury and
an 80.0% chance of injury, while passengers seated on the left-side experienced a
20.0% probability that they would not survive the crash and a 73.3% likelihood
that they would be injured. This disproportionate survival rate is based on a
small total sample size of 6 fatally wounded passengers. The fatality ratio for the
11 pedestrians was 72.7% with an unfortunate injury ratio of one hundred
percent.
Table 4: Association between Seating Position and Type of Severity
Seating Position Not
Injured Injured Killed Total
Fatal Ratio
Injury Ratio
Driver Seat 28 65 126 219 57.5% 87.2%
Front Middle 1 5 0 6 0.0% 83.3%
Front Right 7 33 31 71 43.7% 90.1%
Second-Row Left 4 8 3 15 20.0% 73.3%
Second-Row Middle 1 8 1 10 10.0% 90.0%
Second-Row Right 2 5 3 10 30.0% 80.0%
Cargo Areas 1 1 1 3 33.3% 66.7%
Pedestrian 0 3 8 11 72.7% 100.0%
Total 44 128 173 345 50.1% 87.2%
In general, if a crash occurred, pedestrians had the highest risk of severe injury or
fatality of any person involved in a crash. For front seat drivers or passengers,
the likelihood that they would not survive the crash or they would be injured was
higher than the odds of second-row passengers. In addition, the chance that
passengers seated in the middle would be fatally injured was lower than for
passengers seated on both-sides (immediately adjacent to a car door and
prospective point of impact).

19
Safety Restraint System Usage
As shown in Table 5, 167 of the 345 involved people did not use any safety
restraints. Approximately 31% of the vehicle occupants properly used a shoulder
and lap belt or safety seat. Since the State of Georgia has a primary seat belt law,
this observed non-compliance of the law is a significant factor in evaluating
driver responsibility to occupant severity.
Table 5: Distribution of Safety Restraint System Usage
Restraint System Usage Frequency Percent
Non-Used 167 48.4%
Shoulder Belt Only 5 1.4%
Lap Belt Only 11 3.2%
Shoulder and Lap Belt 102 29.6%
Child Safety Seat 5 1.4%
Helmet Used 3 0.9%
Unknown 41 11.9%
Not Applicable 11 3.2%
Total 345 100.0%
There were 68 of the 345 involved people (19.7%) trapped inside their vehicles, 3
(0.9%) who were extricated by mechanical means. Further, 49 (14.2%) people
were totally ejected from their vehicles and 24 (7.0%) were partially ejected from
their vehicles during crashes as shown in Table 6. Approximately 71% of the
people totally ejected from their vehicles did not use any restraint system. Out of
the 24 people who were partially ejected from their vehicles, 19 (79.2%) did not
use any restraint system and it was not known if 5 people used any restraint
system during crashes. For the 272 people who were not ejected from their

20
vehicles, 41.5% were not using any safety equipment when the crash occurred,
and 37.1% wore both shoulder and lap belts. Table 6 illustrates that even though
the motorcyclists and bicyclists were wearing helmets during crashes, they were
totally ejected from their vehicles and did not survive the crash.
Table 6: The Association between Safety Restraint System Usage and Ejection
Restraint System Usage
Not Ejected
Totally Ejected
Partially Ejected
Total
Non-Used 113 35 19 167
Shoulder Belt Only 5 0 0 5
Lap Belt Only 11 0 0 11
Shoulder and Lap Belt 101 1 0 102
Child Safety Seat 5 0 0 5
Helmet Used 0 3 0 3
Unknown 26 10 5 41
Not Applicable 11 0 0 11
Total 272 49 24 345
Driving Under the Influence of Alcohol or Drugs
Two drivers left the crash scenes. One of the drivers was considered an at-fault
driver and the other was not at-fault. Therefore, in the study crashes, there are
149 at-fault drivers (including 5 at-fault pedestrians) and 75 not at-fault drivers.
As shown in Table 7, of these 149 at-fault drivers, 56 (37.6%) were not under any
influence of alcohol or drugs when crashes occurred and 30 (20.3%) were in
unknown condition. According to the police reports, 63 (42.3%) at-fault drivers
were driving under the influence (DUI) of alcohol and/or drugs.

21
Table 7: Distribution of Alcohol/ Drug Involvement
Type of People
At-Fault Driver or Pedestrian
Not-At-Fault Driver or Pedestrian
Alcohol/ Drug Involvement
Frequency Percent Frequency Percent
Non-DUI 56 37.6% 39 52.0%
DUI-Alcohol 44 29.5% 2 2.7%
DUI-Drugs 13 8.7% 2 2.7%
DUI-Alcohol and Drugs 6 4.0% 0 0.0%
Unknown 30 20.1% 32 42.7%
Total 149 100.0% 75 100.0%
For not at-fault drivers, 39 (52.0%) of them were not under the influence when
the crash occurred. The crash information did not definitively indicate the
condition for 32 (42.7%) drivers. There were only 4 not-at-fault drivers (5.4%)
who were under the influence of alcohol or drugs when the crashes occurred.
Among the 11 pedestrians involved in the 150 study fatal crashes, 5 were
considered to be at-fault. Of the 11 pedestrians, 2 were under the influence of
alcohol, 1 was under the influence of both alcohol and drugs, and the impairment
condition of the remaining 8 was not known.
In summary, in spite of the drivers whose condition was not known, impaired
drivers clearly have a higher likelihood of being at-fault, or responsible for the
occurrence of crashes. Therefore, DUI drivers can be considered as one of the
causal factors to traffic crashes.
22
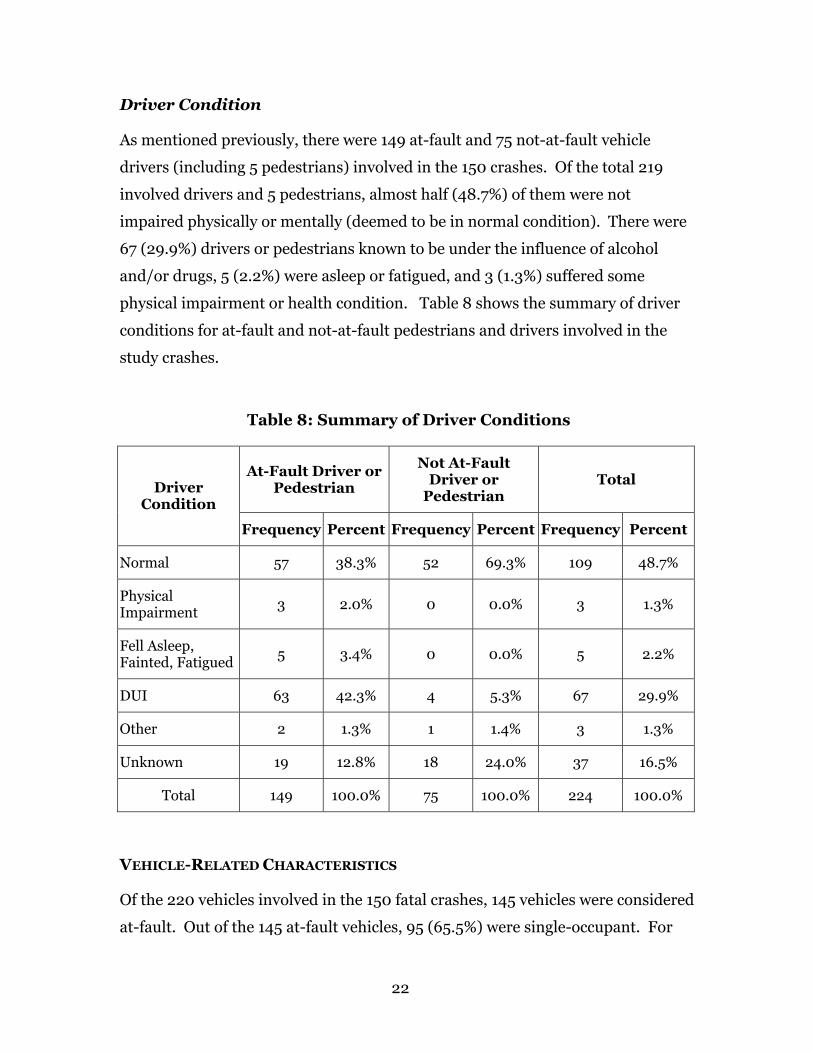
Driver Condition
As mentioned previously, there were 149 at-fault and 75 not-at-fault vehicle
drivers (including 5 pedestrians) involved in the 150 crashes. Of the total 219
involved drivers and 5 pedestrians, almost half (48.7%) of them were not
impaired physically or mentally (deemed to be in normal condition). There were
67 (29.9%) drivers or pedestrians known to be under the influence of alcohol
and/or drugs, 5 (2.2%) were asleep or fatigued, and 3 (1.3%) suffered some
physical impairment or health condition. Table 8 shows the summary of driver
conditions for at-fault and not-at-fault pedestrians and drivers involved in the
study crashes.
Table 8: Summary of Driver Conditions
At-Fault Driver or Pedestrian
Not At-Fault Driver or
Pedestrian Total Driver
Condition
Frequency Percent Frequency Percent Frequency Percent
Normal 57 38.3% 52 69.3% 109 48.7%
Physical Impairment
3 2.0% 0 0.0% 3 1.3%
Fell Asleep, Fainted, Fatigued
5 3.4% 0 0.0% 5 2.2%
DUI 63 42.3% 4 5.3% 67 29.9%
Other 2 1.3% 1 1.4% 3 1.3%
Unknown 19 12.8% 18 24.0% 37 16.5%
Total 149 100.0% 75 100.0% 224 100.0%
VEHICLE-RELATED CHARACTERISTICS
Of the 220 vehicles involved in the 150 fatal crashes, 145 vehicles were considered
at-fault. Out of the 145 at-fault vehicles, 95 (65.5%) were single-occupant. For

23
the not at-fault vehicles, 50 (66.7%) were single-occupant. Overall, there were
145 (65.9%) single-occupant vehicles in the study crashes.
Table 9: Vehicle Type Distribution in the Study’s Crashes
At-Fault Not-At-Fault Total Type of Vehicle
Freq. Percent Freq. Percent Freq. Percent
2 Door Sedan/HT/ Coupe 29 20.0% 12 16.0% 41 18.6%
4 Door Sedan/ HT 50 34.5% 17 22.7% 67 30.5%
Station Wagon 1 0.7% 0 0.0% 1 0.5%
Compact Sport Utility 9 6.2% 9 12.0% 18 8.2%
Large Sport Utility 2 1.4% 0 0.0% 2 0.9%
Minivan 2 1.4% 1 1.3% 3 1.4%
Large Van 8 5.5% 8 10.7% 16 7.3%
Compact Pickup 21 14.5% 7 9.3% 28 12.7%
Standard Pickup 14 9.7% 4 5.3% 18 8.2%
Truck/ Tractor 6 4.1% 9 12.0% 15 6.8%
Heavy Single Unit Truck 2 1.4% 4 5.3% 6 2.7%
Motorcycle 1 0.7% 1 1.3% 2 0.9%
Farm Equipment 0 0.0% 1 1.3% 1 0.5%
Others 0 0.0% 2 2.7% 2 0.9%
Total 145 100.0% 75 100.0% 220 100.0%

24
Vehicle Type
Table 9 shows the specific type of vehicles for the 220 study vehicles. Of the 145
at-fault vehicles, 34.5% were four-door sedans, 24.1% were pickup trucks,
20.0% were two-door sedans, 7.6% were sport utility vehicles, 6.9% were vans,
4.1% were combination trucks, and 1.4% were heavy single unit trucks. Out of the
75 not at-fault vehicles, 22.7% were four-door sedans, 16.0% were two-door
sedans, 14.7% were pickup trucks, 12.0% were combination trucks, 12.0% were
sport utility vehicles, 12.0%)were vans, and 5.3% were heavy single unit trucks.
For at-fault rates, the research team compared the number of at-fault vehicles
and the totals for each type of vehicle and found that the at-fault rates for station
wagons and large utility trucks are the highest for the 150 crash sample at one
hundred percent. However, the sample sizes for these two vehicle types are very
small (1 station wagon and 2 large utility trucks). In general, the at-fault rates of
pickup trucks (76.1%) and passenger cars (73.1%) are high. The at-fault rates of
sport utility vehicles and vans are also over 50%, with the at-fault rate of
motorcycles at 50%. For this study, the at-fault rate of heavy vehicles (38.1%) is
less than that of passenger cars (73.1%). The distribution of at-fault rates for
different types of vehicles is shown in Figure 3.
Vehicle Age
Out of these 220 studied vehicles, two were not included in the calculation of
vehicle age in this study because they were a bike and a go-cart. Therefore, the
actual number of vehicles analyzed was 218 vehicles. Of the 218 vehicles, the
average vehicle age was approximately 8.9 years and the standard deviation was
6.1 years. For at-fault vehicles, the average vehicle age was 9.0 years old and the
standard deviation was 6.6 years old. For not at-fault vehicles, the average
vehicle age was 8.5 years old and the standard deviation was 5.1 years old.

25
Figure 3: At-fault Rates by Types of Vehicles in the Study’s Crashes
In summary, the average vehicle age of those vehicles driven by at-fault drivers
was older than the average vehicle age of the not-at-fault vehicles. In addition,
the standard deviation of the at-fault vehicles was greater than the not-at-fault
vehicles.
ROADWAY-RELATED CHARACTERISTICS
The analyzed crashes all occurred on public roads, including 88 (58.7%) that
occurred on state routes, 61 (40.7%) on county routes, and 1 (0.6%) occurred on a
city street.
Horizontal Alignment
A total of 74 of the 150 crash locations (49.3%) occurred at horizontal curves and
76 (50.7%) at straight sections. At the 74 horizontal curve crash locations, 40
(54.1%) were on curves to the right sections and 34 (45.9%) were on curves to the
left sections. In addition, 41 (55.4%) out of the 74 horizontal curve locations had
55.0%52.6%
38.1%
50.0%
0.0%
73.4%76.1%
0%
10%
20%
30%
40%
50%
60%
70%
80%
Passenger Car UtilityVehicle
Pickup Truck Van HeavyVehicle
Motorcycle Others
Type of Vehicle
At-F
ault
Rat
e
26
sharp curves (radius < 820’) and 33 (44.6%) had mild curves (radius > 820’).
Another way to understand how a curve is considered to be sharp is if the driver
should feel that he or she needs to reduce the vehicle operating speed to safely
traverse the curve. No speed adjustment is perceived as required for a mild
curve. The relationship between curves and lane widths is discussed on p. 32 of
the report.
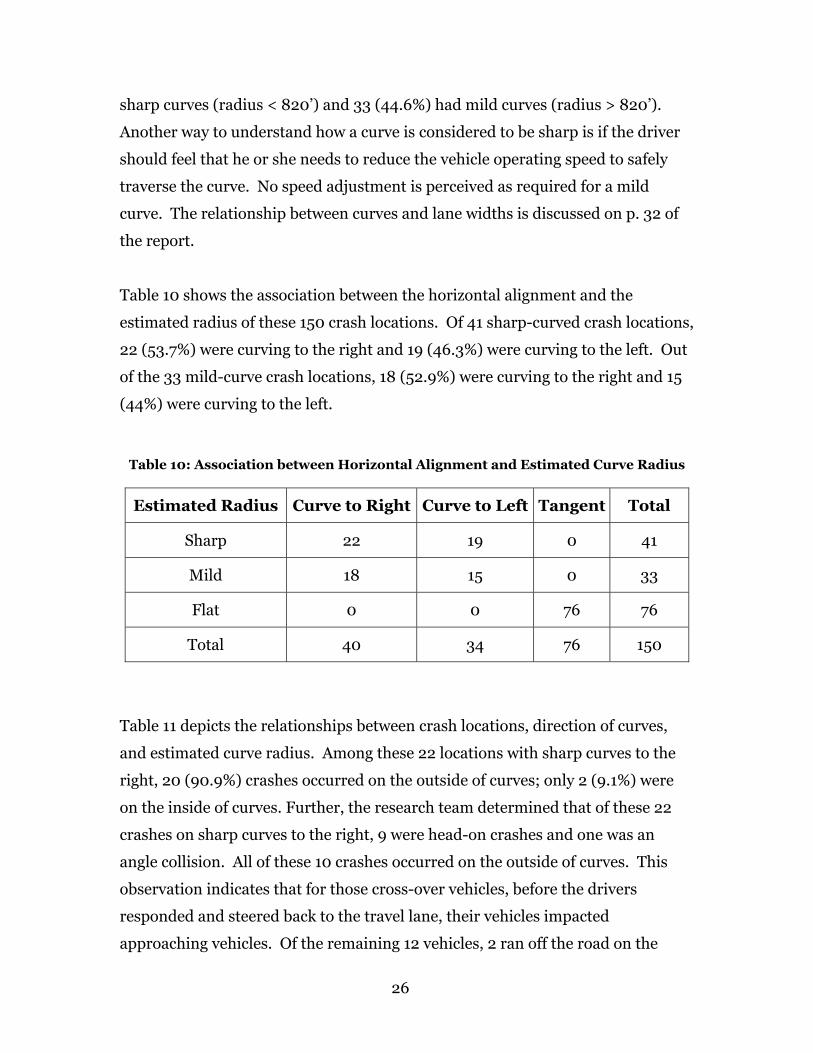
Table 10 shows the association between the horizontal alignment and the
estimated radius of these 150 crash locations. Of 41 sharp-curved crash locations,
22 (53.7%) were curving to the right and 19 (46.3%) were curving to the left. Out
of the 33 mild-curve crash locations, 18 (52.9%) were curving to the right and 15
(44%) were curving to the left.
Table 10: Association between Horizontal Alignment and Estimated Curve Radius
Estimated Radius Curve to Right Curve to Left Tangent Total
Sharp 22 19 0 41
Mild 18 15 0 33
Flat 0 0 76 76
Total 40 34 76 150
Table 11 depicts the relationships between crash locations, direction of curves,
and estimated curve radius. Among these 22 locations with sharp curves to the
right, 20 (90.9%) crashes occurred on the outside of curves; only 2 (9.1%) were
on the inside of curves. Further, the research team determined that of these 22
crashes on sharp curves to the right, 9 were head-on crashes and one was an
angle collision. All of these 10 crashes occurred on the outside of curves. This
observation indicates that for those cross-over vehicles, before the drivers
responded and steered back to the travel lane, their vehicles impacted
approaching vehicles. Of the remaining 12 vehicles, 2 ran off the road on the

27
inside of the curves and 10 crashed on the outside of the curves. This observation
indicates that on the sharp-curved sections, even though cross-over vehicles may
avoid hitting approaching vehicles, the majority of vehicles losing control and
crashing on the outside of the curves still do not have adequate time to steer back
to the appropriate travel lane.
Table 11: Distribution of Crash Locations, Direction of Curves, and Curve Radius
Direction of Curve
Curve to Right Curve to Left Crash Location
Sharp Mild Sharp Mild
Total
Inside of Curve 2 6 11 8 27
Outside of Curve 20 10 8 6 44
Unknown 0 2 0 1 3
Total 22 18 19 15 74
Of the 18 crashes at mild curves to the right, 10 (55.6%) crashes occurred on the
outside of curves, 6 (33.3%) were on the inside of curves, and 2 were unknown.
Among these 18 crashes, one vehicle hit a pedestrian, one was a rear-end crash on
the inside of the curve, 5 were head-on collisions on the outside of the curves, and
4 were angle collisions (3 occurred on the inside of the curves and 1 on unknown
location). For the remaining 7 of the 18 crashes, 2 were side swipe collisions with
approaching vehicles, 1 vehicle ran off the road and crashed on the inside of the
curve and 4 crashed on the outside of the curves. These figures indicate that on
mild-curved road sections, cross-over vehicles have a higher probability of hitting
approaching vehicles. However, drivers who lose control have a higher likelihood
of steering their vehicles back to their traveling lane in comparison to those
vehicles on sharp-curved sections. Nevertheless, approximately one-third of the

28
drivers appear to be over-correcting their vehicles and crash on the inside of the
curves.
Of the 19 locations with sharp curves to the left, 11 (57.9%) crashes occurred on
the inside of the curves and 8 (42.1%) were on the outside of the curves. Among
these crashes, 3 were head-on collisions on the inside of the curves, 2 were angle
collisions on the inside of the curves, 6 ran off road and crashed on the inside of
the curves, and 8 crashed on the outside of the curves. These statistics show that
on the curving to the left sections, more than 50% of drivers who lose control of
their vehicles steer back to the travel lane. With limited perception-reaction
time, most of the drivers over-correct their vehicles and cross over the centerline.
Thus, they have a higher probability of hitting the approaching vehicles or
running off the road on the inside of the curves.
Among the 15 mild curve to the left crash locations, 8 (53.3) were on the inside of
the curves and 6 (40.0%) on the outside of the curves. Out of these crashes, 1 was
a head-on collision on the inside of the curve, 1 angle collision was on the inside
of the curve, 1 angle-collision was at an unknown location, and 1 was a same
direction side-swipe collision on the outside of the curve. In addition, 6 vehicles
ran off the road and crashed on the inside of the curve as well as 5 on the outside
of the curves. Those crash locations show us that on mild curves to the left, only
one-third of vehicles ran off the road in the tangent direction, steering back to the
travel lane. Most of these drivers apparently attempted to steer their out-of-
control vehicles back to the travel lane but over-corrected and crossed the
centerline where they either hit approaching vehicles or ran off the road on the
inside of the curves.
In summary, regardless of the direction of the horizontal curves, sharp curves
generally have higher crash occurrence than mild curves. Due to the limited
perception-reaction time on sharp curves, the probability that errant vehicles will
run off the road and crash on the outside of the curves is higher. On mild-curved
sections, drivers have a better likelihood of steering their vehicles back to the

29
active travel lane but with a high probability that they may over-correct their
vehicle and crash on the inside of the curves. The influence of the direction of
curves, as indicated by the statistics, appears to support the conclusion that out-
of-control vehicles have a higher probability of hitting vehicles approaching from
the opposite direction. On the curves to the left drivers have more reaction time
and buffer space to steer their vehicles back to the appropriate active travel lane;
however, a high percentage of drivers over-correct their vehicles so they cross the
centerline and hit the vehicles approaching from the opposite direction or run off
the road on the inside of the curves.
Of the investigated crashes, 65 (87.8%) were superelevated, 33 (44.6%) had
signing, 73 (98.6%) were striped, and 69 (93.2%) had shoulders as shown in
Table 12. Of the curves’ striping 58 (78.4%) had complete striping (centerline,
solid double yellow, and edgeline) present, 15 (20.3%) had no edgelines present,
and 1 (1.4%) had no striping present. The distribution of the curves’ shoulders
were 47 (63.5%) graded, 1 (1.4%) paved, 21 (28.4%) combination of paved and
graded, and 5 (6.8%) had no shoulders present.

30
Table 12: Distribution of Location, Curve Direction, Shoulder, and
Striping
Shoulder Type and Direction
Graded Paved Combined No
Shoulder
Left Right Left Right Left Right Left Right
Total
Complete Striping
7 6 0 0 7 2 0 0 22
No Edgelines
5 0 0 0 0 0 0 0 5
Inside of
Curve No
Striping 0 0 0 0 0 0 0 0 0
Complete Striping
8 10 0 1 3 8 1 2 33
No Edgelines
1 8 0 0 0 0 0 1 10
Outside of Curve
No Striping
0 0 0 0 0 0 1 0 1
Complete Striping
0 2 0 0 1 0 0 0 3
No Edgelines
0 0 0 0 0 0 0 0 0
Unknown
No Striping
0 0 0 0 0 0 0 0 0
Total 21 26 0 1 11 10 2 3 74
Vertical Alignment
Out of the 150 fatal crashes, 44 (29.3%) occurred at level roadway sections
without noticeable vertical grade, 48 (32.0%) were at uphill locations, and 58
(38.7%) were at downhill locations. Of the 48 uphill crash locations, 31 sites had
mild grades (approximately +2% to +6%) and 17 occurred at grades of
approximately +1%. Among the downhill crash locations, 4 were on steep
downgrades (steeper than -6%), 32 were on mild downgrades (around -2% to -
6%), and 20 were on level grades (about -1%). The vertical alignment
characteristics of the 150 crash locations are summarized in Table 13. Of the 48
uphill crash locations, 15 (31.3%) were located at crest vertical curves. Eight out
of the 15 crashes occurred during daylight conditions and 7 occurred when it was
dark at roads with no supplemental lighting.

31
Table 13: Characteristics of Vertical Alignment of Crash Locations
Direction of Slope Estimated Percent
of Slope (g) Up Down Flat Total
Level (|g| = 1%) 17 20 37
Mild (2% < |g| < 6%) 31 32 63
Steep (6% < |g|) 0 4 4
Not Applicable 0 2 44 46
Total 48 58 44 150
Among the 58 downhill crash locations, 7 (12.1%) were at crest vertical curves
and 4 (6.9%) occurred at sag vertical curves locations. Of the 7 crashes occurring
at crest vertical curves, 6 occurred during daylight conditions and 1 occurred
when it was dark at a roadway section with no supplemental lighting. For the 4
crashes at sag vertical curves, 2 occurred during daylight conditions, 1 at dawn,
and 1 during dark conditions at a location with no supplemental lighting.
Lane Width
Table 14 shows the distribution of the lane widths for the studied 150 crash
locations. Of the 150 crash locations, the lane widths ranged from 8 to 13 feet,
with 41 (27%) crashes occurring at locations with 10 feet lane widths, 37 (25%)
collisions located on facilities with 11 feet lanes, and 51 (34%) crashes locations
on 12 feet lane roadways.

32
Table 14: Lane Width Distribution for 150 Fatal Crashes
Lane Width (feet) Crash Frequency Percent
8 2 1%
9 15 10%
10 41 27%
11 37 25%
12 51 34%
13 3 2%
NA 1 1%
Total 150 100%
To sum up, only approximately one-third of the 150 crash locations had lane
widths greater than 11 feet. The majority of crashes therefore occurred on narrow
lanes.
The relationship between horizontal alignment and lane width, as discussed on
page 26 and shown in Table 15, identified 40 horizontal curves to the right for
which 18 (45.0%) locations had lane widths between 10 and 11 feet, and 13
(32.5%) locations had greater than 11 feet lanes. Of the 34 identified horizontal
curves to the left, 14 (41.2%) locations had lane widths between 10 and 11 feet,
and 13 (38.2%) locations had greater than 11 feet lanes. Of the 76 tangent
locations, 39 (51.3%) sites had lane widths between 10 and 11 feet, and 26
(34.2%) sites had lane widths greater than 11 feet.

33
Table 15: Lane Width Distribution for Different Horizontal Alignments
Lane Width (feet) Curve to Right Curve to Left Tangent Total
< 10 9 7 11 27
10 to 11 18 14 39 71
> 11 13 13 26 52
Total 40 34 76 150
Figure 4 demonstrates the 95% confidence intervals for different horizontal
alignments at the 150 studied crash locations. On average, the lane widths on the
curve to the right crash locations were narrower than on the curve to the left
sections or the tangent sections. The average lane width on tangent sections was
the widest and the standard deviation was the smallest. These observations
indicate that on the horizontal curve to the right locations, the fatal crashes were
more likely to occur on narrower lanes. In other words, when the road curves to
the right and a driver loses control, the likelihood that the driver will steer the
vehicle back to the travel lane will be greater on a wider lane. On the curve to the
left sections, the average lane width was wider than on the curve to the right
sections and the standard deviation was greater as well. The standard deviation
of lane width for roads with horizontal curves to the left was greater. In
comparison, the average lane width at tangent crash locations was wider and the
standard deviation was smaller. One possible explanation may be that the
driving task is simpler on tangent sections even though the design speed on
tangent sections is higher.

34
Figure 4: Comparison of Mean and 95% Confidence Intervals on Lane Widths
Shoulder Type and Shoulder Width
Figure 5 shows the shoulder type distribution for the studied 150 crash locations.
Out of 150 fatal crashes, 9 (6.0%) occurred on roadway sections without any
available shoulders, 5 (3.3%) on roads with paved shoulders, 98 (65.3%) at
locations with only graded shoulders, 37 (24.7%) at sites with a combination of
paved and graded shoulders, and only one crash occurred at a raised curb
roadway section.
10.611.1 11.0 10.8
0
2
4
6
8
10
12
14
16
Curve to Right Curve to Left Tangent Total
Horizontal Alignment
Lane
Wid
th (f
eet)

35
Figure 5: Shoulder Type Distribution
Table 16 shows the average lane width for the different shoulder types. The
crash locations where the shoulders were a combination of paved and graded
conditions were also characterized by the widest lanes. The narrowest lanes were
located at the locations without any available shoulders.
For crash evaluation purposes, shoulder types were defined as follows:
Paved – region adjacent to edge stripes for use by disabled vehicles to
safely exit the road;
Graded – no paved shoulder adjacent to edge stripe (except perhaps a 6
inch buffer), but shoulder graded to permit a disabled vehicle to pull off of
the road;
Combination (Paved and Graded) – only a 2 to 4 feet of paved shoulder
adjacent to the edge stripe but adjacent terrain graded for shoulder use to
permit a disabled vehicle to safely pull off of the road;
3%
25%
1%
65%
6%
0%
10%
20%
30%
40%
50%
60%
70%
Paved Graded Combination (Paved& Graded)
Raised Curb No Shoulder
Shoulder Type
Perc
ent

36
Raised Curb – no graded shoulder present but a vertical concrete curb
(approximately 6 inch in height) was located adjacent to the active travel
lanes;
No Shoulder – terrain adjacent to the road was not suitable for a disabled
vehicle to safely exit the active travel lanes.
Table 16: The Average Lane Width for Different Types of Shoulders
Observation Shoulder Type
Frequency Percent
Average Lane
Width
Standard Deviation
Paved 5 3.3% 10.6 0.9
Graded 98 65.3% 10.5 1.1
Combination, Paved and Graded
37 24.7% 11.6 0.6
Raised Curb, Barrier 1 0.7% 12.0 0.0
No Shoulder 9 6.0% 9.8 1.2
Total 150 100.0% 10.8 1.1
For the 5 locations with paved shoulders, the actual shoulder widths ranged from
2 to 5 feet with an average shoulder width of 3.2 feet, and a standard deviation of
1.3 feet. Of the 98 crash locations with graded shoulders, the shoulder widths
ranged from 2 to 10 feet. The average shoulder width was 5.6 feet and the
standard deviation was 2.2 feet. Among the 37 locations with combined
shoulders, the shoulders were between 2 and 20 feet wide. The average shoulder
width was 7.6 feet and the standard deviation was 3.1 feet. Of these 37 crash
locations with combined paved and graded shoulders, the paved shoulder widths
were between 1 and 6 feet and the graded shoulder widths were between 1 and 16
feet. Basically, for the 150 fatal crashes, the graded shoulder widths were wider
than the paved shoulders.

37
Type of Roadway Junction
Figure 6 shows that of the 150 crash locations, 101 (67.3%) occurred at roadway
sections without intersections proximate to the crash location, 17 (11.3%)
occurred at four-way intersections, 29 (19.3%) were at T-intersections, 2 (1.3%)
were at Y-intersections, and 1 (0.7%) was at a railway grade crossing.
Among the 49 intersections sites, 2 four-way intersections had flashing traffic
control signals, and one railway grade crossing had a flashing beacon that was
not active at the time of the crash because a train was not present. The
remaining intersections in the study crashes were unsignalized with stop
controlled regulatory signs.
Figure 6: Distribution of Types of Roadway Junction of Crash Locations
101
29
2 1
17
0
30
60
90
120
150
Roadway Section Four-WayIntersection
T-Intersection Y-Intersection Railway GradeCrossing
Type of Roadway Junction
Num
ber o
f Cra
sh L
ocat
ions

38
Roadside Hazard Rating
Figure 7 shows the distribution of roadside hazard ratings for the 150 crash
locations. The roadside hazard ratings (RHR) are determined from a seven
point pictorial scale describing the roadside condition with one being less
hazardous to seven being most hazardous (Zegeer et al., 1988). A recoverable
side slope is a relatively flat side slope (1 foot vertical to 4 feet horizontal or
flatter) for which the driver of an errant vehicle may correct the path of the
vehicle and “recover” from a potential crash. A non-recoverable slope is
traversable but vehicles cannot stop or return easily to the roadway (slopes
steeper than recoverable and up to approximately 1 foot vertical to 3 feet
horizontal). A critical side slope is steep and a vehicle will likely overturn while
attempting to traverse it (AASHTO, 2002).
The side slope at 18 crash locations (12.0%) was recoverable (RHR = 1 or 2),
and 91 sites (60.7%) had marginally recoverable (RHR = 3 or 4) side slopes. In
addition, 34 out of 150 (22.7%) crash locations had non-recoverable (RHR = 5 or
6) side slopes, while 7 (4.7%) had critical (RHR = 7) roadside conditions.
Of 40 sites with horizontal curves to the right, 22 (55.0%) locations also had
marginally recoverable roadside conditions, 4 had recoverable roadside
conditions, 12 (30.0%) locations were non-recoverable, and 2 were at critical
roadside conditions. Out of 34 sites with horizontal curves to the left, 18 (52.9%)
had marginally recoverable roadside conditions, 6 (17.6%) had recoverable
roadside conditions, and 9 (26.5%) exhibited non-recoverable roadside
conditions. Among the 76 tangent crash locations, 51 (67.1%) locations were
characterized by marginally recoverable conditions, 8 (10.5%) had recoverable
roadside conditions, 13 (17.1%) exhibited non-recoverable roadside conditions,
and 4 had critical roadside conditions. Table 17 contains the summary of
roadside hazard ratings at different horizontal alignment crash locations.

39
Figure 7: Distribution of Roadside Hazard Rating
Table 17: Summary of Roadside Hazard Rating at Crash Locations
Roadside Hazard Rating
Curve to the Right
Curve to the Left
Tangent Total
Recoverable 4 6 8 18
Marginally Recoverable 22 18 51 91
Non-Recoverable 12 9 13 34
Critical 2 1 4 7
Total 40 34 76 150
12%
61%
23%
5%
0%
10%
20%
30%
40%
50%
60%
70%
Recoverable Marginally Recoverable Non- Recoverable Critical
Roadside Hazard Rating
Percent

40
Speed Limit
Vehicle speed is a critical factor to crash severity; however, the Georgia standard
police report for crashes does not include estimated vehicle speed. As a result,
the speed limit is often used as a surrogate indicator of speed. For example, it is
unlikely a vehicle will travel at 55 mph on a road with a 15 mph speed limit.
Similarly, roads with higher speed limits will rarely have vehicles traveling at 15
or 20 mph. The roadway design speed is generally considered to be 5 to 15 mph
above the speed limit, but for this study the precise design speed at each location
is unknown. As a result, this report summarized speed limit conditions as
indicators of possible road conditions. These speed limits should not be assumed
to reflect vehicle operating speeds.
Of the 150 studied crash locations, 5 (3.3%) locations had speed limits less than
35 mph, 12 (8.0%) locations had 35 mph speed limits, and 2 (1.3%) had 40 mph
speed limits. In addition, 16 (10.7%) locations had 45 mph speed limits and 115
(76.7%) had 55 mph limits. Figure 8 shows the distribution of speed limits for
the studied crash locations, and Table 18 shows the specific relationship between
speed limit and lane width.
Of the 27 locations with lane width less than 10 feet, 15 (55.6%) had speed limits
of 55 mph. Of the locations with lane widths between 10 and 11.5 feet, 58
(76.7%) locations had 55 mph speed limits. Among the 48 crash locations with
lane widths equal to or greater than 12 feet, 42 (87.5%) had speed limits of 55
mph.

41
Figure 8: Distribution of Speed Limits
Table 18: Distribution of Speed Limits and Lane Widths
Lane Width (feet) Speed Limit
(mph) <10 10-11.5 ≥12 Total
15 1 0 0 1
25 0 2 1 3
30 0 1 0 1
35 3 8 1 12
40 2 0 0 2
45 6 6 4 16
55 15 58 42 115
Total 27 75 48 150
0.7% 2.0% 0.7%
8.0%
1.3%
10.7%
76.7%
0%
10%
20%
30%
40%
50%
60%
70%
80%
90%
15 25 30 35 40 45 55
Speed Limit (mph)
Perc
ent

42
In summary, as shown in Figure 9, when the lane widths were narrower, the
average speed limit was lower and the standard deviation was greater. Figure 9
demonstrates that the wider the lane width, the higher the speed limit. This
observation supports the assumption that a higher design standard is associated
with higher speed limits.
The average speed limit at tangent crash locations was 51.8 mph, and the average
speed limit on curving sections (with no regulatory speed limit reductions) was
50.4 mph.
Figure 9: Comparison of Mean and 95% Confidence Intervals on Speed Limits
48.0
53.150.8
0
10
20
30
40
50
60
70
80
< 10 10 to 11 > 11
Lane Width (Feet)
Spee
d Li
mit
(mph
)

43
Average Daily Traffic Volume
Of the 150 crashes, 9 locations had unknown average daily traffic (ADT) volumes.
For the remaining 141 locations, the majority (97.9%) of them had an ADT of less
than 10,000 vehicles per day. The average ADT for these 141 locations was 2938
vehicles per day and the standard deviation was 2925 vehicles per day.
Figure 10 shows the ADT distribution for the 150 crash locations. Of these 150
crashes, 46 occurred at sites with an ADT of less than 1,000 vehicles per day, 27
with an ADT between 1,000 and 2,000 vehicles per day, 15 with ADT values
between 2,000 and 3,000 vehicles per day, and 16 between 3,000 and 4,000
vehicles per day. Basically, the ADT distribution is skewed to the right and
follows an exponential distribution.
Figure 10: Distribution of Average Daily Traffic Volume
30.7%
10.0% 10.7%
5.3%4.0% 4.7%
2.7% 3.3% 2.7% 2.0%
6.0%
18.0%
0%
5%
10%
15%
20%
25%
30%
35%
<1000
1000
to 20
00
2000
to 30
00
3000
to 40
00
4000
to 50
00
5000
to 60
00
6000
to 70
00
7000
to 80
00
8000
to 90
00
9000
to 10
000
> 1000
0
Unkno
wn
Average Daily Traffic Volume
Perc
ent

44
ENVIRONMENT-RELATED CHARACTERISTICS
Day of Week
Of these 150 fatal crashes in the study, 33 (22.0%) occurred on Saturday, while
29 (19.3%) were on Sunday. The lowest frequency is 14 (9.3%) occurring on
Monday and the second lowest is on Wednesday (15 crashes, 10.0%). The
research team also noted that 67 of the 150 crashes (44.7%) occurred on the
weekend (from Friday 6:00 p.m. to Monday 6:00 a.m.).
Weather Conditions
Out of the 150 fatal crashes, 124 (82.7%) occurred on clear days, 21 (14.0%) were
on rainy days, 3 (2.0%) were on cloudy days, and 2 (1.3%) were on foggy days.
Among these crashes, 121 (80.7%) occurred on dry pavement and 29 (19.3%)
were on wet pavement.
Lighting Conditions
The crash reports indicated that 81 (54.0%) crashes occurred during daylight
hours, 2 (1.3%) occurred at dusk and 1 crash occurred at dawn. For the nighttime
of crashes, only 1 occurred at a dark but lit roadway section, while 65 (43.3%)
occurred at locations without supplemental street lighting.

45
5.0 COUNTERMEASURE EVALUATION
INTRODUCTION
Recall that the objective of this research was to identify effective engineering
countermeasures for two-lane rural roads in Georgia, ranked from most to least
effective. Effectiveness is measured using theta (θ), the ratio of “safety” before to
"safety" after application of a given countermeasure. Safety, in this evaluation
method, refers to the number of fatal crashes. The reader should note that a theta
value equal to or greater than unity (1.0) means that a countermeasure is not
deemed to be effective.
As discussed previously, the Georgia Tech research team applied a meta-analysis
to past safety related literature, and performed engineering evaluations for the
prospective countermeasures shown in Table 19. A five-member panel performed
the engineering evaluations and included Dr. Karen Dixon, P.E., Jennifer Ogle,
Dr. Simon Washington, David White, and Dr. Chi-Hung Wu. Each participant
had earned at least a Masters Degree in Transportation Engineering and
possessed varying experience in the area of transportation safety (ranging from
practical to academic applications). The goal of the meta-analysis was to
summarize the current state of knowledge of safety research regarding the
effectiveness of these countermeasures. The objective of the engineering
evaluations was to assess the anticipated impact on two-lane rural roads in the
state of Georgia. The independent engineering evaluation results were then
averaged to determine the “objective evaluation” theta values.
ANALYSIS PROCEDURE
The analysis procedure reported in this section consists of:
• Summary results of meta-analysis and engineering evaluations
• Reduction of meta-analysis results
• Identification of "effective" countermeasures
• Identifying candidate road sections in Georgia

46
Table 19: Countermeasure List
Number Category Countermeasure 1 Add/Upgrade Edgeline 2 Add/Upgrade Centerline 3 Add/Upgrade No-Passing-Zone Lines 4
Pavement Markings
Add Raised Pavement Markings (RPMs) 5 Warning Signs 6 Advisory Speed Signs 7 Chevron Alignment Sign 8
Traffic Signs
Post Delineator 9 Modify Geometric Alignment (Horizontal, Vertical,
Separation) 10 Modify Superelevation/Cross Slope 11 Improve Sight Distance without Geometric
Realignment 12 Widen Lanes/Pavement Width 13 Add Turn Lane 14 Add/Widen Graded/Stabilized
Shoulder 15 Pave Existing Graded Shoulder of
Suitable Width 16
Improve Longitudinal
Shoulder
Widen and Pave Existing Paved Shoulder
17 Add Rumble Strips 18
Roadway Improvements
Improve Roadway Access Management 19 Install/Upgrade Guardrail 20 Upgrade Guardrail End Treatment/Add Impact
Attenuator 21 Widen Clear Zone 22 Flatten Side Slope 23 Relocate Fixed Object 24 Remove Fixed Object 25 Convert Object to Breakaway 26
Roadside Improvements
Clear Zone Improvements
Construct Traversable Drainage Structure
27 Add Segment Lighting 28 Add Intersection Lighting 29
Lighting
Upgrade Segment/Intersection Lighting 30 Regulations Enforce Speed Limits

47
INITIAL RESULTS
Table 20 shows a summary of results from the meta-analysis. Approximately 67%
of investigated countermeasures resulted in no significant or clear published
results from the literature search. Another 20% of investigated countermeasures
produced fewer than three studies. The vast majority of studies examined the
effects of lane width, shoulder width, and geometric alignment on crashes. The
variance of the effectiveness of countermeasure 9, modification of geometric
alignment, was considerably larger than the others and can be attributed to any
number of reasons including the failure to include, quantify, and correct for study
artifacts. Artifacts refer to errors resulting from imperfect research and can be
manifest as selection bias, incorrect data recording or transcription, model
misspecification, etc. The negative signs attributed to both weighted means and
variances are due to the prescribed computation method of the previous research
efforts evaluated. This format differs from conventional methods, particularly for
the variance calculation that is computed as the mathematical difference between
two other variances.
The engineering evaluations were performed by the panel of transportation safety
experts, and then were consolidated into a single Microsoft Excel worksheet.
From the worksheet, summary statistics were gleaned for all pertinent
countermeasures. Table 21 shows a summary of the engineering evaluation
results.

48
Table 20: Countermeasure List for Meta-Analysis
Countermeasure Number of
Studies1
Unit of measure2
Weighted Mean CRF3
Variance of CRF
1. Edgeline 0 Present/Absent N/A 2. Centerline 0 Present/Absent N/A 3. No-Passing Zone 0 Present/Absent N/A 4. Raised Pvmt. Markings 0 Present/Absent N/A 5. Warning Signs 0 Present/Absent N/A 6. Advisory Speed Signs 2(6) MPH 0.0082 0.0005 7. Chevron Signs 0 Present/Absent N/A 8. Post Delineator 0 Present/Absent N/A 9. Geometric Modification 24(36) Current/Modified 0.0258 29.6752 10. Change Cross Slope 1 Feet/Feet 0.5860 0.0014 11. Improve Sight Dist. 0 Feet N/A 12. Widen Lanes/Road 11(15) Feet 0.3306 1.4033 13. Add Turn Lane 0 Present/Absent N/A 14. Improve Graded Shld. 17(27) Feet 0.7025 1.4053 15. Pave Graded Shld. 2 Feet 0.1608 0.0002 16. Widen & Pave Shld. 0 Feet N/A 17. Rumble Strips 0 Present/Absent N/A 18. Access Management 2 Intersections/mile 0.2585 0.0002 19. Guardrail 0 Present/Absent N/A 20. Attenuation Devices 0 Present/Absent N/A 21. Widen Clear Zone 4 Feet 0.4567 0.2423 22. Flatten Side Slope 1 Feet/Feet 3.4607 5.5E-05 23. Relocate Fixed Object 1 Yes/No 1.9048 0.0014 24. Remove Fixed Object 1 Yes/No 1.9048 0.0014 25. Breakaway Object 0 Yes/No N/A 26. Traversable Drain. 0 Yes/No N/A 27. Segment Lights 0 Present/Absent N/A 28. Intersection Lights 0 Present/Absent N/A 29. Upgrade Lights 0 Present/Absent N/A 30. Enforce Speeds 0 Present/Absent N/A See Table 19 for expanded definitions of the countermeasures shown.
1 Number in parentheses represents the total quantity of analysis results. Some reports examined more than one countermeasure within a single study. 2 Some countermeasures have no units of measure and others have nominal values; i.e. the countermeasure is either present or absent, which answers the question whether a countermeasure needs to be added or not. 3 Crash Reduction Factor (CRF) refers to the crash reduction per unit improvement for each countermeasure, the computation method is presented in 10.0 APPENDIX C: Meta-Analysis Process.

49
Table 21: Countermeasure Theta List for Engineering Evaluation
Countermeasure Sample Size
Mean Score4
Median Score
Mode Score
Variance
1. Edgeline 145 0.9681 1.00 1.00 0.0092 2. Centerline 145 0.9818 1.00 1.00 0.0042 3. No-Passing Zone 48 0.9758 1.00 1.00 0.0094 4. Raised Pvmt. Markings 75 0.9384 1.00 1.00 0.0153 5. Warning Signs 61 0.8972 1.00 1.00 0.0219 6. Advisory Speed Signs 44 0.8838 1.00 1.00 0.0235 7. Chevron Signs 76 0.8196 0.75 0.67 0.0301 8. Post Delineator 146 0.9219 1.00 1.00 0.0201 9. Geometric Modification 149 0.8991 1.00 1.00 0.0235 10. Change Cross Slope 144 1.0000 1.00 1.00 0.0000 11. Improve Sight Dist. 150 0.9802 1.00 1.00 0.0070 12. Widen Lanes/Road 150 0.9129 1.00 1.00 0.0227 13. Add Turn Lane 60 0.9388 1.00 1.00 0.0547 14. Improve Graded Shld. 147 0.9527 1.00 1.00 0.0136 15. Pave Graded Shld. 131 0.8951 1.00 1.00 0.0311 16. Widen & Pave Shld. 36 0.9217 1.00 1.00 0.0261 17. Rumble Strips 45 0.8861 1.00 1.00 0.0285 18. Access Management 148 0.9899 1.00 1.00 0.0024 19. Guardrail 41 0.8384 1.00 1.00 0.0407 20. Attenuation Devices 4 1.0000 1.00 1.00 0.0000 21. Widen Clear Zone 149 0.8858 1.00 1.00 0.0232 22. Flatten Side Slope 150 0.9161 1.00 1.00 0.0247 23. Relocate Fixed Object 56 0.9087 1.00 1.00 0.0207 24. Remove Fixed Object 54 0.8774 1.00 1.00 0.0345 25. Breakaway Object 34 0.9806 1.00 1.00 0.0046 26. Traversable Drain. 49 0.8914 1.00 1.00 0.0423 27. Segment Lights 138 0.9079 1.00 1.00 0.0211 28. Intersection Lights 60 0.9339 1.00 1.00 0.0187 29. Upgrade Lights 5 0.9340 1.00 1.00 0.0218 30. Enforce Speeds 149 0.8876 1.00 1.00 0.0341 See Table 19 for expanded definitions of the countermeasures shown.
4 Scores are thetas (θ) representing: 0: would prevent crash; 0.33: would reduce crash severity; 0.67: may reduce crash severity; and ≥ 1: ineffective in reducing crashes and their severity.

50
As shown in Table 21, countermeasures 10 (modify cross slope) and 20 (upgrade
guardrail end treatments) received theta value assignments equal to 1.0. This
means the safety experts did not rate these countermeasures as effective for the
specific crashes evaluated. The sample sizes for countermeasures 20 and 29
(upgrade existing lighting) were too small (<30) to warrant further analysis. All
other countermeasures were potentially effective and therefore included in
further analysis.
REDUCTION OF COUNTERMEASURE LIST
Following completion of the initial literature review and examination of the
results, the research team decided that only previous research reports based upon
data collected from 1977 onwards would be considered for inclusion in future
data analysis. The justification for this time restriction was that studies older
than two decades prior to the analysis year (1997) would likely contain more
selection bias, and are possibly of poorer methodological quality than the current
evolved techniques. In addition, where explicit fatal crash data were not
reported, the fatal national crash data were used to prorate the reported crash
data for that year. For instance, say a study on the influence of lane width on
crashes on two-lane rural roads was conducted across 2 years with a sample size
of 200 total crashes. To determine the number of fatal crashes per year from this
number we first divide the total number of crashes (200) by the number of years
(2), hence we now have 100 total crashes per year. Assuming that 10% of total
crashes per year across the analysis period were fatal crashes, then the effective
analysis sample size is assumed to have been 10 fatal crashes. Finally, after
careful consideration of the wide fluctuations (large variance) in reported results,
the research team determined that a minimum sample size of five studies is
appropriate for a countermeasure to be included and meaningful in the meta-
analysis process. Adhering to the above criteria, the results of the meta-analysis
process are presented in Table 22.

51
Table 22: Reduced “Effective” Countermeasure List from Meta-Analysis
Countermeasure Description 6 Advisory Speed Signs 9 Modify Geometric Alignment 12 Widen Lanes/Pavement Width 14 Add/Widen Graded/Stabilized Shoulders 21 Widen Clear Zone
IDENTIFICATION OF EFFECTIVE COUNTERMEASURES
The goal during this stage of analysis was to identify road sections and traffic
conditions that lend themselves to effective application of the countermeasures
identified in Table 22. The overall challenge throughout this analysis was
development of a method to identify a sufficiently small number of road sections
worthy of improvement. A constant concern while conducting the analyses was
that there would be many road-sections that would share common characteristics
of "improveable" sections, and that the number of lane-miles requiring
improvement using this method would be too large to enable targeted
expenditures of safety improvement dollars. This concern ultimately required
modification to the analysis methodology originally proposed. We describe this
analysis procedure here and conclude with the impact of these analysis decisions
in this section.
The procedure incorporated the use of classification and regression trees
(CART's) and the engineering evaluations to identify roadway characteristics and
traffic conditions where countermeasures can be effectively applied to increase
safety (see Appendix D).
The CART procedure identified predictor variables that appeared to be important
to a particular countermeasure's effectiveness based on ADT, posted speed limit,
RHR and lane width and Table 23 presents the conditions under which they were
considered most effective.

52
Table 23: Reduced “Effective” Countermeasures List from CART (based on
Engineering Evaluations)
Countermeasure Effective-
ness
CART Identified Predictor Variables
1. Edgeline 0.67 350 ≤ ADT < 450, Speed ≥ 55mph
2. Centerline 0.835 ADT < 450, Speed ≥ 55mph, RHR 5-7
4. Raised Pvmt. Markings 0.67 ADT < 450, Speed ≥ 55mph, RHR 5-7
0.67 ADT < 1650, RHR 5-7
0.67 ADT ≥ 5960, RHR 1-4 5. Warning Signs
0.67 550 ≤ ADT < 750, RHR 1-4
6. Advisory Speed Signs 0.67 ADT < 600, RHR 5-7
0.67 ADT < 650, RHR 5-7 7. Chevron Signs 0.67 ADT < 650, Speed ≥ 55mph, RHR 1-4
8. Post Delineator 0.67 ADT < 850, Speed ≥ 55mph, RHR 5-7
0.67 ADT < 550, Speed < 55mph, RHR 5-7
0.67 ADT ≥ 5200, Speed < 55mph
0.67 550 ≤ ADT <1300, Speed ≥ 55mph, RHR 5-7 9. Geometric Modification
0.67 6950 ≤ ADT < 8300, Speed ≥ 55mph,
RHR 1-4
11. Improve Sight Dist. 0.835 ADT < 450, Speed < 55mph, RHR 5-7
0.835 ADT < 1800, Speed < 55mph,
RHR 5-7, Lane Width < 12 feet 12. Widen Lanes/Road 0.67 1350 ≤ ADT < 1800, Speed ≥ 55mph,
RHR 1-4, Lane Width < 12 feet
14. Improve Graded Shld. 0.835 3250 ≤ ADT < 4800, Lane Width < 12 feet
15. Pave Graded Shld. 0.67 ADT<450, Speed ≥ 55mph, RHR 5-7
16. Widen & Pave Shld. 0.835 ADT < 1900
0.835 2900 ≤ ADT < 4100
0.835 ADT < 650 17. Rumble Strips
0.67 1900 ≤ ADT < 2900
19. Guardrail 0.67 Speed ≥ 55mph, RHR 5-7

53
Table 23: Reduced “Effective” Countermeasures List from CART
(continued)
Countermeasure Effective-
ness
CART Identified Predictor Variables
0.67 ADT < 250, Lane Width < 12 feet
0.67 250 ≤ ADT < 450, Speed < 55mph,
Lane Width < 12 feet
0.67a 3600 ≤ ADT < 4700, RHR 1-4,
Lane Width ≥ 12 feet
0.835 3250 ≤ ADT < 5200, Lane Width < 12 feet
21. Widen Clear Zone
0.67 650 ≤ ADT < 850, Lane Width < 12 feet
0.67 550 ≤ ADT < 750, RHR 1-4
0.67 2850 ≤ ADT < 4800, RHR 5-7
22. Flatten Side Slope
0.67 ADT<550, Speed ≥ 55mph, RHR 5-7
0.67 ADT<3350, Speed < 55mph, RHR 5-7
0.67 ADT < 600, RHR 1-4
23. Relocate Fixed Object
0.67 1800 ≤ ADT < 3350, RHR 1-4
0.67 1650 ≤ ADT < 3350 24. Remove Fixed Object
0.67 450 ≤ ADT < 1100
26. Traversable Drain. 0.67 380 ≤ ADT < 5550
27. Segment Lights 0.67 ADT ≥ 2550, Speed ≥ 55mph,
Lane Width < 12 feet
28. Intersection Lights 0.67 500 ≤ ADT < 2900, RHR 5-7
30. Enforce Speeds 0.67 ADT < 950, Speed < 55mph
a: Considered ideal lane width and RHR. See Table 19 for expanded definitions of the countermeasures shown.

54
When combining the 5 “effective” countermeasures from the meta-analysis
process (Table 22) with the 26 “effective” countermeasures from the CART
analysis (Table 23), the research team observed that both analysis results—the
meta-analysis and the engineering evaluation CART analysis—had the following
“effective” countermeasures in common (where effective is defined as theta less
than 1.0):
• Addition of Advisory Speed Signs,
• Modification of Geometric Alignment,
• Widening of Lanes/Pavement Width,
• Adding/Widening Graded/Stabilized Shoulders, and
• Widening Clear Zones.
When identifying candidate improvement roadway sections, consideration
should be given to application of the above 5 common “effective”
countermeasures before consideration should be granted to the other noted
countermeasures in Table 23, since the engineering evaluation process only
identifies predictor variables as opposed to confirming actual countermeasure
effectiveness.
IDENTIFYING CANDIDATE IMPROVEMENT LOCATIONS IN GEORGIA
The Fatality Analysis Reporting System (FARS) database and the GDOT Road
Characteristics Database (RCFILE) were queried for the CART identified
predictor variables or surrogates to determine the number of fatalities and the
number of roadway sections, respectively, that would potentially be affected by
installing countermeasures at these sites. Unfortunately, the ADT attribute was
only present in the RCFILE, while the RCFILE variable SURFACE_U, which
describes the width and type of pavement surface for undivided highways,
represented "lane width", and varied in value from 15 feet to 23 feet. Some FARS
query conditions, for particular countermeasures, could not be comprehensively
55
or accurately investigated due to the lack of representative or closely related
attributes for those measured in the field. The results of the database queries are
displayed in Table 24.
Table 24 contains the estimates of the number of roadway section, and aggregate
roadways, that if upgraded can reduce the number of fatal crashes on two-way
rural roads. While the predictor variables indicate specific RHR cohorts the
above results include roadways with any type of RHR, thus the number of
roadway sections with RHR 5-7 will be less. For example, say we use the RCFILE
variable R_SHOULDER_U which describes the width and type of shoulder on
the right side or an undivided highway as a surrogate for RHR of 5-7. This
variable ranges in value from zero to five feet for various shoulder compositions
(see appendix B). The results produced with this variable included in the query
for countermeasure 2 are 15,987 roadway sections (1491 aggregate roadways), a
reduction of more than 50% of roadway sections from the query for all RHR types
with values of 34,282 roadway sections (2441 aggregate roadways). Further
analysis could be done on the RCFILES roadway sections to determine the length
of roadways that these sections represent, which would immensely aid the
benefit-cost analysis process.

56
Table 24: Georgia Candidate Roadway and Sections
Counter-measure
Predictor Variables RCFILE Roadway Sections1
RCFILE Roadways1
Fatal Crashes
2 1. Edgeline 350 ≤ ADT < 450, Speed ≥ 55 2600 354 CND3 2. Centerline ADT < 450, Speed ≥ 55, RHR 5-7 34282 2441 CND 4. Raised Pvmt. Markings
ADT < 450, Speed ≥ 55, RHR 5-7 34282 2441 CND
ADT < 1650, RHR 5-7 71915 4556 CND ADT ≥ 5960, RHR 1-4 7637 283 CND 5. Warning Signs 550 ≤ ADT < 750, RHR 1-4 4723 513 CND
6. Advisory Speed Signs
ADT < 600, RHR 5-7 51336 3282 CND
ADT < 650, RHR 5-7 53649 3470 CND 7. Chevron Signs
ADT < 650, Speed ≥ 55, RHR 1-4 37959 2796 CND 8. Post Delineator ADT < 850, Speed ≥ 55, RHR 5-7 41529 3063 CND
ADT < 550, Speed < 55, RHR 5-7 14985 1419 30a ADT ≥ 5200, Speed < 55 4719 264 30a 550 ≤ ADT <1300, Speed ≥ 55,RHR 5-7
10127 1003 104a 9. Geometric Modification
6950≤ADT < 8300, Speed≥55,RHR 1-4
1038 65 104a
11. Improve Sight Dist.
ADT < 450, Speed < 55, RHR 5-7 14293 1298 CND
ADT < 1800, Speed < 55, RHR 5-7, Lane Width < 12 feet
11667 1613 CND 12. Widen
Lanes/Road 1350 ≤ ADT < 1800, Speed ≥ 55, RHR 1-4, Lane Width < 12 feet
1125 137 CND
14. Improve Graded Shld.
3250 ≤ ADT < 4800, Lane Width < 12 feet
810 111 CND
15. Pave Graded Shld.
ADT<450, Speed ≥ 55, RHR 5-7 34282 2441 5b
16. Widen & Pave Shld.
ADT < 1900 73960 4613 CND
2900 ≤ ADT < 4100 6842 357 CND ADT < 650 53649 3470 CND 17. Rumble Strips 1900 ≤ ADT < 2900 8519 530 CND
19. Guardrail Speed ≥ 55, RHR 5-7 68945 3905 CND ADT < 250, Lane Width < 12 feet 18068 1762 CND 250 ≤ ADT < 450, Speed < 55, Lane Width < 12 feet
999 185 20c
3600 ≤ ADT < 4700, RHR 1-4, Lane Width ≥ 12 feet
5296 302 CND
3250 ≤ ADT < 5200, Lane Width < 12 feet
1016 131 CND
21. Widen Clear Zone
650 ≤ ADT < 850, Lane Width < 12 feet
3332 407 CND

57
Table 24: Georgia Candidate Roadway and Sections (continued)
Counter-measure
Predictor Variables RCFILE Roadway Sections1
RCFILE Roadways1
Fatal Crashes
2 550 ≤ ADT < 750, RHR 1-4 4723 513 CND 2850 ≤ ADT < 4800, RHR 5-7 9537 434 CND 22. Flatten Side
Slope ADT<550, Speed ≥ 55, RHR 5-7 36270 2654 CND ADT<3350, Speed < 55, RHR 5-7 26527 2379 20c ADT < 600, RHR 1-4 51336 3282 CND 23. Relocate Fixed
Object 1800 ≤ ADT < 3350, RHR 1-4 12530 663 CND 1650 ≤ ADT < 3350 13469 695 CND 24. Remove Fixed
Object 450 ≤ ADT < 1100 15015 1519 CND 26. Traversable
Drain. 380 ≤ ADT < 5550 6931 342 CND
27. Segment Lights ADT ≥ 2550, Speed ≥ 55, Lane Width < 12 feet
822 113 CND
28. Intersection Lights 500 ≤ ADT < 2900, RHR 5-7
33739 2184 CND
30. Enforce Speeds ADT < 950, Speed < 55 17508 1708 CND See Table 19 for expanded definitions of the countermeasures shown. 1: RCFILE Roadway Sections and Roadways represent the number of roadway segments and their respective continuous roadways in the Georgia RCFILE that were found to be candidate sites for each specific countermeasure. 2: Source FARS 1997 3:Could Not Determine a: Curved alignment related crashes b: Shoulder related crashes c: Crashes related to trees, utility poles, highway/traffic signs/posts, other poles/posts/fixed object/support.
IMPLEMENTATION OF COUNTERMEASURES FOR SAFETY IMPROVEMENT IN
GEORGIA: SHORT-TERM STRATEGY
Installing individual effective countermeasures at candidate locations is a sound
long-term safety investment strategy, but the implementation procedure will take
substantial resources dedicated to inventory, analysis, and evaluation activities
before implementation can begin. In the following section, we outline a short-
term strategy that can be implemented by GDOT more swiftly.

The guiding principal of the short-term strategy is as follows:
It follo
multip
reason
this re
The en
numb
condit
most e
Table
effecti
that th
where
1762 r
These
these l
lanes,
identif
Sites with multiple opportunities for countermeasure application(say 4 or more) represent increased driver risk relative to those
sites with few countermeasure improvement opportunities (say
one or two safety countermeasure opportunities). The increased
risk arises from the increased ‘difficulty’ or ‘complexity’ involved
with successfully negotiating the segment of road.
58
ws from this guiding principal that GDOT could identify sites with
le opportunities for countermeasure application, and then apply a
able set of countermeasures from those determined to be effective from
search.
gineering evaluations of the sample of 150 crashes revealed the following
er of identified roadways, the expected theta for the conditions, and the
ions under which the countermeasures were effective for the five identified
ffective countermeasures.
25 depicts those locations where the five countermeasures can be
vely applied. In the short-term safety investment strategy, one should note
e applicable conditions listed in the table represent locations identified
that specific countermeasure would be effective. For instance, there are
oad segments identified where widening the clear zone may be effective.
segments all have ADT < 250 and lane widths less than 12 feet. A subset of
ocations may also be ideal candidates for speed controls, and widening of
etc. The objective of the short-term safety investment strategy is to
y locations where multiple countermeasure investment opportunities exist.

59
Table 25: “Most Promising” Countermeasure List
“Effective” Countermeasure
Potential Roadways
Applicable Conditions
Advisory Speed Signs
3282 ADT<600, RHR 5-7
1419 ADT<550, Speed<55, RHR 5-7 264 ADT≥5200, Speed<55
1003 550≤ADT<1300, Speed ≥ 55, RHR 5-7 Modify Geometric
Alignment 65 6950≤ADT<8300, Speed ≥ 55, RHR 1-4
1613 ADT<1800, Speed<55, RHR 5-7, Lane Width<12 feet Widen Lanes or
Pavement Width 137 1350≤ADT<1800, Speed ≥ 55, RHR 1-4,
Lane Width<12 feet Add/Widen
Graded/Stabilized Shoulder
111 3250≤ADT<4800, Lane Width<12 feet
1762 ADT<250, Lane Width<12 feet 185 250≤ADT<450, Speed<55, Lane Width<12
feet
302 3600≤ADT<4700, RHR 1-4, Lane Width ≥ 12 feet
131 3250≤ADT<5200, Lane Width<12 feet
Widen Roadside Clear Zone
407 650≤ADT<850, Lane Width<12 feet
Table 26: Fatal Crashes’ Relationship to “Effective” Countermeasures
“Effective” Countermeasures Crashes Percent 4+ 74 49.3% 3 22 14.7% 2 18 12% 1 20 13.3% 0 16 10.7%
Total: 150 100.0%
Table 26 shows the number of Georgia study fatal crashes in 1997 (including
crashes on both state and non-state maintained facilities) that were studied and
subsequently identified as candidates for safety investment opportunities. For
instance, 74 out of 150 crashes received “effective” ratings for four or more
countermeasures. This table gives an indication of the number of noted potential

60
countermeasure improvements that could be implemented for improving crash
locations. So, more than half of the 150 crashes could receive multiple
countermeasures to mitigate fatal crashes. This finding suggests that a
considerable number of crash sites have multiple safety deficiencies, and perhaps
these sites can be identified as “more serious” as compared to sites with 1
countermeasure improvement opportunity. Table 26 depicts the fatal crash data
in a manner that compliments information provided by the effectiveness of
specific countermeasures as applied in isolation.
It is interesting and important to note that of the 150 investigated crashes;
approximately 11% would not be affected by any of the countermeasures listed in
Table 19. Also, the analysis process considered each countermeasure
independently and did not consider possible countermeasure interactions. Add
this to the uncertainty surrounding the expected effectiveness of identified
countermeasures, and there remains a significant portion of crashes that could
not be eliminated or benefit from a severity reduction as a result of
implementation of these engineering-based countermeasures.
The recommended short-term safety investment procedure for GDOT as a result
of these findings is as follows:
1. Search the roadway inventory for instances where three or more
countermeasure investment opportunities exist. This will require a
current comprehensive roadway database and sorting capability that
accurately identifies locations with multiple opportunities and their
associated “effective” countermeasures;
OR
Compile a list of crash site locations on two-lane rural roads in Georgia
(state and non-state maintained) over the past several years and
systematically determine which sites are candidates for multiple
countermeasure investment opportunities.

61
2. Implement improvements based upon the type of countermeasure
investment opportunities, the expected benefits (theta) for the
countermeasures of the sites, and an engineering analysis of the nature of
crashes at the sites.
3. Prioritize sites based on steps 1 and 2 above (using cost-benefit analysis or
a similar defensible prioritization strategy), make safety investments, and
monitor the safety record at improved sites over several years.
IMPLEMENTATION OF COUNTERMEASURES FOR SAFETY IMPROVEMENT IN
GEORGIA: LONG-TERM STRATEGY
Recall that the overall objective of this research is to prioritize and rank the
effectiveness of various countermeasures for two-lane rural roads in Georgia, so
that safety investments can be made wisely and with maximum benefit.
A long-term strategy is required due to the difficulty in correlating roadside and
traffic operations features with the GDOT RCFILE and NHTSA FARS databases.
For instance, the RHR, which has been shown to be effective in gauging the level
of risk associated with roadside hazards, is not present in the RCFILE or FARS.
This omission makes it difficult to correlate a RHR obtained through site
investigations with a meaningful measure in either FARS maintained by NHTSA
or the RCFILE maintained by GDOT. Similarly, traffic volumes are not
consistently measured across databases. As a result, it is not feasible for the
researchers to precisely identify the specific sites for candidate improvements
(other than at the observed crash site locations). Instead, the researchers have
identified CONDITIONS UNDER WHICH effective countermeasures may be
applied. It then remains for the GDOT professional staff to analyze, sort,
inventory, and finally implement safety improvements.

62
Thus, as a long-term strategy for making safety investments, and requiring
resources to analyze, sort, and inventory data, the GDOT could follow the
described implementation steps:
1. Determine the number of roadway miles (or intersections) that are “ideal”
with respect to countermeasure application (see Table 23). Recall that a
good starting point is to identify sites where the most effective
countermeasures could be applied and whose application is justified (see
Table 19). This will require archiving the roadway inventory (state and
non-state maintained) that has specific characteristics. It will also
probably require the help of local jurisdictions for identification of these
facilities. On those identified roadway sections/intersections, determine
the number of fatal crashes averaged over the past several years (3 years is
a target).
2. Examine crash records at “candidate” sites and identify sites with below
average safety records (i.e. sites with number of crashes greater or equal to
the average plus one standard deviation).
3. As an alternate, step 2 could be conducted first to identify ‘sites with
promise’, and then the characteristics of those sites could be determined as
described in step 1.
4. Estimate the expected reduction in fatal crashes as a result of
countermeasure application at candidate sites. This reduction can be
calculated as:
(number of fatal crashes in previous 3-year period) x (fatalities/fatal
crash) x (1 – theta),
where theta is the combined value of theta obtained from the meta-
analysis process (see Table 20) and the engineering evaluations (see
Table 23).

63
For example, assume that there were 12 fatal crashes on two-lane
rural roads with ADT < 1800, Speed < 55mph, RHR 5-7, and Lane
Width < 12 feet over the past 3 years (locations where widening of
lanes is an ideal countermeasure). We collect information from the
meta-analysis results and from the engineering evaluations and are
comfortable using a theta of 0.835. That is, the engineers feel that
local conditions (engineering evaluations) are the dominant factor
for determining the effectiveness of widening of lanes.
With theta equal to 0.835, and assuming a hypothetical 1.25
fatalities per crash occurred during the study years, the calculation
yields: (12)(1.25)(1 - 0.835) = 2.475 expected reduction in fatalities
at those sites over future periods.
This estimate represents the most probable number of fatalities
saved by widening lanes to 12 feet at those sites, all else being equal
(i.e. traffic stays constant, no major influencing factors, etc.).
5. This same procedure is conducted for each countermeasure identified with
the site-related characteristics and most probable estimates of theta
obtained from Tables 19 and 22.
6. The cost per application of implementing each countermeasure should be
combined with the expected benefits to determine the most effective
applicable countermeasures. It is during this step that the expected
effectiveness will be combined with costs to re-order the countermeasures.
In other words, the priority according to theta alone will probably be
changed when costs are added to the analysis. It may turn out that some
countermeasures with lower effectiveness (say around 0.95) may on a cost
per life saved be a more effective strategy than countermeasures with
expected thetas of 0.70.

64
7. GDOT could then apply countermeasures using safety investment and
improvement resources and closely monitor the safety performance of
these improvements over time. The improvement may not be immediate,
since changes to roadways and intersections may initially bring about
unfamiliarity to regular roadway users.

65
6.0 CONCLUSIONS
The objective of this research was to determine roadway or roadside
improvements countermeasures that are most effective for reducing fatal crashes
on two-lane rural highways in Georgia, and to prioritize them with respect to the
highest expected number of lives saved. To accomplish this objective, the
research team evaluated 150 randomly selected fatal crashes for 1997. In general,
these crashes were characterized by human, vehicle, roadway, and environmental
features that contributed to the crash.
The research team undertook a technical approach that combined past
knowledge of countermeasure effectiveness with new knowledge gained from
engineering evaluations of approximately 30 roadway and roadside
countermeasures assessed on the 150 fatal motor vehicle crashes. Through this
approach several countermeasures (under specific conditions) were found to be
effective, with the recommended countermeasures summarized as:
• Addition of advisory speed signs or other speed controls,
• Geometric alignment improvements,
• Widening of lanes/pavement widths,
• Adding and/or widening graded/stabilized shoulders, and
• Widening/improvement of clear zones.
The authors identified these countermeasures and the specific conditions under
which they are effective as the most beneficial roadway and/or roadside
improvements for reducing fatal motor vehicle crashes on two-lane rural roads in
Georgia.

66
This Page Left Blank Intentionally

67
7.0 REFERENCES
Al-Senan, S., and P. Wright (1987). Prediction of Head-On Accident Sites. TRR 1122. TRB, National Research Council, Washington, D.C. American Association of State Highway and Transportation Officials (2001). A Policy on Geometric Design of Highways and Streets. Washington, D.C.
American Associate of State Highway and Transportation Officials (2002). Roadside Design Guide. Washington, D.C. Boyce, D. E., J. J. Hochmuth, C. Meneguzzer, and R. G. Mortimer (1989). Cost-Effective 3R Roadside Safety Policy for Two-Lane Rural Highways. Report No. FHWA/IL/RC-003. Federal Highway Administration. Washington, D.C. Breiman, L., J. H. Friedman, R. A. Olshen, and C. J. Stone (1984). Classification and Regression Trees. Wadsworth International Group, Belmont, CA, Cleveland, D. E. and R. Kitamura (1978). Macroscopic Modeling of Two-Lane Rural Roadside Accidents. TRR 681. TRB, National Research Council, Washington, D.C. Council, F. M. and J. Richard Stewart (1999). Safety Effects of the Conversion of Rural Two-Lane to Four-Lane Roadways Based on Cross-Sectional Models. TRR 1665. TRB, National Research Council, Washington, D.C. Council, F. M. (1998). Safety Benefits of Spiral Transitions on Horizontal Curves on Two-Lane Rural Roads. TRR 1635. TRB, National Research Council, Washington, D.C. Creasey, T. and K. R. Agent (1985). Development of Accident Reduction Factors. Report No. UKTRP-85-6. Kentucky Transportation Research Program, College of Engineering. University of Kentucky, Lexington, KY. Dart, Jr., O. K., and L. Mann, Jr. (1970). Relationship of Rural Highway Geometry to Accident Rates in Louisiana. HRR 312. TRB, National Research Council, Washington, D.C. Engineering Standards (1980). Evaluation of Accidents on 2-Lane, Rural Trunk Highways. Minnesota Department of Transportation. Greene, William. Econometric Analysis. Macmillan Publishing Company. 1990. Glennon, J. C., T. R. Neuman, and J. E. Leisch (1985). Safety and Operational Considerations for Design of Rural Highway Curves. Report No. FHWA/RD-86/035. Federal Highway Administration. Washington, D.C.

68
Griffin, L. I., and K. K. Mak (1988). Benefits to be Achieved from Widening Rural, Two-Lane, Farm-to-Market Roads in Texas. Presented at the 67th Annual Meeting of the Transportation Research Board. Gupta, R. C., B. Knorle, and R. P. Jain (1975). Effect of Certain Roadway Characteristics on Accident Rates for Two-Lane, Two-Way Roads in Connecticut. TRR 541. TRB, National Research Council, Washington, D.C. Hadi, M. A., J. Aruldhas, L.-F. Chow, and J. A. Wattleworth (1995). Estimating Safety Effects of Cross-Section Design for Various Highway Types Using Negative Binomial Regression. TRR 1500. TRB, National Research Council, Washington, D.C. Harlow, L. L., S. A. Mulaik, and J. H. Steiger. What if there were no significance tests. Lawrence Earlbaum Associates. 1997. Harwood, D. W., F. M. Council, E. Hauer, W. E. Hughes, and A. Vogt (2000). Prediction of the Expected Safety Performance of Rural Two-Lane Highways. Report No. FHWA-RD-99-207. Federal Highway Administration. Washington, D.C. Hauer, Ezra. Observational Before-After Studies in Road Safety. Elselvier Science/Pergamon. 1997. Hauer, Ezra. “Reflections on Methods of Statistical Inference in Research on the Effect of Safety Countermeasures.” Crash Analysis and Prevention, Pergamon Press, Vol. 15, No. 4, pp. 275-2885. 1983. Hunter, J. E. and F. L. Schmidt (1990). Methods of Meta-Analysis: Correcting Error and Bias in Research Findings. SAGE Publications, Inc., California. Krammes, R. A., R. Q. Brackett, M. A. Shafer, J. L. Otteser, and I. B. Anderson (1995). Horizontal Alignment Design Consistency for Rural Two-Lane Highways. Report No. FHWA-RD-94-034. Federal Highway Administration. Washington, D.C. Melcher, D., K. K. Dixon, S. Washington, and C.-H. Wu (2001) Feasibility of “Subjective” Engineering Assessments of Road Safety Improvements: Bayesian Analysis Development. TRR 1758. TRB, National Research Council, Washington, D.C.
McGee, H. W., W. E. Hughes, and K. Daily (1995). Effect of Highway Standards on Safety. NCHRP Report 374. TRB, National Research Council, Washington, D.C. Miaou, S.-P. and H. Lum (1993). Statistical Evaluation of the Effects of Highway Geometric Design on Truck Accident Involvements. TRR 1407. TRB, National

69
Research Council, Washington, D.C. Miaou, S.-P., P. S. Hu, T. Wright, S. C. Davis, and A. K. Ratti (1993). Development of Relationship Between Truck Accidents and Geometric Design: Phase 1. Report No. FHWA-RD-91-124. Federal Highway Administration. Washington, D.C. Milton, J. C., and F. L. Mannering (1996). The Relationship between Highway Geometrics, Traffic Related Elements, and Motor Vehicle Accidents. Washington State Department of Transportation, Report No. WA-RD 403.1. Federal Highway Administration. Washington, D.C. Traffic Safety Facts 1997. (1999). National Highway Traffic Safety Administration, U.S. Department of Transportation. Washington, D.C. Pruzek, R. M. (1997). An Introduction to Bayesian Inference and it’s Applications. Chap. 11 in What if there were no Significance Tests? eds Harlow, L.L, Mulaik, S. A., and Steiger, pp. 287-318, J. H. Lawrence Erlbaum Associates, New Jersey, 1997. Rosenthal, R. (1991). Meta-Analytic Procedures for Social Research. Applied Social Research Methods Series, Vol. 6. SAGE Publications, Inc., California. S-PLUS 2000 Professional Release 2 for Windows. MathSoft, Seattle, WA. Schoppert, D. W. (1957). Predicting Traffic Accidents from Roadway Elements of Rural Two-Lane Highways With Gravel Shoulders. Bulletin 158. HRB, National Research Council, Washington, D.C. Smith, S. A., J. E. Purdy, H. W. McGee, D. W. Harwood, and J. C. Glennon (1983). Identification, Quantification and Structuring of Two-Lane Rural Highway Safety Problems and Solutions, Vol. 1 - Technical Report. Report No. FHWA/RD-83/021. Federal Highway Administration. Washington, D.C. Stimpson, W. A., H. W. McGee, W. K. Kittelson, and R. H. Ruddy (1977). Field Evaluation of Selected Delineation Treatments on Two-Lane Rural Highways. Report No. FHWA-RD-77-118. Federal Highway Administration. Washington, D.C. Van Maren, P. A. (1980). Correlation of Design and Control Characteristics with Accidents at Rural Multi-Lane Highway Intersections in Indiana. Report No. FHWA/IN-77/20. Federal Highway Administration. Washington, D.C. Vogt, A. and J. Bared (1998). Accident Models for Two-Lane Rural Segments and Intersections. TRR 1635. TRB, National Research Council, Washington, D.C.

70
Voigt, A. (1996). Evaluation of Alternative Horizontal Curve Design Approaches on Rural Two-Lane Highways. Report No. TTI-04690-3. Federal Highway Administration. Washington, D.C. Wolf, F. M. (1986). Meta-Analysis: Quantitative Methods for Research Synthesis. Quantitative Applications in the Social Sciences, Vol. 59. SAGE Publications, Inc., California. Wright, P. H., and K. K. Mak (1972). Relationships Between Off-Road Fixed-Object Accidents Rates and Roadway Elements of Urban Highways. Report No. DOT/HS-800 793. Federal Highway Administration. Washington, D.C. Zegeer, C. V., J. R. Stewart, F. M. Council, D. W. Reinfurt, and E. Hamilton (1992). Safety Effects of Geometric Improvements on Horizontal Curves. TRR 1356. TRB, National Research Council, Washington, D.C. Zegeer, C. V., J. R. Stewart, D. W. Reinfurt, and F. M. Council (1991). Cost-Effective Geometric Improvements for Safety Upgrading of Horizontal Curves. Report No. FHWA-RD-90-021. Federal Highway Administration. Washington, D.C. Zegeer, C. V., D. W. Reinfurt, J. Hummer, L. Herf, and W. W. Hunter (1988). Safety Effects of Cross-Section Design for Two-Lane Roads. TRR 1195. TRB, National Research Council, Washington, D.C. Zegeer, C. V., D. W. Reinfurt, W. W. Hunter, J. Hummer, R. Stewart, and L. Herf (1988). Accident Effects of Sideslope and Other Roadside Features on Two-Lane Roads. TRR 1195. TRB, National Research Council, Washington, D.C. Zegeer, C. V. and J. A. Deacon (1986). Effect of Lane Width, Shoulder Width, and Shoulder Type on Highway Safety: A Synthesis of Prior Research. TRB, National Research Council, Washington, D.C.

71
8.0 APPENDIX A -- SAMPLE CRASH FILE

72

73

74

75

76
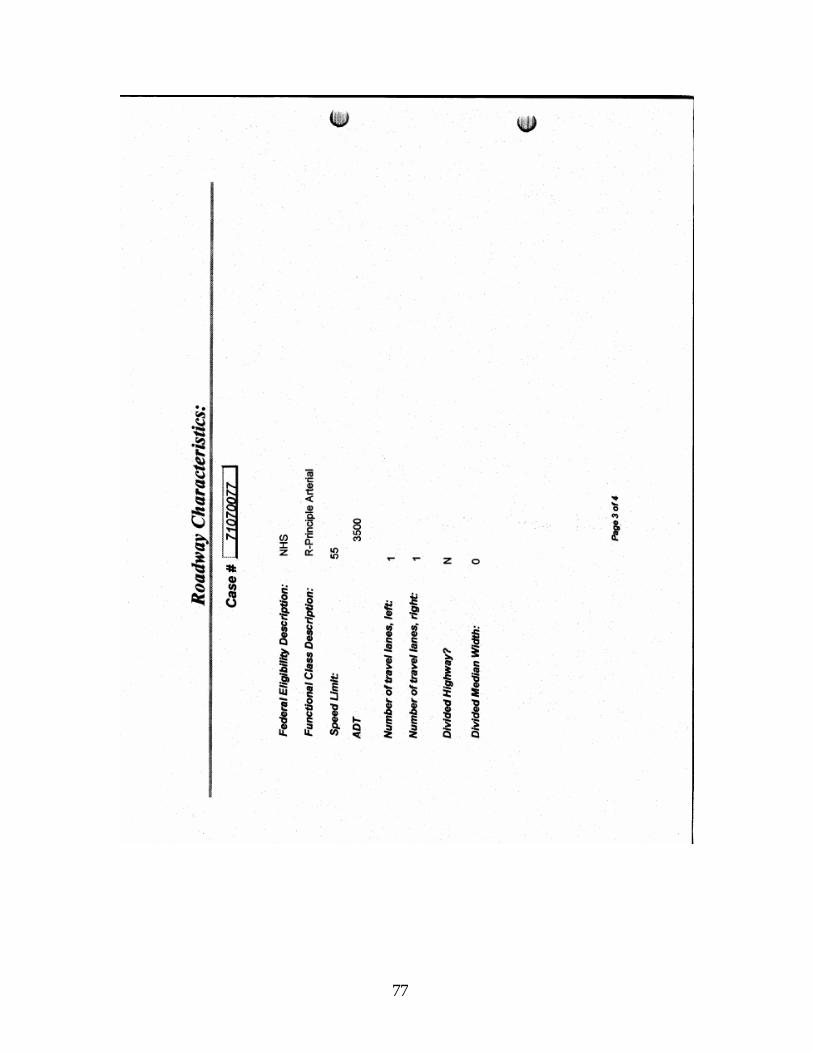
77

78
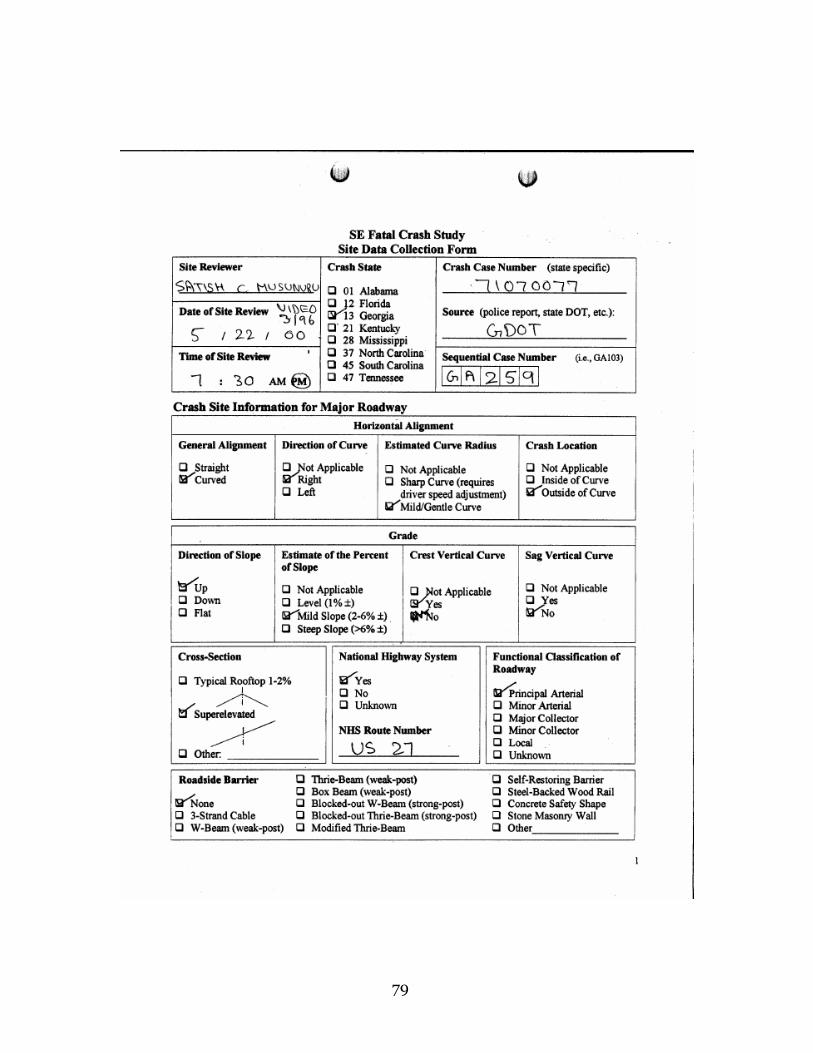
79

80

81

82

83

84

85

86

87

88

89
9.0 APPENDIX B -- DATA DICTIONARY FOR GDOT RCFILE

90
Table 27. Data Dictionary for R C File
Event Item Item Definition
Event Type (feature
type)
Event Definition Event Domain Values
RCLINK 10,10,C N/A GDOT Route Identification Number. Provides relational link between Route features and the RCFILE. Each route in the system has a unique link value
Alphanumeric GDOT route Identification Numbers are composite of the following codes: Positions 1-3 - County FIPS Code Position 4 - GDOT Route Type 0- Unknown Road 1- State Route 2- County Route 3- City Route 4- Col Route 5- Unofficial Route 6- Ramp/Interchange 7- Private Road 8- Public Road 9- Collector-Distributor Roads Position 5-10 - GDOT Route Number (Unique within a given county inventory collection area. Positions 5-8 code the actual number of the road. Positions 9-10 code the following designations: 10- State Route or County
Route, none of the following
NO- North, SO- South EA- East, WE- West AL- Alternate BY- Bypass SP- Spur CO- Connector LO- Loop TO- Toll DU- Dual Mileage AD- Alternate Dual BD- Business Dual BC- Bypass Connector CD- Connector Dual SD- Spur Dual NN- City Suffix Number

91
Table 27. Data Dictionary for R C File (continued)
MILEPOINT 7,7,N,2 Point Mile measurement along Route field collected and recorded to 1/100th of a mile. Use this item as the measurement item for mapping point events using Dynamic Segmentation
Milepoint
FROM 7,7,N,2 Point Milepoint along Route demarking the beginning milepoint for linear events, measured as a distance from the Route 0 milepoint
Milepoint
TO 7,7,N,2 Point Milepoint along Route demarking the ending milepoint for linear events, measured as a distance from the Route 0 milepoint
Milepoint
DESCRIPTION 20,20,C Point Milepoint along Route demarking the ending milepoint for linear events, measured as a distance from the Route 0 milepoint
Milepoint
DISTRICT 2,2,C Linear GDOT District responsible for the inventory and collection of route characteristics
GDOT district number

92
Table 27. Data Dictionary for R C File (continued)
DESIG_TRUCK 1,1,C Linear Route sections officially designated by the FHWA and GDOT for use by large trucks
1. Single and twin trailers and singles
2. Single Trailers only 3. Twins only 4. Original interstate routes L- Access limits from
interstate routes N- Access limits from other
than interstate routes T- Other than original interstate (T's are now A's)
SPEED_LIMIT 2,2,1 Linear Actual standard speed limit in miles per hour
Integer value between 5 and 70
FA_FAS_RT_NUM 5,5,C Linear Actual FA/FAS route number with Spur or Loop if any
5 Character Federal Identification Number
ST_RT_SEQ 2,2,1 Linear Sequence of counties in which a state route traverses
0-99
INV_YEAR 2,2,1 Linear Last two digits of the year of actual inventory
00-99
ACCESS 1,1,C Linear Control of traffic access to a route
U- Free access to the road at grade P- Access at grade are
intersecting roads F- Access is gained only at interchanges or rest areas
OPERATION 1,1,1 Linear Direction of traffic flow along route
0- Can never be used 1- One way (non restricted) 2- Two way (non-restricted) 3- Reversable 4- One-way during school hours 5- One-way (with truck restrictions) 6- Two-way (with truck restrictions) 7- Through trucks restricted
TRAVEL_LANES 2,2,C Linear 1 character num. Left, 1 character num. right. Representing the number of lanes along the route
Combinations of 1-9 on both character positions representing the actual number of lanes

93
Table 27. Data Dictionary for R C File (continued)
L_SHOULDER_D 3,3,C Linear Describes width and type of shoulder on left of a divided highway
First 2 characters code shoulder width in feet, 3rd character codes shoulder composition as follows: G- Grass or sod S- Gravel or stone F- Bituminous Surface
treatment (low) I- Bituminous concrete (high) J- Portland cement (high) C- Curb and gutter (always coded '00C') N- No shoulder or curb D- Gutter only O- Bituminous concrete (high)
with curb and gutter P- Bituminous surface
treatment (low) with curb and gutter
SURFACE_D 3,3,C Linear Describes the width and type of pavement surface of a divided route
First 2 characters code pavement width in feet, 3rd character codes surface type as follows: A- Primitive road B- Unimproved road C- Graded and drained
(natural earthen materials) D- Soil-surfaced road E- Gravel or stone road F- Bituminous surfaced
treated (road of any type to which a bituminous surface layer which <1" thick)
G- Mixed bituminous (<7" combined thickness of surface and base materials, surface alone is >1" thick)
I- High flexible (>7" combined thickness
J- High rigid (Portland cement concrete pave-ments with or without bituminous surface if < 1")
K- Brick L- Block (consisting of stone,
asphalt, wood and other block, steel or wood with <1" surface thickness)
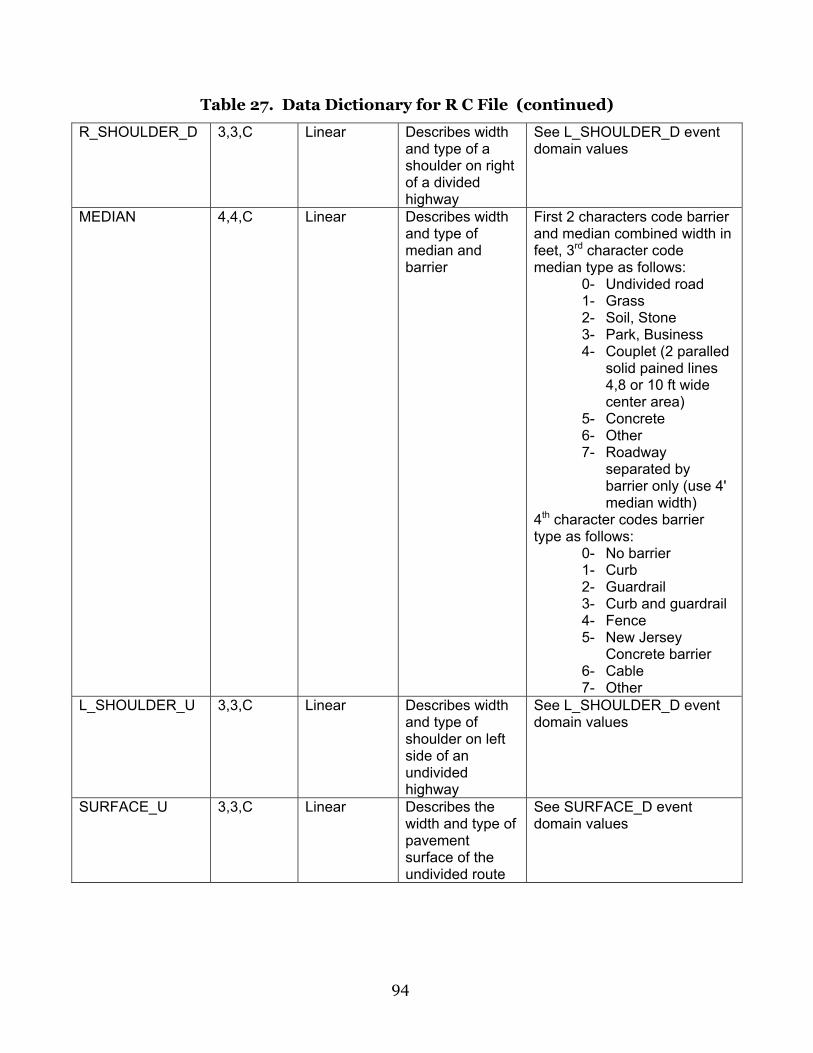
94
Table 27. Data Dictionary for R C File (continued)
R_SHOULDER_D 3,3,C Linear Describes width and type of a shoulder on right of a divided highway
See L_SHOULDER_D event domain values
MEDIAN 4,4,C Linear Describes width and type of median and barrier
First 2 characters code barrier and median combined width in feet, 3rd character code median type as follows:
0- Undivided road 1- Grass 2- Soil, Stone 3- Park, Business 4- Couplet (2 paralled
solid pained lines 4,8 or 10 ft wide center area)
5- Concrete 6- Other 7- Roadway
separated by barrier only (use 4' median width)
4th character codes barrier type as follows:
0- No barrier 1- Curb 2- Guardrail 3- Curb and guardrail 4- Fence 5- New Jersey
Concrete barrier 6- Cable 7- Other
L_SHOULDER_U 3,3,C Linear Describes width and type of shoulder on left side of an undivided highway
See L_SHOULDER_D event domain values
SURFACE_U 3,3,C Linear Describes the width and type of pavement surface of the undivided route
See SURFACE_D event domain values

95
Table 27. Data Dictionary for R C File (continued)
R_SHOULDER_U 3,3,C Linear Describes width and type of shoulder on the right side of an undivided highway
See L_SHOULDER_D event domain values
AUX_LANES_L 3,3,C Linear Auxiliary lanes of different types located on the left side of the route
First 2 characters code auxiliary lane width, 3rd character codes type of lane as follows: A- Left turn B- Right turn C- Left and right turn D- Left-left lane in center of
road E- Passing or climbing lane F- Parking lane (must be
striped or posted) G- Angle parking H- Left turn and parking I- Left left lane in center of
road and parking J- Left-left lane in center of
road and right turn K- Marked of striped median
in center of road, undivided roads only
L- Left turn and other M- Striped median in center
and other N- Right turn and other, must
be marked with an arrow O- All additional non-through
roadway width not listed P- Parking and other Q- Left-left turn and other R- Left turn, right turn and
other T- Transition lane
AUX_LANES_R 3,3,C Linear Auxiliary lanes of different types located on the right side of the route
See AUX_LANES_L event domain values

96
Table 27. Data Dictionary for R C File (continued)
FUNC_CLASS 2,2,1 Linear Code for functional classification, see Value list
Rural 1. Interstate principal arterial 2. Principal arterial 6. Minor Arterial 7. Major collector 8. NFA Minor Collector 9. Local Urban 11- Interstate Principal arterial 12- Urban freeway and
expressway 14- Urban principal arterial 16- Minor arterial street 17- Collector street 19- Local
R_W 4,4,C Linear Right of way in feet
First 3 character code the right of way in feet, 4th character codes as follows: A. Actual width E. Estimated width
SIDEWALKS 2,2,C Linear 1 character alpha left, 1 character alpha right, Indicates existence of sidewalk on left or right side of route
S- Exists
SIGNALS 1,1,C Point Code defining the type of traffic signal along route
S- Traffic control device (red, amber, green)
P. Traffic control w/ pedestrian signalization
A-Stop sign F-Flasher, other than overhead beacon L-Traffic control device with left turn arrow B-Beacon, overhead flashing number R-Beacon, overhead flashing red C-Stop, all directions Y- Yield sign W-Yield sign, opposite direction of inventory O-Stop sign, opposite direction of inventory

97
Table 27. Data Dictionary for R C File (continued)
INTERSECTION 20,20,C Point Intersecting junction of two or more routes See JUNCTION feature
The following codes where nnnnnnn is the route number and the (L, R) is the side of the route SRX - State route cross-road CRX- County route cross-road CSX- City route cross-road SRT- State route T intersection CRT- County route T intersection CST- City route T intersection SRY- State route Y intersection CRY- County route Y intersection CSY- City route Y intersection COM- route becomes common to the specified route EXC- Route exists the county and re-enters RPT- Ramp T intersection RPX- Ramp Cross road RPY- Ramp Y intersection CDT- Collector distributor T intersection CDX- Collector distributor cross road CDY- Collector distributor Y intersection
STRUCTURES 19,19,C Point See BRIDGE feature
CUL_DE_SAC 1,1,1 Point See CUL_DE_SAC feature
UNDERPASS 19,19,C Point See UNDERPASS feature
REST_SITES 19,19,C Point See REST SITES feature

98
This Page Left Blank Intentionally

99
10.0 APPENDIX C -- META-ANALYSIS PROCESS
Highway safety is an important aspect of highway planning and design with
highway safety research extending over many decades. Motor vehicle crashes on
rural highways involve multiple factors that include the driver, motor vehicle, and
the environment. The environmental factors include not only the weather and
time of day but also the condition of the roadway and roadside. Researchers have
attempted, with some success, to identify the most pertinent factors related to the
roadway and roadside environment with the intent to better design these factors
and reduce the number of fatalities, injuries, and property damage claims
resulting from motor vehicle crash occurrences. These roadway factors include
highway geometric design, pavement markings, traffic signs, and roadside
features with the roadway factors proving the most flexible to control in relation
to highway safety. This research has produced many results, some conflicting,
regarding the best approach to the problem of rural highway crashes.
INTRODUCTION
This current research attempts to complement the prevailing body of work with
insight that will guide future design policy regarding rural highways. This
appendix presents the method used to critically examine the body of available
relevant literature and glean integral study results for statistical analysis towards
integrating the results. This method is known as meta-analysis and is commonly
termed the analysis of analyses.
Meta-analysis is a departure from traditional causal narrative literature reviews
as it permits quantitative review and synthesis of research literature. In research,
the task of integrating numerous study findings can be complex and the
traditional procedures of integrating conflicting results across large numbers of
studies are sometimes inadequate. This underscored the need for methods to
integrate existing study results, from which patterns of invariable relationships
can be identified. Meta-analysis applies statistical procedures to accumulated

100
individual study empirical findings with the express purpose of integrating,
synthesizing, and gleaning useful information from them. Meta-analysis brings a
technical and statistical approach to traditional causal narrative literature
reviews with the findings of voluminous research treated as a complex data set
requiring statistical analysis. Each individual study is considered a single data
point in any analysis as opposed to traditional research studies that consider
individual subjects for analysis.
The purpose of meta-analysis is to elucidate the vast amount of already
documented study results and the meta-analysis process can both support the
existing body of knowledge and provide directions towards lacking needed
research. Research questions are seldom answered by single studies or designed
experiments in transportation engineering, however, progress can be made from
the accumulation and refinement of large bodies of work by discovering
underlying trends and principles. Though literature reviews of empirical
research are integral to summarizing and clarifying the state of engineering at
any instance in time, traditional narrative literature reviews are found lacking
from their dependence on subjective judgment, reviewer's biases, and disparate
definitions, variables, procedures, and samples of the original researchers. Also,
study conclusions are often contradictory or inconclusive, and study results are
often misinterpreted. Safety research reports are gathered and each report is
examined and evaluated by individuals who note pertinent information regarding
its characteristics and quantitative results. An analysis of the resulting data is
then conducted using statistical techniques to describe the findings in the
selected studies.
There are many methods, other than meta-analysis, to aggregate and investigate
selected research reports, but this process plays an important role. Meta-analysis
is only applicable on empirical research studies, only applies to research that
produced quantitative findings, hence disqualifying qualitative forms of research,
and is a technique for encoding and analyzing research reports' summary
statistics results. In the event that the complete original data sets for the study

101
are available, it is recommended that more appropriate conventional methods be
used for analysis rather than the meta-analysis process. In addition, because
aggregation and comparison of various research study results are the basis of a
meta-analysis, these results must be able to be compared effectively. Hence, the
findings must address similar relationships and be statistically similar. Each
safety study's findings are represented in the form of safety effect sizes in a meta-
analysis process. The critical qualitative information from each pertinent safety
study finding is encoded in the safety effect size statistic. Safety effect size
statistics generally vary depending on the type of study findings.
The body of research included in a meta-analysis must reflect comparable
research designs and it is imperative that the meta-analyst develops a rationale
for either the inclusion or exclusion of safety studies from the process. A
significant problem remains regarding integrating results into a database for
meaningful analysis given a set of quantitative research results. These safety
studies, for example, rarely use the same measurement procedures for applicable
variables. This problem is addressed through the concept of standardization and
involves the various safety effect size statistics used in encoding numerous
quantitative study results. The statistical standardization of the safety study
results, produced by the safety effect size statistics, results in the numerical
values being consistently interpretable across applicable variables and measures.
The key to meta-analysis is defining a safety effect size statistic representative of
the quantitative results of a body of research in a standardized form that then
permits meaningful analysis across the research. Of the many possibilities, the
safety effect size statistics that record a relationship's magnitude and direction
are more greatly desired. A meta-analyst should seek a safety effect size statistic
for any scrutinized research that facilitates adequate standardization.
The meta-analysis process addresses potential problems from traditional causal
narrative literature reviews including: (1) selective study inclusion through
quality of study reviewer bias; (2) subjective weighting of different studies; (3)
misinterpretation of study results; (4) failure to examine studies' characteristics

102
as potential causes for varying or consistent studies results; and (5) the effect of
moderator variables on the investigated relationship.
Generally, the meta-analysis process involves the following steps:
1. For each available study identify and determine the desired descriptive
statistic, then calculate the average across studies.
2. Calculate the variance of that statistic.
3. Correct the variance for sampling error (sampling error is usually large
because the sample size is determined by the number of studies as opposed to
the number of subjects in a study).
4. Correct the mean and variance for artifacts other than sampling error.
5. Compare the corrected standard deviation (considered an overestimate of the
true standard deviation) to the mean to assess the magnitude of the variation
in results across studies.
PROBLEM SPECIFICATION AND STUDY RETRIEVAL
Study Overview
Upon determination of the comprehensive study’s goals and objectives, conduct a
cursory literature search to identify as many pertinent articles related to the
general subject area as possible.
Combining Research Results
For this Georgia study, the research team and GDOT representatives identified
several prospective safety countermeasures and conducted a thorough search to
locate and retrieve all literature germane to the subject area. This search
included books, journals, theses, and unpublished work. Upon completion of this
task, all relevant statistics from the retrieved literature were extracted and
tabulated. This included data such as sample size, duration of study, regression
parameters, t-statistics, etc.

103
Identify Artifacts and Associated Attenuation Factors
The database developer next determined what, if any, study artifacts could alter
the recorded measures and noted these studies for further analysis. To correct
for the effect of an artifact, information about the size and nature of the artifact is
required. For each available study artifact, an analyst rated the degree of
attenuation with a score lying between the limits of 0 and 1.0 in 0.1 increments.
A score of 1.0 means there was no error in measurement while a score close to 0
means the score was largely due to error. These scores were appended to the
table and the GT team computed the compound artifact attenuation factor by
determining the product of each separate factor.
Attenuation factor for safety study duration (year)
During analysis, the GT researchers developed an attenuation factor for safety
study duration. The rationale behind these scores is based on the assumption
that roadway characteristics and conditions would remain relatively unchanged
over shorter periods of time. Safety studies conducted across longer periods of
time are susceptible to variation in the roadway characteristics and a lack of
adequate documentation of those changes. Hence, shorter safety study duration
resulted in a higher attenuation factor scores than longer safety study duration.
Safety study duration ranged from a minimum of one year to as much as six
years. The attenuation scores ranged from 1.0 through 0.5 respectively.
Attenuation factor for selection bias
The GT researchers also developed a selection bias attenuation factor. The
reasoning behind these scores relates to the method by which study states, crash
sites, crash duration, crash types, etc. were selected. Higher attenuation factor
scores were awarded to safety studies that used random selection as judiciously
as possible; whereas, safety studies that presented little or no evidence of
randomness received low attenuation scores. The range of attenuation factor
scores ranged from a high of 1 down through 0.5.

104
Attenuation factor for omitted variables
The research team also developed a third attenuation factor representing omitted
variables. The rationale behind these scores relates to the kind of crashes
(dependent variables) that were modeled and the independent variables included
in the model. Say, we were examining the relationship between head-on crashes
on two-lane rural roads. We would expect independent variables such as lane
width, shoulder width, access points, vertical alignment, horizontal curvature,
and other related roadway variables to be considered as possible crash predictors.
As such, the more comprehensive the list of included independent variables, the
higher will be the attenuation factor score. This applies to all modeled crash
types, i.e. single-vehicle run-off road crashes, truck crashes, curve crashes, etc.
It should be noted that the meta-analysis process cannot correct for any artifact
where no information exists. Unfortunately, no safety study contains complete
information on all artifacts. Hence, a fully corrected meta-analysis cannot
correct for all artifacts.
Determine the appropriate weight for each safety study
Weighting is necessary to account for the differences inherent to each safety
study resulting from both sample sizes and artifacts. The authors expected
results from larger sample size safety studies to have more influence over the
meta-analysis process than results from relatively smaller sample safety studies.
Each safety study was weighted according to the product of its sample size and
square of its compound artifact attenuation factor.
Measuring safety effect size
In an effort to approximate the safety effect size of a study, each applicable safety
study statistic was converted to a similar metric. Next, each study safety effect
size was weighted and summed across all studies. Finally, the previous sum is

105
divided by the sum of the weights to produce the average corrected
countermeasure safety effect size (mean).
After correction of each applicable safety study statistic for artifacts and
weighting assignment, the authors computed three meta-analysis averages using
the corrected safety effect: the mean corrected safety effect, the mean variance of
the corrected safety effect, and the mean sample error variance for the corrected
safety effect. The corrected variance of corrected safety effect is computed as the
difference between variance attributed to sampling error and variance attributed
to error of measurement. Negative values present in some meta-analysis results
conceptually reflect the indirect effect that countermeasure has on crash
occurrences, i.e. if we increase lane width or shoulder width we should expect a
decrease in the number of crashes or their severities. Negative signed variances
are considered as zeros as they are determined by the difference of two other
variances.
The following titled columns (see Table 28) describe each component of the
meta-analysis process in detail:
1. Study number: refers to the individual safety study included in the process.
2. Author(s): The author(s) of each safety study.
3. Sample Size: The total number of crashes.
4. Years: The time period across which the safety study crash data were
collected.
5. Accident Type: Identifies the specific crash type(s) examined by the safety
study.
6. Analysis Approach: Identifies the modeling methodology applied to the
data.
7. Safety effect size: Identifies the safety study model coefficient associated
with the applicable countermeasure, including the appropriate sign. This is
noted as the uncorrected effect.
8. Year Factor: Artifact that affects the recorded measure over time.
106
9. Selection Bias: Artifacts that affect the recorded measure due to prejudice.
10. Omitted Variables: Artifacts that affect the recorded measure through
omission.
11. (Compound) Attenuation Factor: The product of 8, 9, and 10.
12. Corrected Effect: The quotient of the safety effect size and the compound
attenuation factor. This corrects the observed safety study coefficient for the
reduction caused by artifacts.
13. Study Weight: A function of the sample size and the attenuation factor.
14. Ave(rage) Effect: Product of safety study weight and corrected effect. The
sum across the total number of safety studies divided by the sum of the total
safety study weights. This represents the mean coefficient corrected for
individual known artifacts.
15. Theta: Quotient of average effect and sample size.
16. Var(iance) Effect: The mean variance of the corrected effect.
17. Error Variance: The sampling error variance of the uncorrected effect.
18. Sample Error Variance: Quotient of error variance and the square of the
(compound) attenuation factor. This is noted as the sampling error variance
of the corrected effect.
19. Weighted Error Variance: Product of simple error variance and safety
study weight. The sum across the total number of safety studies divided by the
sum of the total safety study weights. This represents the variance of the
corrected mean coefficient.
Common criticism of application of meta-analysis to safety includes: (1) safety
studies with disparate measuring techniques, variable definitions, and subjects
that cannot be compared and aggregated to any logical conclusions; (2)
combining results from "good" designed safety studies with results from "poorly"
designed safety studies cannot produce relevant meta-analysis results; (3) meta-
analysis results are biased as a result of biased published research (only
significant results); and (4) incorporation of multiple results from the same safety
study can invalidate meta-analysis results through lack of independence.

107
Examining and Reducing Bias
Both qualitative and quantitative literature reviews can, in many ways, result in
biased analyses or conclusions. A meta-analysis may produce biased conclusions
through inclusion of published positive results and the omission of negative
results. Also bias can occur by applying equal weights to the results of all safety
studies examining the same research questions, though clear qualitative
differences exist between them. Similarly, including many tests on a hypothesis
from one safety study will induce statistical bias. These issues present difficult
problems for the meta-analyst. Though numerous potential strategies exist for
addressing these issues, there is still no consensus on a definitive approach. In
all likelihood, a literature review rarely uncovers every safety study conducted on
a specific hypothesis. Because of the tendency for safety studies resulting in
support of the null hypothesis of no significance to be stored away in file drawers,
this is commonly called the "file drawer problem." With the tendency for safety
studies to be abandoned if it appears that statistically significant results are futile,
published research tends to be biased towards positive outcomes. Replications of
previous statistically significant safety studies that result in non-significant
results are rarely published, which is generally justified by the number of
statistically significant safety study results editors receive for publication.
Separate analyses for published and unpublished safety studies are often
performed by many meta-analysts to determine if any differences in safety effect
size are present and can be attributed to the safety study source. It has been
proposed that this problem be addressed analytically by determining the number
of safety studies supporting the null hypothesis needed to reverse a conclusion of
the existence of a significant relationship.
Problem Specification and Safety Study Retrieval
Quantitative research results are presented in various forms to the meta-analyst
and can be correlation coefficients, regression coefficients, etc. A coding process
using a safety effect size statistic must be used on the results for the meta-

108
analysis problem. In any meta-analysis process the same safety effect size
statistic must be utilized in coding all the results for both consistency and
comparison purposes. It is therefore incumbent on the meta-analyst to identify
and procure all pertinent research results to ensure that a common safety effect
size statistic can be used. Meta-analysts have yet to fully develop safety effect size
statistics that adequately represent results from multivariate analysis (due to
their complexity).
Safety Study Eligibility Criteria
Upon definition of the meta-analysis topic and determination of the appropriate
research type, the next research step included identification of safety research
reports to include in the meta-analysis. For a study to qualify for inclusion in the
meta-analysis, it must next adhere to a detailed list of specification criteria. These
include categories such as (a) distinguishing features, (b) key variables, (c)
research design/method, (d) time frame, and (e) publication type. The following
discusses each of these categories:
(a) Distinguishing Features.
This explored the aspect of a safety study that legitimized its inclusion in the
meta-analysis process. In addressing fatal crashes on two-lane rural highways we
include motor vehicle crashes of all types, i.e. passenger cars, trucks, sport utility
vehicles (SUVs), etc., pedestrian crashes, crashes that occurred at both
intersections and on roadway segments, and on tangents and curves. We
excluded safety studies from crashes involving the roadway surface, and the
weather.
(b) Key Variables.
For inclusion in the analysis, a safety study must include any variable related to
the list of crash countermeasures. In addition, a safety study should possess, at a
minimum, adequate statistical information for the estimation of a safety effect
size statistic or any other necessary information germane to the meta-analysis

109
process. The quality of research methodology reporting in the safety study
literature is severely wanting. It is almost impossible for the meta-analyst to
determine what transpired during the course of a safety study as most reports
either do not record, or ambiguously report, the methods and procedures
employed during the study. As such, the quality of research methodology is very
subjective but, through appropriate coding, allows the analyst an opportunity to
determine the influence that different methods have on research results.
(c) Research Design/Method.
Most highway safety studies are of the before-after (B-A) type, with and without
control groups, followed by a smaller number of cross-sectional studies.
Selection bias is prevalent through the selection of facilities with high crash
frequencies. Some safety research studies omit important variables necessary for
a more comprehensive evaluation of a crash scenario. While some or all of the
above conditions compromise the meta-analysis process, none are deemed
serious enough to disqualify a safety study from the meta-analysis process. The
onus is on the analyst to recognize these sources of error or bias, make a note of
the source, and account for them in the meta-analysis process.
(d) Time Frame.
This investigation evaluated all safety studies irrespective of when they were
conducted. We were mindful of changes that may occur on a highway facility that
would affect traffic flow, and the enactment of legislation that may affect driver
safety such as seat belt mandatory use laws, speed limit increases or decreases,
air bags, etc. With that in mind, we placed more confidence in results produced
from safety studies either with data collected across a shorter time span or
investigated over a shorter period of time. These were coded accordingly.
(e) Publication Type
The GT team sought to include all report types in the meta-analysis process
(especially unpublished safety studies, as their exclusion will probably introduce
an upward safety effect size bias). However, restrictive eligibility criteria would

110
allow the meta-analysis process to include only the best safety studies. This
would limit the quality and quantity of eligible studies. This includes published
journal articles, books, Doctoral dissertations, technical reports, unpublished
manuscripts, conference proceedings, etc. It also proved markedly harder to get
research reports from foreign countries.
IDENTIFYING, LOCATING, AND RETRIEVING RESEARCH REPORTS
The eligibility criteria define the meta-analyst's study populations, and the
analysis effort included every attempt to identify and retrieve each safety study.
The research team developed a record keeping system to detail the progress in
identifying potential reports, the search status, and outcome. This record
keeping system includes information on each potential report such as authors,
title, publication type and duration of safety study. Eligible reports were noted
and recorded as active for the meta-analysis process.
Finding References
This process was two pronged: first, the potentially eligible safety studies were
located, and second, copies of the studies were obtained to check for eligibility
and inclusion in the meta-analysis process. The former task proved more
challenging than the latter, as it entailed multiple sources. These sources
included review articles, safety study's references, computerized bibliographic
databases, journals, conference proceedings, experts in the area of interest, and
government agencies as summarized below:
(i) Review articles are great first sources as they provide references on the
subject, though not necessarily in-depth study information.
(ii) Study's references are included in retrieved eligible safety studies. They
are cited along with other similar safety studies. They serve to identify
unknown potential eligible studies.

111
(iii) Computerized bibliographic databases facilitate reference retrieval
through keyword searches. The databases available for searches included,
Georgia Tech Library catalogue (GTEC), Engineering Index (ENGI),
Transportation Research Information Service (TRIS), National Technical
Information Service (NTIS), ERIC, Dissertation Abstract Online, and
Dialog.
(iv) Certain journals are more prevalent in their contributions to the potential
list, as such. Since identified journals publish the research topic area, they
may possibly contain undisclosed articles that do not appear in a general
database search. The GT team performed a cursory check of all volumes'
table of contents to identify potential articles.
(v) Conference proceedings from professional organizations provided useful
information about papers and authors. This permitted direct contact with
an author and possible access to research topic related material they may
possess.
(vi) Experts may have intimate knowledge on undiscovered studies and
material. A request for assistance often produces material or information
leading to additional research worthy of consideration.
(vii) Research oriented federal government agencies provided an excellent
source for the meta-analyst as they have records on funded research
projects including current ongoing research. Also, state and local
government agencies provided a valuable resource.
Retrieving Research Reports
Once a study has been identified and deemed possibly eligible for inclusion, the
meta-analyst initiates the retrieval process. This involves journal articles, books,
Doctoral dissertations, and microfiche in the library, in addition to copies of
material from other libraries through the interlibrary loan service. Also, external
dissertations are available from Dissertation Abstract International, and
government reports from the Government Printing Office. After the studies were
retrieved copies of all reports for the meta-analysis process are archived. The

112
analysts exercised due diligence in retrieving all pertinent research reports as
omissions could create potential selection bias.

113
Table 28. Sample Meta-Analysis Table
Study
Number
Sample
Size Years
Analysis
Approach
Effect
Size (ft)
Corrected
Effect
Year
factor
Selection
Bias
Omitted
Variables
Attenu-
ation
Factor
Study
Weight
Ave
Effect Theta
Var
Effect
Error
Var
Sample
Error
Var
Weighted
Error
Var
1 234 3 Discriminant -0.0074 -0.0220 0.80 0.60 0.70 0.336 26.4 -0.582 -0.002 2.52 0.0042 0.0379 1.002
2 6483 5 Non-linear -0.1294 -0.2996 0.60 0.80 0.90 0.432 1210.0 -362.499 -0.056 1.16 0.0002 0.0008 0.998
3 190 4 Regression -0.0323 -0.0942 0.70 0.70 0.70 0.343 22.4 -2.105 -0.011 1.25 0.0053 0.0446 1.003
190 4 Non-linear -0.0294 -0.0858 0.70 0.70 0.70 0.343 22.4 -5.194 -0.027 0.22 0.0053 0.0449 1.003
190 4 Regression -0.0797 -0.2324 0.70 0.70 0.70 0.343 22.4 -3.998 -0.021 0.52 0.0053 0.0449 1.003
190 4 Non-linear -0.0613 -0.1788 0.70 0.70 0.70 0.343 22.4 -53.478 -0.281 95.03 0.0053 0.0449 1.003
4 71 5 -ve Binomial -0.9187 -2.3924 0.60 0.80 0.80 0.384 10.7 -25.047 -0.353 44.51 0.0143 0.0967 1.012
5 2425 5 Non-linear -0.0223 -0.0515 0.60 0.80 0.90 0.432 452.5 -23.301 -0.010 35.25 0.0004 0.0022 0.998
6 6483 5 Non-linear -0.1755 -0.4064 0.60 0.80 0.90 0.432 1210.0 -491.670 -0.076 6.95 0.0002 0.0008 0.998
7 8528.5 2 -ve Binomial 0.0478 0.0843 0.90 0.70 0.90 0.567 2741.8 231.082 0.027 471.90 0.0001 0.0004 0.998
8 5584 1 Log-linear -0.1469 -0.1469 1.00 1.00 1.00 1.000 5584.0 -820.290 -0.147 188.40 0.0002 0.0002 0.998
9 5764 3 Logistic -1.1640 -3.4643 0.80 0.60 0.70 0.336 650.7 -2254.130 -0.391 6389.70 0.0002 0.0015 0.998
10 1135 3 Poisson -0.4941 -1.4706 0.80 0.60 0.70 0.336 128.1 -188.437 -0.166 166.53 0.0009 0.0078 0.999
1608 3 Poisson -1.3672 -4.0690 0.80 0.60 0.70 0.336 181.5 -738.525 -0.459 2536.62 0.0006 0.0055 0.998
11 420 5 Log-linear 4.0707 10.6009 0.60 0.80 0.80 0.384 61.9 656.528 1.563 7400.62 0.0024 0.0161 1.000
38925 -0.0340 0.423 12346.8 -0.331 -0.027 1.40 0.3494 0.001
Effect
Mean -0.3306 Var (effect) = 1.403
Effect
Var. 1.4033 s.d. = 1.185

114
This Page Left Blank Intentionally

115
11.0 APPENDIX D – CLASSIFICATION AND REGRESSION TREE
(CART) PROCESS
Classification and regression trees (CART's) were used with the engineering
evaluations to identify roadway and traffic conditions where countermeasures
can be effectively applied to increase safety. CART's are non-parametric
statistical procedures that can be used to classify a response variable based on
one or more predictor variables. In this application of CART, roadway
characteristics and traffic conditions are used to classify different levels of
countermeasure effectiveness. Advantages of tree based models include: ease of
interpretation when predictors include both numeric variables and factors,
treatment of missing values, and modeling of factor response variables with more
than two levels. Also, tree based models capture interactions without explicit
specification. When growing a tree, a binary partitioning algorithm recursively
splits each node's data until either the node becomes homogenous or contains too
few observations (compared to a pre-specified size limitation). The resulting
subsets from this process are called terminal nodes.
The engineering evaluation ratings, from the 150 fatal crashes, were appended
with data on traffic volume (ADT), posted speed limit, roadside hazard rating
(RHR), and lane width, as these predictor variables, or surrogate variables, were
present in both the CART and RCFILE databases and provided the means by
which these databases could be matched to produce estimates of the desired fatal
crashes and affected roadways This process required the matching of each fatal
crash with its respective case number to aid in site characteristic identification.
The research team then examined the newly created database to determine the
presence of non-informative data records (i.e. empty data records). Next, we
factored posted speed limit data into 2 groups; less than 55 miles per hour (< 55
MPH) or 55 MPH and greater (≥ 55 MPH). Also, the analysis team factored RHR
data into 2 groups; ratings of 1 through 4 (1-4) considered safe, and ratings of 5
through 7 (5-7) considered less safe. Similarly the procedure divided the data

116
into two groups for lane width: less than 12 feet, and equal to or greater than 12
feet. To assure consistency, the research team rounded the ADT to the nearest
100 vehicles, and verified and, if possible, corrected each incomplete crash record
based on archived field data. Finally, the research team imported the newly
created database into S-Plus 2000 and converted each column of data to the
correct data type for the CART analysis.
The CART procedure identified predictor variables that appeared to be important
to a particular countermeasure's effectiveness. Countermeasures 3 (add/upgrade
no-passing-zone lines), 13 (add turn lane), 18 (improve access management), and
25 (convert roadside objects to breakaway) proved ineffective for the crashes
studied. This means they resulted in predictor variables with thetas equal to one.
The remaining countermeasures queries were based on ADT, posted speed limit,
RHR and lane width that proved most productive, and the conditions under
which they were considered most effective are presented in Table 23. ADT was
the identified predictor variable for countermeasures 16 (widen and pave existing
paved shoulder), 17 (add rumble strips), 24 (removed fixed object), and 26
(construct traversable drainage structure). Also, ADT, posted speed, RHR, and
lane width were the identified predictor variables for only one countermeasure:
widen lanes/pavement width (countermeasure 12).
Figure 11 shows the results of the tree-growing procedure for countermeasure 22.
The roadways in the root node are first split on RHR 1-4 (Node 2), and RHR 5-7
(Node 3). This process coincides with the maximum reduction in variability of
the dependent variable. If the RHR 5-7 condition exists, they are split again for
ADT < 4800. Subsequent splits for ADT < 2850, posted speed ≥ 55mph, and
ADT < 550 resulted in a predicted theta of 0.67. This tree has 21 terminal nodes.
This shows that overall, road sections with roadside hazard ratings between 5 and
7, with posted speed limits of 55 mph and greater, and ADT less than 550 vehicles
are important variables in predicting the effectiveness of flattening side slopes on
fatal crashes for two-way rural roads. This also shows that overall, road sections

117
with roadside hazard ratings between 5 and 7, and ADT between 4800 and 2850
vehicles (in addition to road sections with roadside hazard ratings between 1 and
4, and ADT between 750 and 550 vehicles) are important variables in predicting
the effectiveness of flattening side slopes on fatal crashes for two-way rural roads.
When growing a tree the result may be more complex than necessary to describe
the data.
| RHR:a
ADT<5700
ADT<3600
ADT<750
ADT<550
Posted.Speed:aADT<450
Lane.Width:a
ADT<1350
ADT<1550ADT<2550
ADT<2850
ADT<4700
ADT<8850
ADT<6950
ADT<4800
ADT<2850
Posted.Speed:a
ADT<650 ADT<550
1 1 1
0.67
1 1 1 1
1 1
1 1
1 11
1 10.67 1
0.67
1
CART for Countermeasure 22
Figure 11: CART for Countermeasure 22
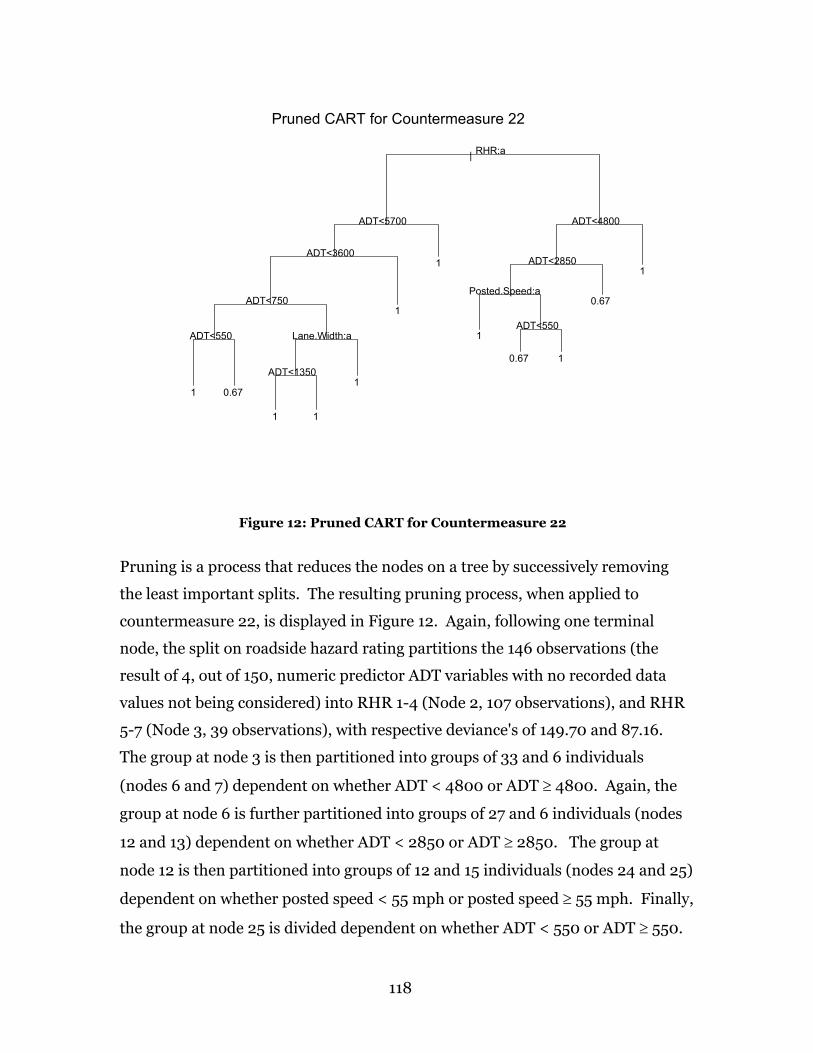
118
| RHR:a
ADT<5700
ADT<3600
ADT<750
ADT<550 Lane.Width:a
ADT<1350
ADT<4800
ADT<2850
Posted.Speed:a
ADT<550
1 0.67
1 1
1
1
1
1
0.67 1
0.67
1
Pruned CART for Countermeasure 22
Figure 12: Pruned CART for Countermeasure 22
Pruning is a process that reduces the nodes on a tree by successively removing
the least important splits. The resulting pruning process, when applied to
countermeasure 22, is displayed in Figure 12. Again, following one terminal
node, the split on roadside hazard rating partitions the 146 observations (the
result of 4, out of 150, numeric predictor ADT variables with no recorded data
values not being considered) into RHR 1-4 (Node 2, 107 observations), and RHR
5-7 (Node 3, 39 observations), with respective deviance's of 149.70 and 87.16.
The group at node 3 is then partitioned into groups of 33 and 6 individuals
(nodes 6 and 7) dependent on whether ADT < 4800 or ADT ≥ 4800. Again, the
group at node 6 is further partitioned into groups of 27 and 6 individuals (nodes
12 and 13) dependent on whether ADT < 2850 or ADT ≥ 2850. The group at
node 12 is then partitioned into groups of 12 and 15 individuals (nodes 24 and 25)
dependent on whether posted speed < 55 mph or posted speed ≥ 55 mph. Finally,
the group at node 25 is divided dependent on whether ADT < 550 or ADT ≥ 550.

119
There is no further division of subgroups. This results in a predicted theta of
0.67. This tree has 12 terminal nodes.

120
This Page Left Blank Intentionally
121
12.0 APPENDIX E – COUNTERMEASURE HANDBOOK

Countermeasure Handbook
Prepared for the Georgia 1997
Fatal Crash Study
Prepared by: Georgia Institute of Technology
School of Civil and Environmental Engineering Atlanta, GA 30332-0355
For Information Regarding Handbook Contact:
Karen K. Dixon, Ph.D., P.E. Telephone: (404) 894-5830
Fax: (404) 894-2278 E-Mail: [email protected]

Countermeasure Handbook 2
TABLE OF CONTENTS
I. INTRODUCTION.......................................................................................................... 6
II. COUNTERMEASURES............................................................................................... 6
A. PAVEMENT MARKING........................................................................................ 15 1. Add or Upgrade Edge line Pavement Marking ..................................................... 15 2. Add or Upgrade Centerline Pavement Marking.................................................... 15 3. Add or Upgrade No-Passing-Zone Pavement Marking Lines .............................. 16 4. Add Raised Pavement Marking (RPMs) to Centerline ........................................ 16
B. TRAFFIC SIGNS..................................................................................................... 16 1. Warning Sign......................................................................................................... 16 2. Advisory Speed Sign............................................................................................. 17 3. Chevron Alignment Sign....................................................................................... 18 4. Post Delineator ...................................................................................................... 18
C. ROADWAY IMPROVEMENTS ............................................................................ 19 1. Modify Geometric Alignment ............................................................................... 19 2. Modify Superelevation / Cross Slope.................................................................... 19 3. Improve Sight Distance without Geometric Realignment .................................... 19 4. Widen Lanes or Pavement Width.......................................................................... 20 5. Add Turn Lane ...................................................................................................... 20 6. Improve Longitudinal Shoulder ............................................................................ 20
a. Add or Widen Graded or Stabilized Shoulder ................................................... 20 b. Pave Existing Graded Shoulder of Suitable Width............................................ 21 c. Widen and Pave Existing Shoulder .................................................................... 21
7. Add Rumble Strips................................................................................................ 22 8. Improve Roadway Access Management ............................................................... 22
D. ROADSIDE IMPROVEMENTS............................................................................. 23 1. Install or Upgrade Guardrail ................................................................................. 23 2. Upgrade Guardrail End Treatment / Add Impact Attenuator................................ 23 3. Clear Zone Improvements ..................................................................................... 24
a. Widen Clear Zone .............................................................................................. 24 b. Flatten Side Slope .............................................................................................. 24 c. Relocate Fixed Object ........................................................................................ 25 d. Remove Fixed Object......................................................................................... 25 e. Convert Object to Breakaway............................................................................ 25 f. Construct Traversable Drainage Structure.......................................................... 26
E. LIGHTING............................................................................................................... 26 1. Add Street Lights to Road Segment ...................................................................... 26 2. Add Lighting to Intersection................................................................................. 27 3. Upgrade Street Lighting for Segment or Intersection........................................... 27
F. REGULATIONS ...................................................................................................... 27 1. Enforce Speed Limits............................................................................................ 27

Countermeasure Handbook 3
III. APPENDIX A. COUNTERMEASURE LITERATURE REVIEW........................ 29
A. PAVEMENT MARKING........................................................................................ 30 1. Add or Upgrade Edgeline Pavement Marking ...................................................... 30 2. Add or Upgrade Centerline Pavement Marking.................................................... 31 3. Add or Upgrade No-Passing-Zone Pavement Marking Lines .............................. 32 4. Add Raised Pavement Marking (RPMs) .............................................................. 33
B. TRAFFIC SIGNS..................................................................................................... 35 1. Warning Sign......................................................................................................... 35 2. Advisory Speed Signs ........................................................................................... 36 3. Chevron Alignment Sign....................................................................................... 37 4. Post Delineator ...................................................................................................... 38
C. ROADWAY IMPROVEMENTS ............................................................................ 39 1. Modify Geometric Alignment ............................................................................... 39 2. Modify Superelevation / Cross Slope.................................................................... 42 3. Improve Sight Distance without Geometric Realignment .................................... 43 4. Widen Lanes or Pavement Width.......................................................................... 44 5. Add Turn Lane ...................................................................................................... 48 6. Improve Longitudinal Shoulder ............................................................................ 50
a. Add or Widen Graded or Stabilized Shoulder ................................................... 51 b. Pave Existing Graded Shoulder of Suitable Width............................................ 55 c. Widen and Pave Existing Paved Shoulder ......................................................... 56
7. Add Rumble Strips................................................................................................ 57 8. Improve Roadway Access Management ............................................................... 57
D. ROADSIDE IMPROVEMENTS............................................................................. 59 1. Install or Upgrade Guardrail ................................................................................. 59 2. Upgrade Guardrail End Treatment / Add Impact Attenuator................................ 60 3. Clear Zone Improvements ..................................................................................... 61
a. Widen Clear Zone ............................................................................................... 61 b. Flatten Side Slope .............................................................................................. 62 c. Relocate Fixed Object ........................................................................................ 63 d. Remove Fixed Object......................................................................................... 65 e. Convert Object to Breakaway............................................................................ 66 f. Construct Traversable Drainage Structure.......................................................... 68
E. LIGHTING............................................................................................................... 69 1. Add Street Lights to Road Segment ...................................................................... 69 2. Add Lighting to Intersection................................................................................. 70 3. Upgrade Street Lighting for Segment or Intersection........................................... 70
F. REGULATIONS ...................................................................................................... 71 1. Enforce Speed Limits............................................................................................ 71
IV. APPENDIX B. REFERENCES ................................................................................ 72

Countermeasure Handbook 4
Countermeasure List of Tables Table 1. Countermeasure Analysis Summary.................................................................... 7 Table A-1. Kentucky Edgeline Crash Reduction Estimates ............................................ 30 Table A-2. FHWA Edgeline Crash Reduction Estimates ................................................ 31 Table A-3. Kentucky Centerline Crash Reduction Estimates.......................................... 31 Table A-4. FHWA Centerline Crash Reduction Estimates ............................................. 32 Table A-5. Kentucky No-Passing-Zone Crash Reduction Estimates .............................. 32 Table A-6. FHWA Passing Lane Crash Reduction Estimates ......................................... 33 Table A-7. Kentucky Raised Pavement Marker Crash Reduction Estimates .................. 34 Table A-8. FHWA Raised Pavement Marking Crash Reduction Estimates.................... 34 Table A-9. FHWA Warning Sign Crash Reduction Estimates ........................................ 35 Table A-10. Kentucky Warning Sign Crash Reductions Estimates ................................ 36 Table A-11. Kentucky Warning Sign Crash Reduction Estimates .................................. 37 Table A-12. Driver Compliance with Advisory Speed.................................................... 37 Table A-13. Kentucky Chevron Warning Sign Crash Reduction Estimates ................... 37 Table A-14. Kentucky Post Delineator Crash Reduction Estimates................................ 38 Table A-15. Kentucky Geometric Improvement Crash Reduction Estimates ................. 40 Table A-16. Miaou Geometric Improvement Crash Reduction Estimates ...................... 41 Table A-17. FHWA Geometric Improvement Crash Reduction Estimates..................... 41 Table A-18. Kentucky Superelevation Improvement Crash Reduction Estimates .......... 42 Table A-19. FHWA Superelevation or Cross Slope Reduction Estimates ...................... 42 Table A-20. Kentucky Sight Distance Improvement Crash Reduction Estimates .......... 44 Table A-21. FHWA Sight Distance Improvement Crash Reduction Estimates .............. 44 Table A-22. Kentucky Lane Width Crash Reduction Estimates ..................................... 45 Table A-23. FHWA Lane Widening Crash Reduction Estimates ................................... 45 Table A-24. Texas Pavement Widening Single-Vehicle Crash Reduction Estimates ..... 46 Table A-25. Percent Crash Reduction Due to Lane Widening (Based on KY Data) ...... 47 Table A-26. Kentucky Added Turn Lane Crash Reduction Estimates ............................ 49 Table A-27. FHWA Turn Lane Construction Crash Reduction Estimates..................... 49 Table A-28. IHSDM Accident Modification Factors for Turn Lanes ............................. 50 Table A-29. Kentucky Shoulder Widening/Stabilizing Crash Reduction Estimates....... 52 Table A-30. Miaou Stabilized Shoulder Improvement Crash Reduction Estimates ....... 53 Table A-31. FHWA Shoulder Stabilization Crash Reduction Estimates ........................ 54 Table A-32. Zegeer Unpaved Shoulder Widening Crash Reduction Estimates .............. 55 Table A-32. Kentucky Paved Shoulder Crash Reduction Estimates ............................... 55 Table A-33. FHWA Shoulder Improvement Crash Reduction Estimates ....................... 56 Table A-34. Zegeer Shoulder Improvement Crash Reduction Estimates ........................ 56 Table A-35. Kentucky Rumble Strip Crash Reduction Estimates ................................... 57 Table A-36. FHWA Rumble Strips Crash Reduction Estimates ..................................... 57 Table A-37. Kentucky Driveway Density Crash Reduction Estimates ........................... 58 Table A-38. FHWA Guardrail Installation Crash Reduction Estimates .......................... 59 Table A-39. Kentucky Guardrail Installation Crash Reduction Estimates ...................... 60 Table A-40. Kentucky Guardrail End Treatment Crash Reductions Estimates............... 61 Table A-41. Kentucky Flatten Side Slope Crash Reduction Estimates ........................... 62 Table A-42. FHWA Flattening Side Slope Crash Reduction Estimates.......................... 63

Countermeasure Handbook 5
Table A-43. Zegeer Flattening Side Slope Expected Crash Reduction Estimates .......... 63 Table A-44. Kentucky Fixed Object Relocation Crash Reduc tion Estimates ................. 64 Table A-45. FHWA Fixed Object Relocation Crash Reduction Estimates ..................... 65 Table A-46. Kentucky Fixed Object Removal Crash Reduction Estimates .................... 65 Table A-47. FHWA Fixed Object Removal Crash Reduction Estimates ........................ 66 Table A-48. Kentucky Breakaway Fixed Object Crash Reduction Estimates................. 67 Table A-49. FHWA Breakaway Utility Pole Crash Reduction Estimates....................... 67 Table A-50. Kentucky Addition of Street Light Crash Reduction Estimates .................. 69 Table A-51. FHWA Street Lighting Crash Reduction Estimates .................................... 70 Table A-52. Kentucky Upgrade of Street Lights Crash Reduction Estimates................. 71

Countermeasure Handbook 6
I. INTRODUCTION Research team members at the Georgia Institute of Technology developed this Countermeasure Handbook as a supplemental guide to be used in the State of Georgia fatal crash study portion of a Federal Highway Administration (FHWA) pooled fund study. The countermeasure list is not all-inclusive, but rather represents feasible engineering-based improvements that can be implemented. As a result, several viable countermeasures such as education and stricter driving laws were not candidates for the handbook. The Georgia study includes a subjective analysis by which each individual crash is evaluated by qualified traffic engineering experts in an effort to determine feasibility and/or effectiveness of the application of a countermeasure for a specific crash. This countermeasure evaluation departs from a common countermeasure evaluation method where a crash type is paired with feasible countermeasures. By evaluating the individual countermeasures at a microscopic level, the research team hopes to identify realistic countermeasure applications. For example, often a run-off-road crash may end when the errant vehicle impacts a tree adjacent to the roadside. The countermeasure suggested for this type of crash would be to remove the obstacle (in this case the tree) and widen the clear zone. Clearly improving the clear zone is a good candidate countermeasure. If the individual crash is evaluated, however, the reviewer may determine that an impaired driver exited the road after crossing an opposing lane (somehow managing to avoid a head-on collision) and then traversed a considerable distance well beyond a reasonable clear zone before impacting the tree. In this example, it is probable that no countermeasure would have prevented the crash. This is the type of detail the Georgia Tech research team seeks to identify and evaluate supplemented by the use of this Countermeasure Handbook.
II. COUNTERMEASURES Numerous feasible engineering countermeasures may be considered for reduction of crashes or crash severity. During the early stages of this research project, Georgia Tech representatives met with representatives of the Georgia Department of Transportation (GDOT) to identify reasonable countermeasures for inclusion in this study. Table 1 includes a list of the countermeasures summarized in this handbook. In addition, Appendix A provides supplemental information regarding past research on each specific countermeasure. Table 1 also includes a column that suggests (based on past research and engineering judgement) suitable conditions for applying the countermeasures. In addition, the subjective analyses proposed for this research includes an effectiveness scale. Two of the evaluation categories are “No Effect” and “Not Applicable.” During a pilot study to assure repeatability of results using numerous reviewers, the distinction between these two categories confused the analysts. As a result, Table 1 includes a third column that discusses conditions where the countermeasure is not applicable.

Countermeasure Handbook 7
Table 1. Countermeasure Analysis Summary
Countermeasures (General / Specific) Suitable Conditions for Applying Countermeasure
Conditions under which Countermeasure is Not Applicable
A. Pavement Marking
1. Add/Upgrade Edgeline
• Improve nighttime visibility of roadway edgeline
• Improve visibility during wet conditions
• Run-off-road crash where driver is alert
• Edgeline in place and in good condition
2. Add/Upgrade Centerline
• Improve nighttime or poor visibility conditions
• Improve visibility during wet conditions
• Crashes where the driver crossed into the opposing lane of travel
• Centerline in place and in good condition
3. Add/Upgrade No-Passing-Zone Lines
• Install where passing maneuvers are not safe under horizontal and/or vertical alignment
• Applicable for restricted sight-distance conditions and intersections
• Crashes where the driver attempted to pass a vehicle at an inappropriate location
• No-passing-zone pavement marking in good condition
4. Add Raised Pavement Markings
(RPM's) to Centerline
• Install where painted centerlines provide inadequate delineation and alert driver crossed centerline
• RPMs already exist and are in good condition
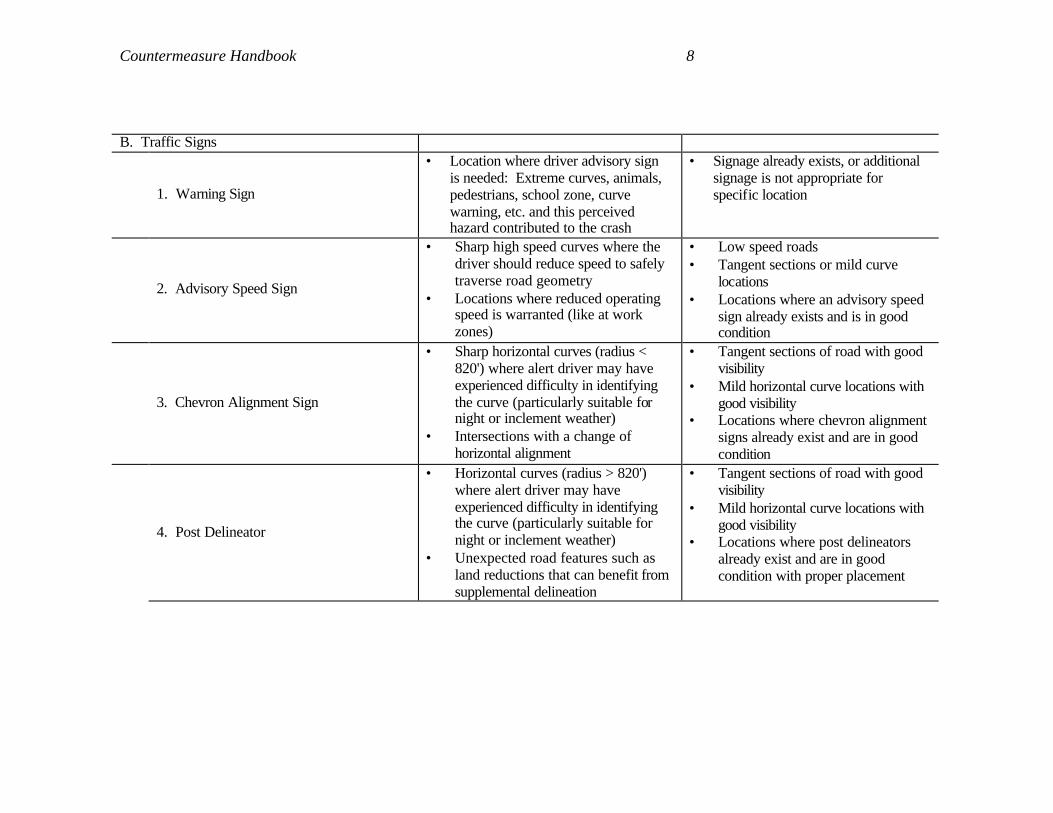
Countermeasure Handbook 8
B. Traffic Signs
1. Warning Sign
• Location where driver advisory sign is needed: Extreme curves, animals, pedestrians, school zone, curve warning, etc. and this perceived hazard contributed to the crash
• Signage already exists, or additional signage is not appropriate for specific location
2. Advisory Speed Sign
• Sharp high speed curves where the driver should reduce speed to safely traverse road geometry
• Locations where reduced operating speed is warranted (like at work zones)
• Low speed roads • Tangent sections or mild curve
locations • Locations where an advisory speed
sign already exists and is in good condition
3. Chevron Alignment Sign
• Sharp horizontal curves (radius < 820') where alert driver may have experienced difficulty in identifying the curve (particularly suitable for night or inclement weather)
• Intersections with a change of horizontal alignment
• Tangent sections of road with good visibility
• Mild horizontal curve locations with good visibility
• Locations where chevron alignment signs already exist and are in good condition
4. Post Delineator
• Horizontal curves (radius > 820') where alert driver may have experienced difficulty in identifying the curve (particularly suitable for night or inclement weather)
• Unexpected road features such as land reductions that can benefit from supplemental delineation
• Tangent sections of road with good visibility
• Mild horizontal curve locations with good visibility
• Locations where post delineators already exist and are in good condition with proper placement

Countermeasure Handbook 9
C. Roadway Improvements
1. Geometric Realignment (Horizontal,
Vertical, Intersection)
• Horizontal or vertical alignment is substandard, e.g. sharp curves, crest curves, limited sight distance conditions and this alignment condition contributed to the crash
• Horizontal or vertical alignment is acceptable
2. Modify Superelevation / Cross Slope
• Location where the pavement cross-slope or superelevation is not compatible with the horizontal alignment and this contributed to the crash
• Drainage inadequate during inclement weather
• Superelevation or cross slope is compatible with the horizontal alignment
3. Improve Sight Distance without Geometric Realignment
• Limited sight distance at horizontal curves due to static obstructions, e.g. trees, signs, billboards, etc. and these obstructions contributed to the crash
• No sight distance problems • No removable obstructions to
improve sight distance problem
4. Widen Travel Lanes / Pavement Width • Lane widths less that 11-feet where
the lane narrow lane width appears to have contributed to the crash
• Lanes that are 11-feet wide or greater
5. Add Turn Lane (Left/Right)
• Locations where crashes are influenced by turning vehicles in the travel lane
• Low volume driveway or intersection locations
• Locations where turning lanes were in place and clearly marked at the time of the crash

Countermeasure Handbook 10
6. Improve Shoulder
a. Add or Widen Graded or
Stabilized Shoulder
• Locations where crashes are influenced by the lack of a traversable shoulder
• Locations where drivers have insufficient shoulder to re-direct vehicle back onto roadway
• Locations where unstabilized shoulder eroded adjacent to the road and this contributed to the crash
• Locations with wide graded or stabilized shoulders in place at the time of the crash
b. Pave Existing Graded Shoulder of
Suitable Width
• Locations where crashes were influenced by the condition or traversability of the shoulder
• Locations where unstabilized shoulder eroded adjacent to the road and this contributed to the crash
• Locations where existing graded shoulder is not a suitable width
c. Widen and Pave Existing
Shoulder
• Locations where crashes were influenced by the condition or width of the shoulder
• Locations where existing shoulder is of suitable width and paved
7. Rumble Strips
• Locations with paved shoulders greater than 2' wide where crashes may have been avoided if rumble strips could alert the inattentive driver
• Locations where paved shoulders greater than 2' wide are not present
• Locations where the crash occurred in a residential neighborhood
• Locations where rumble strips were already present and in good condition
8. Improve Roadway Access Management
• Locations where crashes are directly influenced by poorly positioned driveways or intersections
• Locations with suitable access management
• Locations without suitable access management and no feasible way to correct the problem

Countermeasure Handbook 11
D. Roadside Improvements
1. Install or Upgrade Guardrail
• Locations where an errant run-off-the-road vehicle will encounter an unsafe roadside environment within the clear zone
• Locations where the side slope is not traversable, i.e. too steep, rocks, trees
• Locations where guardrails may create additional hazards, i.e. guardrail endpoints when accommo-dating numerous driveways, sight distance restrictions, intersections
• Locations with guardrail in suitable condition that is adequately placed
2. Upgrade Guardrail End Treatment /
Add Impact Attenuator
• Locations where errant vehicles either directly impacted the guardrail end treatment or were otherwise influenced by its placement and this contributed to the crash
• Locations where guardrail did not exist at the time of the crash
3. Clear Zone Improvements
a. Widen Clear Zone
• Run-off-the-road crashes where vehicles have hit rigid and removable objects located in the reasonable clear zone
• Locations where objects in the clear zone are not removable
• Locations with acceptable clear zone widths per standards in Roadside Design Guide
b. Flatten Side Slope
• Locations with side slope that is steeper than a horizontal:vertical ratio of 3:1
• Locations where an errant vehicle cannot regain control of the vehicle due to side slope design
• Locations where guardrails provide a superior solution
• Locations where the side slope is already flatter than a 3:1 and traversable

Countermeasure Handbook 12
c. Relocate Fixed Object
• Locations where fixed objects, such as utility poles, light standards, signs, mailboxes, and parked cars present a hazard to vehicles
• Locations where objects can be relocated
• Locations where relocation of fixed object may create other hazards or re-locate the hazard
d. Remove Fixed Object
• Locations where fixed objects, such as utility poles, light standards, signs, mailboxes, and parked cars present a hazard to vehicles
• Locations where objects can be removed
• Locations where removal of a fixed object may create other hazards, e.g. removing a light standard, warning sign, etc.
e. Convert Object to Breakaway
• Locations where fixed objects present a hazard to vehicles and are candidates for conversion to breakaway
• Locations where breakaway objects should not be realistically applied (for example, do not place breakaway poles at intersections corners)
f. Traversable Drainage Structure
• Locations with drainage culverts where pipe end treatments are not traversable
• Locations where guardrails provide a superior treatment due to side slope and drainage considerations and are a feasible countermeasure candidate
• Locations with already suitably traversable drainage structures
• Locations where non-traversable drainage structures are located outside the reasonable clear zone

Countermeasure Handbook 13
E. Lighting
1. Add Lighting (Segment)
• Locations with poor night visibility and road environment features that need supplemental illumination, such as access points, pedestrian crossings, or extreme roadway geometry and where driver was alert
• Locations with poor night visibility only but no substandard road environment features that contributed to the crash
2. Add Lighting (Intersection) • Intersections with poor night
visibility and no existing lighting and where driver was alert
• Intersections with adequate night visibility
3. Upgrade Lighting
(Segment/Intersection)
• Locations with poor night visibility and insufficient existing lighting and where driver was alert
• Locations with adequate night visibility
F. Regulations 1. Enforce Speed Limits • Locations where the study crash was
related to excessive speed above the posted speed limit
• Locations where excessive speed (above speed limit) does not appear to be a characteristic of the site

Countermeasure Handbook 14
COUNTERMEASURE DEFINITIONS
AND CRASH APPLICATION
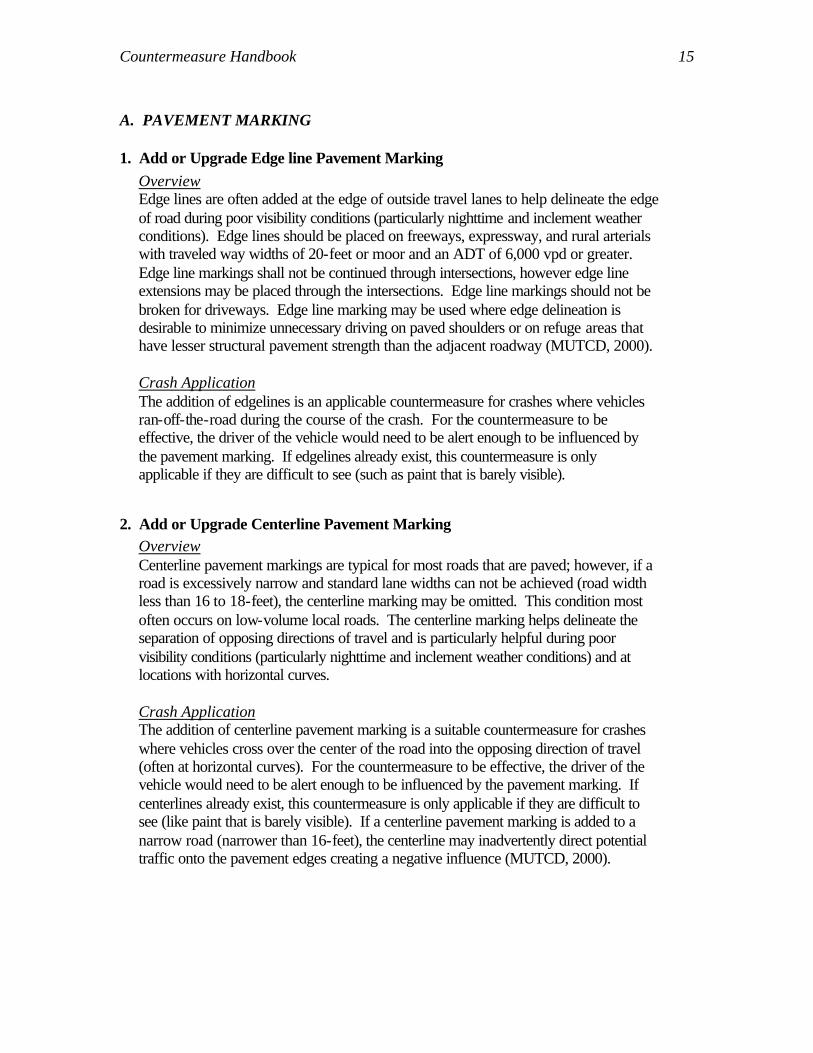
Countermeasure Handbook 15
A. PAVEMENT MARKING
1. Add or Upgrade Edge line Pavement Marking
Overview Edge lines are often added at the edge of outside travel lanes to help delineate the edge of road during poor visibility conditions (particularly nighttime and inclement weather conditions). Edge lines should be placed on freeways, expressway, and rural arterials with traveled way widths of 20-feet or moor and an ADT of 6,000 vpd or greater. Edge line markings shall not be continued through intersections, however edge line extensions may be placed through the intersections. Edge line markings should not be broken for driveways. Edge line marking may be used where edge delineation is desirable to minimize unnecessary driving on paved shoulders or on refuge areas that have lesser structural pavement strength than the adjacent roadway (MUTCD, 2000). Crash Application The addition of edgelines is an applicable countermeasure for crashes where vehicles ran-off-the-road during the course of the crash. For the countermeasure to be effective, the driver of the vehicle would need to be alert enough to be influenced by the pavement marking. If edgelines already exist, this countermeasure is only applicable if they are difficult to see (such as paint that is barely visible).
2. Add or Upgrade Centerline Pavement Marking Overview Centerline pavement markings are typical for most roads that are paved; however, if a road is excessively narrow and standard lane widths can not be achieved (road width less than 16 to 18-feet), the centerline marking may be omitted. This condition most often occurs on low-volume local roads. The centerline marking helps delineate the separation of opposing directions of travel and is particularly helpful during poor visibility conditions (particularly nighttime and inclement weather conditions) and at locations with horizontal curves. Crash Application The addition of centerline pavement marking is a suitable countermeasure for crashes where vehicles cross over the center of the road into the opposing direction of travel (often at horizontal curves). For the countermeasure to be effective, the driver of the vehicle would need to be alert enough to be influenced by the pavement marking. If centerlines already exist, this countermeasure is only applicable if they are difficult to see (like paint that is barely visible). If a centerline pavement marking is added to a narrow road (narrower than 16-feet), the centerline may inadvertently direct potential traffic onto the pavement edges creating a negative influence (MUTCD, 2000).

Countermeasure Handbook 16
3. Add or Upgrade No-Passing-Zone Pavement Marking Lines Overview No-Passing-Zone designations are typical for inadequate sight distance locations. As a result, crest vertical curves and any horizontal curve other than extremely "flat" curves are candidates for no-passing-zones. In addition, no-passing zones should be maintained at intersection locations -- particularly isolated intersections where access into or out of the cross street is not expected. In the event traffic volume is heavy and warrants a level of service of C or greater, the addition of passing lanes is a common improvement strategy. Crash Application The addition of no-passing-zone lines is an applicable countermeasure for crashes where vehicles crossed over the center of the road in an effort to pass a vehicle at an inappropriate location (due to sight distance or access constraints). In the event a no-passing-zone was properly in place and the driver elected to ignore the marking, this countermeasure cannot be evaluated.
4. Add Raised Pavement Marking (RPMs) to Centerline
Overview Raised pavement markers are often used on roads where typical pavement marking needs supplemental delineation; however, if snow frequently occurs in the analysis region a costly “snow plowable” RPM should be used. Crash Application The addition of RPMs is an applicable countermeasure for crashes where the pavement marking alone provides inadequate delineation or channelization (MTES, 1994). Placement of RPMs in the vicinity of pedestrian activity should not present tripping hazards. For the countermeasure to be effective, the driver of the vehicle would need to be alert enough to be influenced by the supplemental delineation. If RPMs already exist and are in good condition, this countermeasure cannot be evaluated.
B. TRAFFIC SIGNS
1. Warning Sign Overview Supplemental warning signs are often used to alert motorists to unexpected features that may pose a hazard and may not be readily apparent to road users. Common applications warn of railroad or pedestrian crossings, sharp horizontal curves, intersection information, etc. The use of warning signs should be kept to a minimum as the unnecessary use of warning signs tends to breed disrespect for all signs (MUTCD, 2000). In this countermeasure manual, chevron signs, advisory signs, and post delineators are included as separate countermeasures and should, therefore, not be included in evaluation of the warning sign countermeasure.

Countermeasure Handbook 17
Crash Application The addition of warning signs is an applicable countermeasure for crashes where the alert driver encountered an unexpected road feature. For example, the likelihood of a nighttime crash at a sharp horizontal curve may be reduced if an advanced “sharp curve ahead” warning sign is placed upstream of the curve. For the countermeasure to be effective, the driver of the vehicle would need to be alert enough to be influenced by the supplemental signage. If appropriate warning signs are already present and in good condition, this countermeasure cannot be evaluated.
2. Advisory Speed Sign Overview Advisory speed limits are often used to aid drivers in selecting slower safe speeds for hazardous locations such as curves, road work sites, intersections, and road sections with lower design speeds (FHWA, 1982). A sample advisory speed sign is depicted below.
Crash Application The use of advisory speed signs is an application for crashes where the alert driver appeared to exceed a safe operating speed at a "hazardous" location where reduced operating speed is warranted. Inherent with the concept of effective advisory speed signs is the assumption a driver adheres to, at a minimum, the regulatory speed limit and pays attention to supplemental signs. For the countermeasure to be effective, the driver of the vehicle would need to be alert enough to observe the advisory speed sign, if present, and consider adjusting his or her relative operating speed. If advisory speed signs already exist at the crash location, this countermeasure cannot be evaluated.

Countermeasure Handbook 18
3. Chevron Alignment Sign Overview Chevron alignment signs are used to provide emphasis and guidance for a change in horizontal alignment. The chevron alignment sign can be used as an alternate or supplement to standard delineators on curves. The sign is installed on the outside of a turn or curve, in line with and approximately at a right angle to approaching traffic (in such a manner that the road user always has at least two chevron alignment signs in view at a time). A chevron alignment sign may alternatively be used on the far side of an intersection to inform drivers of a change of horizontal alignment through the intersection (MUTCD, 2000). A sample chevron alignment sign is depicted below.
Crash Application The use of chevron alignment signs is an application for crashes where the alert driver failed to successfully negotiate a sharp horizontal curve (radius < 820') or failed to successfully traverse an intersection with a change in horizontal alignment. For the countermeasure to be effective, the driver of the vehicle would need to be alert enough to observe the chevron alignment signs and consider adjusting his or her driving behavior in response to the sign. If chevron alignment signs already exist at the crash location, this countermeasure cannot be evaluated.
4. Post Delineator
Overview Post Delineators are used to provide emphasis and guidance at a location where the road alignment may be confusing or unexpected, such as at lane reduction transitions and horizontal curves. The post delineator is considered a guidance sign rather than warning sign. A typical delineator includes retroreflective devices mounted on posts above the roadway surface. They are placed along the side of the road to guide the driver through the road alignment feature. For horizontal curves, the post delineator is located in a series (based on degree of curvature) along the outside of the curve (MUTCD, 2000). Crash Application The use of post delineators is an application for crashes where the alert driver failed to successfully negotiate a horizontal curve (radius > 820' preferred application) or failed to successfully traverse an unexpected feature like lane reductions. For the countermeasure to be effective, the driver of the vehicle would need to be alert enough to observe the post delineators and consider adjusting his or her driving behavior in

Countermeasure Handbook 19
response to the delineators. If post delineators already exist at the crash location, this countermeasure cannot be evaluated.
C. ROADWAY IMPROVEMENTS
1. Modify Geometric Alignment Overview Often the horizontal or vertical road alignment can be substandard and directly contribute to safety problems. The most common problems are sharp horizontal curves where drivers must reduce speed to successfully negotiate the curves. Similarly, substandard crest curves often create sight distance hazards. Common geometric alignment improvements may include flattening the horizontal curve, "shaving" of the crest vertical curve, or performing a combination of horizontal and vertical improvements. Crash Application Modification of geometric alignment should be considered for a crash where it is apparent that the road contributed to the crash. For example, if a driver was not successful in negotiating a horizontal curve, this countermeasure should be evaluated to determine if any realistic improvements are feasible. If road alignment is adequate, this countermeasure is not applicable and should not be evaluated.
2. Modify Superelevation / Cross Slope
Overview When a road has horizontal curvature and is not a low-speed road (such as a local road or minor collector), the pavement cross-section should be superelevated through the curve to assist vehicle motion (counteract forces that would direct the vehicle in a straight path). Similarly, in tangent sections the typical pavement cross section for a two-lane road is a "rooftop" scenario with 2-percent grade from the high point at the road centerline to the edge of the lane. Often these standards are not addressed and contribute to crashes (particularly during inclement weather conditions). Crash Application Modification of superelevation or cross slope should be considered for a crash where the pavement cross slope or superelevation is not compatible with the horizontal alignment and this incompatibility may have contributed to the crash.
3. Improve Sight Distance without Geometric Realignment
Overview Often road features other than the physical road impact required sight distance. For example, a road with horizontal curvature may have a wooded region five feet from the edge of pavement. Other than the obvious roadside obstacle problem, the trees may prevent sight distance as a vehicle traverses around the curve. The driver looks

Countermeasure Handbook 20
along the "chord" of a horizontal curve rather than along the curve centerline, and the trees would directly impact this view. Similar problems can be addressed by improving the sight distance without costly reconstruction of the road. Crash Application Improvement of sight distance should be considered for crashes where it appears a driver did not have proper lines of sight. These can be both daytime and nighttime crashes; however, temporary obstacles such as a stalled car blocking sight distance do not apply to this countermeasure.
4. Widen Lanes or Pavement Width Overview A condition often affiliated with rural two-lane highways is substandard lane width. In the United States, the "desirable" lane width is assumed to be 12-feet; however, lane widths of 11-feet are generally considered acceptable. Crash Application Widening the lanes or total pavement width should be considered for crashes where it appears a driver was in some way influenced by the width. For example, if the vehicle's right tire exited the road this may be an indicator that the narrow lane contributed to the crash. It is important to note that the example of the tire exiting the right edge of the road could also be an indicator of driver inattentiveness.
5. Add Turn Lane
Overview At high-speed rural locations, a vehicle waiting to complete a turning maneuver poses an unexpected obstacle to the fast moving vehicles. This problem occurs both at intersections as well as locations with driveway access to the subject road. One means of removing the turning vehicle from the traffic stream is to provide a dedicated turn lane so the stopped vehicle is no longer blocking the through traffic. Turn lanes are not generally recommended for isolated, low-volume driveway locations. Crash Application Adding a turn lane should be considered for crashes where it appears a driver encountered a turning vehicle in the through lane unexpectedly and this contributed to the crash. If a turn lane was already present, this countermeasure cannot be evaluated.
6. Improve Longitudinal Shoulder a. Add or Widen Graded or Stabilized Shoulder
Overview A graded or stabilized longitudinal shoulder adjacent to the travel lanes will help create a smooth transition between the travel lanes and the side slope adjacent to the road. Widening the shoulder may influence crashes (according to literature in
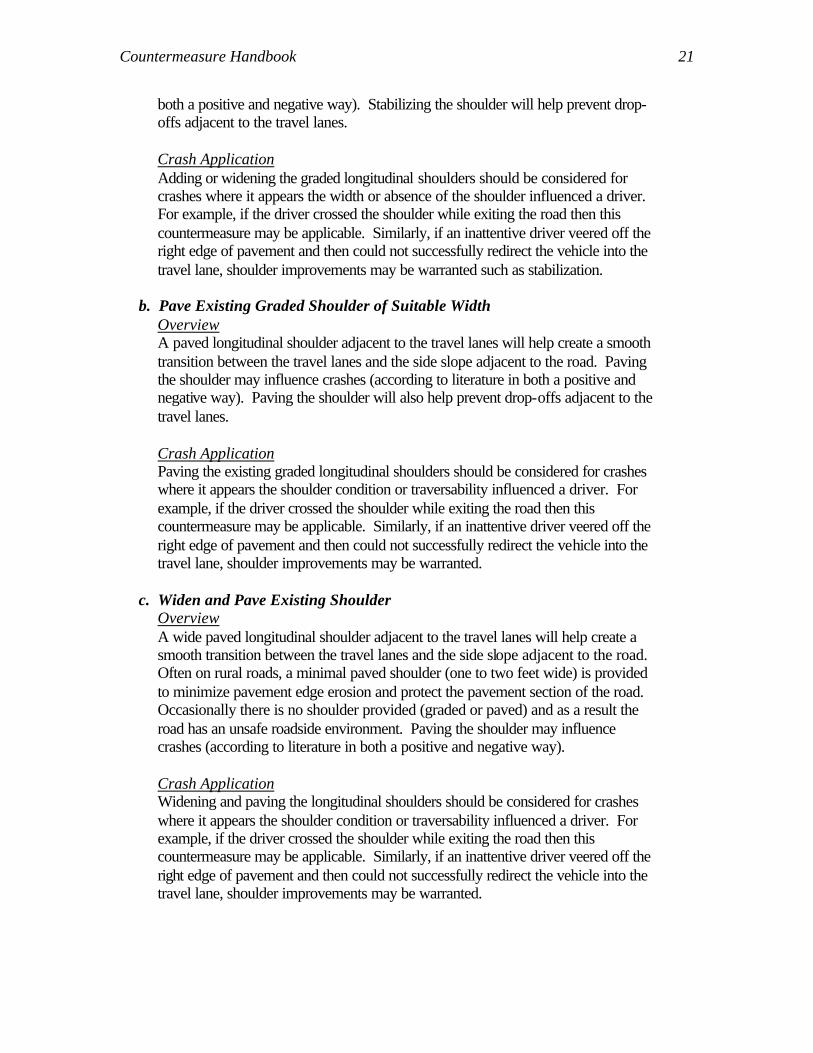
Countermeasure Handbook 21
both a positive and negative way). Stabilizing the shoulder will help prevent drop-offs adjacent to the travel lanes. Crash Application Adding or widening the graded longitudinal shoulders should be considered for crashes where it appears the width or absence of the shoulder influenced a driver. For example, if the driver crossed the shoulder while exiting the road then this countermeasure may be applicable. Similarly, if an inattentive driver veered off the right edge of pavement and then could not successfully redirect the vehicle into the travel lane, shoulder improvements may be warranted such as stabilization.
b. Pave Existing Graded Shoulder of Suitable Width
Overview A paved longitudinal shoulder adjacent to the travel lanes will help create a smooth transition between the travel lanes and the side slope adjacent to the road. Paving the shoulder may influence crashes (according to literature in both a positive and negative way). Paving the shoulder will also help prevent drop-offs adjacent to the travel lanes. Crash Application Paving the existing graded longitudinal shoulders should be considered for crashes where it appears the shoulder condition or traversability influenced a driver. For example, if the driver crossed the shoulder while exiting the road then this countermeasure may be applicable. Similarly, if an inattentive driver veered off the right edge of pavement and then could not successfully redirect the vehicle into the travel lane, shoulder improvements may be warranted.
c. Widen and Pave Existing Shoulder
Overview A wide paved longitudinal shoulder adjacent to the travel lanes will help create a smooth transition between the travel lanes and the side slope adjacent to the road. Often on rural roads, a minimal paved shoulder (one to two feet wide) is provided to minimize pavement edge erosion and protect the pavement section of the road. Occasionally there is no shoulder provided (graded or paved) and as a result the road has an unsafe roadside environment. Paving the shoulder may influence crashes (according to literature in both a positive and negative way). Crash Application Widening and paving the longitudinal shoulders should be considered for crashes where it appears the shoulder condition or traversability influenced a driver. For example, if the driver crossed the shoulder while exiting the road then this countermeasure may be applicable. Similarly, if an inattentive driver veered off the right edge of pavement and then could not successfully redirect the vehicle into the travel lane, shoulder improvements may be warranted.

Countermeasure Handbook 22
7. Add Rumble Strips Overview Rumble strips are pavement undulations that, when traversed by the tires of a vehicle, create an audible cue to alert the driver of the vehicle of a potential hazard. One common application of rumble strips is placement in a series at the approach to an intersection. The intersection application is used to warn drivers as they approach an isolated intersection (usually a stop sign location). A second, and more widely used, application of rumble strips is longitudinal placement along the edge of a road. Longitudinal rumble strips are used to warn drivers they are about to exit the traveled way. Another less common application of longitudinal rumble strips is centerline rumble strip placement to warn drivers they are about to cross into an opposing lane of travel. This rumble strip application is not common in Georgia. Rumble strips can be rolled into new pavement, or milled into the pavement. In addition, there are thermoplastic rumble strips that can be applied in unique locations like work zones. Morgan and McAuliffe (1997) recommend that continuous-shoulder rumble strips are preferable to cluster-type rumble strips. They also indicate that noise complaints from both drivers and nearby residents must be considered. Similarly, rumble strip placement should be compatible with bicycle activity if applicable at the location of interest. Crash Application Placement of rumble strips should be considered for crashes where it appears the driver was inattentive but the minor stimulus from the audible cue of the rumble strip would alert the driver to the prospective hazard. For example, if an inattentive driver crossed the paved shoulder while exiting the road, this countermeasure may be applicable if the paved shoulder had a width greater than two-feet. (In Georgia, a paved shoulder must be wider than two-feet before the standard rolled in rumble strips can be applied.) If the crash occurred in a residential neighborhood, rumble strips are not acceptable countermeasures due to their associated noise.
8. Improve Roadway Access Management Overview The frequent placement of driveways or street intersections without coordination with surrounding land development can create a hazard. For example, a driveway located near an intersection can create conflicts between vehicles turning into the driveway and vehicles traveling through the intersection with the expectation that they have right-of-way. One example may be a driver elects to turn left into a driveway located 50-feet beyond the far side on an intersection. The light turns green and the car following the vehicle expects it to continue beyond the intersection location and increase speed. As a result, the poor access management contributes to a potential rear-end collision. Crash Application Improvement of roadway access is a feasible crash countermeasure if an alternative access opportunity is present. For example, if two driveways are so closely placed to

Countermeasure Handbook 23
each other that vehicles exiting the driveways obscure the view of the driver in the other driveway, perhaps the two driveways could be combined to remove this sight distance problem. If the study crash does not relate to an access management issue, this countermeasure should not be evaluated.
D. ROADSIDE IMPROVEMENTS
1. Install or Upgrade Guardrail
Overview The primary purpose of the installation or upgrade of guardrail systems is to prevent an errant run-off-the-road vehicle from encountering an unsafe roadside environment. As a result, guardrail is commonly placed adjacent to the road at locations where the side slope is not reasonably traversable, numerous roadside obstacles (such as a wood region) are adjacent to the road, or some unforgiving feature like a pond is located within the clear zone distance. The clear zone is basically the distance required for an errant vehicle to be expected to stop or re-direct its motion if the driver is alert. Crash Application Guardrail placement is not feasible at locations where the guardrail will create a direct hazard. For example, placement of guardrail assumes an errant vehicle may encounter the guardrail and the guardrail will protect the driver and vehicle occupants from some worse hazard. If a road segment has frequent driveways, then guardrail may not be suitable because it cannot be continuous and will create sight distance problems for vehicles leaving and entering the driveways. Similarly, the placement of guardrail at or near an intersection is generally discouraged because it adversely impacts driver's sight distance at the intersection. Guardrail as a countermeasure should be considered primarily for run-off-the-road crash conditions.
2. Upgrade Guardrail End Treatment / Add Impact Attenuator
Overview The literature dealing with the effects of guardrail end treatments on crashes is limited. Basically, adequate guardrail end treatments will protect a motorist from skewering their vehicle on the end of the guardrail. Similarly, suitable guardrail will prevent vehicles that impact it from vaulting into the air (thereby creating a hazard). An impact attenuator is often placed at the end of a guardrail rather than the flared end treatment if space is restricted and proper tapering of the end treatment cannot be accomplished. In general, the literature indicates improved end treatment / attenuators may not prevent a crash (the vehicle will still impact the guardrail end), but will reduce the severity of the crash. Crash Application Upgrading the guardrail end treatment or adding an impact attenuator is not feasible at locations where guardrail was not already present at the time of the crash and the vehicle either impacted the end of the guardrail or somehow managed to drive behind the guardrail into a hazardous location. For example, if a vehicle impacted a
Countermeasure Handbook 24
substandard guardrail end treatment and as a result vaulted into the air before landing upside down, the end treatment is probably not appropriately placed and this countermeasure should be evaluated. If the crash did not involve the guardrail end treatment or some associated condition, this countermeasure should not be evaluated.
3. Clear Zone Improvements a. Widen Clear Zone
Overview The clear zone is the width of non-obstructed roadside environment necessary for an errant vehicle to stop or re-direct its motion if the driver is alert. Often rigid objects like utility poles are located in the clear zone width recommended in the Roadside Design Guide (AASHTO, 1996). Where feasible, widening the region next to the road where a vehicle can freely traverse is considered a good safety strategy; however, the excessive cost of right-of-way often prohibits appropriate clear zone width. The clear zone is determined based on the speed and traffic volume of the road (for a high-speed road with heavy traffic volume, it is assumed more likely a vehicle may run off the road and therefore more economically feasible to provide the wider clear zone region). Crash Application Clear zone improvement should be considered for any run-off-the road crashes. The concept of the clear zone is a reasonable width for the alert driver to be able to redirect or stop an errant run-off-the road vehicle. As a result, a crash where the errant vehicle continued to drive a considerable distance from the road until ultimately impacting a object would not be dramatically assisted by a reasonable clear zone. The AASHTO Roadside Design Guide (AASHTO, 1996) provides clear zone requirements. Often widening the clear zone may introduce additional issues for concern. For example, the relocation of a street light pole may improve clear zone but reduce road illumination at night.
b. Flatten Side Slope Overview Often the side slope adjacent to the road is steep and is not reasonable traversable. As a result, the driver of an errant vehicle may not be able to regain control of the vehicle and safely redirect the vehicle. Standard design approaches are to maintain a slope that is flatter than 3:1 with a 6:1 (horizontal:vertical ratio) considered desirable. For purposes of this evaluation assume flattening a side slope to approximately 4:1. Crash Application Flattening the side slope should be considered for any run-off-the road crashes where a steep side slope influenced the behavior of the errant vehicle. If the terrain makes flattening the side slope infeasible (such as a large rock formation or a water feature), then the side slope should be protected with guardrail. One common problem is that the side slope transition into a roadside ditch does not provide a reasonable transition to the ditch back slope. When this occurs, a vehicle may be

Countermeasure Handbook 25
vaulted or flipped when it impacts the dramatic slope change at the base of the ditch.
c. Relocate Fixed Object Overview Often a rigid object is located proximate to the road. When an errant vehicle runs off the road, the object can represent a hazard to the vehicle. Common fixed objects include utility poles, trees, ornamental mail boxes (often made of brick), etc. In addition, parking permitted adjacent to the road may introduce parked vehicles as fixed objects. Crash Application Relocation of fixed objects should be considered for any run-off-the road crashes where a vehicle impacted or was otherwise influenced by a fixed object adjacent to the road. It is important to note, however, that if a vehicle impacts a multi-use object such as a utility pole that also serves as the support for a street light the relocation of the fixed object may remove a hazardous object but will be at the expense of reduced street lighting.
d. Remove Fixed Object Overview Often a rigid object is located proximate to the road. When an errant vehicle runs off the road, the object can represent a hazard to the vehicle. Common fixed objects include utility poles, trees, ornamental mail boxes (often made of brick), etc. In addition, parking permitted adjacent to the road may introduce parked vehicles as fixed objects. Complete removal of these fixed objects is generally an expensive but safe countermeasure. Crash Application Removal of fixed objects should be considered for any run-off-the road crashes where a vehicle impacted or was otherwise influenced by a fixed object adjacent to the road. It is important to note, however, that if a vehicle impacts a multi-use object such as a utility pole that also serves as the support for a street light the relocation of the fixed object may remove a hazardous object but will be at the expense of removing street lighting.
e. Convert Object to Breakaway Overview The literature dealing with converting a roadside object to a breakaway type is limited. But the few studies that have dealt with this countermeasure have provided positive feedback on its effects on the severity of crashes with no real influence on frequency of crashes. It is important to note that some objects pose greater hazards if they are converted to breakaway. One example of a breakaway hazard is a utility pole at an intersection. In order to construct the pole reasonably, it must have support from all directions and adding a breakaway component would diminish this needed support. Often the utility companies supplement these intersection poles

Countermeasure Handbook 26
with supplemental guy wires that attach to rods drilled into the ground in an effort to improve stability.
Crash Application
Converting a fixed object to breakaway should be considered for any run-off-the road crashes where a vehicle impacted or was otherwise influenced by a fixed object adjacent to the road. If the pole is situated at a location where wires connect to it and cross the street, the unsupported wires may themselves become a hazard.
f. Construct Traversable Drainage Structure
Overview A common problem with drainage culverts is that the end treatments are not traversable. As a result, when an errant vehicle exits the road and drives across an acceptable side slope, the presence of a drainage structure that is not traversable may create a hazard. There are several culvert end treatments or grate inlets specifically designed to assure a vehicle can safety drive over the drainage structure without vaulting or overturning. Crash Application Improvement of a traversable drainage structure should be considered for crashes where the driver ran off the road and impacted or was influenced by a non-traversable drainage structure (pipe or box culvert for example). Often a culvert is located beneath a driveway or cross street. In this circumstance, an alternative treatment like protecting the drainage structure end treatment with guardrail is not feasible.
E. LIGHTING
1. Add Street Lights to Road Segment Overview Often poor night visibility can be directly attributed to safety problems. Street lights are commonly added to illuminate road features such as access points or extreme roadway geometry. In urban environments, street lights are also located adjacent to the road to enhance pedestrian safety and better illuminate the entire roadway environment. Crash Application The addition of street lights is an applicable countermeasure for crashes where vehicles crashed during nighttime conditions. For the countermeasure to be considered effective the driver of the vehicle should be alert and the crash should be due to possible visibility issues. It is important to note that when street lights are added adjacent to the road, a roadside obstacle is added to the road environment. Therefore, you may improve one problem (poor visibility) by creating another problem (roadside obstacle). One recommended strategy is to try to use joint-use poles for utilities and street lights. This will reduce the number of obstacles placed

Countermeasure Handbook 27
next to the road. Another benefit of a street light is that the driver's eye is not adjusted to the darker street environment. This means that drivers are less prone to being temporarily "blinded" by approaching vehicle headlights.
2. Add Lighting to Intersection
Overview Often poor night visibility can be directly attributed to safety problems. Street lights are commonly added to illuminate road features such as intersections and adjacent access points. In urban environments, street lights are also located adjacent to the road to enhance pedestrian safety and better illuminate the entire roadway environment. Crash Application The addition of street lights is an applicable countermeasure for crashes where vehicles crashed during nighttime conditions. For the countermeasure to be considered effective the driver of the vehicle should be alert and the crash should be due to possible visibility issues. It is important to note that when street lights are added adjacent to the road, a roadside obstacle is added to the road environment. Therefore, you may improve one problem (poor visibility) by creating another problem (roadside obstacle). One recommended strategy is to try to use joint-use poles for utilities and street lights. This will reduce the number of obstacles placed next to the road. Another benefit of a street light is that the driver's eye is not adjusted to the darker street environment. This means that drivers are less prone to being temporarily "blinded" by approaching vehicle headlights.
3. Upgrade Street Lighting for Segment or Intersection Overview Often poor night visibility can be directly attributed to safety problems. Street lights are upgraded to enhance illumination that is not adequately addressed with the existing lighting system. Often street light plans are initially designed by an electrical engineer on a "flat piece of paper" with little understanding about the influence of horizontal and vertical influences. As a result, it is not uncommon for "dark spots" to exist that require additional illumination by supplementing current lights. Crash Application The upgrade of a street lighting system is only an applicable countermeasure for crashes that occurred during nighttime conditions at locations with existing street lights. For the countermeasure to be considered effective the driver of the vehicle should be alert and the crash should be due to possible visibility issues.
F. REGULATIONS
1. Enforce Speed Limits
Overview Often motorists elect to ignore posted speed limits and may do so knowing that the corridor on which they travel is rarely subjected to police speed enforcement. Crash

Countermeasure Handbook 28
research regarding enforced speed limits primarily focuses on work zone regions. In all cases, highly visible speed enforcement is effective (but also quite costly) in reducing corridor operating speeds. Crash Application The use of enhanced speed limit enforcement is an application for crashes where the alert driver appeared to exceed the posted speed limit and where reduced operating speed is warranted to assure safety. Inherent with the concept of police speed enforcement is the assumption a driver is aware of the legal implications and takes prudent measures when driving. Historically, for example, driving under the influence of alcohol often coincides with speeding. This pairing of hazards is probably due to the driver's impaired senses. Also, a driver under the influence of alcohol knows he or she is breaking the law by driving, so the assumption that increased speed limit enforcement will influence this driver type is probably not accurate. If the subject crash was not due to excessive speed conditions (above the posted speed limit), this countermeasure should not be evaluated.

Countermeasure Handbook 29
III. APPENDIX A. COUNTERMEASURE LITERATURE REVIEW

Countermeasure Handbook 30
A. PAVEMENT MARKING
1. Add or Upgrade Edgeline Pavement Marking
The literature regarding edgelines tends to favor placement of them to enhance safety; however, most of the studies provided estimated crash reductions based primarily on expert opinion (subjective evaluation). Based on the combined estimates resulting from a survey of 43 states plus the District of Columbia and a comprehensive literature review, Kentucky researchers developed the following estimation of percent crash reduction for the addition of edgelines to the edge of the pavement travel way (Agent et. al., 1996).
Table A-1. Kentucky Edgeline Crash Reduction Estimates
Category Number of Estimates
Average Percent Crash
Reduction State Survey Estimates: Edgeline Markings (All Crashes) 19 20 Edgeline Markings (Run-Off-Road Crashes Only) 2 25 Literature Review Estimates: Edgeline Markings (All Crashes) 11 15 Edgeline Markings (Run-Off-Road Crashes Only) 3 36 Researcher's Resulting Estimates: Edgeline Markings (All Crashes) --- 15 Edgeline Markings (Run-Off-Road Crashes Only) --- 30
A FHWA study (Bali et. al., 1978) concluded that results of analyses of crash rates at sites with edgelines versus those without edgelines are mixed (no statistically significant conclusion could be drawn from this comparison). In contrast, a study (Creasy and Agent, 1985) based on a combination of 42 literature reviews, 22 state surveys, and a before-after analysis, provided the subjective estimate that a 15-percent reduction should occur in total crashes due to the addition of edgelines. A comprehensive study for the FHWA (Smith et. al., 1983) estimated percent reduction for several countermeasures. This study was based on improvements at hazardous conditions. The authors emphasize the percent crash reductions estimated are not directly applicable to moderately or mildly hazardous locations. Locations where edgelines were added (centerline-only previous to improvement) resulted in the estimated values shown in the following table.

Countermeasure Handbook 31
Table A-2. FHWA Edgeline Crash Reduction Estimates
Mean Percent Crash Reduction Countermeasure
Total Fatal Injury Property Damage Only
Add Edgeline in Tangent Section 7 0 5 10 Add Edgeline in Horizontal Curve 10 5 10 10 Add Edgeline in Vertical Curve 5 5 5 5 Add Edgeline at Intersection 5 5 5 5
2. Add or Upgrade Centerline Pavement Marking The literature regarding centerlines favors placement of them to enhance safety; however, most of the studies provided estimated crash reductions based primarily on expert opinion (subjective evaluation). Based on the combined estimates resulting from a survey of 43 states plus the District of Columbia and a comprehensive literature review, Kentucky researchers developed the following estimation of percent crash reduction for the addition of centerline markings (Agent et. al., 1996).
Table A-3. Kentucky Centerline Crash Reduction Estimates
Category Number of Estimates
Average Percent Crash Reduction
State Survey Estimates: Centerline Markings (All Crashes) 19 36 Literature Review Estimates: Centerline Markings (All Crashes) 13 24 Researcher's Resulting Estimates: Centerline Markings (All Crashes) --- 35
A FHWA Study (Bali et. al., 1978) concluded that highways with centerlines have lower crash rates than highways with no treatment at all. These findings were consistent for tangent sites, winding road locations, and for isolated horizontal curves. Similarly, a study (Creasy and Agent, 1985) based on a combination of 42 literature reviews, 22 state surveys, and a before-after analysis, provided the subjective estimate that a 30-percent reduction should occur in total crashes due to the addition of centerlines. A comprehensive study for the FHWA (Smith et. al., 1983) estimated percent crash reduction for several countermeasures. This study was based on improvements at hazardous locations. The authors emphasize the percent crash reduction estimated are not directly applicable to moderately or mildly hazardous locations. Locations where centerlines were added resulted in the following estimated values.

Countermeasure Handbook 32
Table A-4. FHWA Centerline Crash Reduction Estimates
Mean Percent Crash Reduction
Countermeasure Total Fatal Injury
Property Damage
Only Add Centerline in Tangent Section 7 0 5 10 Add Centerline in Horizontal Curve 10 10 10 10 Add Centerline in Vertical Curve 5 5 5 5 Add Centerline at Intersection 5 5 5 5 Add Centerline at Bridge Location 5 5 5 5
3. Add or Upgrade No-Passing-Zone Pavement Marking Lines The literature regarding no-passing zones favors placement of them to enhance safety. Many of the studies, however, include strong subjective assessment rather than quantified improvement analysis. Based on the combined estimates resulting from a survey of 43 states plus the District of Columbia and a comprehensive literature review, Kentucky researchers developed the following estimation of percent crash reduction for the addition of no passing zones (Agent et. al., 1996).
Table A-5. Kentucky No-Passing-Zone Crash Reduction Estimates
Category Number of Estimates
Average Percent Crash Reduction
State Survey Estimates: No Passing Zones (All Crashes) 12 42 No Passing Zones (Passing Crashes Only) --- --- Literature Review Estimates: No Passing Zones (All Crashes) 7 48 No Passing Zones (Passing Crashes Only) 2 85 Researcher's Resulting Estimates: No Passing Zones (All Crashes) --- --- No Passing Zones (Passing Crashes Only) --- 40
Council and Harwood (1999) summarized a group of "Accident Modification Factors" for a variety of conditions. The influence of passing lane factors was based on an assumed base condition that no passing lanes are present. Analysis was for the total (two-way) crashes for the length of a passing lane. The authors concluded crashes would reduce by 25-percent for one added passing lane and by 35-percent for short four-lanes sections. Similarly, a study (Creasy and Agent, 1985) based on a combination of 42 literature reviews, 22 state surveys, and a before-after analysis, provided the subjective estimate that a 40-percent reduction should occur in total accidents due to the addition of no passing zone lines. An Indiana study (Ermer et. al.,

Countermeasure Handbook 33
1992) estimated crash reduction factors based on a before-after study and combined with historic analyses in the state of Indiana. The upgrade of a facility's no-passing zones rated an estimated 30-percent reduction in total crashes. A comprehensive study for the FHWA (Smith et. al., 1983) estimated percent reduction for several countermeasures. This study was based on improvements at hazardous locations. The authors emphasize the percent crash reduction estimated are not directly applicable to moderately or mildly hazardous locations. Locations where a passing lane was installed resulted in the estimated values shown in the following table. This is a further enhancement above restricting no-passing zones.
Table A-6. FHWA Passing Lane Crash Reduction Estimates
Mean Percent Crash Reduction Alignment Changes
Total Fatal Injury Property Damage Only
Install Passing Lane 10 20 15 10
4. Add Raised Pavement Marking (RPMs) The literature regarding RPMs favors placement of these markers to enhance safety; however, widescale use of RPMs is extremely expensive and may be cost prohibitive. Stimpson et. al. (1977) determined the use of RPMs on both the centerline and edgeline represented a 68-percent reduction in potential hazard but would cost 900 times the standard pavement markings. Zador et. al. (1987) tested several delineation treatments including RPMs and concluded all tested treatments affected driver behavior at night. They observed speed increases of about 1 ft/sec at night with RPMs, but indicated the resulting speeds almost always remain below the daytime speeds. Krammes et. al. (1990) determined that highways with RPMs have lower crash rates than similar roads with painted centerlines. Similarly, a before-after study summarized in Wright et. al. (1983) evaluated RPMs placed along the centerline (four abreast at 20-foot centers) and across the 4-ft-wide shoulders at a 45-degree angle. The RPMs contributed to a 42-percent decrease in projected crashes. Based on the combined estimates resulting from a survey of 43 states and the District of Columbia and a comprehensive literature review, Kentucky researchers developed the following estimation of percent crash reduction for the addition of RPMs (Agent et. al., 1996).

Countermeasure Handbook 34
Table A-7. Kentucky Raised Pavement Marker Crash Reduction Estimates
Category Number of Estimates
Average Percent Crash Reduction
State Survey Estimates: Raised Pavement Markers (All) 15 13 Raised Pavement Markers (Wet/Night) 7 21 Raised Pavement Markers (Night) 8 17
Literature Review Estimates: Raised Pavement Markers (All) 7 6 Raised Pavement Markers (Wet/Night) 3 29 Raised Pavement Markers (Night) 4 18
Researcher’s Resulting Estimates: Raised Pavement Markers (All) --- 10 Raised Pavement Markers (Wet/Night) --- 25 Raised Pavement Markers (Night) --- 20
A comprehensive study for the FHWA (Smith et. al., 1983) estimated percent crash reduction for several countermeasures. This study was based on improvements at hazardous locations. The authors emphasize the percent crash reduction estimated are not directly applicable to moderately or mildly hazardous locations. Locations where RPMs were added to complement pavement markings resulted in the percent crash reduction depicted in the following table.
Table A-8. FHWA Raised Pavement Marking Crash Reduction Estimates
Mean Percent Crash Reduction Countermeasure
Total Fatal Injury Property Damage Only
Add RPMs in Tangent Section 5 0 5 5 Add RPMs in Horizontal Curve 10 10 10 10 Add RPMs at Intersection 5 5 5 5
A study performed by Creasy and Agent (1985), based on a combination of 42 literature reviews, 22 state surveys, and a before and after analysis, provided a subjective estimate that a 5-percent reduction should occur in total crashes due to the addition of raised pavement markers. For nighttime accidents on wet pavements, the reduction is as high as 20-percent with a 10-percent estimated reduction for dry pavement nighttime crashes. Wattleworth et. al. (1988) developed accident reduction factors related to the crash experience in Florida. The researchers performed before-after analysis of crash data from three years before and three years after a safety countermeasure was implemented. They estimated a 5-percent reduction in the number of total crashes due to installation of reflectorized raised pavement markers at the roadway centerline.

Countermeasure Handbook 35
B. TRAFFIC SIGNS
1. Warning Sign
The literature regarding warning signs emphasizes sign placement to enhance safety; however, excessive placement of warning signs may diminish their impact on safety. A comprehensive study for the FHWA (Smith et. al., 1983) estimated percent crash reduction for several countermeasures. This study was based on improvements at hazardous conditions. The authors emphasized the percent crash reductions estimated are not directly applicable to moderately or mildly hazardous locations. Locations where a warning sign was added resulted in the estimated values shown in the following table.
Table A-9. FHWA Warning Sign Crash Reduction Estimates
Mean Percent Crash Reduction Countermeasure: Add warning Sign Total Fatal Injury Property
Damage Only Intersection 5 5 5 5 Curve 10 15 10 10 Curve with advanced speed 20 30 25 20 Narrow bridge 5 5 5 5 Route Guidance 5 5 5 5 Slippery when wet 1 1 1 1 Speed Zone 5 15 10 5
A study performed by Creasy and Agent (1985), based on a combination of 42 literature reviews, 22 state surveys, and a before-after analysis, provided a subjective estimate that a 40-percent reduction should occur in total crashes due to the addition of warning signs at intersections, 20-percent reduction at mid-block sections, and 30-percent reduction on curves, all in rural areas. Based on the combined estimates resulting from a survey of 43 states and the District of Columbia and a comprehensive literature review, Kentucky researchers developed the following estimation of percent crash reduction for the addition of different types of warning signs (Agent et. al., 1996).

Countermeasure Handbook 36
Table A-10. Kentucky Warning Sign Crash Reductions Estimates
Category Number of Estimates
Average Percent Crash Reduction
State Survey Estimates: General 12 23 Curve Warning (All Crashes) 16 32 Curve Warning (Run-off-Road) 2 28 Intersection Related 14 36 Bridge Related 2 34 Railroad Crossing 5 29 Pavement Condition 2 18 Pedestrian 1 15 School Zone 3 14 Animal 2 8
Literature Review Estimates: General 11 30 Curve Warning (All Crashes) 11 37 Intersection Related 5 32 Pavement Condition 1 80 Animal 1 5
Researcher’s Resulting Estimates: General --- 25 Curve Warning (Run-off-Road) --- 30 Intersection Related --- 30 Railroad Crossing --- 30 Pavement Condition --- 20 School Zone --- 15
2. Advisory Speed Signs
Rutley (1972) conducted a literature survey and concluded that advisory signs used in the USA have been useful in eliminating surprise on some sharp curves and have reduced congestion and crashes. The research team evaluated advisory speeds at curves for three counties in England. They determined that there appeared to be a reduction in the number of crashes at curves in all three counties when compared to the number of other crashes for similar roads in the counties. The observed crash reduction, however, was statistically significant in only one of the counties evaluated. Based on the combined estimates resulting from a survey of 43 states and the District of Columbia and a comprehensive literature review, Kentucky researchers developed the following estimation of percent crash reduction for the addition of advisory speed limit signs (Agent et. al., 1996).

Countermeasure Handbook 37
Table A-11. Kentucky Warning Sign Crash Reduction Estimates
Category Number of Estimates
Average Percent Crash Reduction
State Survey Estimates: Advisory Speed 2 26
Literature Review Estimates: Advisory Speed 2 30
Chowdhury et. al. (1998) evaluated driver compliance to advisory speed signs at horizontal curves. They found that on average nine out of ten drivers exceeded the posted advisory speed. Compliance also varied based on the specific advisory speed. The following table depicts observed compliance.
Table A-12. Driver Compliance with Advisory Speed
Percentage Compliance Posted Advisory Speed (mph) Average Range
15 to 20 0% 0% to 0% 25 to 30 8% 0% to 38% 35 to 40 5% 0% to 32% 45 to 50 35% 0% to 56%
3. Chevron Alignment Sign Wattleworth et. al. (1988) developed accident reduction factors related to the accident experience in Florida. The researchers performed before-after analysis of crash data from three years before and three years after implementation of a safety countermeasure. A 35-percent reduction in the number of total crashes is estimated due to installation of chevron signs. Based on the combined estimates resulting from a survey of 43 states and the District of Columbia and a comprehensive literature review, Kentucky researchers developed the following estimation of percent crash reduction for the addition of chevron alignment signs at horizontal curves (Agent et. al., 1996).
Table A-13. Kentucky Chevron Warning Sign Crash Reduction Estimates
Category Number of Estimates Average Percent Crash Reduction
State Survey Estimates: Chevron 2 55
Literature Review Estimates: Chevron 3 30
Wright et. al. (1983) performed a state survey for low-cost countermeasures suitable for reducing the frequency of run-off-the-road crashes. All 38 surveyed states used

Countermeasure Handbook 38
chevron signs as a means of alerting drivers to the presence and sharpness of upcoming curves. Jennings and Demetsky (1985) evaluated vehicle tracking through curves and recommended chevron use at curves sharper than approximately 7-degrees (radius less than 820-feet).
4. Post Delineator A study performed by Bali et. al. (1978) used linear regression analysis to estimate the relationship between roadway environment, geometric data, traffic volumes, delineation and accident rates for tangent, winding and horizontal curve sections. Model development utilized crash data for 514 sites from 10 states and covered 13,000 accidents. The researchers determined that, for tangent and or winding sites, highways with post delineators have lower crash rates than those without post delineators (in the presence or absence of edgelines). Similarly, for isolated horizontal curves there is some indication (based on average corridor crash rate estimates) that sites with post delineators also have lower crash rates than sites without post delineators. Wattleworth et. al. (1988) developed accident reduction factors related to the crash experience in Florida. The researchers performed before-after analysis of crash data from three years before and three years after implementation of a safety countermeasure. A 30-percent reduction in the number of total crashes and 25-percent in fatal accidents was estimated due to installation of post delineators on curves. Based on the combined estimates resulting from a survey of 43 states and the District of Columbia, and a comprehensive literature review, Kentucky researchers developed the following estimation of percent crash reduction for the addition of post delineators (Agent et. al., 1996).
Table A-14. Kentucky Post Delineator Crash Reduction Estimates
Category Number of Estimates
Average Percent Crash Reduction
State Survey Estimates: Post Delineators / Curve (All Crashes) 14 23 Post Delineators / Curve (Night Crashes) 2 30 Delineators / Tangent (All Crashes) 17 28 Delineators / Tangent (Night Crashes) 2 30 Flexible Delineators (All Crashes) 1 40 Literature Review Estimates: Post Delineators / Curve (All Crashes) 8 23 Post Delineators / Curve (Night Crashes) 1 30 Delineators / Tangent (All Crashes) 5 16 Delineators / Tangent (Night Crashes) 1 30 Researcher's Resulting Estimates: Post Delineators (Night Crashes) --- 30
Jennings and Demetsky (1985) evaluated vehicle tracking through curves and recommended post delineators for delineation at curves less than 7-degrees (radius

Countermeasure Handbook 39
greater than 820-feet). Zador et. al. (1987) observed a short-term increase in speed (about 2 ft/sec to 2.5 ft/sec at night) in locations where post-mounted delineators were added. The long-term speed conditions remained consistent with those observed for short-term speed evaluations.
C. ROADWAY IMPROVEMENTS
1. Modify Geometric Alignment
The literature regarding the modification of geometric alignment is based upon both subjective assessment and analytical evaluation. A study (Creasy and Agent, 1985) based on a combination of 42 literature reviews, 22 state surveys, and a before-after analysis, provided the subjective estimate that a 30-percent reduction should occur in total crashes due to a change (improvement) in the horizontal alignment. Similarly, a 45-percent reduction should occur in total crashes for a change (improvement) in vertical alignment, with a 50-percent reduction attributed to a change in both horizontal and vertical alignment. Fink and Krammes (1995) verified the general conclusion that the relationship between crash rate and degree of horizontal curvature is easy to quantify where the sharper radius directly contributes to more crashes than a larger radius. More specifically, the research team determined that horizontal curves that do not require speed reductions (generally, curves with degrees of curvature < 4-degrees [approx. radius of 1432']) have similar mean crash rates than horizontal curves that do require speed reduction (Krammes et. al., 1995). A study performed for the State of Washington evaluated numerous environmental and physical road features in an effort to identify their relationship to crashes (Milton and Mannering, 1996). The researchers determined that curves of more than 2-degrees (R > 2865') tend to decrease crash probability. In addition long curves tend to increase the crash probability for collectors and minor arterials. Mohamedshah et. al. (1993) determined for truck crashes on two-lane rural roads, the significant degree of curvature is 6-degrees or greater. They were not able to determine any significant relationship between the road gradient and truck crashes. Based on the combined estimates resulting from a survey of 43 states plus the District of Columbia and a comprehensive literature review, Kentucky researchers developed the following estimation of percent crash reduction for several methods of geometric realignment (Agent et. al., 1996).

Countermeasure Handbook 40
Table A-15. Kentucky Geometric Improvement Crash Reduction Estimates
Category Number of Estimates
Average Percent Crash
Reduction State Survey Estimates: Add Any Type of Median (All Crashes) 10 35 Add Mountable Median (All Crashes) 4 20 Add Non-mountable Median (All Crashes) 11 27 Horizontal Realignment (All Crashes) 20 44 Horizontal Realignment (Run-Off-Road Crashes) 2 50 Curve Reconstruction (All Crashes) 6 50 Vertical Realignment (All Crashes) 13 41 Vertical Realignment (Run-Off-Road Crashes) 2 50 Horizontal & Vertical Realignment (All Crashes) 6 52 Literature Review Estimates: Add Any Type of Median (All Crashes) 7 14 Add Mountable Median (All Crashes) 4 28 Add Non-mountable Median (All Crashes) 8 10 Horizontal Realignment (All Crashes) 5 40 Curve Reconstruction (All Crashes) 11 54 Vertical Realignment (All Crashes) 4 39 Horizontal & Vertical Realignment (All Crashes) 12 38 Researcher's Resulting Estimates: Horizontal Realignment / Curve Reconstruction --- 40 Vertical Realignment --- 40 Modify Horizontal & Vertical Realignment --- 50
One study relating truck crashes to road geometry (Miaou, et. at., 1993) determined heavy vehicle crash rate on horizontal curves is a factor of curve length and degree of curvature. The following table summarizes general expected reductions in truck crash involvement on a rural two-lane undivided arterial road following an improvement.

Countermeasure Handbook 41
Table A-16. Miaou Geometric Improvement Crash Reduction Estimates
Horizontal Curvature (HC) in degrees / 100-ft arc: for 2o # HC # 30o
(percent reduction) Length of Original
Curve (mi.) Reduce 1o Reduce 2o Reduce 5o Reduce 10o Reduce 15o
0.10 9.4 (±1.1)
18.0 (±2.0)
39.1 (±3.8)
62.9 (±4.6)
77.4 (±4.3)
0.25 10.0 (±1.8)
19.0 (±3.3)
41.0 (±6.1)
65.2 (±7.4)
79.5 (±6.8)
0.50 11.0 (±4.7)
20.7 (±8.4)
44.1 (±15.4)
68.7 (±20.2)
82.5 (±22.0)
0.75 11.9 (±7.6)
22.4 (±13.6)
47.0 (±26.2)
71.9 (±42.6)
85.1 (---)
>1.00 12.8
(±10.6) 24.0
(±19.0) 49.7
(±39.6) 74.7 (---)
87.3 (---)
A comprehensive study for the FHWA (Smith et. al., 1983) estimated percent crash reduction for several countermeasures. This study was based on improvements at hazardous locations. The authors emphasize the percent crash reduction estimated are not directly applicable to moderately or mildly hazardous locations. Locations with horizontal and vertical realignment resulted in the estimated values depicted in the following table.
Table A-17. FHWA Geometric Improvement Crash Reduction Estimates
Mean Percent Crash Reduction Alignment Changes
Total Fatal Injury Property Damage Only
Horizontal realignment 40 40 30 25 Vertical realignment 40 40 40 50
One accident reduction factor study (SDDOT, 1998) evaluated sixty-two hazardous sites and attempted to quantify accident reduction factors (ARFs) for the sites. These ARFs were calculated by dividing the total number of crashes following an improvement project by the total number from previous years. A value greater than one, therefore, represents an increase in the number of crashes. Realignment of horizontal configurations resulted in an ARF of zero (or a 100% crash reduction). Realignment of horizontal and vertical resulted in an ARF of 1.12 (or an increase in crashes). A 1991 study (Zegeer et. al., 1991) determined that curve flattening (increasing the length of the radius for the horizontal curve) reduces crash frequency by as much as 80-percent, depending on the central angle and amount of flattening.

Countermeasure Handbook 42
2. Modify Superelevation / Cross Slope The literature regarding the modification of superelevation or cross slope is based upon both subjective assessment and analytical evaluation. Based on the combined estimates resulting from a survey of 43 states plus the District of Columbia and a comprehensive literature review, Kentucky researchers developed the following estimation of percent crash reduction for modifying the roadway superelevation (Agent et. al., 1996).
Table A-18. Kentucky Superelevation Improvement Crash Reduction Estimates
Category Number of Estimates
Average Percent Crash Reduction
State Survey Estimates: Modify Superelevation (All Crashes) 13 46 Literature Review Estimates: Modify Superelevation (All Crashes) 5 34 Researcher's Resulting Estimates: Modify Superelevation (All Crashes) --- 40
A study (Creasy and Agent, 1985) based on a combination of 42 literature reviews, 22 state surveys, and a before-after analysis, provided the subjective estimate that a 40-percent reduction should occur in total crashes due to the correction or improvement of roadway superelevation. A comprehensive study for the FHWA (Smith et. al., 1983) estimated percent crash reduction for several countermeasures. This study was based on improvements at hazardous locations. The authors emphasize the percent crash reduction estimated are not directly applicable to moderately or mildly hazardous locations. Locations with changes to superelevation correction or cross slope improvement resulted in the estimated values shown below.
Table A-19. FHWA Superelevation or Cross Slope Reduction Estimates
Mean Percent Crash Reduction
Alignment Changes Total Fatal Injury
Property Damage
Only Raise superelevation 5 5 10 20 Correct superelevation runoff 5 5 5 5 Correct cross slope break at shoulders 5 5 5 5 Flatten cross slope on pavement 5 5 5 5 Flatten cross slope on shoulder 5 2 2 2
Harwood et. al. (2000) summarized a group of "Accident Modification Factors" (AMF) for a variety of conditions. They captured their perception of the influence of

Countermeasure Handbook 43
superelevation deficiency using as depicted in the following graphic. If the AMF is greater than 1.0, the configuration has a greater likelihood of crashes.
3. Improve Sight Distance without Geometric Realignment The literature regarding improved sight distance is based upon both subjective assessment and analytical evaluation. It is important to note that some of the studies did not specifically identify how sight distance was improved, so it is difficult to know if physical road improvements were included. A study (Creasy and Agent, 1985) based on a combination of 42 literature reviews, 22 state surveys, and a before-after analysis, provided the subjective estimate that a 30-percent reduction should occur in total crashes due to an improvement in sight distance. This improvement condition was separated from geometric improvement analysis in the study. An Indiana study (Ermer et. al., 1992) estimated crash reduction factors based on a before-after study and combined with historic analyses in the state of Indiana. The improvement of sight distance rated an estimated 30-percent reduction in total crashes. It is important to note, geometric elements were not specifically separated in this study so the possible sight distance improvements may include some geometric features. Based on the combined estimates resulting from a survey of 43 states plus the District of Columbia and a comprehensive literature review, Kentucky researchers developed the following estimation of percent crash reduction for improved sight distance (Agent et. al., 1996). In this study, the actual method of improvement was not identified; however, the same study included a separate evaluation of geometric realignment.
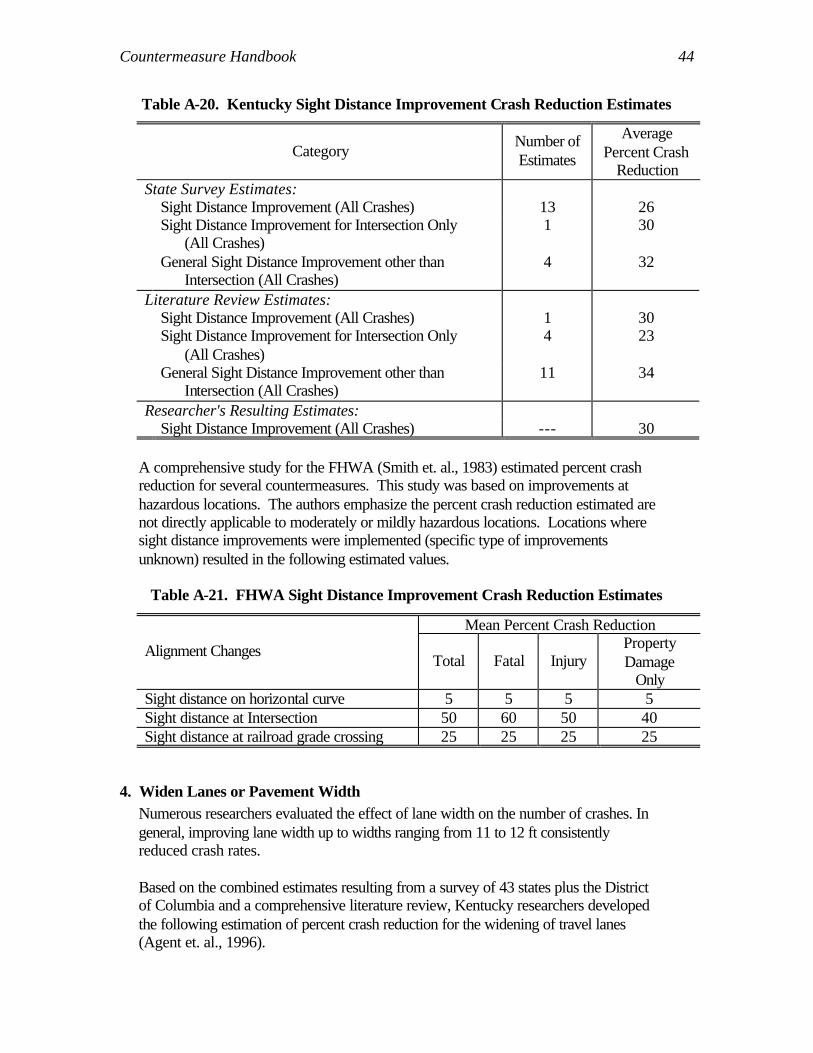
Countermeasure Handbook 44
Table A-20. Kentucky Sight Distance Improvement Crash Reduction Estimates
Category Number of Estimates
Average Percent Crash
Reduction State Survey Estimates: Sight Distance Improvement (All Crashes) 13 26 Sight Distance Improvement for Intersection Only
(All Crashes) 1 30
General Sight Distance Improvement other than Intersection (All Crashes)
4 32
Literature Review Estimates: Sight Distance Improvement (All Crashes) 1 30 Sight Distance Improvement for Intersection Only
(All Crashes) 4 23
General Sight Distance Improvement other than Intersection (All Crashes)
11 34
Researcher's Resulting Estimates: Sight Distance Improvement (All Crashes) --- 30
A comprehensive study for the FHWA (Smith et. al., 1983) estimated percent crash reduction for several countermeasures. This study was based on improvements at hazardous locations. The authors emphasize the percent crash reduction estimated are not directly applicable to moderately or mildly hazardous locations. Locations where sight distance improvements were implemented (specific type of improvements unknown) resulted in the following estimated values.
Table A-21. FHWA Sight Distance Improvement Crash Reduction Estimates
Mean Percent Crash Reduction
Alignment Changes Total Fatal Injury
Property Damage
Only Sight distance on horizontal curve 5 5 5 5 Sight distance at Intersection 50 60 50 40 Sight distance at railroad grade crossing 25 25 25 25
4. Widen Lanes or Pavement Width Numerous researchers evaluated the effect of lane width on the number of crashes. In general, improving lane width up to widths ranging from 11 to 12 ft consistently reduced crash rates. Based on the combined estimates resulting from a survey of 43 states plus the District of Columbia and a comprehensive literature review, Kentucky researchers developed the following estimation of percent crash reduction for the widening of travel lanes (Agent et. al., 1996).

Countermeasure Handbook 45
Table A-22. Kentucky Lane Width Crash Reduction Estimates
Category Number of Estimates
Average Percent Crash Reduction
State Survey Estimates: Widen Pavement (All Crashes) 19 26 Widen Pavement (Run-off-Road Crashes only) 2 30
Literature Review Estimates: Widen Pavement (All Crashes) 15 22
Researcher’s Resulting Estimates: Widen Pavement (All Crashes) --- 25
A study performed by Creasy and Agent (1985), based on a combination of 42 literature reviews, 22 state surveys and a before-after analysis, provided the subjective estimate that a 20-percent reduction should occur in total crashes due to lane widening. Benekohal and Hashmi (1990) considered data from 1981 to 1987 for two-lane rural highways in the state of Illinois. These researchers evaluated the relationship between roadway characteristics, environmental conditions and crash frequency. The researchers concluded “any roadway improvement consisting of lane and shoulder widening… generally results in the reduction of accident frequency of related accidents.” The analysis model indicated that crash frequency decreases by about 3-percent as lane width increases. A comprehensive study for the FHWA (Smith et. al., 1983) estimated percent crash reduction for several countermeasures. The researchers based this study on improvements at hazardous locations. The authors emphasized the percent crash reductions estimated are not directly applicable to moderately or mildly hazardous locations. Locations where pavement was widened resulted in the estimated values shown in the following table.
Table A-23. FHWA Lane Widening Crash Reduction Estimates
Mean Percent Crash Reduction Countermeasure Total Fatal Injury Property
Damage Only Pavement Widening on Sections 0 -10 -5 5 Pavement Widening on Horizontal and Vertical Curves 5 -5 0 10
Griffin and Mak (1988) suggested that by increasing surface width, the single-vehicle crash rate for average annual daily traffic (AADT) greater than 400 would decrease. They used data on two-lane, rural, farm-to-market roads in the state of Texas. The study included crash data and roadway inventory data from 1985. The analyses indicated that surface widening would not reduce multi-vehicle crash rates. The

Countermeasure Handbook 46
researchers determined the influence of surface widening for a given AADT category to be a function of (1) existing road width and (2) the width to which the road is widened. The percent reduction in single-vehicle crashes when the resurfacing conforms to various road widths is shown in the column titles in the following table. For example, resurfacing from 18 ft to 20 ft on a roadway with AADT in the range 401-700 results in a 7.05-percent reduction in crashes.
Table A-24. Texas Pavement Widening Single-Vehicle Crash Reduction Estimates
Final Pavement Surface Width (feet) AADT Existing Pavement Width (feet) 20 22 24 26
18 7.05 13.42 19.24 24.59 20 --- 6.86 13.12 18.87 22 --- --- 6.72 12.90 401-700
24 --- --- --- 6.63 18 11.82 22.52 32.28 41.26 20 --- 12.13 23.20 33.39 22 --- --- 12.60 24.19 701-1000
24 --- --- --- 13.26 18 13.92 26.50 37.99 48.57 20 --- 14.62 27.97 40.25 22 --- --- 15.64 30.02
1001-1500
24 --- --- --- 17.05
Hadi et. al. (1995a) estimated a relationship between a variety of cross section design variables for all types of crashes. The analysis used four years (1988-1991) of crash data from Florida. The authors determined that for two-lane rural highways, widening lane widths up to 13-feet could be expected to decrease crash rates. In 1957, Schoppert used linear regression analysis to estimate the relationship between traffic crashes and roadway elements for rural two-lane highways with gravel shoulders in Oregon. He used data for years 1952, 53 and 54. In general he determined fewer crashes can be expected on roadways with wider lanes (Schoppert, 1957). Similarly, Vogt and Bared (1998) independently arrived at a conclusion similar to that of the 1957 study. Zegeer and Deacon (1987) identified the three most important factors that affect crash experience. Lane width was included as one of these three factors. The simple percentage decrease in the number of run-off-road and opposite direction crashes from a before condition to an after situation are summarized in the following table:

Countermeasure Handbook 47
Table A-25. Percent Crash Reduction Due to Lane Widening (Based on KY Data)
Lane Width “Before” (feet)
Lane Width “After” (feet)
Percent Crash Reduction
10 23 8 11-12 36 10 10 9 11-12 29
10 11-12 23
Another Florida study (Hadi et. al., 1995b) determined that roadway widening on curves as a safety countermeasure is cost-effective. An extensive review of literature identified previously derived relationships between geometric design elements and crash rates. Conclusions drawn from this review include: • Crash rates decreased as lane width increased up to 11-feet, then remained
relatively constant. • A before-after study showed a significant decrease in crash rates when widening
lanes from 9-12 feet, especially at high-crash sections. • Pavements 22-24 feet wide had fewer crashes than narrower and wider pavements
for two-lane roads. • A before-after study recorded that widening lanes at 17 sites from 9 and 10 feet to
11 and 12 feet resulted in a 22-percent reduction in crash rates. • The researchers determined that the only crashes that could be expected to
decrease with lane widening were run-off-road and opposite-direction crashes. They also found that only property damage and injury crashes decreased as lane width increased. They did not observe a change in fatality rate.
• As the lane widening increased, the percentage reduction in related crashes also increased. The first foot of lane widening between 8 and 12 feet caused a 12-percent reduction in related crashes, 2 feet caused a 23-percent reduction, 3 feet caused a 32-percent reduction and 4 feet caused a 40-percent reduction. This applies to only rural two-lane highways with lane widths of 8-12 feet, shoulder width of zero to 12 feet, and traffic volumes of 100 to 10,000 vpd.
In addition to their literature review summary above, Hadi et. al. (1995b) developed models to identify the relationship between various factors and crash experience. They determined that as lane width increased from 9 feet to 13 feet, the total, injury and fatal crash rates were decreased by 4.26, 4.17, and 9.23-percent respectively. Zegeer et. al. (1991) determined that widening lanes and shoulders on curves can reduce the frequency of curve crashes by as much as 33-percent. The researchers indicated that, irrespective of the degree of curve, central angle, length of curve, or the ADT, the predicted number of curve crashes always decreased as lane width increased on a horizontal curve. This increase in lane width is limited to the curve regions and not the entire length of the roadway. Estimated crash reductions were in a range from

Countermeasure Handbook 48
4-percent for 2 feet of total roadway widening to 36-percent for 20 feet of total roadway widening. Harwood et. al. (2000) summarized a group of AMFs for a variety of conditions. The influence of lane width was based on an assumed base lane width of 12-feet. The researchers based their analysis on single-vehicle run-off-road crashes, multi-vehicle same direction sideswipe crashes, and multi-vehicle opposite direction crashes. As AADT values increase the likelihood of a crash associated with a lane width also increases. The following graphic demonstrates the accident reduction factors for lane width. If the AMF is greater than 1.0, the configuration has a greater likelihood of crashes.
5. Add Turn Lane
Based on the combined estimates resulting from a survey of 43 states and the District of Columbia and a comprehensive literature review, Kentucky researchers developed the following estimation of percent crash reduction for the addition of turn lanes (Agent et. al, 1996).

Countermeasure Handbook 49
Table A-26. Kentucky Added Turn Lane Crash Reduction Estimates
Category Number of Estimates
Average Percent Crash Reduction
State Survey Estimates: Left-turn (At Signal) (All Crashes) 17 30 Left-turn (At Signal) (LT Rear End) 2 75 Left-turn (No Signal) (All Crashes) 16 28 Left-turn (No Signal) (LT Rear End) 2 87 Right-turn (All Crashes) 5 27 Two-way Left-turn Lane (All Crashes) 21 34
Literature Review Estimates: Left-turn (At Signal) (All Crashes) 3 27 Left-turn (No Signal) (All Crashes) 3 30 Two-way Left-turn Lane (All Crashes) 10 31
Researcher’s Resulting Estimates: Left-turn (All Crashes) --- 25 Left-turn (LT Related Crashes) --- 50 Right-turn (All Crashes) --- 25 Right-turn (RT Related Crashes) --- 50 Two-way Left-turn Lane (All Crashes) --- 30
A study conducted by Creasy and Agent (1985) evaluated a combination of previous research available in literature, 22 state surveys, and a before-after analysis. This study provided a subjective estimate of the influence of the addition of a left-turn lane and concluded there would be: • A 25-percent reduction in total crashes when there is no traffic signal present, • A 30-percent reduction when there is a traffic signal, and • A 30-percent reduction when a two-way left-turn lane is added. A comprehensive study for the FHWA (Smith et. al., 1983) estimated percent crash reduction for several countermeasures. This study was based on improvements at hazardous locations. The authors emphasize the percent crash reductions estimated are not directly applicable to moderately or mildly hazardous locations. Locations where a turn lane was added resulted in the estimated values shown in the following table.
Table A-27. FHWA Turn Lane Construction Crash Reduction Estimates
Mean Percent Crash Reduction Countermeasure
Total Fatal Injury Property Damage
Only Add turn lanes at signalized intersection 25 15 20 25 Add turn lanes at intersections without signals 60 45 55 65
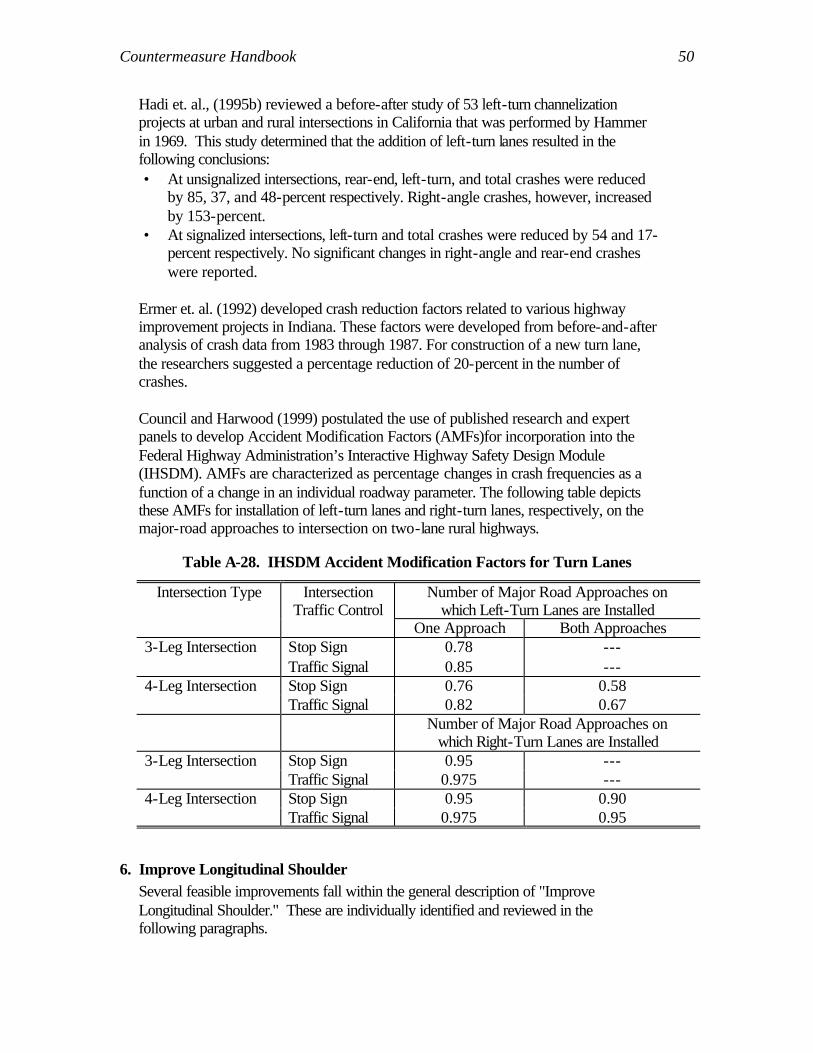
Countermeasure Handbook 50
Hadi et. al., (1995b) reviewed a before-after study of 53 left-turn channelization projects at urban and rural intersections in California that was performed by Hammer in 1969. This study determined that the addition of left-turn lanes resulted in the following conclusions: • At unsignalized intersections, rear-end, left-turn, and total crashes were reduced
by 85, 37, and 48-percent respectively. Right-angle crashes, however, increased by 153-percent.
• At signalized intersections, left-turn and total crashes were reduced by 54 and 17-percent respectively. No significant changes in right-angle and rear-end crashes were reported.
Ermer et. al. (1992) developed crash reduction factors related to various highway improvement projects in Indiana. These factors were developed from before-and-after analysis of crash data from 1983 through 1987. For construction of a new turn lane, the researchers suggested a percentage reduction of 20-percent in the number of crashes. Council and Harwood (1999) postulated the use of published research and expert panels to develop Accident Modification Factors (AMFs)for incorporation into the Federal Highway Administration’s Interactive Highway Safety Design Module (IHSDM). AMFs are characterized as percentage changes in crash frequencies as a function of a change in an individual roadway parameter. The following table depicts these AMFs for installation of left-turn lanes and right-turn lanes, respectively, on the major-road approaches to intersection on two-lane rural highways.
Table A-28. IHSDM Accident Modification Factors for Turn Lanes
Number of Major Road Approaches on which Left-Turn Lanes are Installed
Intersection Type Intersection Traffic Control
One Approach Both Approaches Stop Sign 0.78 --- 3-Leg Intersection Traffic Signal 0.85 --- Stop Sign 0.76 0.58 4-Leg Intersection Traffic Signal 0.82 0.67
Number of Major Road Approaches on which Right-Turn Lanes are Installed
Stop Sign 0.95 --- 3-Leg Intersection Traffic Signal 0.975 --- Stop Sign 0.95 0.90 4-Leg Intersection Traffic Signal 0.975 0.95
6. Improve Longitudinal Shoulder Several feasible improvements fall within the general description of "Improve Longitudinal Shoulder." These are individually identified and reviewed in the following paragraphs.

Countermeasure Handbook 51
a. Add or Widen Graded or Stabilized Shoulder
The literature regarding adding or widening graded or stabilized roadway shoulders is considerable and is based upon both subjective assessment and analytical evaluation. Barbaresso and Bair (1983) performed statistical analysis on several crashes associated with a variety of shoulder widths on two-lane roads. Their goal was to determine whether there is a significant difference in crash frequency between two-lane roadways with shoulder widths that meet minimum standards and those that do not. The results of their study did not support the idea that roadways with wider shoulders experience fewer crashes than roadways with narrow shoulders. Interestingly, they did find that fixed object crash frequency is significantly lower for roadways with shoulders less than 7 feet wide than it is for roadways with wider shoulders. The authors hypothesize that wider shoulders may give drivers a false sense of security and the drivers may, therefore, drive at speeds faster than appropriate for roadway conditions. This hypothesis was not, however, tested in their study. A study (Creasy and Agent, 1985) based on a combination of 42 literature reviews, 22 state surveys, and a before-after analysis, provided the subjective estimate that a 20-percent reduction should occur in total crashes due to the addition of a shoulder as well as the widening of a shoulder. An Indiana study (Ermer et. al., 1992) estimated crash reduction factors based on a before-after study and combined with historic analyses in the state of Indiana. The construction and/or reconstruction of shoulders rated an estimated 9-percent reduction in total crashes. A Florida study (Hadi et. al., 1995a) determined that a greater total shoulder width (paved plus unpaved) was associated with lower crash rates on two-lane rural highways. Based on the combined estimates resulting from a survey of 43 states plus the District of Columbia and a comprehensive literature review, Kentucky researchers developed the following estimation of percent crash reduction for widening or stabilizing roadway shoulders (Agent et. al., 1996).
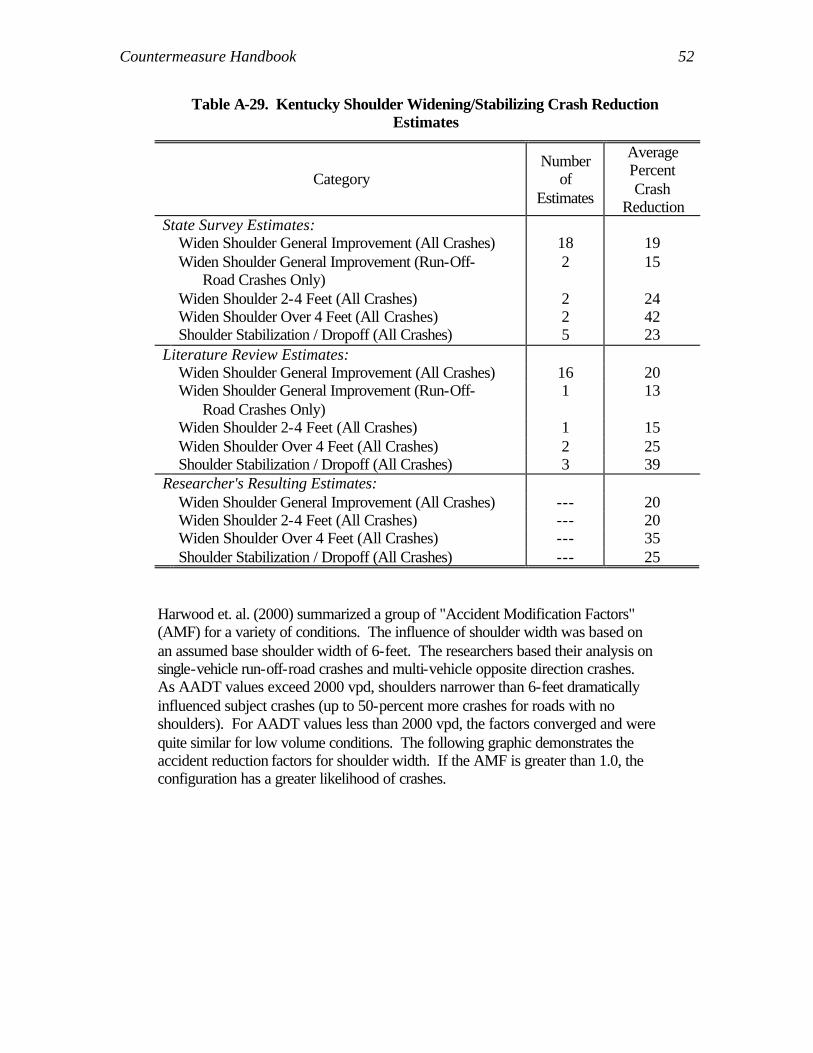
Countermeasure Handbook 52
Table A-29. Kentucky Shoulder Widening/Stabilizing Crash Reduction Estimates
Category Number
of Estimates
Average Percent Crash
Reduction State Survey Estimates: Widen Shoulder General Improvement (All Crashes) 18 19 Widen Shoulder General Improvement (Run-Off-
Road Crashes Only) 2 15
Widen Shoulder 2-4 Feet (All Crashes) 2 24 Widen Shoulder Over 4 Feet (All Crashes) 2 42 Shoulder Stabilization / Dropoff (All Crashes) 5 23 Literature Review Estimates: Widen Shoulder General Improvement (All Crashes) 16 20 Widen Shoulder General Improvement (Run-Off-
Road Crashes Only) 1 13
Widen Shoulder 2-4 Feet (All Crashes) 1 15 Widen Shoulder Over 4 Feet (All Crashes) 2 25 Shoulder Stabilization / Dropoff (All Crashes) 3 39 Researcher's Resulting Estimates: Widen Shoulder General Improvement (All Crashes) --- 20 Widen Shoulder 2-4 Feet (All Crashes) --- 20 Widen Shoulder Over 4 Feet (All Crashes) --- 35 Shoulder Stabilization / Dropoff (All Crashes) --- 25
Harwood et. al. (2000) summarized a group of "Accident Modification Factors" (AMF) for a variety of conditions. The influence of shoulder width was based on an assumed base shoulder width of 6-feet. The researchers based their analysis on single-vehicle run-off-road crashes and multi-vehicle opposite direction crashes. As AADT values exceed 2000 vpd, shoulders narrower than 6-feet dramatically influenced subject crashes (up to 50-percent more crashes for roads with no shoulders). For AADT values less than 2000 vpd, the factors converged and were quite similar for low volume conditions. The following graphic demonstrates the accident reduction factors for shoulder width. If the AMF is greater than 1.0, the configuration has a greater likelihood of crashes.
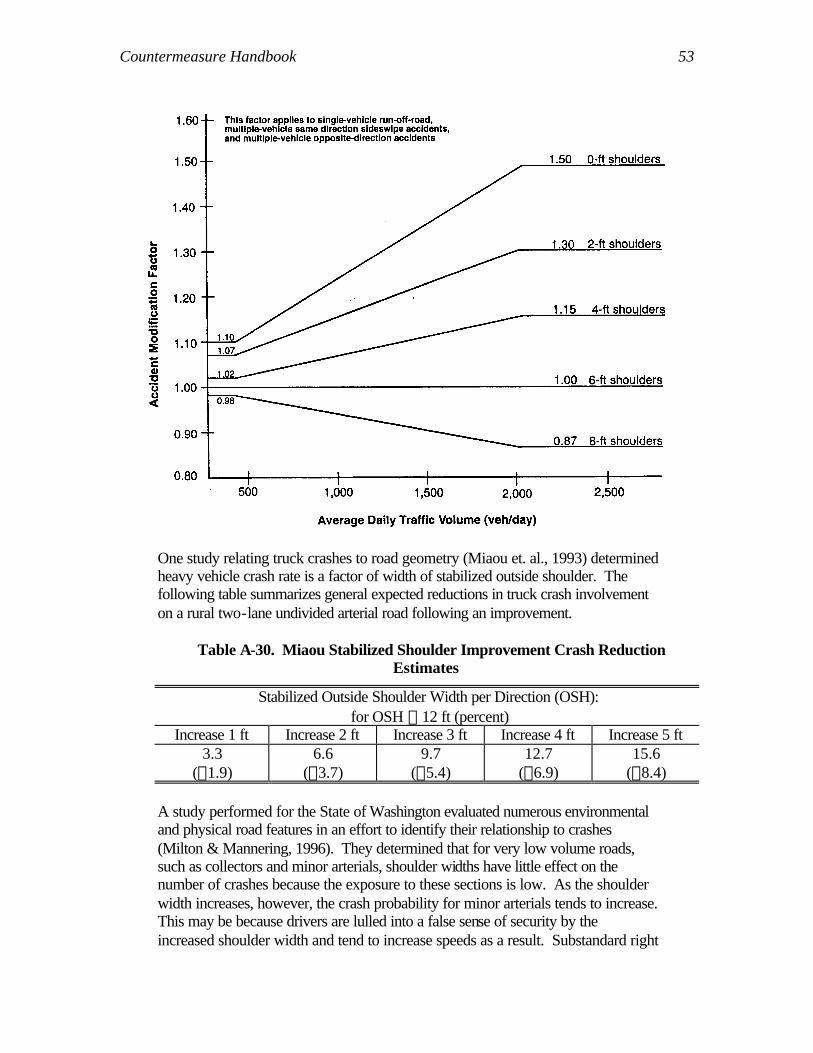
Countermeasure Handbook 53
One study relating truck crashes to road geometry (Miaou et. al., 1993) determined heavy vehicle crash rate is a factor of width of stabilized outside shoulder. The following table summarizes general expected reductions in truck crash involvement on a rural two-lane undivided arterial road following an improvement.
Table A-30. Miaou Stabilized Shoulder Improvement Crash Reduction
Estimates
Stabilized Outside Shoulder Width per Direction (OSH): for OSH # 12 ft (percent)
Increase 1 ft Increase 2 ft Increase 3 ft Increase 4 ft Increase 5 ft 3.3
("1.9) 6.6
("3.7) 9.7
("5.4) 12.7
("6.9) 15.6
("8.4)
A study performed for the State of Washington evaluated numerous environmental and physical road features in an effort to identify their relationship to crashes (Milton & Mannering, 1996). They determined that for very low volume roads, such as collectors and minor arterials, shoulder widths have little effect on the number of crashes because the exposure to these sections is low. As the shoulder width increases, however, the crash probability for minor arterials tends to increase. This may be because drivers are lulled into a false sense of security by the increased shoulder width and tend to increase speeds as a result. Substandard right

Countermeasure Handbook 54
shoulders also tend to increase the frequency of crashes for principal arterials and collectors. This is assumed to be because drivers have less room to take corrective actions after making an errant maneuver. The Minnesota Department of Transportation performed a two-lane rural crash analysis with associated cost benefit evaluations for improvements (MinDOT, 1980). For evaluation of all crashes, they determined that even the narrowest permitted shoulder standard would have to have a very high average daily traffic volume before widening could be justified on the basis of normally anticipated savings in crash costs. If the shoulders could be widened 3-feet for minimal cost, the benefits from reduced crashes would justify the construction cost. When evaluating run-off-road crashes, they found crashes decreased as shoulder width increased (a similar observation for total crashes). The researchers were not able to determine a relationship between shoulder type and crash rate. In 1995, a University of Florida study (Hadi et. al., 1995b) concluded that for rural two-lane highways increasing the total shoulder width (paved and unpaved) from 3-feet to 9-feet was found to decrease the total crash rate by 8.62-percent and the injury crash rate by 11.85-percent. A comprehensive study for the FHWA (Smith et. al., 1983) estimated percent crash reduction for several countermeasures. This study was based on improvements at hazardous locations. The authors emphasize the percent crash reduction estimated is not directly applicable to moderately or mildly hazardous locations. Locations with shoulder improvements (stabilizing shoulders) resulted in the estimated values shown below.
Table A-31. FHWA Shoulder Stabilization Crash Reduction Estimates
Mean Percent Crash Reduction Countermeasure
Total Fatal Injury Property Damage Only
Stabilize Shoulders (Tangent) 5 0 5 10 Stabilize Shoulders (Horizontal
Curve) 15 10 10 10
Stabilize Shoulders (Intersection) 10 5 5 5
One accident reduction factor study (SDDOT, 1998) evaluated sixty-two hazardous sites and attempted to quantify accident reduction factors (ARFs) for the sites. These ARFs were calculated by dividing the total number of crashes following an improvement project by the total number from previous years. A value greater than one, therefore, represents an increase in the number of crashes. Shoulder widening resulted in an ARF of 0.80 (a reduction in crashes). It is important to note that of the sixty-two improvement sites, only one site involved shoulder widening so this ARF is from a single data point.

Countermeasure Handbook 55
Zegeer et. al. (1987) found for shoulder widths between 0 and 12 feet, the percent reduction in related crashes as a result of adding unpaved shoulders would result in 13, 25, and 35-percent reduction in related crashes for 2, 4, and 6-feet of widening, respectively. A 1991 study (Zegeer et. al., 1991) determined the percent reduction in crashes due to unpaved shoulder widening as represented in the following table.
Table A-32. Zegeer Unpaved Shoulder Widening Crash Reduction Estimates
Total Amount of Shoulder Widening (ft.)
Total Per Side
Percent Crash Reduction for Unpaved Shoulder Widening
2 1 3 4 2 7 6 3 10 8 4 13 10 5 16 12 6 18 14 7 21 16 8 24 18 9 26 20 10 29
b. Pave Existing Graded Shoulder of Suitable Width
Based on the combined estimates resulting from a survey of 43 states and the District of Columbia and a comprehensive literature review, Kentucky researchers developed the following estimation of percent crash reduction for the paving of shoulders (Agent et. al., 1996).
Table A-32. Kentucky Paved Shoulder Crash Reduction Estimates
Category Number of Estimates
Average Percent Crash Reduction
State Survey Estimates: Pave Shoulder (All Crashes) 3 18 Pave Shoulder (Run-off-Road Crashes only) 2 15
Literature Review Estimates: Pave Shoulder (All Crashes) 1 20
Researcher’s Resulting Estimates: Pave Shoulder (All Crashes) --- 15
Hadi et. al. (1995b) determined that based on a Florida study data of 1988-1991 no significant relationship could be found between shoulder type and crashes. The analysis model evaluated the total shoulder width and did not separate the width of paved and unpaved shoulders.

Countermeasure Handbook 56
A comprehensive study for the FHWA (Smith et. al., 1983) estimated percent crash reduction for several countermeasures. This study was based on improvements at hazardous locations. The authors emphasize the percent crash reduction estimated is not directly applicable to moderately or mildly hazardous locations. Locations where the shoulders were paved resulted in the following estimated values.
Table A-33. FHWA Shoulder Improvement Crash Reduction Estimates
Mean Percent Crash Reduction Countermeasure
Total Fatal Injury Property Damage Only
Pave Shoulders (Tangent) 5 5 10 10 Pave Shoulders (Horizontal Curve) 15 15 15 15 Pave Shoulders (Intersection) 10 10 10 10
Zegeer et. al. (1987) found for shoulder widths between 0 and 12 feet, the percent reduction in related crashes as a result of adding paved shoulders is 16-percent for 2-feet of widening, 29-percent for 4-feet of widening, and 40-percent for 6-feet of widening.
c. Widen and Pave Existing Paved Shoulder
In 1995, a University of Florida study (Hadi et. al., 1995b) concluded that for rural two-lane highways increasing the total shoulder width (paved and unpaved) from 3-feet to 9-feet was found to decrease the total crash rate by 8.62-percent and the injury crash rate by 11.85-percent.
A 1991 study (Zegeer et. al., 1991) determined the percent reduction in crashes due to paved shoulder widening as represented in the following table.
Table A-34. Zegeer Shoulder Improvement Crash Reduction Estimates
Total Amount of Shoulder Widening (ft.)
Total Per Side
Percent Crash Reduction for Paved Shoulder Widening
2 1 4 4 2 8 6 3 12 8 4 15 10 5 19 12 6 21 14 7 25 16 8 28 18 9 31 20 10 33
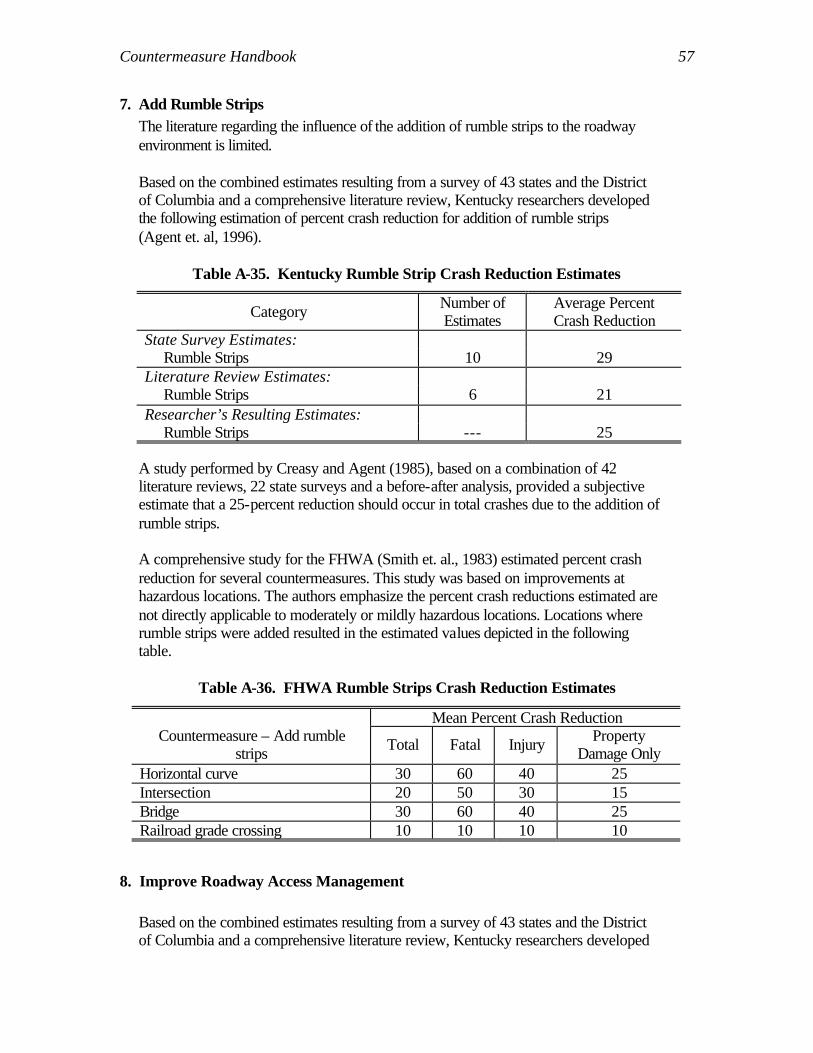
Countermeasure Handbook 57
7. Add Rumble Strips The literature regarding the influence of the addition of rumble strips to the roadway environment is limited. Based on the combined estimates resulting from a survey of 43 states and the District of Columbia and a comprehensive literature review, Kentucky researchers developed the following estimation of percent crash reduction for addition of rumble strips (Agent et. al, 1996).
Table A-35. Kentucky Rumble Strip Crash Reduction Estimates
Category Number of Estimates
Average Percent Crash Reduction
State Survey Estimates: Rumble Strips 10 29
Literature Review Estimates: Rumble Strips 6 21
Researcher’s Resulting Estimates: Rumble Strips --- 25
A study performed by Creasy and Agent (1985), based on a combination of 42 literature reviews, 22 state surveys and a before-after analysis, provided a subjective estimate that a 25-percent reduction should occur in total crashes due to the addition of rumble strips. A comprehensive study for the FHWA (Smith et. al., 1983) estimated percent crash reduction for several countermeasures. This study was based on improvements at hazardous locations. The authors emphasize the percent crash reductions estimated are not directly applicable to moderately or mildly hazardous locations. Locations where rumble strips were added resulted in the estimated values depicted in the following table.
Table A-36. FHWA Rumble Strips Crash Reduction Estimates
Mean Percent Crash Reduction Countermeasure – Add rumble
strips Total Fatal Injury Property Damage Only
Horizontal curve 30 60 40 25 Intersection 20 50 30 15 Bridge 30 60 40 25 Railroad grade crossing 10 10 10 10
8. Improve Roadway Access Management
Based on the combined estimates resulting from a survey of 43 states and the District of Columbia and a comprehensive literature review, Kentucky researchers developed

Countermeasure Handbook 58
the following estimation of percent crash reduction for the addition of a frontage road (Agent et. al., 1996).
Table A-37. Kentucky Driveway Density Crash Reduction Estimates
Category Number of Estimates
Average Percent Crash Reduction
State Survey Estimates: Frontage Road
7
39
Literature Review Estimates: Frontage Road
1
40
Researcher’s Resulting Estimates: Frontage Road
---
40
Hadi et. al. (1995a) developed models based on Florida crash data from 1988 to 1991. They concluded the presence of an additional intersection in a rural two-lane road section increased the mid-block crash rate and the injury crash rate by 6.07 and 6.19-percent respectively. Schoppert (1957) used regression analysis to estimate the relationship between traffic crashes and roadway elements for rural two-lane highways with gravel shoulders in Oregon. He based his study on crash data from 1952, 53 and 54. He concluded that access to highways through driveways or intersections was directly related to crashes at all AADT levels. Residential driveways also showed a positive relationship to crashes in all AADT ranges, but the higher the density of residential driveways, the higher the number of crashes. Vogt and Bared (1998) developed crash prediction models for two-lane rural roads. The study included crash data from Minnesota and Washington for 1985-89 and 1993-95 respectively. The final model indicated that reducing driveway density results in a reduced number of crashes. Dart and Mann (1970) developed a model to represent the relationship between crash rates and the number of traffic conflict points. The study was based on crash and roadway information from 1962 to 1966 in the state of Louisiana. Traffic conflict points are defined as the total number of traffic access points on both sides per mile of highway section. These access points include only minor road intersections (intersections with major roads were considered as break points between study sections) and principal access driveways to abutting property along highway section. The researchers concluded that traffic conflict points per mile is one of the two most important factors affecting crash rates. This conclusion was based on interactions with traffic volume. Ivan and O’Mara (1997) developed a model to represent the relationship between traffic conditions, geometric variables, and highway crash rates. The model utilized a Connecticut database that contained crash and roadway information for the period

Countermeasure Handbook 59
1991 through 1993. The researchers found that for all evaluated factors, the one that had the greatest influence on crash rates was the number of intersections per mile.
D. ROADSIDE IMPROVEMENTS
1. Install or Upgrade Guardrail The literature regarding the addition of guardrail favors its placement to enhance safety. Many of the studies include subjective assessment, but a few evaluated before and after conditions to determine countermeasure effectiveness. A study (Creasy and Agent, 1985) based on a combination of 42 literature reviews, 22 state surveys, and a before-after analysis, provided the subjective estimate that a 55-percent reduction should occur in the number of fatal crashes due to the addition of guardrail. Similarly, a 35-percent reduction should occur in the number of injury crashes due to the guardrail addition. An Indiana study (Ermer et. al., 1992) estimated crash reduction factors based on a before-after study and combined with historic analyses in the state of Indiana. The installation of guardrail rated an estimated 4-percent reduction in total crashes, while the replacement of guardrail rated a 7-percent reduction value. A comprehensive study for the FHWA (Smith et. al., 1983) estimated percent reduction for several countermeasures. This study was based on improvements at hazardous conditions. The authors emphasize the percent crash reduction estimated are not directly applicable to moderately or mildly hazardous locations. Locations where guardrail was installed resulted in the estimated values shown below.
Table A-38. FHWA Guardrail Installation Crash Reduction Estimates
Mean Percent Crash Reduction Alignment Changes
Total Fatal Injury Property Damage Only
General Guardrail Installation
5 50 15 -5
Based on the combined estimates resulting from a survey of 43 states plus the District of Columbia and a comprehensive literature review, Kentucky researchers developed the following estimation of percent crash reduction for the installation of guardrail (Agent et. al., 1996).

Countermeasure Handbook 60
Table A-39. Kentucky Guardrail Installation Crash Reduction Estimates
Category Number of Estimates
Average Percent Crash
Reduction State Survey Estimates: Install Guardrail (All Crashes) 17 22 Install Guardrail (Fatal Crashes Only) 6 64 Install Guardrail (Injury Crashes Only) 6 31 Upgrade Guardrail (All Crashes) 11 8 Upgrade Guardrail (Fatal Crashes Only) 4 51 Upgrade Guardrail (Injury Crashes Only) 5 37 Literature Review Estimates: Install Guardrail (All Crashes) 7 20 Install Guardrail (Fatal Crashes Only) 3 68 Install Guardrail (Injury Crashes Only) 3 32 Upgrade Guardrail (All Crashes) 10 10 Researcher's Resulting Estimates: Install Guardrail (All Crashes) --- 5 Install Guardrail (Fatal Crashes Only) --- 65 Install Guardrail (Injury Crashes Only) --- 40 Upgrade Guardrail (All Crashes) --- 5 Upgrade Guardrail (Fatal Crashes Only) --- 50 Upgrade Guardrail (Injury Crashes Only) --- 35
2. Upgrade Guardrail End Treatment / Add Impact Attenuator The literature dealing with the effects of end treatment on crashes is limited. Generally, the improvement of guardrail end treatments results in a reduction in the severity of crashes. Based on the combined estimates resulting from a survey of 43 states and the District of Columbia and a comprehensive literature review, Kentucky researchers developed the following estimation of percent crash reduction for upgrading the end treatment. (Agent et. al., 1996).

Countermeasure Handbook 61
Table A-40. Kentucky Guardrail End Treatment Crash Reductions Estimates
Category Number of Estimates
Average Percent Crash Reduction
State Survey Estimates: Upgrade End Treatment 1 10 Install Impact Attenuator (All Crashes) 16 29 Install Impact Attenuator (Fatal Crashes) 4 75 Install Impact Attenuator (Injury Crashes) 4 50
Literature Review Estimates: Upgrade End Treatment 6 35 Install Impact Attenuator (All Crashes) 10 31 Install Impact Attenuator (Fatal Crashes) 3 65 Install Impact Attenuator (Injury Crashes) 3 36
Researcher’s Resulting Estimates: Install Impact Attenuator (All Crashes) --- 5 Install Impact Attenuator (Fatal Crashes) --- 75 Install Impact Attenuator (Injury Crashes) --- 50
Wattleworth et. al. (1988) developed accident reduction factors related to crash experience in Florida. The researchers performed before-after analysis of crash data from three years before and three years after implementation of the guardrail end treatment safety countermeasure. A 10-percent reduction in the number of total crashes and 55-percent in the number of fatal crashes was estimated due to end treatment of guardrail.
3. Clear Zone Improvements
Several feasible improvements fall within the general description of "Clear Zone Improvements." These are individually identified and reviewed in the following paragraphs. a. Widen Clear Zone
The literature regarding the improvement of the clear zone is minimal. The primary source of information should be the Roadside Design Guide (AASHTO, 1996). Illinois researchers (Boyce et. al., 1989) attempted to find a relationship and cost justification between acceptable clear zone and average daily traffic (ADT). They found little evidence to indicate a specific clear zone width would be cost-effective for a roadway in a certain ADT class. They did, however, note that crash frequency generally declines with increasing clear zone width and increases with increasing ADT.

Countermeasure Handbook 62
b. Flatten Side Slope
The literature regarding the flattening of side slopes is based upon both subjective assessment and analytical evaluation. Based on the combined estimates resulting from a survey of 43 states and the District of Columbia and a comprehensive literature review, Kentucky researchers developed the following estimation of percent crash reduction when the side slope is "flattened" (Agent et. al., 1996). Table A-41. Kentucky Flatten Side Slope Crash Reduction Estimates
Category Number of Estimates
Average Percent Crash
Reduction State Survey Estimates: Flatten Side Slopes (All Crashes) 11 30 Flatten Side Slopes (Run-Off-Road Crashes Only) 2 46 Literature Review Estimates: Flatten Side Slopes (All Crashes) 10 19 Researcher's Resulting Estimates: Flatten Side Slopes (All Crashes) --- 30
Illinois researchers (Boyce et. al., 1989) evaluated the effect of roadside characteristics on crashes and determined that roads with steep lateral slopes (> 3:1) and narrow clear zones (#15 feet) experienced over twice as many crashes per mile as roads with flat lateral slopes (#5:1) and wide clear zones (>28 feet). Unfortunately, a companion cost benefit analysis that evaluated flattening side slopes and removing affected fixed obstacles indicated the improvement cost exceeded the savings from the predicted reduction in run-off-road crashes. A study (Creasy and Agent, 1985) based on a combination of 42 literature reviews, 22 state surveys, and a before-after analysis, provided the subjective estimate that a 15-percent reduction should occur in total crashes due to the flattening of the side slope. A comprehensive study for the FHWA (Smith et. al., 1983) estimated percent reduction for several countermeasures. This study was based on improvements at hazardous conditions. The authors emphasize the percent crash reduction estimated are not directly applicable to moderately or mildly hazardous locations. Locations where side slope improvements were implemented resulted in the following estimated values.

Countermeasure Handbook 63
Table A-42. FHWA Flattening Side Slope Crash Reduction Estimates
Mean Percent Crash Reduction Alignment Changes
Total Fatal Injury Property Damage Only
Flatten side or back slope 30 75 50 20 Round ditches 5 10 10 5 Remove pavement edge
dropoffs (tangent section) 25 15 15 15
Remove pavement edge dropoffs (horizontal curve) 20 20 20 20
Zegeer et. al. (1987) found the rate of single-vehicle crashes decreases steadily for side-slopes of 3:1 to 7:1 or flatter. However, they observed only a slight reduction in single-vehicle crashes for a 3:1 side slope compared to a side slope of 2:1 or steeper. In a follow-up paper, Zegeer et. al. (1988) developed the following table for expected percent reduction in single-vehicle crashes due to side slope flattening.
Table A-43. Zegeer Flattening Side Slope Expected Crash Reduction Estimates
Side Slope Ratio in After Condition Side Slope Ratio in Before
Condition 3:1 4:1 5:1 6:1 7:1 or Flatter
2:1 2 10 15 21 27 3:1 0 8 14 19 26 4:1 --- 0 6 12 19 5:1 --- --- 0 6 14 6:1 --- --- --- 0 8
c. Relocate Fixed Object
The literature regarding the relocation of fixed objects is based upon both subjective assessment and analytical evaluation. Based on the combined estimates resulting from a survey of 43 states plus the District of Columbia and a comprehensive literature review, Kentucky researchers developed the following estimation of percent crash reduction for the relocation of fixed objects (Agent et. al., 1996).

Countermeasure Handbook 64
Table A-44. Kentucky Fixed Object Relocation Crash Reduction Estimates
Category Number
of Estimates
Average Percent Crash
Reduction State Survey Estimates: Relocate Fixed Objects (All Crashes) 10 41 Relocate Fixed Objects (Fatal Crashes Only) 4 40 Relocate Fixed Objects (Injury Crashes Only) 4 15 Relocate Fixed Objects (Run-Off-Road Crashes Only) 2 55 Literature Review Estimates: Relocate Fixed Objects (All Crashes) 2 42 Relocate Fixed Objects (Fatal Crashes Only) 2 40 Relocate Fixed Objects (Injury Crashes Only) 2 15 Researcher's Resulting Estimates: Relocate Fixed Objects (All Crashes) --- 25 Relocate Fixed Objects (Fatal Crashes Only) --- 40 Relocate Fixed Objects (Injury Crashes Only) --- 25
Benekohal and Hashmi (1990) evaluated crashes for a number of roadways where improvements (of a large variety) occurred. One general project conclusion was that the fixed objects most frequently involved in run-off-the-road crashes were guardrails, highway signs, fences, trees, and utility poles (82-percent to 84-percent of all objects struck). They encouraged utility pole relocation as a reasonable safety countermeasure. Zegeer and Cynecki (1984) evaluated utility pole countermeasure effectiveness conditions. They found that increasing lateral pole offset causes a reduction in utility pole crashes but may contribute to an increase in other run-off-road crashes (possibly because if the pole is relocated another object like a tree may be impacted). They found increasing lateral placement reduces run-off-road utility pole crash severity.
A study (Creasy and Agent, 1985) based on a combination of 42 literature reviews, 22 state surveys, and a before-after analysis, provided the subjective estimate that a 40-percent reduction should occur in fatal crashes due to the relocation of fixed objects. Similarly, a 15-percent reduction should occur in injury only crashes after relocation of fixed objects. A comprehensive study for the FHWA (Smith et. al., 1983) estimated percent reduction for several countermeasures. This study was based on improvements at hazardous conditions. The authors emphasize the percent crash reduction estimated are not directly applicable to moderately or mildly hazardous locations. Locations where fixed objects were either removed or relocated resulted in the estimated values shown below.

Countermeasure Handbook 65
Table A-45. FHWA Fixed Object Relocation Crash Reduction Estimates
Mean Percent Crash Reduction Alignment Changes
Total Fatal Injury Property Damage Only
Remove / Relocate Fixed Objects
60 65 60 55
d. Remove Fixed Object
The literature regarding the removal of fixed objects is based upon both subjective assessment and analytical evaluation. Based on the combined estimates resulting from a survey of 43 states plus the District of Columbia and a comprehensive literature review, Kentucky researchers developed the following estimation of percent crash reduction for the removal of fixed objects (Agent et. al., 1996).
Table A-46. Kentucky Fixed Object Removal Crash Reduction Estimates
Category Number
of Estimates
Average Percent Crash
Reduction State Survey Estimates: Remove Fixed Objects (All Crashes) 15 32 Remove Fixed Objects (Fatal Crashes Only) 8 50 Remove Fixed Objects (Injury Crashes Only) 8 17 Remove Fixed Objects (Run-Off-Road Crashes Only) 2 55 Literature Review Estimates: Remove Fixed Objects (All Crashes) 10 22 Remove Fixed Objects (Fatal Crashes Only) 3 53 Remove Fixed Objects (Injury Crashes Only) 3 17 Researcher's Resulting Estimates: Remove Fixed Objects (All Crashes) --- 30 Remove Fixed Objects (Fatal Crashes Only) --- 50 Remove Fixed Objects (Injury Crashes Only) --- 30
Benekohal and Hashmi (1990) evaluated crashes for a number of roadways where improvements (of a large variety) occurred. One general research conclusion indicated that the fixed objects most frequently involved in run-off-the-road crashes were guardrails, highway signs, fences, trees, and utility poles (82-percent to 84-percent of all objects struck). They encouraged tree removal as a reasonable safety countermeasure. Zegeer and Cynecki (1984) evaluated utility pole countermeasure effectiveness conditions. They found that completely removing utility poles by placing utility lines underground effectively eliminates utility pole crashes, but may

Countermeasure Handbook 66
cause an increase in other run-off-road crashes (the vehicle hits another object). This countermeasure also reduces the average percent of injury and fatal crashes.
A study (Creasy and Agent, 1985) based on a combination of 42 literature reviews, 22 state surveys, and a before-after analysis, provided the subjective estimate that a 50-percent reduction should occur in fatal crashes due to the removal of fixed objects. Similarly, a 15-percent reduction should occur in injury only crashes after removal of fixed objects. A comprehensive study for the FHWA (Smith et. al., 1983) estimated percent reduction for several countermeasures. This study was based on improvements at hazardous conditions. The authors emphasize the percent crash reduction estimated are not directly applicable to moderately or mildly hazardous locations. Locations where fixed objects were either removed or relocated resulted in the following estimated values.
Table A-47. FHWA Fixed Object Removal Crash Reduction Estimates
Mean Percent Crash Reduction Alignment Changes
Total Fatal Injury Property Damage Only
Remove / Relocate Fixed Objects 60 65 60 55
One accident reduction factor study (SDDOT, 1998) evaluated sixty-two hazardous sites and attempted to quantify accident reduction factors (ARFs) for the sites. These ARFs were calculated by dividing the total number of crashes following an improvement project by the total number from previous years. A value greater than one, therefore, represents an increase in the number of crashes. Removal of a fixed object resulted in an ARF of zero (or a 100-percent crash reduction). It is important to note that of the sixty-two improvement sites, only one site involved removal of fixed objects so this ARF is from a single data point. A 1970’s study in Georgia (Wright & Mak, 1972) determined that the presence of fixed objects along the roadside has little effect on off-road accident experience. Off-road accident rates are not closely related to the presence of continuous roadside objects. Basically, this means that a person in no more likely to run off the road and crash at locations with roadside objects as at locations without objects.
e. Convert Object to Breakaway
The literature dealing with converting a roadside object to a breakaway type is very sparse. But the few studies that have dealt with this countermeasure have provided positive feedback on its effects on the severity of crashes. Based on the combined estimates resulting from a survey of 43 states and the District of Columbia and a comprehensive literature review, Kentucky researchers

Countermeasure Handbook 67
developed the following estimation of percent crash reduction for converting an object to a breakaway type. (Agent et. al., 1996).
Table A-48. Kentucky Breakaway Fixed Object Crash Reduction Estimates
Category -- Convert to Breakaway Number of Estimates
Average Percent Crash Reduction
State Survey Estimates: All Crashes 15 28 Fatal Crashes 4 60 Injury Crashes 4 30 Run-off-the-Road Crashes 2 45
Literature Review Estimates: All Crashes 11 52 Fatal Crashes 1 60 Injury Crashes 1 30
Researcher’s Resulting Estimates: All Crashes --- 5 Fatal Crashes --- 60 Injury Crashes --- 30
A comprehensive study for the FHWA (Smith et. al., 1983) estimated percent reduction for several countermeasures. This study was based on improvements at hazardous conditions. The authors emphasize the percent crash reductions estimated are not directly applicable to moderately or mildly hazardous locations. Locations where breakaway poles were installed resulted in the following estimated values.
Table A-49. FHWA Breakaway Utility Pole Crash Reduction Estimates
Mean Percent Crash Reduction Countermeasure Total Fatal Injury Property Damage
Only Install breakaway poles 0 60 20 -15
Creasy and Agent (1985) performed a study based on a combination of 42 literature reviews, 22 state surveys, and a before-after analysis. They provided a subjective estimate that a 60-percent reduction in fatal crashes and 30-percent reduction in injury crashes should occur due to the conversion of roadside signs to breakaway signs. Installation of breakaway utility poles results in reductions of 40- and 30-percent in fatal and injury related crashes. It is important to note, breakaway utility poles must be supported by adjacent rigid utility poles, so application of this strategy is not feasible systemically but rather individually.
Wattleworth et. al. (1988) developed accident reduction factors related to crash experience in Florida. The researchers performed before-after analysis of crash data from three years before and three years after implementation of the breakaway

Countermeasure Handbook 68
safety countermeasure. A 35-percent reduction in the number of total crashes was estimated due to conversion of an obstacle to breakaway.
f. Construct Traversable Drainage Structure
The literature regarding construction of a traversable drainage structure is limited. The primary reference for guidance in this type of countermeasure is the Roadside Design Guide (AASHTO, 1996); however, this is a manual that is a guideline and does not include assessment of different treatments. The "blending" of the slope of the drainage structure to the slope of the embankment assists in providing a traversable design. The picture shown below is from the Roadside Design Guide (AASHTO, 1996) and represents this traversable concept.
For large drainage structures, the drainage design often should include bars spaced across the opening. One of the purposes of these bars is to provide traversability for vehicle tires as they drive across the large opening to the drainage structure.

Countermeasure Handbook 69
E. LIGHTING
1. Add Street Lights to Road Segment
The literature regarding the addition of street lights favors placement of them to enhance safety. Many of the studies include subjective assessment, but there is also a strong literature base that includes quantified assessment in favor of street light placement. Based on the combined estimates resulting from a survey of 43 states plus the District of Columbia and a comprehensive literature review, Kentucky researchers developed the following estimation of percent crash reduction for the addition of street lights (Agent et. al., 1996).
Table A-50. Kentucky Addition of Street Light Crash Reduction Estimates
Category Number of Estimates
Average Percent Crash Reduction
State Survey Estimates: General Use (All Crashes) 6 25 New Roadway (All Crashes) 10 28 New Roadway (Night Crashes Only) 12 45 Literature Review Estimates: General Use (All Crashes) 5 10 New Roadway (All Crashes) 7 19 New Roadway (Night Crashes Only) 5 38 Researcher's Resulting Estimates: General Use (All Crashes) --- 25 General Use (Night Crashes Only) --- 50 Roadway Segment (All Crashes) --- 25 Roadway Segment (Night Crashes Only) --- 45
A study (Creasy and Agent, 1985) based on a combination of 42 literature reviews, 22 state surveys, and a before-after analysis, provided the subjective estimate that a 25-percent reduction should occur in total crashes due to the addition of street lights. For nighttime crashes only, a reduction of 50-percent should be expected. An Indiana study (Ermer et. al., 1992) estimated crash reduction factors based on a before-after study and combined with historic analyses in the state of Indiana. The installation of street lights rated an estimated 37-percent reduction in total crashes. One accident reduction factor study (SDDOT, 1998) evaluated sixty-two hazardous sites and attempted to quantify accident reduction factors (ARFs) for the sites. These ARFs were calculated by dividing the total number of crashes following an improvement project by the total number from previous years. A value greater than one, therefore, represents an increase in the number of crashes. Addition of roadway lighting resulted in an ARF of 0.83 (or a decrease in crashes).

Countermeasure Handbook 70
A comprehensive study for the FHWA (Smith et. al., 1983) estimated percent reduction for several countermeasures. This study was based on improvements at hazardous conditions. The authors emphasize the percent crash reduction estimated are not directly applicable to moderately or mildly hazardous locations. Locations where lighting was added adjacent to the road resulted in the estimated values shown below.
Table A-51. FHWA Street Lighting Crash Reduction Estimates
Mean Percent Crash Reduction Alignment Changes
Total Fatal Injury Property Damage Only
Add Lighting in Horizontal Curve, at an Intersection, or at a Bridge
10 15 15 10
Add Lighting at Tangent Section --- 10 5 5
2. Add Lighting to Intersection Wortman et. al. (1972) developed a methodology that measures the effects of illumination of rural at-grade intersections. The researchers determined that though the severity of crashes is not directly related to illumination, illumination does reduce the frequency of nighttime crashes. Preston and Schoenecker (1999) performed an extensive literature survey and estimated installation of intersection lighting resulted in a 25- to 50-percent reduction in the night time crash to total crash ratio. They further conducted a system-wide comparative crash analysis of 3,400 rural intersections along the Minnesota highway system and a before-after analysis of 12 intersections. The system-wide comparative analysis showed that the nighttime crash rate for intersections with and without street lighting was 0.47 and 0.63 respectively. This represents a 25-percent lower nighttime crash rate at rural intersections with street lighting. From the before-after study, the researchers determined where street lighting was installed they experienced an overall decrease in the nighttime crashes of approximately 40-percent. Walker and Roberts (1976) performed a before-after study for three years immediately before and after lighting at 47 at-grade rural intersections. The results showed a 49-percent overall reduction in nighttime crashes.
3. Upgrade Street Lighting for Segment or Intersection The literature regarding the improvement or upgrade of street lights is sparse, but it favors this countermeasure strategy to enhance safety. Based on the combined estimates resulting from a survey of 43 states plus the District of Columbia and a comprehensive literature review, Kentucky researchers presented

Countermeasure Handbook 71
the following estimation of percent crash reduction for the upgrade of street lights (Agent et. al., 1996).
Table A-52. Kentucky Upgrade of Street Lights Crash Reduction Estimates
Category Number of Estimates
Average Percent Crash Reduction
State Survey Estimates: General Use (All Crashes) 6 25 Upgrade Roadway (Night Crashes Only) 2 42 Literature Review Estimates: General Use (All Crashes) 5 10 Researcher's Resulting Estimates: General Use (All Crashes) --- 25 General Use (Night Crashes Only) --- 50 Roadway Segment (All Crashes) --- 25 Roadway Segment (Night Crashes Only) --- 45
An Indiana study (Ermer et. al., 1992) estimated crash reduction factors based on a before-after study and combined with historic analyses in the state of Indiana. The modernization of existing lighting rated an estimated 25-percent reduction in total crashes.
F. REGULATIONS
1. Enforce Speed Limits
The literature dealing with the effect of police enforcement of speed limits on the number of crashes is limited. Dart (1977) used time series plots of speed, volume and crash data for North Carolina, Mississippi and Louisiana for the period of 1973 and 1974 to evaluate the probable role of police enforcement of speed limits on the number of crashes. The energy crisis in the fall of 1973 had brought about a reduction in the average speed to about 55 mph, which was assumed to be a fuel efficient speed. Though the speeds returned back to pre-crisis levels within 2 years, they were more uniform. The researcher identified strong indications that the increased enforcement levels of 1974 to 1976 are responsible for maintaining the uniform and safer speed levels. For example, Louisiana data for 1974 and 1975 (compared with data from 1971 and 1972) showed not only significantly fewer fatalities on rural highways, but also large reductions in the percentage of all rural crashes and of rural fatal crashes for which excessive speed was cited as a contributing factor.

Countermeasure Handbook 72
IV. APPENDIX B. REFERENCES Agent, K. R., N. Stamatiadis, and S. Jones (1996). "Development of Accident Reduction
Factors," Report No. KTC-96-13, NTIS Reference PB97-159099, Kentucky Transportation Center, KY.
American Association of State Highway and Transportation Officials (1996). Roadside
Design Guide, Washington, D.C. Bali, S., R. Potts, J. A. Fee, J. I. Taylor, and J. Glennon (1978). "Cost-Effectiveness and
Safety of Alternative Roadway Delineation Treatment for Rural Two-Lane Highways," Report No. FHWA-RD-78-51, Washington, D.C.
Barbaresso, J. D., and B. O. Bair (1983). "Accident Implications of Shoulder Width on
Two-lane Roadways." TRB, National Research Council, Washington, D.C., Transportation Research Record No. 923, pp. 90-97.
Benekohal, R. F., and A. M. Hashmi (1990). "Accident Savings from Roadside
Improvements on Two-Lane Rural Highways." Final Report for Illinois Department of Transportation, Report No. FHWA/IL/RC-009, Illinois Universities Transportation Research Consortium, Chicago, IL.
Boyce, D. E., J. J. Hochmuth, C. Meneguzzer, and R. G. Mortimer (1989). "Cost-
Effective 3R Roadside Safety Policy for Two-Lane Rural Highways." Final Report for Illinois Department of Transportation, Report No. FHWA/IL/RC-003, Illinois Universities Transportation Research Consortium, Chicago, IL.
Chowdhury, M. A., D. L. Warren, H. Bissell, and S. Taori (1998). "Are the Criteria for
Setting Advisory Speeds on Curves Still Relevant?" ITE Journal, Vol. 28, No. 2, pp. 23-45.
Council, F. M., and D. W. Harwood (1999). "Accident Modification Factors for Use in
the Prediction of Safety on Rural Two-Lane Highways." Presented at Traffic Safety on Two Continents Conference, Sweden.
Creasey, T., and K. R. Agent (1985). "Development of Accident Reduction Factors."
Report No. UKTRP-85-6, Kentucky Transportation Research Program, KY. Dart, O. K. (1977). “Effects of the 88.5-km/h (55-mph) Speed Limit and its
Enforcement on Traffic Speeds and Accidents.” TRB, National Research Council, Washington, D.C., Transportation Research Record No. 643, pp. 23-32.
Dart, O. K., and L. Mann (1970). "Relationship of Rural Highway Geometry to Accident
Rates in Louisiana." TRB, National Research Council, Washington, D.C., Highway Research Record No. 312, pp. 1-16.

Countermeasure Handbook 73
Ermer, D. J., J. D. Fricker, and K. C. Sinha (1992). "Accident Reduction Factors for
Indiania." Final Report for Indiana Department of Transportation, Report No. FHWA/IN/JHRP-91/11, School of Civil Engineering, Purdue University, West Lafayette, IN.
Federal Highway Administration [FHWA] (1982). “Synthesis of Safety Research
Related to Traffic Control and Roadway Elements.” Report No. FHWA-TS-82-232, Washington, D.C.
Fink, K. L., and R. A. Krammes (1995). "Tangent Length and Sight Distance Effects on
Accident Rates at Horizontal Curves on Rural Two-Lane Highways." TRB, National Research Council, Washington, D.C., Transportation Research Record No. 1500, pp. 162-168.
Griffin, L.I. and K. K. Mak (1988). “Benefits to be Achieved from Widening Rural, Two-
Lane, Farm-to-Market Roads in Texas”, Transportation Research Board, 67th Annual Meeting, Washington D.C.
Hadi, M. A., J. Aruldhas, L.F. Chow, and J. A. Wattleworth (1995a). "Estimating Safety
Effects of Cross-Section Design for Various Highway Types Using Negative Binomial Regression." TRB, National Research Council, Washington, D.C., Transportation Research Record No. 1500, pp. 169-177.
Hadi, M. A., J. A. Wattleworth, J. Aruldhas, L. F. Chow, and C. T. Gan (1995b).
"Relationship of Highway Design Standards to Accidents, Injuries and Fatalities." Final Report of the Florida Department of Transportation, Report No. FL/DOT 99700-7576-119, Transportation Research Center, University of Florida, Gainesville, FL.
Harwood, D. W., F. M. Council, E. Hauer, W. E. Hughes, and A. Vogt (2000).
"Prediction of the Expected Safety Performance of Rural Two-Lane Highways." Report No. FHWA-RD-99-207. Federal Highway Administration, McLean, VA.
Ivan, J. N., and P. J. O’Mara (1997), “Prediction of Traffic Accident Rates using Poisson
Regression”, Paper No. 970861, TRB Preprint 1997. Jennings, B. E., and M. J. Demetsky (1985). "Evaluation of Curve Delineation Signs."
TRB, National Research Council, Washington, D.C., Transportation Research Record No. 1010, pp. 53-61.
Krammes, R. A., R. Q. Brackett, M. A. Shafer, J. L. Ottesen, I. B. Anderson, K. L. Fink,
K. M. Collins, O. J. Pendleton, and C. J. Messer (1995). "Horizontal Alignment Design Consistency for Rural Two-Lane Highways." Final Report for the U.S. Department of Transportation, Federal Highway Administration. Report No. FHWA-RD-94-034, Washington, D.C.

Countermeasure Handbook 74
Krammes, R. A., K. D. Tyer, D. R. Middleton, and S. A. Feldman (1990). "An
Alternative to Post-Mounted Delineators at Horizontal curves on Two-Lane Highways." Report no. FHWA/TX-90/1145-1F (PB91-164491). Texas Transportation Institute, College Station, TX.
Manual of Transportation Engineering Studies [MTES] (1994), 1st Edition, Institute of
Transportation Engineers, Prentice-Hall, Englewood Cliff, NJ. Manual of Uniform Traffic Control Devices [MUTCD] (2000), U. S. Department of
Transportation, Federal Highway Administration, Washington, DC. Miaou, S. P., P. S. Hu, T. Wright, S. C. Davis, and A. K. Rathi (1993). "Development of
Relationship between Truck Accidents and Geometric Design: Phase I." Final Report for Office of Safety and Traffic Operations, Federal Highway Administration. Report No. FHWA-RD-91-124, Washington, D.C.
Milton, J. C., and F. L. Mannering (1996). "The Relationship between Highway
Geometrics, Traffic Related Elements, and Motor Vehicle Accidents." Final Report for the Washington State Department of Transportation. Report No. WA-RD 403.1, Olympia, Washington.
Minnesota Department of Transportation [MinDOT] (1980). "Evaluation of Accidents
on Two-Lane, Rural Trunk Highways." Engineering Standards Internal Report, pp. 1-10.
Mohamedshah, Y. M., J. F. Paniati, and A. G. Hobeika (1993). "Truck Accident Models
for Interstates and Two-Lane Rural Roads." TRB, National Research Council, Washington, D.C., Transportation Research Record No. 1407, pp. 35-41.
Morgan, R. L., and D. E. McAuliffe (1997). “Effectiveness of Shoulder Rumble Strips:
A Survey of Current Practice.” Special Report 127 (FHWA/NY/SR-97/127), Engineering Research and Development Bureau, New York State Department of Transportation.
Preston, H., and T. Schoenecker (1999). “Safety Impact of Street Lighting at Isolated
Rural Intersections.” Report No. MN/RC-1999-17. Minnesota Department of Transportation, St Paul, Minnesota.
Rutley, K. S. (1972). “Advisory Speed Signs for Bends.” Transport and Road Research
Laboratory (TRRL Report LR 461). Report No. PB-211-850. Crowthorne, Berkshire.
Schoppert, D.W. (1957). “Predicting Traffic Accidents from Roadway Elements of Rural
Two-Lane Highways with Gravel Shoulders”, HRB Bulletin 158, pp. 4-18.

Countermeasure Handbook 75
Smith, S. A., J. E. Purdy, H. W. McGee, D. W. Harwood, and J. C. Glennon (1983). "Identification, Quantification and Structuring of Two-Lane Rura Highway Safety Problems and Solutions, Vol. I - Technical Report." Final Report for the U.S. Department of Transportation, Federal Highway Administration. Report No. FHWA/RD-83/021, Washington, D.C.
South Dakota Department of Transportation [SDDOT] (1998). “Development of South
Dakota Accident Reduction Factors.” Study SD98-13, Final Report. Prepared by the Office of Research, South Dakota Department of Transportation, S.D.
Stimpson, W. A., H. W. McGee, W. K. Kittelson, and R. H. Ruddy (1977). “Field
Evaluation of Selected Delineation Treatments on Two-Lane Rural Highway,” Report No. FHWA-RD-77-118. Prepared for the Federal Highway Administration, Washington, DC.
Vogt, A., and J. Bared (1998). “Accident Models for Two-Lane Rural Segments and
Intersections.” TRB, National Research Council, Washington, D.C., Transportation Research Record No. 1635, pp. 18-29
Walker, F. W., and S. E. Roberts (1976). “Influence of Lighting on Accident Frequency
at Highway Intersections.” TRB, National Research Council, Washington, D.C., Transportation Research Record No. 562, pp. 73-78.
Wattleworth, J. A., R. J. Atherly, and P. Hsu (1988). “Accident Reduction Factors for
Use in Calculating Benefit/Cost.” Report No. PB91-197020, Department of Civil Engineering, College of Engineering, University of Florida.
Wortman, R.H., M. E. Lipinski, L. B. Fricke, W. P. Grimwade, and A. F. Kyle (1972).
“Development of Warrants for Rural At-Grade Intersection Illumination.” Report No. PB-218-057. Department of Civil Engineering, University of Illinois, Urbana, Illinois.
Wright, P. H., J. W. Hall, and P. L. Zador (1983). "Low-Cost Countermeasures for
Ameliorating Run-Off-the-Road Crashes." TRB, National Research Council, Washington, D.C., Transportation Research Record No. 926, pp. 1-7.
Wright, P. H., and K. K. Mak (1972). “Relationships Between Off-Road Fixed-Object
Accident Rates and Roadway Elements of Urban Highways.” Final Report DOT/HS-800 793. National Highway Traffic Safety Administration, Washington, D.C.
Zador, P., H. S. Stein, P. Wright, and J. Hall (1987). "Effects of Chevrons, Post-Mounted
Delineators, and Raised Pavement Markers on Driver Behavior at Roadway Curves." TRB, National Research Council, Washington, D.C., Transportation Research Record No. 1114, pp. 1-10.
Countermeasure Handbook 76
Zegeer, C. V., and M. J. Cynecki (1984). “Determination of Cost-Effective Roadway Treatments for Utility Pole Accidents.” TRB, National Research Council, Washington, D.C., Transportation Research Record No. 970, pp. 52-64.
Zegeer, C.V. and J. A. Deacon (1987). “Relationships between Safety and Key Highway
Features.” State of the Art Report 6, TRB, National Research Council, Washington, D.C., pp. 1-21.
Zegeer, C. V., J. Hummer, D. Reinfurt, L. Herf, and W. Hunter (1987). “Safety Effects
of Cross-Section Design for Two-Lane Roads.” Final Report FHWA-RD-87/008. Prepared for the Federal Highway Administration and the Transportation Research Board National Research Council, Washington, D.C.
Zegeer, C. V., D. W. Reinfurt, W. W. Hunter, J. Hummer, R. Stewart, and L. Herf
(1988). “Accident Effects of Sideslope and Other Roadside Features on Two-Lane Roads.” TRB, National Research Council, Washington, D.C., Transportation Research Record No. 1195, pp. 33-47.
Zegeer, C., J. Steweart, D. Reinfurt, F. Council, T. Neuman, E. Hamilton, T. Miller, and
W. Hunter (1991). “Cost-Effective Geometric Improvements for Safety Upgrading of Horizontal Curves.” Final Report No. FHWA-RD-90-021. Prepared for the Federal Highway Administration, MeLean, VA.