final report - jicano. eid jr 10-125 jica preparatory survey on greater cairo metro line no.4 in the...
TRANSCRIPT

No.
E I D
J R
1 0 - 1 2 5
JICA Preparatory SurveyOn
Greater Cairo Metro Line No.4In
the Arab Republic of Egypt
FINAL REPORT
Volume 2(Feasibility Study Report 2)
JUNE 2010
JAPAN INTERNATIONAL COOPERATION AGENCY
NIPPON KOEI CO., LTD.JAPAN RAILWAY TECHNICAL SERVICE
NIPPON CIVIC CONSULTING ENGINEERS CO., LTD
Ministry of Transport,National Authority for TunnelsThe Arab Republic of Egypt
JICA
Prep
aratory S
urvey On G
reater Cairo
Metro
Line No
.4In the A
rab R
epub
lic of E
gyp
tJU
NE
2010FIN
AL R
EP
OR
TV
olum
e 2(Feasib
ility Stud
y Rep
ort 2)

Exchange Rates
1.00 LE = JPY17.28 USD1.00 = JPY95.25 USD1.00 = 5.512 LE
JICA Preparatory Survey on
Greater Cairo Metro Line No.4 in
the Arab Republic of Egypt
CONTENTS OF FINAL REPORT
Volume 1 : Feasibility Study Report 1
Data Collection, Diagnosis of the Existing Public Transport System and Urban Development Hypothesis
Volume 2 : Feasibility Study Report 2
New Transportation Study, Data Analysis and Alternative Corridors for Greater Cairo Metro Line No. 4
Volume 3 : Feasibility Study Report 3/4
Preliminary design on Greater Cairo Metro Phase 1 and Economic Financial Analysis
Volume 4 : Drawings

Preface
In response to the request from the government of the Arab Republic of Egypt, the Government of
Japan decided to conduct “JICA Preparatory Survey on Greater Cairo Metro Line No.4”, and entrusted
the study and to the Japan International Cooperation Agency (JICA).
JICA selected and dispatched a study team consisted of Nippon Koei Co. Ltd., Japan Railway
Technical Service (JARTS) and Nippon Civic Consulting Engineer Co. Ltd, headed by Mr. Hiroshi
Izawa, between February 2009 to May 2010.
The team conducted field surveys at the study area and held discussions with the officials
concerned of the Government of the Arab Republic of Egypt. Having completed them, now the team
prepared this final report.
I hope that this report will greatly contribute to the construction and operation of the Metro Line
No.4 for the urban transportation in Greater Cairo, as well as to enhancement of friendly relationship
between our two countries.
Finally, I wish to express my sincere appreciation to the officials concerned of the Government of
the Arab Republic of Egypt for their close cooperation to the project.
June 2010
Kiyoshi Kodera
Vice President
Japan International Cooperation Agency

LOCATION MAP

TABLE OF CONTENTS

JICA PREPARATORY SURVEY ON GREATER CAIRO METRO LINE NO.4
Final Report - Volume 2 (i)
JICA PREPARATORY SURVEY
ON GREATER CAIRO METRO LINE NO.4
IN THE ARAB REPUBLIC OF EGYPT
Final Report
Volume 2
New Transportation Study, Data Analysis and Alternative Corridors for Greater Cairo Metro Line No. 4
PREFACE LOCATION MAP TABLE OF CONTENTS LIST OF TABLES AND FIGURES LIST OF APPENDIXES GLOSSARY OF ABBREVIATIONS AND MEASURING UNITS EXECUTIVE SUMMARY OF VOLUME 2
TABLE OF CONTENTS CHAPTER 1 Introduction.................................................................................................. 1-1 1.1 Background of the Study ................................................................................................. 1-1 1.2 Objective of the Study ..................................................................................................... 1-2 1.3 Study Area and Administrative Setting ............................................................................ 1-3 CHAPTER 2 Transportation Study .................................................................................. 2-1 2.1 Transport Survey............................................................................................................. 2-1 2.1.1 Introduction............................................................................................................... 2-1 2.1.2 Summary of Previous Survey ................................................................................... 2-1 2.1.3 Components and Purpose of Transport Survey ....................................................... 2-7 2.1.4 Link Traffic Count Survey ......................................................................................... 2-7
(1) Survey Locations...................................................................................................... 2-7 (2) Vehicle Types......................................................................................................... 2-10 (3) Traffic Count Period ............................................................................................... 2-10
2.1.5 Screen Line Traffic Count Survey........................................................................... 2-10 (1) Screen Line Locations............................................................................................ 2-10 (2) Screen Line Traffic Count Periods.......................................................................... 2-12
2.1.6 Traffic Count Data Analysis .................................................................................... 2-13 (1) Ring Road at Maadi Bridge (SL1)........................................................................... 2-13 (2) Abbas Bridge (SL2) ................................................................................................ 2-15
2.1.7 Interview Survey..................................................................................................... 2-17 (1) Sample Size and Used Forms................................................................................ 2-17 (2) Survey Locations and Dates................................................................................... 2-17 (3) Training .................................................................................................................. 2-22 (4) Data Processing ..................................................................................................... 2-22 (5) Data Analysis ......................................................................................................... 2-24
2.1.8 Interview Survey for Tourist.................................................................................... 2-31 (1) Survey Location...................................................................................................... 2-31 (2) Sample Size and Survey Form............................................................................... 2-31
2.2 Urbanization and Socio-Economic Development Trends within the Study Area until 2050...................................................................................................................................... 2-32
2.2.1 Future Patterns of Urbanization.............................................................................. 2-32 2.2.2 Population Projections............................................................................................ 2-34

JICA PREPARATORY SURVEY ON GREATER CAIRO METRO LINE NO.4
Final Report - Volume 2 (ii)
(1) Population Projection for Metro Line 4 Study Area................................................. 2-34 (2) Population Projections for Study Sectors ............................................................... 2-36
2.2.3 Employment Projections......................................................................................... 2-40 (1) Employment Projection for Metro Line 4 Study Area.............................................. 2-40 (2) Employment Projections for Study Sectors ............................................................ 2-42
2.2.4 Projected Student Enrolments................................................................................ 2-45 (1) Student Enrolment Projections for the Study Area ................................................. 2-45 (2) Student Enrolment Projections for Study Sectors................................................... 2-46
2.2.5 Car Ownership Projections..................................................................................... 2-49 2.2.6 Summarized Transport Planning Indicators ........................................................... 2-51
2.3 Analysis of Transport Demand and Services................................................................. 2-52 2.3.1 Metro Network Service in Greater Cairo Region .................................................... 2-52 2.3.2 Trend of Metro Demand ......................................................................................... 2-52 2.3.3 Preferences and Choices of Cairo Metro Users ..................................................... 2-54
(1) Socio-economic Characteristics of Metro Line 2 users........................................... 2-55 (2) Trip Characteristics ................................................................................................ 2-55 (3) Preferences of Metro Line users ............................................................................ 2-56
2.3.4 Egyptian National Railways (ENR) Suburban Railway Service and Demand......... 2-56 2.3.5 Bus Service ............................................................................................................ 2-58 2.3.6 Existing Road Network in Greater Cairo Region .................................................... 2-59 2.3.7 Existing Traffic Demand on Regional Roads.......................................................... 2-59
2.4 Description of Transport Demand Forecasting Model ................................................... 2-60 2.4.1 Methodology........................................................................................................... 2-60
(1) Transportation Model Structure .............................................................................. 2-60 (2) Zone System in Study Area.................................................................................... 2-62 (3) Modelling and Forecasting Tools............................................................................ 2-62
2.4.2 Trip Generation and Attraction Models................................................................... 2-63 (1) Modelling Trip Generation and Attraction by Zone ................................................. 2-63 (2) Verification of Trip Generation and Attraction Models ............................................ 2-63
2.4.3 Trip Distribution Model ........................................................................................... 2-64 (1) Modelling Trip Distribution ...................................................................................... 2-64 (2) Validation of Trip Distribution Model ....................................................................... 2-64
2.4.4 Modal Choice Model............................................................................................... 2-65 (1) Methodology of modelling modal split among private mode, public mode
and metro ............................................................................................................... 2-65 (2) Modal Choice Model for Private Car Share ............................................................ 2-66 (3) Modal Choice Model for Metro Mode Share ........................................................... 2-68
2.4.5 Trip Assignment Model........................................................................................... 2-70 2.5 Estimation of Present and Future Transportation Demand Matrix................................. 2-71 2.5.1 Trip generation and attraction in the present and future......................................... 2-72 2.5.2 Trip Distribution (OD Matrix) by All Transportation Mode ....................................... 2-72 2.5.3 Present and Future Modal Split .............................................................................. 2-76
(1) Modal Share between Car, Bus and Rail Mode...................................................... 2-76 (2) Rail Mode Trips by Sector Zone ............................................................................. 2-76 (3) Rail Mode OD Matrix by Sector Zone..................................................................... 2-77
2.6 Estimation of Present and Future Metro Passengers .................................................... 2-83 2.6.1 Metro Passengers by Line No. ............................................................................... 2-83 2.6.2 Station and Section Passengers for Metro Line 4 Phase 1 .................................... 2-84
2.7 Conceptual Analysis of Bus Feeder Service and Transit Facility Plan........................... 2-86 2.7.1 Modal Choice Decisions for Feeder Transport ....................................................... 2-86 2.7.2 Overall Conceptual Design of Modal Interchange Facilities ................................... 2-87
(1) Modal Interchanges for Terminal Stations .............................................................. 2-87 (2) Pick-up and Set-down Facilities for Other Stations ................................................ 2-90
2.7.3 Methods and Approach for Determination of Feeder Transport Requirements ......................................................................................................... 2-91
2.7.4 Institutional Changes Needed for Better Integration of Metro and Feeder Transport ................................................................................................................ 2-96

JICA PREPARATORY SURVEY ON GREATER CAIRO METRO LINE NO.4
Final Report - Volume 2 (iii)
CHAPTER 3 Track Alignment study for phase 1 section .............................................. 3-1 3.1 Basic Concept of Route Selection ................................................................................... 3-1 3.2 Basic Design Parameter Related with Route Selection ................................................... 3-1 3.3 El Malek El Saleh to El Remayah Square ....................................................................... 3-2 3.3.1 Basic Policy for Route Selection and Station Location ............................................. 3-2 3.3.2 Route Selection ........................................................................................................ 3-3
(1) Existing Structures and Hazards on the Route......................................................... 3-3 (2) Route Comparison Between PYRAMIDS Road and King Faisal Road .................... 3-3 (3) Case Study of Avoiding Giza Flyover Route........................................................... 3-10 (4) The Intersection of Pyramids Road with Alexandria Desert Road .......................... 3-14 (5) Proposed Route ..................................................................................................... 3-14
3.3.3 Station Locations.................................................................................................... 3-18 (1) M4W-Sta.1 (El Malek El Saleh Station) .................................................................. 3-18 (2) M4W-Sta.2 (El Rauda Station) ............................................................................... 3-19 (3) M4W-Sta.3 (El Nile Station).................................................................................... 3-19 (4) M4W-Sta.4 (El Giza Station) .................................................................................. 3-19 (5) M4W-Sta.5 to M4W- Sta.9...................................................................................... 3-19 (6) M4W-Sta.10 ........................................................................................................... 3-19 (7) M4W-Sta.11 ........................................................................................................... 3-19 (8) M4W-Sta.12 (El Remayah Square) ........................................................................ 3-20
3.3.4 Type of Structures .................................................................................................. 3-20 3.4 El Remayah Square to Depot/Workshop....................................................................... 3-21 3.4.1 Location of Depot/Workshop .................................................................................. 3-21 3.4.2 Alignment from El Remayah Square to Depot/Workshop....................................... 3-24
3.5 List of Hard Points ......................................................................................................... 3-24 CHAPTER 4 Route Selection for Phase 2 Section ......................................................... 4-1 4.1 Transportation Demand................................................................................................... 4-1 4.1.1 Population by the Distance From/To the Stations .................................................... 4-1 4.1.2 Future Land Use by the Distance From/To the Stations........................................... 4-2 4.1.3 Potential Metro Passenger Demand in the Future.................................................... 4-2 4.1.4 Findings from the Viewpoint of Demand Forecasting ............................................... 4-3
4.2 Routes Setting of Alternative Routes............................................................................... 4-4 4.2.1 Alternative Route 1: Northern Route Proposed by CREATS Report (El
Malek El Saleh – El Sawaha Square - Ring Road Exit No. 18) ................................ 4-4 4.2.2 Alternative Route 2: Eastern Route Proposed by SYSTRA Study (El
Malek El Saleh - Nasr City - Ring Road) .................................................................. 4-4 4.3 Construction Hard Points................................................................................................. 4-6 4.3.1 Identified the Hard Points in Each Alternative .......................................................... 4-6
(1) Alternative Route 1: Northern Route ........................................................................ 4-6 (2) Alternative 2: Eastern Route................................................................................... 4-12
4.4 Construction Methodology............................................................................................. 4-12 4.4.1 Structure Selection ................................................................................................. 4-12
(1) Northern Route....................................................................................................... 4-13 (2) Eastern Route ........................................................................................................ 4-13
4.4.2 Methodology of Station Construction...................................................................... 4-14 (1) Standard Station..................................................................................................... 4-15 (2) Station with the Spine Wastewater Tunnel (SWWT) .............................................. 4-18 (3) Station No. 8 under an Existing Railway (Ghamrah) .............................................. 4-20
4.4.3 Tunnel Construction Methodology.......................................................................... 4-24 4.4.4 Use of the Two Liquid Type Backfill Material for the Tail Void................................ 4-27 4.4.5 Soil Improvement from the Cutting Face and Under the Azhar Road Tunnel
and Metro Line 3 Tunnel ........................................................................................ 4-28 4.5 Construction Schedule .................................................................................................. 4-30 4.5.1 Study Condition ...................................................................................................... 4-30 4.5.2 Schedule ................................................................................................................ 4-30

JICA PREPARATORY SURVEY ON GREATER CAIRO METRO LINE NO.4
Final Report - Volume 2 (iv)
4.6 Construction Cost .......................................................................................................... 4-33 4.7 Environmental, Social and Archaeological Aspects....................................................... 4-35 4.7.1 Methodology of Comparison................................................................................... 4-35 4.7.2 Comparison Results and Key Notes....................................................................... 4-35
4.8 Comparison Results by Multi-Criteria Analysis and Recommendation .......................... 4-38 4.8.1 Multi-Criteria Analysis (MCA) ................................................................................. 4-38
(1) The Purpose and Methodology of MCA ................................................................. 4-38 (2) Summarized Condition of Two Alternative Routes ................................................. 4-38 (3) Analysis of Two Alternative Routes ........................................................................ 4-41
4.8.2 Recommendation ................................................................................................... 4-44

JICA PREPARATORY SURVEY ON GREATER CAIRO METRO LINE NO.4
Final Report - Volume 2 (v)
LIST OF TABLES AND FIGURES
Table 2-1 Summary of Previous Survey............................................................................ 2-1 Table 2-2 Previous Traffic Survey Data............................................................................. 2-5 Table 2-3 List of Link Traffic Count Survey Locations along Pyramids Road .................... 2-8 Table 2-4 List of Link Traffic Count Survey Locations along Port-Said Street ................... 2-8 Table 2-5 List of Screen Line Survey Locations, Survey Day and Dates ........................ 2-12 Table 2-6 Survey Day and Date for Each Interview Survey Location.............................. 2-22 Table 2-7 Comparison between the Numbers of the Total Interviewed Persons
Before and After Data Checking...................................................................... 2-23 Table 2-8 Distribution of the Total Number of Interviews Among Different
Interview Locations ......................................................................................... 2-23 Table 2-9 Population Growth Forecast for Study Area (SDMP Study) ............................ 2-35 Table 2-10 Feasibility Study Population Forecast for Study Area ..................................... 2-36 Table 2-11 Population Projection for NUCs to be Developed After 2027 .......................... 2-38 Table 2-12 Population Forecast for Greater Cairo by Study Sector, 2007-2050 ............... 2-39 Table 2-13 Summary of Forecast Population Growth Rates, by Study Sector .................. 2-39 Table 2-14 Land Area and Population Density in the Study Area, 2009-2050 .................. 2-40 Table 2-15 SDMP Employment Growth Forecast for the Study Area................................ 2-41 Table 2-16 Feasibility Study Employment Forecast for the Study Area............................. 2-41 Table 2-17 Total Employment in Secondary and Tertiary Industries by Type of
Urban Area, 2006-2050................................................................................... 2-43 Table 2-18 Population Projection for NUCs to be Developed after 2027........................... 2-44 Table 2-19 Secondary and Tertiary Industry Employment Forecast by Study Sector
........................................................................................................................ 2-44 Table 2-20 Summary of Forecast Employment Growth Rates by Study Sector ................ 2-45 Table 2-21 SDMP student enrolment forecast for the study area...................................... 2-46 Table 2-22 Feasibility Study Student Enrolments Forecast for the Study Area ................. 2-46 Table 2-23 Total Student Enrolments by Type of Urban Area, 2006-2050........................ 2-47 Table 2-24 Student Enrolment Projection for NUCs to be Developed After 2027 ............. 2-48 Table 2-25 Student Enrolment Forecast by Study Sector ................................................. 2-48 Table 2-26 Summary of Forecasted Student Enrolment Growth Rates by Study
Sector.............................................................................................................. 2-49 Table 2-27 Analysis of Car Ownership in Three Governorate Against GDRP growth
........................................................................................................................ 2-50 Table 2-28 Car Ownership Forecast (Three Governorates) .............................................. 2-50 Table 2-29 Car Ownership Rates vs. GDP Per Capita (USD), Countries in Western
Europe............................................................................................................. 2-51 Table 2-30 Socio-economic Indicators in the Study Area.................................................. 2-51 Table 2-31 Metro Line Operating Data for Cairo Metro Organization (CMO) .................... 2-53 Table 2-32 Passenger Volume/Day at Each Metro Line 1 Station .................................... 2-53 Table 2-33 Passenger Volume/Day at Each Metro Line 2 Station .................................... 2-54 Table 2-34 Number of Passenger and Suburban Trains in the Greater Cairo Area .......... 2-56 Table 2-35 Number of Passengers per day on Each Line in 2005/2006 ........................... 2-57 Table 2-36 Estimated Number of Buses in the Fleet ......................................................... 2-58 Table 2-37 Estimated Passenger Transport Share ........................................................... 2-58 Table 2-38 ADT on the Main Road Network...................................................................... 2-60 Table 2-39 ADT on Major Arterial Highways ..................................................................... 2-60 Table 2-40 Calibrated Parameters of Trip Generation and Attraction Models ................... 2-63 Table 2-41 Parameters of Trip Distribution Model ............................................................. 2-64 Table 2-42 Trend and Estimation of Private Mode Share Against Car Ownership
Rate ................................................................................................................ 2-66 Table 2-43 Private Car Modal Share Model in This Study................................................. 2-67 Table 2-44 Assumption of Travel Time by Mode for the Modelling Period ........................ 2-69 Table 2-45 Model Calibration Results ............................................................................... 2-70 Table 2-46 Trip generation and attraction (unit: thousand trips per day) ........................... 2-72 Table 2-47 All Mode Origin and Destination Matrix by Sector Zone in Year 2008

JICA PREPARATORY SURVEY ON GREATER CAIRO METRO LINE NO.4
Final Report - Volume 2 (vi)
(unit: thousand trip per day) ............................................................................ 2-73 Table 2-48 All Mode Origin and Destination Matrix by Sector Zone in Year 2027
(unit: thousand trip per day) ............................................................................ 2-74 Table 2-49 All Mode Origin and Destination Matrix by Sector Zone in Year 2050
(unit: thousand trip per day) ............................................................................ 2-75 Table 2-50 Result of Modal Share Estimation ................................................................... 2-76 Table 2-51 Rail Mode Trip by Sector Zone, (unit: thousand trips per day) ........................ 2-77 Table 2-52 Rail Mode Origin and Destination Matrix by Sector Zone in Year 2008
(unit: thousand trips per day)........................................................................... 2-78 Table 2-53 Rail Mode Origin and Destination Matrix by Sector Zone in Year 2027
Alternative 1 North Extension (unit: thousand trips per day)......................... 2-79 Table 2-54 Rail Mode Origin and Destination Matrix by Sector Zone in Year 2027
Alternative 2 East Extension (unit: thousand trips per day) ............................. 2-80 Table 2-55 Rail Mode Origin and Destination Matrix by Sector Zone in Year 2050
Alternative 1 North Extension (unit: thousand trips per day) ........................... 2-81 Table 2-56 Rail Mode Origin and Destination Matrix by Sector Zone in Year 2050
Alternative 2 East Extension (unit: thousand trips per day) ............................. 2-82 Table 2-57 Summary of Metro Daily Demand (Metro Line 4 Alternative 1 North
Extension) ....................................................................................................... 2-83 Table 2-58 Summary of Metro Daily Demand (Metro Line 4 Alternative 2 East
Extension) ....................................................................................................... 2-84 Table 2-59 Detailed Metro Demands for Metro Line 4 Phase 1 (To/From Phase 2 Alternative 1 North Extension)........................................... 2-84 Table 2-60 Detailed Metro Demands for Metro Line 4 Phase 1 (To/From Phase 2 Alternative 2 East Extension) ............................................ 2-85 Table 2-61 Planning Factors for Determining Requirement of Feeder Transport
Facilities at Major Stations .............................................................................. 2-95 Table 2-62 Planning Factors for Determining Requirement of Feeder Transport
Facilities at Ordinary Stations.......................................................................... 2-96 Table 3-1 Speed Restrictions and Length of Transitional Curves ..................................... 3-2 Table 3-2 Consideration from Viewpoints of Environmental and Social
Acceptability ...................................................................................................... 3-9 Table 3-3 Comparison of Proposed Station Locations .................................................... 3-18 Table 3-4 Comparison Table for Alternative Access Routes to the
Workshop/Depot ............................................................................................. 3-23 Table 4-1 Station covering Population by distance ........................................................... 4-1 Table 4-2 Metro Station and Section Passenger by Alternatives ...................................... 4-3 Table 4-3 Hard Points of the Northern Route .................................................................... 4-7 Table 4-4 Single Track Double Tube and Double Tracks Tubel...................................... 4-24 Table 4-5 Construction Period......................................................................................... 4-30 Table 4-6 Conditions for Cost Estimate........................................................................... 4-33 Table 4-7 Conditions for Each Corridor for Phase 2........................................................ 4-33 Table 4-8 Basic Unit Cost as of 2009.............................................................................. 4-34 Table 4-9 Construction and Procurement Cost for Phase 2 as of 2009 .......................... 4-34 Table 4-10 Comparison of Magnitude of Land Acquisition and Resettlement ................... 4-36 Table 4-11 Comparison of Social, Environmental and Archaeological Aspects ................ 4-37 Table 4-12 Summarized Main Characteristics................................................................... 4-39 Table 4-13 The Predicted Population and Number of Passengers ................................... 4-39 Table 4-14 Comparison of Cost Estimation....................................................................... 4-40 Table 4-15 Criteria for scoring........................................................................................... 4-42 Table 4-16 Weighting of Criteria........................................................................................ 4-42 Table 4-17 Comparison of Two Routes............................................................................. 4-43 Table 4-18 Comparison Considering Transportation Demands in 2050............................ 4-43 Table 4-19 Comparison Table for Phase 2 Route ............................................................. 4-45

JICA PREPARATORY SURVEY ON GREATER CAIRO METRO LINE NO.4
Final Report - Volume 2 (vii)
Figure 1-1 Study Area ........................................................................................................ 1-3 Figure 2-1 Traffic Count Location Map(Previous Surveys)................................................ 2-2 Figure 2-2 Traffic Survey Hours(Previous Surveys) .......................................................... 2-3 Figure 2-3 Traffic Volume at Each Location Converted to 24-hour Unit(Previous
Surveys) ........................................................................................................... 2-4 Figure 2-4 Proposed Link Traffic Count Survey Locations along Pyramids Road .............. 2-8 Figure 2-5 Proposed Link Traffic Count Survey Locations along Port Said Street ............. 2-9 Figure 2-6 Traffic Count Form .......................................................................................... 2-11 Figure 2-7 Screen Line Survey Location Map .................................................................. 2-12 Figure 2-8 Traffic Volume Fluctuation for Both Directions at Maadi Bridge (SL1)
(First Survey Day) ........................................................................................... 2-14 Figure 2-9 Traffic Volume Fluctuation for Both Directions at Maadi Bridge (SL1)
(Second Survey Day) ...................................................................................... 2-14 Figure 2-10 Average Traffic Composition at Maadi Bridge (SL1) ....................................... 2-15 Figure 2-11 Traffic Volume Fluctuation for Both Directions at Abbas Bridge (SL2)
(First Survey Day) ........................................................................................... 2-16 Figure 2-12 Traffic Volume Fluctuation for Both Directions at Abbas Bridge (SL2)
(Second Survey Day) ...................................................................................... 2-16 Figure 2-13 Average Traffic Composition at Abbas Bridge (SL2)....................................... 2-17 Figure 2-14 Revealed Preference Survey Form for Car Users........................................... 2-19 Figure 2-15 Revealed Preference Survey Form for Public Transport User ........................ 2-20 Figure 2-16 Stated Preference Survey Form...................................................................... 2-21 Figure 2-17 Locations of Interview Survey ......................................................................... 2-24 Figure 2-18 Distribution of the Interviewed Sample of Public Transport Users
According to Trip Purpose............................................................................... 2-24 Figure 2-19 Distribution of the Interviewed Sample of Public Transport Users
According to Used Public Mode Type ............................................................. 2-25 Figure 2-20 Distribution Based on Waiting time ................................................................. 2-26 Figure 2-21 Distribution Based on Walk to Mode Time ...................................................... 2-26 Figure 2-22 Distribution Based on Number of Mode Transfer ............................................ 2-26 Figure 2-23 Distribution Based on Travel cost.................................................................... 2-26 Figure 2-24 Distribution Based on “In vehicle” Time........................................................... 2-26 Figure 2-25 Distribution Based on Walking Time from Mode ............................................. 2-26 Figure 2-26 Comparison Between the Trip Characteristics of the User Trips for both
the Used and Alternative Modes ..................................................................... 2-27 Figure 2-27 Percentages of Interviewed Public Mode Users Regarding Their
Opinions in Each Trip Characteristic Item ....................................................... 2-27 Figure 2-28 Distribution of Interviewed Sample of Car Users According to Trip
Purpose........................................................................................................... 2-28 Figure 2-29 Distribution of Interviewed Sample of Car Users According to Trip Time........ 2-28 Figure 2-30 Distribution of Interviewed Sample of Car Users According to Parking
Fees ................................................................................................................ 2-29 Figure 2-31 Distribution of the Interviewed Sample of Car Users According to Other
Available Alternative Mode.............................................................................. 2-29 Figure 2-32 Percentages of Interviewed Car Users Regarding their Opinions on
Each Trip Characteristic Item.......................................................................... 2-30 Figure 2-33 Distribution of Interviewed Sample of Public Users According to Trip
Purpose........................................................................................................... 2-30 Figure 2-34 Percentages of Interviewed Public Users Regarding their Opinions on
Each Trip Characteristic Item.......................................................................... 2-31 Figure 2-35 Tourist Survey Form........................................................................................ 2-32 Figure 2-36 Urban Development Strategy for Greater Cairo up to 2050 ............................ 2-33 Figure 2-37 New Urban Community (NUC) Development until 2050 ................................. 2-34 Figure 2-38 Relative Population Growth between NUCs and Other Urban Areas.............. 2-35 Figure 2-39 Delineation of Study Geographical Sectors..................................................... 2-37 Figure 2-40 Regression of Car Ownership Rate Against GRDP per Capita in Three
Governorates (Cairo, Giza and Qaliobeya) ..................................................... 2-50

JICA PREPARATORY SURVEY ON GREATER CAIRO METRO LINE NO.4
Final Report - Volume 2 (viii)
Figure 2-41 Metro Line 1 and 2 Routes and Stations ......................................................... 2-52 Figure 2-42 Existing Urban Railway Network in Greater Cairo........................................... 2-57 Figure 2-43 Existing Major Road Network in Greater Cairo Region ................................... 2-59 Figure 2-44 Principle of Transportation Modeling............................................................... 2-61 Figure 2-45 Concept of Four-Step Approach of Transport Modelling ................................. 2-62 Figure 2-46 Verification of Trip Generation and Attraction Models ..................................... 2-63 Figure 2-47 Verification of Trip Generation and Attraction Models ..................................... 2-65 Figure 2-48 Work Flow for Modal Split Modelling and Projection of Metro Line
Passengers ..................................................................................................... 2-66 Figure 2-49 Private Car Modal Split Model......................................................................... 2-67 Figure 2-50 Private Car Modal Share Model in This Study................................................. 2-68 Figure 2-51 Explanatory Illustration for Station Accessibility .............................................. 2-69 Figure 2-52 Modal Split Model (Bus and Metro) Calibration Results and Estimated
Rail Mode Share ............................................................................................. 2-70 Figure 2-53 Concept of Traffic Assignment and Finding a Tree/Route............................... 2-71 Figure 2-54 Choice of Transport Mode Reflected in Relationship between Traffic
Density and Distance ...................................................................................... 2-87 Figure 2-55 Concept drawing of El Remayah Station, showing the layout of
Underground “park and ride” and modal interchange facilities ........................ 2-89 Figure 2-56 Concept Drawing of El Giza Station, Showing the Layout of
Above-ground “Park and Ride” and Modal Interchange Facilities ................... 2-90 Figure 2-57 Plan Arrangement of “Pick-up and Set-down” Facilities for Feeder
Transport at Ordinary Stations ........................................................................ 2-91 Figure 2-58 Distribution of Passenger Demand Forecast by Feeder Trip Distance
(Entire Route of Metro Line 4) ......................................................................... 2-93 Figure 2-59 Distribution of Passenger Demand Forecast by Feeder Trip Distance
(Metro Line 4 Phase 1 route)........................................................................... 2-94 Figure 3-1 Main Crossing Structures Between El Malek El Saleh and El Remayah
Square............................................................................................................... 3-3 Figure 3-2 Possible Routes between El Malek El Saleh and Sta.6 .................................... 3-4 Figure 3-3 Existing Conditions of Giza Square................................................................... 3-5 Figure 3-4 The Flyover ....................................................................................................... 3-5 Figure 3-5 Location of Faisal Station and El-Giza Station on Metro Line 2 ........................ 3-7 Figure 3-6 Current Condition of Pyramids Road................................................................. 3-7 Figure 3-7 Current Condition of King Faisal Street ............................................................. 3-8 Figure 3-8 Plan for Toll Road Along King Faisal Street ...................................................... 3-9 Figure 3-9 Alternative Route Avoiding Main Construction Difficulties ............................... 3-10 Figure 3-10 List of Existing Site Conditions ........................................................................ 3-13 Figure 3-11 Alternative Alignments Around the Intersection of Pyramids Road with
Alexandria Desert Road .................................................................................. 3-14 Figure 3-12 Proposed Route for Phase 1 Section .............................................................. 3-15 Figure 3-13 Schematic Layout of Station Locations ........................................................... 3-16 Figure 3-14 Schematic Vertical Alignment.......................................................................... 3-17 Figure 3-15 Typical Cross Section of Tunnel...................................................................... 3-20 Figure 3-16 Typical Cross Section of Station Structure ...................................................... 3-21 Figure 3-17 Possible Planning Area for the Workshop/Depot ............................................ 3-21 Figure 3-18 Alternative Access Routes to the Workshop/Depot......................................... 3-22 Figure 3-19 List of Hard Points........................................................................................... 3-25 Figure 4-1 Future Land Use Composition within 2,000 m Distance From/To the
Stations ............................................................................................................. 4-2 Figure 4-2 Site in front of Children Cancer Hospital ........................................................... 4-4 Figure 4-3 World Heritage Area.......................................................................................... 4-5 Figure 4-4 Alternative Route Corridor for Phase2 Section (Northern Route and
Eastern Route) .................................................................................................. 4-6 Figure 4-5 Hard Points Location of Northern Route ........................................................... 4-8 Figure 4-6 Typical Cross Section Under Port Said Street................................................... 4-9 Figure 4-7 Neighbouring Construction of the Yamate Tunnel in Tokyo ............................ 4-10

JICA PREPARATORY SURVEY ON GREATER CAIRO METRO LINE NO.4
Final Report - Volume 2 (ix)
Figure 4-8 Complicated Neighbouring Tunnel Construction of Keio Line and Sagami Line in Tokyo...................................................................................... 4-11
Figure 4-9 Cross Section at Crossing Point of El Azhar Road Tunnel.............................. 4-12 Figure 4-10 Structural Type of Northern Route and Southern Route ................................. 4-14 Figure 4-11 Intersection at Grade Covered with Road Decks ............................................ 4-15 Figure 4-12 Plan and Profile of Cut and Cover with Road Deck Method during
Station Construction........................................................................................ 4-16 Figure 4-13 Procedure of Installing the Road Deck during Station Construction................ 4-17 Figure 4-14 Procedure of the Road Deck Method during Station Construction .................. 4-18 Figure 4-15 Procedure of Hanging Spine Wastewater Tunnel in Station
Construction .................................................................................................... 4-19 Figure 4-16 Seismic Countermeasure for the SWWT in Station......................................... 4-20 Figure 4 17 Plan at Station No. 8 (Ghamrah) ..................................................................... 4-21 Figure 4-18 Image of Station No. 8 (Ghamrah) Constructed Using the Multi Box
Jacking............................................................................................................ 4-21 Figure 4-19 Photo of Multi Box Jacking Machine and Image of Construction..................... 4-22 Figure 4-20 Image of Station No. 8 (Ghamrah) constructed Using HEP and JES
Method ............................................................................................................ 4-23 Figure 4-21 Photo and Image of HEP and JES Construction Method ................................ 4-23 Figure 4-22 TBM Excavation Procedure Plan (Left: Northern Route, Right: Eastern
Route) ............................................................................................................. 4-26 Figure 4-23 Mechanism of the Settlement by the Deformation of Backfill Material............. 4-27 Figure 4-24 Ground Surface Settlement with Different Backfill Materials ........................... 4-28 Figure 4-25 Image of Soil Improvement from the Cutting Face of the Shield TBM............. 4-29 Figure 4-26 Construction Schedule of Phase 2 (Northern Route) ...................................... 4-31 Figure 4-27 Construction Schedule of Phase-2 Eastern Route .......................................... 4-32
LIST OF APPENDIXES Appendix 1: Traffic Count Locations Appendix 2: Traffic Count Locations at Port-Said Street Appendix 3: Screen Line Traffic Count Locations Appendix 4: Traffic Volume Fluctuation and Traffic Composition at the Screen Line
Locations Appendix 5: Summary of Horizontal Alignment for Phase1 and Phase2 Appendix 6: Alignment Drawing for Phase2 and Phase3 Appendix 7: Interview Survey Forms in Arabic

GROSSARY OF ABBREVIATIONS AND MEASURING UNITS

JICA PREPARATORY SURVEY ON GREATER CAIRO METRO LINE NO.4
Final Report - Volume 2 Abbreviations and Units I
GLOSSARY OF ABBREVIATIONS AND MEASURING UNITS
ABBREVIATIONS
A
AASHTO American Association of State Highways and Transportation
Officials
AB Absolute Block
ABS Automatic Block Signals
A/C Air Conditioning
AC Alternating Current
ACE Arab Consulting Engineers
ACij Access Length
ADT Average Daily Traffic
AF Audio Frequency
AFC Automatic Fare Collection (system)
AfDB African Development Bank
AG Automatic Gate
AGT Automated Guide-way Transit
AHU Air Handling Unit
AM Amplitude Modulation
am Ante meridian
ANSI American National Standards Institute
AREMA American Railway Engineering and Maintenance Association
ARS Automatic Route Setting
ASCII American Standard Code for Information Interchange
asl Above Sea Level
ASTM American Society for Testing and Materials
AT Auto Transformer
ATC Automatic Train Control
ATO Automatic Train Operation
ATP Automatic Train Protection
ATS Automatic Train Supervision
ATS Automatic Train Stop
Ave. Average
B

JICA PREPARATORY SURVEY ON GREATER CAIRO METRO LINE NO.4
Final Report - Volume 2 Abbreviations and Units II
BAS Building Automation System
BCC Beginning of Circular Curve
BCR Benefit Cost Ratio
BD Basic Design
BNC British National Connector
BP Brake Pipe
BRT Bus Rapid Transit
BS British Standard
BSE Base Station Equipment
BT Booster Transformer
BTC Beginning of Transition Curve
C
CA Certification Authority
CAA Competent Administrative Authority
CAD Computer Aided Design
C&I Criteria & Indicator
CAPMAS Central Agency for Public Mobilization and Statistics
CAPW Construction Authority for Portable Water and Wastewater
CBD Central Business District
CBTC Communication Based Train Control
CCIR International Radio Consultation Committee
CCITT Consultative Committee for International Telephone and
Telegraphs
CCP Central Control Point
CCTV Closed Circuit Television
CCU Central Control Unit
CCU Communication with Central Control Unit
CD ROM Compact Disc Read Only Memory
CDR Compact Disc Recordable
CIP Central Interface Panel
CENELEC European Committee for Electrotechnical Standardization
CI Computerized Interlocking
CICC Contactless IC Card
CIPF Card Initiation and Personalization Function
CIPS Card Initiation and Personalization System
CMH Cubic Meter per Hour
CML Cairo Metro Line

JICA PREPARATORY SURVEY ON GREATER CAIRO METRO LINE NO.4
Final Report - Volume 2 Abbreviations and Units III
CMO Cairo Metro Organization
CMOS Complementary Metal Oxide Semiconductor
CNG Compressed Natural Gas
COP Crew Operation Panel
CPEE City Unit Cable
CPM Critical Path Method
CREATS Cairo Regional Area Transportation Study
CRT Cathode Ray Tube
CS Cab Signal
CSC Contactless Smart Card
CTA Cairo Transport Authority
CULTNAT Cultural and National Heritage
CV Curriculum Vitae
CWO Cairo Wastewater Organization
CWR Continuously Welded Rail
D
DB Dry Bulb (Ventilation)
D&B Design and Build
DC Direct Current
DC Direct Cost
DCF Discount Cash Flow
DF Depot Facility
DIN Deutsche Industry Norm (German Industrial Standard)
DO Dissolved Oxygen
DOS Disk Operating System
DSRSC Design Standards for Railway Structures and Commentary
DWG Drawing
E
E&M Electrical and Mechanical
ECC End of Circular Curve
ECM Egyptian Company for Metro
ECMOU Egyptian Company for Maintaining and Operating the
Underground
ECS Environmental Control System
EEAA Egyptian Environmental Affairs Agency
EEHC Egyptian Electricity Holding Company
Egij Egress Length

JICA PREPARATORY SURVEY ON GREATER CAIRO METRO LINE NO.4
Final Report - Volume 2 Abbreviations and Units IV
EGP Egyptian Pound
EGSA Egyptian General Survey Authority
EHF Extremely High Frequency (mill-meter wave)
EIA Environmental Impact Assessment
EIB European Investment Bank
EIRENE European Integrated Railway Radio Enhanced NEtwork
EIRR Economic Internal Rate of Return
ELCB Earth Leakage Circuit Breaker
EMC Electro Magnetic Compatibility
EMI Electro Magnetic Interference
EMU Environmental Management Unit (Governorate)
EMU Electric Multiple Unit
ENIT Egypt National Institute of Transport
ENPV Economic Net Present Value
ENR Egyptian National Railway
EPBM Earth Pressure Balanced Machine
EPI Environmental performance Indicator
ER Electric Room
ERs Executive Regulations
ERTMS European Railway Traffic Management System
ETC End of Transition Curve
ETCS European Train Control System
ETHERNET Computer Cabling System
EU European Union
EUA EU emission Allowance
F
FCC Federal Communications Commission
FIRR Financial Internal Rate of Return
FM Frequency Modulation
FOB Free On Board
FOC Fiber Optic Cable
F/S Feasibility Study
FS Fail Safe
FSK Frequency Shift Keying
FSR Feasibility Study Report
FTP File Transfer Protocol
FY Fiscal Year, Financial Year

JICA PREPARATORY SURVEY ON GREATER CAIRO METRO LINE NO.4
Final Report - Volume 2 Abbreviations and Units V
G
GARBLT General Authority for Roads, Bridges and Land Transport
GC General Consultant
GCA Greater Cairo Area
GCR Greater Cairo Region
GDP Gross Domestic Product
GEM Grand Egyptian Museum
GHG Greenhouse Gas
GIS Geographic Information System
GL Ground Level
GNI Gross National Income
GOE Government of Egypt
GOJ Government of Japan
GOPP General Organization for Physical Planning
GPS Global Positioning by Satellite System
GRDP Gross Regional Domestic Product
GSM Global System for Mobile communications
GSM-R Global System for Mobile communications for Railways
GUI Graphical User Interface
H
HB Home Based
HFC Hydro-Fluoro-Carbon
HIS Home Interview Survey
HMI Human Machine Interface
Hz Hertz
hr hour
HS Hindrance Sensor
HTTP Hyper Text Transfer Protocol
HVL High Voltage Line
HVS High Voltage Station
I
IBA Important Bird Area
IBC International Building Code
IBRD International Bank for Reconstruction and Development
IC Integrated Circuit
ICEA Insulated Cable Engineers Association
IDC In-Direct Cost

JICA PREPARATORY SURVEY ON GREATER CAIRO METRO LINE NO.4
Final Report - Volume 2 Abbreviations and Units VI
IEC International Electrotechnical Commission
IEEE Institute of Electrical and Electronics Engineers
IGBT Insulated Gate Bipolar Transistor
IMF International Monetary Fund
IP Implementation Program
IRJ Insulated Rail Joint
IRR Internal Rate of Return
IS Information System
ISDN Integrated Services Digital Network
ISO International Standards Organization
IT Information Technology
I-Tax Import Tax
ITU International Telecommunication Union
ITV Industrial Television
IUCN International Union for Conservation of Nature and Natural
Resources
J
JARTS Japan Railway Technical Service
JBIC Japan Bank for International Cooperation (former name of
JICA)
JICA Japan International Cooperation Agency
JIS Japanese Industrial Standards
JNR Japanese National Railways
JPY Japanese Yen
JST JICA Study Team
K
kCal kilo-Calory
kV kilo Volt
kVA kilo Volt Ampere
L
LAN Local Area Network
LCD Liquid Crystal Display
LCU Local Control Unit
LCX Leaky Coaxial Cable
LE /L.E. Egyptian Pound
LED Light Emitting Diode
LPS Lighting and Power Station

JICA PREPARATORY SURVEY ON GREATER CAIRO METRO LINE NO.4
Final Report - Volume 2 Abbreviations and Units VII
LRT Light Rail Transit
LRV Light Rail Vehicle
LRU Line Replaceable Unit
LT Link Traffic
LV Low Voltage
LWR Long Welded Rail
M
MCA Multi-Criteria Analysis
MCBF Mean Cycle Between Failure
MCP Manual Control Panel
MCPC Monitoring and Control Personal Computer
MCS Manual Control Switch
MDB Manual Door Opening Button
M&E Mechanical and Electrical
MDBF Mean Distance Between Failure
MDOP Manual Door Operation Panel
MH Maintenance Hatch
MIL Military Specification
min. minute
MIS Management Information System
MJC Misr Japan Alled Company for Rolling Stock Maintenance and
Renweal
MLIT Ministry of Land Infrastructure, Transport and Tourism /
Japan
MOH Ministry of health (Egypt)
MOT Ministry of Transport (Egypt)
MP Mimic Panel
MPU Motive Power Unit
MPU Micro Processor Units
MRT Mass Rapid Transit
MSEA Ministry of State for Environmental Affairs
MSK Minimum Shift Keying Modulation
MT Matting Transformer
MT Magnetic Ticket (AFC)
M4N Metro Line 4 North section (Phase 2)
M4W Metro Line 4 West Section (Phase 1)
MW Mega Watt
JICA PREPARATORY SURVEY ON GREATER CAIRO METRO LINE NO.4
Final Report - Volume 2 Abbreviations and Units VIII
N
NAT National Authority for Tunnel, Ministry of Transport
NATM New Austrian Tunneling Method
NFPA National Fire Prevention Association
NGO Non-Governmental Organization
NHB Non-Home Based
NOUH National Organization for Urban Harmony
NOx Nitrogen Oxides
NPV Net Present Value
N-Sta. North line Station (Phase 2)
NUC New Urban Community
O
OA Outside Air (Ventilation)
OCC Operation Control Centre
OCS Overhead Contact System
OD / O/D Origin and Destination
ODA Official Development Assistance
OFC Optical Fibre Cable
OHC Over Head Catenary
O&M Operation and Maintenance
OP Operation Policy
ORC Overhead Rigid Conductor
P
p.a. per annum
P&L Profit and Loss
PA Public Announcement/ Public Address
PAP Project Affected Person
Pax Passenger
PBX Private Automatic Branch Exchange
PC Pre-stressed Concrete
PC Personal Computer
PCP Power Control Point
PCU Passenger Car Unit
p/h person per hour
PHPDT Peak Hour Peak Direction Trips
PID Passenger Information Display
PKI-SAM Public Key Infrastructure - Security Access Key

JICA PREPARATORY SURVEY ON GREATER CAIRO METRO LINE NO.4
Final Report - Volume 2 Abbreviations and Units IX
pm post meridian
PM Particulate Matter
PMSM Permanent Magnet Synchronous Motor
PPHPD Passengers Per Hour Per Direction
PPM Planned Preventive Maintenance
PRC Programmed Route Control
PRJ Projector
PSD Platform Screen Door
P.T. Piaster
PT Person Trip
PTC Programmed Traffic Control
PPM Parts Per Million
PSO Public Service Obligation
PVC Poly Vinyl Chloride
PVU Portable Verification Unit
PW Permanent Way
Q
QA Quality Assurance
R
RA Returned Air
RAMS Reliability, Availability, Maintainability and Safety
RAP Resettlement Action Plan
RBO Regional Branch Offices
RC Reinforced Concrete
RCS Radio Central Control System
Rd. Road
RF Radio Frequency
Rf Rectifier equipment
RH Relative Humidity
RI Relay Interlocking
Rij Railway Length
RL Rail Level
ROE Return On Equity
ROI Return On Investment
ROW Right Of Way
RP Revealed Preference
RPS Revealed Preference Survey

JICA PREPARATORY SURVEY ON GREATER CAIRO METRO LINE NO.4
Final Report - Volume 2 Abbreviations and Units X
RPF Resettlement Policy Framework
RS Rectifier Station
RS Rolling Stock
RT Refrigeration Tons
RTU Remote Terminal Unit
RTRI Railway Technical Research Institute, Japan
R/W Read and Write
S
SA Supply Air
SAM Security Access Module
SCA Supreme Council of Antiquities
SCADA Supervisory Control and Data Acquisition
SCU Station Control Unit
SDH Synchronous Digital Hierarchy
SDMP The Strategic Urban Development Master Plan Study for a
sustainable Development of the Greater Cairo Region in the
Arab Republic of Egypt
Sec. Section
sec. second
SEVP Signal Polyethylene Vinyl Cable
SF Stored Fare (Ticket)
SHF Super High Frequency (centimeter wave)
SI Systeme Internationale d’Unites (SI Unit)
SI Sensitive Indicator
SIFE Students in Free Enterprise
SL Screen Line
SM Single Mode
SO2 Sulfur Dioxide
SOFRETU Société Française d’études et de réalisations de transports
urbains
SP Stated Preference
SPAD Signal Passing At Danger
SPF Shadow Pricing Factor
SPS Stated Preference Survey
SPT Standard Penetration Test
SQEE Signal Quad Polyethylene Cable
sq.m. square meter

JICA PREPARATORY SURVEY ON GREATER CAIRO METRO LINE NO.4
Final Report - Volume 2 Abbreviations and Units XI
SSOP Station Staff operation Panel
STA / Sta. Station
STRASYA Standard Urban Railway System for Asia
STEP Special Terms for Economic Partnership
SV Switching Value
S/W Scope of Work
SWWT Spine Waste Water Tunnel
T
TAC Track Access Charge
TAZ Traffic Analysis Zone
TBM Tunnel Boring Machine
TD Train Detection
TD Tender Document
TDM Time Division Multiplex
TDMA Time Division Multiple Access
TEF Tunnel Exhaust Fans
TETRA Terrestrial Trunked Radio
TIS Ticket Initialization Unit
TOM Ticket Office Machine
TOR Terms Of Reference
TR Ticket Reader
TV Television
TVF Tunnel Ventilation Fans
TVM Ticket Vending Machine
U
UNDP United Nations Development Programme
UIC Union International des Chemins de fer (International Union of
Railways)
UPS Uninterruptible Power Supply
USRT United States Refrigeration Tons
V
V Volt
VAT Value Added Tax
VHF Very High Frequency
VOC Vehicle Operating Cost
VOT Value Of Travel Time
VVVF Valuable Voltage Valuable Frequency

JICA PREPARATORY SURVEY ON GREATER CAIRO METRO LINE NO.4
Final Report - Volume 2 Abbreviations and Units XII
W
W Watt
WB World Bank
WB Wet Bulb
W/D Workshop/Depot
W/S Work Station
WS Wayside Signal
WAN Wide Area Network
WWW World Wide Web
WYSIWYG What You See Is What You Get
JICA PREPARATORY SURVEY ON GREATER CAIRO METRO LINE NO.4
Final Report - Volume 2 Abbreviations and Units XIII
UNITS OF MEASURE
A Ampere
Amp Ampere
BTU British Thermal Unit
dB Decibel
dBA Decibel on the ‘A’ weighted scale
FC Foot-candles
g Acceleration due to Gravity (32.2 ft/s2 =9.81 m/s2 )
H Hour
Hz Hertz
In Inch
J Joule
ha Hectare
kg Kilogram
kHz Kilohertz
km Kilometer
km2 Square Kilometer
km/h Kilometer per hour
kWh Kilowatt hour
kV Kilovolt
I Liter
L.E. Egyptian Pound
m Meter
m2 Square Meter
mg/l Milligram per Litter
MHz Mega Hertz
min Minute
mm Millimeter
MW Megawatt
MVA Mega Volt Ampere
mV Millivolt
ìV Microvolt
N Newton
NYU Nephelometric Turbidity Unit
ppm parts per million
RT Refrigeration Tons

JICA PREPARATORY SURVEY ON GREATER CAIRO METRO LINE NO.4
Final Report - Volume 2 Abbreviations and Units XIV
sec Second
ug/m3 Microgram per cubic meter
USRT United States Refrigeration Tons
V Volt
Vac Volt alternating current
Vdc Volt direct current
wt weight
°C Degree Celsius
°F Degree Fahrenheit

EXECUTIVE SUMMARY OF VOLUME 2

JICA PREPARATORY SURVEY ON GREATER CAIRO METRO LINE NO. 4
Final Report - Volume 2 1 Executive Summary
EXECUTIVE SUMMARY OF VOLUME 2
1. Introduction
1.1 Background and Purpose of the Study
The Greater Cairo Region is the premier city in Egypt. It is rich in history and boasts of a
large number of historical structures. It is the largest city in the African Continent and the
Middle Eastern Region with a population of over 18 million, representing 25% of the total
population of Egypt.
As the population of the Greater Cairo Region is envisaged to increase to 20 million by the
year 2017 according to the SDMP Report, the Government of Egypt (GOE) is reforming the
urban structure, changing from a mono-centric form to a decentralized form, notably
through the development of New Urban Communities (NUCs), such as the 10th of
Ramadan City and 6th October City. However, the increasing transport demand has not
been accompanied by a substantial solution to urban problems such as road traffic
congestion, insufficient public transportation services and air pollution.
At present two metro lines are in service and one metro line is under construction. As a
long-term strategic development plan, the General Organization for Physical Planning
(GOPP) has prepared “the Cairo Vision 2050”. This vision document proposes 15 metro
routes as the main public transport system in the Greater Cairo Region.
Under this circumstanced, GOE has decided to construct, as early as practicable, the Metro
Line 4, and requested the Government of Japan (GOJ) to implement the “Development
Study on Greater Cairo Metro Line No.4 Project in October 2008, by the Government of the
Arab Republic of Egypt”. The Japan International Cooperation Agency (JICA), the official
agency responsible for the implementation of GOJ’s programs, has had discussions with
the National Authority for Tunnels (NAT) of the Ministry of Transport and has agreed to
conduct a feasibility study for the proposed Metro Line 4. The document for the Scope of
Work was signed on 21st December 2008.
1.2 Implementation of the Study
The JICA Preparatory Survey on the Greater Cairo Metro Line No.4 was undertaken in
March 2009, based on the Scope of Work agreed among the NAT, the Ministry of Transport,
and the JICA. The study was carried out by the JICA Study Team (JST), which is the
consultant team hired by JICA for the implementation of this study. The JICA Preparatory
Survey consists of the following two major studies.
New Transportation Study on Greater Cairo Metro Line No.4, including selection of the routes for Phase 1 and Phase 2, considering future transport demand up until the year 2050.
A complete Feasibility Study for the combined Phase 1 and Phase 2 selected route, including Preliminary Design for Phase 1, considering future transport demand up until the year 2050.
JICA PREPARATORY SURVEY ON GREATER CAIRO METRO LINE NO. 4
Final Report - Volume 2 2 Executive Summary
2. Transportation Study
2.1 Transport Survey
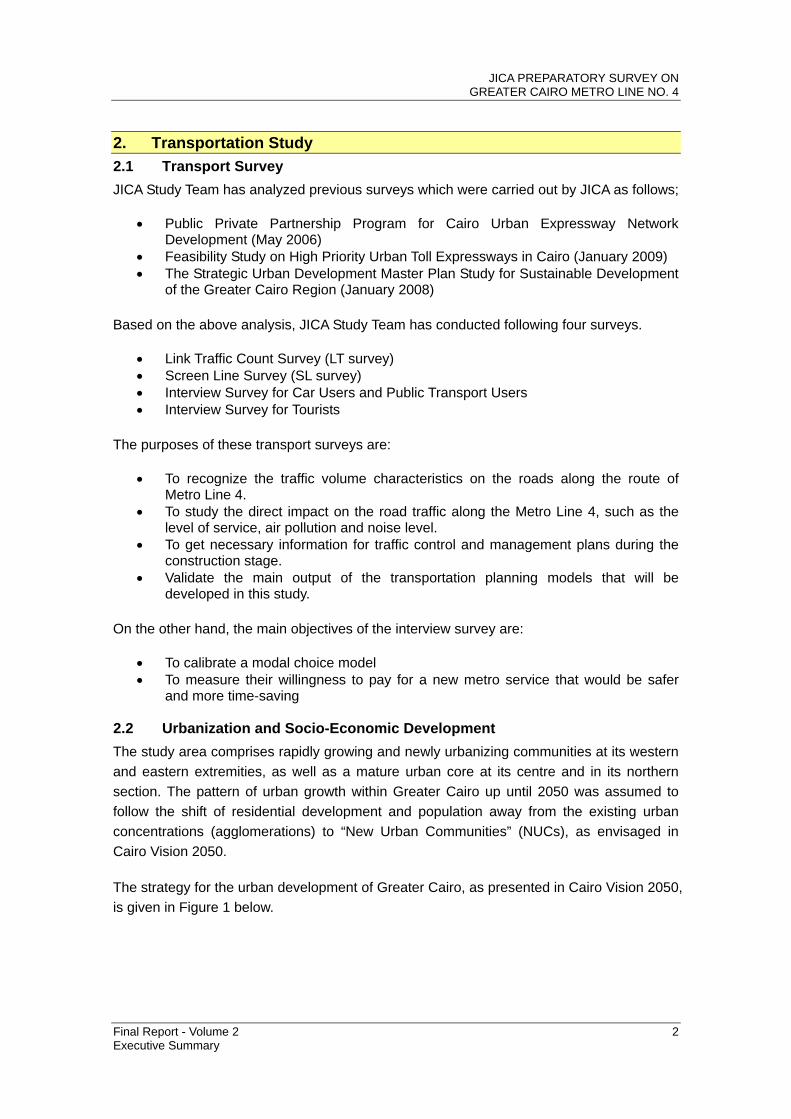
JICA Study Team has analyzed previous surveys which were carried out by JICA as follows;
Public Private Partnership Program for Cairo Urban Expressway Network Development (May 2006)
Feasibility Study on High Priority Urban Toll Expressways in Cairo (January 2009) The Strategic Urban Development Master Plan Study for Sustainable Development
of the Greater Cairo Region (January 2008) Based on the above analysis, JICA Study Team has conducted following four surveys.
Link Traffic Count Survey (LT survey) Screen Line Survey (SL survey) Interview Survey for Car Users and Public Transport Users Interview Survey for Tourists
The purposes of these transport surveys are:
To recognize the traffic volume characteristics on the roads along the route of Metro Line 4.
To study the direct impact on the road traffic along the Metro Line 4, such as the level of service, air pollution and noise level.
To get necessary information for traffic control and management plans during the construction stage.
Validate the main output of the transportation planning models that will be developed in this study.
On the other hand, the main objectives of the interview survey are:
To calibrate a modal choice model To measure their willingness to pay for a new metro service that would be safer
and more time-saving 2.2 Urbanization and Socio-Economic Development
The study area comprises rapidly growing and newly urbanizing communities at its western
and eastern extremities, as well as a mature urban core at its centre and in its northern
section. The pattern of urban growth within Greater Cairo up until 2050 was assumed to
follow the shift of residential development and population away from the existing urban
concentrations (agglomerations) to “New Urban Communities” (NUCs), as envisaged in
Cairo Vision 2050.
The strategy for the urban development of Greater Cairo, as presented in Cairo Vision 2050,
is given in Figure 1 below.

JICA PREPARATORY SURVEY ON GREATER CAIRO METRO LINE NO. 4
Final Report - Volume 2 3 Executive Summary
Existing area of population concentration, from which there will be a shift of population by 2050.
New areas to be proposed for residential development to absorb an additional 1 million residential units by 2050 (comprising approx. 35,000 feddan in total)
Already existing “New Urban Communities” planned for expansion to absorb an additional 1 million residential units each by 2050
Area to be reserved for agricultural land within Greater Cairo (approximately 60,000 feddan)
Source: Vision 2050, General Office for Physical Planning, Ministry of Housing, Utilities and Urban
Development
Figure 1 Urban Development Strategy for Greater Cairo up to 2050
2.2.1 Population Projections
For the purpose of summarizing the population forecasts used as inputs for the transport
demand forecast, the study area was divided into 18 geographical sectors. Following table
shows the summary of forecast population and growth rates by study sectors.
In most cases of sectors containing existing NUCs (see rows shaded green), the average
rate of population increase declines significantly between 2027 and 2050, as these areas
approach their capacity. Conversely, it shows that in most cases of sectors containing new
NUCs (see rows shaded purple), the average rate of population increase either remains
constant or expands between 2027 and 2050.

JICA PREPARATORY SURVEY ON GREATER CAIRO METRO LINE NO. 4
Final Report - Volume 2 4 Executive Summary
Table 1 Summary of Forecast Population Growth Rates, by Study Sector
2009-2027 2009-2050 2009-2027 2009-20501 6th of October 322,880 1,449,364 1,671,672 449% 518% 8.7% 4.1%2 Imbaba Markaz 1,835,262 2,684,164 3,575,870 146% 195% 2.1% 1.6%3 Dokki 1,343,380 1,429,463 1,648,719 106% 123% 0.3% 0.5%4 Giza 1,567,077 1,974,991 2,625,922 126% 168% 1.3% 1.3%5 South Giza 530,317 590,495 681,067 111% 128% 0.6% 0.6%6 Helwan 820,100 995,041 2,911,664 121% 355% 1.1% 3.1%7 Maadi 1,113,044 1,655,522 1,909,452 149% 172% 2.2% 1.3%8 Khaleafa 858,798 951,550 1,097,502 111% 128% 0.6% 0.6%9 CBD 399,602 384,529 443,509 96% 111% -0.2% 0.3%10 Shobra 1,020,712 1,041,766 1,201,556 102% 118% 0.1% 0.4%11 Masr El Gedeeda 873,972 976,786 1,126,609 112% 129% 0.6% 0.6%12 Nasr City 1,118,408 2,355,577 2,716,884 211% 243% 4.2% 2.2%13 Ain Sham 1,067,601 1,401,467 1,616,429 131% 151% 1.5% 1.0%14 Salam City 815,377 725,064 836,277 89% 103% -0.7% 0.1%15 Shobra El Kheima 1,084,038 1,406,107 1,621,781 130% 150% 1.5% 1.0%16 Qalyob 924,506 1,270,396 1,465,254 137% 158% 1.8% 1.1%17 Qanater 1,350,293 2,313,704 3,988,588 171% 295% 3.0% 2.7%18 10th of Ramadan 171,217 586,024 675,910 342% 395% 7.1% 3.4%
Total 17,216,581 24,192,010 31,814,664 141% 185% 1.9% 1.5%
Y2050 Av. annual rate of growthNo. Overall GrowthSector Y2009 Y2027
Sources: (1) SDMP Report 2008 (Population forecasts 2007-2027) (2) JICA Study Team 2009 (Population forecasts 2030-2050) Key: Includes existing NUCs Includes new NUCs identified in Vision 2050 2.2.2 Employment Projections
The growth of employment in the study area is one of the factors having a strong influence
on the growth in demand for the proposed Cairo Metro Line 4. Summary of forecast
employment and growth rates by study sector is show in table below. It may be observed
that the forecast reflects an expectation of a substantial shift of employment away from the
main agglomerations to the existing and proposed NUCs. The former (shaded green) are
expected to continue employment growth beyond 2027, but at reduced rates, while the
latter (shaded purple), for the most part, are expected to more than double their annual
rates of growth between 2009 and 2050, as compared with 2009-2027.
Table 2 Summary of Forecast Employment Growth Rates by Study Sector
Sources: SDMP report (2008); JICA Study Team (2009)
2009-2027 2009-2050 2009-2027 2009-2050NUC's - existing 461 1,443 2,803 313% 608% 6.5% 4.5%
1 6th of October 119 335 718 282% 603% 5.9% 4.5%
12 Nasr City 47 294 704 631% 1513% 10.8% 6.9%18 10th of Ramadan 166 365 739 220% 446% 4.5% 3.7%
Others 130 449 642 346% 495% 7.1% 4.0%Agglomerations, small towns and new NUC's 4,004 5,507 8,462 138% 211% 1.8% 1.8%
2 Imbaba Markaz 463 747 654 161% 141% 2.7% 0.8%
3 Dokki 347 398 348 114% 100% 0.8% 0.0%
4 Giza 403 549 1,417 136% 352% 1.7% 3.1%
5 South Giza 137 164 387 120% 283% 1.0% 2.6%
6 Helwan 211 277 1,280 131% 606% 1.5% 4.5%
7 Maadi 283 460 403 163% 142% 2.7% 0.9%
8 Khaleafa 221 265 232 119% 105% 1.0% 0.1%
9 CBD 104 107 94 103% 90% 0.2% -0.2%
10 Shobra 264 290 254 110% 96% 0.5% -0.1%
11 Masr El Gedeeda 226 272 238 120% 105% 1.0% 0.1%
13 Ain Sham 273 390 341 143% 125% 2.0% 0.5%
14 Sadam City 212 202 177 95% 83% -0.3% -0.4%
15 Shobra El Kheima 278 391 343 141% 123% 1.9% 0.5%
16 Qalyob 236 353 309 150% 131% 2.3% 0.7%
17 Qanater 342 643 1,985 188% 581% 3.6% 4.4%Total 4,465 6,950 9,726 156% 218% 2.5% 1.9%
Y2050 Overall Growth Av. annual rate of growthNo. Study Sector Y2009 Y2027
Salam City

JICA PREPARATORY SURVEY ON GREATER CAIRO METRO LINE NO. 4
Final Report - Volume 2 5 Executive Summary
2.2.3 Student Enrolment Projections
Student enrolments are yet another important determinant for the level of demand for a
metro, or indeed for any other form of public transport system. As such, forecasted student
enrolments at the traffic zone level are used as an input for the Transport Demand
Forecasting Model for the calculation of trip generation. Summary of forecast student
enrolment and growth rates by study sector is show in table below. It may be observed that
the forecast reflects an expectation of a large shift of student numbers away from the main
agglomerations to the existing and proposed NUCs. The former (shaded green) are
expected to continuously increase in terms of student numbers beyond 2027, but at
reduced rates, while the latter (shaded purple), for the most part, are expected to double
their annual rates of growth between 2009 and 2050, as compared with 2009-2027.
Table 3 Summary of Forecasted Student Enrolment Growth Rates by Study Sector
2009-2027 2009-2050 2009-2027 2009-2050
NUC's - existing 167 1,113 2,810 666% 1680% 11.1% 7.1%1 6th of October 31 367 927 1197% 3023% 14.8% 8.7%
12 Nasr City 119 597 1,507 502% 1266% 9.4% 6.4%18 10th of Ramadan 17 149 375 849% 2144% 12.6% 7.8%
Agglomerations, smalltowns and new NUC's 3,460 4,712 7,719 136% 223% 1.7% 2.0%
2 Imbaba Markaz 400 639 610 160% 152% 2.6% 1.0%
3 Dokki 300 340 325 113% 108% 0.7% 0.2%
4 Giza 348 470 1,277 135% 367% 1.7% 3.2%
5 South Giza 118 141 349 119% 295% 1.0% 2.7%
6 Helwan 183 237 1,145 130% 627% 1.5% 4.6%
7 Maadi 245 394 376 161% 154% 2.7% 1.1%
8 Khaleafa 191 226 216 118% 113% 0.9% 0.3%
9 CBD 90 92 87 102% 97% 0.1% -0.1%
10 Shobra 228 248 237 109% 104% 0.5% 0.1%
11 Masr El Gedeeda 195 232 222 119% 113% 1.0% 0.3%
13 Ain Sham 236 334 318 141% 135% 1.9% 0.7%
14 Salam City 183 173 165 94% 90% -0.3% -0.3%
15 Shobra El Kheima 240 335 319 139% 133% 1.9% 0.7%
16 Qalyob 204 302 288 148% 142% 2.2% 0.9%
17 Qanater 296 551 1,785 186% 604% 3.5% 4.5%Total 3,635 5,825 8,781 160% 242% 2.7% 2.2%
Y2050 Overall Growth Av. annual rate of growthNo. Study Sector Y2009 Y2027
Sources: SDMP report, 2008 ; JICA Study Team 2.2.4 Car Ownership Projections
A projection of the growth in car ownership until 2050 was made as the basis for estimating
the growth in the daily number of car trips within the study area in the “without project” case
(i.e. the situation which would apply without Metro Line 4 in operation). Application of the
equation derived from the regression process to per capita GRDP resulted in determining
the forecasted car ownership rates for the period 2009-2050, as shown in the following
table.

JICA PREPARATORY SURVEY ON GREATER CAIRO METRO LINE NO. 4
Final Report - Volume 2 6 Executive Summary
Table 4 Car Ownership Forecast (Three Governorates)
Year GRDP per cap Ln (x) (x) Estimate Actual
2006 8,124.17 9.00 61.82 60.332007 8,460.14 9.04 66.90 70.082008 8,868.86 9.09 72.82 71.512009 8,985.05 9.10 74.462010 9,050.07 9.11 75.362011 9,181.94 9.12 77.182012 9,383.07 9.15 79.902020 14,238.00 9.56 132.242030 23,873.84 10.08 197.112040 37,685.37 10.54 254.402050 55,571.49 10.93 303.15
Cars per 1000 persons
Growth factor 2050/2006 6.84 4.90 Source: JICA Study Team
2.2.5 Summarized Transport Planning Indicators
The socio-economic indicators which have been assessed as bases for transport planning
in this feasibility study are summarized in table below.
Table 5 Socio-economic Indicators in the Study Area
Socio-economic framework in the study area Indicator Unit 2006 2007 2009 2012 2017 2027 2030 2040 2050
Population 1000 persons 16,101 16,464 17,217 18,411 20,369 24,192 25,387 28,801 31,815 No.of Households 1000 4,007 4,097 4,284 4,582 5,067 5,385 6,318 7,168 7,918 Household S ize Persons/household 4.02 4.02 4.02 4.02 4.02 4.02 4.02 4.02 4.02
EconomyGRDP Million L.E. 148,648 159,202 176,808 197,444 283,457 352,138 692,708 1,240,534 2,020,700 GRDP per Capita L.E. per capita 9,232 9,670 10,270 10,724 13,916 16,273 27,286 43,072 63,515 Labour force 1000 4,613 4,777 5,096 5,506 6,316 7,761 8,193 9,602 11,012 Unemployment % 7% 6% 6% 6% 5% 5% 5% 4% 4%No.of Workers (Secondary and Tertiary) 1000 workers 4,051 4,208 4,465 4,890 5,634 6,950 7,272 8,415 9,726
EducationPrimary and Preparatory 1000 students 2,305 2,328 2,447 2,638 2,922 3,614 3,854 4,545 5,249Secondary and University 1000 students 1,094 1,132 1,187 1,275 1,560 2,211 2,361 2,932 3,531Total 1000 students 3,399 3,460 3,635 3,913 4,482 5,825 6,215 7,477 8,781
Sources: SDMP report, 2008 ; JICA Study Team estimates, 2009 2.3 Analysis of Transport Demand and Services
Passenger transport share in Cairo is shown in Table 6. The daily number of passengers
transported by existing metro is roughly 2 million and total public transport mode
passengers are estimated to be 13.7 million. According to the recent data, the average
number of passengers per day between 05:15-24:15 amounted to 1.217 million on Metro
Line 1 and 0.73 million on Metro Line 2.
Table 6 Estimated Passenger Transport Share
Total Demand 13.7 million Metro 2.0 million CTA 4.1 million
Private Bus 7.6 million Sources: JICA Study Team estimates

JICA PREPARATORY SURVEY ON GREATER CAIRO METRO LINE NO. 4
Final Report - Volume 2 7 Executive Summary
2.4 Transport Demand Forecasting Model
During all steps of travel model calibrations and demand forecast, the JICA STRADA
system and the facilities of Excel spread sheets are used. In this report, methodology, step
and explanation of modelling is described.
2.5 Present and Future Transportation Demand Matrix
Based on the socio–economic framework up to 2050 and the transportation models
developed, the present and future transportation demand is estimated according to the
following conventional “four-step” approach:
(1) trip generation and attraction, (2) trip distribution, (3) modal split and (4) trip assignment. The original estimated OD matrices have 464 traffic zone bases, but are not presented in
this report due to its large volume. Therefore the forecasting results in this report are
integrated into a sector zone system with 18 zones. The demand data and OD matrixes
with the original 464 zones are only prepared in electronic based data using Excel or JICA
STRADA data format.
The present and future trip generations by zone are estimated as shown in Table 7, and the
summary results of modal share among “car mode”, “bus mode” and “rail mode” are show
in Table 8.
Table 7 Trip generation and attraction (unit; thousand trips per day)
No.
Sector Zone Gi2008
Gi2027
Gi2050
Growth Rate
2027/2008
Growth Rate
2050/2008
Growth Rate
2050/20271 6th of October 351.7 1,879.0 2,812.4 5.34 8.00 1.50 2 Imbaba Markaz 1,579.9 2,585.0 4,450.0 1.64 2.82 1.72 3 Dokki 1,470.7 1,692.5 2,313.0 1.15 1.57 1.37 4 Giza 2,124.3 2,711.9 4,491.8 1.28 2.11 1.66 5 South Giza 513.3 627.1 865.4 1.22 1.69 1.38 6 Helwan 903.6 1,064.0 3,326.3 1.18 3.68 3.13 7 Maadi 1,098.3 1,712.2 2,873.7 1.56 2.62 1.68 8 Khaleafa 921.3 968.1 1,322.8 1.05 1.44 1.37 9 CBD 719.6 593.3 802.5 0.82 1.12 1.35
10 Shobra 1,094.0 1,118.9 1,556.2 1.02 1.42 1.39 11 Masr El Gedeeda 1,619.2 1,585.1 2,171.9 0.98 1.34 1.37 12 Nasr City 1,369.0 2,583.9 3,473.3 1.89 2.54 1.34 13 Ain Sham 1,062.5 1,385.6 1,907.4 1.30 1.80 1.38 14 Salam City 841.7 773.4 1,071.9 0.92 1.27 1.39 15 Shobra El Kheima 1,137.8 1,404.4 1,927.4 1.23 1.69 1.37 16 Qalyob 882.7 1,103.4 1,477.9 1.25 1.67 1.34 17 Qanater 1,298.2 2,102.6 4,918.2 1.62 3.79 2.34 18 10th of Ramadan 191.7 687.5 1,038.2 3.59 5.42 1.51
Total 19,179.5 26,577.9 42,800.3 1.39 2.23 1.61 Source: JICA Study Team

JICA PREPARATORY SURVEY ON GREATER CAIRO METRO LINE NO. 4
Final Report - Volume 2 8 Executive Summary
Table 8 Result of Modal Share Estimation
No. of Trip (thousand trip per day) Modal share (%) Year Metro Line 4 Phase 2
Alternative Car
mode Bus
mode Rail
mode Car
mode Bus
mode Rail
mode 2008 4,584 12,693 2,412 23.3% 64.5% 12.2%
Alt 1 North 9,593 12,365 4,744 35.9% 46.3% 17.8% 2027 Alt 2 East 9,599 12,374 4,730 35.9% 46.3% 17.7% Alt 1 North 19,374 16,017 7,809 44.8% 37.1% 18.1% 2050 Alt 2 East 19,381 15,975 7,845 44.9% 37.0% 18.2%
Source: JICA Study Team 2.6 Present and Future Metro Passenger
Table 9 and Table 10 explain the number of passengers of metro by lines, each year. (Note
that the number of passengers for Metro Line 4 includes both for phase 1 and phase 2
sections). For Metro Line 4 alternative 1, the total passenger volume is expected to be 5.36
million per day, which is the same for alternative 2. However the passenger volumes on
Metro Lines 1 and 2 are lower than alternative 2, because the alignment of line 4 phase 2
section runs along the northern corridor where Metro lines 1 and 2 also compete. In Metro
Line 4 alternative 2, the passenger volume of Metro Line 4 is bigger than alternative 2, but
its phase 2 section is in conflict with Metro Line 3. It is also noted that the demand of Metro
Line No.3 is very low, as compared with alternative 1.
The demand for Metro Line 1 in 2050 surpasses the design capacity. This result suggests
improving the capacity or installing new public transportation service in this area.
Table 9 Summary of Metro Daily Demand (Metro Line No. 4 Alternative 1 North Extension)
Year Metro Line 1
Metro Line 2
Metro Line 3
Metro Line 4
Total
No. of Passengers (Station Boarding / Alighting)
1,237,000 977,000 2,214,0002008
Section Maximum Passengersper hour per direction
54,100 42,200
No. of Passengers (Station Boarding / Alighting)
2,105,000 1,381,000 1,686,000 1,968,000 3,964,0002027
Section Maximum Passengersper hour per direction
62,100 36,300 59,100 53,100
No. of Passengers (Station Boarding / Alighting)
2,704,000 1,821,000 2,087,000 2,347,000 5,362,0002050
Section Maximum Passengersper hour per direction
64,600 42,800 67,400 55,700
Source: JICA Study Team

JICA PREPARATORY SURVEY ON GREATER CAIRO METRO LINE NO. 4
Final Report - Volume 2 9 Executive Summary
Table 10 Summary of Metro Daily Demand (Metro Line No. 4 Alternative 2 East Extension)
Year Metro Line 1
Metro Line 2
Metro Line 3
Metro Line 4
Total
No. of Passengers (Station Boarding / Alighting)
1,237,000 977,000 2,214,0002008
Section Maximum Passengersper hour per direction
54,100 42,200
No. of Passengers (Station Boarding / Alighting)
2,131,000 1,452,000 1,487,000 1,814,000 4,017,0002027
Section Maximum Passengersper hour per direction
63,000 39,100 40,000 40,300
No. of Passengers (Station Boarding / Alighting)
2,700,000 1,896,000 1,904,000 2,360,000 5,365,0002050
Section Maximum Passenger per hour per direction
63,600 44,000 44,000 53,000
Source: JICA Study Team 2.7 Transit Facility Plan The design of stations along the route of Metro Line 4 will be needed to incorporate
facilities for the transfer of passengers between road transport vehicles and the metro
concourse and platforms (and vice versa). These facilities may be classified into two types:
Full modal interchange facilities at, or near, the terminal stations and possibly at one or two major intermediate stations
Pick-up and set-down facilities at all other stations not having sufficient demand for major interchange facilities
The JICA Study Team has developed conceptual layout plans for two types of modal
interchange terminal: one for a large underground terminal (El Remayah Square) and
another for an above ground terminal (El Giza Station). While these facilities will be of
different size, the same facilities (park and ride for cars and parking bays for other road
transport) will be applied to both types.
3. Track Alignment Study for Phase 1 Section
Based on the basic concept and basic design parameter which is shown in Chapter 3 in this
report, JICA Study Team proposed the Phase 1 route as shown in Figure 2.

JICA PREPARATORY SURVEY ON GREATER CAIRO METRO LINE NO. 4
Final Report - Volume 2 10 Executive Summary
Source: JICA Study Team
Figure 2 Proposed Route for Phase 1 Section
The route will start from El Malek El Saleh Sta. (Connecting Metro Line 1), running along
Salah Salem Street, and passing El Rauda, Giza Square and El Giza Sta. (Connecting
Metro Line 2 and ENR Line). After the El Giza Sta., it will pass through Pyramids Road and
the route will turn at Alexandria Desert Road to El Remayah Square.
From El Remayah Square to Workshop/Depot, three alternative access routes have been
studied. The final route will be selected in the further study stage.
Total length of the route is approximately 17 km with 15 underground stations.
4. Route Selection for Phase 2 Section
Phase 2 route is between El Malek El Saleh via El Sawaha Square and directly to Ring
Road Exit #18, with a length of about 18 km, referred to as the “northern route”. In addition,
an alternative Phase 2 route, starting from El Malek El Saleh to Nasr City, with a length of
about 23.5 km, referred to as the “eastern route”, was evaluated and compared.
The proposed routes to be compared are “Alternative 1 (Northern Route)”, the route studied
and proposed by Cairo Regional Area Transportation Study (CREATS), and “Alternative 2
(Eastern Route)”, the route studied and proposed in the “Greater Cairo Public Transport
Study, Report 2, Integrated Public Transport Network Scenarios” by SYSTRA.
Northern Route and Eastern Route are shown in Figure 3.

JICA PREPARATORY SURVEY ON GREATER CAIRO METRO LINE NO. 4
Final Report - Volume 2 11 Executive Summary
Source: JICA Study Team, Map: Quickbird
Figure 3 Alternative Route Corridor for Phase2 Section (Northern Route and Eastern Route)
JICA Study Team has used Multi Criteria Analysis (MCA) to select the route. Result of the
analysis is shown in Table 11.
Table 11 Comparison Considering Transportation Demands in 2050
Alternative 1 (Northern Route) Alternative 2 (Eastern Route)
Multi-Criteria Analysis Score in
words Score Weight
Scorex
Weight
Score in
wordsScore Weight
Scorex
Weight
Transportation Demand in the Far Future:2050
High 9.4 1.2 11.5 High 8.9 1.2 10.9
Cost Mod 5.4 1.2 6.5 Mod 4.6 1.2 5.5 Hard points Low 3.2 0.8 2.4 High 8.6 0.8 6.5 Construction Easiness Mod 5.0 0.7 3.4 High 7.8 0.7 5.3 Construction Schedule Mod 6.9 0.8 5.4 Mod 5.7 0.8 4.5 Environment Mod 6.9 0.8 5.6 High 5.3 0.8 4.3 Archaeological Assets High 7.4 0.9 6.3 Low 3.2 0.9 2.7
Total/Average/Total 44.2 1.0 41.1 44.1 1.0 39.7Source: JICA Study Team

JICA PREPARATORY SURVEY ON GREATER CAIRO METRO LINE NO. 4
Final Report - Volume 2 12 Executive Summary
JICA Study Team recommends the construction of both alternative routes of the metro,
considering the future transportation demands. The 2022 transportation demands of both
lines are large enough to require the construction of the metro. However, the 2022
transportation demand of Alternative 1 is larger than that of Alternative 2.
The rehabilitation of the tramway line from Abbasia to Nasr City to efficiently connect Nasr
City with the Metro Line 3 was recommended in the “Greater Cairo Public Transport Study,
Report 2, Integrated Public Transport Network Scenarios” prepared by SYSTRA. Moreover,
the study for the rehabilitation of this tramway as a Super Tram has already started with the
financial support from World Bank.
The construction of stations on Port Side Street has some conflicts with Spine Waste Water
Tunnel (SWWT). However, the recent underground construction technology and experience
show that such conflict can be solved with limited additional cost.
Therefore, JICA Study Team recommends to give priority to Alternative 1 (Northern Route)
and to implement the feasibility study.

CHAPTER 1 INTRODUCTION

JICA PREPARATORY SURVEY ON GREATER CAIRO METRO LINE NO.4
Final Report - Volume2 1-1
CHAPTER 1 INTRODUCTION
1.1 Background of the Study
The Greater Cairo Region, which steeped in history and contains large numbers of
historical structures, is the premier city in Egypt. It is the largest city in the African continent
and the Middle East region with a population of over 18 million, representing 25% of the
total population of Egypt. The Cairo Metro, the only specialized metro system operating in
the African continent, commenced construction in 1981. Its design was based on “Plans for
Construction of Cairo Metro 3 Lines”, developed by Société Française d’études et de
réalisations de transports urbains (SOFRETU) in 1973 to improve road traffic congestion.
The current status of Cairo Metro is as follows.
Metro Line 1 Phase 1 (28 km) started operation in 1987. The whole line (44 km) in full service by 1989.
Metro Line 2 Phase 1 (8 km) started operation in 1996. The whole line (21.6 km) in full service by 2005.
Metro Line 3 Phase 1 (4.3 km) under construction, scheduled to start operation in 2011. The whole line is 34.2 km.
Metro Line 3 was proposed in the “New Public Transportation Study of the Great Cairo
Area” conducted by SYSTRA in 1998-2000 and in the “Cairo Regional Area Transportation
Study” (CREATS) conducted under a JICA Study in 2000-2002.
As the population of the Greater Cairo Region is envisaged to increase to 20 million by the
year 2017 according to the SDMP report, the Government of Egypt (GOE) is reforming the
urban structure, changing from a mono-centric form to a decentralized form, notably
through the development of New Urban Communities (NUCs), such as 10th of Ramadan
City and 6th October City. However, the increased transport demand has not been
accompanied by a substantial solution to urban problems, such as road traffic congestion,
insufficient public transportation services and air pollution.
As a long term strategic development plan, General Organization for Physical Planning
(GOPP) has prepared the Cairo Vision 2050. This vision document proposes 14 metro
routes as the main public transport system in the Greater Cairo Region.
As a consequence, GOE has decided to construct, as early as practicable, Metro Line 4 as
initially proposed by CREATS, and requested the Government of Japan (GOJ) in October
2008 to implement the “Development Study on Greater Cairo Metro Line No.4 Project
(Metro Line 4 Project)”. Japan International Cooperation Agency (JICA), the official agency
responsible for the implementation of GOJ’s program, has discussed with National Authority
for Tunnels (NAT) of Ministry of Transport and has agreed to conduct a feasibility study for
the Greater Cairo Metro Line No.4 (Metro Line 4). The document for the Scope of Work
was signed on 21st December 2008.

JICA PREPARATORY SURVEY ON GREATER CAIRO METRO LINE NO.4
Final Report - Volume2 1-2
1.2 Objective of the Study
The primary objective is to conduct a feasibility study for Metro Line 4 (line length
approximately 45 km), from a depot adjacent to Dream Land to El Sawaha Square or Nasr
City via the Grand Egyptian Museum (GEM), El Giza Station of Metro Line 2 and El Malek
El Saleh Station of Metro Line 1. This feasibility study will adopt suitable approaches for the
mitigation of urban transport congestion and contribute to the sustainable development of
the Greater Cairo Region. The following four key objectives will form the foundation of the
study:
- To formulate a proposed route for Metro Line 4
- To assess the justification of the project
- To appropriately plan the project considering its technical, economical and
financial, environmental and social aspects
- To carry out technology transfer to the Egyptian counterpart personnel in the
course of the study
The feasibility study entitled “JICA Preparatory Survey on Greater Cairo Metro Line No. 4 in
the Arab Republic of Egypt” consists of four reports. The main tasks and activities to be
covered in these reports are as follows:
a) Report No. 1 (Volume 1)
- Data collection, diagnosis of the existing public transport system and urban
development hypothesis;
- Collection of the relevant data about the existing and foreseen public utilities;
- Collection of the relevant socio-economic data; and
- Collection of the relevant data for preliminary design.
b) Report No. 2 (Volume 2)
- Analysis of all data collected for generation of Origin and Destination (O/D)
matrices and development of a transportation study of the Greater Cairo Metro
Line 4;
- Recording of all data concerning vehicles and all transport modes, conduct of
field traffic survey in the study area, and review of the demand forecast; and
- Comparison and evaluation of two alternative corridors regarding Metro Line 4
alignment.
c) Report No.3 (Volume 3)
- Preparation of design guidelines and criteria and general features of Metro Line
4 Phase 1.
- Preparation of the general design specifications of Metro Line 4.
d) Report No. 4 (Volume 3)
- Submission of the final results and the pertinent analysis showing the feasibility

JICA PREPARATORY SURVEY ON GREATER CAIRO METRO LINE NO.4
Final Report - Volume2 1-3
of the implementation of the whole project from both economic and financial
perspectives.
1.3 Study Area and Administrative Setting
The Study Area, shown in Figure 1-1, covers two phases, namely, (a) Phase 1 of the
proposed Metro Line 4 that runs from a depot/workshop via GEM to El Malek El Saleh
Station (with a length of about 21 km) and (b) Phase 2 which is a route between El Malek El
Saleh via El Sawaha Square and the Ring Road (Exit No. 18) (with a length of about 18
km). In addition, an alternative Phase 2 route, starting from El Malek El Saleh to Nasr City
(with a length of about 23 km), will be evaluated and compared with the originally proposed
route.
Source: JICA Study Team
Figure 1-1 Study Area
CHAPTER 2 TRANSPORTATION STUDY

JICA PREPARATORY SURVEY ON GREATER CAIRO METRO LINE NO.4
Final Report - Volume2 2-1
CHAPTER 2 TRANSPORTATION STUDY
2.1 Transport Survey
2.1.1 Introduction
Field data collection in transportation studies can be considered as an important milestone.
This is for two main reasons: first, because most of the decision-making process is usually
based on these data and second, it needs great effort and cost to be implemented. The
data usually needed for transportation studies can be classified into three main types,
namely, socioeconomic and land use data, transportation infrastructure data, and travel
pattern data. This report is intended to a part of the travel pattern data, which is traffic and
interview data.
In that context, it will be very helpful to summarize the main findings of the traffic survey
results of the recent related studies as it can be used in this study. These existing traffic
count data will be very useful in analyzing the road traffic conditions and its future trends.
2.1.2 Summary of Previous Survey
JICA has carried out various traffic count surveys after the CREATS Project in 2002. The
JICA projects after CREATS are as follows (see Table 2-1)
1. JICA PPP
2. JICA Toll Expressway
3. JICA SDMP Table 2-1 Summary of Previous Survey
Project Survey Hour
Number of Traffic Survey
Date of Traffic Survey
JICA PPP Public Private Partnership Program For Cairo Urban Expressway Network Development(May 2006)
16 28 May 2005
JICA Toll Expressway
Feasibility Study on High Priority Urban Toll Expressways In Cairo In Arab Republic of Egypt(January 2009)
18 or 24
24 ※18hour:22,
※24hour:2
Autumn 2007 or
Winter 2008 JICA SDMP The Strategic Urban Development
Master Plan Study for Sustainable Development of the Greater Cairo Region in the Arab Republic of Egypt(January 2008)
16 8 December 2007
Source: JICA PPP, JICA Toll Express way, JICA SDM Figure 2-1 illustrates the traffic count locations for the three aforementioned studies while
Figure 2-2 shows the traffic survey periods for each location. Figure 2-3 depicts the daily
traffic volume at each of these locations on the Greater Cairo map. Table 2-3 summarizes
the exact daily traffic volume at each of the traffic count locations.
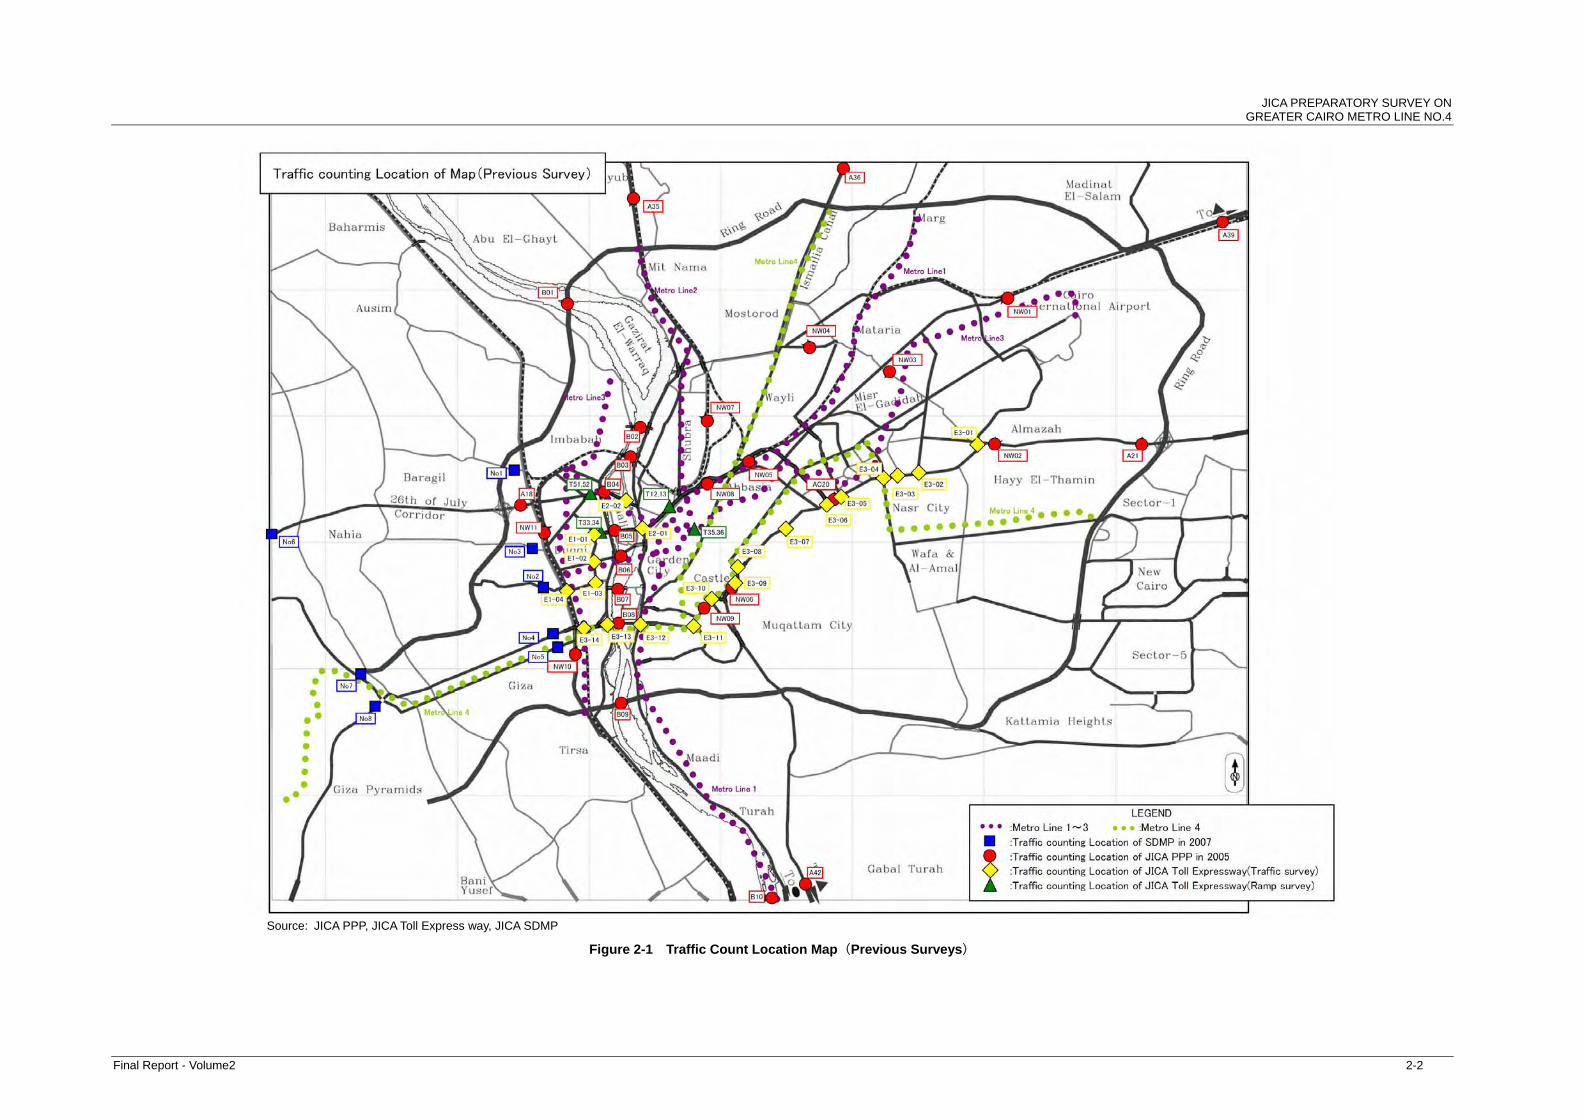
JICA PREPARATORY SURVEY ON GREATER CAIRO METRO LINE NO.4
Final Report - Volume2 2-2
Source: JICA PPP, JICA Toll Express way, JICA SDMP
Figure 2-1 Traffic Count Location Map(Previous Surveys)

JICA PREPARATORY SURVEY ON GREATER CAIRO METRO LINE NO.4
Final Report - Volume2 2-3
Source: JICA PPP, JICA Toll Express way, JICA SDMP
Figure 2-2 Traffic Survey Hours(Previous Surveys)

JICA PREPARATORY SURVEY ON GREATER CAIRO METRO LINE NO.4
Final Report - Volume2 2-4
Source: JICA PPP, JICA Toll Expressway, JICA SDM
Figure 2-3 Traffic Volume at Each Location Converted to 24-hour Unit(Previous Surveys)

JICA
PR
EP
AR
AT
OR
Y S
UR
VE
Y O
N
GR
EA
TE
R C
AIR
O M
ET
RO
LINE
NO
.4
Final R
eport – V
olume 2
2-5
Table 2-2 Previous Traffic Survey Data
Source: JICA PPP, JICA Toll Express way, JICA SDMP
*Note:24 hours convert is used previous survey result of T51~T52(Rate of 16hours traffic volume:85%, Rate of 18hours traffic volume:94%)
Average24hourconvert
1 El- Barageel Street next to Imbaba airport. 21,467 - 25,236 -
2 Nahya Street next to Boulaq terminal. 14,132 - 16,613 -
3 26th of July corridor in the reach from Giza to Ring Road (near Ring Road). 100,791 - 118,486 -
4 Faisal Street next to Sports Collage. 57,789 - 67,935 -
5 Al-Haram (Pyramids) street next to Electricity Distribution Company Building. 52,862 - 62,143 -
6 26th of July corridor between Ring Road and Shaikh Zayed entrance. 39,640 - 46,599 -
7 The beginning of El-Wahat road near the Ring Road. 28,964 - 34,049 -
8 The beginning of El-Fayyoum road in front of the electricity station. 36,264 - 42,631 -
B01 Warraq Bridge 45,992 - 54,066 -
B02 Rodh El Farag Bridge 83,666 - 98,355 -
B03 Imbaba Bridge 21,574 - 25,362 -
B04 15th of May Bridge 118,548 - 139,361 -
B05 6th of October Bridge 259,798 - 305,409 -
B06 Galaa Bridge 55,902 - 65,716 -
B07 Gamah Bridge 70,991 - 83,454 -
B08 Giza Bridge 82,425 - 96,896 -
B09 Moneeb Bridge 104,066 - 122,336 -
B10 Marazeeq Bridge 12,494 - 14,687 -
A18 26th of July Corridor 78,439 - 92,210 -
A21 Suez Desert Road 35,866 - 42,163 -
A35 Alex. Agriculture Road 89,080 - 104,719 -
A36 Ismailia Agriculture Road 27,169 - 31,939 -
A39 Ismailia Desert Road 79,534 - 93,497 -
A42 Autostrade 32,579 - 38,299 -
AC20 Nasr Road 169,714 - 199,509 -
NW01 24-May Gesr El-Suez St. 67,454 - 79,296 -
NW02 25-May Suez Desert Road 51,872 - 60,979 -
NW03 24-May Abo Bakr El-Sedeeq St. 49,464 - 58,148 -
NW04 Kablat Street 22,565 - 26,527 -
NW05 Lotfy El-Sayed 51,533 - 60,580 Direction of traffic is only one way
NW06 24-May Autostrade Road 63,785 - 74,983 -
NW07 Ahmed Helmy St. 35,380 - 41,591 -
NW08 Ramsis St. 78,451 - 92,224 -
NW09 Salah Salem Road 90,999 - 106,975 -
NW10 Tereat El-Zomor Road 42,993 - 50,541 -
NW11 Sudan St. 35,442 - 41,664 -
T12~13 28-Jan 18 Through traffic to Ramsis sq and Tahreer sq. 180,939 - 192,690 -
T33~34 4-Feb 24 Through to Ramsis direction and Dokki direction 103,056 - 103,056 -
T35~36 4-Feb 18 Al-Azhar Tunnel 59,973 - 63,868The traffic movement stopped from 10:10 to 11:50due to an accident in the tunnel
T51~52 30-Jan 24 Through Traffic to lebanon sq. 70,281 - 70,281 -
NotesSort ofsurvey
Code Year DateSurveyhour
Location
SDMP
2008
2007 4-Dec 16
2005JICA-PPP
JICA-TollExpress No2
RampSurvey
16
23-May
24-May
25-May
30-May
30-May
30-May
24-May
Traffic Volume

JICA
PR
EP
AR
AT
OR
Y S
UR
VE
Y O
N
GR
EA
TE
R C
AIR
O M
ET
RO
LINE
NO
.4
Final R
eport – V
olume 2
2-6
Table 2-2 Previous Traffic Survey Data (2)
Source: JICA PPP, JICA Toll Express way, JICA SDMP *Note:24 hours convert is used previous survey result of T51~T52(Rate of 16hours traffic volume:85%, Rate of 18hours traffic volume:94%)
Average24hourconvert
11-Sep (121,796)29-Oct (94,024)22-Oct (93,605)6-Nov (93,540)22-Oct (122,550)6-Nov (125,392)23-Oct (84,471)7-Nov (73,122)11-Sep (126,385)30-Oct (113,037)11-Sep (98,664)30-Oct (105,684)5-Sep (104,973)29-Oct (142,870)29-Oct (66,946)31-Oct (79,990)16-Oct (95,283)31-Oct (100,873)16-Oct (104,785)31-Oct (138,756)17-Oct (96,215)5-Nov (113,386)10-Sep (131,718)5-Nov (136,153)17-Oct (60,120)5-Nov (73,565)10-Sep (95,069)13-Nov (111,694)10-Sep (123,370)13-Nov (130,871)17-Oct (143,828)30-Oct (145,789)23-Oct (150,624)7-Nov (119,261)23-Oct (81,551)7-Nov (85,460)24-Oct (87,124)12-Nov (94,789)24-Oct (142,373)12-Nov (136,515)
Surveyhour
LocationTraffic Volume
NotesSort ofsurvey
Code Year Date
Traffic Volume of Western section
Traffic Volume of Southern section
Traffic Volume of Western section
Traffic Volume of Eastern section
Traffic Volume of Western section
Traffic Volume of Northern section
Traffic Volume of Eastern section
Traffic Volume of Southern section
Traffic Volume of Northern section
Traffic Volume of Eastern section
Traffic Volume of Eastern section
Traffic Volume of Southern section
Traffic Volume of Western section
Traffic Volume of Eastern section
Traffic Volume of Eastern section
Traffic Volume of Southern section
Traffic Volume of Western section
Traffic Volume of Eastern section
Traffic Volume of Southern section
Traffic Volume of Western section
139,444
144,809
83,914
134,943
83,506
90,957
133,936
66,843
103,382
127,121
73,468
98,078
121,771
104,801E03-5
E03-4
E03-3
107,910
93,573
123,971
78,797
119,711
102,174
123,922
E03-9
E03-8
E03-7
E03-6
Sayyidah Ashah Square
Salah Salem / El Nasr Road next to E3-08
Salah Salem / El Nasr Road / El Mokattm Road
E01-1
E01-2
E01-3
E01-4
E02-1
E02-2
E03-1
Giza Square / Flyover
Giza Bridge (Gamal Abd El Naser )
Salah Salem / Corniche El Nil / Flyover
Magra El Ayoun / Salah Salem / Ain Al Sira
E1 Highway (Exits/Entrances/Main Way) at North Tahrir /Galaa Street /Ramses Stre
Abd Al Salam Arif /Sudan Street / Flyover
Cairo University (Sarwat / Gamiat El Qahira / Dokki Street)
Doqqi Square / Flyover (El Tahrir / Dokki Street)
18
AL NAHDA (6th October Bridge / El Batal Ahmed Abdel Aziz / Wazaret AlZerra)
El Nasr Road / Ahmed Said / Al Amir Qaraqush
Imtedad Ramsis / El Nasr Road / Flyover
Fangray / El Nair Road
Nair Road / Yousof Abbas
El Nasr Road / El Tayaran
El Nasr Road / Abbas El Aqqad / Nozha
El Nasr / Cairo Suez Road / Flyover
15th of May Bridge East (26th of July Street / Corinch El Nile)
JICA-TollExpress No1
TrafficSurvey
2007
E03-2
E03-14
E03-13
E03-12
E03-11
E03-10
114,918
99,650
132,022
127,486
108,810
131,970
78,239
104,448
129,679
111,607
142,634
71,184
110,096
135,376
154,213
143,706
88,929
96,864
148,500

JICA PREPARATORY SURVEY ON GREATER CAIRO METRO LINE NO.4
Final Report – Volume 2 2-7
2.1.3 Components and Purpose of Transport Survey
The transport survey in this study consists of four main components as follows:
1.Link Traffic Count Survey (LT survey)
2.Screen Line Survey (SL survey)
3.Interview Survey for Car Users and Public Transport Users
4.Interview Survey for Tourists
The purpose of this transport survey is:
To recognize the traffic volume characteristics on the roads along the route of
Metro Line 4.
To study the direct impact on the road traffic along Metro Line 4, such as the
level of service, air pollution and noise level.
To get necessary information for traffic control and management plans during
the construction stage.
Validate the main output of the transportation planning models that will be
developed in this study, On the other hand, the main objectives of the interview survey are:
To calibrate a modal choice model
To measure their willingness to pay for a new metro service that would be
safer and more time-saving
2.1.4 Link Traffic Count Survey
(1) Survey Locations
As mentioned earlier, JICA has executed various traffic surveys in previous studies.
Therefore, the number of survey locations was decided considering the maximum and
effective usage of their results. The traffic count survey locations should be along the
proposed route of Metro Line 4. The proposed route consists of two phases: the first phase
will be along Pyramids Road starting from an area close to El Remayah Square until El
Malek El Saleh. As for the second phase, there are two main alternatives: the first will be
through Port-Said Street to the north direction and the second will be to the east direction to
Nasr City District. Twelve main locations were selected along the route of phase 1 after
discussion with National Authority for Tunnel (NAT) representatives. Figure 2-4 shows these
locations and Table 2-3 shows the corresponding list. Appendix 1 shows their respective
exact locations. As for the north direction alternative of phase 2, ten locations were
proposed after discussion with NAT representatives. Figure 2-5 also depicts these locations
and Table 2-4 shows the related list. Appendix 2 meanwhile shows the corresponding exact
locations.
The locations for the east alternative of phase 2 will be delayed until the exact route
alignment is finally established.

JICA PREPARATORY SURVEY ON GREATER CAIRO METRO LINE NO.4
Final Report – Volume 2 2-8
Source: JICA Study Team
Figure 2-4 Proposed Link Traffic Count Survey Locations along Pyramids Road
Table 2-3 List of Link Traffic Count Survey Locations along Pyramids Road
Ser. no Code Location
1 LT1 El Remaya Square
2 LT2 Close to Mansouria intersection
3 LT3 Close to Maryoutia intersection
4 LT4 Close to EL-Shaikh El-Sherbini intersection (Matba’ah Station)
5 LT5 Close to Kafr Tohormos Street intersection
6 LT6 Close to Sayed Abo-Khair Street intersection
7 LT7 Close to Ter’et El-Zomor Street intersection
8 LT8 Between El Giza Square and El-Haram Tunnel
9 LT9 El-Gam’ah Street close to Giza Square
10 LT10 Mourad Street close to Giza Square
11 LT11 Close to Abbas Bridge
12 LT12 Rabeea El-Jeezi Street close to Giza Square
Source: JICA Study Team
Table 2-4 List of Link Traffic Count Survey Locations along Port-Said Street
Ser. no Code Location
1 LT13 Close to Sayyedah Zainab Square
2 LT14 Port Said between Bab El-Khalq Square and Sayyedah Zainab Square
3 LT15 Port Said - between El-Gaish Square and Bab El-Khalq Square
4 LT16 Close to Ghamrah Bridge from the south direction
5 LT17 Between Dair El-Malak and El-Sharakat Streets
6 LT18 Port Said - between Sekkat- El-Wayly Street and Ghamrah Bridge
7 LT19 Close to El-Swaah Square from the south side
8 LT20 Port Said extension (Ismaellia agricultural road) -between El- Ameeryah Bridge and Mostorod Bridge
9 LT21 Port Said extension (Ismaellia agricultural road) -between Mostorod Bridge and the Ring Road
10 LT22 Between Mostorod and Ring Road Source: JICA Study Team

JICA PREPARATORY SURVEY ON GREATER CAIRO METRO LINE NO.4
Final Report – Volume 2 2-9
Source: JICA Study Team, 2009
Figure 2-5 Proposed Link Traffic Count Survey Locations along Port Said Street
E

JICA PREPARATORY SURVEY ON GREATER CAIRO METRO LINE NO.4
Final Report – Volume 2 2-10
(2) Vehicle Types
The traffic volume will be counted manually. It will be classified based on the following ten
vehicle types:
Passenger Car
Taxi
Shared Taxi/Minibus
Bus
Pick-up
Truck
Heavy Truck (over 3-Axle, trailer and semi-trailer)
Motorcycle / Bicycle
Others A form, shown in Figure 2-6, was designed by JICA Study Team to be used for the traffic
count process by the surveyors.
(3) Traffic Count Period
The traffic count will be conducted on two different working days (Monday, Tuesday, or
Wednesday). The traffic count period will be 19 hours from 6:00 am to 1:00 am at all
locations except for two locations at Pyramids Road (El-Haram Street) and one location at
Port Said Street, where the period will be 24 hours. The main objective of the 24-hr
counting locations is to get some factors for converting the other 19-hr traffic count
locations to equivalent 24-hr counts.
2.1.5 Screen Line Traffic Count Survey
The main objective of the screen line survey is to validate the main output of the
transportation planning models that will be developed in this study. The traffic count
process at the screen line locations has been already finished.
(1) Screen Line Locations
Nine main locations were selected for the traffic count. All the screen line locations actually
consist of bridges over the Nile River. Figure 2-7 shows these locations and Table 2-5
shows the related list. Appendix 3 meanwhile shows the exact locations of each.

JICA PREPARATORY SURVEY ON GREATER CAIRO METRO LINE NO.4
Final Report – Volume 2 2-11
Source: JICA Study Team
Figure 2-6 Traffic Count Form

JICA PREPARATORY SURVEY ON GREATER CAIRO METRO LINE NO.4
Final Report – Volume 2 2-12
(2) Screen Line Traffic Count Periods
All the screen line locations were conducted on two days, i.e., one on a normal working day
and the other on a Friday. The traffic count period was 16 hours from 6:00 am to 10:00 pm
for all locations. The process was conducted with the same procedure as the previous
traffic count location considering the same vehicle type classification.
Source: JICA Study Team
Figure 2-7 Screen Line Survey Location Map
Table 2-5 List of Screen Line Survey Locations, Survey Day and Dates
Link Name Link Code Day Survey Date Ring Road at Maadi Bridge SL1 Wednesday, Friday 27th May, 29th May Abbas Bridge SL2 Monday, Friday 25th May, 29th May Al-Gamah Bridge SL3 Monday, Friday 25th May, 5th June Qasr El Neel Bridge SL4 Tuesday, Friday 19th May, 12th June 6th October Bridge – between Abdel-Monem Riyadh and Zamalek ramps
SL5 Tuesday, Friday 19th May, 12th June
15 May Bridge SL6 Tuesday, Friday 19th May, 12th June Imbaba Bridge SL7 Wednesday, Friday 20th May, 5th June Rod AlFarag Bridge SL8 Wednesday, Friday 20th May, 5th June Ring Road at Alwarraq Bridge SL9 Wednesday, Friday 27th May, 29th May Source: JICA Study Team