final report june 2018 - smtc › ... › 2018-fville_transp-lu_analysis.pdf · 2019-05-03 ·...
TRANSCRIPT
FAYETTEVILLE ROUTE 5 TRANSPORTATION AND LAND USE ANALYSIS
Final Report
June 2018

FAYETTEVILLE ROUTE 5 TRANSPORTATION AND LAND USE ANALYSIS
Syracuse Metropolitan Transportation Council
Final Report
June 2018
This document was prepared with financial assistance from the Federal Highway Administration and the
Federal Transit Administration of the U.S. Department of Transportation through the New York State
Department of Transportation. The Syracuse Metropolitan Transportation Council is solely responsible
for its contents.
For further information, contact:
Meghan Vitale, Project Manager
James D’Agostino, Director
Syracuse Metropolitan Transportation Council
126 N. Salina St., 100 Clinton Square, Suite 100 Syracuse, NY 13202
PHONE : (315) 422-5716 FAX: (315) 422-7753
www.smtcmpo.org

Fayetteville Route 5 Transportation and Land Use Analysis Final Report June 2018
ii
TABLE OF CONTENTS
1 Introduction ...............................................................................................................................1
1.1 Overview and study area .............................................................................................................. 1
1.2 Study process ................................................................................................................................ 1
2 Background research ..................................................................................................................3
2.1 Previous studies ............................................................................................................................ 3
2.1.1 Transportation planning studies ......................................................................................... 3
2.1.2 Traffic impact studies.......................................................................................................... 5
2.2 Traffic data .................................................................................................................................... 7
2.2.1 Historic Route 5 traffic volumes ......................................................................................... 7
2.2.2 Intersection traffic volumes ................................................................................................ 9
2.2.3 Current intersection capacity analysis ................................................................................ 9
2.3 Existing plans ............................................................................................................................... 11
2.4 Background research summary .................................................................................................. 12
3 Existing conditions .................................................................................................................... 14
3.1 Study area roadway description ................................................................................................. 14
3.1.1 Functional classification and ownership ............................................................................. 14
3.1.2 Roadway cross-sections ...................................................................................................... 14
3.1.3 On-road pedestrian and bicycle facilities ............................................................................ 15
3.2 Travel time study ........................................................................................................................ 16
3.3 Traffic flow in western village ..................................................................................................... 21
3.4 Travel demand model outputs .................................................................................................... 25
3.4.1 Consistency with observed existing conditions .................................................................. 25
3.4.2 Volume-to-capacity ratios ................................................................................................... 26
3.4.3 Trip origins and destinations ............................................................................................... 26
3.5 Hourly traffic volumes ................................................................................................................. 28
3.6 Transit routes and ridership ........................................................................................................ 29
4 Future traffic flow conditions .................................................................................................... 31
4.1 Future Base traffic volumes ........................................................................................................ 31
4.2 Anticipated future development ................................................................................................ 31
4.3 Future traffic volumes with proposed development .................................................................. 33
4.4 Route 290 capacity increase ....................................................................................................... 36

Fayetteville Route 5 Transportation and Land Use Analysis Final Report June 2018
iii
5 Issues and opportunities ........................................................................................................... 40
5.1 Overview ..................................................................................................................................... 40
5.2 Overall traffic characteristics ...................................................................................................... 40
5.2.1 Impact of local trips on overall traffic volumes .................................................................. 40
5.2.2 Impact of route and mode choice for commuters .............................................................. 40
5.3 Western portion of village (west of Salt Springs Road) .............................................................. 42
5.3.1 Delay at signalized intersections ......................................................................................... 42
5.3.2 Capacity of Route 5 between Highbridge Street and Salt Springs Road ............................. 42
5.3.3 Driveways on Route 5 in lower business district ................................................................ 43
5.4 Route 5/Route 257/Salt Springs Road intersections .................................................................. 43
5.4.1 Signalized intersection operations ...................................................................................... 43
5.4.2 Potential for roundabouts .................................................................................................. 44
5.4.3 Other changes ..................................................................................................................... 46
5.5 Eastern portion of village (east of Salt Springs Road) ................................................................. 46
5.5.1 Numerous driveways and side streets along Route 5......................................................... 46
5.5.2 Turning movements from side streets onto Route 5 .......................................................... 48
6 Summary and conclusions ......................................................................................................... 50
6.1 Summary of significant findings .................................................................................................. 50
6.2 Conclusion ................................................................................................................................... 51
APPENDICES
Appendix A: Public meeting summary
Appendix B: Route 5 and Route 290 Travel Time Study Memorandum
Fayetteville Route 5 Transportation and Land Use Analysis Final Report June 2018
iv
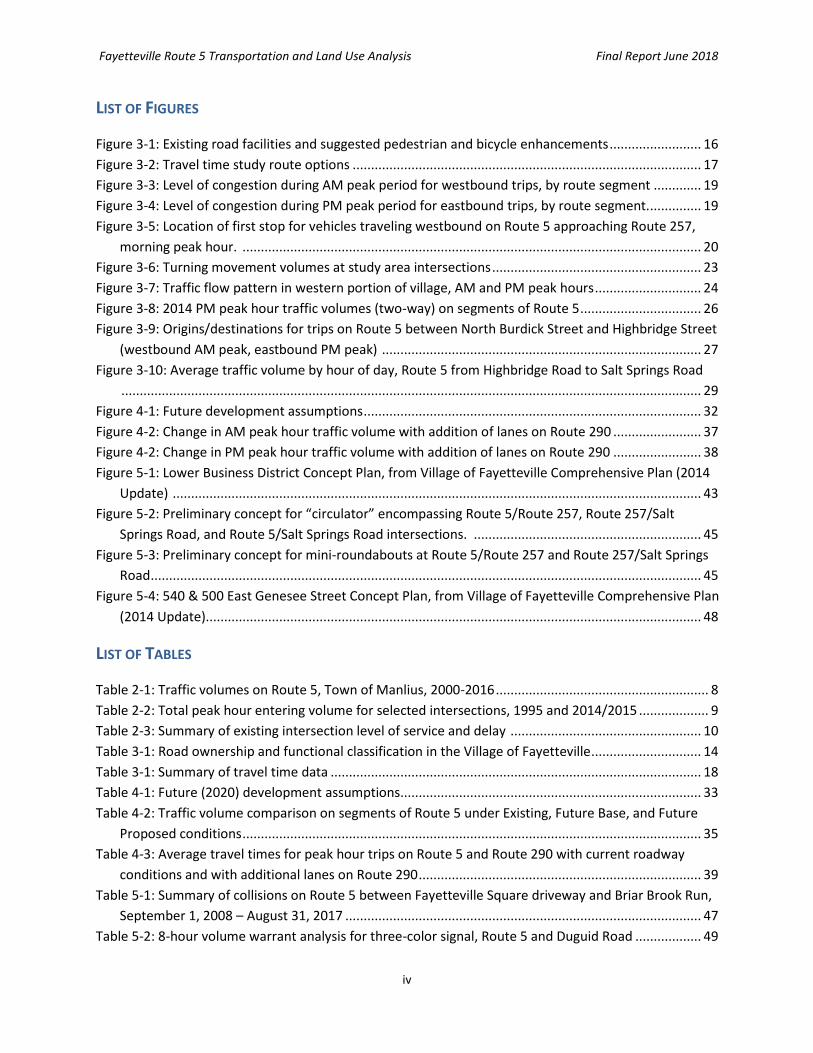
LIST OF FIGURES
Figure 3-1: Existing road facilities and suggested pedestrian and bicycle enhancements ......................... 16
Figure 3-2: Travel time study route options ............................................................................................... 17
Figure 3-3: Level of congestion during AM peak period for westbound trips, by route segment ............. 19
Figure 3-4: Level of congestion during PM peak period for eastbound trips, by route segment. .............. 19
Figure 3-5: Location of first stop for vehicles traveling westbound on Route 5 approaching Route 257,
morning peak hour. ............................................................................................................................. 20
Figure 3-6: Turning movement volumes at study area intersections ......................................................... 23
Figure 3-7: Traffic flow pattern in western portion of village, AM and PM peak hours ............................. 24
Figure 3-8: 2014 PM peak hour traffic volumes (two-way) on segments of Route 5 ................................. 26
Figure 3-9: Origins/destinations for trips on Route 5 between North Burdick Street and Highbridge Street
(westbound AM peak, eastbound PM peak) ....................................................................................... 27
Figure 3-10: Average traffic volume by hour of day, Route 5 from Highbridge Road to Salt Springs Road
.............................................................................................................................................................. 29
Figure 4-1: Future development assumptions ............................................................................................ 32
Figure 4-2: Change in AM peak hour traffic volume with addition of lanes on Route 290 ........................ 37
Figure 4-2: Change in PM peak hour traffic volume with addition of lanes on Route 290 ........................ 38
Figure 5-1: Lower Business District Concept Plan, from Village of Fayetteville Comprehensive Plan (2014
Update) ................................................................................................................................................ 43
Figure 5-2: Preliminary concept for “circulator” encompassing Route 5/Route 257, Route 257/Salt
Springs Road, and Route 5/Salt Springs Road intersections. .............................................................. 45
Figure 5-3: Preliminary concept for mini-roundabouts at Route 5/Route 257 and Route 257/Salt Springs
Road ...................................................................................................................................................... 45
Figure 5-4: 540 & 500 East Genesee Street Concept Plan, from Village of Fayetteville Comprehensive Plan
(2014 Update)....................................................................................................................................... 48
LIST OF TABLES
Table 2-1: Traffic volumes on Route 5, Town of Manlius, 2000-2016 .......................................................... 8
Table 2-2: Total peak hour entering volume for selected intersections, 1995 and 2014/2015 ................... 9
Table 2-3: Summary of existing intersection level of service and delay .................................................... 10
Table 3-1: Road ownership and functional classification in the Village of Fayetteville .............................. 14
Table 3-1: Summary of travel time data ..................................................................................................... 18
Table 4-1: Future (2020) development assumptions .................................................................................. 33
Table 4-2: Traffic volume comparison on segments of Route 5 under Existing, Future Base, and Future
Proposed conditions ............................................................................................................................. 35
Table 4-3: Average travel times for peak hour trips on Route 5 and Route 290 with current roadway
conditions and with additional lanes on Route 290 ............................................................................. 39
Table 5-1: Summary of collisions on Route 5 between Fayetteville Square driveway and Briar Brook Run,
September 1, 2008 – August 31, 2017 ................................................................................................. 47
Table 5-2: 8-hour volume warrant analysis for three-color signal, Route 5 and Duguid Road .................. 49

Fayetteville Route 5 Transportation and Land Use Analysis Final Report June 2018
v
EXECUTIVE SUMMARY
The Fayetteville Route 5 Transportation and Land Use Analysis was completed as part of the Syracuse
Metropolitan Transportation Council’s (SMTC) Unified Planning Work Program (UPWP). The village’s
stated goal in requesting this analysis was to “identify methods to allow the Village of Fayetteville to
continue to develop existing underutilized properties by improving and/or creating new vehicle capacity
within the village.” The study area for this analysis included all of the Village of Fayetteville, with a focus
on Route 5. A Study Advisory Committee (SAC) consisting of the Village of Fayetteville, Town of Manlius,
New York State Department of Transportation, and the Syracuse-Onondaga County Planning Agency was
formed to guide the study.
As part of the overall study effort, a “travel time study” was conducted that used GPS data collected by
SMTC staff to compare peak period travel times on Route 5 and Route 290. The methodology and resulting
data are described in detail within the body of this report as well as an attached memorandum. The travel
time data collection results showed that all average travel times (eastbound and westbound, morning and
evening peak periods) were less than 20 minutes between Mycenae (Route 5/Route 290 intersection) and
Midler Avenue on I-690 in the City of Syracuse. In all cases, the overall average travel time on Route 5 was
greater than the average travel time on Route 290, but only by four minutes at most.
With input from the SAC, an anticipated future land use scenario was defined that included nearly 430
additional residential units and 100,000 square feet of additional commercial development within and
adjacent to the Village of Fayetteville by the year 2020. The SMTC’s travel demand model was used to
evaluate the impacts of this anticipated development on traffic volumes within the village. The model
indicated about 4 percent to 12 percent total growth on segments of Route 5 over six years with the
anticipated development. This equates to up to 100 additional vehicles in the morning peak hour and up
to 150 additional vehicles in the evening peak hour, which is not expected to substantially change the
operating conditions along Route 5. The model was also used to evaluate a scenario with an additional
travel lane in each direction on Route 290 between Basile Rowe and Route 5. This scenario resulted in
very little traffic diversion from Route 5 to Route 290, suggesting that much of the traffic on Route 5 is
generated by residents within and very nearby the village and that trips are attracted to Route 5 because
of the numerous commercial destinations along the route.
After examining the existing and anticipated traffic flow in the village, “issues and opportunities” were
identified and presented at a public meeting in February 2018. Public input was collected on the identified
issues and potential opportunities for addressing these issues. Some suggestions have substantial impacts
or challenges. For example, building-out new local street grid connections is challenging due to terrain
and would likely bring negative impacts of additional traffic to streets that are narrow and currently carry
very low volumes. The relatively low congestion, low cost of parking, and dispersed employment locations
throughout the region make diverting trips to transit exceedingly difficult. The NYSDOT developed two
initial concepts for converting the Route 5/Route 257 intersection to a roundabout or pair of roundabouts;
Fayetteville Route 5 Transportation and Land Use Analysis Final Report June 2018
vi
both are likely to have significant right-of-way impacts and would require additional operational and
safety assessments.
The analysis presented in this study indicates that Route 5 serves many purposes, as a commuter route,
commercial corridor, and “main street.” Traffic volumes are likely to remain relatively high because of the
many destinations along Route 5. The village’s Comprehensive Plan does not support widening of Route
5, and capital funding for transportation projects in the region is largely focused on preservation and
maintenance rather than adding system capacity. Other improvements, such as access management and
the addition of a two-way left-turn lane where appropriate, could help alleviate some of the congestion
within the village. Development within the village can provide conveniences to local residents, but also
brings additional traffic. This study examined the many issues associated with traffic flow and future
development, and explored some opportunities to address these issues. If desired, the village will need
to work in partnership with the road owners and residents to pursue some of the ideas documented in
this study.

Fayetteville Route 5 Transportation and Land Use Analysis Final Report June 2018
1
1 Introduction
1.1 Overview and study area
The Fayetteville Route 5 Transportation and Land Use Analysis was completed as part of the Syracuse
Metropolitan Transportation Council’s (SMTC) Unified Planning Work Program (UPWP). This analysis was
proposed by the Village of Fayetteville in late 2015 in response to a call for projects. The Scope of Work
was approved in September 2016.
The village’s stated goal in requesting this analysis was to “identify methods to allow the Village of
Fayetteville to continue to develop existing underutilized properties by improving and/or creating new
vehicle capacity within the village.”
The study area for this analysis included all of the Village of Fayetteville, with a focus on Route 5. Some
elements of the analysis incorporated development within the Town of Manlius near or adjacent to the
Village of Fayetteville. A significant portion of this work effort focused on a comparison of travel times for
Route 5 and Route 290 (primarily in the Town of Manlius) using data collected by SMTC staff. This “travel
time study” is explained in more detail later in this report.
This report reviews and summarizes numerous previous studies for the Fayetteville area, examines
existing traffic volumes and travel patterns, and examines likely future impacts of anticipated
development in and around the village. Using this information, along with input from stakeholders and
the public, existing transportation issues are identified and, where possible, opportunities for addressing
these issues are also discussed. In some cases, significant challenges exist to implementing solutions to
the existing concerns. Throughout this study, SMTC staff were mindful of the goals defined in the Village’s
most recent Comprehensive Plan, which seeks to preserve and enhance the character of this community.
1.2 Study process
This study was conducted with the advice and assistance of a Study Advisory Committee (SAC), which met
twice during the study process. The SAC consisted of the following entities:
Village of Fayetteville
Town of Manlius
New York State Department of Transportation (NYSDOT)
Syracuse-Onondaga County Planning Agency (SOCPA).
A public meeting was held on February 28, 2018, to present initial findings on “issues and opportunities”
within the study area and to seek additional feedback from the public. This meeting consisted of a
presentation by SMTC staff, followed by an open question and answer period. The meeting attendees
were then encouraged to speak directly to the SMTC staff members on-hand and to indicate their
concerns and suggestions either on comment forms or on large maps of the study area that were available
at the public meeting. About 20 community members, mostly village residents, attended this meeting,
which was held in the evening at Fayetteville Elementary School. A meeting summary is available in
Appendix A.

Fayetteville Route 5 Transportation and Land Use Analysis Final Report June 2018
2
After the public meeting, SMTC staff continued to refine the identified issues within the study area and to
investigate possible solutions. Throughout the study process, SMTC staff coordinated closely with the
Region 3 NYSDOT staff to ensure that any suggestions made within this study would be acceptable to the
NYSDOT as the owner of Route 5 through the study area.
The SAC reviewed a draft final report in April 2018. The report was then finalized after being presented to
the SMTC’s Planning and Policy Committees in May and June 2018.

Fayetteville Route 5 Transportation and Land Use Analysis Final Report June 2018
3
2 Background research
2.1 Previous studies
2.1.1 Transportation planning studies
Onondaga County’s eastern suburbs have long been the subject of transportation planning concerns. The
studies summarized below are not an exhaustive list, but include the most substantial SMTC/NYSDOT
study efforts beginning in the early 1990s.
Eastern Onondaga County Traffic Needs Study, Final Report, September 1993, C&S Engineers, Inc.
In 1993, the SMTC and the NYSDOT initiated a substantial effort with the Eastern Onondaga County Traffic
Needs Study to “examine the impact of proposed and projected roadway improvement alternatives on
roadway operations in the Manlius and DeWitt areas.” This 1993 study was an extension of previous
efforts by SMTC and NYSDOT examining the potential for relocation of Route 290. This study evaluated
ten alternatives to address traffic concerns in the eastern suburbs, including two options for
extending/relocating Route 290, two alternatives for extending/relocating Route 173, two alternatives for
widening Route 5, intersection improvements, construction of a High Occupancy Vehicle lane, commuter
transit service, and a car-pool matching service.
The preferred alternative was determined to be the intersection improvements at 12 selected
intersections, along with relocation of Route 290 as a four-lane facility from the Butternut Interchange to
the intersection of Route 290 and Route 257 in Manlius Center. This study also recommended additional
study of key links such as Burdick Street from Route 5 to Route 290 and the Routes 5/92 overlap from Erie
Boulevard to Lyndon Corners, stating that “the goal would be to concentrate the business activity into
centers adjacent to the highway, but with indirect access, possibly via a service or exclusive driveway. All
of these links have too many points of access which hinders traffic flow, reduces capacity and increases
the level of service and congestion.” In short, the study acknowledged the need for “access management”
along the major transportation routes as far back as 1993.
2020 Long Range Transportation Plan, January 1995, SMTC.
In January 1995 – less than two years after the publication of the final report for the Eastern Onondaga
County Traffic Needs Study – the SMTC published the 2020 Long Range Transportation Plan (LRTP). The
Route 290 extension/relocation was discussed at length in the SMTC’s 2020 LRTP. The relocation of Route
290 had been included in the 1994-1999 Transportation Improvement Program (the region’s listing of
federally-funded transportation capital projects) as an “unfunded project.” The 2020 LRTP stated that
“the purpose of the proposed facility was to increase highway capacity between Syracuse and the eastern
suburbs in the towns of DeWitt, Manlius, and Sullivan.” The 2020 LRTP included an analysis of the Route
290 project in terms of its effectiveness at meeting the plan objectives, and found that the project would
have only a minimal positive impact on the most congested areas in the eastern suburbs and the cost
would be substantial. The 2020 LRTP concluded that “this project is ineffective at meeting 2020 Plan
objectives.”

Fayetteville Route 5 Transportation and Land Use Analysis Final Report June 2018
4
Traffic Needs Report Project Development Phase, DeWitt-
Fayetteville-Manlius, Onondaga County, New York, Final
Report, August 1996, McFarland-Johnson Inc. with Fisher
Associates and RSG.
This study was completed by a consultant team for the SMTC,
NYSDOT, and OCDOT as a follow-up to the 1993 Eastern
Onondaga County Traffic Needs Study “to address, identify,
and prioritize improvements that will alleviate traffic
congestion at key intersections.” This was a direct response to
the “preferred alternative” identified in the 1993 Needs Study,
although the relocation of Route 290 had, by this time, been
eliminated from consideration through the 1995 LRTP process.
Traffic counts, existing and future level of service analysis, and
accident analysis were conducted for 15 intersections in the
towns of DeWitt and Manlius (including the Village of
Fayetteville). Conceptual diagrams were developed for future
improvements at each intersection. The subject intersections
were ranked for future project priority based on technical and
social/environmental factors, as well as a combined ranking.
The four locations examined in the Village of Fayetteville, and
their resulting priority for implementation of the conceptual improvements, were:
Route 5/North Burdick (priority 4 of 15)
Route 5/Highbridge (priority 12 of 15)
Route 257/Salt Springs (priority 14 of 15)
Route 5/Route 257 (priority 15 of 15).
The conceptual diagrams developed for these intersections included a number of road widenings (to add
auxiliary turn lanes) and redesignation of existing lanes. A few of the improvements have been
implemented, but most – primarily those that involved widening – have not been implemented.
Eastern Onondaga Area Study, March 1998, SMTC.
Onondaga County’s eastern suburbs were once again the focus of a traffic needs study in 1998. This study
again pointed to population growth and commercial development in the area contributing to traffic
growth, and sought to find “options for improved operations in the Route 5 and Route 92 corridor.” This
study identified that the NYSDOT had “recently” completed a capacity and safety improvement project
near the Wegmans plaza, but that congestion was continuing to worsen and that alternative routes should
be explored. The study examined, in various combinations, park-and-ride options, relocation of Route
173, new ramps at the Butternut Interchange, a bypass in the area of Jamesville Quarry, a reversible lane
on Route 92, and a new Thruway interchange west of Chittenango. The study concluded that “of all the
alternatives examined the one with the most promise seems to be Alternative 7 (Route 92 Reversible
Lanes).” This was never implemented.
In 2015, the SMTC published the first
entirely new LRTP since the original 2020
plan. The current 2050 LRTP focuses on
preservation and maintenance of the
current transportation system within the
current funding situation. The
transportation system in our region has
extensive needs to bring it into a state of
good repair, but federal funding for
transportation has not kept pace with these
needs. This means that very limited funding
is available for new projects, making
capacity expansion projects unlikely. The
extension or relocation of Route 290 was
discussed during the development of the
SMTC’s current 2050 Long Range
Transportation Plan, and was again
identified as a project that would not be
included in the region’s future plans.

Fayetteville Route 5 Transportation and Land Use Analysis Final Report June 2018
5
Project Scoping Report for Route 5 and Route 257 Intersection, 2009, NYSDOT
The NYSDOT initiated further study of the Route 5/Route 257 intersection with an Initial Project Proposal
(IPP) for reconstruction of the intersection in 2007. The project development process included the
creation of a Project Scoping Report (PSR) in 2009. The expressed purpose was to address the condition
of pavement at this intersection. Roadside quality, drainage, safety issues, operational/capacity needs,
and pedestrian needs were also considered.
The PSR identified poor levels of service (LOS E/F) under existing (2009) and future (2035) conditions,
during both the morning and evening peak hours, at this intersection. The PSR acknowledged the
conditions that contribute to this LOS, stating:
The poor LOS at the intersection is influenced by the lack of adequate storage capacity of the turn
lanes and also the proximity of the Salt Springs Rd. intersection. This is especially true for the
northbound left turn movement during the AM Peak: only four cars can be accommodated in the
available storage space and the high volume of this movement results in backups on Route 257 to
the south and Salt Springs Rd. to the east. The proximity of the Salt Springs Rd. intersection also
makes it difficult to implement an effective phasing plan, as movements must be coordinated by
a single controller. (p.14)
Ultimately, the PSR identified one of the project objectives as “improve traffic operations to a Level of
Service ‘D’ or better.” To address the operational needs, seven alternatives were considered, including:
Signal modifications
Roundabout
Route 257 widening and Route 5 restriping
Route 5 widening
Route 92 widening
Bypass of village
New Thruway interchange.
All operations alternatives were dropped from consideration, due to minimal expected improvements
coupled with high costs and substantial property/environmental impacts, or incompatibility with the
village character.
2.1.2 Traffic impact studies
A number of traffic impact studies have been completed for proposed developments in the Village of
Fayetteville within the last few years. These developments were be taken into account when determining
likely future traffic volumes through the study area (see Chapter 4).
Coffee Shop, January 2014, Clough Harbour & Associates.
This study was completed for the current Dunkin’ Donuts shop on the former Friendly’s restaurant site at
the northeast corner of Route 5 and Route 257. The site has full-access driveways on Route 5 and Route
257, plus a right-turn out only driveway on Route 5. The study considered two intersections: Route
5/Route 257 and Route 257/Salt Springs Road (both signalized intersections). The intersections currently
operate at LOS D and C, respectively. Traffic volume counts were conducted in September 2013, and

Fayetteville Route 5 Transportation and Land Use Analysis Final Report June 2018
6
again in February 2015. The study used a 1% per year growth rate, but acknowledged that volumes on
Route 5 have decreased over the past five years. Overall, the analysis indicated that “no significant
impact” was expected from the re-opening of the site as a new coffee shop.
Fayetteville Village Apartments, December 2017, SRF Associates.
This study examined the impacts of a mixed-use development proposal on the former OBG Tech site.
The proposal includes 150 apartment units in five buildings, 50 townhome units in ten buildings, 6,000
SF of office space, 6,000 SF of retail space, 4,000 SF of restaurant space, and three additional apartment
units above the restaurant. Access is proposed via two driveways on Route 5, with one driveway
restricted to right-in/right-out only movements. The following intersections were studied:
Route 5/Route 257
Route 5/Salt Springs Road
Route 5/Tracy Lumber driveway
Route 5/Post Office exit
Route 257/Salt Springs Road
Route 5/site driveways
The study used a 0.5% per year growth rate. Intersection turning movement counts were conducted in
February 2015. The study states that “the proposed development will not result in any potentially
significant adverse traffic impacts to the study area intersections or nearby roadway network.” Although
the study did not find significant adverse traffic impacts at the site driveways, an eastbound left turn lane
on Route 5 at the westerly site driveway is recommended due to the anticipated volume of left turns into
the site during the evening peak hour.
This proposal requires a zone change approval from the Village Board of Trustees, which was still pending
at the time of this writing. (The Village Planning Board had recommended approval with some caveats.)
Highbridge Commons, August 2015 (revised December 2015), Dunn & Sgromo Engineers.
This study examined the potential impacts of a 13,900 square foot multi-use building (retail/office) and
2,700 square foot fast-food restaurant at the southeast corner of Route 5 and Highbridge Street. One
right-in/right-out only driveway was proposed on Route 5, with a full-access driveway on Highbridge
Street and a connection to Fitch Street, a local road at the south edge of the site. Two intersections were
studied: Route 5/Highbridge Street/Limestone Plaza and Route 5/North Burdick Street. Traffic counts
were conducted in March 2015. The study concluded that “under full-build conditions, operations will
be maintained equal to the existing level-of-service at the two study area intersections.” No mitigation
measures were recommended. Westbound left turns are currently prohibited at the Route 5/Highbridge
Street intersection, but this study indicates that the NYSDOT “will remove the no left turn sign upon
request from the Village of Fayetteville.”
Fayetteville Route 5 Transportation and Land Use Analysis Final Report June 2018
7
2.2 Traffic data
2.2.1 Historic Route 5 traffic volumes
The NYSDOT publishes estimates of Annual Average Daily Traffic (AADT) on segments of all State roads in
the annual Traffic Volume Report. These estimates are based on counts conducted by NYSDOT on a
recurring basis. SMTC consulted the 2016 Traffic Volume Report (the most recent available report) for
AADT estimates on segments of Route 5 through the Town of Manlius from 2000 to 2016. As shown in
Table 2-1, these traffic volumes have generally declined over the past 10 years. The current (2016)
NYSDOT estimates for AADT on Route 5 are based on declines or very minimal increases in volumes.

Fayetteville Route 5 Transportation and Land Use Analysis Final Report June 2018
8
Ta
ble
2-1
: Tra
ffic
vo
lum
es
on
Ro
ute
5, T
ow
n o
f M
anliu
s, 2
00
0-2
01
6
Segm
en
t e
aste
rn
en
dp
oin
t
T.M
anliu
s/
V.F
aye
tte
ville
*
Hig
hb
rid
ge R
d.
Salt
Sp
rin
gs R
d.
Ro
ute
25
7
Du
guid
Rd
. R
ou
te 2
90
C
.On
on
dag
a/
C.M
adis
on
Year
A
AD
T A
nn
ual
gr
ow
th
AA
DT
An
nu
al
gro
wth
A
AD
T A
nn
ual
gr
ow
th
AA
DT
An
nu
al
gro
wth
A
AD
T A
nn
ual
gr
ow
th
AA
DT
An
nu
al
gro
wth
A
AD
T A
nn
ual
gr
ow
th
20
00
1
9,6
91
10
,31
4
2
00
1
27
,05
6
2
00
2
20
03
1
1,4
83
3
.6%
2
00
4
28
,81
8
2.1
%
22
,13
3
1
6,4
19
20
05
3
4,1
86
1
1.7
%
6,5
24
20
06
6
,20
8
-4.8
%
20
07
2
8,7
83
-0
.04
%
21
,12
6
-1.5
%
15
,61
5
-1.7
%
20
08
2
3,2
06
-1
2.1
%
10
,93
5
2
00
9
5,9
73
-1
.3%
1
0,1
16
-2
.1%
2
01
0
20
,98
3
-0.2
%
20
11
1
5,6
93
0
.1%
9
,01
8
-6.2
%
20
12
2
01
3
20
14
8
,84
5
-0.6
%
20
15
2
3,2
03
0
.0%
2
2,7
12
-2
.9%
2
1,2
36
0
.2%
1
5,8
89
0
.3%
8
,87
5
0.3
%
7,0
11
2
.7%
1
1,7
71
2
.6%
2
01
6
21
,31
9
0.4
%
Sou
rces
: 20
00
-20
14
vo
lum
es f
rom
NYS
DO
T Tr
aff
ic V
olu
me
Rep
ort
, Ju
ly 2
01
5;
20
15
vo
lum
es f
rom
NYS
DO
T Tr
aff
ic D
ata
Vie
wer
; 20
16
vo
lum
e
fro
m N
YSD
OT
Tra
ffic
Co
un
t H
ou
rly
Rep
ort
.
AA
DT
is g
iven
in v
ehic
les
per
day
.
*Th
is s
egm
ent
beg
ins
at t
he
inte
rse
ctio
n o
f R
ou
te 5
an
d R
ou
te 9
2 (
i.e. L
ynd
on
Co
rner
s).
No
te: N
YSD
OT
per
form
s tr
affi
c co
un
ts o
n a
rec
urr
ing
bas
is. B
lan
k ce
lls in
th
e ta
ble
ind
icat
e th
at t
he
segm
ent
was
no
t co
un
ted
in t
hat
yea
r. 2
01
5
volu
mes
sh
ow
n in
ital
ic t
ext
are
esti
mat
es
bas
ed o
n h
isto
rica
l dat
a, a
s p
ub
lish
ed in
th
e N
YSD
OT
Traf
fic
Vo
lum
e R
epo
rt J
uly
20
15
(th
e m
ost
rec
ent
rep
ort
ava
ilab
le a
t th
e ti
me
of
this
wri
tin
g). A
nn
ual
gro
wth
rat
e is
cal
cula
ted
fro
m p
revi
ou
s av
aila
ble
co
un
t.

Fayetteville Route 5 Transportation and Land Use Analysis Final Report June 2018
9
2.2.2 Intersection traffic volumes
Table 2-2 compares recent traffic volumes for intersections within the Village of Fayetteville to 1995
volumes included in the Traffic Needs Report Project Development Phase, DeWitt-Fayetteville-Manlius,
Onondaga County, New York, Final Report (1996, McFarland-Johnson Inc. with Fisher Associates and RSG).
The 2014/2015 volumes were found in recent traffic impact studies; all of these counts were conducted
between January 2014 and March 2015. Data for the Route 5/North Burdick Street intersection in the PM
peak hour show growth of about 1.3 percent per year from 1995 to 2015, but all of the remaining
intersections saw either declines in total entering volume or growth of less than 1 percent per year during
both the AM and PM peak hours.
Table 2-2: Total peak hour entering volume for selected intersections,
1995 and 2014/2015
Intersection
AM Peak Hour PM Peak Hour
1995 2014/ 2015
Annual growth 1995
2014/ 2015
Annual growth
Route 5/ North Burdick
2,200 2,403 0.4% 2,805 3,630 1.3%
Route 5/ Highbridge
2,165 2,178 0.0% 2,785 2,862 0.1%
Route 5/ Route 257
1,725 1,465 -0.8% 2,035 1,588 -1.2%
Route 257/ Salt Springs
1,105 1,261 0.7% 1,260 1,156 -0.4%
Cedar Bay/ North Burdick
780 843 0.4% 1,169 1,226 0.3%
Sources:
1995 volumes: Traffic Needs Report Project Development Phase, DeWitt-Fayetteville-
Manlius, Onondaga County, New York, Final Report (1996, McFarland-Johnson Inc. with
Fisher Associates and RSG)
2014/2015 volumes: Traffic Impact Study for Highbridge Commons (August 2015,
revised December 2015, Dunn & Sgromo Engineers); NYSDOT Region 3 traffic counts;
Fayetteville Village Apartments Traffic Impact Study (February 2015, SRF Associates).
2.2.3 Current intersection capacity analysis
Current level of service and delay information was available from recent traffic impact studies for four
intersections in the village. This information is shown in Table 2-3. All of these intersections currently
operate at an overall LOS D or better during both peak hours, although some individual movements
operate at LOS E or F. The data indicate the greatest delay for the southbound approach at the Route
257/Salt Springs Road intersection, with 110 seconds of average vehicle delay.

Fayetteville Route 5 Transportation and Land Use Analysis Final Report June 2018
10
Table 2-3: Summary of existing intersection level of service and delay
Intersection Approach Movement
AM peak hour LOS (delay)
PM peak hour LOS (delay)
Route 5 / North Burdick B (19) C (35)
Eastbound Left F (83) F (83)
Through/right A (8) C (22)
Westbound Left/through B (13) D (36)
Right A (2) A (8)
Northbound Left/through/right D (47) D (54)
Southbound Left D (50) E (57)
Through D (51) E (61)
Right A (4) A (5)
Route 5 / Highbridge C (25) C (23)
Eastbound Through/right B (15) B (19)
Westbound Left/through B (20) B (16)
Northbound Left D (44) D (55)
Right B (12) B (14)
Southbound Left D (40) D (43)
Right E (64) D (53)
Route 5 / Route 257 D (36) C (35)
Eastbound Left C (27) C (23)
Through/right C (30) D (39)
Westbound Left C (26) E (68)
Through/right D (47) C (32)
Northbound Left C (32) B (14)
Through/right A (6) A (4)
Southbound Left D (50) E (60)
Through/right E (60) E (76)
Route 257 / Salt Springs C (24) D (47)
Eastbound Left C (26) C (34)
Through/right C (22) D (38)
Westbound Left/through/right B (14) B (13)
Northbound Left/through/right D (37) D (35)
Southbound Left/through/right C (21) F (110) LOS = Level of service. Delay is the average delay per vehicle, in seconds.
Sources: Traffic Impact Study for Highbridge Commons (August 2015, revised December 2015,
Dunn & Sgromo Engineers); Fayetteville Village Apartments Traffic Impact Study (December
2017, SRF Associates).

Fayetteville Route 5 Transportation and Land Use Analysis Final Report June 2018
11
2.3 Existing plans
Current plans that will impact development in the Village of Fayetteville are listed below, along with items
from each plan that are most relevant to the current transportation and land use study.
Village of Fayetteville Parks Master Plan, 1997.
The 1997 Parks Master Plan included linear parks along Limestone Creek and Bishop’s Brook. These could
present multi-modal travel options within the village.
Fayetteville Commercial Design Guidelines, EDR, August 2006.
The commercial design guidelines for the village identify “good” site design and architectural principles
for each commercial character area. Pedestrian safety and traffic calming are themes throughout the
document, with suggestions for sidewalks, parking, and streetscaping.
Resolution Setting Forth Village of Fayetteville Commitment to Complete Streets, November 2012.
This resolution states that the village’s Department of Public Works and the Village Engineer will make
Complete Streets part of their operations and incorporate Complete Streets features into future projects.
Village of Fayetteville Comprehensive Plan, updated August 2014.
The updated Comprehensive Plan recommends a number of notable transportation-related “actions”
including:
Explore the opportunity to create a center median and wider sidewalk on East Genesee Street in
the lower business district
Encourage westbound traffic on Route 5 to use Limestone Plaza for left turns onto Highbridge
Road
Provide additional Park N Ride parking spaces within the Village
Additional bus service
New sidewalks along East Genesee Street and North Burdick Street near Towne Center
Traffic calming
New pedestrian connections, especially to parks, and improved/new sidewalks
Traffic police officer for 30 minutes in AM and PM to direct traffic at Burdick Street/East Genesee
Street
Bike lanes, encouraging bicycle use, bike racks.
The plan designates five areas for new sidewalks: Route 5 from Southfield Street to Briar Brook; Brooklea
Drive from Center Street to Route 257; Sheffield Lane; Salt Springs Road from Orchard condos to Redfield
Avenue; and Route 257 from Penwood Lane to Barker Lane. As of this writing, nearly all of this new
sidewalk construction has been completed.
Residential growth to the east (in Manlius as well as Town of Sullivan/Village of Chittenango) is identified
as the source of the village’s traffic issues, with the Comprehensive Plan stating that “the cumulative
traffic impacts of historic growth, particularly that of neighboring communities, are inhibiting current and
future growth opportunities within the Village.”

Fayetteville Route 5 Transportation and Land Use Analysis Final Report June 2018
12
Village of Fayetteville Climate Action Plan December 2014, Central New York Regional Planning and
Development Board.
A Climate Action Plan was developed for the Village by the Central New York Regional Planning and
Development Board (CNYRPDB) with the goal to reduce the amount of transportation-related greenhouse
gas emissions by increasing options for low-carbon transportation and increasing use of alternative fuels.
Transportation-related recommended actions include:
Prepare a commuting analysis to evaluate the need for organized carpooling and ride-share opportunities such as “Uber”, “Sidekick”, and “Lyft”
Use smaller school buses when only a few students are being transported to and from school
events.
The Climate Action Plan noted that 78 percent of workers residing in the village drive alone to work, based
on 2008-2012 American Community Survey data.
2.4 Background research summary
Based on the available previous transportation plans, historic and current traffic volumes, and existing
planning documents, the following points are noted:
Traffic congestion in the eastern portion of Onondaga County has been a concern for decades. SMTC
conducted a number of large-area studies in the early- to mid-1990s on this topic.
o In a 1996 study, 15 intersections were examined, including Route 5 at North Burdick, Highbridge,
and Route 257 as well as Route 257/Salt Springs Road.
o A number of road widenings to add turn lanes or travel lanes at Route 257/Salt Springs and Route
5/Route 257 were identified, but these intersections were given a priority ranking of 14 and 15,
respectively, apparently due to the very high cost for relatively little benefit associated with these
improvements.
The Village’s Comprehensive Plan, updated in 2014, identifies traffic congestion in the village as an
issue, and posits that this traffic is largely “through traffic” attributable to residential growth outside
of the village (in the surrounding Town of Manlius, as well as farther east into Madison County).
At least three new developments have been proposed in the village, and have completed traffic
impact studies, since 2014: Dunkin Donuts (redevelopment of former Friendly’s restaurant),
Fayetteville Village Apartments (redevelopment of former OBG Tech site), and Highbridge Commons.
These studies:
o Used low (1% or less) background growth rates.
o Acknowledged poor levels of service for some existing turning movements at intersections, but
did not find any significant impacts from the individual developments and did not propose any
substantial mitigation measures (beyond some signage or suggestions to consider transportation
demand management).
Existing LOS calculated in recent impact studies show some individual lane groups operating at LOS E-
F, although overall LOS was found to be D or better at the intersections studied.
Comparison of 1995 intersection volumes with actual 2015 volumes generally shows annual growth
of less than 0.5% per year (resulting in a total increase in traffic of less than 10%), with declines for

Fayetteville Route 5 Transportation and Land Use Analysis Final Report June 2018
13
some intersections. The most substantial growth was at Route 5/North Burdick Street in PM peak,
with nearly a 30% increase in traffic. This may be attributable to the development of the Fayetteville
Towne Center.
Review of historical traffic volumes (AADTs) on Route 5 through the Town of Manlius shows declining
traffic or very minimal increases.
Fayetteville Route 5 Transportation and Land Use Analysis Final Report June 2018
14
3 Existing conditions
3.1 Study area roadway description
3.1.1 Functional classification and ownership
Functional classification, or “functional class,” categorizes roads according to their character and the role
they play in the transportation network. This classification puts roads into categories ranging from
interstates, which are designed for high-speed trips between cities, to low-speed local roads, which
provide access to individual properties. Roads are also classified as being urban or rural based on the
Urban Area Boundary, which is primarily dependent on population density reported in the most recent
Census.
Functional classifications are directly related to federal-aid eligibility, which determines whether a road
may receive federal transportation funding. Principal arterials, minor arterials, and major collectors are
federal-aid eligible (also known as “FAE roads”). Minor collectors and local roads (urban and rural) are not
federal-aid eligible.
Table 3-1 lists the FAE roads within the Village of Fayetteville. Remaining roads within the Village of
Fayetteville are classified as local roads and are owned by the village. The entire Village of Fayetteville is
within the SMTC’s Urban Area Boundary. Road ownership and federal-aid eligibility are also indicated on
Figure 3-1.
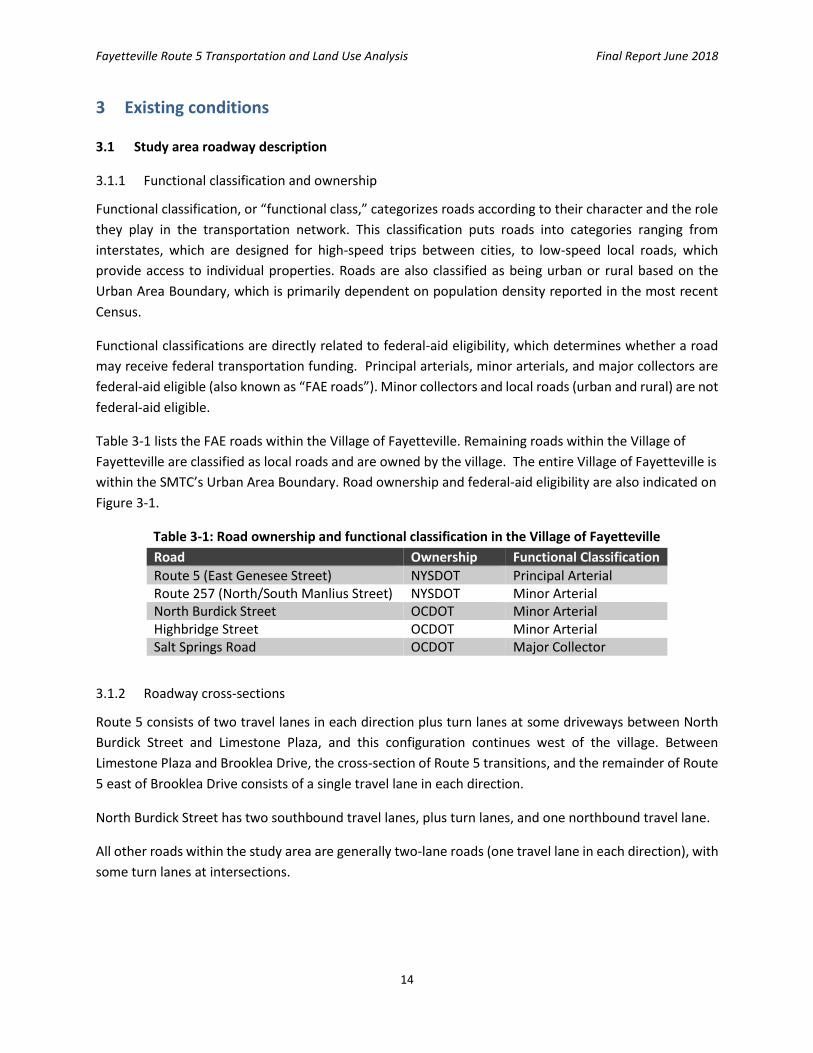
Table 3-1: Road ownership and functional classification in the Village of Fayetteville
Road Ownership Functional Classification
Route 5 (East Genesee Street) NYSDOT Principal Arterial Route 257 (North/South Manlius Street) NYSDOT Minor Arterial North Burdick Street OCDOT Minor Arterial Highbridge Street OCDOT Minor Arterial Salt Springs Road OCDOT Major Collector
3.1.2 Roadway cross-sections
Route 5 consists of two travel lanes in each direction plus turn lanes at some driveways between North
Burdick Street and Limestone Plaza, and this configuration continues west of the village. Between
Limestone Plaza and Brooklea Drive, the cross-section of Route 5 transitions, and the remainder of Route
5 east of Brooklea Drive consists of a single travel lane in each direction.
North Burdick Street has two southbound travel lanes, plus turn lanes, and one northbound travel lane.
All other roads within the study area are generally two-lane roads (one travel lane in each direction), with
some turn lanes at intersections.

Fayetteville Route 5 Transportation and Land Use Analysis Final Report June 2018
15
3.1.3 On-road pedestrian and bicycle facilities
Many roads within the village – including local roads as well as State- and County-owned facilities – already
have sidewalks, although the Village’s Comprehensive Plan suggests that the condition of sidewalks is not
consistent. Some gaps exist along major roadways and residential streets. The Village’s Comprehensive
Plan identified five areas for sidewalk extensions. The Village was also awarded over $600,000 in
Transportation Alternatives funding from New York State in April 2017 for the “Salt Springs to Beard Park
Sidewalks Project,” which proposed replacing about 1,800 linear feet of deteriorated sidewalk and
installing about 1,700 linear feet of new sidewalk in the vicinity of Fayetteville Elementary School,
Wellwood Middle School, and Immaculate Conception School.
Most of the western portion of the village falls within a “pedestrian priority zone” defined by the SMTC.1
This zone also extends west of the village to encompass Fayetteville Towne Center and some nearby
residential areas.
At present, there are no on-road bicycle facilities within the Village of Fayetteville. The SMTC’s 2013
Bicycle Commuter Corridor Study identified some roads within the village as candidates for bike lanes,
shared lane markings (sharrows), and bike boulevards.
Figure 3-1 shows the existing sidewalk network, locations proposed for sidewalk extensions per the
village’s Comprehensive Plan, and suggested bicycle treatments per the SMTC’s previous study.
1 As part of its Sustainable Streets Initiative, the SMTC developed a pedestrian demand model that uses factors such as proximity to schools, parks, and grocery stores, as well as population density, employment density, and demographic characteristics. The results of the pedestrian demand model were used to identify “pedestrian priority zones” throughout the region. These zones are intended to help municipalities prioritize locations for investment in sidewalk maintenance or construction. This does not preclude the construction/maintenance of sidewalks outside of the pedestrian priority zones.

Fayetteville Route 5 Transportation and Land Use Analysis Final Report June 2018
16
Figu
re 3
-1: E
xist
ing
road
fac
iliti
es a
nd
su
gges
ted
ped
est
rian
an
d b
icyc
le e
nh
ance
me
nts
Fayetteville Route 5 Transportation and Land Use Analysis Final Report June 2018
17
3.2 Travel time study
At the outset of this study effort, the village expressed interest in encouraging through traffic from the
east to use the Route 290 corridor rather than Route 5 to reach I-481/I-690 and other points to the west.
In response, a travel time study was conducted, which was designed to quantify average travel time on
these two east-west commuter routes, as well as to identify areas of recurring congestion during the peak
commuter periods. Note that most of Route 290 within the study area carries between 6,000 and 9,000
vehicles per day, although the segment west of Fremont Road (near I-481) carries about 18,000 vehicles
per day. These figures are slightly lower than the current volumes on parallel segments of Route 5, which
carries 15,000 to 23,000 vehicles per day west of Route 257 and about 7,000-9,000 vehicles per day east
of Route 257 (see Table 2-1).
SMTC staff completed “floating car”-type travel time runs on each of the routes during morning and
evening commuter periods with GPS units to record time and location. A summary of this data collection
effort is presented here; see Appendix B for a thorough description of the methodology and detailed
analysis of the resulting data.
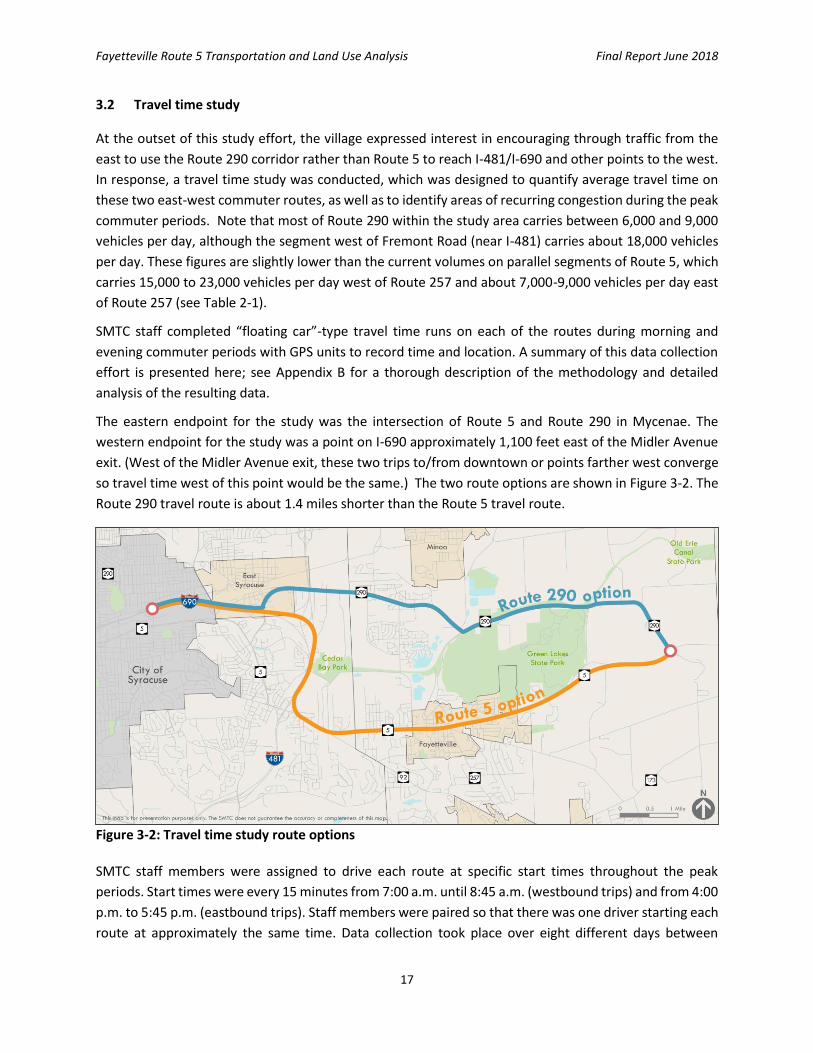
The eastern endpoint for the study was the intersection of Route 5 and Route 290 in Mycenae. The
western endpoint for the study was a point on I-690 approximately 1,100 feet east of the Midler Avenue
exit. (West of the Midler Avenue exit, these two trips to/from downtown or points farther west converge
so travel time west of this point would be the same.) The two route options are shown in Figure 3-2. The
Route 290 travel route is about 1.4 miles shorter than the Route 5 travel route.
Figure 3-2: Travel time study route options
SMTC staff members were assigned to drive each route at specific start times throughout the peak
periods. Start times were every 15 minutes from 7:00 a.m. until 8:45 a.m. (westbound trips) and from 4:00
p.m. to 5:45 p.m. (eastbound trips). Staff members were paired so that there was one driver starting each
route at approximately the same time. Data collection took place over eight different days between
Fayetteville Route 5 Transportation and Land Use Analysis Final Report June 2018
18
September 29, 2016, and October 25, 2016. All data collection was completed on a Monday, Tuesday, or
Wednesday. There were no construction projects or other incidents that impacted the data collection.
Three separate runs were completed for each start time on each route, for a total of 24 travel time runs
in the primary commuter direction during each peak period. Staff were instructed to generally try to drive
at the prevailing speed of traffic to capture a “typical” travel time under peak period conditions. Ten
different staff members participated in the data collection effort. Each staff member carried a GPS unit in
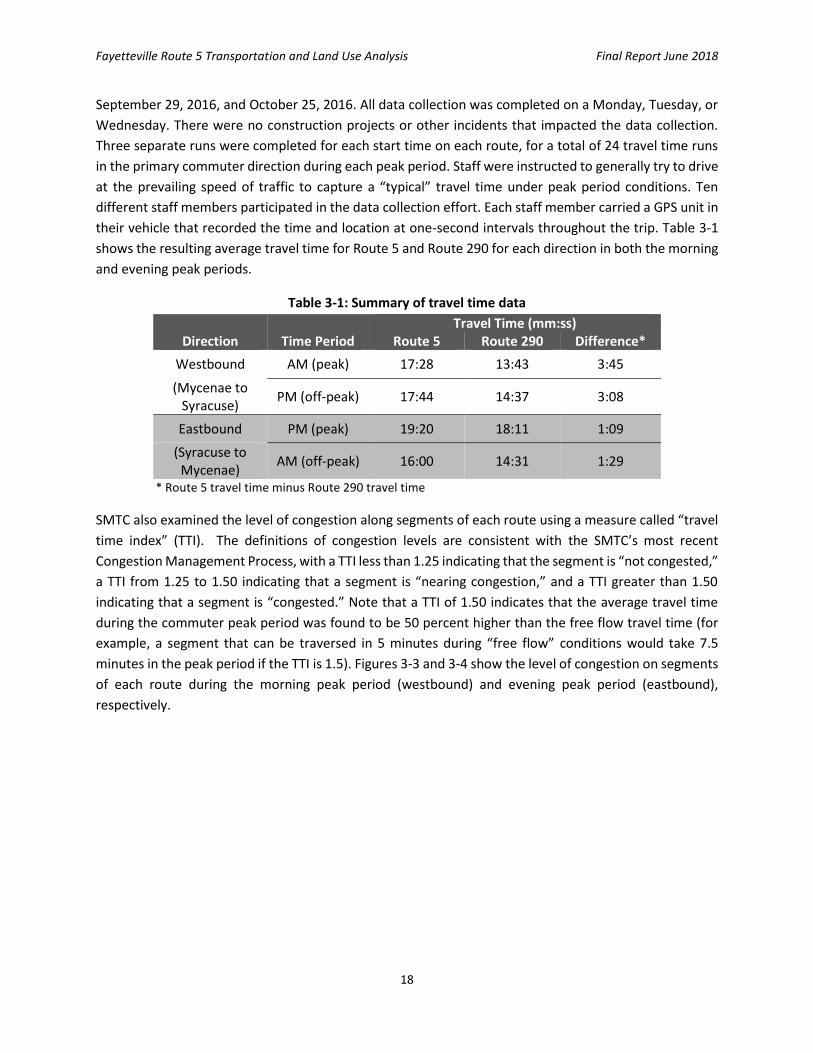
their vehicle that recorded the time and location at one-second intervals throughout the trip. Table 3-1
shows the resulting average travel time for Route 5 and Route 290 for each direction in both the morning
and evening peak periods.
Table 3-1: Summary of travel time data
Direction Time Period Travel Time (mm:ss)
Route 5 Route 290 Difference*
Westbound AM (peak) 17:28 13:43 3:45
(Mycenae to Syracuse)
PM (off-peak) 17:44 14:37 3:08
Eastbound PM (peak) 19:20 18:11 1:09
(Syracuse to Mycenae)
AM (off-peak) 16:00 14:31 1:29
* Route 5 travel time minus Route 290 travel time
SMTC also examined the level of congestion along segments of each route using a measure called “travel
time index” (TTI). The definitions of congestion levels are consistent with the SMTC’s most recent
Congestion Management Process, with a TTI less than 1.25 indicating that the segment is “not congested,”
a TTI from 1.25 to 1.50 indicating that a segment is “nearing congestion,” and a TTI greater than 1.50
indicating that a segment is “congested.” Note that a TTI of 1.50 indicates that the average travel time
during the commuter peak period was found to be 50 percent higher than the free flow travel time (for
example, a segment that can be traversed in 5 minutes during “free flow” conditions would take 7.5
minutes in the peak period if the TTI is 1.5). Figures 3-3 and 3-4 show the level of congestion on segments
of each route during the morning peak period (westbound) and evening peak period (eastbound),
respectively.

Fayetteville Route 5 Transportation and Land Use Analysis Final Report June 2018
19
Figure 3-3: Level of congestion during AM peak period for westbound trips, by route segment
Figure 3-4: Level of congestion during PM peak period for eastbound trips, by route segment
The travel time study data could also be used to determine where vehicles stop along the two routes. This
was done by examining the density of the data points collected by the GPS: when a vehicle was slowing
down and stopped, the data points became very close together along the travel route. In response to
concerns about queuing and delay on Route 5 westbound at the intersection with Route 257 in the
morning commuter period, SMTC examined the GPS data specifically for this road segment. Figure 3-5,
below, shows where each of the 23 westbound morning peak hour runs first stopped approaching this

Fayetteville Route 5 Transportation and Land Use Analysis Final Report June 2018
20
intersection. The GPS data show that only two vehicles in the study had to wait through two cycles of the
traffic signal at Route 5/Route 257 to pass through this intersection (i.e. these vehicles stopped twice
before passing through the intersection).
Figure 3-5: Location of first stop for vehicles traveling westbound on Route 5 approaching Route 257, morning peak hour
Some major conclusions are noted based on the results shown in Table 3-1 and Figures 3-3, 3-4, and 3-5:
Within each peak period, the overall average travel time for Route 5 was found to be greater than
the overall average travel time for Route 290. However, the difference in average travel times was
relatively small. The most significant difference was in the westbound direction during the
morning peak period, with the average travel time on Route 5 nearly 4 minutes greater than the
average travel time on Route 290.
The average eastbound travel time was greater in the evening peak than in the morning peak for
both routes. Both routes had an average eastbound travel time in the evening that was over three
minutes longer than the same trip in the morning.
For westbound trips, the evening travel times were slightly greater than the morning travel times
on the same route, although the differences were both less than one minute. For westbound trips,
the morning was considered the “peak” but the results show that travel times are comparable
between the morning and evening commuter periods in the westbound direction.
The greatest range of travel times over the peak period on a single route was observed on
eastbound Route 5 during the evening, with a low of 16 minutes 48 seconds and a high of 24
minutes 35 seconds, or a difference of just under 8 minutes.
During the morning peak period in the westbound direction, trips that started in Mycenae at 7:45
a.m. had the highest average travel time on both routes. During the evening peak period in the
Passed through intersection on first
green light after stopping (one cycle).
Passed through intersection
on second green light after
stopping (two cycles)

Fayetteville Route 5 Transportation and Land Use Analysis Final Report June 2018
21
eastbound direction, trips that started at Midler Avenue at 4:45 p.m. had the highest average
travel time on both routes.
In the westbound (commuter) direction during the morning peak period, only two segments on
Route 5 were found to be congested based on the calculated TTI: Southfield Drive to North
Manlius Street and North Burdick Street to Route 92/Highbridge Road.
More segments were found to be congested or nearing congestion for the eastbound (commuter)
trips during the evening peak period. On Route 290, the segment from Bridge Street to Butternut
Drive was “nearing congestion,” while the segments from Butternut Drive to North Burdick Street
were congested. On Route 5, the segment from the I-481 exit to Route 92/Highbridge Road was
“nearing congestion” and the segment from North Burdick Street to North Manlius Street was
congested, based on the calculated TTI.
During the morning commuter peak, approaching Route 257 westbound on Route 5, only two out
of a total of 23 vehicles in the data collection stopped twice (i.e. waited through more than one
cycle of the traffic signal) before passing through this intersection.
In conclusion, SMTC’s travel time data collection results showed that all average travel times (both
directions, both peak periods) were less than 20 minutes between Mycenae and Midler Avenue. In all
cases, the overall average travel time (across all starting times) on Route 5 was greater than the average
travel time on Route 290. The greatest difference in average travel times was observed for the westbound
trips during the morning peak period with the average travel time on Route 5 just under four minutes
greater than the average travel time on Route 290.
Both routes appear to offer fairly consistent travel times during the peak periods. The greatest range of
travel times over the peak period on a single route was observed on eastbound Route 5 during the
evening, where the shortest travel time was just under eight minutes less than the longest travel time.
Although greater congestion was observed during the evening peak period, most segments of both routes
were found to be uncongested during the peak periods and areas of congestion were relatively short.
3.3 Traffic flow in western village
Traffic volumes on Route 5 are significantly higher in the western portion of the village – west of Route
257 – than in the eastern portion of the village. This is clear from the daily traffic volumes available from
NYSDOT, which show 15,000 to 23,000 vehicles per day on Route 5 west of Route 257 compared to under
9,000 vehicles per day east of Route 257 (see Table 2-1). There are also a number of other major travel
routes that converge with Route 5 in the western portion of the village, as opposed to the mostly
residential streets that intersect Route 5 farther to the east. Therefore, SMTC staff examined intersection
turning movement counts for six intersections in the western portion of the Village to gain a better
understanding of the existing pattern of traffic flow.
Turning movement counts from previous traffic impact studies (described in Section 2.2.2) were utilized
for the Route 5/North Burdick Street, Route 5/Highbridge Road, Route 5/Route 257, and Route 257/Salt
Springs Road intersections. These four counts were completed in 2014 and 2015. SMTC staff conducted
counts at the Route 5/Brooklea Drive and Route 5/Salt Springs Road intersections in July 2017. The turning
Fayetteville Route 5 Transportation and Land Use Analysis Final Report June 2018
22
movement counts for the morning and evening peak hours at each of these intersections are shown on
Figure 3-6, and the resulting traffic flow patterns for each peak hour are illustrated on Figure 3-7.
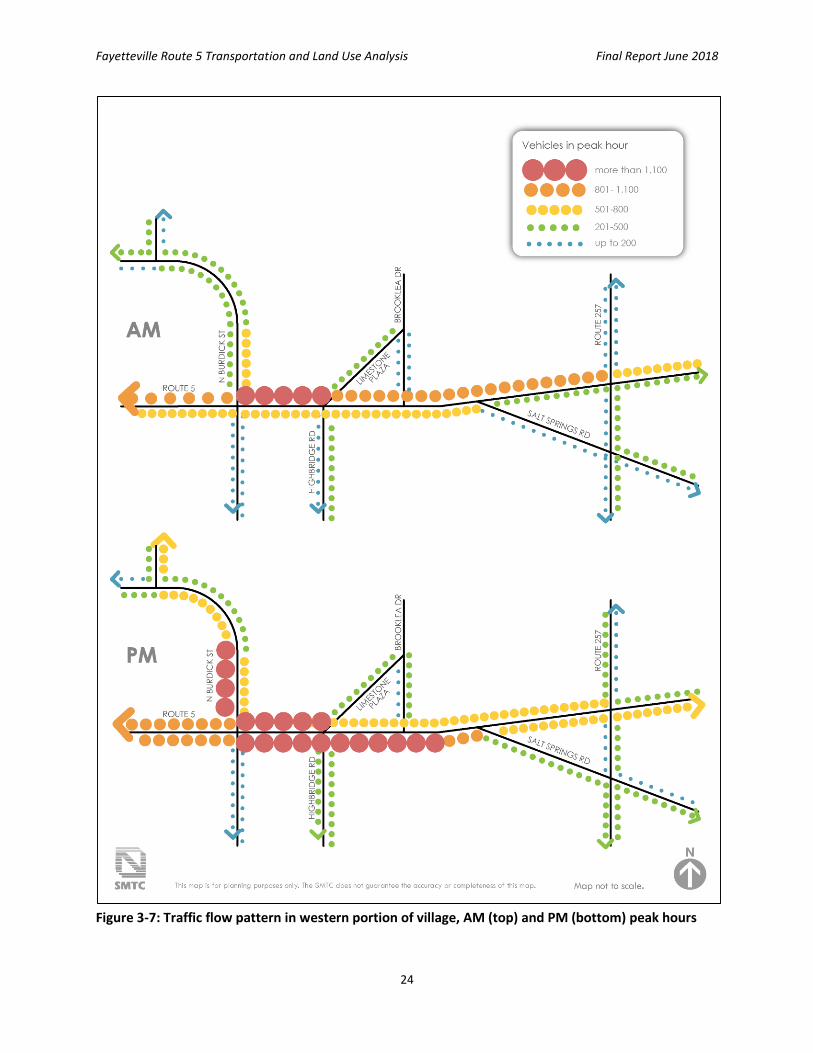
The following points are evident from the turning movement volumes and the traffic flow diagram:
The evening peak hour traffic volume is greater, overall, than the morning peak hour volume.
The segment of Route 5 between North Burdick Street and Highbridge Road carries the highest
volume of traffic during both peak hours, with the eastbound traffic volume reaching over 1,500
vehicles per hour on this segment during the evening peak hour.
Generally, the turning movements to and from Route 5 are relatively low volumes – under 200
vehicles per hour – with the notable exception of the movements to/from North Burdick Street.
As eastbound traffic on Route 5 approaches the intersection with Salt Springs Road, the traffic
splits nearly evenly between these two roads.
Since traffic cannot travel westbound on Salt Springs Road from Route 257 to Route 5, there is a
relatively large northbound left-turn volume at the Route 5/Route 257 intersection (nearly
equivalent to the westbound through volume at the same intersection).
There is clearly a “loss” of vehicles traveling eastbound on Route 5 between Highbridge Road and
Salt Springs Road. This is particularly apparent during the evening peak hour, when about 100
more vehicles travel eastbound through the Highbridge Road intersection than “arrive” at the Salt
Springs Road intersection. It is likely that these vehicles are turning off of Route 5 and onto one
of the residential side-streets between Brooklea Drive and Salt Springs Road, likely returning
home from work.
There are also notable changes in the traffic volumes along North Burdick Street, with higher
volumes at the southern end of this road (near Route 5) than on the portion near Cedar Bay Road.
This is likely due to the significant traffic “generators” along North Burdick Street closer to Route
5, particularly the Fayetteville Towne Center shopping plaza.

Fayetteville Route 5 Transportation and Land Use Analysis Final Report June 2018
23
Figu
re 3
-6: T
urn
ing
mo
vem
en
t vo
lum
es
at s
tud
y ar
ea in
ters
ecti
on
s
Fayetteville Route 5 Transportation and Land Use Analysis Final Report June 2018
24
Figure 3-7: Traffic flow pattern in western portion of village, AM (top) and PM (bottom) peak hours

Fayetteville Route 5 Transportation and Land Use Analysis Final Report June 2018
25
3.4 Travel demand model outputs
3.4.1 Consistency with observed existing conditions
SMTC’s current “existing conditions” regional travel demand
model is based on population and employment data collected
in 2014. SMTC staff examined traffic volume outputs from this
model for ten segments of Route 5 between Fayette Drive on
the west and Duguid Road on the east. Model outputs were
also reviewed for some roads intersecting Route 5 such as
Highbridge Street, Route 257, Salt Springs Road, and Brooklea
Drive. Data were examined for the morning and evening peak
hours (commuter peaks).
As shown in Figure 3-8, the total (two-way) PM peak hour
modeled traffic volumes on Route 5 in and near the Village of
Fayetteville range from a low of about 800 vehicles per hour
near Duguid Road, just east of the village, to a high of about
2,200 vehicles per hour between Burdick Street and
Highbridge Street. Modeled volumes are highest in the
western portion of the village, and then decline steadily
moving farther east. The PM peak hour volumes are generally
about 10 percent greater than the AM peak hour volumes on
the same segment. These model outputs align with the traffic
flow analysis, based on existing turning movement counts,
described in the previous section.
The NYSDOT hourly count reports for these segments of Route 5 indicate that the peak hour accounts for
about 10 percent of the total daily traffic. The peak hour volumes from the SMTC travel demand model
are consistent with the daily volumes published by the NYSDOT in the 2016 Traffic Volume Report (see
Table 2-1).
SMTC’s travel demand model is a
“four step model” that can be used to
predict the amount, type, and location
of travel that residents will undertake,
now and in the future. The model uses
inputs such as population and
economic forecasts, the geographic
dispersion of people and jobs
throughout the region, and a
description of the transportation
system (roads and transit system). The
model outputs can be used to
evaluate the regional impact of
changes to the transportation system,
changes in land use, or changes in
policy (such as pricing). The travel
demand model cannot forecast future
land use or evaluate traffic operations
at specific intersections.

Fayetteville Route 5 Transportation and Land Use Analysis Final Report June 2018
26
Figure 3-8: 2014 PM peak hour traffic volumes (two-way) on segments of Route 5
Source: SMTC travel demand model
3.4.2 Volume-to-capacity ratios
The travel demand model also indicates a “volume-to-capacity (V/C) ratio” for segments and intersections
within the study area. The V/C ratio is a measure of congestion, with values up to 0.7 generally
representing “uncongested” operations, values between 0.7 and 0.9 indicating that a segment is
“approaching congestion,” and values above 0.9 indicating congestion. The existing conditions model
indicates that there are no segments with an existing V/C ratio over 0.7. In fact, most segments of Route
5 in the study area have V/C ratios under 0.5. The highest V/C ratios in the study area are between
Brooklea Drive and Chapel Street, with values from 0.6 to 0.7 for westbound AM traffic and eastbound
PM traffic. These results are very similar to the results from the travel time study (see Section 3.1).
3.4.3 Trip origins and destinations
Throughout this study, questions were raised about the “type” of traffic on Route 5; specifically, there
was a desire to understand how much of the traffic is commuter trips made by residents of areas east of
the Village of Fayetteville and how much of the traffic is generated by village residents. This could be
answered most accurately by conducting license plate surveys or a household travel survey, both of which
are beyond the scope of the current study. However, outputs from the SMTC’s travel demand can be
used to help answer this question.
SMTC staff examined eastbound evening peak hour trips and westbound morning peak hour trips along
Route 5 between North Burdick Street and Highbridge Road (since this segment has the highest peak hour
volume within the study area). The model can identify how trips on a specific segment of roadway travel
through the road network (this is called a “select link analysis”). The model results show that of the
0
500
1,000
1,500
2,000
2,500
Segment eastern endpoint
veh
icle
s p
er h
ou
r

Fayetteville Route 5 Transportation and Land Use Analysis Final Report June 2018
27
vehicles traveling eastbound during the evening peak and westbound during the morning peak on Route
5 between North Burdick Street and Highbridge Road:
About 20 percent have an origin or destination located within the Village of Fayetteville west of
Route 257.
About 25 percent have an origin or destination located within the Village of Fayetteville east of
Route 257.
About 25 percent travel along Route 5 from an origin or to a destination east of the Route 5/Route
290 intersection.
About 20 percent travel to/from various points south of the village on Highbridge Road or Route
257.
The remaining 10 percent of vehicles disperse to various origins/destinations outside of the
village.
These results are also illustrated on Figure 3-9.
Figure 3-9: Origins/destinations for trips on Route 5 between North Burdick Street and Highbridge Street (westbound AM peak, eastbound PM peak)
Fayetteville Route 5 Transportation and Land Use Analysis Final Report June 2018
28
Based on these modeling results, the majority of the traffic traveling eastbound on the highest-volume
section of Route 5 during the evening peak hour has a destination within the Village of Fayetteville or
south of the village. About a quarter of the eastbound traffic on Route 5 between North Burdick Street
and Highbridge Road continues on through the village to a destination east of the Route 5/Route 290
intersection, towards Chittenango. The eastbound traffic on Route 5 at the intersection with Route 257
is just about evenly split between traffic that has a destination in the eastern part of the village, and traffic
that has a destination farther east past the intersection with Route 290. However, as the total traffic on
Route 5 decreases as one travels farther east, the “through” traffic makes up a larger proportion of the
overall traffic. The travel pattern for the westbound morning peak period traffic mirrors the eastbound
evening peak period pattern.
Also interesting is where traffic on this segment of Route 5 originates during the evening peak period. The
model indicates that about 60 percent of those vehicles traveling eastbound on Route 5 between North
Burdick Street and Highbridge Street were already traveling eastbound on Route 5. About 25 percent
come from the Fayetteville Towne Center area, and the remaining 15 percent were previously traveling
southbound on North Burdick Street. This shows the strong influence of the retail areas on trip patterns,
especially during the evening commute when retailers are open and many people “chain” shopping trips
into their commute home.
These model results show a pattern of travel through the village that is consistent with the pattern evident
from the existing turning movement counts, shown in Figures 3-6 and 3-7. The model indicates that a
substantial portion of traffic on Route 5 is generated by origins and destinations in or immediately
surrounding the village.
3.5 Hourly traffic volumes
The NYSDOT completed an hourly traffic volume count on Route 5 between Highbridge Road and Salt
Springs Road in November 2016. The resulting average hourly volumes for eastbound, westbound, and
total two-way traffic are shown on Figure 3-10. Westbound traffic peaks at about 900 vehicles per hour
between 7:00 a.m. and 9:00 a.m., then remains steady at around 700 vehicle per hour throughout most
of the day (until about 5:00 p.m.). Eastbound traffic climbs steadily throughout the day, reaching a peak
of nearly 1,200 vehicles from 5:00 p.m. to 6:00 p.m. The combined result of the two directions of traffic is
that overall, Route 5 experiences a sharp increase in traffic after 7:00 a.m., followed by a fairly steady
increase in traffic overall to a peak of over 1,800 vehicles between 5:00 p.m. and 6:00 p.m. After 6:00
p.m., the traffic volume declines significantly. The midday volume (11:00 a.m. to 1:00 p.m.) is nearly
equivalent to the morning “peak” and traffic in the later afternoon – before the traditional evening peak
hour – is greater than in the morning commuter peak period. This pattern of traffic volumes over the
course of a day is indicative of a road that is highly varied in use, serving both commuter traffic and
providing access to numerous commercial destinations throughout the day.

Fayetteville Route 5 Transportation and Land Use Analysis Final Report June 2018
29
Figure 3-10: Average traffic volume by hour of day, Route 5 from Highbridge Road to Salt Springs Road
Source: NYSDOT, 2016
3.6 Transit routes and ridership
Centro provides bus service to Fayetteville and Manlius on Route 62 and its variations. The “local” 62 and
262 routes provide service along East Genesee Street. The Wegmans – DeWitt Park-N-Ride is also served
by “local” routes 330 and 530, which travel along East Genesee Street to/from Westcott Street and the
University Hill area.
Route 262X provides express service during weekday morning and afternoon commuter peak periods,
traveling on Route 257 and Route 5 between the Village of Manlius and Wegmans - DeWitt, then on I-481
and I-81 to downtown. Free parking is available for bus commuters at Fayetteville Towne Center and
Wegmans - DeWitt. These trips stop at the Sarah Loguen Street shelter near Upstate University Hospital,
East Washington Street/State Street in downtown, and at the Centro Transit Hub. Travel time between
the Fayetteville Towne Center and the Hub is 36 minutes for morning trips and 30 minutes for afternoon
trips. Morning trips arrive at the Hub at 7:10 a.m., 7:47 a.m., and 8:20 a.m., and afternoon trips depart
the Hub at 3:30 p.m., 4:45 p.m., and 5:20 p.m.
The Route 162 Express service travels on I-690 between downtown and ShoppingTown mall with only one
“inbound” (i.e. to downtown) trip in the morning and two “outbound” (i.e. from downtown) trips in the
afternoon. Route 362 Express travels on I-690 between downtown and Wegmans – DeWitt with one
outbound trip in the morning and one inbound trip in the afternoon (in other words, Route 362 provides
a “reverse commute” express service).
0
200
400
600
800
1,000
1,200
1,400
1,600
1,800
2,000
0 1 2 3 4 5 6 7 8 9 10 11 12 13 14 15 16 17 18 19 20 21 22 23
Ave
rage
vo
lum
e (v
ehic
les
per
ho
ur)
Hour start
Eastbound
Westbound
Total (2-way)

Fayetteville Route 5 Transportation and Land Use Analysis Final Report June 2018
30
Overall, the 62 “line” (including all service on the 62, 162, 262, 362, 462, and 262X routes) ranks 22nd out
of Centro’s 25 lines based on total ridership for 2015. Individual stop-level data from 2017 for the 262X
route indicate, on average, no more than 15 people use this route daily to commute (based on the sum
of average daily boardings east of I-481 and alightings in downtown during the morning, and the sum of
average daily boardings in downtown and alightings east of I-481 in the evening). The Park-N-Ride
locations at Wegmans – DeWitt and Fayetteville Towne Center are the highest-usage stops on this route,
but average only three boardings and alightings per day at each location. Many of the stops in
Fayetteville/Manlius on this route average less than one rider per day.
The Wegmans – DeWitt location was evaluated as a Park-N-Ride location for a dedicated University Hill
shuttle in the SMTC’s University Hill Park & Ride Feasibility Study (2010). At the time that study was
completed, 10 vehicles were observed parked near the designated Park-N-Ride bus shelter mid-morning
on a weekday. One of the short-term recommendations from this study was to provide direct service from
the existing Wegmans – DeWitt Park-N-Ride to University Hill.
There is no transit service on Route 5 east of Route 257, so commuters from the eastern part of the village
or beyond who desire to utilize transit still need to drive through the Village of Fayetteville to the Park-N-
Ride at either Towne Center or Wegmans. Since the University Hill Park & Ride Feasibility Study sought to
identify options for suburban Park-and-Ride locations that could provide a total commute time – including
drive time to the Park-and-Ride lot and the time on the shuttle – of 35 minutes or less, that study did not
consider locations east of the Village of Fayetteville. Also, Centro does not provide service in Madison
County.
Fayetteville Route 5 Transportation and Land Use Analysis Final Report June 2018
31
4 Future traffic flow conditions
4.1 Future Base traffic volumes
The SMTC’s travel demand model was used to determine the likely future traffic volumes on Route 5. The
horizon year for this analysis was 2020. The SMTC’s current 2020 Future Base model includes household
and employment growth assumptions that were developed in cooperation with local officials and planners
during the model update process in 2014. At that time, this growth was assumed to be minimal, with
about 24 additional households and 34 additional jobs in the 2020 Future Base model compared to the
2014 Existing Conditions model within the analysis zones that encompass the Village of Fayetteville. The
2020 Future Base model was updated for this current analysis to account for the 2015 opening of the
Yellow Brick Road Casino in Chittenango.2 The results from the 2020 Future Base model, with the
additional casino jobs, indicate higher growth in traffic volumes at the eastern end of the study area,
nearest to the location of the new casino, than at the western end of the study area. Generally, the model
indicates about 0.3 percent per year growth in traffic volumes, or about 1 percent to 1.7 percent total
growth, from 2014 to 2020 on segments of Route 5 within the study area. This is consistent with the
annual growth rates published by the NYSDOT in the 2015 Traffic Volume Report (see Table 2-1). The V/C
ratios for segments of Route 5 in the study area under the 2020 Future Base scenario are nearly identical
to the V/C ratios under the existing conditions.
4.2 Anticipated future development
Since the current 2020 Future Base model included a relatively small number of additional households
and jobs within the study area, an additional model scenario was examined that includes proposed and
likely future development in and adjacent to the Village of Fayetteville. SMTC staff and SAC members
identified these development sites, which are shown on Figure 4-1 and listed in Table 4-1. (The Wegmans
– DeWitt food court expansion is about two miles to the west of the village on Route 5, but was included
at the request of the SAC members.) All developments were assumed to be complete by the year 2020.
The number of units (for residential developments) or specific use and size information (for commercial
developments) were determined from published information where available, or based on input from the
Village of Fayetteville.
2 250 jobs were added at the casino location, based on information in an April 2015 news article. (Yellow Brick Road Casino job fair attracts hundreds; restaurant lineup revealed. April 21, 2015. Elizabeth Doran. Syracuse.com)

Fayetteville Route 5 Transportation and Land Use Analysis Final Report June 2018
32
Figu
re 4
-1: F
utu
re d
evel
op
me
nt
assu
mp
tio
ns

Fayetteville Route 5 Transportation and Land Use Analysis Final Report June 2018
33
Table 4-1: Future (2020) development assumptions
1Use/size information from Traffic Impact Study for Highbridge Commons, Dunn & Sgromo Engineers, December 2015.
The 2020 Proposed model includes 428 additional housing units and 334 additional jobs compared to the
2014 model within the same analysis zones, not including the additional jobs associated with the
Wegmans expansion or the casino. In other words, the 2020 Future Proposed scenario represents a
substantially different future vision than the original 2020 Future Base scenario of the SMTC’s regional
travel demand model.
4.3 Future traffic volumes with proposed development
The impacts of the proposed future developments are reflected in the 2020 Future Proposed scenario
model results, as shown in Table 4-2. The following conclusions are noted from these model results:
Map
location Development Residential units Commercial use/size
1 Retirement resort 128 apartments na
2 Towne Center pad sites na 10,000 SF retail/restaurant
3 Highbridge Commons na 6,100 SF retail
1,700 SF coffee shop
6,100 SF office
2,700 SF restaurant1
4 Former Fayetteville Inn 20 apartments 5,000 SF retail
5 540 E. Genesee St. (former Jay
Chevrolet)
30,000 SF auto sales
6 547 E. Genesee St. (Former
OBG Tech)
239 apts. and
single-family
na
7 Office/retail na 6,000 SF office/retail
8 Current Romano Jeep na 6,100 SF retail
1,700 SF coffee shop
6,100 SF office
2,700 SF restaurant
9 Mill Street residential 17 townhomes and
single-family
na
10 Former Syracuse Plastics 24 apartments 3,000 SF office
11 Wegmans food court expansion na 12,350 SF restaurant
TOTAL 428 units 99,550 SF

Fayetteville Route 5 Transportation and Land Use Analysis Final Report June 2018
34
On Route 5:
The overall distribution of traffic remains the same as the existing condition, with the segment
between Burdick Street and Highbridge Street carrying the most traffic, and traffic volumes
gradually decreasing east of Highbridge Street.
The growth percentage varies by segment, ranging from about 4 percent to about 12 percent total
growth when comparing the 2020 Future Proposed results to the 2014 Existing Conditions model
results.
This percentage equates to an increase in total traffic of about 100 vehicles or less in the AM peak
hour and 150 vehicles or less in the PM peak hour.
The highest growth in traffic (both in number of additional vehicles and percentage growth over
existing) associated with the 2020 Future Proposed scenario is between Route 257 and Cashin
Drive (i.e. the segment just east of Route 257).
Growth is higher in the commuter direction in a given time period (i.e., westbound in the morning,
eastbound in the afternoon).
Overall, very little change in V/C ratios is expected under the 2020 Future Proposed scenario.
Increases in V/C ratio are minimal, although the segment between Brooklea Drive and Center
Street is expected to experience a V/C ratio of 0.72 for westbound AM traffic and eastbound PM
traffic (compared to 0.69/0.67 for existing conditions). This suggests that the segment is
approaching congested conditions.
As previously noted, the Route 5/Route 257 intersection currently operates at LOS D/C (AM/PM)
overall (see Table 2-3). The SMTC’s model indicates that total entering traffic volumes during the
evening peak hour would increase by about 5 to 8 percent (total) during the peak hours from 2014
conditions to the anticipated 2020 conditions with the casino and the developments listed in
Table 4-1. This amount of total volume increase is likely to have only a minimal impact on the
average vehicle delay experienced at the intersection.
On other roads in the study area:
Volume increases on Highbridge Street, South Manlius Street, and Salt Springs Road are minimal,
with fewer than 12 additional vehicles in the peak hours.
North Burdick Street, Brooklea Drive, and North Manlius Street show greater increases, with the
addition of about 60 vehicles on North Burdick Street and up to 30 vehicles per hour on Brooklea
Drive and North Manlius Street, as compared to the existing conditions.

Fayetteville Route 5 Transportation and Land Use Analysis Final Report June 2018
35
T
able
4-2
: Tra
ffic
vo
lum
e c
om
par
iso
n o
n s
egm
en
ts o
f R
ou
te 5
un
de
r Ex
isti
ng,
Fu
ture
Bas
e, a
nd
Fu
ture
Pro
po
sed
co
nd
itio
ns
Segm
en
t ea
ste
rn
en
dp
oin
t M
ott
Rd
B
urd
ick
St
Hig
hb
rid
ge S
t B
roo
kle
a D
r C
en
ter
St
Ch
ape
l St
Ro
ute
25
7
Cas
hin
Dr
Shad
y Ln
D
ugu
id R
d
AM
Pea
k H
ou
r
20
14
P
eak
ho
ur
volu
me
1
,48
7
1,6
17
1
,98
4
1,6
10
1
,67
6
1,4
96
1
,33
5
1,1
42
9
18
7
70
P
eak
ho
ur
volu
me
1
,50
0
1,6
28
2
,00
1
1,6
43
1
,67
5
1,4
97
1
,33
6
1,1
60
9
36
7
85
20
20
B
ase
C
han
ge,
fro
m 2
01
4
13
1
1
17
3
3
-1
1
1
18
1
8
15
%
ch
ange
, fr
om
20
14
0
.9%
0
.7%
0
.9%
2
.0%
-0
.1%
0
.1%
0
.1%
1
.6%
2
.0%
1
.9%
P
eak
ho
ur
volu
me
1
,54
8
1,6
97
2
,07
9
1,6
19
1
,75
0
1,5
60
1
,39
9
1,2
45
1
,00
9
79
7
20
20
P
rop
ose
d
Ch
ange
, fr
om
20
14
6
1
80
9
5
9
74
6
4
64
1
03
9
1
27
%
ch
ange
, fr
om
20
14
4
.1%
4
.9%
4
.8%
0
.6%
4
.4%
4
.3%
4
.8%
9
.0%
9
.9%
3
.5%
PM
Pea
k H
ou
r
20
14
P
eak
ho
ur
volu
me
1
,69
1
1,8
90
2
,19
7
1,8
12
1
,80
3
1,5
86
1
,30
3
1,2
71
1
,00
3
83
3
P
eak
ho
ur
volu
me
1
,71
5
1,9
12
2
,22
6
1,8
39
1
,83
0
1,6
16
1
,32
7
1,2
96
1
,03
0
85
7
20
20
B
ase
C
han
ge,
fro
m 2
01
4
24
2
2
29
2
7
27
3
0
24
2
5
27
2
4
%
ch
ange
, fr
om
20
14
1
.4%
1
.2%
1
.3%
1
.5%
1
.5%
1
.9%
1
.8%
2
.0%
2
.7%
2
.9%
P
eak
ho
ur
volu
me
1
,74
6
1,9
76
2
,31
0
1,9
43
1
,92
2
1,6
97
1
,41
3
1,4
24
1
,11
3
87
2
20
20
P
rop
ose
d
Ch
ange
, fr
om
20
14
5
5
86
1
13
1
31
1
19
1
11
1
10
1
53
1
10
3
9
%
ch
ange
, fr
om
20
14
3
.3%
4
.6%
5
.1%
7
.2%
6
.6%
7
.0%
8
.4%
1
2.0
%
11
.0%
4
.7%
Sou
rce:
SM
TC t
rave
l dem
an
d m
od
el

Fayetteville Route 5 Transportation and Land Use Analysis Final Report June 2018
36
4.4 Route 290 capacity increase
The idea of modifying Route 290 to act as an alternative route to Route 5 through the eastern suburbs
has been discussed since the early 1990s. Previous studies examining various such options were reviewed
in detail in Chapter 2 of this report. Capacity expansion on Route 290 was again examined as part of this
study.
Route 290 is currently a three-lane facility (one travel lane in each direction and a center turn lane) from
Basile Rowe to Fremont Road. Between Fremont Road and the intersection with Route 5 in Mycenae,
Route 290 is generally a two-lane facility with one travel lane in each direction. The SMTC travel demand
model reflects the existing geometry of Route 290. An alternative was examined using the travel demand
model in which an additional travel lane was added to Route 290 between Basile Rowe and Route 5, so
that two travel lanes were available in each direction for this entire segment.
The resulting changes in AM and PM peak hour traffic volumes are shown on Figures 4-2 and 4-3,
respectively. The following points summarize the results of this analysis:
Total (two-way) traffic volumes on Route 5 decreased by about 70 vehicles per hour with the
increased capacity on Route 290. This equates to about a two to eight percent decrease in peak
hour traffic on individual segments through the village, which is unlikely to be perceptible to the
average driver and is within the range of typical expected daily variations in traffic.
The reduction in traffic on Route 5 was mostly in the peak commuter direction (westbound in the
morning, eastbound in the evening), and overall the reduction was greater during the PM peak
hour (which has more overall traffic to begin with).
The volume of traffic removed from Route 5 was fairly consistent between I-481 and the
intersection with Route 290, suggesting that the trips that divert to Route 290 are commuter trips
with a “home” end east of the Route 5/Route 290 intersection and a “work” end accessible from
the Interstate system.
Taken together, these findings suggest that a large proportion of the traffic on Route 5 in the Village of
Fayetteville is generated by residences or commercial development in and near the village.
Traffic volumes also decreased on many other east-west roads with the addition of lanes on Route 290.
Mostly the reductions were very minor and were distributed among many east-west options. However,
the reduction in peak hour volume on Kirkville Road was notable, with over 100 vehicles removed from
Kirkville Road east of I-481 in the during the peak hours. Since this is currently a relatively low-volume
road, this equates to a decrease of 20 to over 35 percent on segments of Kirkville Road with the additional
lanes on Route 290.
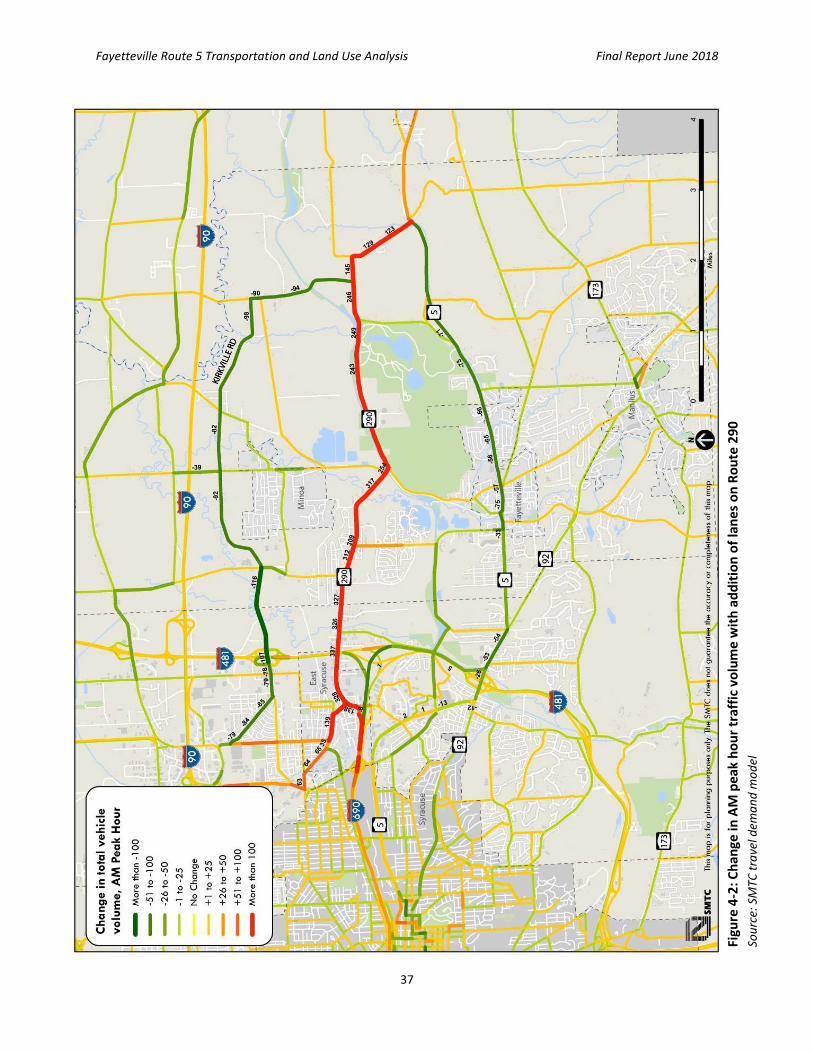
Fayetteville Route 5 Transportation and Land Use Analysis Final Report June 2018
37
Figu
re 4
-2: C
han
ge in
AM
pea
k h
ou
r tr
affi
c vo
lum
e w
ith
ad
dit
ion
of
lan
es
on
Ro
ute
29
0
Sou
rce:
SM
TC t
rave
l dem
an
d m
od
el

Fayetteville Route 5 Transportation and Land Use Analysis Final Report June 2018
38
Figu
re 4
-3: C
han
ge in
PM
pea
k h
ou
r tr
affi
c vo
lum
e w
ith
ad
dit
ion
of
lan
es
on
Ro
ute
29
0
Sou
rce:
SM
TC t
rave
l dem
an
d m
od
el

Fayetteville Route 5 Transportation and Land Use Analysis Final Report June 2018
39
Travel time outputs from the model also indicated relatively minor changes, as shown by Table 4-3. The
slight reduction in traffic on Route 5 resulted in a reduction of only 17 seconds for the average travel time
on Route 5 eastbound during the evening peak hour. Route 290 experienced a decrease in average travel
time of under two minutes with the additional travel lanes (in combination with the additional traffic
drawn to this route), also eastbound in the evening peak hour.
Table 4-3: Average travel times for peak hour trips on Route 5 and Route 290 with current roadway
conditions and with additional lanes on Route 290
Travel time (mm:ss) AM peak, westbound PM peak, eastbound Rt. 5 from I-481
ramps to Rt. 290 Rt. 290 from
Bridge St. to Rt. 5 Rt. 5 from I-481 ramps to Rt. 290
Rt. 290 from Bridge St. to Rt. 5
2020 Future Proposed with existing road conditions
15:34 16:46 16:28 16:53
2020 Future Proposed with additional lanes on Route 290
15:19 14:52 16:11 15:11
Difference 0:14 1:53 0:17 1:42 Source: SMTC travel demand model
Fayetteville Route 5 Transportation and Land Use Analysis Final Report June 2018
40
5 Issues and opportunities
5.1 Overview
The preceding chapters of this report examined previous studies for the Fayetteville area, historical traffic
volumes, current travel patterns, the potential impacts of additional development in and around the
village, and the impact of a capacity increase on Route 290 as an alternative travel route to Route 5. All of
this information is useful in identifying the current issues and the potential opportunities for
transportation in the Village of Fayetteville.
With input from the SAC, SMTC staff identified specific issues within the village and potential
opportunities to address those issues, along with the potential impacts of any solutions. This analysis was
presented at the public meeting on February 28, 2018, and additional input from the public was collected
(see Appendix A for a summary of the public meeting).
5.2 Overall traffic characteristics
5.2.1 Impact of local trips on overall traffic volumes
The segment of Route 5 between North Burdick Street and Highbridge Road carries the highest traffic
volume within the study area. Travel demand model outputs show that about 45 percent of the traffic
traveling westbound in the morning and eastbound in the evening peak on this segment has an origin or
destination within the Village of Fayetteville (see Figure 3-9). This suggests that much of the overall traffic
volume is attributable to residents of the village, either commuting or traveling to/from the destinations
along Route 5 near the village. Further supporting this conclusion, existing intersection turning movement
counts show a notable decrease in vehicles traveling eastbound on Route 5 between Highbridge Road and
Salt Springs Road, particularly during the evening peak hour (see Figures 3-6 and 3-7). It is likely that these
vehicles are turning off of Route 5 and onto one of the residential side-streets between Brooklea Drive
and Salt Springs Road.
Creating new connections to serve local traffic while avoiding Route 5 – “building out the grid” – would
be the logical solution given the traffic flow patterns in the village. For example, connections from North
Burdick Street to North Manlius Street and from Mott Road to South Manlius Street would increase
options for local traffic and remove some of the burden from Route 5. However, any such solution would
require crossing Limestone Creek and would likely bring more traffic to residential streets. These options
were considered infeasible due to the undesirable impacts and construction challenges.
5.2.2 Impact of route and mode choice for commuters
Modeling suggests that trips with an origin/destination east of the village represent only about a quarter
of the traffic on the busiest segment of Route 5, but this equates to a higher proportion of the traffic east
of Route 257.
Increasing the capacity of Route 290 to attract through trips from Route 5 was suggested early-on in this
study effort, and the potential impacts were analyzed and described in Section 4.4. Travel times on the
two routes are comparable now and Route 290 has available capacity. Model results show that a capacity
increase on Route 290 does not noticeably reduce Route 5 volumes. This suggests that Route 5 is a more

Fayetteville Route 5 Transportation and Land Use Analysis Final Report June 2018
41
“attractive” route regardless of the higher volumes because of nearby land uses. Additionally, the benefit-
to-cost ratio of a Route 290 capacity expansion would be very low, and residents near Route 290 may
oppose the project.
Encouraging the use of transit for commuter trips was also discussed as a way to reduce through traffic
volumes. There are a number of challenges associated with transit ridership – especially in suburban
locations and for potential “choice” riders (i.e. riders that do have access to their own vehicle and,
therefore, are not transit-dependent). These challenges include:
Relatively low congestion in the region. In regions with very significant congestion and high parking
costs, there are clear incentives to transit use. In Central New York, the current levels of relatively
low congestion and relatively low parking costs in the urban core do not encourage transit use by
suburban commuters. In general, the transit mode split for suburban commuters in our region is
extremely low (only about 1% of commuters outside of the City of Syracuse use public
transportation), and, specific to this study area, the current ridership on the 62 line is also very low,
as detailed in Section 3.6. A shift to transit that would meaningfully reduce vehicular traffic is unlikely
(and there is a real possibility that any capacity created by a mode shift would be filled by “latent
demand” during peak times).
Park-and-ride usage. Potential transit riders from the Village of Fayetteville or points farther east still
have to drive through the Village of Fayetteville to reach the existing Park-and-Ride lots at
Fayetteville Towne Center or Wegmans – DeWitt, so moving commute trips to transit would not
reduce traffic volumes in the village under the current route configuration. Creating a new park-and-
ride location near the eastern edge of the village for express service to downtown and University Hill
would create a situation with the potential to remove trips from the village core. However, this would
likely reduce service to Manlius and the likelihood of attracting significant numbers of commuters is
low. In general, transit is most attractive when riders can walk to a transit stop. Once commuters are
in their cars, it is difficult to convince them to switch modes, especially in the absence of significant
congestion.
Dispersed work locations. Transit works best when a lot of people are all going from the same place
to the same place. Although downtown and University Hill represent the largest concentrations of
jobs in our region, there are still many workplaces scattered throughout the region and numerous
suburb-to-suburb commuters. There are about 2,300 workers that live in the Village of Fayetteville,
and they work in many locations throughout the region. Of the workers that reside in Fayetteville,
19 percent also work in Fayetteville, 4 percent work in the Village of Manlius, and 37 percent work
in the City of Syracuse (at various locations). That leaves 40 percent that work at various other
locations throughout the region.3 This dispersion of workplaces is very difficult to serve by transit.
3 U.S. Census Bureau, Census Transportation Planning Products (CTTP) data from the 2006-2010 American Community Survey.

Fayetteville Route 5 Transportation and Land Use Analysis Final Report June 2018
42
5.3 Western portion of village (west of Salt Springs Road)
5.3.1 Delay at signalized intersections
Analysis shows that the Route 5 intersections at Burdick Street and Highbridge Street currently operate
at acceptable conditions (overall LOS B/C during both peak hours – see Table 2-3). However, there are
some individual movements – particularly at the Route 5/Burdick Street intersection – that operate at LOS
E/F.
In response to public comments in the past, the NYSDOT previously investigated the feasibility of signal
phasing and/or lane configuration changes at Route 5/North Burdick Street. NYSDOT considered the
addition of a westbound left-turn storage lane at this location, but found that trucks (turning left from
North Burdick Street, southbound, onto Route 5) drive over the painted median. Thus, a new stop bar
with a deep setback would be required to accommodate these truck movements if a left-turn storage lane
was added, resulting in a relatively short left-turn storage lane (only about 50 feet, or about two car-
lengths). Also, the limited existing pavement width would mean an additional lane would be narrower
than the required minimum. A turn lane would also require the installation of new detection loops, which
would add to the complexity and cost of the modification. The NYSDOT reviewed accidents over a six-year
period and found no pattern of left-turn or rear-end accidents that could suggest the need for a left-turn
lane here. For all of these reasons, the addition of a westbound left-turn storage lane at Route 5/Burdick
Street was determined to be infeasible.
5.3.2 Capacity of Route 5 between Highbridge Street and Salt Springs Road
The highest volume of traffic on Route 5 is between Burdick Street and Highbridge Street, which currently
has two travel lanes in each direction. However, the highest volume-to-capacity ratio is between Brooklea
Drive and Center Street, where Route 5 narrows to only one lane in each direction. SMTC’s travel time
data showed congestion (based on Travel Time Index) between Burdick Street and Salt Springs Road,
which includes this “merge” section, but the congestion is very geographically-limited, with the segment
of Route 5 just east of Salt Springs Road/Route 257 showing no congestion based on our data collection.
A substantial portion of the eastbound traffic splits-off to Salt Springs Road, and the volume on Route 5
decreases significantly at that point.
Members of the public have previously suggested restriping Route 5 eastbound between Brooklea Drive
and Salt Springs Road with two eastbound travel lanes. This was identified as a potential option in the
NYSDOT’s 2009 project Route 5/Route 257 intersection. However, further investigation by the NYSDOT in
2013 determined that the current pavement width from the centerline of the road to the curb is not
sufficient to accommodate two eastbound travel lanes.
This idea was revisited with NYSDOT again as part of the current study. NYSDOT confirmed that adding a
second eastbound travel lane would require repaving the entire segment of road in order to change the
location of the crown (which is currently at the centerline); this would add substantially to the cost of any
changes here. Since no accident pattern has been identified, the project would not be eligible for Federal
funds related to safety projects, and other fund sources would likely be very difficult to obtain given
competing regional priorities. There are also some existing benefits to the current configuration. The
existing cross-section allows traffic to maneuver around a vehicle waiting to make a left turn; under a

Fayetteville Route 5 Transportation and Land Use Analysis Final Report June 2018
43
three-lane section, left-turns may cause new queuing and delays. Changing this to a three-lane cross-
section could introduce new safety and operational concerns with pedestrians that would have to cross
more lanes of traffic and “weaving” vehicles trying to position themselves in the correct lane. On-street
parking is currently allowed on both sides of Route 5 (with the exception of a restriction from 4:00 to 6:00
p.m.). On-street parking would be prohibited if the cross-section changed to three lanes.
5.3.3 Driveways on Route 5 in lower business district
Numerous driveways along Route 5 serve individual homes or businesses. The resulting turning
movements, even at very low-volumes, can cause queuing and general “friction” along the roadway,
decreasing its actual capacity. The Village’s Comprehensive Plan identifies the need for access
management for existing developments and future developments, and presents concepts for
implementing good access management. Figure 5-1, below, shows the concept for the lower business
district as presented in the Comprehensive Plan. Achieving this level of access control on Route 5 will
involve working with individual property owners and developers over time; the Village should continue to
pursue this to the extent feasible.
Figure 5-1: Lower Business District Concept Plan, from Village of Fayetteville Comprehensive Plan (2014 Update)
5.4 Route 5/Route 257/Salt Springs Road intersections
5.4.1 Signalized intersection operations
Overall, the Route 5/Route 257 and Route 257/Salt Springs Road intersections currently operate at LOS
C/D during the peak hours, which is an acceptable level of service. However, some individual turning
movements experience higher delay and undesirable LOS.

Fayetteville Route 5 Transportation and Land Use Analysis Final Report June 2018
44
This is a complex configuration, with two traffic signals operating on a single controller. The northbound
approach of Route 257 at Route 5 receives a green indication twice within one cycle of the signal in order
to clear vehicles out of the short segment of Route 257 between Salt Springs Road and Route 5. This may
contribute to the perception that vehicles on Route 5 must wait through multiple cycles of the signal
before receiving the green light. However, the travel time study data collected by SMTC staff showed that
fewer than 10 percent of trips westbound on Route 5 in the morning waited through more than one cycle
of the signal. The NYSDOT has reviewed and optimized the timings here multiple times in the recent past.
These intersections operate under saturated conditions during peak hours, so any signal timing changes
would simply move delays from one approach to another without any net reduction in delay. It does not
appear that further signal timing modifications will significantly alleviate delay at this intersection.
Widening the approaches to these intersections has also been suggested. Widening of multiple
approaches at these intersections was proposed in the 1996 study, although this option ranked low in the
conclusions at that time. Various options for widening these approaches, as well as options for
constructing a roundabout, were considered by NYSDOT in the 2009 PSR for the Route 5/Route 257
intersection and were eliminated due to property impacts and the potential to negatively impact the
village character. The Village’s own Comprehensive Plan (Appendix 6 – Transportation) acknowledges this
concern, stating that “widening of major roadways to accommodate the demands of commuter traffic is
seen as a threat to Fayetteville’s community character.”
5.4.2 Potential for roundabouts
Reconfiguration as a roundabout was once again considered as part of the current study. The NYSDOT
Main Office roundabout group reviewed the intersections and provided two possible concepts: a
“circulator” that encompasses all three intersections into a single, elongated roundabout; and a second
option with mini-roundabouts at Route 5/Route 257 and Route 257/Salt Springs Road. Figures 5-2 and 5-
3 show very preliminary sketches for these two concepts. Initial operational analysis suggests that both
options could be functional, though at this point neither are recommended. Some caveats and cautions
are noted regarding these concepts:
The roundabout concepts have not been fully evaluated for operational and/or safety issues, and
there are some initial concerns with operation of several merge points.
Both options present unconventional designs that will result in a “learning curve” for users.
These are likely to have significant right-of-way impacts. Additional space would be necessary for
snow storage and sidewalks, outside of the lines shown.
Additional lanes at these intersections or conversion to a roundabout(s) would require a full
reconstruction project. This would be a large project for the region, and would have to compete with
other regional needs for capital funding.

Fayetteville Route 5 Transportation and Land Use Analysis Final Report June 2018
45
Figure 5-2: Preliminary concept for “circulator” encompassing Route 5/Route 257, Route 257/Salt Springs Road, and Route 5/Salt Springs Road intersectionsz Source: NYSDOT
Figure 5-3: Preliminary concept for mini-roundabouts at Route 5/Route 257 and Route 257/Salt Springs Road Source: NYSDOT

Fayetteville Route 5 Transportation and Land Use Analysis Final Report June 2018
46
5.4.3 Other changes
Other suggestions made during the course of this study for streamlining traffic flow in the area around
these intersections included:
Change existing on-street parking from perpendicular (i.e. nose-in) to parallel. Vehicles backing out
of existing perpendicular spaces on Route 5 could block traffic and add to congestion in this area.
Parallel or back-in, angled parking is generally preferred for on-street parking.
Restrict Spring Street to right-in/right-out only movements at Salt Springs Road. There was a question
about whether left-turns from Spring Street onto Route 5 (which require crossing eastbound traffic
on Salt Springs Road) present a safety concern. SMTC reviewed accident data within NYSDOT’s
Accident Location Identification System (ALIS) in the vicinity of Spring Street/Salt Springs Road for a
ten-year period (September 1, 2008 – August 31, 2017) and found only one accident that involved a
vehicle crossing over the painted median between Route 5 and Salt Springs Road. This initial review
does not suggest that left turns from Spring Street are contributing to an accident concern here;
however, given the configuration of the roads in this area, restricting left turns from Spring Street
would support good access management.
Restripe Salt Springs Road eastbound approach to Route 257 (“Salt Springs spur”) as a shared left-
turn/through lane and a right-turn lane (from the current left-turn only and shared through/right-
turn configuration). This was not analyzed in detailed, but it is noted that the left turn volume here
is very low. However, the left-most lane on the “spur” does not align with the receiving lane on Salt
Springs Road east of Route 257, so there may be concerns about redesignating this lane for through
movements. This would need to be evaluated in more detail.
5.5 Eastern portion of village (east of Salt Springs Road)
5.5.1 Numerous driveways and side streets along Route 5
Similar to the issue in the lower business district area, numerous driveways on Route 5 can cause queuing and “friction” along the roadway east of Route 257.
The SMTC met with the NYSDOT to discuss the appropriateness of a two-way left-turn lane (TWLTL) along
Route 5 from the Fayetteville Square driveway to a point east of the former OBG Tech site. The NYSDOT
suggested that the SMTC review accident data for this portion of the roadway to determine if rear-end,
head-on, or left-turn collisions were common. The SMTC reviewed these types of collisions during a ten-
year period (September 1, 2008 to August 31, 2017) and found that rear-end collisions were common
along this section of roadway (17 out of 40 multiple-vehicle collisions). Accident data are summarized in
Table 5-1.
Additionally, the STMC found that more than 20 driveways exist within a half mile east of the Route 257
intersection, which is more than twice the density suggested for considering a TWLTL, according to the
NYSDOT’s Highway Design Manual. A TWLTL would extend 1,300-feet or longer if it started near the left-
turn bay at Route 257 and extended to east of the former OBG Tech site. The potential length of the
TWLTL far exceeds the minimum length recommendation of 260 feet. The posted speed limit is 30 mph
in the village and is 40 mph in the town, which both fall below the recommended maximum speed limit

Fayetteville Route 5 Transportation and Land Use Analysis Final Report June 2018
47
of 45 mph for installation of a TWLTL. Therefore, several criteria indicate that it would be appropriate to
consider a TWLTL for this segment of Route 5.
However, the existing width of the road segment presents a challenge to installing a TWLTL. The roadway
is classified as an urban arterial; therefore, the preferred minimum width for travel lanes in 12 feet with
at least an 11-foot wide TWLTL (i.e., at least 35-foot wide road, exclusive of shoulders). Route 5 within
this segment is curbed and ranges from 33-feet wide to 39-feet wide. Widening would likely be necessary
to accommodate a TWLTL, which is a major capital expenditure. Other factors to consider with TWLTLs is
that they do not provide a safe refuge for pedestrians, can create problems between closely spaced access
points, and can encourage strip development with closely spaced access points.
Table 5-1: Summary of collisions on Route 5 between Fayetteville Square driveway and Briar Brook Run, September 1, 2008 – August 31, 2017
Fayetteville Square to Huntleigh
Huntleigh to Briar Brook
Total
Multiple vehicle collisions 40 30 70 Left-turn 1 1 2 Rear-end 17 21 38 Head-on 0 0 0
All other types 22 8 30
Collision with
Bicyclist 0 0 0 Pedestrian 0 0 0 Fixed object 6 5 11 Animal 8 31 39 Other 2 0 2
Total collisions 56 66 122
Segment length (mi.) 0.33 0.64 0.97
Accident rate (per MVMT) 5.248 3.19 3.89
Average rate for similar facilities*
3.5 3.5 3.5
Number of driveways and side streets
20 15 35
Source: NYSDOT ALIS
*From NYSDOT’s 2015-2016 Average Accident Rates for State Highways: Urban, undivided, 2-
lane facility; mainline & juncture accidents; all types.
https://www.dot.ny.gov/divisions/operating/osss/highway-repository/Average%20Accidents%20Rates%20Table_2016.pdf
In addition to a TWLTL within this segment of Route 5, the Village also needs to be cognizant of good
access management practices as development occurs. Shared driveways and new connecting roadways
can minimize turning movements to/from Route 5 and preserve capacity on Route 5. The Village’s
Comprehensive Plan already includes a concept for aligning access points at the former OBG Tech site and
the properties at 540 and 550 East Genesee Street (dependent on future redevelopment on these
parcels), and creating a new road connection between Route 5 and Salt Springs Road. This represents
good access management and enhancement of the local road network.

Fayetteville Route 5 Transportation and Land Use Analysis Final Report June 2018
48
Figure 5-4: 540 & 500 East Genesee Street Concept Plan, from Village of Fayetteville Comprehensive Plan (2014 Update)
5.5.2 Turning movements from side streets onto Route 5
Some members of the public expressed frustration with the delay they experience when trying to
complete a turn (especially a left turn) onto Route 5 from the residential side streets and suggested that
new traffic signals could address this concern. Quantifying this concern for all side streets in this segment
would require collecting data on traffic volumes at these locations and the available gaps in traffic on
Route 5; this was outside of the scope of the current study. However, SMTC and NYSDOT staff did review
existing available data for the Route 5/Duguid Road intersection to determine if that location would be
likely to meet the criteria for a traffic signal.
The Manual on Uniform Traffic Control Devices (MUTCD) identifies eight signal warrants that define the
minimum conditions under which installing traffic control signals might be justified. The most-commonly
used warrant is Warrant 1 – Eight-hour Vehicular Volume Warrant, which requires that both the major
road and the minor approach meet a minimum traffic volume threshold for the same eight hours of a day.
As shown in Table 5-2, the existing average hourly traffic volumes on Route 5 and Duguid Road do not
satisfy the conditions of this warrant.
In addition, NYSDOT staff reviewed six years of accident data for this intersection, and found only eight
accidents. None of these were right-angle type accidents, which a signal could help mitigate. It was
determined that the location would not meet the warrants for a three-color signal based on the accident
history and the low traffic volumes.

Fayetteville Route 5 Transportation and Land Use Analysis Final Report June 2018
49
Table 5-2: 8-hour volume warrant analysis for three-color signal, Route 5 and Duguid Road
Hour start
Major road (Route 5) volume,
2-way total
Minor approach (Duguid Rd northbound)
volume
Both roadways meet threshold? Condition A – Minimum
Vehicular Volume 350 vph major 105 vph minor
Condition B – Interruption of Continuous Traffic
525 vph major 53 vph minor
7:00 627 61 No Yes 8:00 579 36 No No 9:00 531 38 No No
10:00 565 34 No No 11:00 627 35 No No 12:00 611 41 No No 13:00 623 43 No No 14:00 655 44 No No 15:00 778 75 No Yes 16:00 838 74 No Yes 17:00 860 84 No Yes 18:00 648 67 No Yes 19:00 473 42 No No
Meets 8-hour warrant? No No Sources: Manual of Uniform Traffic Control Devices (MUTCD) 2009 Edition, Part 4 – Highway Traffic Signals, Section 4C.02 Warrant 1, Eight-hour Vehicular Volume. Traffic volumes from New York State Traffic Data Viewer: Route 5 Traffic Count Hourly Report – Station 330178, begin date: 6/4/2014; Duguid Road Traffic Count Hourly Report – Station 331006, begin date 4/14/15. Note: Per MUTCD guidance, the 70% volume thresholds were used because Route 5 at this location has a posted speed limit of 55 mph.

Fayetteville Route 5 Transportation and Land Use Analysis Final Report June 2018
50
6 Summary and conclusions
6.1 Summary of significant findings
SMTC reviewed various types of existing data sources for the Village of Fayetteville including intersection
turning movement counts, available AADT data, and hourly traffic count data to develop an understanding
of current conditions and travel patterns within the village. The SMTC’s travel demand model was also
utilized to understand where trips through the village originate and where they end, and to determine
the likely future impacts of anticipated development within the village. A travel time study comparing
trips on Route 5 and Route 290 during peak conditions was also conducted as part of this analysis.
Chapters 3 and 4 provide detailed analysis of these various data sources. Chapter 5 drew on the analysis
of existing and future traffic conditions, as well as input from the public and the SAC, to identify
transportation issues and opportunities throughout the village. These are summarized below.
Route 5 serves a lot of “local” trips, but there are significant challenges to creating new alternative
routes for these trips. The traffic flow in the village suggests the need for alternatives to Route 5 for
“local” trips (to/from a destination within or adjacent to the village), but new local road connections
do not appear feasible due to undesirable impacts to existing residential neighborhoods and
construction challenges (especially crossing Limestone Creek).
Traffic volumes on Route 5 are significantly higher in the western portion of the village than in
the eastern portion of the village. Volumes on Route 5 progressively decrease east of Highbridge
Street, suggesting that many vehicles turn on/off Route 5 at the side streets and driveways east
of Highbridge Street.
Travel demand model outputs show that the majority of the traffic traveling eastbound on the
highest-volume section of Route 5 (between North Burdick Street and Highbridge Street) during
the evening peak hour has a destination within the Village of Fayetteville or south of the village.
Route 290 currently presents a reasonable alternative to Route 5 for through trips – it is shorter and
slightly faster. But it is clear that, in spite of these factors, people are choosing to travel on Route 5.
Traffic data suggest that this is because Route 5 has many destinations that are desirable, and it is
likely that people “chain” trips to other destinations within their commute.
Route 5 and Route 290 offer comparable travel times, both averaging less than 20 minutes from
Mycenae to the east side of the City of Syracuse.
Travel time index calculations, using travel time data collected by staff, and volume-to-capacity
outputs from the SMTC’s travel demand model both show very geographically confined areas of
congestion that last for a short period of time.
Modeling suggests that trips with an origin/destination east of the village represent only about a
quarter of the traffic on the busiest segment of Route 5, but this equates to a higher proportion of
the traffic east of Route 257.
Route 5 is more than just a commuter route, with significant midday traffic volumes and both
commuter, local, and commercial trips contributing to high volumes during the evening peak hour.
Traffic volumes on Route 5 increase sharply after 7:00 a.m., climb fairly steadily throughout the
day, and decline significantly after 6:00 p.m.

Fayetteville Route 5 Transportation and Land Use Analysis Final Report June 2018
51
Transit is unlikely to reduce commuter volumes from and through Fayetteville due to the relatively
low congestion in the region, relatively cheap parking at destinations, and the dispersal of job sites
throughout the region.
The current design of Route 5 west of Salt Springs Road offers flexibility, and revising the lane
configuration would be a substantial capital project. The current design of Route 5 between Brooklea
Drive and Chapel Street (one wide lane in each direction) offers flexibility – on-street parking is
allowed (with minimal restrictions) and vehicles are able to maneuver around other vehicles that are
waiting to make a left turn. Changing this segment to a three-lane cross-section, with two eastbound
travel lanes, would remove these advantages, could introduce a new safety concern, and would be a
major project requiring reconstruction of the road.
Access management could help alleviate some congestion along Route 5. The Village’s current
Comprehensive Plan includes concepts that support the principles of access management, including
shared access and ideal driveway alignment. The village should continue to support these concepts to
the extent feasible, dependent on future redevelopment plans.
The Route 5 – Route 257 – Salt Springs Road intersections present current challenges and no simple
solutions. Overall, the intersections of Route 5/Route 257 and Route 257/Salt Springs Road operate
at acceptable levels, although some individual movements experience higher delay during peak hours.
However, significant improvement to operations here would require widening of the roads or major
reconstruction, which run counter to the goals of the Comprehensive Plan. Two initial roundabout
concepts were developed as part of this study; both would require additional, more detailed analysis
to be determined feasible.
A TWLTL east of Route 257 has merit, but also challenges. Data suggest that a two-way left-turn lane
on Route 5 between Fayetteville Square and Briar Brook Run would be appropriate and beneficial;
however, the existing pavement is narrow in part of this segment and may present a construction
challenge. More investigation is needed. This should be coordinated with the redevelopment of the
former OBG Tech property.
6.2 Conclusion
The village’s overarching objective in this study was to “identify methods to allow the Village of
Fayetteville to continue to develop existing underutilized properties” by addressing existing and future
transportation constraints. Traffic concerns in Fayetteville are based on two primary issues: high traffic
volume and areas of constrained capacity. Addressing these issues requires that either traffic volumes are
reduced or capacity is increased, or some combination of the two.
The review of previous studies shows that traffic congestion in the eastern portion of Onondaga County
has been a concern for decades, with a number of large-area studies completed in the early- to mid-1990s.
Yet analysis has shown potential solutions to be too resource-intensive and/or to have too many negative
impacts, particularly in the context of the character of the Village of Fayetteville.
Our analysis shows that Route 5 has many purposes: it is a commuter route, a commercial corridor, and a
“main street.” Cumulatively, this results in Route 5 west of Route 257 being one of the highest volume
roadways in the region, exclusive of the interstates and other limited-access highways. But, these traffic

Fayetteville Route 5 Transportation and Land Use Analysis Final Report June 2018
52
streams cannot be neatly divided. Many commuters also take advantage of the numerous commercial
destinations on or nearby Route 5, likely “chaining trips” from work to shopping to home. This complexity
makes it hard to identify a single solution to the village’s traffic-related concerns. It also offers
convenience to many village residents, while creating some traffic frustrations during peak times.
High traffic volume can be a good thing if businesses can capture some of the through trips. Directing
travelers to parking areas with clear signage and providing pedestrian connections enables them to “park
once” and patronize multiple village businesses. The Village of Fayetteville has a unique character, and
the current Comprehensive Plan recognizes that some potential traffic mitigation options may threaten
that character. This study has taken a deeper look at some ideas that have surfaced in the community in
the past, and the current and future issues have been documented in this report. The Village may decide
to pursue some of the ideas that require more analysis, as documented in Chapter 5, working in
partnership with road owners and village residents.

Appendix A: Public meeting summary

1
MEETING SUMMARY Village of Fayetteville Route 5 Transportation and Land Use Analysis Public meeting February 28, 2018 6:00 p.m. Fayetteville Elementary School Attendance Twenty-one people attended, including five Study Advisory Committee (SAC) members. All but six people indicated they were village residents, and all but five people indicated 13066 as their ZIP code. Elected officials included: Mark Olson, Village of Fayetteville Mayor; Dennis Duggleby, Village Trustee; and Sara Bollinger, Town of Manlius Councilor. Presentation Meghan Vitale, SMTC Principal Transportation Planner, gave a presentation that included an overview of the SMTC, background information about the study, a summary of the SMTC’s travel time data collection, historical and existing traffic volume information, and a review of “issues and opportunities” identified by the SMTC and the SAC. Question and Answer Following the presentation, Ms. Vitale asked if there were any questions about the information in the presentation. A synopsis of the questions and answers follows: Q: Did you study the traffic cutting through the neighborhoods on Huntleigh Ave and Redfield Ave? A: No, SMTC did not specifically examine traffic on these two streets. We did examine traffic counts on Route 5, which suggest that many trips come from or go to residential side-streets within the village. Q: Did you study the people trying to get from the neighborhoods onto Route 5? A: No, we did not do an analysis of the wait time to complete a turn onto Route 5 from the side streets. Q: Parking is not necessary on Route 5 eastbound, it would be better to just stripe it as two lanes. This is an easy solution that just requires paint. A: We appreciate the feedback regarding parking on Route 5. This is a State-owned facility, so the NYSDOT would make the determination, but we believe that input from the village would be a key factor in that determination. If the consensus of the village is that parking is not necessary, the village should communicate this to the State. It was also noted that there are some signs along Route 5 that indicate “No Standing 4-6 PM.” Q: Clarify the accident information for Route 5/Burdick Street and for Route 5 between Fayetteville Square and Huntleigh Drive. Why does one location meet the criteria for a turn lane, while the other does not? A: These locations are not being compared to each other. In each case, staff looked for an accident pattern that would suggest a need for the particular treatment being considered. The segment of Route 5 from Fayetteville Square to Huntleigh was evaluated for a two-way left-turn lane, while the Route 5/Burdick intersection was evaluated for the addition of a westbound left-turn storage lane.

2
Comments Participants were able to leave comments on large maps of the corridor, or to use a generic comment form. For those commenting on the maps, the corridor was divided into three segments, as shown below along with the comments. West (Towne Center to Chapel Street)
WB left turn lane on Route 5 at Burdick Central (Chapel Street to Huntleigh Ave)
Route 257/5 going west, 15-17 cars during green light. Increase in through truck traffic.
Pull-in parking concerns (area in front of former Hullar’s)
Did NYSDOT evaluate an option with only one roundabout at 5/257?
Dunkin Donuts – close driveway closest to 5/257
Old/rusty street signs
Create dedicated left turns and right turns on each approach at 5/257
Check on parking regulations along the Salt Springs “spur”
Change Spring Street to a right-out only onto Salt Springs
Change Salt Springs approach to Route 257 to a shared left-turn/through lane and a right-turn-only lane.
Salt Springs WB at Route 257 – Green light delay lefts
Issue: lack of green arrow on Route 5 WB near Dunkin Donuts (i.e. WB approach at 5/257)
There was a brief discussion about the concept of reducing the Salt Springs spur to a single travel lane (which would eliminate the left-turn lane on this approach) so that a parking lane could be delineated. Feedback was not in favor of this idea.
Suggestion to look at the location of first stop for EB PM trips approaching Route 5/257 intersection (like what was done for the WB AM trips using the travel time study data).
East (Huntleigh Ave to Briar Brook)
Suggestions to add a signal at Route 5/Cashin Drive
Issue: “constant cut-throughs” on Redfield Drive
Suggestion: connect subdivisions between Southfield and Oakwood
Very difficult to make a left-turn from side streets (esp. Redfield) onto Route 5. One comment form was returned, which stated: “Would love to see round-abouts @ Veteran’s Park! I thought I was the only one to think of it. Would love to take out parking – Highbridge to 257.” Evaluation One meeting evaluation form was returned, with positive ratings. The meeting concluded at approximately 7:30 p.m.
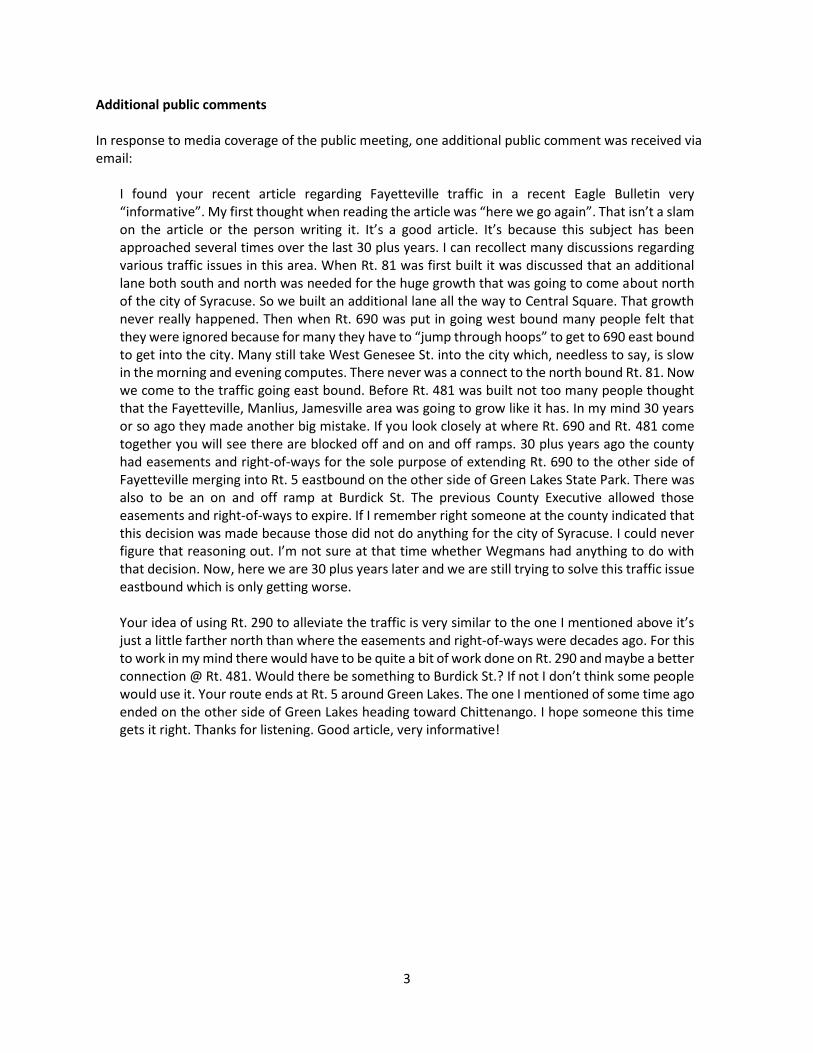
3
Additional public comments In response to media coverage of the public meeting, one additional public comment was received via email:
I found your recent article regarding Fayetteville traffic in a recent Eagle Bulletin very “informative”. My first thought when reading the article was “here we go again”. That isn’t a slam on the article or the person writing it. It’s a good article. It’s because this subject has been approached several times over the last 30 plus years. I can recollect many discussions regarding various traffic issues in this area. When Rt. 81 was first built it was discussed that an additional lane both south and north was needed for the huge growth that was going to come about north of the city of Syracuse. So we built an additional lane all the way to Central Square. That growth never really happened. Then when Rt. 690 was put in going west bound many people felt that they were ignored because for many they have to “jump through hoops” to get to 690 east bound to get into the city. Many still take West Genesee St. into the city which, needless to say, is slow in the morning and evening computes. There never was a connect to the north bound Rt. 81. Now we come to the traffic going east bound. Before Rt. 481 was built not too many people thought that the Fayetteville, Manlius, Jamesville area was going to grow like it has. In my mind 30 years or so ago they made another big mistake. If you look closely at where Rt. 690 and Rt. 481 come together you will see there are blocked off and on and off ramps. 30 plus years ago the county had easements and right-of-ways for the sole purpose of extending Rt. 690 to the other side of Fayetteville merging into Rt. 5 eastbound on the other side of Green Lakes State Park. There was also to be an on and off ramp at Burdick St. The previous County Executive allowed those easements and right-of-ways to expire. If I remember right someone at the county indicated that this decision was made because those did not do anything for the city of Syracuse. I could never figure that reasoning out. I’m not sure at that time whether Wegmans had anything to do with that decision. Now, here we are 30 plus years later and we are still trying to solve this traffic issue eastbound which is only getting worse. Your idea of using Rt. 290 to alleviate the traffic is very similar to the one I mentioned above it’s just a little farther north than where the easements and right-of-ways were decades ago. For this to work in my mind there would have to be quite a bit of work done on Rt. 290 and maybe a better connection @ Rt. 481. Would there be something to Burdick St.? If not I don’t think some people would use it. Your route ends at Rt. 5 around Green Lakes. The one I mentioned of some time ago ended on the other side of Green Lakes heading toward Chittenango. I hope someone this time gets it right. Thanks for listening. Good article, very informative!

Appendix B: Route 5 and Route 290 Travel Time Study Memorandum

Memorandum
TO: Village of Fayetteville Route 5 Transportation and Land Use Analysis Study Advisory Committee
FROM: Meghan Vitale, Principal Transportation Planner
Jason Deshaies, Senior Transportation Analyst
DATE: December 19, 2016
RE: Route 5 and Route 290 Travel Time Study
______________________________________________________________________________
This memorandum documents the methodology and findings of a travel time study conducted as part of
the Route 5 Transportation and Land Use Analysis. The Syracuse Metropolitan Transportation Council
(SMTC) is completing this analysis for the Village of Fayetteville as part of the 2016-2017 Unified
Planning Work Program.
The village expressed interest in encouraging through traffic from the east to use the Route 290 corridor
rather than Route 5 to reach I-481/I-690 and other points to the west. The travel time study was
designed to quantify average travel time on these two east-west commuter routes, as well as to identify
areas of recurring congestion during the peak commuter periods.
Data Collection Methodology
SMTC staff completed “floating car”-type travel time runs on each of the routes during morning and
evening commuter periods with GPS units to record time and location. The eastern endpoint for the
study was the intersection of Route 5 and Route 290 in Mycenae. The western endpoint for the study
was a point on I-690 approximately 1,100 feet east of the Midler Avenue exit. (West of the Midler
Avenue exit, these two trips to/from downtown or points farther west converge so travel time west of
this point would be the same.) The two routes are shown on Figure 1. The total distance for each route
is shown in Table 1 (note that the distances vary by direction, primarily due to the configuration of the
Interstate ramps). The Route 290 travel route is about 1.4 miles shorter than the Route 5 travel route.

2
Figure 1: Study routes
Table 1: Travel distance between Route 5/Route 290 (Mycenae) and Midler Avenue exit on I-690
Travel route Direction Distance (miles)
Route 5 – I-481 – I-690 Westbound 10.65
Eastbound 10.93
Route 290 – I-690 Westbound 9.28
Eastbound 9.51
SMTC staff members were assigned to drive each route at specific start times throughout the peak
periods. Start times were every 15 minutes from 7:00 a.m. until 8:45 a.m. (westbound trips) and from
4:00 p.m. to 5:45 p.m. (eastbound trips). Staff members were paired so that there was one driver
starting each route at approximately the same time. Data collection took place over eight different days
between September 29, 2016, and October 25, 2016. All data collection was completed on a Monday,
Tuesday, or Wednesday. There were no construction projects or other incidents that impacted the data
collection. Three separate runs were completed for each start time on each route, for a total of 24 travel
time runs in the primary commuter direction during each peak period. In some cases, data were also
recorded for the “return” trip (i.e. eastbound in the morning, westbound in the evening). Staff were
instructed to generally try to drive at the prevailing speed of traffic to capture a “typical” travel time
under peak period conditions. Ten different staff members participated in the data collection effort.
Each staff member carried a GPS unit in their vehicle that recorded the time and location at one-second
intervals throughout the trip.

3
Data Analysis Methodology
The resulting dataset was analyzed in ArcMap. The data collection effort resulted in over 150 individual
trip datasets with each trip dataset including, on average, approximately 1,000 data points. Figure 2
shows, as an example, the points collected for a single travel time run on a portion of Route 5. Several
models were built using Model Builder in ArcMap to streamline the data processing.
Figure 2: Example of GPS points collected during the travel time runs, for a portion of Route 5
The GPS data points were clipped to the start and end points of the routes, as shown in Figure 1, and the
timestamps for those points were extracted and exported to a database. Staff used Excel to summarize
the data by route, direction, and time period as shown in the results section below.
The next step was to analyze the data at a more local level by splitting the routes into several segments.
The Route 290 route was split into 7 segments and the Route 5 route was split into 8 segments. These
segments were identified by considering key intersections and changes in speed limits. Similar to the
process mentioned above, timestamps were extracted at the start and end points for each identified
segment and exported to a database. Again, Excel was used to summarize the data by route, direction,
time period, and segment. Average peak period travel times were divided by the free flow travel times
to calculate the Travel Time Index (TTI) for each segment. TTI is often used as a measure of congestion
on a road segment. For this analysis, the morning eastbound (i.e. non-commuter direction) average
travel time was used to represent the free flow travel time, based on the assumption that this
represents an uncongested travel time. The results were grouped into categories and mapped, as shown
in the results section below.
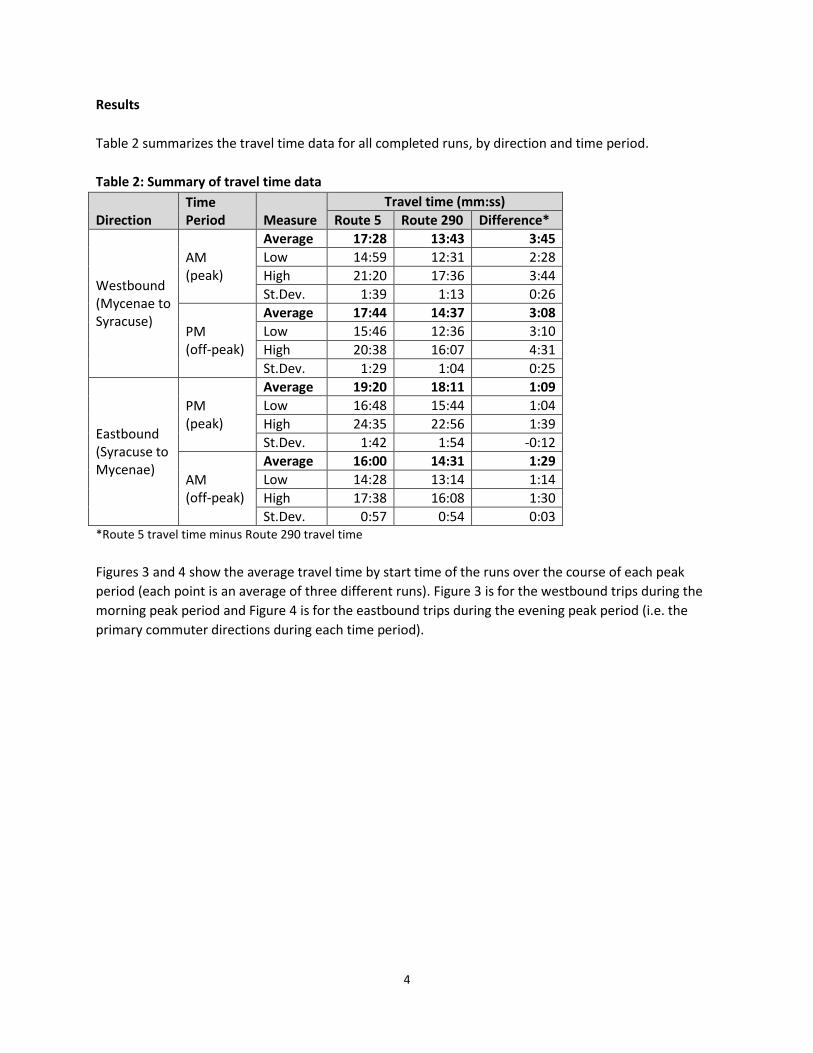
4
Results
Table 2 summarizes the travel time data for all completed runs, by direction and time period.
Table 2: Summary of travel time data
Direction Time Period Measure
Travel time (mm:ss)
Route 5 Route 290 Difference*
Westbound (Mycenae to Syracuse)
AM (peak)
Average 17:28 13:43 3:45
Low 14:59 12:31 2:28
High 21:20 17:36 3:44
St.Dev. 1:39 1:13 0:26
PM (off-peak)
Average 17:44 14:37 3:08
Low 15:46 12:36 3:10
High 20:38 16:07 4:31
St.Dev. 1:29 1:04 0:25
Eastbound (Syracuse to Mycenae)
PM (peak)
Average 19:20 18:11 1:09
Low 16:48 15:44 1:04
High 24:35 22:56 1:39
St.Dev. 1:42 1:54 -0:12
AM (off-peak)
Average 16:00 14:31 1:29
Low 14:28 13:14 1:14
High 17:38 16:08 1:30
St.Dev. 0:57 0:54 0:03 *Route 5 travel time minus Route 290 travel time
Figures 3 and 4 show the average travel time by start time of the runs over the course of each peak
period (each point is an average of three different runs). Figure 3 is for the westbound trips during the
morning peak period and Figure 4 is for the eastbound trips during the evening peak period (i.e. the
primary commuter directions during each time period).

5
Figure 3: Average travel time by start time, westbound trips during AM peak period
Figure 4: Average travel time by start time, eastbound trips during PM peak period
15:21
16:4617:32
20:09
18:04
16:1217:20 17:36
13:07 13:1114:26 14:34 14:14 13:42 13:35
12:54
02:14
03:35 03:05
05:35
03:51
02:3003:44
04:42
00:00
03:00
06:00
09:00
12:00
15:00
18:00
21:00
24:00
7:00 7:15 7:30 7:45 8:00 8:15 8:30 8:45
Trav
el T
ime
(mm
:ss)
Start Time (a.m.)
Route 5 Route 290 Difference (Route 5 - Route 290)
18:35 18:44 18:46
20:15 19:58 19:3719:33 19:16
16:5617:43 17:42
20:2217:38
19:55 18:44
16:18
01:3901:01 01:03
02:20
00:49
02:58
00:00
03:00
06:00
09:00
12:00
15:00
18:00
21:00
24:00
4:00 4:15 4:30 4:45 5:00 5:15 5:30 5:45
Trav
el T
ime
(mm
:ss)
Start Time (p.m.)
Route 5 Route 290 Difference (Route 5 - Route 290)
-03:00

6
Figures 5 and 6 show the level of congestion by route segment2 on Route 5 and Route 290 during the
commuter peak periods, using the Travel Time Index (TTI) as the measure of congestion. The definitions
of congestion levels are consistent with the SMTC’s most recent Congestion Management Process, with
a TTI less than 1.25 indicating that the segment is “not congested,” a TTI from 1.25 to 1.50 indicating
that a segment is “nearing congestion,” and a TTI greater than 1.50 indicating that a segment is
“congested.” Note that a TTI of 1.50 indicates that the average travel time during the commuter peak
period was found to be 50 percent higher than the free flow travel time (for example, a segment that
can be traversed in 5 minutes during “free flow” conditions would take 7.5 minutes in the peak period if
the TTI is 1.5).
Figure 5: Level of congestion during AM peak period for westbound trips, by route segment
2 Segment endpoints were defined as follows:
Route 290: I-690 at Midler – Bridge St – Butternut Dr – Fremont Rd – N Burdick St – Manlius Center Rd –
Clemons Rd – N Manlius St – Route 5 (Mycenae)
Route 5: I-690 at Midler – I-481 – Rts 5 & 92 – Rt 92 (Highbridge Rd) – N Burdick St – N Manlius St – Southfield
Dr – Duguid Rd – Rt 290 (Mycenae)
Commuter Flow

7
Figure 6: Level of congestion during PM peak period for eastbound trips, by route segment
The following points are noted based on the results shown above:
Within each peak period, the overall average travel time for Route 5 was found to be greater than
the overall average travel time for Route 290. However, the difference in average travel times was
relatively small. The most significant difference was in the westbound direction during the morning
peak period, with the average travel time on Route 5 nearly 4 minutes greater than the average
travel time on Route 290.
The average eastbound travel time was greater in the evening peak than in the morning peak for
both routes. Both routes had an average eastbound travel time in the evening that was over three
minutes longer than the same trip in the morning.
For westbound trips, the evening travel times were slightly greater than the morning travel times on
the same route, although the differences were both less than one minute. For westbound trips, the
morning was considered the “peak” but the results show that travel times are comparable between
the morning and evening commuter periods in the westbound direction.
The greatest range of travel times over the peak period on a single route was observed on
eastbound Route 5 during the evening, with a low of 16 minutes 48 seconds and a high of 24
minutes 35 seconds, or a difference of 7 minutes 47 seconds.
The standard deviation for travel times on a single route (which can be thought of as a measure of
the variability of the observed travel times) was greatest for the westbound trip in the morning on
Route 5 and the eastbound trip in the evening on Route 290, at nearly two minutes each. The
standard deviations observed across all runs in for each direction/time period ranged from a low of
54 seconds to a high of 1 minute 54 seconds, suggesting that both routes offer relatively consistent
travel times during each peak period.
During the morning peak period in the westbound direction, trips that started in Mycenae at 7:45
a.m. had the highest average travel time on both routes. During the evening peak period in the
Commuter Flow

8
eastbound direction, trips that started at Midler Avenue at 4:45 p.m. had the highest average travel
time on both routes.
In the westbound (commuter) direction during the morning peak period, only two segments on
Route 5 were found to be congested based on the calculated TTI: Southfield Drive to North Manlius
Street and North Burdick Street to Route 92/Highbridge Road. All remaining segments on the Route
5 travel path as well as the entire Route 290 travel path were found to be uncongested.
More segments were found to be congested or nearing congestion for the eastbound (commuter)
trips during the evening peak period. On Route 290, the segment from Bridge Street to Butternut
Drive was “nearing congestion,” while the segments from Butternut Drive to North Burdick Street
were congested. On Route 5, the segment from the I-481 exit to Route 92/Highbridge Road was
“nearing congestion” and the segment from North Burdick Street to North Manlius Street was
congested, based on the calculated TTI.
Conclusion
SMTC staff conducted over 20 individual travel time runs in the primary commuter directions on both
Route 5 and Route 290 during the morning and evening peak periods. Additional data were also
collected for the reverse (i.e. non-commuter) direction. Data collection was completed by staff with GPS
units in their vehicles over a variety of weekdays in September and October 2016.
All average travel times (both directions, both peak periods) were less than 20 minutes between
Mycenae and Midler Avenue. In all cases, the overall average travel time (across all starting times) on
Route 5 was greater than the average travel time on Route 290. The greatest difference in average
travel times was observed for the westbound trips during the morning peak period with the average
travel time on Route 5 just under four minutes greater than the average travel time on Route 290.
Although greater congestion was observed during the evening peak period, overall, most segments of
both routes were found to be uncongested during the peak periods. Areas of congestion were relatively
short.
Overall, both routes appear to offer fairly consistent travel times during the peak periods. The standard
deviations observed across all runs in for each direction/time period ranged from a low of 54 seconds to
a high of 1 minute 54 seconds. The greatest range of travel times over the peak period on a single route
was observed on eastbound Route 5 during the evening, where the shortest travel time was just under
eight minutes less than the longest travel time.
In conclusion, this travel time study suggests that the Route 5 option and the Route 290 option between
Mycenae and Syracuse offer comparable travel times, both under 20 minutes on average.