final report mei project about measuring eco-innovation · contributions from anthony arundel, mads...
TRANSCRIPT

1
Project No: 044513 Project acronym: MEI Project Title: Measuring eco-innovation
Instrument: STREP Thematic Priority: Call FP6-2005-SSP-5A, Area B, 1.6, Task 1
Deliverable 15
Final report MEI project about measuring eco-innovation
Due date of deliverable: April 2007 Actual submission date: February 2007
Start date of project: 1-2-2007 Duration: 14 months
Lead contractor: UM-MERIT Authors: René Kemp and Peter Pearson
Project co-funded by the European Commission within the Sixth Framework Programme (2002-2006) Dissemination Level
PU Public
PP Restricted to other programme participants (including the Commission Services)
RE Restricted to a group specified by the consortium (including the Commission Services) RE CO Confidential, only for members of the consortium (including the Commission Services)

2
About MEI MEI is a project for DG Research of the European Commission (Call FP6-2005-SSP-5A, Area B, 1.6, Task 1). The project has been carried out in collaboration with Eurostat, the European Environment Agency (EEA) and the Joint Research Center (JRC) of the European Commission. MEI offers a conceptual clarification of eco-innovation (developing a typology) and discusses possible indicators, leading to proposals for eco-innovation measurement. Objectives
• To offer a conceptual clarification of eco-innovation (developing a typology) based on an understanding of innovation dynamics.
• To identify and discuss the main methodological challenges in developing indicators and statistics on eco-innovation and to explore how they may be addressed.
• To propose possible indicators for measuring relevant aspects of eco-innovation, taking into account data availability issues; to define future research needs for addressing these methodological challenges in developing eco-innovation indicators; and to set up guidance for the most feasible route for implementation of eco-innovation indicators on the time scale envisaged.
Research partners
• UM-MERIT (NL) (coordinator, project leader René Kemp) • ZEW (FRG) • DTU (DK) • ICL (UK) • LEIA (ES)
In collaboration with
• Eurostat • European Environment Agency (EEA) • Joint Research Center (JRC)
Project officer: Dr Michele Galatola of DG Research This report has been prepared by René Kemp and Peter Pearson, based on contributions from Anthony Arundel, Mads Borup, Igor Cano Dorronsoro, Per Dannemand Andersen, Frans de Vries, Jordan Espina Lázaro, Tim Foxon, Javier A. García Sedano, David Grisaleña Rodríguez, Sandra Hernando Casas, Jens Horbach, Jun Jin, Minna Kanerva, Sergio Larreina, Måns Molin, Vanessa Oltra, Klaus Rennings, Peter Pearson, Jamie Speirs, Fred Steward, Sebastian Voigt and participants at the MEI workshops Contact: Dr René Kemp (project leader MEI project): Tel +31 43 3884405, [email protected] Project website: http://www.merit.unu.edu/MEI

3
Table of contents 1. Definition and typology of eco-innovation………………………………………4
1.1 What is innovation……………………………………………………………4 1.2 What is eco-innovation……………………………………………………….5 1.3 Eco-industry…………………………………………………………………..8 1.4 Typology of eco-innovation…………………………………………………10
2. Methods for measuring eco-innovation………………………………………...12
2.1 Survey analysis………………………………………………………………12 2.2 Patent analysis……………………………………………………………….15 2.3 Digital and documentary source analysis……………………………………23
3. Assessing the capacity for eco-innovation from a system’s perspective…...…28
3.1 The Innovation System Frame………………………………………….…....28 3.2 National Innovation Systems……………………………………………..….32 3.3 National Innovation Capacity………………………………………………..35 3.4 The Technological Innovation System………………………………………39 3.5 Eco-innovation implications…………………………………………………41
4. Benchmarks of environmental performance as an indicator of eco-innovation…………………………………………………………………………...55
4.1 Benchmark projects……………………………………………………….…55 4.2 Environmental performance indices…………………………………………59 4.3 Developing a benchmark indicator for eco-innovation……………………...62
5. Data needs of economic models incorporating eco-innovation………………..68
5.1 Introduction…………………………………………………………….….…68 5.2 Data use in ETC models………………………………………..……………69 5.3 Available data……………………………………….. ……………………...71
6. Measurement of competitiveness of eco-innovation…..……………………….75
6.1 Defining and understanding competitiveness………………………………..75 6.2 An exemplary analysis for energy technology…………………………….…93 6.3 Conclusions about measuring competitiveness………………………………99
7. Conclusions…………………………………………...…………………………102 Annex 1: Summary findings about methods for analysis of eco-innovation……….106 Annex 2: List of BusinessDatabases………………………………………………..109 References…...……………………………………………………………………..112

4
1. Definition and typology of eco-innovation 1.1 What is innovation? Innovation is the introduction of novelty in the economic realm. The novelty can be many things. According to the Oslo Manual (OECD 2005), innovation is the implementation of a new or significantly improved product (good or service), or process, a new marketing method, or a new organizational method in business practice. The innovation that is being developed or adopted may be new to the world or new to the company. The adoption of a new process or business practice developed elsewhere counts as innovation. Innovation should be distinguished from invention. While the concept of invention refers to discovery, discovery may not be needed for innovation. The overwhelming majority of innovations are not based on discovery but are the outcome of applied research and development informed by theoretical knowledge, engineering experience and knowledge about user wants. Sometimes users are actively involved in the creation of an innovation. An example is the mountain bike, which was ‘invented’ by users. Innovation is ongoing—and this creates a big problem for innovation measurement. Advances in technology and feedback from users help product innovation vendors to improve their products, while economies of scale and competition help to bring down prices for the innovation. New uses and users may be found during diffusion. Innovation continues in the diffusion stage. The characteristics of the innovation and the way in which it is used thus change. Given the uncertainty about outcomes and need for alignment of various activities, the innovation process is best viewed as a search, development and learning process, where knowledge is gathered and used in new ways in the development of process technologies, products or services. Consequently, R&D is only part of the story of innovation. It is important for high-tech products but less important for other types of products that still may be knowledge-intensive. The products from IKEA are an example, since they are knowledge-intensive but require little R&D. Innovation occurs within a wider context that shapes innovation processes, innovation output and economic and environmental outcomes. This wider context encompasses the values, beliefs, knowledge and networks of actors, the technologies in place, economic growth, the product market conditions, factor market conditions, the education and training system, physical infrastructure and the macroeconomic and regulatory context. Impacts are coproduced, both at the micro and macro level. The macro performance of an innovation is hard to assess because it depends on income effects and spillovers in knowledge and taste formation. It is possible, however, to compare the performance of an innovation to the performance of a relevant alternative in a first round analysis, which looks at material consumption, emissions and waste.
5
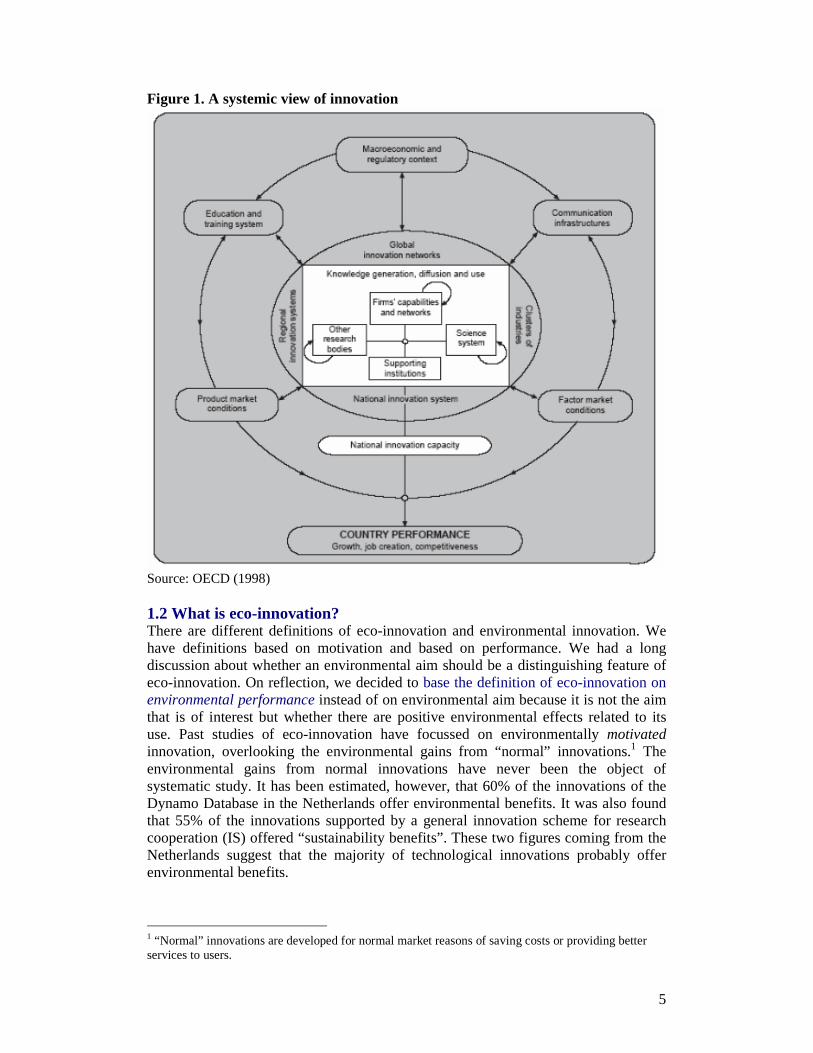
Figure 1. A systemic view of innovation
Source: OECD (1998) 1.2 What is eco-innovation? There are different definitions of eco-innovation and environmental innovation. We have definitions based on motivation and based on performance. We had a long discussion about whether an environmental aim should be a distinguishing feature of eco-innovation. On reflection, we decided to base the definition of eco-innovation on environmental performance instead of on environmental aim because it is not the aim that is of interest but whether there are positive environmental effects related to its use. Past studies of eco-innovation have focussed on environmentally motivated innovation, overlooking the environmental gains from “normal” innovations.1 The environmental gains from normal innovations have never been the object of systematic study. It has been estimated, however, that 60% of the innovations of the Dynamo Database in the Netherlands offer environmental benefits. It was also found that 55% of the innovations supported by a general innovation scheme for research cooperation (IS) offered “sustainability benefits”. These two figures coming from the Netherlands suggest that the majority of technological innovations probably offer environmental benefits.
1 “Normal” innovations are developed for normal market reasons of saving costs or providing better services to users.

6
The use of eco-innovation may or may not lead to an absolute reduction in environmental harm. In the case of a replacement of a less environment-friendly technology, the environmental harm is likely to be reduced but in case of extra capacity or use the environmental harm may increase because every technology causes some environmental harm in the production chain and during use. A classic example of this is the new type of use for outdoor lighting that has been found for energy-saving lamps. Cost-saving innovations usually have a “rebound effect” through increased expenditure. The relevant criterion for determining whether an innovation is an eco-innovation is that its use is less environmentally harmful than the use of relevant alternatives. This is also the basis for the definition of environmental technologies in ETAP, where environmental technologies are “technologies whose use is less environmentally harmful than relevant alternatives”.2
In everyday life the term “environmental technologies” has obtained a much more narrow interpretation by being linked to the environmental goods and services industry (sometimes called “eco-industry”)), i.e. companies who are engaged in “the production of goods and services to measure, prevent, limit, minimise or correct environmental damage to water, air and soil, as well as problems related to waste, noise and ecosystems” (OECD and Eurostat definition). For these companies, environmental protection is their core business. Within eco-industry we have companies whose only business is environmental technology and those with activities in other areas of business. Over time, however, ETAP moved away from its original focus on technologies and processes whose purpose was to deal with pollution, waste and water management, to include “all technologies and processes to manage pollution (e.g. air pollution control, waste management), less polluting and less resource-intensive products and services and ways to manage resources more efficiently (e.g. water supply, energy-saving technologies)” (ETAP, 2004). This latter definition is in line with the definition of eco-innovation based on outcomes instead of motivation but clearly is a cause of confusion. Increasingly, in communications the term “environmentally friendly technologies” (or “eco-friendly technologies”) is used.3 In MEI we also discussed whether novelty should be a defining characteristic for innovation. We agreed that while there should be an element of novelty, the novelty does not have to be a novelty new to the world but may also exist in something being novel to a firm. The minimum degree of novelty means something that is new to the firm or other user. This distinction between innovations that are “new to the market” and those that are “new to the firm” is important for assessing the diffusion of innovations. The European Innovation Scoreboard takes this into account by including one indicator on “new to the relevant market” and one on “new to the firm” innovation.
2 There is another definition of ETAP of environmental technologies that says that environmental technologies encompass technologies and processes to manage pollution (e.g. air pollution control, waste management), less polluting and less resource-intensive products and services and ways to manage resources more efficiently (e.g. water supply, energy-saving technologies). 3 http://ec.europa.eu/environment/etap/index_en.htm . The term “technology” is still undefined.

7
Of course, it is important to know whether the novelty is minor or major. We may want to separate minor novelties from major novelties in indicator research. A partially unresolved question is whether it makes sense to distinguish between resource-efficient innovations and low pollution and low-waste innovations. It seems that the distinction matters mostly from a technological viewpoint, and is less relevant from an eco-innovation analysis viewpoint because greater resource-efficiency and waste reduction normally lead to lower pollution. Among the eco-innovation experts it was agreed that measurement technologies for measuring pollution, resource use and environmental quality, and “green energy technologies” are also to be viewed as environmental technologies. Green energy technologies are not explicitly mentioned in the definition of environmental technologies as “all technologies and processes to manage pollution (e.g. air pollution control, waste management), less polluting and less resource-intensive products and services and ways to manage resources more efficiently (e.g. water supply, energy-saving technologies)” but they should be viewed as being part of it. The most important conclusion of MEI is that the concept of eco-innovation should not limited to new or better environmental technologies: every environmentally improved product or service counts as an eco-innovation. We discussed whether the term “eco-innovation” should be limited to those innovations that are aimed at reducing environmental harm. The consensus was not to do this but to make the environmental effects (vis-à-vis relevant alternatives) the sole criterion for eco-innovation. Based on the OECD definition of innovation,4 we propose the following definition for eco-innovation:
Eco-innovation is the production, assimilation or exploitation of a product, production process, service or management or business method that is novel to the organisation (developing or adopting it) and which results, throughout its life cycle, in a reduction of environmental risk, pollution and other negative impacts of resources use (including energy use) compared to relevant alternatives.
This definition is based on the definition in the call but no longer requires that the innovation is aimed at reducing environmental harm. From this two important things follow. First, that all new processes that are more resource efficient are eco-innovations. Anything is an eco-innovative solution as long as it is more environmentally benign than “the relevant alternative”. The relevant alternative may be the technology in use in a company or the normal technology in a sector (for example, gas or coal burning stations in the case of electricity generation). Innovations in coal burning technology would qualify as eco-innovation if they reduced emissions. The second thing that follows from this is that the term eco- 4 The Oslo Manual (OECD 2005) defines innovation as the implementation of a new or significantly improved product (good or service), or process, a new marketing method, or a new organizational method in business practice (where implementation means realization for use).

8
innovation crucially depends on an overall assessment of environmental effects and risks. Life cycle assessment based on multi-attribute value theory can be used for such an assessment. We should note here that this approach may create a problem for survey analysis: the respondents’ assessment of whether an innovation is better than relevant alternatives on a life cycle basis need not be true. In fact, the knowledge may not be available or crucially depend on how and where the innovation is used. LCA have been completed only for a handful of products and processes. As a last remark, one may restrict the term “eco-innovations” to those innovations offering a significant (non-negligible) reduction in environmental harm. This then leads to problems of defining “significant”. To us the above definition of eco-innovation is relevant and appears to be workable both for statistical agencies and for companies. There is a wide consensus in the MEI project that data collection and indicator research should not be limited to environmentally motivated innovations but also should comprise “unintended environmental innovations” for the reason that they constitute an important category, about which we know very little. Of course, if we do this, then almost all firms will be eco-innovators. However, this is the same “false problem” that has been discussed in reference to the Oslo Manual on measuring innovation, with people objecting that the Manual defines innovation so broadly that almost all firms should be innovators. The problem is not that all firms are innovators (most should be), but how we use the data to look at the different ways in which firms innovate. 1.3 Eco-industry The broad definition of eco-innovation might have implications for our understanding of eco-industry. One could argue that the definition of “eco-industry” should be widened to include also companies whose innovations qualify as eco-innovations by being less environmentally harmful than relevant alternatives. This would create problems from a data collection view point, as the term “eco-industry” is already used for data collection activities by Eurostat and OECD; they define eco-industries as “activities which produce goods and services to measure, prevent, limit, minimize or correct environmental damage to water, air and soil, as well as problems related to waste, noise and eco-systems. This includes technologies, products and services that reduce environmental risk and minimize pollution and resources” (European Commission, 2006). The eco-industry (or environmental goods and services sectors as it is also called) may be measured on the basis of environmental protection measures or on the basis of sales, or a combination thereof. Whatever method is used, it is important to note that eco-innovation occurs in the whole economy: any company adopting a good, service, production process management or business method with environmental benefit is an eco-innovator. In this respect, it appears useful to distinguish between different types of eco-innovators. Here we could follow the suggestion of Bruce Tether in the UK and Anthony Arundel and Hugo Hollanders at UNU-MERIT to assign all innovative firms to one of four mutually exclusive categories, depending on how each firm innovates (by developing innovations for other firms, adopting innovations developed elsewhere in a strategic or passive way). Following this logic, eco-innovators could be classified in one and

9
only one category on the basis of how they introduce environmental innovations. For instance:
• Strategic eco-innovators: active in eco equipment & services sectors, develop eco-innovations for sale to other firms.
• Strategic eco-adopters: intentionally implement eco-innovations, either developed in-house, acquired from other firms, or both.
• Passive eco-innovators: process, organisational, product innovations etc. that result in environmental benefits, but where there is no specific strategy to eco-innovate.
• Non eco innovators: No activities for either intentional or unintended innovations with environmental benefits.
These categories of eco-innovators may be identified in the CIS using filter questions. The partitioning of the universe of firms into 4 categories based on eco-innovation activities has not been attempted by anyone but appears an interesting direction for indicator research, allowing one to study changes in company behaviour within the economy and possible reasons for them. At this moment only comprehensive information is available only for the strategic eco-innovators belonging to the eco-equipment & services sector. Work is under way to link the OECD list of environmental technologies with NACE. 5 Figure 2 anticipates a possible outcome of the partitioning of firms according to eco-activities. Note that the indicated size is nothing more than a wild guess. Figure 2. Possible distribution of firms according to eco-activities 5 Eurostat is currently drafting a compilation guide for collecting stats on the EGSS, so they are also in the process of defining the sector from the activities point of view (the NACE codes). They have defined a ‘core’ industry group (NACE 25.12, 37, 41, 51.57 and 90), but the much larger ‘non-core’ group of industries is yet to be defined.
Passive eco-adopters
Strategic eco-adopters
Strategic eco-innovators
Non-eco innovators

10
The economic size of environmentally beneficial innovations produced outside the eco-industry is unclear. We do know from Dutch studies that probably half of the innovations have a “free” environmental benefit but, as noted, this has not been systematically studied. According to a recent study by Ernst and Young for DG Environment, the output of eco-industry narrowly defined amounts to 2.2% of GDP. The share of non-eco innovators is probably between 20-30%, based on survey information from the IMPRESS project of 1594 companies of more than 50 employees in five European countries (Germany, Italy, NL, CH and UK) in the 1999-2000 period and a recent OECD study of 4186 facilities in seven OECD countries (Canada, France, Germany, Hungary, Japan, Norway, and the USA). It is clear, however, that future eco-innovation data collection should go beyond the traditional eco-business sector, which captures only a small amount of the eco-activities. There is a real need for an assessment of the eco-activities in companies not belonging to the environmental goods and services sector as defined by the OECD. 1.4. Typology of eco-innovation Keeping in with the view that any innovation that offers environmental benefits compared to relevant alternatives is to be viewed an eco-innovation we developed the following classification for eco-innovation. A. Environmental technologies
- Pollution control technologies including waste water treatment technologies. Cleaning technologies that treat pollution released into the environment;
- Cleaner process technologies: new manufacturing processes that are less polluting and/or more resource efficient than relevant alternatives;
- Waste management equipment; - Environmental monitoring and instrumentation; - Green energy technologies; - Water supply; - Noise and vibration control.
B. Organisational innovation for the environment: the introduction of organisational methods and management systems for dealing with environmental issues in production and products. A finer classification is:
- Pollution prevention schemes: aimed at prevention of pollution through input substitution, more efficient operation of processes and small changes to production plants (avoiding or stopping leakages and the like);
- Environmental management and auditing systems: formal systems of environmental management involving measurement, reporting and responsibilities for dealing with issues of material use, energy, water and waste (EMAS and ISO 14001 are examples);
- Chain management: cooperation between companies so as to close material loops and to avoid environmental damage across the value chain (from cradle to grave).
C. Product and service innovation offering environmental benefits: new or environmentally improved products and environmentally beneficial services
11
- New or environmentally improved material products (goods) including eco-houses and buildings;
- Green financial products (such as eco-leases or climate mortgages); - Environmental services: solid and hazardous waste management, water and
waste water management, environmental consulting, testing and engineering, other testing and analytical services;
- Services that are less pollution and resource intensive (car sharing is an example).
D. Green system innovations
- Alternative systems of production and consumption that are more environmentally benign than existing systems: biological agriculture and a renewables-based energy system are examples.
New materials such as lightweight composite materials could be an additional category. They could also be subsumed under product innovations.

12
2. Methods for measuring eco-innovation MEI investigated the usefulness of 3 methods for measuring eco-innovation
- Survey analysis - Patent analysis - Digital and documentary source analysis
2.1 Survey analysis Survey analysis is an important method for monitoring and understanding innovation. The results of the Community Innovation Survey (CIS) have provided us with a much better idea of innovation activities in Europe. While the CIS has provided researchers with extremely valuable information, unfortunately it provides little information about eco-innovation. At the moment environmental issues are not specifically and separately addressed by the CIS. In CIS6 they are addressed together with health and safety issues in question 7.1. CIS also has a question about whether the innovation helped to meet regulation and also asks about process-related effects in terms of reduction in the use of material and energy for new innovations (adopted in the last 3 years). There are, however, no questions on waste and pollution.
In MEI we examined the possibilities of studying eco-innovation through survey analysis, with special attention to the CIS. We will report here the main findings (as relayed in the report of Horbach and Rennings and the workshop on survey analysis). Questions and additional information for the respondent firms in surveys, have to be simple and short. Therefore, a not overly detailed classification of eco-innovation has to be applied. It seems useful here to consider the distinction between technical, presentational and organisational innovations of the OECD Guidelines for Collecting and Interpreting Technological Innovation Data (OECD, 2005). Technical innovations are divided into product and process innovations:
• Process innovations occur when a given amount of output (goods, services) can be produced with less input;
• Product innovations require improvements to existing goods (or services) or the development of new goods. Product innovations in machinery in one firm are often process innovations in another firm;
• Presentational innovations refer to the implementation of new design and marketing methods in order to increase firms’ sales;
• Organisational innovations include new forms of management, e.g. total quality management.
According to MEI researchers Jens Horbach and Klaus Rennings, the analysis of eco-innovation within surveys cannot be restricted to a simple identification of the different innovation activities of the questioned firms. In particular the development of political measures to promote eco-innovation requires a profound knowledge of the drivers and barriers and also, if possible, of the economic and ecological impacts of eco-innovation. One major problem of surveys in general is that there are normally only few possibilities to link survey data with official statistics or other survey data. Therefore, the survey itself has to provide information on the relevant control variables such as the influence of different policy instruments.

13
Combining theoretical assumptions with evidence from past surveys, an optimal set of survey questions was identified, both for the determinants and for the control variables for eco-innovations. Determinants (drivers and barriers) of eco-innovation
• Inputs: financial and human resources, R&D expenditure supporting the technological capabilities of a firm;
• Environmental policy framework (e.g. regulatory stringency, different environmental policy instruments such as technology-based standards, emission taxes or liability for environmental damages);
• Existence of environmental management systems, practices and tools; • Demand pull hypothesis: expected market demand, profit situation in the past; • Appropriation problem: competition situation (e.g. number of competitors,
concentration of the market), innovation cooperation; • Influence of stakeholders and motivations for environmental innovation (e.g.
public authorities, pressure groups such as industry or trade associations); • Availability of risk capital; • Availability of high-skilled labour force.
Control variables and impacts
• Firm-level attributes (sector, size, stock market listing, employment, value of shipments);
• Commercial conditions (scope of the firms’ markets, competition, sales, profitability);
• Environmental impacts of the facilities’ products and production processes by different environmental fields (importance of each impact and change in impacts during the last three years).
Is not possible to provide a general prescription for the measurement level of both innovation and control variables, For econometric analysis it would always be the best solution to analyze interval data but in many cases the firms are not able to provide quantitative answers on questions like “R&D expenditures for eco-innovation in EUR”. Because the number of missing values for these questions will be very high, the results of econometric analyses would probably be biased. Therefore, questions that are likely to demand too much information of the interviewed firm representative instead have to be posed in a simple, in many cases, binary manner (see also Arundel 2005). Arundel (2005) proposes to obtain nominal data on the prevalence of different types of innovation, and ordinal data on inputs, outputs and impacts. Concrete suggestions for CIS One aim of MEI is to offer concrete suggestions for questions about eco-innovation for the Community Innovation Survey. Using the CIS for the analysis of environmental innovation does not require adding many questions because the survey is already very rich concerning the relevant control variables. Therefore, we only need to alter some of the questions and to add a single question capturing the character of the environmental innovation activity. We propose to include a question about environmental regulation as an innovation source. It would be useful to introduce this question in the general questionnaire of

14
CIS for all the involved countries. It is important, however, to formulate the question in such a way that environmental regulation could also be seen as a driver of general innovation and not only of eco-innovation (see also the debate on the Porter hypothesis). We propose to separate the environmental from the health effects of innovation. In general, it is not useful to combine these two effects because in many cases health effects have nothing to do with environmental effects. For instance, the development of a new drug (medical treatment) to reduce the mortality of heart diseases could have high health impacts but no environmental effects. To learn more about the character of eco-innovation it would be useful, therefore, to add one single question following the classification product, process, organisational and presentational eco-innovation of the Oslo Manual. This leads to the following propositions for questions on eco-innovation for the Community Innovation Survey: 1) Environmental policy as innovation source a) Did you realise innovations from 20XX to 20XY (new or significantly improved
products or production processes) predominantly because of existing or anticipated environmental policy measures?
Yes, No b) If yes, which of the environmental policy measures were decisive for the
introduction of these innovations? Please describe the measures in the order of their importance: ……………………………………………….
2) How important were each of the following effects of your product (good or service)
and/or process innovations introduced during the three-year period 20XX-20XX? Degree of importance: Not relevant - Low - Medium - High
Reduced materials and energy per unit output Reduced environmental impacts Improved health and safety
3) Please answer the following questions if you reported high or medium reduced
environmental impacts of your innovation activities in question 2: a) Do you consider the reduction of environmental impacts as the main purpose of
your innovation activities? Yes No b) Predominant category of your innovation: Product innovation Process innovation Organisational innovation

15
2.2 Patent analysis6 Eco-innovation activities may also be analysed through patent analysis. This has been done by scholars such as Lanjouw and Mody, Jaffe, Marinova and McAleer, whose findings are an important source of information. What is a patent? A patent is an exclusive right to exploit (make, use, sell, or import) an invention over a limited period of time (20 years from filing) within the country where the application is made. Patents are granted for inventions which are novel, inventive (non-obvious) and have an industrial application (useful). The right embedded in the patent can be assigned by the inventor to somebody else, usually to his/her employer, a corporation, and/or sold to or licensed for use by somebody else; this right can be enforced only by the potential threat of or an actual suit in the courts for infringement damages (OECD, 2004). The standard of novelty and utility imposed on the granting of such a right is not very high. In Europe, the European Patent Office (EPO) grants about 70% of the patent applications. In the US, more than 80% of the patents applications are granted. The measurement of technological innovation has long preoccupied economists. R&D and patent data have emerged as relevant indicators of the innovativeness of an economy. R&D expenditures provide an input measure of innovative activity, while patent data are considered an output indicator. For innovation research, the main advantage of patents is that they are publicly available for rather long time series and provide detailed technological information. The long time series make patents unique among innovation indicators. Using patent data, it is possible for researchers to collect data in highly disaggregated forms and to subject this to statistical analysis. The cost of processing patent data is also lower than the cost of survey-based data. As a measure of invention patents have a close (if not perfect) link to technical invention. Over the last two centuries, there are very few examples of major technical inventions that were not patented. Patents cover a broad range of techniques, extending now to biotechnology and software, with first extensions towards service-related inventions (so-called “business methods”). Invention is, of course, not the same as innovation. The use of patent data enables researchers to study and to assess different features of innovative processes. On the basis of the huge literature on patents, we can emphasize five attributes of innovative activities that can be evaluated through patent data. • The level of inventive activity: Given that patent applications are usually filed early in the research process (Griliches, 1990), they are not only a measure of innovative output, but also an indicator of the level of innovative activity itself (Popp, 2005).7 Cohen et al. (2000) emphasize that there is a mutual causation between R&D and patents, and that patenting tends to stimulate R&D, in line with one of the objectives of patent legislation. Lanjouw and Mody (1996), for example, found a strong positive correlation between patents and R&D in alternative energy for the US.
6 The section is based on the report by Vanessa Oltra, René Kemp and Frans de Vries for MEI. 7 It is better to talk about inventive activity instead of innovative activity, as they are different things. Innovative activity involves far more than the development and use of an invention. Innovation involves production, design and marketing. An innovation project need not be based on an invention.

16
Figure 3: Correlation between patents and R&D in alternative energy in the US
Source: Lanjouw and Mody (1996, p. 560) If we look across countries we also observe that countries with high levels of R&D per capita tend to have more patents per capita. The Netherlands and Germany have the highest levels of patents applications per GERD.8
8 Gross domestic expenditure on R&D (GERD) is total intramural expenditure on R&D performed on the national territory during a given period. It includes R&D performed within a country and funded from abroad but excludes payments made abroad for R&D.

17
Figure 4: Patents per capita and expenditure on R&D per capita across countries
Source: Eurostat (2006a) Thus patent data tend to be correlated with R&D. The advantage of patent data is that they are available for technologies whereas R&D data are usually not. For broad technology classes, such as alternative energy technologies, information on public R&D is available. Information on private R&D on specific technologies is usually not available, however, as companies do not want to report this and also are often not requested to do so by statistical agencies. • Types of innovation and technological competencies of organizations: each patent provides a detailed description of the invention and is classified according to the International Patent Classification (IPC)9. This classification is a hierarchical system in which the whole area of technology is divided into a range of sections, classes, subclasses and groups. This system is indispensable for the retrieval of patent documents in the search for establishing the novelty of an invention or determining the state of the art in a particular area of technology. These data allow for a microeconomic analysis of the patented invention and of the technological competencies of the patenting organizations. More precisely, the description of the technology and the IPC codes can be used to distinguish between different types of technological innovations according to their degree of novelty (radical or incremental) and their technological field. For example, the OST/INPI/ISI classification provides a concordance table between IPC codes and thirty technological fields, which is used to classify patents according to the type of technology. Moreover, patents are also a good indicator of the directions of research and of the technological competencies of organizations (public organizations or private firms). The fact that a firm applies for a
9 Patent examiners assign at least one classification code of the IPC to all patent documents by.

18
patent in a given technological field means that such a firm is at, or close to, the technological frontier and has advanced technological competencies in that field. Patent portfolios of firms offer detailed information on the relevant technological areas, which is of particular relevance in order to assess the firms' spectrum of technological activities. Many empirical studies use patent data to analyze firms' technological diversification (see for example, Breschi et al., 2003).
• Technology strengths of nations: Patents can be used to determine the technology strengths of nations. Thus the US has the highest levels of patents, which is evidence that the US is technologically advanced. Looking at EPO applications in 2002, the United States leads by far, with 46 819 patent applications, followed by Germany and Japan, with 24 514 and 24 494 patent applications respectively. Eleven of the 20 worldwide leaders are EU-25 Member States. Along with Japan, there are three other Asian countries among the 20 best performing countries: South Korea (8), China (15) and India (20). A further breakdown of patents is needed to determine whether a nation is leading in a sector. A breakdown of patents per sector can be found in the “Patent Scorecard”, based on information of the world’s top 2500 technology firms, collected by the American company called “Intellectual Property Intelligence Quotient” (ipIQ)
Table 1: US patenting activity broken down by industrial sector and world region, as a percentage of 2500 of the world’s top technology firms, 2005
Europe plays a significant role in US patenting in industrial sectors such as pharmaceuticals (47%), telecommunications (39%), energy and environmental (38%), chemicals (29%), and automotive and transportation (27%). In most sectors the US displays a technological leadership, which is particularly strong in biotechnology, aerospace and defence, and medical devices. Japan is leading in consumer electronics.

19
Patents can also be used to determine the technological position of nations in a certain technology area (for example, nanotechnology). Marinova and McAleer (2003a, 2003b) analyse the technological position of the top 12 foreign patenting countries in the US in the area of nanotechnology. The non-US countries are Australia, Canada, France, Germany, Great Britain, Italy, Japan, Korea, The Netherlands, Sweden, Switzerland, and Taiwan. The analysis uses four indicators of technological strength based on patent data, which are: i) technological specialization index, ii) patent share, iii) citation rate and iv) rate of assigned patents. The technological specialization index is the quotient of the share of environmental patents in a technological area or sector and the average share; if it is above 1 the nation can be said to be specialized in that area. The patent share is the national share of particular technology in the overall number of patents in the same field, allowing for a ranking of countries. The citation rate gives the mean number of citations per patent from a particular country; it is a measure for the importance of the patents. The rate of assigned patents is the percentage of patents that is assigned; it is indicative of the market relevance. Marinova and McAleer find France to be the best performing country in the area of nanotechnology, followed by Japan and Canada. • Technology diffusion: Patent data are available from many different countries and so can be used to track patterns of diffusion (Popp, 2005). Because the legal protections granted by a patent only apply in the country in which the patent has been granted, inventors must file patent applications in each country for which they desire protection. In Europe, inventors may choose to file an application through the EPO, rather than applying to individual patent offices. The applicant designates as many of the 18 EPO member states for protection as is desired. Because EPO applications are more expensive than single country applications, European inventors typically first file a patent application in their home country, and then apply to the EPO if they desire protection in multiple European countries10. Because of the additional costs of filing abroad, only the most valuable inventions are filed in several countries. Filing a patent application in a given country is a signal that the inventor expects the invention to be profitable in that country, which is seen as a potential. In that sense, researchers can use the data on multiple filings of patents to track the diffusion of technology across countries (Lanjouw and Mody, 1996). Diffusion may be tracked for environmental technology as a whole or for specific subsets. It thus allows for diffusion analysis at a highly aggregated level. It does not measure diffusion directly, but only indirectly. For example it does not provide information on the level of diffusion, such as whether it is 1%, 10% or 100%. • Source of invention: from the bibliographic data on a patent, researchers can learn the identity and home country of the inventor and of the assignee (or the applicant). The assignee is the person who has the legal rights to the patent. This information enables researchers to identify the sources of innovation in terms of patenting organizations. In this way, patent data can be used to study the relative role of public and private organizations in the innovative process. For a given technology, or a given IPC section, we can calculate the share of patents filed by private firms, universities and public laboratories. In the figure below, for example, it can be seen that
10 These additional filings of the same patent application in different countries are known as patent families (Popp, 2005).

20
businesses applied for most EPO patents (82.4%). Only 17.6% of EPO patent applications are from other institutional sectors (Eurostat, 2006). Figure 5: EPO patent applications by sector
Source: Eurostat (2006a) When focusing on private firms, patent data can also be used to study the distribution of patents across sectors and, for example, to emphasize the share of patents filed by component manufacturers. Some authors concentrate on joint patent applications, in order to study collaborations and network of innovators. For example, Yarime (2005) analyses university-industry collaboration in the field of photocatalyst technologies. On the basis of joint patent applications, the author maps the networks of innovators and stresses the central role of big Japanese university laboratories. In this type of work, patents are used as an indicator of the relationships between organizations in the innovation process. • Technological spillovers and knowledge relatedness: In recent years there have been various attempts to conceptualize relatedness among technological fields and to find appropriate measures for knowledge spillovers. Various methodologies have been proposed on the basis of patent data: based on Scherer (1982) the 'Yale matrix' is constructed on the data from the Canadian Patent Office, which assigns principal user and producing sectors to each patent, and is used for measuring the flow of spillovers from the innovation producing sector to the innovation-using sector; Jaffe (1986, 1989) measures technological relatedness among a sample of US firms by looking at the distribution of their patents across technological fields (each field corresponding to a collection of 12-digit IPC codes); Engelsman and Van Raan (1991, 1992) analyze the co-occurrence of IPC codes assigned to patents to evaluate knowledge links and spillovers; and Verspagen (1997) evaluates intersectoral technology spillovers by distinguishing between the main classification IPC code and the supplementary codes. In another study, Verspagen (2005) uses patent citations to describe the main paths of knowledge flows in the field of fuel cells and to map the technological trajectories

21
underlying fuel cell developments. Such a methodology enables the researcher to capture the cumulativeness and the dynamic character of innovation. • The novelty of inventions: The importance of the invention can be assessed through patent analysis. Important patents are cited more often than less important patents. Of course it takes time for a patent to be cited; old patents are likely to be cited more often than new ones. The importance of the invention may also be assessed through expert evaluation. The consultation of experts may also be relied upon to identify important inventions not patented.
The limits of patent data indicators In spite of the wealth of information contained in patents, their use as innovation indicators also presents strong weaknesses and biases of which researchers should be aware. Firstly, patent data only capture a limited proportion of all innovations. According to Crepon et al. (2000), on average 30% of innovations in the French industrial manufacturing sector are patented. The propensity to patent differs between sectors. Table 2 presents the results of the CIS4 survey on the share of innovative firms protecting their innovations with patents. Table 2: Share (%) of firms protecting their innovations with patents in the sample of innovative firms over the period [2002-2004] (CIS4, 2004)
Industrial sectors (NES 16) % of firms protecting their innovations with patents
EB: Foods, beverages, tobacco 16,4
EC: Consumption goods 25,1
ED: Motor vehicles 42,5
EE: Equipment goods 33,4
EF: Intermediary goods 30,5
EC à EF: Manufacturing industry (without IAA) 30,5
EG: Energy 29,5
EB à EG: Industry 28,7
EN: Firms services 15,5
Smaller firms have a lower probability to apply for at least one patent. However, given that they do patent, they apply for higher numbers of patents (Brouwer and Kleinknecht, 1999). A second limitation of patent data indicators is that the value distribution of patents is very skewed, and it is important to take this into account. A few patents have large value, whereas many have very low value. Hence the usefulness of simple patent counts is limited, as they put on an equal footing patents of very different values.

22
Different methodologies have been proposed to evaluate the value of patents. For example, one may ask patent owners about past returns and the potential market value of their rights, look at the renewal of patents and at the number of citations. Here the development of the OECD Triadic Patent Family database is of great interest since it provides a database of "high quality" inventions. The use of patent families - i.e. filings of the same patent application (which share the same priority date) in different countries – enables the researcher to focus on the most valuable innovations. Indeed, because of the added costs of filing abroad, the less valuable patents are usually filed only in the inventor's home country. The use of patent data also poses methodological issues. How does one allocate patent data organized by firms or by substantive patent classes into economically relevant industry or product groupings? The OECD Technology Concordance (OTC) presented in Johnstone (2002) may be used to transform IPC-based patent data into patent counts by sector of the economy, but this does not work well for patents used in multiple sectors. The identification of eco-patents in patent databases raises methodological issues which should be taken into account when interpreting the results. In the literature two methodologies are used, sometimes in combination: research in specific patent classifications and/or searching for relevant keywords. The problem is that patent classification systems do not provide specific categories which cover environmental patents and there is also no widely accepted agreement in the literature as to what constitutes an environmental technology. The methodology also depends on whether the analysis concerns environmental technologies in general or a specific set of technologies. In order to be able to define relevant keywords, researchers must have an adequate knowledge of the technologies under consideration. Moreover, when the analysis seeks to evaluate eco-patents in general, it is generally restricted to end of pipe technologies. Eco-patent analysis can be broader in terms of types of innovation when it focuses on specific technological fields. When the area of the analysis is more precise, researchers can identify the relevant technologies and define a precise list of keywords. Nevertheless, whatever the methodology, it is difficult to know exactly the characteristics of the distribution of eco-patents, in terms of type of eco-innovation and in terms of their environmental value. The three step model of de Vries and Withagen (2005) appears a good model (described in the project deliverable on patents). It consists of a careful screening of patents through the analysis of patent abstracts, to avoid noise. Not all eco-innovations can be usefully analysed through patent analysis. Eco-patents mainly measure inventions that underlie green product innovations and end of pipe technologies, whose environmental impacts are specific aims and motivations of the inventions. For these kinds of innovations it is acceptable to use patent analysis. For other types of innovation, patent analysis does not appear very suited.

23
2.3 Digital and documentary source analysis Most contemporary scholars agree with Schumpeter that innovation is only accomplished with the entry of a new product or process into commercial use. This concept has profound consequences for the measurement of innovation. It suggests that the innovation indicator of choice would be based on a direct and systematic monitoring of such output events. This is quite different from the measurement of R&D (an ‘input’ indicator of knowledge activity) or the counting of patents (an ‘intermediate’ indicator of inventive activity). Yet, surprisingly, the use of output events as an innovation indicator is much less developed than the use of ‘upstream’ input or intermediary measures. There is considerable evidence that research and patent activity is a poor guide to actual innovation performance. First, only a small proportion of research or patenting leads to innovation and this varies considerably between different organisations and contexts. Second, much innovation arises from other sources than formal research or patentable invention, such as external users or non-R&D in-house functions. Both of these incongruities reinforce the importance of focusing on a direct measure of innovation output events. An important explanation for the inappropriate emphasis on input and intermediary indicators is the availability, and ease of access to data. R&D expenditure is covered by accounting procedures. Patent data arise from legal processes. Both may be readily used to generate aggregate national and sectoral data, and, with more difficulty, to generate organisation specific data. Much of this information is available in the public domain. Data on innovation output events are not gathered so systematically nor are they so readily available. However, it is a mistake to conclude that they are not available at all. The vast majority of innovation output events are announced publicly in some form, and therefore leave visible communication traces which, with ingenuity and commitment, may be used for the construction of useful indicators. Other than availability, another explanation for the neglect of innovation output events is the issue of commensurability. It is argued that such events present a classic ‘apples and oranges (or pears)’ dilemma. While it is true that the raw data of innovation output events presents confusing qualitative diversity (in terms, for example, of novelty and functionality) this is not an intractable problem and can be resolved through an appropriate classification scheme. The use of ‘universal’ monetary or legal units in R&D and patent indicators is merely one particular expression of this. The fundamental commensurability problem exists just as much between a unit of research in pharmaceuticals and in road safety, between a patent in nanotechnology and one in clockwork as between an innovation output of a Personal Data Assistant and a new strain of rice. As with availability the challenge of incommensurability is different to that for conventional input and intermediate indicators, but is not insurmountable. Recognition of the shortcomings of input and intermediate indicators has led some researchers to focus on measuring innovation through downstream indicators of the possible consequences or outcomes of innovation. These include measures of productivity, turnover, profitability, and market share. A UK study in the early 1990s argued that quoted share price was the most effective proxy for innovation since it represented an easily visible investor assessment of corporate innovation performance. The same critique applies here as for upstream indicators. Without a

24
robust indicator of innovation output events it is impossible to assess the contribution of innovation to these downstream outcomes compared with other economic, social or managerial factors. Although attracting less attention than other indicators, innovation outputs have been employed in a number of research studies. A common solution to the problems of availability and commensurability is to narrow the focus to either a sector, or to the most prominent innovations. Several indicators have been developed for reaching firms’ innovation output based on literature. The two main methods are: Output measures in innovation surveys: This method gathers its information regarding technological innovation in products or processes directly from company managers, usually through a survey. It covers the innovative behaviour and activities of the firm as a whole and explores the factors influencing the innovative behaviour of the firm, the scope of various innovation activities and the effects of innovations (Flor and Oltra, 2004). Using New Product Announcements: This is a literature-based innovation output indicator (LBIO). LBIOs databases are built by sampling the ‘new product announcement’ sections of technical and trade journals. Technical journals are chosen which have editorially controlled sections where new products are reported (Coombs et al, 1996). This means that the details, though supplied by the companies, are not in the journals by virtue of being a paid advertisement, but by virtue of the decision of the journal editor to include them. This characteristic guarantees objectivity and equity of the selections. If a series of journals covering most industrial sectors are compiled over a long period of time, it is relatively easy, if time-consuming, to generate a substantial database of new or modified products introduced into a national market-place during a particular time period (Coombs et al, 1996). Eco-innovation output indicators The overwhelming majority of research on innovation indicators has been concerned with the issues of innovation with respect to economic competitiveness rather than environmental sustainability. Even within those terms there are serious limitations to the utility of the indicators generally employed. A reliable innovation output indicator would, in itself, be of value to the development of useful eco-innovation indicators by providing a systematic record of ‘actually existing’ innovation in a specific form which would allow a further level of interpretive analysis of the environmental consequences of each specific innovation output event. The distinguishing requirement, of course, is some means of classifying and comparing innovation outputs according to their impact on environmental sustainability. Looking at what is available MEI researcher Fred Steward found that the literature based innovation output indicators has not addressed environmental sustainability directly. However there are studies that have explicitly sought to construct eco-innovation indicators using analogous methods: the TEI (Technological Environmental Innovation) database (Huber 2004) and the new product data base for
25
air conditions and gas water heaters based on the US Sears catalogue (Newell et al 1999). The two studies reviewed show that it is possible to incorporate environmental performance into a literature based innovation indicator. The TEI study relies on expert judgement as the basis for classification of specific innovations into useful eco-innovation categories. The Newell study utilises published energy efficiency performance data of specific new product introductions as the basis for comparative analysis of the ‘eco’ dimension of innovation. Digital possibilities All of the studies reviewed have been based on a manual search of selected published documentary sources. They show that this method can be used to construct useful innovation output indicators and that such indicators can include measures of environmental impact of individual innovations which can be used for comparative analysis. Most of the studies reviewed are constrained by geographical location, time period, sector or significance. These constraints partly arise from the reliance on physical documentary sources and manual searching which result in a rather cumbersome and labour intensive process. It is evident that since the emergence of the World Wide Web as an easily accessible information source in the early 1990 that the journals and catalogues used in these studies have become available in digital form with the prospect of more efficient searching. There has also been a widespread emergence of online databases which also contain reports of new commercial introductions of innovations and offer the prospects of gathering innovation output indicators in a new fashion. It now appears feasible to construct eco-innovation indicators derived from digital sources from the year 2000 onwards and in some cases from earlier periods as well. A review of online digital source of data which could be used to capture innovation output events reveals two broad types of interest.
• ’New announcement’ databases • ‘Product information’ databases
An example of a new announcement databases is the PIRA base which tracks innovation announcements in the paper industry sector. An assessment was undertaken of the identification of new and emerging nanotechnology innovations for environmental sustainability within a specific sector. This sustainable technology study is concerned with nanotechnology applications to a specific technological area- “print-on-paper”. Its deinkability function for enhanced fibre recycling in the paper recovery stage is examined through this innovative approach. It is often stressed that new and emerging generic technologies offer great potential for major gains in eco-efficiency and dematerialization. Assessing emerging innovations which consists of any changes in end uses of materials and commitments to recycling, offer cleaner and more efficient processes can certainly help in identifying types of eco innovations developed over time. Product Information Databases offer a second possibility for tracking innovation output. There is a growing availability of publicly available information databases to guide consumers in making choices regarding product purchase. This is an online analogy to the product catalogue type of literature database. One particular subset of

26
these which is of particular interest for eco-innovation indicators is designed to enable consumers to exercise choice on the environmental impact of their selected products. Although many databases are available in various forms through web access to the product catalogue type of literature database, many of them are rather too partial or selective in coverage of information. Only the ones offering comprehensive consistent data on some environmental performance parameters have the chance to be applied in measuring eco-innovations. Though often rather partial and selective, some offer comprehensive product coverage with consistent data on some environmental performance parameters. Some of these arise from new legislative requirements to provide environment relevant information to consumers. For example, Directive 1999/94/EC requires availability of consumer information on fuel economy and CO2 emissions in respect of the marketing of new passenger cars. A publicly accessible web based UK database (May 2007) has 2871 models with details on company, technical characteristics and environmental impacts. A feasibility study was undertaken to assess the viability of using public available products information database to identify eco-innovation. Changes in eco-performance of products can be established for a number of electric household appliances thanks to a series of Council Directives pertaining to labelling and standard product information of the consumption of energy and other resources. Based on the Council Directive 92/75/EEC, the European Commission defined details of the relevant type of appliance and the obligation to implement the corresponding directives. As yet, directives were adopted for the following electrical household appliances: household electric refrigerators and freezers and their combinations (Directive 94/2/EC with amendment 2003/66/EC), household washing machines (Directive 95/12/EC), household electric tumble driers (Directive 95/13/EC), household combined washer-driers (Directive 96/60/EC), household dishwashers (Directive 97/17/EC and amendment 99/9/EC), household lamps (Directive 98/11/EC), household air-conditioner (Directive 2002/31/EC) and household electric ovens (Directive 2002/40/EC). A further directive on labelling hot water heaters is planned. As with passenger vehicles a consequence of this legislation is that data on the environmental performance of new products is now systematically gathered.Access to these databases with some systematic analysis of source and time to market of innovation could lead to a useful eco-innovation indicator Conclusions The review of empirical studies of literature based innovation output indicators demonstrates that it is feasible to capture innovation output events through the systematic selection of reports of such events which are recorded in documentary sources such as trade journals or product catalogues. With appropriate methods it is possible to categorise these innovation events according to attributes such as organisation size and location, novelty and functionality of innovation, time of market entry etc. This enables comparative analysis of patterns of innovation according to time, place, organisation, sector, and technology. In short it leads to an appropriate and useful innovation indicator.

27
The advantage of event based eco-innovation output indicators is that they combine rich qualitative data on the nature of specific innovations categorised in a manner that enables effective quantitative analysis. The main drawback of these indicators is that there is no obvious universal source of such information. It needs to be aggregated from diverse sources and interpreted with some expertise. It is proposed that the most practical route to carry this method forward is to use a selection of online digital sources to construct a ‘basket’ of eco-innovation indicators with sufficient diversity to give a guide to broad patterns and trends while not claiming universal coverage. Such a basket of eco-innovation indicators would be selected along a number of criteria. Any indicator should only be included if it offers wide international (preferably global) coverage and is available on an ongoing basis from the year 2000 onwards. Indicators need to be drawn from a range of sectors and technologies which represent significant arenas of economic and innovative activity. Most importantly from the viewpoint of eco-innovation the basket of indicators must explicitly cover a spectrum from incremental eco-efficiency improvements within the current prevailing sociotechnical regimes through to radical transformative innovations with the potential to enable transitions to new sociotechnical regimes. Different tracking methods are needed for measuring incremental and radical eco-innovation output. It is proposed that measurement could best be achieved as follows: Incremental eco-innovation indicators - These should be based on the digital ‘product information’ sources. In particular they can exploit the databases on the environmental performance of new consumer products such as cars and domestic products arising from European Union legislation on consumer information labelling. These could quite speedily be turned into an eco-innovation indicator enabling analysis over time and between countries and businesses Radical eco-innovation indicators – These should be based on the digital ‘new announcement’ databases. A selection of these should be made which offer the greatest potential to capture innovations with the real potential to enable sustainable system innovation. These could include low carbon technologies and other sustainability oriented innovation paths, perhaps including those in the generic areas of information technology, biotechnology and nanotechnology. The identification of an appropriate range of such areas of innovation could then be translated into an eco-innovation indicator through systematic search and categorisation from suitable online digital sources. Attention should also be given to system-innovations. This constitutes a big challenge. It is difficult to envisage how one could ‘leapfrog’ the development of well-grounded singular innovation indicators in order to address the even bigger challenge of systemic innovation indicators. Any interpretation of ‘systemness’ also requires the specific detail required for a credible assessment of environmental impact, which won’t be easy. One of the merits of a robust innovation output indicator is that it becomes possible to assess the actual contribution of research expenditure or patenting activity to innovation performance. It would also enable the more systematic exploration of other dimensions of the innovation process such as the role of users, open innovation processes and non R&D based knowledge inputs.

28
3. Assessing the capacity for eco-innovation from a system perspective Innovation research has shown that innovation occurs within a wider context that shapes innovation processes, innovation output and economic and environmental outcomes. This wider context consists of the values, beliefs, knowledge and networks of actors, the technologies in place, economic growth, the product market conditions, factor market conditions, the education and training system, physical infrastructure and the macroeconomic and regulatory context. MEI researchers Jamie Speirs, Tim Foxon and Peter Pearson, examined six approaches into the systemic and dynamic aspects of innovation:
• The Innovation System Frame • The National Innovation System concept • National Innovative Capacity concept • The technological innovation system concept • The system innovation approach • A socio-cultural perspective
All six approaches share the view that knowledge for innovation is distributed in society among the specialised knowledge producers who need to coordinate and collaborate with each other for efficient innovation. Innovation occurs within networks and is shaped by the knowledge and interests of private companies. The innovation system perspective particularly emphasizes the central role of interactive learning between the companies (users and producers) in the value chain for the innovation process. The first three and last approach have been used for data collection and it is on these three approaches that we will focus our discussion (a discussion of all six approaches can be found in the Deliverable on systems approaches on innovation). 3.1 The Innovation System Frame The Innovation System Frame as defined in The Oslo Manual (which constitutes the basis for the Community Innovation Survey) consists of four distinct domains representing classifications of factors relating to innovation capacity. These four domains are as follows:
• Framework Conditions • Science and Engineering Base • Transfer Factors • Innovation Dynamo
These four domains and their relationship to each other are presented in ‘The Oslo Manual’ in an outline map presented in Figure 6. Definitions of the four domains are dealt with below.

29
In chapter 5 of the Manual, 6 groups of indicators are proposed, with the intention that these form the subject of survey questions for the purposes of data gathering. A list of suggested questions is provided for each of the indicator groups. It is highlighted that these questions have a proven value for analytical purposes as they were formed based on the results of the Community Innovation Survey (CIS) which was undertaken as a result of the first edition of ‘The Oslo Manual’. Chapter 5 of The Oslo Manual (1997) contains an exhaustive list of all proposed questions. Objectives of Innovation The manual recommends the gathering of data on the reasons for engaging in innovation activity. They comprise a series of questions relating to: Economic objectives of innovation:
• replace products being phased out; • extend product range:
− within main product field;
Figure 6: The Innovation System Frame, as presented in the second edition of the Oslo Manual

30
− outside main product field; • develop environment-friendly products; • maintain market share; • increase market share; • open up new markets:
− abroad; − new domestic target groups;
• improve production flexibility; • lower production costs by:
− reducing unit labour costs; − cutting the consumption of materials; − cutting energy consumption; − reducing the reject rate; − reducing product design costs; − reducing production lead times;
• improve product quality; • improve working conditions; • reduce environmental damage.
The questions do not relate directly to any areas of “The Innovation System Frame” but provide valuable information about the drivers of innovation within a certain market. It is of interest that the objective “develop environment-friendly products” is not currently included in the CIS. Factors Assisting or Hampering Innovation These questions are divided into two sub-sets: Information sources, and economic, enterprise and other factors. Assisting or information factors are then divided as follows:
• Internal sources within the firm or business group; • External marketing/commercial sources; • Educational/research institutions; • Generally available information.
It is here that we begin to see reference to the innovation system frame as a basis for the design of these data gathering questions. Internal sources of information clearly relate to the idea of an ”innovation dynamo” or the internal workings of an innovating firm. External marketing/commercial sources and generally available information (which includes codified knowledge) refer to transfer factors. Educational/research institutions are at the centre of the science and engineering base. Hampering factors are divided as follows:
• Economic factors, including prohibitive cost, perceived risk and lack of appropriate finance;
• Enterprise factors, including lack of skilled personnel or R&D effort; • Other reasons, including lack of technological opportunity or prohibitive
legislation. The factors examined here all refer to elements of “framework conditions” and in this way this indicator attempts to assess the respondent in reference to “the innovation system frame”. Prohibitive factors such as prohibitive cost and lack of appropriate finance are specifically mentioned in the component elements of the “framework conditions” domain. Similarly enterprise factors and those ideas included under “other

31
reasons” such as prohibitive legislation also find mention within this domain of ”the innovation system frame”. Identifying innovating firms Data on whether or not a firm is innovating are of obvious importance when assessing the effect of the other indicators considered. The Manual defines in detail the criteria needed to qualify as an innovating firm and it is intended that questions be included to clarify the respondent firm’s innovating status based on these. The Manual also suggests that only successful innovations of the last three years should be considered. This timeframe will be of importance when comparing innovation data or their derived statistics across jurisdictions. The Impact of Innovations on the Performance of the Enterprise This indicator is subdivided by the Manual into:
• The proportion of sales due to technologically new or improved products; • The results of the innovation effort; and • The impact of innovation on the use of factors of production.
It is highlighted that, for firms established within the three-year timeframe, all sales will be based on new or improved products and as such these firms should be considered separately. The Manual goes on to recommend certain question structures for each of these performance indicators in order to ascertain the financial and other performance aspects of innovation for the innovating firm. These questions assess the innovating firm only and as such do not rely heavily on the concepts of the innovation system frame. Diffusion of Innovation Diffusion of Innovation as an indicator has clear origins in the “transfer factors” domain of the ”innovation system frame” and this aspect of “diffusion of innovation” will account for the knowledge of innovation moving between markets. The capacity for those innovations to be adopted by other firms or in other jurisdictions largely depends on elements of the wider “framework conditions”. The manual proposes two sub-sets of question topic:
• User sectors, where the sector of the creation of innovation and the sector where this innovation has been adopted are defined;
• Survey of the use of advanced technologies in the manufacturing process, which has been included because of the precedent set by previous studies in this area by several OECD countries.
Special Questions These indicators do not fall into other categories and are an attempt to fill information gaps in the survey data. Three main indicators are proposed in this section:
• Special questions on R&D, which are deemed important to innovation measurement but are not covered in the “Frascati Manual”;
• Questions on patents and the appropriability of innovations; and • Questions of acquisition and diffusion of technologies.
It is highlighted that patent data only represent invention that may not lead to innovation itself, although knowledge of this process is important to understanding the innovation process. It is clear to see here elements of the “framework conditions” and “transfer factors” domains, particularly in the last two indicators.

32
Measuring Expenditure on Innovation The Manual devotes an entire chapter to the process of measuring expenditure on innovation. The “Frascati Manual” clearly covers the aspects of R&D expenditure but it does acknowledge the fact that this represents only a part of total innovation expenditure. The Oslo Manual defines innovation expenditure as “all expenditures related to those scientific, technological, commercial, financial and organisational steps which are intended to lead, or actually lead, to the implementation of technologically new or improved products and processes.” This definition clearly covers significant areas of expenditure that are not covered by strict measurement of R&D expenditure. The ”Frascati Manual” goes on to discuss several areas of importance in the measurement of innovation expenditure. These are:
• The method of measurement, and a discussion of the object and subject approaches to data gathering; and
• The breakdown of innovation expenditure, including the following categories:
o Breakdown by type, including labour costs and capital costs etc. o Breakdown by innovation activity, including R&D expenditure and
marketing of innovative products etc. All of this is relevant to eco-innovation and should be adhered to. 3.2 National Innovation System The concept of “National Innovation Systems” (NIS) was developed during the 1990s and is an attempt to expand the ideas of innovation models from typically linear structures to a more integrated and interactive innovation systems conceptual framework. Work towards this more strategic concept of innovation was carried out by the OECD under the National Innovation Systems project and was concluded with the paper ‘Dynamising National Innovation Systems’ (Remøe et al. 2002). A subsequent project entitled “MONIT” (monitoring and implementing national innovation policies) attempts to guide implementation of this previous work into national government policy (Remøe et al. 2005). Scope of NIS The NIS approach is, similar to the previous strand, focused on the firm or enterprise level and its interactions throughout the system. The approach is primarily focussed on technological innovation, which should be viewed as analogous to TPP innovation referred to in the previous chapter. However, brief consideration is given to the increasing evidence of the importance of organisational and marketing (referred to as “branding”) innovations. The transformation of the telecommunications firm Nokia is cited as an example of organisational and branding innovation. A generic model of national innovation systems is presented in Arnold & Kuhlman (Arnold, Kuhlman 2001) and presented here in Figure 7.
Figure 7: The generic model of national innovation systems as presented in Arnold & Kuhlman (2001)
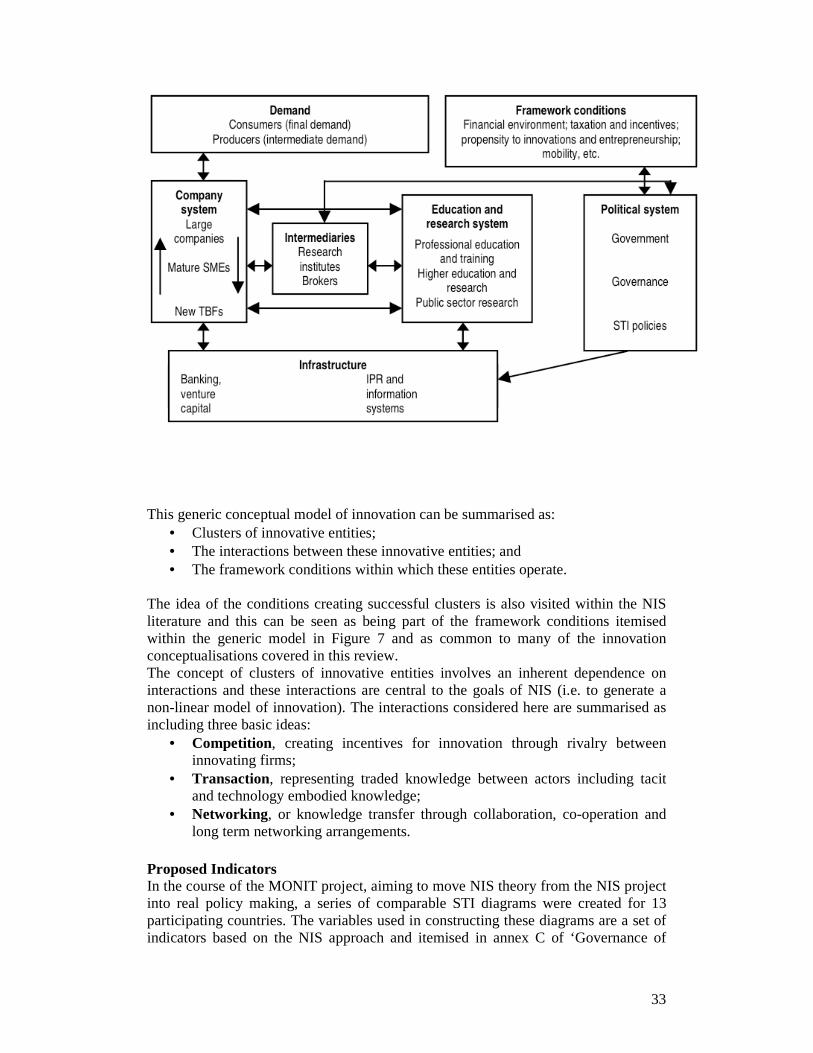
33
This generic conceptual model of innovation can be summarised as: • Clusters of innovative entities; • The interactions between these innovative entities; and • The framework conditions within which these entities operate.
The idea of the conditions creating successful clusters is also visited within the NIS literature and this can be seen as being part of the framework conditions itemised within the generic model in Figure 7 and as common to many of the innovation conceptualisations covered in this review. The concept of clusters of innovative entities involves an inherent dependence on interactions and these interactions are central to the goals of NIS (i.e. to generate a non-linear model of innovation). The interactions considered here are summarised as including three basic ideas:
• Competition, creating incentives for innovation through rivalry between innovating firms;
• Transaction, representing traded knowledge between actors including tacit and technology embodied knowledge;
• Networking, or knowledge transfer through collaboration, co-operation and long term networking arrangements.
Proposed Indicators In the course of the MONIT project, aiming to move NIS theory from the NIS project into real policy making, a series of comparable STI diagrams were created for 13 participating countries. The variables used in constructing these diagrams are a set of indicators based on the NIS approach and itemised in annex C of ‘Governance of
34
Innovation Systems Volume 1: Synthesis Report’ (Remøe et al. 2005). These indicators are as follows:
• Innovation in the company system. This set of eight indicators attempts to assess the core innovation activities at the firm level and includes the following measures:
• Innovation expenditures (% of all turnover in manufacturing); • Patents in Triadic patent families per million population; • SMEs’ share of national R&D performance (% of total business R&D); • Employment in medium and high tech manufacturing (% of total
workforce); • Stock of inward FDI (% of GDP); • Business expenditure on R&D (BERD)(% GDP); • Direct government funding of business R&D.
• Knowledge generation through education and research system. Here, four indicators were used in an attempt to assess the progress of knowledge generation at the national level:
• New S&E graduates (% of 20-29 years age class); • Number of PhDs per 10,000 inhabitants; • Number of publications per million population; • Basic research as a percentage of GDP; • Share of annual government budget allocated to research.
• Industry-Science linkages. This group of three indicators attempts to quantify the strength of linkages between firms and the wider institutional infrastructure, contributing to the scientific knowledge base:
• Business-financed R&D performance by higher education as % of GDP;
• Business-financed R&D performance by government as a % of GDP; • Percentage of innovative firms co-operating with other firms,
universities or public research institutes. • Absorption capacity (aspects of demand, infrastructure and framework
conditions). This group of indicators (as stated above) represents the assessment of the framework conditions of the innovative system amongst other themes:
• Population with tertiary education (% of 25-64 years age classes); • Participation in life-long learning (% of 25-64 years old); • Investment in knowledge as a percentage of GDP; • Seed and start-up venture capital (investment per 1000 GDP).
• Overall Performance. This grouping attempts to describe the extent to which the system and all its conditions have achieved in generating an innovative environment:
• Share of innovative firms as a percentage of all firms (manufacturing); • Share of innovative firms as a percentage of all firms (services); • Labour productivity/CAGR, GDP per hour worked; • Average annual growth of value added in high and medium tech as
compared to average annual growth of GDP; • Average annual growth of employment in high and medium tech as
compared average annual growth of total employment.

35
The indicators presented in the synthesis report of the MONIT project and discussed above represent the variables used to create multivariate analysis diagrams for each of the participating countries. The data for each of these indicators was gathered from several surveys carried out as part of six projects:
• The European Innovation Scoreboard; • OECD Science, Technology and Industry Outlook; • UNCTAD World Investment Report; • “Benchmarking National Research Projects: The Impact of RTD on
Competitiveness and Employment”; • OECD “Comparative Innovation Performance: Countries and Policies for
Review”; • Eurostat, CIS-2; • “Annex to the Progress Report on Benchmarking of National Research
Policies. A Set of Commented Indicators on 4 Themes”. As such, the indicator data was supplied by several external sources and no project specific survey was created or carried out. This might have an effect on the precision or efficacy of the indicators to describe the innovation system as detailed within the strand literature but this remains to be seen. Several of the above indicators may be used in adapted form for monitoring and assessing eco-innovation activities and relevant factors. Specific suggestions will be offered below, after discussing two other strands. 3.3 National Innovative Capacity This concept is developed in work by Porter and Stern (2002) and is further referred to in Deliverable 1 of the MEI project. The work stems from the observation that, although R&D expenditure is common to all jurisdictions, observed bias in R&D expenditure is evident in recent record. It is also observed that patent registration displays similar heterogeneity across jurisdictions, with some regions or countries registering significantly more patents per capita than others. This location-bias is at the centre of the concept of ”the national innovative capacity” (NIC). Scope This strand focuses on innovation of a technological nature and explicitly refers to the comparison of indicators across all jurisdictions. There is no specific definition of innovation found in the literature although the system of data gathering implies that any patentable technology is considered as an innovation. The data gathering method also implies a focus on the firm or enterprise level. Key Concepts In the paper ‘National Innovative Capacity’, Porter and Stern (2002) begin by defining the national innovative capacity as “….the country’s potential – as both a political and economic entity – to produce a stream of commercially relevant innovation.” The implication being that this “stream” of innovation is a product of the conditions inhabited by an innovating entity. The ideas underpinning this theory are conceptualised by the authors in three elements;
• Common Innovation Infrastructure; • Cluster-Specific Conditions; and • Quality of Linkages.

36
Figure 8: Elements of national innovative capacity as presented in Porter and Stern (2002)
These are graphically represented in Figure 8. The Common Innovation Infrastructure This element is defined as the set of human and financial resources devoted to innovation, the public policies impacting on innovation, and the economy’s level of technological sophistication. It is the environment within which all innovating enterprises must operate. In this way the “common innovation infrastructure” can be seen as analogous to the “framework conditions” referred to in the ”innovation system frame” of the “Oslo Manual”. Cluster-Specific Conditions This idea of an innovating cluster (defined as a “geographic concentration of interconnected companies and institutions in a particular field”) expands slightly on the idea of the “innovation dynamo” found in “the innovation system frame” to include the relationship between innovating enterprise on a localised level, an element confined to “transfer factors” within previous conceptual frameworks. This concept

37
also gives significant weight to the effects of localised rivalries to drive innovation, a concept not fully expressed in other conceptual framework of innovation. The environment at this, “cluster” level is further conceptualised as four interrelating attributes, each contributing to the innovative capacity of the ”cluster”. They are defined as:
• The context for firm strategy and rivalry , representing the local encouragement of investment and rivalry between local enterprise;
• Factor or input conditions, including human capital, risk capital, research infrastructure and information infrastructure;
• Demand conditions, including insight gained from sophisticated local demand; and
• Related supporting industries, including local suppliers, related companies and the presence of these in localised industries or ‘clusters’.
The benefits of cluster-specific interactions are referred to, developing the idea of heightened efficiency and competitiveness as a result of this environment. These benefits may include faster adaptation to changing demand or market forces and the competitive efficiency developed in peer-oriented environments. It is believed that these elements may not be adequately accounted for in conceptual frameworks that do not address this “cluster” environment. Quality of Linkages The quality of linkages is defined as the relationship between the common infrastructure and a nation’s industrial clusters. The relationship is described as “reciprocal”, as clusters are said to be able to feed and benefit the common infrastructure. Porter and Stern propose that this relationship is governed by formal or informal organisations that facilitate the links between the common innovation infrastructure and industrial clusters. One such organisation given in example is that of the national university system, which provides a particularly strong bridge between technology and companies. International patents as the baseline indicator Since this theory is scoped specifically towards the technology frontier (and disregards organisational and marketing innovation) the authors have concluded that international patents provide the best measure of realised innovation. The international patenting registration figures across a sample of 75 nations were recorded and corrected for population, historical technological sophistication and commitment of human resources. The resulting figures are ranked and considered the baseline data for use in further analysis. Sub-indices For the purposes of comparison with the baseline, 4 sub-indices are created. Using survey data from the Global Competitiveness Report (GCR) (Porter et al. 2002) the authors identified 24 survey measures that closely correlated to the baseline data. These are grouped into three classes and used to create three corresponding sub-indices: the innovation policy sub-index; the cluster innovation environment sub-index; and the linkages sub-index. Weightings for each survey measure are used based on the regression of that measure against the baseline data. A fourth sub-index was created based on the baseline data: the scientists and engineers sub-index.

38
The Scientists and Engineers Sub-index The variable representing the commitment of human resources was found the most significant in the creation of the baseline data. It is used, therefore, to create a sub-index for comparison with the baseline data. This information can be used to highlight countries that invest more or less relatively to other countries and, in comparison with observed patent registration, can indicate efficiency or inefficiency relative to this measure. The Innovation Policy Sub-Index Of the 24 GCR survey measures found to closely correlate to international patent registration, 10 were classified as relating to innovation policy. Three of these were chosen and used to create the innovation policy sub-index. These were as follows:
• The effectiveness of intellectual property protection; • The ability of a country to retain its scientists and engineers; and • The size and availability of R&D tax credits for the private sector.
The Cluster Innovation Environment Sub-index 10 survey measures were classified as relating to the cluster innovation environment and of these the following three were chosen to create the cluster innovation environment sub-index:
• The sophistication and pressure to innovate from domestic buyers; • The presence of suppliers of specialised research and training; and • The prevalence and depth of clusters.
The Linkages Sub-Index The remaining 4 survey measures were classified as relating to linkages between clusters and the common innovation infrastructure. Of these, two were selected and used to calculate the linkages sub-index. Those variables are as follows:
• The overall quality of scientific research institutions; and • The availability of venture capital for innovative but risky projects.
In this way the indicators used in “the national innovation capacity” are very closely derived from the conceptual model of innovation proposed by Porter et al. All three of the elements proposed as contributory to the national innovation capacity are represented. The Innovative Capacity Index This index is the sum of the four sub-indices detailed above and is intended as the definitive measure for comparison of innovative capacity across countries. By comparing the overall standing in this index with the various sub-indices it is possible to see areas where a sub-index for a country outperforms the final innovation capacity index, possibly suggesting inefficiency within that sub-index. Conversely, it may be possible to observe a sub-index that underperforms against the final index rank, possibly suggesting an area for improvement or an area of high efficiency. Extent of Current Indicator Data Collection The data collection methods used by Porter & Stern in their NIC approach involve the use of patent data and the survey results from the Global Competitiveness Report (GCR) (Porter et al. 2002). Similar to the previous strand, no project-specific survey was created or implemented. This may create difficulties in accuracy and

39
effectiveness although the area of patent analysis is well documented and based on the extensive records kept by patent organisations. 3.4 The Technological Innovation System (TIS) approach This approach has been developed by several researchers in Sweden and the Netherlands (Bergek, Jacobsson and Hekkert), with the aim of improving on “systems” style analysis of the innovation process. Innovation theories focusing on the structure of innovation systems have, it is claimed, proved insufficient in informing the study of the innovation process (Hekkert et al. 2007). As such, this approach attempts to analyse innovation systems by assessing what are termed “functions of the innovation system”, a term given to certain processes deemed important to the success of an innovation system. It is mentioned that this approach can be considered a form of history event analysis. Scope of TIS The scope of this approach is focused on technological innovations and using these innovations as a reference point rather than the firm or enterprise, as is common in other innovation systems approaches. The approach is also defined with reference to the scope of other system scopes, overlapping sectoral and national system scopes. This approach also expresses an explicit interest in environment specific innovations policy, as in Hekkert et al (2007) and their consideration of ‘market formation’ as a function of the innovation system. This is not expressed explicitly in any definition of the approach or its intentions within this document but is clear in the details of the paper. Hekkert et al (2007) created a list of seven functions which they propose as suitable for the purposes of describing and analysing technological innovation systems. The proposed functions are as follows:
• Entrepreneurial activities. This is noted as a primary indicator of the performance of an innovation system. As such, it is in part a function of the other six functions. It is also highlighted that active entrepreneurs have a significant influence in shaping the innovation system. The following indicators are suggested in order to measure this function:
• The number of new entrants • The number of diversification activities of incumbent actors • The number of experiments with the new technology
• Knowledge Development. This function includes ”learning by searching” and “learning by doing” and represents the heart of the innovation process (the knowledge economy). Three indicators for this function are suggested:
• Number of R&D projects over time • Number of patents over time • Investment in R&D over time
• Knowledge Diffusion. This function is a common concept throughout various innovation system theories. The speed and proliferation of knowledge transfer is of significant importance to the health of an innovation system. The following two indicators are suggested:
• Number of workshops and conferences devoted to a specific technology topic
• Size and intensity of network related to specific technology over time
40
• Guidance of the Search. The force guiding investment in certain aspects of the development of new technology. This is of importance due to the limited resources often associated with the development of new technologies. Any actor within the system can create this guiding force, although most commonly it is exerted through market forces and legislative/economic influence. Suggested indicators are:
• Success achieving government or industry designed targets for use of a specific new technology
• Number of articles on the future development of a new technology • Ratio of positive to negative articles regarding expectation of future
technology development • Market Formation. Through the observation that most new technologies are
poorly prepared to compete within their relevant markets, it is noted that the formation of niche markets or manipulation of market conditions through economic instruments is important for the successful development of a new technology. Certain examples of this process in practice are given, including the tax incentives for renewable energy technology in Holland or the tax exemption on biofuels implemented in Germany. Suggested indicators are:
• Number of niche markets introduced • Number of specific tax regimes for new technologies • Number of new environmental standards that improve chances for new
technology • Resource Mobilisation. This function relates to the ability of an innovating
actor to gain access to finance of human capital in order to fulfil the needs of the development of a technology. It is noted that this function is difficult to measure directly. The following is suggested for measurement purposes:
• Question actors as to their perception of access to specific resources • Creation of Legitimacy/Counteract Resistance to Change. Hekkert et al
(2007) observe that in order for a technology to succeed it must in itself become an incumbent technology. In turn it must, therefore, overcome the issues of resistance within the market by achieving some level of legitimacy. This legitimacy is most successfully afforded by the work of coalitions of advocates who can place technologies on the political and public agenda. The success of biofuels in Germany is once again used as an example. Here the advocates included the agriculture sector (gaining Common Agriculture Policy subsidies and a new lucrative market) that in turn created a successful lobby group (the Union For the promotion of Oil and Protein plants, UFOP). The UFOP brought together various other advocates, developing the market and legitimacy of the technology. One indicator is suggested:
• Growth of interest groups and their lobby actions For selected energy technologies one might also use the findings from Eurobarometer (see Figure 9).

41
Figure 9: Public opinions on selected energy technologies: solar and wind
Source: EU 2007, Eurobarometer The functions approach has been applied in a range of studies, combining a qualitative and quantitative element. 3.5 Eco-innovation systems and policy This strand focuses specifically on innovation from an environmental perspective. It focuses on the policy process and as such has no exclusive focus on the firm or technology level as in other strands. The policy processes regarded are considered from a national/member state and European scope. The basis behind current work on eco-innovation systems is to help create a model framework through which future eco-innovation policy can be constructed. It is observed that traditionally the areas of innovation policy and environmental policy have been considered in isolation. The purpose of this strand of innovation study, therefore, is to suggest ways to integrate these two policy areas. In the report entitled ‘Transforming policy processes to promote sustainable innovation: some guiding principles’, Foxon et al (2005), propose the following five guiding principles to inform the sustainable innovation (SI) process:
• Stimulation of the development of an SI policy regime, bringing together the innovation and environmental policy regimes. Four specific actions are suggested in order to achieve this including:

42
• Promotion of SI as an explicit policy goal; • Systemic changes to current technological and institutional systems; • Creating a long-term, stable and consistent strategic framework to
promote a transition to more sustainable systems; and • Formulating clear, long-term sustainability goals.
This principle is designed, therefore, as the inception point of a transition between the incumbent style of policy process and what is proposed for the future.
• Apply systems thinking, engaging with the complexity and systemic interactions of innovation systems and policy-making processes. Again, four actions are proposed:
• ‘Systems failures’ as rationale for public policy intervention; • Taking advantage of ‘techno-economic’ and ‘policy’ windows’ of
opportunity; • Diversity of technology and institutional options as a solution to
‘lock-in’ of unsustainable technologies and institutions; and • Developing and implementing the ‘substitution principle’.
Here the guidelines point towards the need to address the innovation system in an integrated fashion, moving away from the more linear innovation models of the past. This is an idea noted heavily in the second strand of this review. The “substitution principle” mentioned here refers to a specific principle of policy/law which aims to overcome lock-in issues associated with certain technological systems. According to Foxon et al (2005) the use of public intervention measures intended to facilitate this principle could be applied according to the following criteria: environmental assessment of the existing technological system; the market availability of substitutes; and the need to maintain market availability of the service offered by the affected product. The first iteration of this principle can be seen in Article 4(2)(b) and annex II of the End of Vehicles Directive.
• Advance the procedural and institutional basis for delivery of SI policy aims. Two actions are proposed to achieve this:
• Promoting public/private institutional structures to enhance regulator/regulated relationships and stakeholder activities; and
• Ensuring broad stakeholder participation, particularly from the ‘innovation constituency’.
• Develop an integrated, synergistic mix of policy processes and instruments that cohere to promote sustainable innovation. This to be achieved by:
• Applying sustainability indicators and sustainability innovation criteria;
• Balancing benefits and costs of likely economic, environmental and social impacts;
• Using a dedicated SI risk assessment tool in developing policy support instruments; and
• Assessing instruments in terms of their appropriateness to different stages of the innovation process.
• Incorporate policy learning as an integral part of SI policy process by: • Monitoring and evaluation of policy implementation; • Reviewing policy impacts on sustainable innovation systems; and • Learning and policy process enrichment.

43
These guidelines give a positive direction to the integration of eco-innovation policy and wider environmental policy processes. They also advocate the use of systems thinking in the consideration of the eco-innovation policy process. This is clearly in step with the innovation models considered here, all of which advocate this type of approach to innovation conceptualisation. There is also mention of stakeholder participation and regulator/regulated relationship enhancement. This is something that may become fundamental to the success of eco-innovation policy making, as other guiding principles cover issues contrary to the typical aspirations of industry such as technology diversification and public policy intervention. 3.6 Socio-cultural determinants A socio-cultural perspective seeks to focus on social and elements relevant to eco-innovation, and to measure these using a capital approach. The main source is work done by the consultancy Technopolis as part of the SYSTEMATIC project, supported by the European Commission under the 6th Framework Programme. This work is recent and under development. First results are reported in Bruno et al. (2008) The starting point for this work is the claim that socio-cultural factors influence the nature and level of innovation across industrial sectors. The approach has two elements: firstly, to analyse similarities and differences across national socio-cultural profiles; and secondly, to explore the socio-cultural factors relevant for specific sectors, focussing on the eco-innovation sector. The socio-cultural characteristics of communities (geographical or sectoral) relevant to innovation are identified by four dimensions, referred to as “the four capitals”:
• Cultural capital & consumer behaviour; • Human capital; • Social capital; and • Organisational capital & entrepreneurship.
Similar forms of conceptual classification based on types of capital can be found in other reports for the European Commission (High Level Expert Group on RICARDIS, 2006), as well as in a broader analysis of the drivers and barriers to sustainable development in “Capitalism: As if the world matters” by Jonathon Porritt (Porritt 2005). The classifications of these four capitals used by Technopolis are:
• The Cultural Capital and Consumer Behaviour category refers to the attitudes of people that may influence innovation including attitudes towards science and technology, the future, and the environment.
• The Human Capital category is defined as the knowledge, skills and attributes derived from education, training and work experience.
• Social Capital is defined as the nature and intensity of relationships, assuming that the nature and intensity of social networks impacts directly on the productivity of individuals and groups (Bourdieu 1986, OECD et al. 2001).
• Organisational Capital refers to an organisation’s resources and rules including cash-flow, R&D personnel, culture, routines, structure, morality and management style. Highlighted aspects of this class are: individuals attitude to work; employer employee relationships; attitude towards risk; and the level of organisational rigidity/innovativeness.

44
Using data from three key surveys (Eurobarometer, European Social Survey, and Community Innovation Survey), indicator sets were created for each of the capital classes and their values (expressed as an index) were calculated for each of the EU25 countries. These were used to profile the socio-cultural characteristics relating to innovation for each of the countries considered. A weak but clear correlation was found between the measured socio-cultural capacity of a country and its performance on conventional measures of innovation, including labour productivity, EPO patents, and business expenditure on research and development. A survey of 76 European sectoral experts also showed that socio-cultural factors are important determinants of innovation performance by sector. A review of evidence for the influence of socio-cultural factors on the eco-innovation sector was then performed, and broad policy implications were drawn. Proposed Indicators The indicators developed for each of the four capitals in the Technopolis report on “Socio-cultural Determinants of Eco-Innovation” are described here: Cultural Capital and Consumer Behaviour Indicators
• Interest in science and technology • Attitude towards science • Attitude towards risk from new technologies; • Attitudes towards future • Attitudes towards environment • Attitudes towards other cultures • Customer responsiveness
Human Capital Indicators • Human resources in science and technology (HRST) • Nationality of HRST • Higher education (provision of Higher educated people) • Human resources in knowledge-intensive services • Job-to-job mobility of employed HRST • Participation in life-long learning • Availability of lifelong personnel
Social Capital Indicators • Cooperation with competitors • Cooperation with the academic world • Customer as a source of information • Trust • Corruption
Organisational Capital and Entrepreneurship Indicators • Initiative at work • Empowerment • Relationship between employers and employees • Risk aversion/entrepreneurship • SMEs which introduce an organisational innovation • Organisational rigidities
These indicators attempt to measure factors underlying the capacity for innovation in a nation and/or sector, rather than measuring inputs or outputs of particular innovative

45
activity. As such, it is difficult to establish clear causal relations between these factors and innovative activity. However, the results found by the Technopolis study suggest that this is an area worthy of further investigation in relation to understanding and measuring eco-innovation activity. Whilst the indicators of human capital and organisational capital and entrepreneurship are reflected to a large extent in more direct measures of innovation, the cultural capital and social capital indicators may be neglected by other approaches. For example, recognition and acceptance by consumers of a firm having a “green brand” could be an important driver of innovation by that firm. Similarly, building up and sharing the necessary levels of skills and knowledge for eco-innovation could be important, and could be facilitated by EU policy measures to support inter-regional co-operation and networking within and between industrial clusters focussing on eco-innovation. Skills in this instance may refer to knowledge of eco-design principles, skills in building constituencies for the purposes of eco-innovative projects, and eco-marketing and distribution (with emphasis on relating to the consumer regarding eco-innovative products). These skills could be broadly summarised as: eco-innovative skills relating to the product; skills in developing linkages to enhance eco-innovative product; and skills in legitimising the eco-innovative product. The skills referred to here fall largely under the concept of “Human Capital”. Though the indicators proposed for this capital are chiefly concerned with science and technology human resources, it would also be of interest to comment on the human resources relating to network development and marketing. It is unclear how this could be achieved. Emerging eco-innovation companies could also benefit from efforts to improve networking between SMEs across European countries, and more strategic co-operation between innovation and environmental funding agencies within countries to promote eco-innovation (exemplified by successful co-operation between agencies in Sweden to promote and disseminate eco-labelling of fridges.) Finally, this approach highlights the importance of training and education design policies and tools (such as European Masters programmes) to develop eco-innovative skills amongst industry actors, including business managers, engineers, architects and designers and supply chain managers. 3.7 Eco-Innovation Implications The relevance of the concepts discussed above to the idea of eco-innovation is of key importance in the context of this work, in the following ways. The theory referred to here as “technological innovation systems” could be considered as an innovation indicator set well suited to the measurement of eco-innovation. In their discussion of the functions of innovation Hekkert et al. (2007) directly refer to the environment. Further, the use of TIS theory to describe environmentally oriented technology systems has precedent (Jacobsson and Bergek 2004). This theory is one of two theories previously referred to here as having “firm” focus. The result of this firm level of focus may make this theory suitable to adaptation for the purposes of measuring eco-innovation specifically, as indicator surveys could be used to target previously identified eco-innovative actors. The indicators proposed in the Oslo Manual share the firm focus identified in the TIS indicators. This may make the Oslo approach similarly suitable for the purposes of

46
measuring eco-innovation. Although mentioned briefly, an ecological focus is not apparent in the literature and there are no apparent examples of ecological application of these principles. It is, however, a comprehensive guide to the process of measuring innovation and therefore might provide a more exhaustive source of guidance for the purposes of measuring eco-innovation. In this respect it is a more definitive indicator set than that of TIS. The Community Innovation Survey (CIS), based on the early editions of the Oslo Manual and part of the iterative process, is of interest at this point. Under “objectives of innovation” the Manual mentions developing environmentally friendly products. This objective is not represented in any question in the CIS. There are also other areas of the CIS which could be improved from an environmental perspective. Currently health and safety and the environment are combined in one indicator. This makes it impossible to isolate environmental effects of innovation activities from health and safety effects. If these were separated it would be very useful for the identification of eco-innovators and the assessment of the relative importance of environmental effects of innovation. The CIS also asks about the importance of meeting regulatory requirements as an effect. This question has significance for innovation, but for eco-innovation research this question could be modified to ask about the importance of environmental regulations or alternatively which regulations were important or very important for their innovation activities. In this way the survey would identify more easily “prohibitive legislation” mentioned in the Oslo Manual as a potential barrier. The indicators proposed in NIS and NIC theories are both designed with an inherent focus on the national level. As such they may both prove slightly more difficult to adapt for the purposes of measuring eco-innovation. It might be possible, however, to create supplementary indicators that could help distinguish eco-innovation at the survey stage. Although this would clearly create more work and an area for further study, it might be necessary to some extent with all of the indicator sets considered. With regard to the indicators identified in the report “Governance of innovation systems” (Remøe, 2005) the following modification may be of use from the perspective of eco-innovation. The category “ Innovation in the company system” might be usefully changed into “Eco-innovation in the company system” with the following indicators:
• Innovation expenditures for the environment (% of all turnover in manufacturing);
• Eco-patents in Triadic patent families per million population; • Employment in eco-innovative firms manufacturing (% of total workforce); • Business expenditure on environmental R&D (BERD)(% GDP); and • Direct government funding of business environmental R&D.
The term “environment” would have to be carefully defined. Pollution abatement and prevention are clearly environmental. “Environment” may also refer to the use or development of new materials. But as many environmental effects occur across the entire lifespan of a product, it is important to take a life-cycle perspective. Attention must be paid to the transfer of environmental problems: from one medium to another and across boundaries. As to business expenditures on environmental R&D, an

47
attempt was made in an OECD project (Johnstone 2007) to gather this data, but the response rate to this question was very low (5%). “ Knowledge generation through education and research system” might be adapted to “Knowledge generation for eco-innovation through the education and research system”. Here we have the problem of identifying eco-innovation relevant knowledge and studies. Further work is required to identify these. During the consultation of the Blueprint report (Rennings 2004) it was stated that the greatest environmental engineers are probably chemical engineers. Knowledge about materials and chemical compounds certainly is relevant, as is knowledge about lifecycle analysis and eco-design. Also business courses on environmental management and corporate sustainability would have to be included. Of the five indicators probably only the fifth indicator (share of annual government budget allocated to research) might be easily adapted:
• Share of annual government budget allocated to environmental research It will be very hard to break down “ industry-science linkages” into those that are relevant for eco-innovation and those that are not. When studying real eco-innovation processes, attention might be given to the industry-science cooperation. That way we may learn something on the existence and the importance of those interactions. Through the use of filter questions to identify eco-innovators in the CIS we may also learn about the nature and quality of the interactions.
With regard to the indicator group “ absorptive capacity” , some relevant hard data are available. One relevant indicator is the relative share of companies that have EMAS or ISO14001. Such information is available from the certification bureaus. No systematically collected information is available on other organisational aspects relevant to eco-innovation such as the use of eco-design, LCA and the extent to which environment is a corporate responsibility. Information on this could be collected through questions in a one-off survey, for instance as part of a special module of CIS. If this were repeated every 10 years, the evolution of organisational aspects relevant to eco-innovation could be traced. Through surveys the percentage of firms with environmental mission statements and officers also could be assessed. The commitment to eco-innovation of course will not only depend on having people responsible for environmental issues but also will depend on the beliefs of managers and workers about eco-innovation, whether they see it as a cost factor or source of competitive advantage. These might vary within the company, however, and the answers might not reflect the true beliefs. One should be careful, therefore, in using this kind of information, however relevant.
As to “overall performance”, the following statistics might be used: • Share of eco-innovative firms as a percentage of all firms (manufacturing); • Share of eco- innovative firms as a percentage of all firms (services); • Material productivity (TMR per capita or GDP).
The statistics are straightforward adaptations of the original questions. CIS data could be used for determining the share of eco-innovative firms. Eco-innovative firms may be identified as those which report a positive effect in terms of reduced material use, reduced energy use and/or reduced environmental impact or improved health and safety. A problem here is how to distinguish between innovation and eco-innovation and likewise between an innovative company and an eco-innovative company.

48
Section 1.2 provides a comprehensive definition of eco-innovation for the purposes of the MEI project. One notable feature of that definition is the inclusion of innovations providing an unintended environmental benefit. In the future it may be desirable to attempt to assess the effectiveness of eco-innovation fostering policy. Since one of the primary aims of measuring eco-innovation is to compare progress between jurisdictions and over time, it is of importance to identify these definitional issues before any measurement begins. The work of Porter & Stern (2002) includes significant discussion of the implications of innovation for competitiveness, which may prove useful for the purposes of the MEI project, but the idea promoted in NIC theory that patents are a good indicator of realised innovation is contested elsewhere (OECD 1997), where it is highlighted that, although patent information may be an important inclusion in an innovation indicator set it is not necessarily an indication of innovative output. The exclusive use of US patent information also raises questions of bias and adaptability. Innovation expenditures are a better indicator for innovation but this does not say anything about the output and the economic value of these expenditures. The same applies for R&D-based innovations: they are important for maintaining and improving competitiveness but there is also a need for new viable business models, networks and alliances. This again demonstrates the importance of using different indicators and to create also a knowledge base for interpreting the indicators through case studies. In general, different research methodologies are needed to assess the complete range of issues. The idea of resource productivity, or the ratio of welfare produced from one unit of nature is another relevant issue for consideration. This idea of resource productivity or “eco-efficiency” may indicate, to some extent, the level of innovation, as many innovative activities aim to improve products or processes by improving their efficiency or decreasing cost through material efficiency. Resource productivity is also affected by changes in demand, clouding the effects of innovation to some degree The measurement of these two variables (welfare and “use of nature”) is still an area of debate. GDP, the Human Development Index (HDI) and the Index of Sustainable Economic Welfare (ISEW) have all been considered as suitable for the measurement of welfare. The number of potential environmental indicators has also been identified as potentially distracting. Among the potential indicators of “use of nature” are Material Flow Accounting and Total Material Accounting. If we treat the indicators of NIC theory to the same adaptation as that of NIS, then these can also be improved for the purposes of eco-innovation measurement. “The scientists and engineers sub-index” is entirely based on the percentage of workers in these fields. A useful adaptation of this would then be to count the percentage of the workforce employed as scientist or engineer working on environmental science or engineering. This could also be expressed as a percentage of the total science and engineering workforce. “The innovation policy sub-index” could be widened to include all relevant policy areas for eco-innovation. Besides innovation policy, environmental policy (comprising all regulations and policies with regard to air emissions, water

49
discharges, soil protection and waste management) and market structure regulations are important. Two possible indicators are:
• The share of environmental taxes in the government budget or the percentage of GDP;
• Prices for landfill and other types of waste management (including effluent charges).
A problem with the latter statistic is that prices vary within nations. A simple solution is to use averages. Probably a better indicator is the total waste costs as a percentage of GDP. It is unclear whether this information is available. One might also use here the results from two questions in the Executive opinion survey of the Global Competitiveness Report (GCR) for nations.
• How stringent is your country’s environmental regulation? (1 = lax compared with that of most countries, 7 = among the world’s most stringent).
• Environmental regulations in your country are (1 = confusing and enforced erratically, 7 = stable and enforced consistently and fairly).
Three metrics were selected to represent “The cluster innovation environment sub-index”: the sophistication and pressure to innovate from domestic buyers; the presence of suppliers of specialised research and training; and the prevalence and depth of clusters. It is unclear how these metrics could be adapted to an eco-innovation focus. Alternative questions to assess this sub-index could include the following:
• Environmental mindedness of the general public; • Managers’ perception of overall quality of environmental research in scientific
institutions. These indicators might not serve the intentions of this sub-index completely and it might be necessary to adapt them further to assess the demand implications of general public environmental opinion or to measure directly the presence of research and training facilities. “The linkages sub-index” relies on two metrics: business managers’ opinions of the overall quality of scientific research institutions within a country; and the availability of venture capital for innovative but risky projects. With regard to this first question, adaptation for the purposes of eco-innovation measurement might involve asking business managers their opinion on the quality of environmental research institutions. This would involve new survey data and it may also necessitate identifying relevant environmentally oriented business managers in order to obtain relevantly informed survey data. The availability of venture capital for innovative projects may be simply changed to the availability of venture capital for eco-innovative but risky projects. It may prove difficult to differentiate between availability for innovative or eco-innovative projects. The resulting adapted indicators would then be as follows:
• Business managers’ opinion of the overall quality of environmental research institutions;
• The availability of venture capital for eco-innovative but risky projects. In the table below we present several metrics for the measurement of eco-innovation. These questions are largely based on the metrics discussed throughout this report though they also include several original metrics.

50
Table 3: List of proposed eco-innovation indicators
Indicator Data Source The Firm 1 R&D expenditures for environmental
protection in industry. STATCAN currently collects this information
2 % of firms with EMAS or ISO14001 Numbers collected by German Federal Environmental Agency
3 % of firms with environmental mission statements and/or officers
Would need to survey for this.
4 Managers opinion of eco-innovation Possibly for inclusion in CIS The Conditions 5 ‘Green Tax’ as a percentage of
government budget OECD data
6 Government expenditures on environmental R&D as:
• % of total R&D expenditure • % of GDP
GBAORD data
7 Uptake of environmental subsidies for eco-innovative activity
Government data
8 Financial support for eco-innovation from public programmes
OECD data
9 Demand for eco-innovative products. Measure demand using survey techniques.
10 Environmental expenditure in college/university research
National Science Foundation collect this for US. EU source unknown
11 Number of environmental graduates, MScs or PhDs
EIS & IRCE report
12 Waste management costs (landfill tariff etc)
Government data
13 Executive opinion on environmental regulation (Stringency and transparency).
For possible inclusion in CIS
14 Attitudes towards eco-innovation Eurobarometer data The Linkages 15 Frequency of eco-innovation
workshops/conferences and number of people attending.
Web based searches
16 Value of “green funds” made available by financial institutions for innovating companies.
SRI fund service data
17 Managers perception of overall quality of environmental research in scientific institutions.
For possible inclusion in the CIS
Radical/incremental innovation indicators 18 Ratio of eco-start-ups to incumbents in
the market Companies house data or European business register.
19 Frequency of new entrants to the market. Companies house data or European
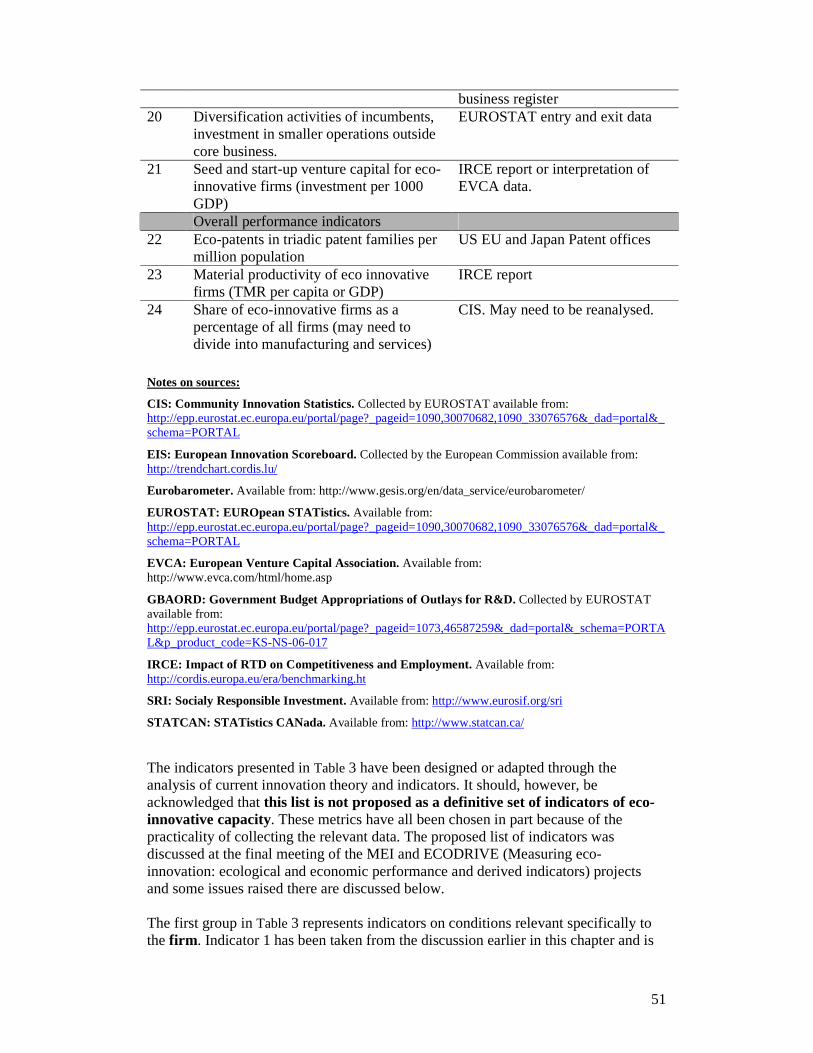
51
business register 20 Diversification activities of incumbents,
investment in smaller operations outside core business.
EUROSTAT entry and exit data
21 Seed and start-up venture capital for eco-innovative firms (investment per 1000 GDP)
IRCE report or interpretation of EVCA data.
Overall performance indicators 22 Eco-patents in triadic patent families per
million population US EU and Japan Patent offices
23 Material productivity of eco innovative firms (TMR per capita or GDP)
IRCE report
24 Share of eco-innovative firms as a percentage of all firms (may need to divide into manufacturing and services)
CIS. May need to be reanalysed.
Notes on sources:
CIS: Community Innovation Statistics. Collected by EUROSTAT available from: http://epp.eurostat.ec.europa.eu/portal/page?_pageid=1090,30070682,1090_33076576&_dad=portal&_schema=PORTAL
EIS: European Innovation Scoreboard. Collected by the European Commission available from: http://trendchart.cordis.lu/
Eurobarometer. Available from: http://www.gesis.org/en/data_service/eurobarometer/
EUROSTAT: EUROpean STATistics. Available from: http://epp.eurostat.ec.europa.eu/portal/page?_pageid=1090,30070682,1090_33076576&_dad=portal&_schema=PORTAL
EVCA: European Venture Capital Association. Available from: http://www.evca.com/html/home.asp
GBAORD: Government Budget Appropriations of Outlays for R&D. Collected by EUROSTAT available from: http://epp.eurostat.ec.europa.eu/portal/page?_pageid=1073,46587259&_dad=portal&_schema=PORTAL&p_product_code=KS-NS-06-017
IRCE: Impact of RTD on Competitiveness and Employment. Available from: http://cordis.europa.eu/era/benchmarking.ht
SRI: Socialy Responsible Investment. Available from: http://www.eurosif.org/sri
STATCAN: STATistics CANada. Available from: http://www.statcan.ca/
The indicators presented in Table 3 have been designed or adapted through the analysis of current innovation theory and indicators. It should, however, be acknowledged that this list is not proposed as a definitive set of indicators of eco-innovative capacity. These metrics have all been chosen in part because of the practicality of collecting the relevant data. The proposed list of indicators was discussed at the final meeting of the MEI and ECODRIVE (Measuring eco-innovation: ecological and economic performance and derived indicators) projects and some issues raised there are discussed below. The first group in Table 3 represents indicators on conditions relevant specifically to the firm . Indicator 1 has been taken from the discussion earlier in this chapter and is

52
an adapted form of an indicator found in strand 2. The remaining three indicators of this group are original proposals but all refer to aspects of firm conditions that are relevant to eco-innovation and are also reasonably practical with regards to their collection. However, concerns were raised over whether or not EMAS or ISO 14001 (indicator 2) are accurate proxies for eco-innovative tendency, as the evidence for the relation between environmental management systems and eco-innovative activity is mixed. Similarly, concerns were raised over indicators 3 and 4, where the link between eco-innovative activity and presence of “environmental officer” or “managers’ opinions” of eco-innovation could be questioned. At best, these are likely to be indicative of incremental eco-innovation with the firm, rather than radical eco-innovation. The indicators presented in the second group are metrics that attempt to measure the conditions of the general eco-innovation environment. Indicator 5 is adapted from a strand 3 indicator and is further discussed above. Indicators 6, 8 and 11 are adapted from indicators found in strand two, the adaptation of which is discussed earlier in this chapter. Indicators 7, 9, 10 and 12 are all original metrics. Indicator 13 is an adapted version of an indicator found in the executive opinion survey of the GCR. This adaptation is discussed earlier in this chapter. Finally, indicator 14 is an adaptation of indicators found in “Cultural Capital” of strand 6. Similar to the firm oriented indicators, concerns were raised over the value of these metrics as eco-innovation indicators. In particular, indicator 10 relies on a link between the expenditure on environmental research in tertiary education and the science base contribution to eco-innovation, which is not well established. Further research is needed to develop the evidence base for these indicators. The third group of indicators is classified as indicators of the state of linkages between entities involved in the eco-innovative environment. Indicator 15 is an adaptation of an indicator presented in Hekkert et al (2007), found in the chapter “Function 3: Knowledge diffusion through networks”. Indicator 16 here is an original proposal. Metric 17 of this group is adapted from a metric presented in “The linkages subindex” of Porter and Stern (2001). Again, in relation to indicator 17, the validity of an “executive opinion”, while of interest to the topic, may have no empirical relationship to the question of linkages between the science base and the firm. The fourth group of indicators attempts to measure the radical or incremental nature of the innovative environment. These indicators have been chosen as they all attempt to measure something about the size and thus motivation of the actors involved in the market of concern. Of these indicators, 18 is an original proposal, 19 and 20 have been adapted from Hekkert et al (2007) paragraph 5.1 “Function 1: entrepreneurial activities”, and 21 has been adapted from the Stand 2 document “Governance of innovation systems” (Remøe et al 2005). However, the motivation behind the “diversification activities” referred to in indicator 20 may not be driven by a desire to innovate. Questions also arise when considering the ease of recovering these data from EUROSTAT enter and exit data. In addition, the inability of all of the indicators in this class to distinguish between innovation and eco-innovation may pose questions for their relevance. Again, further empirical research is needed to establish clear causal connections for the case of eco-innovation, rather than for innovation in general.

53
The last group of indicators is concerned with measuring the overall performance of an innovation environment. This group is of vital importance when trying to compare the success of any innovation fostering activities. The three indicators proposed here are all adaptations of metrics proposed in the report “Governance of innovation systems” (Remøe et al 2005). It should be noted that the indicators presented here are considered as complementary to indicators currently collected on innovation considered more generally. This can be seen as a logical position given the broad definition of eco-innovation used in the MEI project, which includes innovation with both intentional and unintentional environmental benefits. Eco-innovation arising through both intentional and unintentional means is likely to be affected by variables relevant to both innovation and eco-innovation. The indicators given here are not intended, therefore, to supersede current innovation indicators and we acknowledge the value of current innovation indicators to the measurement of eco-innovative capacity. Finally, the findings of this report regarding the types of indicators that could be adapted and considered most relevant for the purpose of measuring eco-innovation have been found largely in line with similar work on ecological and economic performance indicators by the sister project ECODRIVE. In the discussion during the final workshop, it was acknowledged that the conclusions of the two projects were broadly in line with each other, with similar indicators being proposed and similar limitations of the indicators being highlighted in both projects. Final remarks Although the concepts used in each of the theories considered can be presented as broadly similar, they have given rise to indicator sets with certain key differences. Importantly the differences between the firm and the national focus discussed above may prove significant to the outcomes of the MEI project. Although a national focus indicator set may seem less adaptable to eco-innovation purposes, such a step would not necessarily be impossible or even unwise. One significant criterion in the goal of establishing an eco-innovation indicator system is that of finding an indicator set that is both comprehensive with regard to the system analysis of innovation and generic and simple enough to be applied across jurisdictions and for comparison between jurisdictions. Our appraisal of the various indicator sets found both comprehensive and relatively simple proposals for sets of indicators. With regard to the sensitivity of the considered indicator sets to radical or incremental innovation, there might be an advantage in firm focused indicator sets although they might not be exclusively suitable. In addition, the observation that there may be a correlation between firm size and the radical/incremental nature of innovation (Foster 1986) could be a useful consideration for all indicator sets. In the future, for the purposes of measuring eco-innovation, it could be desirable to further define some of the more complicated issues in innovation. Issues of this kind might include defining organisational and marketing innovation for the purposes of

54
eco-innovation or how to classify innovations that may have a neutral or negative net environmental effect. As noted, however, issues remain relating to the adequacy of these proposed indicators for measuring eco-innovation. There are several questions regarding the accuracy of the metrics and specifically the use of proxy indicators where strong empirical relationships have not yet been demonstrated. This needs to be considered when referring to the indicator list presented in Table 1. These concerns arise as a result of the desire to create indicators that have been adapted from innovation systems indicators rather than created for the specific purpose of measuring eco-innovation. Further theoretical work and empirical validation specifically on eco-innovation indicators is needed to meet the growing national and European policy needs in this area.
55
4. Benchmarks of environmental performance as an indicator of eco-innovation
4.1 Benchmark projects
Environmental benchmarking is a modern evaluation technique aimed at comparing the environmental performance of a company with the best available practices or with a predefined benchmark. The comparison is based on a number of qualitative and quantitative environmental indicators of strategic importance allowing the comparison of several companies active in the same sector. Benchmarking is also a framework within which indicators and best practices are examined in order to determine areas where company performance can be improved. Although most benchmarking initiatives concern financial and management issues, environmental benchmarking is becoming a major element in the environmental management of companies. Below is a list of some sector/enterprise analyses and databases, collected by LEIA for MEI. Some of them have been obtained from the document of Risø National Laboratory “Background paper for the workshop on eco-innovation indicators” published on September 29 2005. This list has been completed with other analyses and databases compiled by LEIA researchers Jordan Espina Lázaro, Igor Cano Dorronsoro, Sandra Hernando Casas, David Grisaleña Rodríguez, under the supervision of Javier A. García Sedano. PERFORM/MEPI PERFORM has been created at SPRU and builds on the MEPI project of JRC. It is based on voluntary data by UK companies as well as available statistics providing a comprehensive picture of the environmental performance of firms and a number of industrial sectors. The project stopped last year. It needs to be considered whether the UK PERFORM sectoral environmental database could become a model for providing further data at the industrial sector level. The aim of the PERFORM project was to benchmark and improve sustainability performance in industry. While the benchmarking service is no longer operational, you can still access results and background information on this website: http://www.sustainability-performance.org/ The analysis covers the following industrial sectors: aggregates, aluminium, cement, ceramics, electricity, glass, motor vehicles, paper, plaster, plastics, printing, steel, timber, and water. COMPASS The COMPAnies' and Sectors' path to Sustainability (COMPASS) 9 project, carried out by the Wuppertal Institute, enables decision-makers at the company and sector level to provide transparent information to external stakeholders about their performance and to obtain an internal information basis on economic, social and

56
environmental aspects for evaluating and continuously improving sustainability performance. The main objectives of COMPASS are to:
- Help companies/sectors to translate the broad concept of sustainability into specific and measurable targets and indicators useful in day-to-day business decisions;
- Pro-actively involve internal and external stakeholders in order to bring in new knowledge to the company and sector level associations, and access to new perspective on innovation.
- Enable decision-makers to optimize processes, products and services throughout the entire value chain, considering economic, ecological and social aspects (Kuhndt and Liedtke 1999; Kuhndt et. al. 2002).
A sector level application of COMPASS was carried out on behalf of the GDA (Gesamtverband der Aluminiumindustrie) and the European Aluminium Association (EAA). This project aimed to define sustainability issues in the aluminium sector within the context of the European and the international debate. It developed core sustainability indicators for the European Aluminium Industry (EAI) and measured the innovation capacity in the sector (Kuhndt, et al., 2002). EPER It needs to be considered how the EPER database on environmental performance of industry could be utilized as a data source for eco-innovation/eco-efficiency analysis particular at the industry level. Overall: using eco-efficiency analysis as a proxy for eco-innovative activity entails not a redefinition but a reinterpretation and use of the eco-efficiency term seen in relation to how the concept is normally understood and used. Still, despite some data problems there is thorough methodological work to build on. ENVIROWISE Envirowise offers UK businesses free, independent, confidential advice and support on practical ways to increase profits, minimise waste and reduce environmental impact. Envirowise delivers a valuable government-funded programme of free, confidential advice to UK businesses. This assistance enables companies to increase profitability and reduce environmental impact. The Envirowise programme is available to any UK business, completely free of charge. This programme is managed on behalf of UK Government (BERR and DEFRA) by Momenta, an operating division of AEA Technology plc, and Technology Transfer and Innovation Ltd (TTI), a wholly-owned subsidiary of Serco Limited. EHSBA Environmental Health & Safety Benchmarking Association The Environmental, Health & Safety Benchmarking Association is forming an association of environmental, health and safety managers to identify best business practices and compare operating performance. EHSBA is part of The Benchmarking Network, Inc.. The Benchmarking Network, Inc. is an international resource for business process research and metrics. TBN lead studies with over 3,000 process

57
leaders in over 25 countries. They provide benchmarking training and research to individual companies, professional and trade associations, and industry and process based groups. Since 1992, over 300 benchmarking studies have spanned virtually all processes and industries, to identify measures and collect data to identify best practices. Citizens’ Network Benchmarking Initiative The project is run by ELTIS, the European Local Transport Information Service. It is a benchmarking initiative for public authorities in the area of transport, and encompasses performance benchmarking as well as learning from best practice. The pilot project was started in 1998 with 15 cities and regions. Benchmarking of the Öresund region This project was initiated in 1999 by the Öresund Committee and its member organisations. The objective is to estimate where the Öresund region stands in terms of environmental issues, compared to other metropolitan areas in Europe; however, the aspect of exchange of experiences and build-up of partnerships is also important. The plan was to finish the project in 2001. IKON – Index of local sustainability IkoN — Index für kommunale Nachhaltigkeit. This is an index used for rating cities and towns around Hanover. The index is based on a set of indicators, collected in the framework of Korena, which stands for “Local and regional sustainability inventory”. It is a project developed by the Cities and Towns-Net of the EXPO region, local and regional NGOs and the Ecologic Institute. The goal was to develop tools, which could help communities to monitor whether or not they are on the way towards sustainability. The Italian Urban Ecosystem Report The “Ecosistema Urbano” is a ranking of 102 Italian cities based on scores for different indicator sets. Produced by Legambiente, in cooperation with the Istituto di Ricerche Ambiente Italia, it has existed since 1994. The full ecosystem report for the year 2000 (in Italian) can be downloaded on the Internet (see below) Regional benchmarking — The four motors of Europe This benchmarking project was conducted in 1991 /92 with the goal of benchmarking the European regions of Baden-Württemberg in Germany, Rhene-Alpes in France, Lombardia in Italy and Catalonia in Spain. While a report has been produced about it, there have been no follow-up activities since the publication of the report. SHEIIBA SHEIIBA (Safety, Health and Environment Intra Industry Benchmarking Association) is operated by the UK-based Corporate Benchmarking Association and offers different tools for exchange of best practices and comparison of performance in the area of safety, health and environment. Members are mostly corporations; however, it is also open to local authorities. ecoBUDGET ecoBUDGET has been developed by the European Secretariat of the International Council for Local Environmental Initiatives (ICLEI). It is a tool controlling

58
governments’ sustainable consumption of natural resources and environmental goals, adapted from the world of financial budgeting. Pilot projects have been carried out in several German cities since 1996. ENVIRO-MARK The Enviro-Mark was launched in 1998/99 by the UK-based BEA (Business Environment Association), now maintained by Enviro-Mark Systems Ltd. It is a five-stage accreditation process enabling companies to demonstrate their performance at any level from legal compliance to the requirements of ISO 14001. The aim is to offer practical support in overcoming environmental problems and highly focused training to sustain improved performance. EEBN (European Environmental Benchmarking Network) The EEBN was established in 1999 by the European Commission, and implemented by the Fondazione Eni Enrico Mattei (Italy) and other partners. The EEBN aims at building a network of interested parties — particularly firms and associations — on environmental benchmarking. The general objective of the EEBN is to stimulate the use of benchmarking techniques to the environmental management domain. CONTOUR environment, health and safety benchmarking CONTOUR was launched in 1997, based on research by a CBI cross-sector working group of EHS directors. It is a self-assessment questionnaire that allows organisations to measure their EHS performance against others. It covers management systems, health and safety, pollution control and waste management, product life cycle, transport, stakeholders, and organisation and culture. The result shows where an organisation stands against its industry sector and 150 other participating companies, concerning the dimensions environmental performance and practice. METREX practice benchmark METREX is the Network of European Metropolitan Regions and Areas. The focus of Metrex is in the area of spatial planning and it is aimed at setting benchmarks rather doing actual benchmarking exercises. The intention is to present current metropolitan planning practice with regard to competence, capability and process. The Metrex practice benchmark is currently being piloted as an Interreg project within the northwest metropolitan area involving six Metrex members and associates: Glasgow and the Clyde Valley, Bradford, Lille, Dublin, Brussels and Rotterdam. THE GERMAINE PROJECT THE GERMAINE PROJECT, Environmental performance indicators in public administrations. The GERMAINE project’s acronym stands for Gestion Responsable et Matrise des Indicateurs Environnementaux: responsible management through Environmental Performance Indicators. The goal of GERMAINE is to distribute environmental best-practice cases and to raise the awareness for norms, standards and tools for environmental management in public entities and the services sector. The project is implemented by the Belgian Federation of Companies, the Belgium Association for Eco-Counsellors (ABECE) and the Eco-Counsellor Institute in Namur, from April 2000 till end of 2001. It was financially supported by the Belgian Federal Office for Scientific, Technical and Cultural Affairs.

59
ESBN – European SMEs Benchmarking Network The SME-Network is a European-wide network among Benchmarking Centres to foster benchmarking and promote best practice sharing, especially for SMEs. Through its affiliates, it aims to provide a European network that promotes benchmarking, enhances communications among affiliates, offers expert support, information, ethical expectations, and demonstrates significant business benefits through the pursuit of benchmarking. 4.2 Environmental performance indices There exist several composite indicators for environmental performance, based on indicator categories some of which are relevant to eco-innovation and environmental technologies. Here we will sketch the main features of some composite indicators, whose sub-indicators could be interesting. Most of them are extracted from the paper by Michaela Saisana’s for the EEA Workshop of September 29 2005, and completed with other ecoinnovation initiatives searched by this working group. Environmental Sustainability Index The Environmental Sustainability Index (Esty et. al, 2005) is published by Yale and Columbia Universities, in collaboration with the World Economic Forum and the JRC. It benchmarks the ability of 146 nations to protect the environment over the next several decades. It does so by integrating 76 data sets – tracking natural resource endowments, past and present pollution levels, environmental management efforts, and the capacity of a society to improve its environmental performance – into 21 indicators of environmental sustainability. These indicators permit comparison across a range of issues that fall into the following five broad categories:
- Environmental Systems - Reducing Environmental Stresses - Reducing Human Vulnerability to Environmental Stresses - Societal and Institutional Capacity to Respond to Environmental
Challenges - Global Stewardship.
The indicators and variables on which they are constructed build on the well-established “Pressure-State-Response” environmental policy model. The issues incorporated and variables used were chosen through an extensive review of the environmental literature, assessment of available data, rigorous analysis, and broad-based consultation with policymakers, scientists, and indicator experts. Ecosystem Wellbeing index The Ecosystem Wellbeing index (Prescott-Allen, 2001) combines 51 indicators of land, biodiversity, water quality and supply, air quality and global atmosphere, and energy and resource use pressures into an index.

60
Eco-Indicator 99 Eco-Indicator 99 (Goedkoop and Spriensma, 2001) is a damage oriented impact assessment method for materials and processes, which addresses three damage categories: (a) human health, (b) ecosystem quality and (c) resources, minerals and fossil fuels. The indicators are normalized using distances from European reference values, which are used as goalposts. Environmental Performance Index for Rich Nations The Environmental Performance Index for Rich Nations (Roodman, 2004) is a sub-component of the Commitment to Development Index. It is based on three components: depletion of shared commons (climate change, ozone depletion, and marine fisheries), international governmental cooperation (participation in multilateral environmental institutions, and contributions to such institutions), and contributions to international efforts to develop new energy technologies (renewable energy R&D, and deployment of renewable technologies). It covers 21 OECD nations. Environmental Policy Performance Index The Environmental Policy Performance Index (Adriaanse A., 1993) groups 42 indicators with a view to monitor the trend in the total environmental pressure in the Netherlands and indicate whether the environmental policy is heading in the right direction or not. The indicators are normalized using sustainability levels and policy targets as goalposts. Index of Environmental Friendliness The Index of Environmental Friendliness (Puolamaa et al., 1996) aims to provide diversified quantified information for environmental decision-making and discussion in Finland. Eleven indicators are included measuring:
- The greenhouse effect - Ozone depletion - Acidification of soil and water - Eutrophication - Ecotoxicological effect - Resource depletion - Photo-oxidation - Biodiversity - Radiation - Noise
The indicators are normalized using national total pressures as goalposts. For innovation the following composite indicators and indicator sources exist. Innovation Capacity Index The Innovation Capacity Index (Porter and Stern, 2003) creates a quantitative benchmark of national innovative capacity, which highlights the resource commitments and policy choices that most affect innovative output in the long run. It is composed of five subindexes. The five subindexes are:
- Science and engineering manpower subindex - Innovation policy subindex - Cluster innovation environment subindex

61
- Innovation linkages subindex - Company innovation orientation subindex
There are other relevant initiatives and programs that could help us in ecoindicator definition. Some of them are: WBCSD The World Business Council for Sustainable Development is a global association of some 200 companies dealing exclusively with business and sustainable development. The Council provides a platform for companies to explore sustainable development, share knowledge, experiences and best practices, and to advocate business positions on these issues in a variety of forums, working with governments, non-governmental and intergovernmental organizations. ISO The International Standards Organization’s International Standard on Environmental Evaluation performance (ISO 14031). In fact, ISO 14031 is recommended in the framework to be used as the primary approach for selecting sector or company specific environmental influence indicators. CERES and GRI The Coalition for Environmentally Responsible Economies (CERES) with the Global Reporting Initiative (GRI). GRI focuses on developing a common harmonized format for corporate sustainability reporting. The fact that the GRI reporting guidelines and the WBCSD (World Business Council for Sustainable Development) framework were developed in the same period and partly with the support of the same companies, led to a high level of fruitful interaction, cross – fertilization and adaptation. NRTEE The Canadian National Round Table on the environment and the Economy (NRTEE) has conduced pilot studies on how to measure eco - efficiency in business, specially with respect to the use of energy and materials. The findings of the NRTEE pilot studies have been taken into consideration in developing the WBCSD framework. VERITE VERITE (Virtual Environment for Innovation Management Technologies) is a trans-regional network for the diffusion of Innovation Management Technologies (IMTs). The network includes universities, technology intermediary organizations and regional authorities from 13 different EU countries (many of them have implemented RIS/RITTS projects) as well as 5 Newly Associated countries. The main concept is to serve communication between regions in the area of IMTs. The network will concentrate on the IMTs, which could be better implemented with online interaction/cooperation between the partners. The project includes a general workshop on IMTs and four thematic workshops. The project also includes the development of a web-based portal for IMT providers. The virtual IMT applications will enhance the workshops and continue through the project on an Internet based discussion group. www.e-innovation.org

62
4.3 Developing a benchmark indicator for eco-innovation We will now describe a benchmark indicator for eco-innovation developed by LEIA. The benchmark indicator is still to be field tested so we cannot present empirical results yet. The indicator combines two types of indicators which traditionally have not been combined: innovation indicators and environmental indicators. FIRST FACTOR: INNOVATION For innovation the following indicators are used: Input indicators: Input indicators are those related to the resources necessary to develop innovative activities. The following have been chosen:
1. Total investment in R&D+i: percentage of the total innovation expenditure, in national currency and current prices, including the full range of innovation activities: in-house R&D+i, extramural R&D+i, machinery and equipment linked to product and process innovation, spending to acquire patents and licenses, manufacturer design, training, and the marketing of innovations.
2. Number of R&D+i projects achieved. Total number of R&D+i projects related to a process, product service or activity which are carried out for a given interval of time.
3. Training expenses: total training expenses or efforts related to innovative processes, products, services or activities expressed in national currency or in hours per employee for a given interval of time.
a. Percentage of the training expenses comparing with the total expenses.
b. Number of training hours inverted by employee. 4. Personnel of R&D+i: researchers + auxiliary personnel. Number of employees
involved at least 50% of total working time in R&D+I processes for a given period of time. This amount includes researchers and auxiliary personnel.
Output indicators: The output indicators are used to control the activities related to the innovative results produced.
1. Intellectual property. Number of patents developed for the product, service, process or activity considered for a given interval of time. This is a way to measure the intellectual production of new innovations and ideas.
2. New processes: number of new processes involving the implementation of a new or significantly improved production or delivery method.
3. New products / services: number of new products/services involving the introduction of a new good or service that is new or substantially improved. This might include improvements in functional characteristics, technical abilities, ease of use, or any other dimension.
4. Sales due to the innovation: % of the sales due to innovations achieved. This percentage related directly to the innovation generated for a product, service, process or activity is obtained by comparing the sales before and after the innovation, expressed in national currency.

63
5. Innovation expenditures (% of turnover): this indicator is itself a ratio. It can be described as the total sum of innovation expenditure, in national currency and current prices (Innovation expenditures includes the full range of innovation activities: in-house R&D+i, extramural R&D+i, machinery and equipment linked to product and process innovation, spending to acquire patents and licenses, manufacturer design, training, and the marketing of innovations.), divided by the turnover, in national currency and current prices.
Financial value indicators
The volume of investments in technological venture capital: this indicator is also a ratio. It can be understood as the total sum of investments in technological venture capital, in national currency, divided by the net benefit obtained from a product, process, service or activity.
Organizational innovation indicators:
1. Is there an environmental certification such as ISO 14001?Yes/No 2. Internal environmental audits? Yes/No 3. External environmental audits? Yes/No 4. Written environmental policy? Yes/No 5. Public environmental report? Yes/No 6. Environmental performance indicators/goals? Yes/No 7. Environmental training programme for employees? Yes/No 8. Benchmark environmental performance? Yes/No 9. Environmental criteria used to evaluate/compensate employees? Yes/No
SECOND FACTOR: ECO-EFFICIENCY This factor should represent the variation in eco-efficiency performance for a certain period of time, expressed as a number between 0 and 1. In this analysis, the following indicators in EE are considered:
• Energy consumption • Water consumption • Consumption of materials • ODS emissions • GHG emissions • Acidifying emissions • Total waste generated
Each of these factors has to be separately calculated using as denominator the functional unit associated with every product, process, service or action. This factor is used to analyze a process, product or service in comparison with:
− An existing process, product or service previously commercialized; − An existing process, product or service with future alternatives.
So, the difference between the initial situation and the final one, has to be expressed as a percentage of the initial status. Only in this way it is possible to combine the

64
results of each analysis in units that can be different. (MJ for the energetic consumption, m3 for the water consumption, kg of emissions to the air …) Example: in the case of energy consumption, the Eco-Efficiency factor (EE) is calculated as follows:
0
0
1
1
0
0
FU
E
FU
E
FU
E
E
−
=δ
It is calculated for functional units. The use of functional units (FU) is essential since the EE of a process will depend to a great extent on the considered FU. When using the same FU during the process (which means the same denominator for the status before and after) just the net energy consumption will be indicative of eco - efficiency. The δE must be understood as the value that expresses the rate of variation of eco - efficiency performance. This rate can be positive if the product, process, service or action is efficient. Values of 0 or negative are indicative of inefficiency. All these individual indicators can be better understood if they are represented in a graph as it follows: Figure 10: Eco-efficiency performance indicators
Eco-efficiency performance
0
25
50
75
100Energy consumption
Water consumption
Material consumption
GHG emissions
ODS emissions
Acidificant emissions
Total waste (mass balance)
Total waste (waste output)
The bigger the polygon area, the better the eco-efficiency performance. There are two possibilities for combining the 7 individual components in a summary statistic for eco-efficiency.

65
The first approach is based on the combination of each individual factor as percentages in a simple average. Considering all the possible factors of eco – efficiency that could be used, the seven which have been chosen in the study are critical and therefore they have to be positive separately. In order to consider a process eco-efficient, it is necessary that all the factors involved are equal to or greater than zero, with at least one of them positive. The most favourable result is given when all the seven indicators are positive. Logically the final performance will depend on the quantity of improvement for each individual indicator. The result will always be positive and bigger than 0. The bigger the overall value, the better the performance. The worst situation is related to values close to 0.
EE =
∑
n
F nnδ
Eδ ≥ 0 Wδ ≥ 0 Mδ ≥ 0 GHGδ ≥ 0 ODSδ ≥ 0 ACIDδ ≥ 0 TWδ ≥ 0
nFδ ≥ 0
The second option, more complex, includes these individual factors expressed in percentages, respecting the sign in a weighted average.
EE =
∑
×∑
WWFnn
nnn)(δ
Where Wn
is the weight assigned to each factor of individual eco-efficiency.
The final result will be expressed as a rate between 0 and 1. In this way, and considering the sign, the result will range in the interval [-∞,1]. From this interval those negative results between [-∞,0] will indicate absence of eco – efficiency, with the values close to 0 being the most benevolent. The positive results between [0,1] will indicate eco-efficient activities. The closer to 1 the better the performance. (A hypothetical value of 1 would mean a total performance, an improvement of 100 % in all the processes involved. This is an unachievable situation but it will remain included in the formulation.) MEASURING ECO-INNOVATION IMPACT Multiplying the indicator of eco - innovation by the number of functional units sold will give an idea of the final impact of the action, product or process developed.
Eco-innovation indicator = ( ) ( )factor Efficiency-Ecofactor Innovation × = (Indicator result) x (number of functional units sold)

66
ECO-INNOVATION SURVEY FOR USE IN SMEs It is hard to obtain all the information for every company. For SMEs the following questionnaire may be used, for which the data requirements appear manageable.
1. Mention any R&D+i plans existing in your firm. 2. Analyze the aspects related to environmental technologies of the previous planning
period. Indicate if in that planning some R&D+i specific actions were included in the following areas: work against the climatic change, efficient management of the water, energetic efficiency, renewable energies, efficient management of the transport, clean transport, urban sustainability, sustainable construction, productive clean processes, substitution of raw materials, recycling and reutilization of by-products, etc.
3. Indicate if there are any R&D+i private funding lines related with environmental
technologies and describe them. 4. Indicate if there are any R&D+i public funding lines related with environmental
technologies and describe them. 5. Indicate if there are databases, expert systems or environmental improvement checking
systems, on materials, products and clean technologies. Mention them. 6. Indicate if programmes or specific lines of training exist related to technologies and clean
processes, both for the researchers and auxiliary personnel. Mention them. 7. Indicate if any innovation indicatos related to technologies and clean processes are used
or not. 8. Indicate the web pages or links in those where it is possible to search for references to the
aspects indicated previously. 9. Indicate if any advice service related to innovation related to clean technologies and clean
processes exists and is used by your firm. Mention it. . 10. Indicate the number of environmental suggestions developed by the personnel of the
company. 11. Indicate the number of employees who are taking part in environmental innovative
programs. (Suggestions, good practices…) 12. Is there an environmental certification such as ISO 14001? Yes/No 13. Internal environmental audits? Yes/No 14. External environmental audits? Yes/No 15. Indicate if there is any written environmental policy. Yes/No 16. Indicate if there is any public environmental report. Yes/No 17. Indicate if your company has any environmental performance goals. Yes/No

67
18. Indicate if there is any benchmarking study related to environmental performance.
Yes/No 19. Do you use any environmental criteria to evaluate/compensate employees? Yes/No This survey is currently being field tested. First results can be found in the LEIA report for MEI.
68
5. Data needs for economic models incorporating eco-innovation 5.1 Introduction Economic models are used to determine the effects of environmental and energy policies. In MEI we surveyed what data are used in economic models with technical change that protects the environment. Originally technical change was incorporated as an autonomous parameter. Recently, efforts to endogenize technological change have been a major subject for economists. With regard to economic climate change modelling, this approach opens new perspectives for handling prospective issues concerning mitigation policies and emission reductions. The availability of corresponding data is a difficulty for the calibration and estimation of certain parameters in economic models. In their report for MEI, ZEW researchers Rennings and Voigt survey the models of the economy-environment–energy relationship (E3 models) as part of a wider discussion of models of endogenous technical change (ETC). The relevant models fall into two categories: bottom-up models and top-down models (a third category is hybrid models). Bottom-up approaches commonly use energy systems (ES) as their standard modelling tool, presenting a highly disaggregated view of the economy. ES provide a detailed description of technologies contained in each considered sector. Within this spectrum, technological progress is mainly represented through learning-by-doing (LBD). Due to the specificity of ES models, they are well-suited to incorporate LBD since learning typically refers to particular technologies (see Pizer and Popp (2007) for more details). That is why LBD is less applicable in more aggregated approaches. In contrast, the poor availability of specific data for investment in R&D makes this element of ETC less appropriate for disaggregated models. Top-down models treat energy systems in an extremely aggregated manner. They focus particularly on the examination of the entire economy, thus offering a rather macroeconomic view, incorporating continuous, smooth production functions where possibilities of substitution are represented by substitution elasticities, cf. Löschel (2002). Technological development is included through the relationship of inputs and outputs and their relative prices. Here, TC is a step-by-step procedure emerging through changes in the relative prices of different technologies. In this regard, the TC representation in the top-down analysis corresponds more closely to reality than the radical change in bottom-up models, since conventional technologies are replaced gradually. That is why top-down models are qualified for analyzing long-term innovation. An additional advantage of top-down modelling certainly is the opportunity to represent feedback effects between distinct markets, e.g. through changes in the price system. In contrast, this approach fails to integrate assumptions on the prospective development of different technologies and costs.11 The most widely applied model is the Computable General Equilibrium (CGE) model. CGE models involve market interactions between households and firms. Household utility and production possibilities are usually represented by nested constant elasticity of substitution (CES) functions (see Löschel (2002)). Endogenous technological
11 For more details on the subject of top-down modeling, cf. Löschel (2002) and Böhringer and Rutherford (2006).

69
progress is typically incorporated in these models through investment in R&D and spillovers. A number of CGE models divide the economy into several sectors, causing special empirical challenges, as Pizer and Popp (2007) find. In those kinds of models the knowledge stock of each single sector is required. This is a difficult task since corresponding specific data on the meso- and micro-level are harder to obtain than aggregate data. 5.2 Data use in ETC-models No single data source is able to fully cover all requirements needed. Bottom-up models usually call for a lot more differentiated data than top-down approaches. CGE models often distinguish only fossil and non-fossil fuels or energy-intensive and non-energy-intensive sectors, respectively. In contrast, as noted, bottom-up approaches frequently use Energy System (ES) models which differentiate between several kinds of energy, such as nuclear power, solar PV, carbon energy, etc. This necessitates the use of detailed data. A wide range of the literature concerning ETC favours patents as measure of innovative activities (see Popp (2001, 2002)). The intuition behind this is the creation of new knowledge inherent in a successful patent application. Since they contain detailed information on the technology, assigning patents to a particular research field is relatively uncomplicated though possibly tedious. Reliable data are offered by national and international patent offices, e.g. JPO, USPTO and EPO, and the OECD Triadic Patent Family Database. There are certain difficulties when measuring innovative efforts by the number of patent applications, described in section 2.2. Instead of patents, R&D statistics may be used. Many models use a knowledge stock variable to model technological learning Goulder and Schneider (1999) establish a CGE framework based on the accumulation of knowledge capital through R&D expenditures as the driving element of technological progress. In their model they distinguish conventional and alternative sources of energy. In addition, a market for intermediate goods is introduced in which products are manufactured by using either carbon-intensive or non-carbon-intensive materials. The data required for simulation runs of this model stem from the US. Information on inter-industry flows as reported in the Survey of Current Business (April 1994) published by the US Department of Commerce. Data concerning alternative energy was provided by Pacific Northwest Laboratories. Unfortunately, the authors did not obtain precise data relating to R&D expenditures since their principal aim is to gain qualitative insights about this feature. A rather qualitative view is also presented by Goulder and Mathai (2000). They model technological progress primarily via investment in R&D and technological learning. As in the previous case the authors do not use empirical information on these sources of TC. The only criterion where databases are explicitly named is for CO2 emissions data made available by the Intergovernmental Panel on Climate Change (IPCC). R&DICE, an integrated assessment model (IAM) including a CGE framework of the economy, was developed in Nordhaus (2002). R&DICE is founded on the Dynamic Integrated model of Climate and the Economy (DICE), introduced by Nordhaus (1994). It is a global approach without a detailed distinction of specific energy sectors. Endogenous technological progress is represented by means of investments in R&D. The calibration is again based on the US economy with data from the National Science Foundation (NSF) and the Bureau of Economic Analysis (BEA). The NSF offers

70
detailed R&D expenditure data for the United States for the time period since 1991, structured by different industry branches and even explicitly exposing energy R&D. The BEA data on R&D expenditures are not as differentiated as those from the NSF, but they cover the period since 1959, thus providing relatively large samples on the macro-level. An econometric panel data study by Jaffe and Palmer (1996) examines the dependencies of R&D expenditures on different factors. Their sector-specific data regarding R&D are rooted in the Standard Industrial Classification of all Economic Activities (SIC) and stem from an NSF survey as well. Another global model is ENTICE-BR, used by Popp (2006), which is a modified version of ENTICE (for ENdogenous Technological Change), for which see Popp (2004). It is rooted in DICE, but unlike in DICE, which assumes exogenous TC, technological progress in ENTICE-BR is modelled via investment in R&D. Fossil fuels, a carbon-free backstop technology and a knowledge stock of energy efficiency are significant components of ENTICE-BR. Popp estimates energy R&D expenditures for the world by taking the corresponding percentage value of the US and transmitting it to the whole world. Unfortunately, he does not name the exact data source for those values. Otto et al. (2006) establish a CGE model that includes a relatively detailed description of different industrial sectors, distinguishing in particular carbon-intensive and non-carbon-intensive industries and electricity generation. Here, the driving element of endogenous technical growth is again knowledge capital, which is accumulated by expenditures on R&D and on education and investments in information and communication infrastructure. Drawing on investment data for knowledge capital from the Netherlands, the authors apply their model to the Dutch economy. The necessary information is obtained by the official national statistics of the Netherlands (Nationale Rekeningen). Data on fossil fuel inputs are accessible on the GTAP-EG database. A macroeconometric approach incorporating sectoral and regional specification is presented in E3MG (energy-environment-economy model of the globe) - see Barker et al. (2006). This model was developed by the Tyndall Centre at the University of East Anglia and is based on E3ME which is a similar approach for the European Union, cf. Barker and Köhler (1998). Technological progress is embodied through investments in R&D in the sectoral energy demand equations and, using a bottom-up representation, through learning curves referring to regional investments in energy-generating technologies. The database created for E3MG includes information by OECD, IEA, GTAP, RIVM (the Dutch National Institute for Public Health and the Environment) as well as the World Bank and the IMF. Energy systems are a standard tool of bottom-up modelling approaches. They are commonly based on technology learning as the source of technical change. A familiar example of ES models is MESSAGE, see Messner (1997), which was developed at the International Institute for Applied System Analysis (IIASA). In MESSAGE, the knowledge gained through the learning process is measured via the cumulative installed capacity, i.e. specific investment costs for electricity generation are required. The relevant data can be found in CO2DB, a database of CO2 mitigation technologies, administered by the IIASA. McDonald and Schrattenholzer (2001) collected and estimated learning rates for several energy-related industrial branches yielding an extensive gathering of these LBD parameters. Their results are based on various
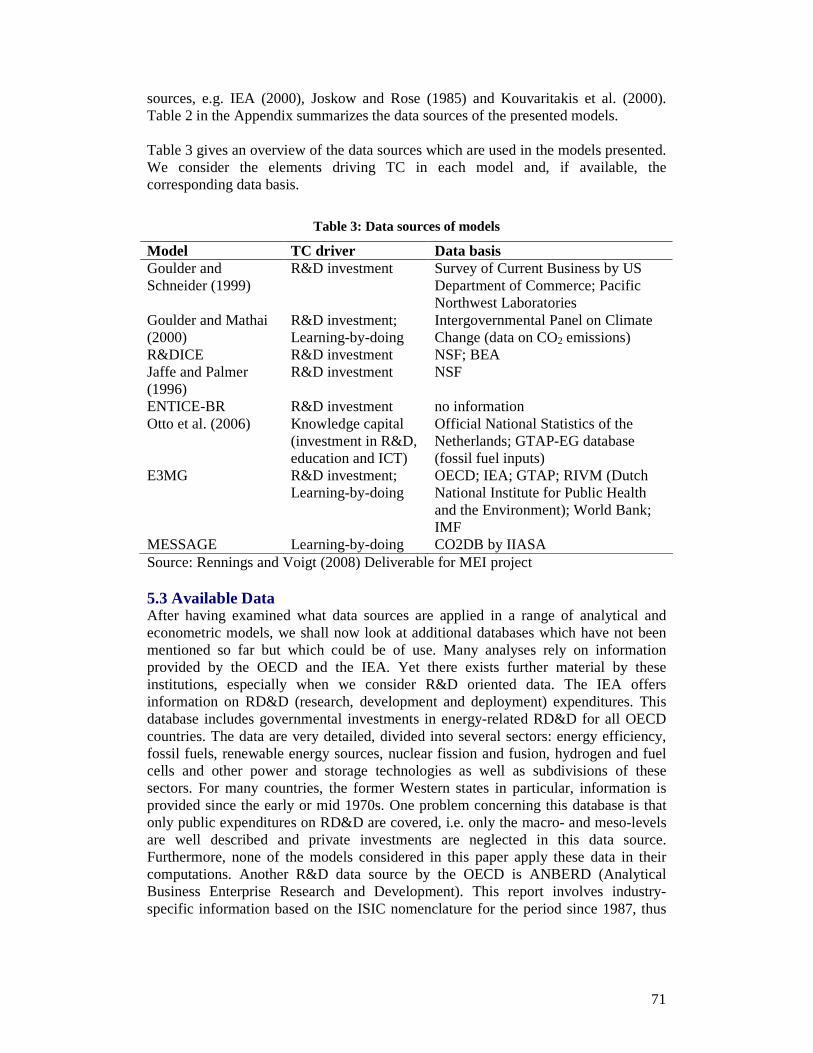
71
sources, e.g. IEA (2000), Joskow and Rose (1985) and Kouvaritakis et al. (2000). Table 2 in the Appendix summarizes the data sources of the presented models. Table 3 gives an overview of the data sources which are used in the models presented. We consider the elements driving TC in each model and, if available, the corresponding data basis.
Table 3: Data sources of models
Model TC driver Data basis Goulder and Schneider (1999)
R&D investment Survey of Current Business by US Department of Commerce; Pacific Northwest Laboratories
Goulder and Mathai (2000)
R&D investment; Learning-by-doing
Intergovernmental Panel on Climate Change (data on CO2 emissions)
R&DICE R&D investment NSF; BEA Jaffe and Palmer (1996)
R&D investment NSF
ENTICE-BR R&D investment no information Otto et al. (2006) Knowledge capital
(investment in R&D, education and ICT)
Official National Statistics of the Netherlands; GTAP-EG database (fossil fuel inputs)
E3MG R&D investment; Learning-by-doing
OECD; IEA; GTAP; RIVM (Dutch National Institute for Public Health and the Environment); World Bank; IMF
MESSAGE Learning-by-doing CO2DB by IIASA Source: Rennings and Voigt (2008) Deliverable for MEI project 5.3 Available Data After having examined what data sources are applied in a range of analytical and econometric models, we shall now look at additional databases which have not been mentioned so far but which could be of use. Many analyses rely on information provided by the OECD and the IEA. Yet there exists further material by these institutions, especially when we consider R&D oriented data. The IEA offers information on RD&D (research, development and deployment) expenditures. This database includes governmental investments in energy-related RD&D for all OECD countries. The data are very detailed, divided into several sectors: energy efficiency, fossil fuels, renewable energy sources, nuclear fission and fusion, hydrogen and fuel cells and other power and storage technologies as well as subdivisions of these sectors. For many countries, the former Western states in particular, information is provided since the early or mid 1970s. One problem concerning this database is that only public expenditures on RD&D are covered, i.e. only the macro- and meso-levels are well described and private investments are neglected in this data source. Furthermore, none of the models considered in this paper apply these data in their computations. Another R&D data source by the OECD is ANBERD (Analytical Business Enterprise Research and Development). This report involves industry-specific information based on the ISIC nomenclature for the period since 1987, thus

72
offering private R&D expenditure data at the level of industrial sectors.12 However, there is no direct separation into general, energy-related and environmental innovations. The Statistical Office of the European Communities, Eurostat, is one more possible source of data on R&D expenditures. This institution provides general information for the EU countries, like gross expenditures on R&D (GERD), as well as business enterprise R&D expenditures (BERD), hence including macro- and meso-level statistics. Industry-specific data are based on the general nomenclature of economic activities (NACE). Aggregate GERD and BERD information is quite extensive, covering time periods since the beginning of the 1990s. On the other hand, disaggregated data on the basis of NACE sectors are still incomplete and differ broadly from country to country. Portugal, for instance, provides rather detailed data whereas large countries, e.g. Germany, France or Italy, lack thorough information. Moreover, many industrial sectors keep their R&D investments confidential. Nonetheless, there are clear improvements in Eurostat’s R&D databases since the beginning of this century. In addition, for some sectors, e.g. mining, manufacturing or energy and water supply, Eurostat provides expenditures on environmental protection. On the EU level the data on that subject are available for the time frame since the mid 1990s. Since 2001 relatively specific information can also be obtained for some countries, in particular Germany, the Netherlands, Portugal, Slovenia, France and the United Kingdom. Those data could help us to identify environmental innovations. Eurostat even provides information on investments in pollution control and expenditures linked to cleaner technologies. These aspects can clearly be assigned to environmental innovations. Another feature of Eurostat is the Community Innovation Survey (CIS). In this survey companies are polled about their expenditures on innovations and the purposes of these investments. It might be possible to expose energy-related and environmental innovative efforts based on the aims stated by the enterprises. However, data from Eurostat have not experienced wide application in analyses as yet. An additional promising database is currently being established by the EU KLEMS project. This database intends to provide measures on various economic indicators, e.g. growth, productivity, capital formation and technological change, to name just a few. These data aim at capturing productivity contributions of capital, labour, energy, materials and services for all member countries of the EU-25 for the time period since 1970. In particular, Work Package 9, “Technical Progress and Innovation”, is of great importance. The principal objectives of this work package include the provisioning of quantitative inputs for the database, the development of measures for R&D expenditures in order to create R&D or knowledge capital indicators, and the relation between productivity growth and R&D efforts, among others. R&D data are mostly obtained by mentioned sources, mainly ANBERD and national statistics as well as CIS. Although this information is available by now, this will be a significant data compendium covering many relevant subjects related to growth accounting. Central issues of this work package deal, for instance, with the composition of R&D, globalization of R&D efforts, surveys concerning the structure and organization of R&D in firms, or the effect of domestic innovations.13 The final publication of the EU 12 R&D data are available since 1987 for most European OECD countries. The Czech Republic and Poland provide data since 1992 and 1994, respectively. 13 For more detailed information concerning this work package, cf. http://www.euklems.net.

73
KLEMS database can be expected by early 2008. As yet, the most recent version from March 2007 involves various information on all EU-25 countries as well as Japan and the United States. In order to represent knowledge capital one can refer to capital services from information and communications technologies (ICT) since capital is divided into ICT and non-ICT capital for several EU-25 countries. For most of these states, corresponding data are available since 1970. Exceptions are Austria (since the mid 1970s), the Czech Republic, Hungary, Slovenia and Sweden (all since the mid 1990s). Despite some difficulties about whether knowledge can solely be based on ICT, this assignment provides a good starting point for measuring innovative activity. In addition, ICT capital is mainly responsible for the storage of knowledge, which makes its application more plausible. The data are disaggregated up to the industry level, supplying information of a precision similar to NACE or ISIC. A model in which the EU KLEMS database may broadly be applied can be found in Inklaar et al. (2007). Their multi-sectoral model includes production functions using labour services, and both non-ICT and ICT capital services. These are variables which can all be found in the forthcoming EU KLEMS database. To see the full scope of applicability, we have to wait for its final release. Table 4 summarizes the data availability for the coverage of R&D investments, LBD and spillovers.
Table 4: Data availability
R&D LBD Spillovers Public Private Micro-level IIASA –
CO2DB
Meso-level IEA – Energy RD&D Eurostat NSF
OECD – ANBERD Eurostat NSF EU KLEMS
Macro-level NSF OECD Eurostat
NSF OECD Eurostat EU KLEMS
OECD IMF
Source: Rennings and Voigt (2008) Deliverable for MEI project
To conclude, data availability is mixed. There is also a second problem, which is that the model exercises are often not transparent about the data sources used to calibrate benchmarks for the simulation of certain situations. Frequently, calibration parameters rely on assumptions which are not clearly communicated, a point that is criticized by Pizer and Popp (2007). A particular difficulty is whether models intend to gain qualitative or quantitative insights. This often is not evident from the description of the approaches. Especially for variables related to the knowledge stock, there are a lot of examples where no explicit database is used but ad hoc assumptions are included. However, it might be useful to check those models for quantitative consistency of their results since this could help to understand the phenomenon of technological progress more deeply. Furthermore, the usability of the mentioned data could be improved, e.g. through better coverage of firm level R&D expenditures or adjustments in the capture of research investments in EU countries.

74
The identification of environmental innovations presents a problem. R&D expenditures are not broken down into environmental R&D and non-environmental R&D. For energy technologies we have good R&D statistics for public R&D but not for private R&D. On non-energy eco-innovation there is no data. The informational basis of E3 models is thus extremely poor as far as eco-innovation is concerned outside the energy sector. For aggregate approaches which distinguish only between energy-intensive and non-energy-intensive sectors useful data are available. For instance, with respect to public research investments one can use the IEA database on energy RD&D. In models with a detailed sectoral classification, like E3MG, disaggregated data on different industrial sectors from Eurostat offer a good starting point despite the problem of the small sample size. The NACE based specification is transferable to the sectoral categorization used in those models. The principal difficulty in Europe is that data availability is good for some countries and very poor for others, mostly for former Eastern bloc countries. That makes a unitary European view difficult, whereas in the US there is a common standard of data gathering.

75
6. Measurement of competitiveness of eco-innovation
Competitiveness is a EU priority. The competitiveness of a company can be broadly defined as the ability to sell its products in home and foreign markets. The aggregated competitiveness of all companies determines the competitiveness of a country. Eco-innovation can contribute to competitiveness in several ways. Two important ways are (1) by helping EU industry to lower costs thanks to lower resource costs, and (2) by creating products that can be sold into the world market.14
6.1 Defining and understanding competitiveness In the literature, we find different definitions of competitiveness.15 The OECD (1996, p. 24) defines it as "… the ability of companies, industries, regions, nations, and supranational regions to generate, while being and remaining exposed to international competition, relatively high factor income and factor employment levels on a sustainable basis". The EU Commission (2003, p. 21) uses as a definition of competitiveness "… the ability of an economy to provide its population with high and rising standards of living and a high level of employment for all those willing to work, on a sustainable basis."
Competitiveness has to do with the ability to compete and earn money in the world economy. The competitiveness of eco-innovations may be measured on the basis of exports data, sales data, and the world market shares of those eco-innovations that are sold as goods or services. Here the market performance is used as a measure. A second approach looks not at economic performance but at those factors that affect the ability to compete and to reap benefits from eco-innovative activity. The ability to compete depends on company internal capabilities for altering their processes and products, strengths in marketing and market power, and wider aspects such as the sectoral system of innovation (the value chain), conditions of rivalry, and macro-economy factors (price stability, competition). The indicators about the ability to innovate will tell something about the potential future performance of innovating firms.
The ability to compete and earn money does not depend on innovation in a narrow sense but on a range of factors. In his book “Competitive advantage of nations”, business professor Michael Porter identifies four sets of variables that affect economic performance of sectors and nations.
14 This chapter is based on two contributions for MEI: one by René Kemp and Jens Horbach, and one by Riso researchers Per Dannemand Andersen, Mads Borup, and Måns Molin. 15 From Fischer and Schornberg (2006, p.3).

76
Figure 11: Porter’s “Diamond”
Source: http://pacific.commerce.ubc.ca/ruckman/competitiveadvofnations.htm16
Factor conditions refer to inputs used as factors of production - such as labour, land, natural resources, capital and infrastructure. This appears in line with standard economic theory, but Porter argues that the "key" factors of production (or specialized factors) are created, instead of being inherited. Specialized factors of production are skilled labour, capital and infrastructure. "Non-key" factors or general use factors, such as unskilled labour and raw materials, can be obtained by any company and, hence, do not generate sustained competitive advantage. However, specialized factors involve sustained investment and are thus more difficult to duplicate.
16 The below text is taken from this source.

77
Porter argues that a lack of resources often helps countries to become competitive (Selective Factor Disadvantage (SFD). Abundance is said to generate waste, whereas scarcity generates an innovative mindset to overcome the problem of scarce resources. Examples of SFDs are:
• Switzerland: first country to experience labour shortage. Abandoned labour-intensive watches and concentrated on innovative and/or high-end watches (Rolex, Swatch).
• Japan: high priced land, which implied high cost of factory space, stimulated Just In Time inventory.
• Sweden: short building season plus high construction costs encouraged pre-fabricated housing
Demand conditions refer to the type of users and size of the market. Firms that face a sophisticated domestic market are likely to sell superior products because the market demands high quality, and a close proximity to such consumers enables the firm to better understand the needs and desires of the customers. Related and supporting industries constitute the third element. They can exist at a regional level but could also exist at the international level. The local level is said to be important. Examples include Silicon valley in the U.S., Detroit (for the auto industry) and Italy (leather-shoes-other leather goods industry). Strategy, structure and rivalry refer to the company’s strategy, the ways in which it is integrated and rivalry situation it is in. Low rivalry is good in the short term but bad in the longer term.
Challenging environmental regulations may thus help companies to become competitive (the Porter hypothesis). This hypothesis is controversial but coming from perhaps the world’s most famous business economist, has received a lot of attention.
The model is not prone to simple measurement but offers a useful theoretical framework for thinking about competitiveness. Porter himself created the Business Competitiveness Index (BCI), a composite index, about which more will be said later on.
The EU has produced several communications and working documents on the competitiveness of the EU as a whole and of particular EU sectors. An example is the report “Key indicators on the Competitiveness of EU’s ICT industry”. The paper offers an economic profile of the sector for the EU25 and individual companies, in terms of value added, number of persons employed and turnover. Value added as a percentage of GDP for the EU15 is compared with that of selected trading nations. Relative shares of employment in the ICT sector are also compared. These are nothing but crude measures of competitiveness, as the size of the sector reflects in the first instance the demand for ICT services. The paper also gives information on labour productivity growth, labour costs and production growth, trade performance, human capital, R&D and venture capital investments for the EU, which is presented in graphs, together with information for Japan and the US and other nations. There is no discussion of the capacity to innovate, nor is there an elaborate discussion of competitiveness.
The Commission Staff working document “European Industry: A Sectoral Overview” uses the same type of information for the ICT sector (and other sectors), together with

78
graphical information of the evolution of VA, employment and labour productivity against total manufacturing, allowing us to see the relative evolution (whether this sector does relatively well). The working document offers a competitiveness assessment through a short tabled discussion of knowledge, competition, regulation, environment (regulation) and external competitiveness. This discussion is rather superficial and is not based on systematic comparisons. The environmental goods and services sector is absent from the sectors discussed, for the simple reason that we lack annual data on the above measures for this sector.
We now turn to the issue of measurement, where we examine four types of indicators for measurement:
- Indicators based on trade performance
- Indicators based on costs and labour productivity
- Single indicators based on input measures for innovation
- Systems indicators based on sets of indicators
Indicators based on trade data - Exports
A high share of exports of a certain good and positive net exports (exports minus imports) is indicative of a nation’s competitiveness. We lack information about exports and imports for the eco-sector as a whole but information about sales and exports is often available for quite detailed good categories, such as wind turbines and photovoltaic (PV) cells and components from sector organisations. The Ernst and Young study for DG Environment “Eco-industry, its size, employment, perspectives and barriers to growth in an enlarged EU” (published September 2006) offers information about imports and exports for the following eco-industry sectors:
• Air pollution control (APC); • Water pollution control (WPC); • Waste disposal; • Monitoring equipment; • Other Environmental Equipment (OEE); • Solar thermal; • Photovoltaics; • Hydropower.
Information about imports and exports for these sectors for the years 2000 to 2004 is plotted for the EU as a whole and selected countries such as Germany, France, UK, Belgium and Italy (see Figures 12 and 13)

79
Figure 12: EU-25 Import and export figures from and to outside the EU-25
Source: Ernst and Young (2006, p. 113)
Figure 13: EU-25 Import and export figures for Germany, 2004
Source: Ernst and Young (2006, p. 118) The report says that the 8 eco-sectors account for approximately 20% of total trade (in environmental goods and services) and mentions that there are data problems. This is indicated in a quotation from a previous study on the Eco-industry published in 2001, stating "it is unclear what percentage of total trade in environmental goods is captured by these trade codes. Due to data limitations, it is only possible for a few countries (usually strong exporters) to make a comparison between exports measured by trade code analysis with exports reported by environment industry suppliers. This comparison suggests that only in the order of 20% of total trade is captured by trade

80
codes in these countries (Germany and Austria). However, this ratio is highly variable across environmental categories (…) For many eco-innovation product categories information about the value of exports and imports is available. The very detailed COMEXT database of the EU is interesting as it allows the analysis of foreign trade (intra- and extra-trade) for the EU 25. The commodities in this database are broken down by the 8-digit commodity numbers (CN2006 combined nomenclature). “This tariff and statistical classification, based on the international classification known as the Harmonised Commodity Description and Coding System, or more simply the Harmonised System or HS, includes ca. 10 000 eight-digit codes” (EUROSTAT (2006b), p. 11). Within the COMEXT database intra- and extra EU trade statistics are compiled monthly. The main statistical data published by EUROSTAT for intra-EU trade are as follows (see EUROSTAT (2006b): the declaring Member State, the reference period, the flow, the product, as defined in the Combined Nomenclature, the trading partner, the statistical value, the net mass (in tonnes), the quantity in any supplementary units (litres, number of parts, etc.) and the mode of transport. All these data are also available for extra-EU trade. In addition, data are available to the public for trade with third countries on: the statistical procedure, the nationality of the means of transport at the frontier and whether or not the goods are transported in a container. For 2007, a change in the classification has been announced. The use of the COMEXT database for environmental purposes evokes two non-trivial problems. Firstly, one has to identify environmentally related products (see Table 5 for examples for such products within the Combined Nomenclature). Different analyses of the environmental industry (see e.g. Halstrick-Schwenk, Horbach, Löbbe, Walter (1994) or Ernst&Young (2006) or Legler et. al. (2007)) and supplier lists can be used to find these products. Nevertheless, many of the products, like pumps, are so-called multi-purpose products so that it will be difficult to calculate the environmentally relevant value shares. Another problem is that there is a bias towards end-of-pipe technologies and environmentally friendly products whereas is is rarely possible to identify cleaner technologies. Table 5: Examples for (potentially) environmental-innovative products within the Combined Nomenclature used for the COMEXT database 3815 Reaction initiators, reaction accelerators and catalytic preparations, not else
where specified or included: Supported catalysts: 3815 11 00 With nickel or nickel compounds as the active substance 3815 12 00 With precious metal or precious-metal compounds as the active substance 8410 Hydraulic turbines, water wheels, and regulators therefore: Hydraulic turbines and water wheels 8414 Air or vacuum pumps, air or other gas compressors and fans; ventilating or
recycling hoods incorporating a fan, whether or not fitted with filters: 8414 10 81 Diffusion pumps, cryopumps and adsorption pumps 8414 10 89 Other 8421 Centrifuges, including centrifugal dryers; filtering or purifying machinery

81
and apparatus, for liquids or gases: Filtering or purifying machinery and apparatus for liquids: 8421 21 00 For filtering or purifying water 8541 Diodes, transistors and similar semiconductor devices; photosensitive
semiconductor devices, including photovoltaic cells whether or not assembled in modules or made up into panels; light-emitting diodes; mounted piezoelectric crystals:
8541 40 Photosensitive semiconductor devices, including photovoltaic cells whether or not assembled in modules or made up into panels; light-emitting diodes:
8502 Electric generating sets and rotary converters: 8502 31 00 Wind-powered Source: European Commission (2005). After having identified the environmental goods, the innovativeness of these products has to be analysed. To solve this problem, the following procedures seem to be feasible:
• Using general lists of innovation intensive products, then sub-filtering for environmental goods;
• Identifying new and relevant environmental goods by analysing case studies; • Exploring patent data bases to identify the innovative products.
For the finally identified environmentally innovative goods, indicators such as world market shares or RCA (Revealed Comparative Advantage) values may be calculated.
In Germany, Legler et al. (2007) use the concept of “potential” environmental goods to assess the competitiveness of the eco-industry in Germany and other OECD countries (see also table 6). The authors use information of the German Statistical Office and supplier lists to define a list of environmental goods compatible with external trade statistics. The “multi-purpose” problem of products such as pumps is simply ignored so that the whole product group is defined as environmentally relevant leading to an overestimation of the importance of the eco-industry. The advantage of this approach is that a statistically identifiable eco-industry is constructed allowing the calculation of world trade shares or RCA values.
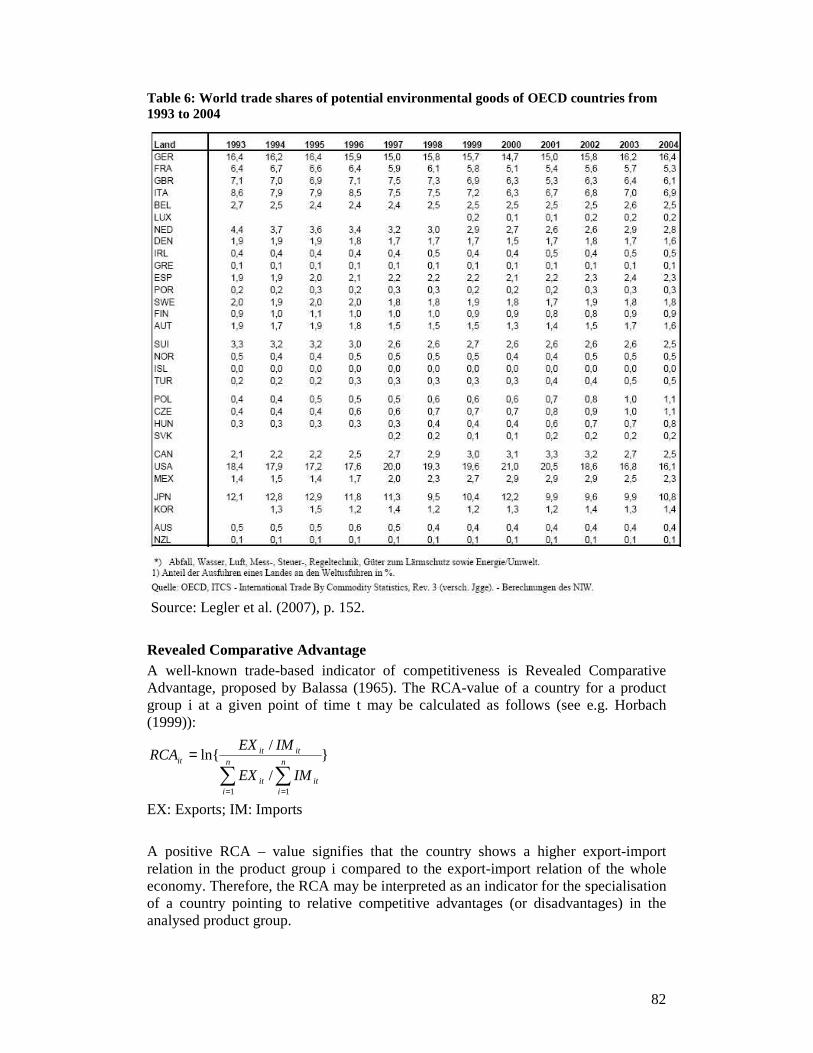
82
Table 6: World trade shares of potential environmental goods of OECD countries from 1993 to 2004
Source: Legler et al. (2007), p. 152.
Revealed Comparative Advantage A well-known trade-based indicator of competitiveness is Revealed Comparative Advantage, proposed by Balassa (1965). The RCA-value of a country for a product group i at a given point of time t may be calculated as follows (see e.g. Horbach (1999)):
}/
/ln{
1 1∑ ∑
= =
=n
i
n
iitit
ititit
IMEX
IMEXRCA
EX: Exports; IM: Imports
A positive RCA – value signifies that the country shows a higher export-import relation in the product group i compared to the export-import relation of the whole economy. Therefore, the RCA may be interpreted as an indicator for the specialisation of a country pointing to relative competitive advantages (or disadvantages) in the analysed product group.
83
RCA is being calculated for EU sectors for which trade data is available. The earlier mentioned Commission Staff working document “European Industry: A Sectoral Overview” plots information for the EU15.
The figure below (Figure 14) shows that the EU is doing relatively well in mechanical engineering, chemical and poor in clothing and radio and TV receivers. Revealed comparative advantage indices can be calculated for those eco-sectors for which trade data are available. RCA indices can be calculated for the 8 eco-sectors identified in the Ernst Young study about the eco-industry -- Air pollution control, Water pollution control, Waste disposal, Monitoring equipment, Other Environmental Equipment, Solar thermal, Photovoltaic and Hydropower – for those years for which information about exports and imports have been calculated.

84
Figure 14: EU-15 trade in manufactured products
Indicators based on costs and labour productivity Cost differences Cost differences are a traditional indicator of competitiveness. They are a less relevant indicator for heterogeneous products where quality aspects make costs less relevant. Costs have to be considered together with quality aspects, which is difficult because there are no standardized figures for product quality.
85
Productivity differences Nations with high costs may do well because a high labour productivity compensates for high costs. For labour productivity we have standardized figures for nations and sectors. Data availability is to be further studied Indicators about innovation activities Innovative activities may be measured by:
• Data on Research and Development activity
• Business start ups
• Patent data
• Data on innovative companies
Each of the measures will be discussed briefly.
Data on Research and Development activity These are available for companies, sectors and nations. We do not have statistics on environmental R&D by companies. Unfortunately, it is very difficult to get data on environmentally related R&D expenditures because firms are often not able to separate between environmental and “normal” R&D (see also Johnstone (2007)). This is especially the case for cleaner technologies where many eco-innovations are only a by-product of general innovation activities.
Business start ups Start ups are indicative of innovative activity, especially in manufacturing. Information about business startups is available from Eurostat. The main source of data for this development action is the statistical business registers that the National Statistical Institutes maintain. The use of the statistical business registers makes it possible to identify demographic events at the level of each individual unit. According to Eurostat, in 2003 there were 1.2 million newly born enterprises in the business economy of the 16 countries for which information was available. The countries are: the Czech Republic, Estonia, Spain, Italy, Latvia, Lithuania, Luxembourg, Hungary, the Netherlands, Portugal, Slovenia, Slovakia, Finland, Sweden, the United Kingdom, and Switzerland.

86
Figure 15: Enterprise birth rates, business economy (2003 (%))
The classification used is NACE. Eco-innovative companies cannot be identified within the NACE classification so that we do not have information about business start ups in eco-innovation or in environmental goods and services. To create statistics on this, statistical bureaus should ask companies whether their company is selling an environmentally superior product, and whether environmental improvement was a key objective. It would also be interesting to collect additional information about business deaths -- whether environmental aspects played a role in the death of the company.
Patent data Patent data can be used to measure the technological capabilities of the companies in ecotechnology by searching for environmentally relevant patents. This may give information about the strength of European manufacturers in emerging environmental technology areas such as nanotechnology and fuel cells. Patent data have to be examined with care (see section 2.2)
Data on innovative companies Information about eco-innovators across various EU countries can be obtained from the Community Innovation Survey, even when no question is asked about whether companies eco-innovate. Eco-innovators may be defined as those which had reported a high degree of impact of innovation on either “reduced materials and energy per produced unit” (EMAT) or “improved environmental impact or health and safety aspects” (EENV). This definition has been used by ZEW and Technopolis and Horbach (in press). The profile of eco-innovating firms may be compared to that of innovative firms in various sectors – remember that the firms in those sectors may qualify as eco-innovators, which means that the population of eco-innovators is a mixture of the other populations. Such a comparison using data from CIS-3 has been undertaken by Technopolis in the Europe Innova project. General results are given in Figure 16.
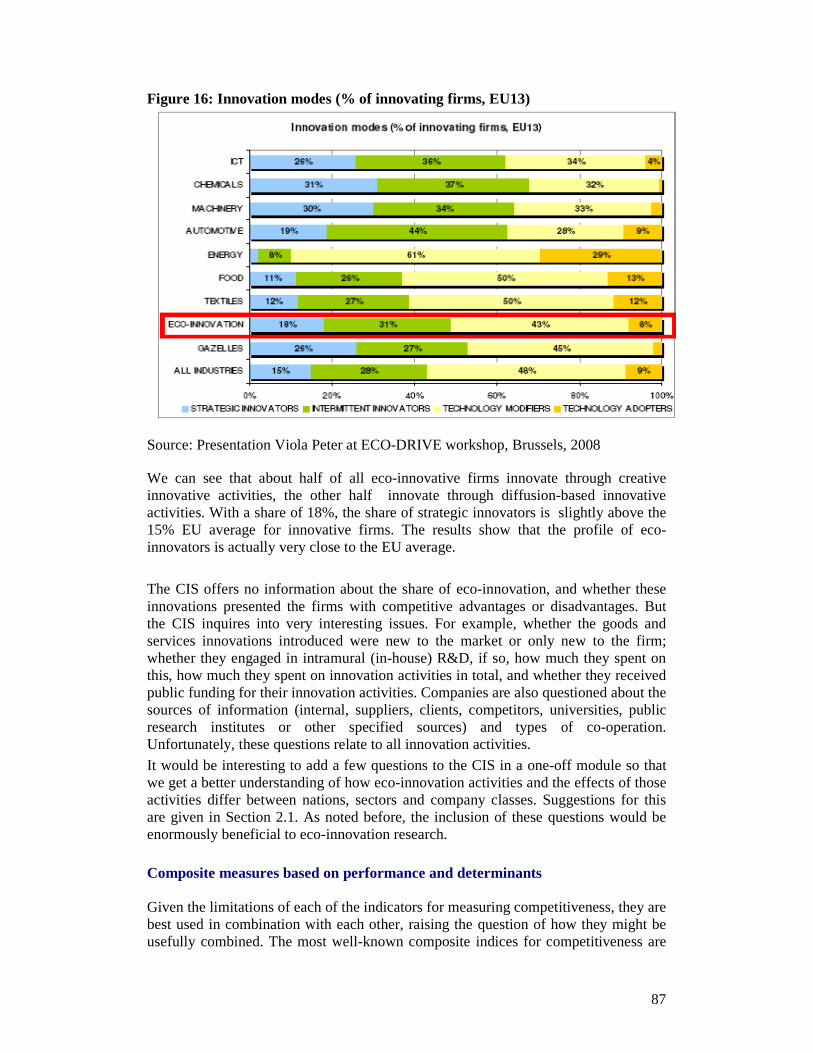
87
Figure 16: Innovation modes (% of innovating firms, EU13)
Source: Presentation Viola Peter at ECO-DRIVE workshop, Brussels, 2008 We can see that about half of all eco-innovative firms innovate through creative innovative activities, the other half innovate through diffusion-based innovative activities. With a share of 18%, the share of strategic innovators is slightly above the 15% EU average for innovative firms. The results show that the profile of eco-innovators is actually very close to the EU average.
The CIS offers no information about the share of eco-innovation, and whether these innovations presented the firms with competitive advantages or disadvantages. But the CIS inquires into very interesting issues. For example, whether the goods and services innovations introduced were new to the market or only new to the firm; whether they engaged in intramural (in-house) R&D, if so, how much they spent on this, how much they spent on innovation activities in total, and whether they received public funding for their innovation activities. Companies are also questioned about the sources of information (internal, suppliers, clients, competitors, universities, public research institutes or other specified sources) and types of co-operation. Unfortunately, these questions relate to all innovation activities.
It would be interesting to add a few questions to the CIS in a one-off module so that we get a better understanding of how eco-innovation activities and the effects of those activities differ between nations, sectors and company classes. Suggestions for this are given in Section 2.1. As noted before, the inclusion of these questions would be enormously beneficial to eco-innovation research.
Composite measures based on performance and determinants Given the limitations of each of the indicators for measuring competitiveness, they are best used in combination with each other, raising the question of how they might be usefully combined. The most well-known composite indices for competitiveness are

88
the Global Competitiveness Index (GCI) of the World Economic Forum (WEF), the Competitiveness Scoreboard (CS) of the International Institute for Management Development (IMD) and the Business Competitiveness Index (BCI) of Michael Porter. The Global Competitiveness Index is the successor of the Growth Competitiveness Index developed by Sachs and McArthur. The GCI combines factors that are viewed critical to driving productivity and competitiveness, which are grouped into nine pillars:
• Institutions • Infrastructure • Macroeconomy • Health and primary education • Higher education and training • Market efficiency • Technological readiness • Business sophistication • Innovation
It is stated that none of these factors alone can ensure competitiveness. The index incorporates the notion that countries around the world are functioning at different stages of economic development. The relative importance of particular factors for improving the competitiveness of a country will be a function of the starting conditions, that is, those institutional and structural features which characterize a country in comparison with others in terms of development, as measured by per capita income. For example, what presently drives productivity in Sweden is necessarily different from what drives it in Ghana. The GCI separates countries into three specific stages: factor-driven, efficiency-driven, and innovation-driven, each implying a growing degree of complexity in the operation of the economy.

89
Table 7: Global Competitiveness Index (GCI) ranking s and 2005 comparisons
Source: global competitiveness report – executive s ummary (2006)

90
Figure 17: The World Competitiveness Scoreboard 2007 of IMD
Source: IMD (http://www.imd.ch/research/publications/wcy/upload/scoreboard.pdf)

91
Table 8: The Business Competitiveness Index (BCI)
Source: http://www.weforum.org/pdf/Global_Competitiveness_Reports/Reports/gcr_2006/gcr2006_summary.pdf

92
The pillars of the GCI are organized into three sub-indexes, each critical to a particular stage of development: (a) the basic requirements sub-index groups those pillars most critical for countries in the factor-driven stage (institutions, infrastructure, macroeconomy, health and primary education); (b) the efficiency enhancers sub-index includes those pillars critical for countries in the efficiency-driven stage (higher education and training, market efficiency, technological readiness); (c) the innovation and sophistication factors sub-index includes all pillars critical to countries in the innovation-driven stage (business sophistication, innovation). The World Competitiveness Scoreboard (CS) presents (Figure 17) the 2007 overall ranking for the 55 countries covered by the World Competitiveness Yearbook (WCY). The economies are ranked from the most to the least competitive and performance can be analyzed on the basis of time-series. The basic assumption is that wealth creation takes place at enterprise level (whether private or state-owned) but that enterprises operate in a national environment which enhances or hinders their ability to compete domestically or internationally. The WCY divides the national environment into four main factors: - Economic Performance - Government Efficiency - Business Efficiency - Infrastructure Each of these factors is divided into 5 sub-factors which highlight every facet of the areas analyzed. Altogether, the WCY features 20 such sub-factors, which comprise more than 300 criteria. Each sub-factor, independently of the number of criteria it contains, has the same weight in the overall consolidation of results, that is 5% (20x5 =100). Criteria can be hard data, which analyze competitiveness as it can be measured (e.g. GDP) or soft data, which analyze competitiveness as it can be perceived (e.g. Availability of competent managers). Hard criteria represent a weight of 2/3 in the overall ranking whereas the survey data represent a weight of 1/3. Some criteria are for background information only, which means that they are not used in calculating the overall competitiveness ranking (e.g. Population under 15). Aggregating the results of the 20 sub-factors makes the total consolidation, which leads to the overall ranking of the WCY.17 The Business Competitiveness Index (BCI) was developed by Michael Porter. It ranks countries by their microeconomic competitiveness, identifies competitive strengths and weaknesses in terms of countries’ business environment conditions and company operations and strategies, and provides an assessment of the sustainability of countries’ current levels of prosperity. It is stated that the BCI explains more than 80 percent of the variation of GDP per capita across the wide sample of countries covered, a confirmation of the critical importance of microeconomic factors for prosperity. This shows that the BCI complements the GCI in an important way.
17 For more detail, see: http://www.imd.ch/research/publications/wcy/competitiveness_scoreboard.cfm?bhcp=1

93
6.2 An example analysis for energy technology In chapter 3 we examined how the general systems indicators may be adapted for eco-innovation. Below we will give an example analysis for (alternative) energy technology undertaken by Riso researchers Per Dannemand Andersen, Mads Borup, and Måns Molin for Europe, with special attention to wind energy in Denmark. The following indicators are used: exports, market shares, share prices, job creation and innovation system indicators. Exports Europe is a net importer of energy (which is related to the security-of-supply issue) but a net exporter of energy technologies. According to an analysis by the Danish Energy Authority and Statistics Denmark, the export from the EU (extra EU-15) of energy technology and energy equipment increased from 42.2 bn€ in 1996 to 92.6bn€ in 2006. The import (extra EU-15) has increased over the same period from 20.9 bn€ to 47.3 bn€. This leaves EU-15 with a net export of energy technology in the order of 45.5 bn€ in 200618. Germany accounted for approximately 40% of the EU-15 total, and Italy is the second biggest exporter. Energy technologies on average accounted for a little more than 5 % of the total export of the EU-15 countries (including mutual trade). See figure 18. For countries like Italy and Denmark energy technologies amount to almost 8% of total exports. For Denmark the export of oil and gas amounts to a similar percentage. Furthermore, both Denmark and Italy have experienced a significant growth in the export of energy technologies in the period 2004-2005. At the other end of the scale is Ireland with a very low export of energy technologies and even a declining rate during 2004-05. Also Belgium/Luxembourg, Spain and Portugal seem to fall further behind the EU average. On the other hand the Netherlands and partly the UK are catching up. No data are yet available on the distribution of this export over different energy technologies.
18 Data made available from Danish Energy Authority and Statistics Denmark, 2007.
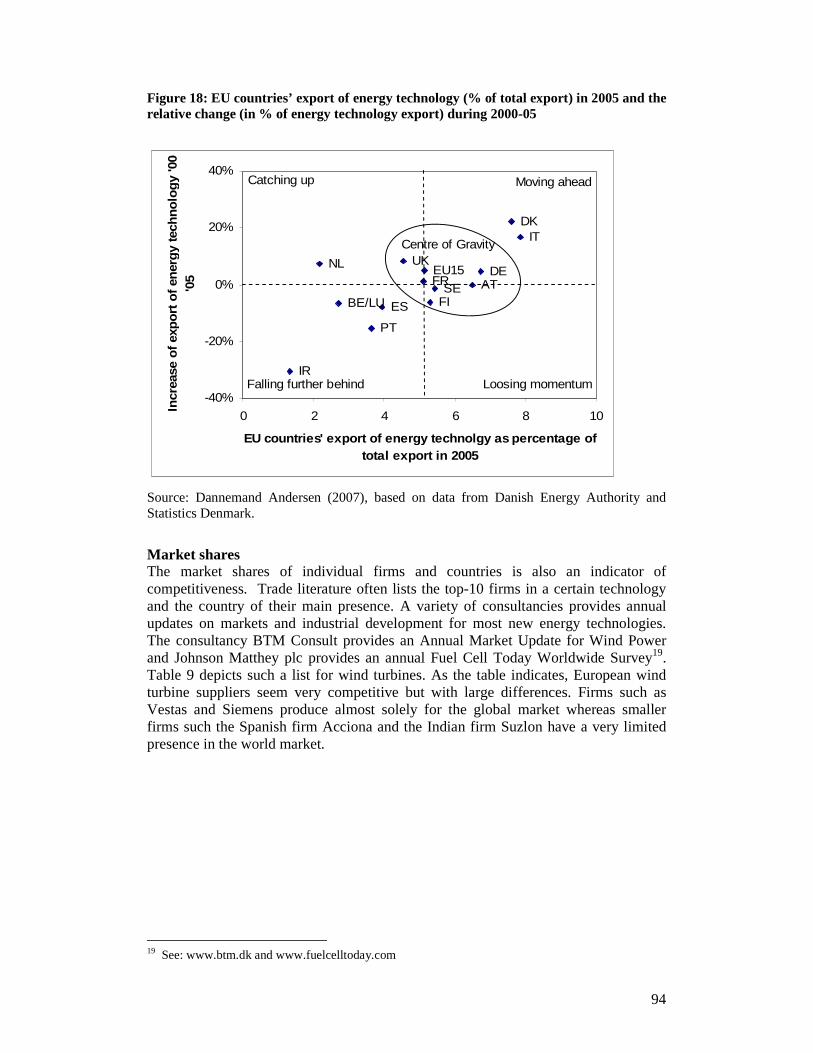
94
Figure 18: EU countries’ export of energy technology (% of total export) in 2005 and the relative change (in % of energy technology export) during 2000-05
SE
NL
IR
UK
AT
ITDK
PT
ESBE/LU
DE
FI
FREU15
-40%
-20%
0%
20%
40%
0 2 4 6 8 10
EU countries' export of energy technolgy as percent age of total export in 2005
Incr
ease
of e
xpor
t of e
nerg
y te
chno
logy
'00-
'05
Loosing momentumFalling further behind
Centre of Gravity
Moving aheadCatching up
Source: Dannemand Andersen (2007), based on data from Danish Energy Authority and Statistics Denmark.
Market shares The market shares of individual firms and countries is also an indicator of competitiveness. Trade literature often lists the top-10 firms in a certain technology and the country of their main presence. A variety of consultancies provides annual updates on markets and industrial development for most new energy technologies. The consultancy BTM Consult provides an Annual Market Update for Wind Power and Johnson Matthey plc provides an annual Fuel Cell Today Worldwide Survey19. Table 9 depicts such a list for wind turbines. As the table indicates, European wind turbine suppliers seem very competitive but with large differences. Firms such as Vestas and Siemens produce almost solely for the global market whereas smaller firms such the Spanish firm Acciona and the Indian firm Suzlon have a very limited presence in the world market.
19 See: www.btm.dk and www.fuelcelltoday.com

95
Table 9: Market shares of 10 leading wind turbine suppliers Firm name
Country of main presence
Market share in 2006 in MW
Market share in 2006 in %
Export in 2006 in MW
Export share in 2006 of total production
Vestas Denmark 4339 28.2 4228 99.7 Gamesa Spain 2346 15.6 1385 59.0 GE Wind US 2326 15.5 1205 51.8 Enercon Germany 2316 15.4 1461 63.1 Suzlon India 1157 7.7 227 19.7 Siemens Denmark 1103 7.3 1103 100.0 Nordex Germany 505 3.4 400 79.1 Repower Germany 480 3.2 281 58.5 Acciona Spain 426 2.8 53 12.3 Goldwind P. R. China 416 2.8 0 0 Others 689 4.6 Total 16006 107
Source: BTM Consult, 2007. For technical reasons (explained in the source) the totals amounts to more than 100%.
A problem here is, of course, the increasing internationalization of industrial production, which makes it difficult to define the nationality of large firms. Share prices The development of share prices at the stock market is a related indicator. Share prices reflect perhaps more the market expectations of future competitiveness than competitiveness today. Wind turbine manufacturers such as Vestas Wind System A/S (Denmark), Suzlon (India), Nordex AG (Germany) and Gamesa Eolica (Spain) are independently listed at international or national stock exchanges. Other firms such as GE Wind (USA) and Siemens Wind Power (Denmark and Germany) are fully owned subsidiaries of large engineering conglomerates and their performance and competitiveness within the wind power sector is overshadowed by these conglomerates’ general performance. For privately owned firms or firms with no publicly traded shares, such as Enercon GmbH (Germany), share prices are also difficult to estimate. Job creation As job creation is high on the political agenda in many countries several energy technology action plans and roadmaps have considered the employment effects of increased use of the technology in question. As an example, the European Wind Energy Association expects that up to 368,000 jobs will be created in the EU between 2000 and 2020, assuming that wind power is expanded to provide 15% of the Union’s demand for electrical power by 2020. Other industry organizations have put up similar figures. From a macro economic viewpoint job creation is not in it self an aim for governmentl science and innovation policy. Macro economists put more focus on improvements of the productivity of a sector or a nation.

96
Innovation System Indicators In the context of the European Environmental Technologies Action Plan (EU ETAP) a variety of investigations have been carried out on the concept of “eco-innovation” and indicators for this20. Researchers at Riso who were engaged in this type of research used the innovation system model, which they operationalised as follows:
1) Knowledge creation a. Governmental R&D expenditures b. Private R&D expenditures c. Publications, citations and patents
2) Actors (industry, markets, institutions) a. Venture capital and IPO Value b. Markets size and market growth rates
3) Actors’ mutual interaction a. Co-authoring and co-patenting b. Joint R&D - participation in governmental (or international) R&D
programmes c. Tech-trans schemes
Governmental R&D expenditures for energy This relates to governmental expenditures for energy related research and development within an area of energy technology. Government expenditures can be found in IEA Energy Technology R&D Statistics that are based on information from the individual IEA member countries21. The quality of these data can be questioned but it is the best available today. Data are available since the 1970s for most energy technologies. For several newer energy technologies, such as fuel cells and hydrogen, data have only been included since 2004. An important note is that only OECD/IEA members contribute to these statistics. Countries such as China, India, Russia and Brazil are not included in the figures. Especially, within recent years quite an effort has been made in energy related R&D in these countries. In figure 19 governmental R&D expenditures for wind energy in the period 1996-2005 are used. Private R&D expenditures for energy Several studies have tried to assess private sector (firms’) expenditures on energy related research and development but accessibility of comparable data is usually a prohibitive fact. One such study is the EU FW6 project SRS NET & EEE (Scientific Reference System on new energy technologies, energy end-use efficiency, and energy RTD). As the project is ongoing no results are yet available. Publications, citations and patents in energy technology The number of publications and citations within an area of energy technology can be extracted from different databases. Such bibliometrics offer an easily accessible and well described (and often criticized) indicator. Patents are also a relatively accessible indicator. But the problem of defining search words is common to both bibliometric and patent data. Experts from the field of science and technology in question must be involved in the process of defining adequate search words. Bibliometric searches are usually carried out in the Science Citation Index and the Derwent World Patents
20 Andersen, M. M.: Eco-Innovation Indicators. European Environment Agency, Copenhagen, February 2006. 21 On-line access via: http://www.iea.org/Textbase/stats/rd.asp

97
Index, both of which are hosted online via STN International. In figure 19, indicators for wind power, the following search words were used:
• Science citation index: wind power(5w)plant? or wind(5w) turbine? • Derwent world patents index: wind power(5w)plant? or wind(5w) turbine?
Values comprise a time span of 1996-2006. Venture capital and IPO Value Venture capital attracted to an area of technology is also an interesting indicator but again accessibility of comparable data is a problem. A recent report from the consultancy New Energy Finance has analysed issues such as venture capital, private equity, incubators and investments funds in the area of sustainable energy22. The IPO value in the energy technology area boomed in 2006 with an increased of 156% measured at a global level23. Solar energy and bio fuels are the primary driving areas in this (Lux Research 2007). In Denmark, venture capital investments in renewable energy and other eco-innovation areas have developed from being almost invisible in the general picture of the venture area in the late 1990s to accounting for 7% of the investments in 2006 (Vækstfonden 2007). Venture capital and IPO value might also count as an indicator of firms’ or sectors’ competitiveness or at least as the market’s expectation of future competitiveness. Market size and market growth rates While several market indicators are mentioned in literature, in this context we will focus on only one indicator: market size and market growth rates. For most energy producing technologies trade literature lists cumulated installations in MW and installations in the most recent year. Information like this is usually available and can be broken down between countries and regions. Markets can be broken down into two types: energy markets (e.g. bio ethanol) and technology markets (e.g. equipment or plants for producing bio ethanol). From an energy technology perspective the latter, of course, is the most important – provided the data are available. In figure 19 the cumulated installed capacity in GW by the end of 2006 is used as an indicator for market sizes for wind turbines. Additional annual installations could also be used as an indicator.
22 http://www.unep.org/pdf/SEFI_report-GlobalTrendsInSustainableEnergyInverstment07.pdf 23 Initial Public Offering (IPO) is the first sale of stock by a private company to the public.

98
Figure 19: Example of overview indicators for wind energy technology 24
0%
20%
40%
60%
80%
100%
Paper
s (No.)
Citatio
ns (N
o.)
Paten
ts (N
o.)
Gov. R
&D (M€)
Insta
llatio
ns (G
W)
Man
ufac
turin
g
No data
ROW
USA
Japan
EU
Source: Dannemand Andersen (2007)
Interaction between actors Indicators for interactions between actors are difficult to find within traditional statistical accounts. Concerning knowledge production, bibliometric indicators such as co-authoring and co-patenting in the future might be developed as useful tools. Useful information about joint (science and industry) research projects can be drawn from databases over projects within public R&D programmes (e.g. EU Framework programmes or national programmes). The table below is an example of some of the results from an investigation of this in Danish energy R&D programmes. It shows that there are significant differences in the patterns of public-private co-operation within different areas of energy technology. A considerably larger share of projects in the wind energy area than in the area of hydrogen technology includes co-operation between industrial companies and public research institutions. However, there is a larger share of other kinds of public-private co-operation in the hydrogen area than in the wind area. This can be, for example, joint projects between private technology developers and regional authorities. Table 10: Share of projects within the national energy R&D programmes that involve co-operation between actors of different types Co-operation
between business and public research
Other public-private co-operation
Other co-operation across actor types
Total (N)
Hydrogen 36% 16% 9% 44
Wind 57% 2% 15% 46
Source: Borup et al ( 2007) 24 Indicators for wind energy technology. Installations refer to cumulated installations of wind turbines in GW and manufacturing refers to home country of leading wind turbine manufacturers.
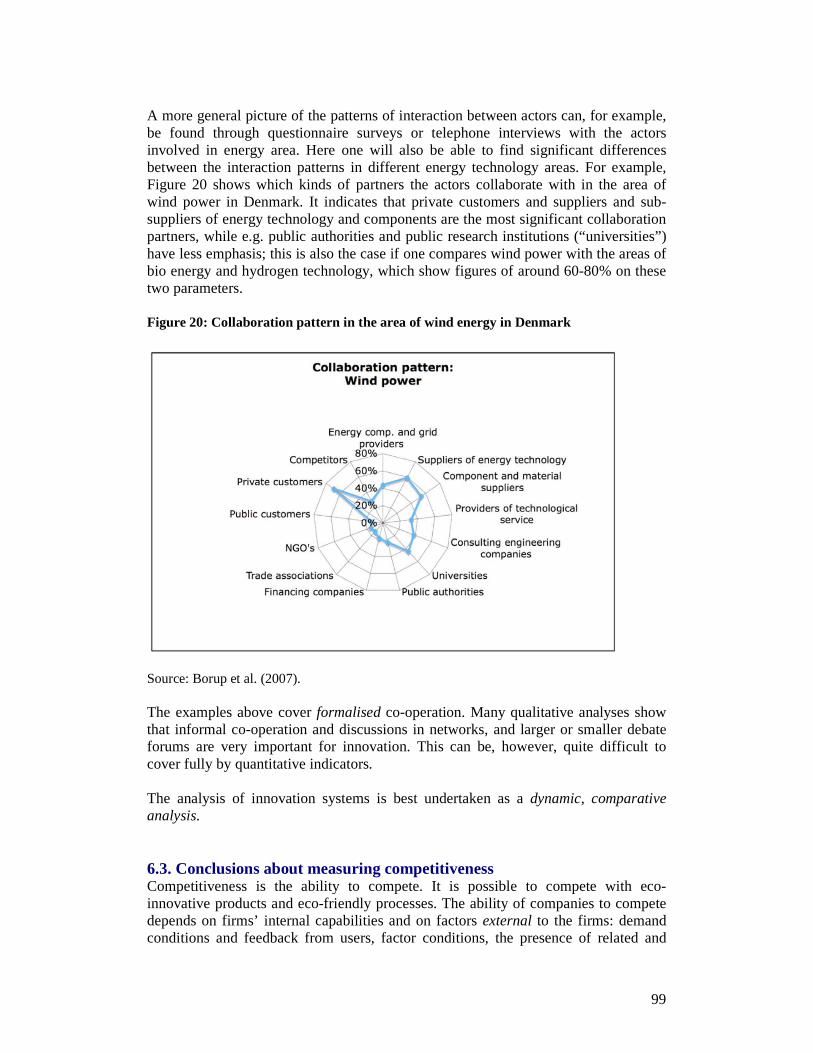
99
A more general picture of the patterns of interaction between actors can, for example, be found through questionnaire surveys or telephone interviews with the actors involved in energy area. Here one will also be able to find significant differences between the interaction patterns in different energy technology areas. For example, Figure 20 shows which kinds of partners the actors collaborate with in the area of wind power in Denmark. It indicates that private customers and suppliers and sub-suppliers of energy technology and components are the most significant collaboration partners, while e.g. public authorities and public research institutions (“universities”) have less emphasis; this is also the case if one compares wind power with the areas of bio energy and hydrogen technology, which show figures of around 60-80% on these two parameters. Figure 20: Collaboration pattern in the area of wind energy in Denmark
Source: Borup et al. (2007). The examples above cover formalised co-operation. Many qualitative analyses show that informal co-operation and discussions in networks, and larger or smaller debate forums are very important for innovation. This can be, however, quite difficult to cover fully by quantitative indicators. The analysis of innovation systems is best undertaken as a dynamic, comparative analysis. 6.3. Conclusions about measuring competitiveness Competitiveness is the ability to compete. It is possible to compete with eco-innovative products and eco-friendly processes. The ability of companies to compete depends on firms’ internal capabilities and on factors external to the firms: demand conditions and feedback from users, factor conditions, the presence of related and

100
supported industries, rivalry (market power of companies) and the national system of innovation (education, skills, intellectual property right protection right and so on). For measuring the competitiveness of sectors, different measures may be used. As discussed, the competitiveness may be measured on the basis of trade performance, costs differences, productivity differences. Of these, relative trade performance (whether a nation exports relatively much compared to other nations) is the best measure. For assessing future competitiveness we may use data on innovation expenditures, R&D, business start ups, and relative patent advantages (RPA). None of these is a reliable predictor because future competitiveness also depends on institutions, infrastructure, education, the macroeconomy, regulation, education and other factors. The quality of these can be measured through the Global Competitiveness Index, the Business Competitiveness Index) and the Competitiveness Scoreboard. Of course, one does not know future values and it is entirely possible that special institutions and infrastructures are needed for a new type of development.
For assessing (future) competitiveness one should not focus on single measures, but combine different measures. In general costs and prices are not good measures because there may be important quality aspects which they do not indicate. The revealed comparative advantage (RCA), which is often used, is a better measure for competitiveness. But this is not a perfect measure either because it partly reflects international specialisation. One should thus look beyond RCA. Germany has a flourishing solar and wind power industry, thanks to its feed-in law. But because of the feed-in law German consumers and industry are paying more for electricity than they otherwise would. The higher electricity costs may hamper the competitiveness of other sectors, especially of electricity-intensive sectors (unless these have found ways to reduce their electricity intensity but there may be a cost involved in that as well). Both effects are difficult to estimate precisely; the only reliable method of estimation would be the application of a computable general equilibrium model.
A clear problem for assessing competitiveness is that eco-innovation is not an official category in trade statistics. We have sales information from companies selling certain products but such information is not collected systematically across the EU. As noted, interesting work has been done by Legler and colleagues for so-called potential environmental goods (Legler et al. (2007)). They have calculated RCA and RPA values for product categories which contain a fair share of environmental goods and services. From the CIS it is possible to infer how eco-innovative firms are innovating (through technology adoption or technology modification or development). The results show that the profile of eco-innovators is actually very close to the EU average. Concerning competitiveness the CIS provides information on the scope of a firm’s market (local, national or international), patent activities (question if the firm applied for a patent) and labour productivity (turnover per employee). Just as the measurement of eco-innovation calls for the use of different measures, so does the measurement of competitiveness. Micro-competitiveness depends on macro-

101
factors and product market conditions. The study of competitiveness calls for a multilayered analysis involving different statistics.

102
7. Conclusions Eco-innovation is a broad concept comprising many innovations. The typology of MEI may prove helpful here in categorizing these and in creating information for each of them. According to the experts in MEI, eco-innovation research and data collection should not be limited to products from the environmental goods and services sector or to environmentally motivated innovations but should cover all innovations with an environmental benefit.
This has led us to a definition of eco-innovation in which environmental performance instead of environmental aim is the main determinant. From our definition it follows that anything could be an eco-innovative solution as long as it is more environmentally benign than “the relevant alternative”. The relevant alternative may be the technology that is in use in a company or the normal technology in a sector (gas or coal burning stations in the case of electricity generation). Innovations in coal burning technology qualify as eco-innovation, for example, if they reduce emissions. Eco-innovation does not have to be the most environmentally benign option. It is a relative concept. The second thing that follows from this is that the term “eco-innovation” crucially depends on an overall assessment of environmental effects and risks. For this, life cycle assessment based on multi-attribute value theory can be used. Nanotechnology and biotechnology are potential eco-innovations.
Measuring technological change presents a common and well-known problem for innovation output research. In practice, four different types of measures have been used to quantify technological change:
• Input measures: R&D expenditures, R&D personnel, researchers, and innovation
expenditures (with and without intangible investment such as design expenditures and software and marketing costs);
• Intermediate output measures: the number of patents; numbers and types of scientific publications
• Direct measures of innovative output: the number of innovations, descriptions of individual innovations, data on sales of new products
• Indirect measures derived from aggregate data: changes in resource efficiency and productivity using decomposition analysis.
Each measure has its own disadvantages and is subject to a particular kind of bias. Input measures like R&D reflect only the resources devoted to producing the innovative output, not the amount of innovative output actually realised. R&D measures also tend to incorporate efforts made to generate innovative activity that are undertaken in a formal way, typically within formal R&D laboratories. They underestimate the innovative work in smaller firms, which is often done on a more informal basis. Another disadvantage of R&D expenditures is that they do not tell us anything about the nature of the innovations that are produced and about the social value of the innovations. Patents are the most commonly used indicator for innovation output. A clear limitation is that patents measure inventive rather than innovative output. Furthermore, not all innovations are patented. One reason for not patenting an invention is that the information contained in the invention becomes available to

103
imitators. An advantage of patents is that they can be counted. They also can be classified according to technological area, sector of use/origin, and innovation property because the patent files contain a description of the invention. The technical significance of a patent is difficult to assess from patent files (although the description may give an idea of this); one way around this problem is to look at patent citations. A significant patent is likely to be cited more often. A third possibility is direct measurement of innovation output using documentary and digital sources. The advantage is that they measure innovation output rather than innovation inputs (such as R&D expenditures) or an intermediate output measure (such as patent grants). Little use has been made of this method, primarily because of a lack of funding and absence of product databases with environmental information. Environmental reporting requirements may help to create relevant information, aiding innovation research. Innovation may also be measured indirectly from changes in resource efficiency and productivity.
Although some methods are better than others, no single method or indicator is ideal. One should apply different methods for analyzing eco-innovation – to see the whole elephant, instead of just a part. 25
This cautions against the use of one popular method for measuring eco-innovation: patent analysis. As explained, patents are a measure for invention not innovation,
25 The synthesis report discusses possibilities for combining different innovation measures (input indicators and output indicators, direct and indirect measures).

104
many patents have a low value (the majority is not used), and they mainly measure inventions that underlie green product innovations and end of pipe technologies, whose environmental impacts are specific aims and motivations of the inventions. In general the knowledge base for eco-innovation is poor. One reason for this is that eco-innovation is not an official sector. It would be helpful if it became one. Eurostat is currently drafting a compilation guide for collecting statistics on the Environmental Goods and Services Sector (EGSS), so they are also in the process of defining the sector from the activities viewpoint (the NACE codes). They have defined a “core” industry group (NACE 25.12, 37, 41, 51.57 and 90), but the much larger “non-core” group of industries is yet to be defined. But as explained, eco-innovation is best understood as something broader than products and services from the EGSS. The next Community Innovation Survey (CIS2008) will have a special module on eco-innovation, which in 2010 will produce important information about the nature of eco-innovation and its determinants. MEI researchers contributed to the formulation of the questions. A limitation remains that the CIS only provides general information for the company as a whole. It does not give information about specific technologies or products. Research needs are various. One area for future research is the macro-effects of micro-behaviour. Eco-improvements at the micro level do not automatically lead to macro-improvements. The links between micro and macro are complex for the following reasons:
• Cost-saving eco-innovations generate wealth that will be spent on goods and services that have negative environmental impacts, creating an environmental burden in a second round. Prime examples are the use of energy-saving lights for outdoor lighting and holiday trips involving air travel (rebound effect)
• Cost-increasing eco-innovations are likely to contribute more to an absolute decoupling but at the expense of lower economic growth. Exports yield a positive economic effect (this suggests that there is still an important role for pollution control technology (end-of-pipe solutions) to achieve an absolute decoupling)
• Many normal innovations qualify as eco-innovations (by being more environmentally benign than relevant alternatives), but environmental gains will be impaired by economic growth produced by those innovations.
• To assess the impacts of eco-innovation one should look at what happens within and across value chains from resource extraction to waste management.
• Micro-behaviour is affected by macro-factors (taxes etc.) Other topics for research are:
• Measuring the greenness of national systems of innovation (green taxes, education, collaboration, venture capital, subsidy schemes, …)
• Eco-innovation barometer focusing on company beliefs relating to environmental issues (cost or opportunity), environmental strategies, eco-innovation activities and green values
• Lead markets and eco-business (about first mover and second-mover advantages and the role of policy)
• Drivers and institutional barriers of eco-innovation in the field of renewable energies (a comparative study across the EU, based on survey analysis).

105
• Appraisal of environmental technology innovation systems: competitiveness assessment and Life cycle analysis
• Analysis of national road maps of ETAP, identifying best practices and using these for defining comprehensive policy packages which promote and sustain innovative activity across the chain.
• Analysis of CIS data about eco-innovation aspects, combined with analysis of framework conditions (assessed outside CIS)
• Analysis of when eco-innovation produces a win-win.

106
Appendix: summary findings about methods for analysis of eco-innovation Method of analysis
Studies of eco-innovation using this method
Indicators Purposes Limitations Possible ways for overcoming limitations
Possibilities for combination with other indicators and methods and suggestions for data collection
Patent analysis
Brunnermeier, Cohen (2003) Lanjouw and Mody (1996), Popp (2001, 2003, 2005), Marinova and McAleer (2003), Nameroff et al (2004), De Vries and Withagen (2005), Verspagen (2005) Oltra and St Jean (2006, 2007) Important general studies on patents are: Griliches (1990) and Arundel and Kabla (1998)
Patent counts, citations
To measure rate and direction of invention, which can be mapped and can be related to possible determinants such as prices, environmental regulation and other types of policy (through econometric analysis). Patents may also be used to determine spillover effects, to monitor diffusion and to determine relative strength/specialization of nations in certain technology areas. Patents allow for comparative analysis across nations for technologies, …
Many innovations are not patented (they may not be based on an invention); many patents do not result in innovations; value of patent differs greatly; identification of eco-patents depends critically on search terms; only suited for technological innovations, primarily end-of-pipe technologies and alternative energy technologies are readily identifiable in patent descriptions; propensity to patent differs between sectors and also between companies (smaller companies tend to patent less, unless they have patent experience).
Careful reading of patent abstracts helps to determine whether a patent is an eco-patent or not. Value of patents can be ascertained through citations (for older patents) and by consulting industry technology experts; patents that are not used should be eliminated from the innovation study (they may be relevant however for a study on invention). The propensity to patent should be taken into account.
One could contact inventors and ask questions about the patents (for example to what extent they are spurred by specific regulations, the economic gains for the inventor, etc.); comparison with innovation output indicators helps to assess the relevance of patents as a measure for innovation The official database of the European Patent Office is subject to several limitations. Main barriers concern the number of keywords and IPC codes that can be included in a single research (no more than 5). One can maximally retrieve 500 patents. It is proposed to make the database more user friendly.

107
Method of analysis
Studies of eco-innovation using this method
Indicators Purposes Limitations Possible ways for overcoming limitations
Possibilities for combination with other indicators and methods and suggestions for data collection
Survey analysis
Henriques, Sadorsky (1996) Cleff, Rennings (1999), Hemmelskamp (1999) Rennings, Zwick (2002) Gray, Shadbegian (2003) Frondel, Horbach, Rennings (2005) Gonzalez (2005) Horbach (2006) Mazzanti, Zoboli (2006) Rehfeld, Rennings, Ziegler (2007), Arimura, Hibiki, Johnstone (2007)
Existence of a budget specifically related to environmental R&D, R&D expenditures, total innovation expenditures, In the last three years, did your establishment introduce (always yes or no): any pollution control technologies; recycling programmes; new or improved products or services that are more environmentally-friendly than those already on the market; new or improved processes with environmental benefits; organisational innovations such as environmental reports, audits, or management programmes; new or improved delivery, transport, or distribution systems for its products or services, with environmental benefits Environmental impacts of innovation activities
Detecting the character of eco-innovation by many different indicators that can be easily linked with a broad scale of control variables such as the environmental policy framework, the influence of stakeholders and motivations on eco-innovation, firm-level attributes, commercial conditions The inclusion of these variables allows the application of sophisticated econometric methods The results of these analyses can be used for the amelioration of environmental policy instruments
Most of the surveys are only point in time sources so that the dynamic character of eco-innovation can not be addressed. On the other hand, especially panel data surveys for eco-innovation purposes are too expensive Low response rates concerning quantitative variables, resulting in high non-response errors Lack of “hard” information, the analysis of the self-perception of the questioned firms may be misleading
Use of general panel innovation surveys and adding questions on eco-innovation Use of qualitative variables Comparison of the plausibility of survey results with other eco-innovation sources
Suggestion to enlarge the CIS by two additional questions on eco-innovation Joining different sources, e.g. the combination of the Mannheim Innovation Survey with a list of suppliers of environmental goods and services Adding further information from official statistics to survey data

108
Method of analysis
Studies of eco-innovation using this method
Indicators Purposes Limitations Possible ways for overcoming limitations
Possibilities for combination with other indicators and methods and suggestions for data collection
Document and digital source analysis
Huber (2004) Newell et al (1999)
Shares of end-of-pipe and integrated solutions Shares according to primary production or base products, material processing and intermetidate products, final productions and end products, user behaviour, consumer practices Shares of technological eco-innovation according to stage or life cycle (using categories which relate to absolute versus relative decoupling) (Huber, 2004) Evolution of techno-economic characteristics of product models: purchase prices and energy efficiency (Newell et al., 1999)
To determine the nature of innovation and evolution of relevant performance characteristics of actual innovations It is possible to determine novelty and functionality of the innovation, time of market entry and organisational source Time series analysis based on product performance may be used to determine the influence of public policies vis-à-vis other variables such as energy prices One of the merits is that it becomes possible to assess the actual contribution of research expenditure or patenting activity to innovation performance. It would also enable the more systematic exploration of other dimensions of the innovation process such as the role of users, open innovation processes and non R&D based knowledge inputs.
There is no universal source of such information; it needs to be aggregated from various sources and interpreted with some expertise Labour intensive to identify relevant innovations and scrutinise the performance characteristics Commensurability problem
Labelling and product information requirements (an example is the Council Directive 92/75/EEC) To construct a ‘basket’ of eco-innovation indicators with sufficienty wide coverage (from incremental eco-efficiency improvements to radical transformative innovations) Use of digital source analysis makes it less labour intensitve
Innovation output data may be usefully combined with patent data and data about R&D expenditures This way we may assess the usefulness of patent data and R&D data for measuring innovation and determine the actual contribution from such activities

109
Annex II. List of Business data bases INTERNATIONAL BUSINESS DATABASES
Asia yellow web
http://www.yellow-web.com
Free access: ����
Business Directory Singapore and Asia Pacific companies
Bizweb
http://www.bizweb.com/
Free access: ����
Directory
Is a Web business guide to 46290 companies listed in 208 categories
Bureau van Dijk
http://www.bvdep.com/
Free access: ����
(Priced service with free directory search.)
Directory. (Information for public and private companies in Europe, US,
Japanese…)
Companies
Dun & Bradstreet
http://smallbusiness.dnb.com/
Free access: ����
Directory.
Business database.
Companies.
Information for credit, marketing, and purchasing decisions.
Factiva
http://www.factiva.com/
Free access: ����
Articles (full text news & magazines).
Data (stocks)
Companies, Industries, Investment, Management
GlobalSpec
http://www.globalspec.com/
Free access: ����
Directory of companies, technical articles,
engineering and scientific links…
For the engineering, industrial and technical
communities.

110
Hoover’s Online
http://www.hoovers.com
Free access: ����
Directory
Companies
Infobel
http://www.infobel.com/
Free access: ����
Directory.
Companies and people
Kompass
http://www.kompass.com
Free access: ���� and ����
Directory
Industrial and commercial companies (Norway, Poland, Portugal, Romania, Russian
Federation, San Marino, Saudi Arabia…)
Skyminder
www.skyminder.com
Free access: ����
Directory.
Credit and financial information on companies world-wide from a variety of sources.
Companies
Thomas Register
www.thomasnet.com/
Free access: ����
American Directory Thomas Register of American Manufacturers
Resource for finding information on suppliers of industrial products and services in North America
Thomson Corporation
www.thomson.com
Free access: �
Directory
Companies

111
EUROPEAN BUSINESS DATABASES
AMADEUS
http://www.bvdep.com/en/amadeus.html
Free access: �
European database containing financial information
European companies (10 million public and private companies in 38
European countries)
Bureau van Dijk
http://www.bvdep.com/
Free access: �
(Priced service but directory search is free.)
The services containing detailed information for: 6 million public and
private companies in Europe
European companies
Company-World .CO.UK
European Companies directory
http://company-world.co.uk/companies/Europe/Europe_comp
anies.html
Free access: �
Directory
European companies
Danish Exporters
http://www.danishexporters.dk
Free access: �
Directory
Danish companies (Basic information)
Europages
http://www.europages.com/
Free access: �
European Business Directory yellow
pages
900,000 European companies (Basic information)
European yellow pages directory http://www.euroyellowpages.com
Free access: ����

112
European Interactive Directories
European companies (From Europages Directory)
(Basic information)
ICC www.icc.co.uk
Free access: �
The ICC web site offers access to Juniper, which now provides access to information and
financial data on over 22 million European companies in UK, Ireland, France, Germany,
Italy, Netherlands, Denmark, Belgium, Austria and Spain.
European companies

113
References Andersen, Maj Munch: Eco-Innovation Indicators. Background paper for the workshop on eco-innovation indicators EEA. Copenhagen, September 29 2005. Risø National Laboratory www.risoe.dk/rispubl/art/2006_116_paper.pdf Arnold, E. & Kuhlman, S. 2001, RCN in the Norwegian Research and Innovation System, Technopolis, Brighton. Arundel, A. (2000) Patents the Viagra of Innovation Policy, internal report for project “Innovation Policy in a Knowledge-Based Economy” commissioned by the European Commission. Arundel A. (2005) Lessons from innovation indicators: What can we ask in a survey? MERIT, The Netherlands Barker, T., Köhler, J. (1998), Equity and Ecotax Reform in the EU: Achieving a 10 per cent Reduction in CO2 Emissions Using Excise Duties. Fiscal Studies 19, 375–402. Barker, T., Pan, H., Köhler, J., Warren, R., Winne, S. (2006), Decarbonizing the Global Economy with Induced Technological Change: Scenarios to 2100 using E3MG. The Energy Journal, Special Issue: Endogenous Technological Change and the Economics of Atmospheric Stabilisation, 241–258. Bolli, A, Emtairah, T. (2001) Environmental benchmarking for local authorities: From concept to practice. International Institute for Industrial Environmental Economics Lund University, Sweden. Bourdieu, P. 1986, "The Forms of Capital" in The Handbook of Theory: Research for the Sociology of Education, ed. J.G. Richardson, Greenwood Press, New York, pp. 241-258. Breschi S., Lissoni F. and Malerla F., (2003) « Knowledge-relatedness in firm technological diversification, Research Policy, Vol.32, pp.69-87. Brouwer E. and Kleinknecht A. (1999), “Innovative output and firms propensity to patent. An empirical investigation”, Research Policy, Vol.28, pp.615-624. Bruno, N., Miedzinski, M., Reid, A. & Ruiz Yaniz, M. 2008, Socio-Cultural Determinants of Eco-Innovation, Report edn, Unpublished. Borup, Mads; Birgitte Gregersen; Anne Nygaard Madsen, 2007: Development dynamics and conditions for new energy technology seen in an innovation system perspective, DRUID Summer Conference, Copenhagen 2007 Crépon B., E. Duguet et J.Mairesse (2000), "Mesurer le rendement de l’innovation" Economie et Statistique, n° 334, pp.65-78. Dannemand Andersen, Per (2007): Innovation indicators and future options. In: H. Larsen & L. S. Petersen, Risø Energy Report 6, Future options for energy technologies, Risø-R-1612(EN) ISBN 978-87-550-3611-6. De Vries, F., and C. Withagen (2005) Innovation and Environmental Stringency: The Case of Sulfur Dioxide Abatement, CentER discussion paper 2005-18, Tilburg.

114
EC 2002, 2002 European Innovation Scoreboard: Technical Paper No 4. Indicators and Definitions, Office for Official Publications of the European Communities., Luxembourg. Edquist, C. & Johnson, B. 1997, "Institutions and organisations in systems of innovation" in Systems of innovation: Institutions and organisations, ed. C. Edquist, Pinter, London, pp. 41-63. Engelsman E.C. and Van Raan A.F.J. (1991), “Mapping of Technology, A First Exploration of Knowledge Diffusion Amongst Fields of Technology”, Report to the Netherlands Ministry of Economic Affairs (1991) published in the Policy Studies on Technology and Economy (BTE) Series, Nr. 15 (ISSN 0923-3164), The Hague. Engelsman E.C. and Van Raan A.F.J. (1994), “A patent-based cartography of technology”, Research Policy, Vol.23(1), pp.1-26.
Ernst and Young (2006) “Eco-industry, its size, employment, perspectives and barriers to growth in an enlarged EU”, report for DG Environment of European Commission
EU Commission, European innovation scoreboard 2001, SEC (2001) 1414 - 14.09.2001
EU Commission, European innovation scoreboard 2002, SEC (2002) 1349 - 9.12.2002
EU Commission, Innovation in a knowledge-driven economy, COM (2000) 567 final - 20.09.2000
EU Commission (2002), Report on Research and Development, EC Economic Policy Committee Working group on R&D, EPC/ECFIN/01/777-EN Final, Brussels, January 2002
European Commission (2002), Structural Indicators. COM(2002) 551 final, Brussels.
EU Commission, Innovation policy: updating the Union's approach in the context of the Lisbon strategy, Communication from the Commission COM (2003) 112 final - 11.3.2003
European Commission (2003) Innovation policy: updating the Union's approach in the context of the Lisbon strategy, Communication from the Commission COM (2003) 112 final - 11.3.2003
EU Commission (2003): European Competitiveness Report 2003. European Commission (2004d), Stimulating Technologies for Sustainable Development: An Environmental Technologies Action Plan for the European Union. COM (2004) 38 final, Brussels.
EU Commission (2005): EU sectoral competitiveness indicators. European Commission (2005): ECOMMISSION REGULATION (EC) No 1719/2005 f 27 October 2005 amending Annex I to Council Regulation (EEC) No 2658/87 on the tariff and statistical nomenclature and on the Common Customs Tariff, Official Journal of the European Community, 18.10.2005, Brussels. European Commission DG Environment (2006) “Eco-industry, its size, employment, perspectives and barriers to growth in an enlarged EU”, report prepared by Ernst and Young, online : http://ec.europa.eu/environment/enveco/industry_employment/pdf/ecoindustry2006.pdf

115
Eurostat (2006a) Statistics in Focus. Science and Technology, 16/2006, Eurostat, Luxemburg. EUROSTAT (2006b): Statistics on the trading of goods – User guide, Luxembourg, online available: http://fd.comext.eurostat.cec.eu.int/xtweb/ EUROSTAT (2007): Draft Compilation guide on environmental sector version 5.1, Luxemburg, online: http://epp.eurostat.ec.europa.eu/portal/page?_pageid=2873,63643317,2873_63903025&_dad=portal&_schema=PORTAL Flor, M. L. and Oltra, M. J. (2004) Identification of innovating firms through technological innovation indicators: an application to the Spanish ceramic tile industry. Research Policy, 33, 323-336 Foster, R., N. 1986, Innovation: the attacker's advantage, First edn, Summit Books, New York. Foxon, T., Pearson, P., Makuch, Z. & Mata, M. 2005, Transforming policy processes to promote sustainable innovation: some guiding principles, Imperial College, London. Goulder, L.H., Schneider, S. (1999), Induced technological change and the attractiveness of CO2 abatement policies. Resource and Energy Economics, 21, 211–253. Goulder, L.H., Mathai, K. (2000), Optimal CO2 Abatement in the Presence of Induced Technological Change. Journal of Environmental Economics and Management 39, 1–38. Griliches, Z (1990), Patent Statistics as Economic Indicators: A Survey, Journal of Economic Literature 28: 1661-1707. Halstrick-Schwenk, M.; Horbach, J.; Löbbe, K.; Walter, J. (1994): Die umwelttechnische Industrie in der Bundesrepublik Deutschland, Halle. Hekkert, M.P., Suurs, R.A.A., Negro, S.O., Kuhlmann, S. & Smits, R.E.H.M. 2007, "Functions of innovation systems: A new approach for analysing technological change", Technological Forecasting and Social Change, vol. 74, no. 4, pp. 413-432. High Level Expert Group on RICARDIS,. 2006, RICARDIS: Reporting intellectual capital to augment research, development and innovation in SMEs: Encourage corporate measuring and reporting on research and other forms of intellectual capital, Report to the European Commission, Directorate-General for Research; Office for Official Publications of the European Communities [distributor], Luxembourg. Hitchens, D., J. Birnie and A. McGowan (1998): Investigating the relationship between company competitiveness and environmental regulation in European food processing: results of a matched firm comparison. Environment and Planning A 30: 1585- 1602. Hitchens, D., M. Trainor, J. Clausen, S. Thankappan, B. De Marchi (2002) Small and Medium-Sized Companies in Europe. Environmental Performance, Competitiveness and Management: International EU Case Studies, Springer, Berlin. Horbach, J. (1999): Umweltschutz und Wettbewerbsfähigkeit, in: Maußner, Alfred; Binder, Klaus Georg (Hg.), Ökonomie und Ökologie, Verlag Duncker & Humblot, Berlin, S. 403-431.

116
Horbach, J. (2008): Determinants of Environmental Innovation – New Evidence from German Panel Data Sources. In: Research Policy 37 (2008), 163-173. Horbach, J. & Rennings, K. 2007, (Panel-) Survey Analysis of Eco-Innovation: Possibilities and Propositions: Deliverable 4 & 5 of the MEI (Measuring Eco-Innovation Project, Report edn. Jacobsson, S. & Bergek, A. 2004, "Transforming the energy sector: the evolution of technological systems in renewable energy technology", Industrial and Corporate Change, vol. 13, no. 5, pp. 815-849. Jaffe, A.B., and K. Palmer (1997) ‘Environmental Regulation and Innovation. A Panel Data Study’, Review of Economics and Statistics 79: 610-619. Johnson, A. & Jacobsson, S. 2001, "Inducement and blocking mechanisms in the development of new industry: the case of renewable technology in Sweden" in Technology and the market. Demand, users and innovation, ed. R. Coombs, K. Green, A. Richards, V. Walsh, Edward Elgar, Cheltenham, pp. 89-111. Johnstone, N. (2005) Environmental Policy, Technological Innovation and Patent Activity: Initial Empirical Results and Project Progress, report of Working Party on National Environmental Policy, June 16-17, 2005, Washington D.C. Johnstone, N., 2007, Environmental policy and corporate behaviour, Edward Elgar/OECD, Cheltenham, UK; Northampton, MA. Joskow, P.L., Rose, N.L. (1985), The Effects of Technology Change, Experience, and Environmental Regulation on the Construction Cost of Coal-burning Generating Units. Rand Journal of Economics 16(1), 1119–1135. Kemp, René, and Maj Munch Andersen (2004) strategies for eco-efficiency innovation, report for informal environmental council of 16-18 July, 2004, Maastricht. Kline, S, Rosenberg, N (1986), ‘An overview of innovation’, in Landau R (ed.), The positive sum strategy: Harnessing technology for economic growth, pp. 275-306 Krugman, P. (1994): Competitiveness: A Dangerous Obsession. Foreign Affairs 73(2): 28- 44. Kleinknecht A., K. van Montfort, E. Brouwer (2002) ‘The non-trivial choice between innovation indicators’, Economics of Innovation and New Technologies, Vol. 11(2): 109 – 121. Kline, S.J. & Rosenberg, N. 1986, "An Overview of Innovation" in The Positive Sum Strategy, eds. R. Landau & N. Rosenberg, National Academic Press, Washington DC. Kouvaritakis, N., Soria, A., Isoard, S. (2000), Modelling energy technology dynamics: methodology for adaptive expectations models with learning by doing and learning by searching. International Journal of Global Energy Issues 14, 1–4. Kuhndt, Michael/ Liedtke, Christa (1999): COMPASS - Companies' and Sectors' Path to Sustainability - The Methodology. Wuppertal Paper No. 97. Wuppertal. Kuhndt, Michael/ Geiberl, Justus von/ Eckermann, André (2002): Developing a Sectoral Sustainability Indicator Set taking a Stakeholder Approach. A conceptual paper presented at

117
the 10th International Conference of the Greening of Industry Network 23-26 June, 2002, Göteborg, Sweden. Lanjouw, J.O., and A. Mody (1996) ‘Innovation and the International Diffusion of Environmentally Responsive Technology’, Research Policy 25: 549-571. Legler, H.; Krawczyk, O.; Rammer, C.; Löhlein, H.; Frietsch, R. (2007): Zur technologischen Leistungsfähigkeit der deutschen Umweltschutzwirtschaft im internationalen Vergleich, in: Bundesministerium für Bildung und Forschung (BMBF) (Ed.), Studien zum deutschen Innovationssystem Nr. 20-2007, Berlin. Löschel, A. (2002), Technological change in economic models of environmental policy: a survey. Ecological Economics 43, 105-126. Marinova, D. and McAleer, M. (2003a) ‘Environmental Technology Strengths: International Rankings based on US patent data’, http://ideas.repec.org/p/tky/fseres/2003cf204.html Marinova, D. and McAleer, M. (2003b) ‘Modelling trends and volatility in ecological patents in the USA’, Environmental Modelling and Software 18:195-203. Marinova, D. and McAleer, M. (2003c) Nanotechnology Strength Indicators: International Rankings Based on US patents, Nanotechnology 14, R1-R7. McDonald, A., Schrattenholzer, L. (2001), Learning rates for energy technologies. Energy Policy 29, 255–261. Messner, S. (1997), Endogenised Technological Learning in an Energy Systems Model. Journal of Evolutionary Economics 7, 291–313. Nameroff T.J., Garant R.J., Albert M.B. (2004) ‘Adoption of green chemistry: an analysis based on US patents’, Research Policy, Vol.33, pp. 959-974. Nelson, R (1993), National Systems of Innovation: A comparative analysis, Oxford University Press, New York Newell, R. G., Jaffe, A. B. and Stavins, R. N. (1999) The Induced Innovation Hypothesis and Energy-saving Technological Change, the Quarterly Journal of Economics, 114: 941-975. Nordhaus, W. (1994), Managing the Global Commons: The Economics of Climate Change. The MIT Press, Cambridge, Massachusetts. Nordhaus, W. (2002), Modeling Induced Innovation in Climate Change Policy. In: Technological Change and the Environment, edited by A. Grubler, N. Nakicenovic and W. Nordhaus, Washington, DC: Resources for the Future Press. OECD 1992, Technology and the economy the key relationships. Organisation for Economic Co-operation and Development, Paris. OECD (1996): Globalisation and Competitiveness: Relevant Indicators. STI Working papers 1996/5. OECD 1997, Oslo manual proposed guidelines for collecting and interpreting technological innovation data. Organisation for Economic Co-operation and Development : Statistical Office of the European Communities ; OECD Washington Center [distributor], Paris, France; Washington, D.C.

118
OECD (1998), Trends in OECD Countries’ International Competitiveness. The Influence of Emerging Market Economies, ECO/WKP(98)8. OECD (1999), Managing National Innovation Systems, OECD, Paris OECD 1999, Boosting innovation the cluster approach, OECD Publications, Paris. OECD (2000), Knowledge management in the Learning Society, OECD, Paris OECD (2001a), Innovative Clusters. Drivers of National Innovation Systems. OECD, Paris. OECD (2001b), Innovative Networks. Cooperation in National Innovation Systems. OECD, Paris. OECD (2000c): Measuring Productivity - Measurement of aggregate and industry- level productivity growth. OECD Manual. OECD 2002a, Frascati manual 2002 proposed standard practice for surveys on research and experimental development : the measurement of scientific and technological activities., Organisation for Economic Co-operation and Development, Paris. OECD 2002b, OECD science, technology and industry outlook 2002. Organisation for Economic Co-operation and Development, Paris. OECD (2002c), Dynamising National Innovation Systems, OECD, Paris OECD (2003): Glossary of statistical terms. OECD 2005, Oslo manual guidelines for collecting and interpreting innovation data. Organisation for Economic Co-operation and Development : Statistical Office of the European Communities, Paris. OECD, Healy, T., Côté, S., Helliwell, J.F., Field, S., Centre for Educational Research and Innovation. 2001, The well-being of nations : the role of human and social capital, Organisation for Economic Co-operation and Development, Paris. Oltra, V., and M. Saint Jean (2006) Variety of technological trajectories in low emission vehicles (LEVs): a patent data analysis, paper presented at the International Schumpeter Society, Nice Sophia Antipolis, May 2006. Oltra, V., and M. Saint Jean (2007) Incrementalism of environmental innovations versus paradigmatic changes: A comparative study of the automotive and chemical industries, paper for the 5th European Meeting on Applied Evolutionary Economics (EMAEE), Session on Environmental Innovations, 17-19 May 2007, Manchester. Pizer, W. A., Popp, D. (2007), Endogenizing Technological Change: Matching Empirical Evidence to Modeling Needs. RFF Discussion Paper 07-11, Resources for the Future, Washington. Popp, D. (2001) “Pollution Control Innovations and the Clean Air Act of 1990,” NBER Working Paper #8593. Popp, D. (2003), ‘Pollution Control Innovations and the Clean Air Act of 1990’, Journal of Policy Analysis and Management, 93, 390-409.

119
Popp, D. (2004), ENTICE: endogenous technological change in the DICE model of global warming. Journal of Environmental Economics and Management 48, 742–768. Popp, D. (2006), ENTICE-BR: The effects of backstop technology R&D on climate policy models. Energy Economics 28, 188–222. Popp, D. (2006), ‘International Innovation and Diffusion of Air Pollution Control Technologies: The Effects of NOX and SO2 Regulation in the U.S., Japan and Germany’, Journal of Environmental Economics and Management, 51, 46-71. Porritt, J. 2005, Capitalism as if the world matters, Earthscan, London; Sterling, VA.
Porter, M. & Stern, S. 2002, "National Innovative Capacity" in The global competitiveness report 2001-2002 World Economic Forum, Geneva, Switzerland 2001, eds. M. Porter , K. Schwab , J. Sachs, et al, Oxford University Press, New York, pp. 102-118.
Porter, M., Schwab, K., Sachs, J., Cornelius, P., McArthur, J. 2002, The global competitiveness report 2001-2002 World Economic Forum, Geneva, Switzerland 2001, Oxford University Press, New York.
Porter, M., Schwab, K., Sachs, J., Cornelius, P., McArthur, J. 2002, The global competitiveness report 2001-2002 World Economic Forum, Geneva, Switzerland 2001, Oxford University Press, New York. Remøe, S., Guinet, J.,. 2002, "Dynamising national innovation systems", OEDC Committee for Scientific and Technological Policy. & OECD Working Party on Technology and Innovation Policy, OECD, Paris. Remøe, S., 2005, Governance of national innovation systems, OECD Committee for Scientific and Technological Policy. & OECD Working Party on Technology and Innovation Policy. [Homepage of OECD], [Online]. Rennings, K. 2004, Blueprints for an integration of science, technology and environmental policy (BLUEPRINT) STRATA project, ZEW, Mannheim. Taylor, M.R., E.S. Rubin and D.D. Hounshell (2003), ‘Effect of government actions on technological innovations for SO2 control’, Environmental Science and Technology, 37, 4527-4534. UNCTAD 2002, United Nations Conference on Trade And Development World investment report 2002 transnational corporations and export competitiveness. United Nations, New York. Vækstfonden 2007: Partnerskaberne – en katalysator for deal flow til venturekapitalen?, presentation by Vice President Rolf Hauge Kjærgaard, Vækstfonden, at the conference Partnerskaberne, Copenhagen, Oktober 2007 Verspagen, B. (2005) Mapping Technological Trajectories as Patent Citation Networks. A Study on the History of Fuel Cell Research, MERIT-Infonomics Research Memorandum Series 2005-020.

120
Yarime M. (2005), "Coevolution of Environmental Regulation and Innovation Network: The Development of Lead-Free Solders in the United States, Europe, and Japan” Paper presented at the Fourth European Meeting on Applied Evolutionary Economics, Utrecht, The Netherlands, May 19-21 (2005).