final report: nist/library of congress (lc) optical disc ... · nist/library of congress (lc)...
TRANSCRIPT

Final Report:
NIST/Library of Congress (LC) Optical Disc Longevity Study.
The LIBRARY of CONGRESS
NIST/LC: OPTICAL DISC LONGEVITY STUDY
The Library of Congress and the National Institute of Standards and Technology do not recommend or endorse commercial products or enterprises, and makes no claims about the stability of any particular brand or type of media; therefore, no brand names are included in this report. The CD and DVD media used for this study were acquired in 2005. Test results and longevity estimations for the products used in this research may not reflect the quality of currently manufactured media. This report is published for information and research purposes only.
Certain commercial entities, equipment, or materials may be identified in this document in order to describe an experimental procedure or concept adequately. Such identification is not intended to imply recommendation or endorsement by the Library of Congress or the National Institute of Standards and Technology, nor is it intended to imply that the entities, materials, or equipment are necessarily the best available for the purpose.
September 2007 2

NIST/LC: OPTICAL DISC LONGEVITY STUDY
Preface 4
1 Introduction 5 2 Technical Background and Eyring Model 6 3 Definitions 7 4 Procedure 9
4.1 Procedural Overview 9 4.2 Test Method 10 4.3 Test Conditions 11 4.4 Test Discs 12
4.4.1 CD-R discs 12 4.4.2 Recordable and Rewritable DVD discs 12
4.5 Analysis of the discs 12 4.6 Measurement and Collecting data 13
4.6.1 Media recording and initial data 13 4.6.2 Media burning stations 13 4.6.3 Analyzer 14 4.6.4 Collecting data 14
4.7 Requirements of incubation condition 14 4.7.1 Environmental chambers 15
4.8 Incubation time requirements 15 4.9 Step by step summary analysis of data 15
5 Results 16 6 Conclusion 18 7 Normative references 19 8 Bibliography 20
Appendix I – Example result and analysis 21 Appendix II – Disc coding system for LE test 32
September 2007 3

NIST/LC: OPTICAL DISC LONGEVITY STUDY
Preface The Information Access Division (IAD) of the Information Technology Laboratory (ITL) at the National Institute of Standards and Technology (NIST), in collaboration with the Preservation Research and Testing Division (PRTD) at the Library Of Congress (LC) established a collaboration to test the longevity of recordable optical media including DVD-R, DVD+R, DVD-RW, DVD+RW, and CD-R. The details of this collaboration, results, and analysis are presented in this report. About the Library of Congress The Library of Congress is the nation's oldest federal cultural institution and serves as the research arm of Congress. It is also the largest library in the world, with more than 130 million items on approximately 530 miles of bookshelves. The collections include more than 29 million books and other printed materials, 2.7 million recordings, 12 million photographs, 4.8 million maps, and 58 million manuscripts. Preservation Research and Testing Division of the Library of Congress conducts scientific research to advance the preservation of the Library’s collections by extending their useful life as long as possible. Besides traditional book and manuscript materials, these collections include a variety of other media, including photographs, motion picture film, magnetic tape, and digital optical media such as CDs and DVDs. This division is also responsible for establishing specifications, acceptable practices, and testing protocols for all materials used for the conservation and/or storage of the Library’s permanent collections, as well as for specifying acceptable storage conditions, conservation practices and treatment processes that may have a direct or indirect impact on the longevity of the collections. About NIST Founded in 1901, NIST is a non-regulatory federal agency within the U.S. Commerce Department's Technology Administration. NIST's mission is to develop and promote measurement, standards, and technology to enhance productivity, facilitate trade, and improve the quality of life. NIST carries out its mission in four cooperative programs, the NIST Laboratories, conducting research that advances the nation's technology infrastructure and is needed by U.S. industry to continually improve products and services, the Baldrige National Quality Program, the Manufacturing Extension Partnership, and the Advanced Technology Program. NIST has an operating budget of about $858 million and operates in two locations: Gaithersburg, Md., (headquarters—234-hectare/578-acre campus) and Boulder, Colo., (84-hectare/208-acre campus). NIST employs about 3,000 scientists, engineers, technicians, and support and administrative personnel. About 1,800 NIST associates complement the staff. In addition, NIST partners with 1,400 manufacturing specialists and staff at affiliated centers around the country. The NIST/LoC Project Team: J. Zheng (NIST contractor, Lead Scientist), O. Slattery, F. Byers, A. Klepchukov, Anna Nhan (NIST), C. Shahani, M. Youket, E. Eusman, N. Olson (LC).
September 2007 4

NIST/LC: OPTICAL DISC LONGEVITY STUDY
1 Introduction The preservation of digital information has become a critical issue for many organizations, not least the libraries and archives of the US Government. According to the National Digital Information Infrastructure and Preservation Program (NDIIPP), which is administered by the LC, information is being produced in greater quantities and with greater frequency than at any time in history. Furthermore, according to the NDIIPP, electronic media, especially the Internet, make it possible for almost anyone to become a "publisher." The program asks: How will society preserve this information and make it available to future generations? Optical media has become the medium of choice for digital storage in many government agencies as well as many organizations within the private sector. In 2004, the Information Access Division of the National Institute of Standards and Technology (NIST) and the Preservation Directorate at the Library of Congress (LC) agreed to perform an investigation of the longevity of recordable Compact Disc (CD) and Digital Versatile Disc (DVD) media. This report outlines the procedural details of that investigation for estimating the life expectancy of information stored in CD-R, DVD-R and DVD+R, as well as DVD-RW and DVD+RW discs. The test procedure uses accelerated aging techniques and statistical analysis to estimate the standardized life expectancy (LE) of recordable DVD and CD media purchased in 2005. Only the effects of temperature and relative humidity on the media are considered. The standardized life expectancy estimated using this model is defined for discs maintained at 25 ºC and 50 % RH, but can be applied to give an estimate of the life expectancy at any moderate storage condition. Discs exposed to more severe conditions of temperature and humidity are expected to experience a shorter life. The test plan does not attempt to model degradation due to exposure to light, corrosive gases, contaminants, or mishandling, nor does it account for variations in the playback subsystem. Furthermore, the compatibility of the recorder and the media will have a critical effect on the LE of media, including very stable media since error rates immediately after recording will impact the length of time before failure. For this study, great care was taken to ensure compatibility between the recorder and the media, thus ensuring low initial error rates. In this report, all identifying information about the products has been removed. This study was not intended as a consumer report nor as a way to determine the longevity of particular brands but to help the LC get a meaningful sense of the longevity of optical media in general. This report summarizes the study and its results. It is important that NIST and the LC are not seen to be endorsing some products by including specific products in the study. It is also important for the industry to be confident that identifying information will not be disclosed so as to ensure their continued support and cooperation with optical media studies at NIST and the LC. It is the policy of NIST and the Library of Congress not to endorse any particular products.
September 2007 5
NIST/LC: OPTICAL DISC LONGEVITY STUDY
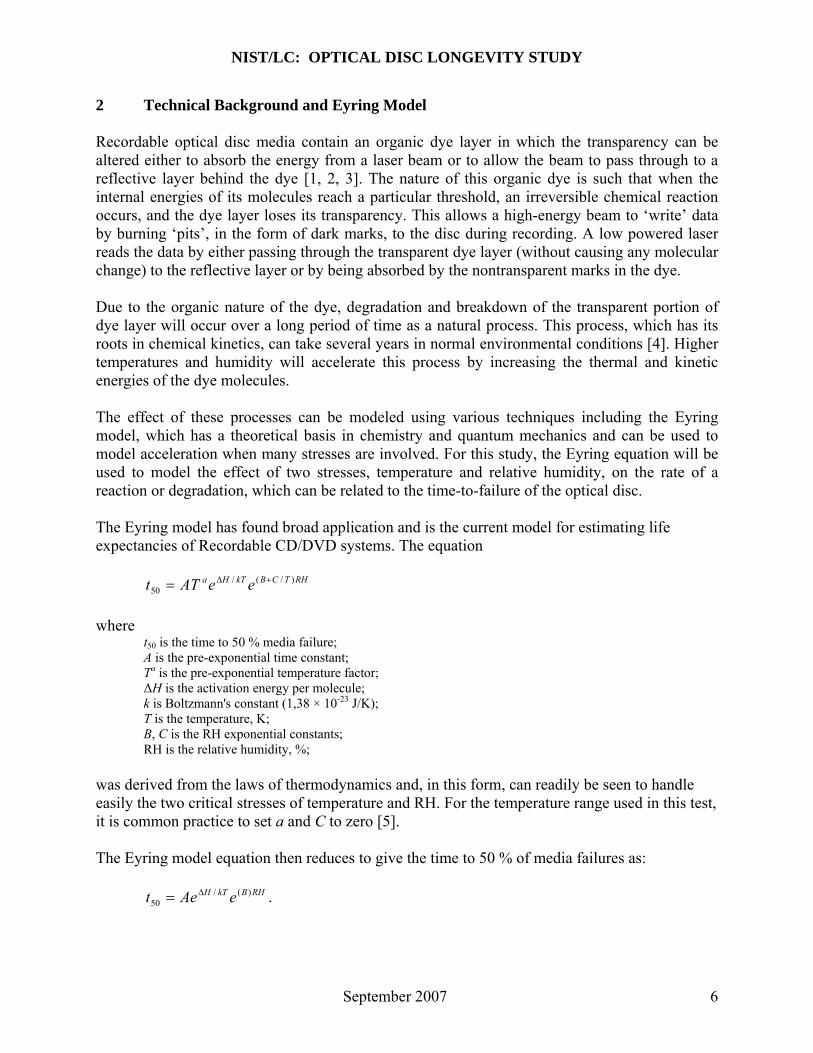
2 Technical Background and Eyring Model Recordable optical disc media contain an organic dye layer in which the transparency can be altered either to absorb the energy from a laser beam or to allow the beam to pass through to a reflective layer behind the dye [1, 2, 3]. The nature of this organic dye is such that when the internal energies of its molecules reach a particular threshold, an irreversible chemical reaction occurs, and the dye layer loses its transparency. This allows a high-energy beam to ‘write’ data by burning ‘pits’, in the form of dark marks, to the disc during recording. A low powered laser reads the data by either passing through the transparent dye layer (without causing any molecular change) to the reflective layer or by being absorbed by the nontransparent marks in the dye. Due to the organic nature of the dye, degradation and breakdown of the transparent portion of dye layer will occur over a long period of time as a natural process. This process, which has its roots in chemical kinetics, can take several years in normal environmental conditions [4]. Higher temperatures and humidity will accelerate this process by increasing the thermal and kinetic energies of the dye molecules. The effect of these processes can be modeled using various techniques including the Eyring model, which has a theoretical basis in chemistry and quantum mechanics and can be used to model acceleration when many stresses are involved. For this study, the Eyring equation will be used to model the effect of two stresses, temperature and relative humidity, on the rate of a reaction or degradation, which can be related to the time-to-failure of the optical disc. The Eyring model has found broad application and is the current model for estimating life expectancies of Recordable CD/DVD systems. The equation
RHTCBkTHa eeATt )/(/50
where
t50 is the time to 50 % media failure; A is the pre-exponential time constant; Ta is the pre-exponential temperature factor; ΔH is the activation energy per molecule; k is Boltzmann's constant (1,38 × 10⁻²³ J/K); T is the temperature, K; B, C is the RH exponential constants; RH is the relative humidity, %;
was derived from the laws of thermodynamics and, in this form, can readily be seen to handle easily the two critical stresses of temperature and RH. For the temperature range used in this test, it is common practice to set a and C to zero [5]. The Eyring model equation then reduces to give the time to 50 % of media failures as: . RHBkTH eAet )(/
50
September 2007 6

NIST/LC: OPTICAL DISC LONGEVITY STUDY
For each stress condition, an acceleration factor is computed and used to estimate the difference between the 50 % failure at the stress conditions and the usage conditions. These factors are then used to normalize the data to the usage condition. A log mean and standard deviation are then computed and used, together with a confidence factor to estimate the life expectancy at ambient conditions. 3 Definitions DVD-R: Stands for Digital Versatile Disc – Recordable. A format of DVD which uses dye sublimation recording technology, and conforms with ISO/IEC DIS 23912:2005 Information technology - 80 mm (1.46 Gbytes per side) and 120 mm (4.70 Gbytes per side) DVD Recordable Disk (DVD-R). On DVD-R, data can be written to once and read many times. DVD+R: Stands for Digital Versatile Disc + Recordable. A format of a recordable DVD which uses dye sublimation recording technology, and conforms with ISO/IEC 17344:2005: Information technology -- Data interchange on 120 mm and 80 mm Optical Disk using +R format -- Capacity: 4.7 and 1.46 Gbytes per side. On DVD+R, data can be written to once and read many times. DVD-RW: Stands for DVD-ReWritable. A format of a re-writable DVD disc, which uses phase change recording technology, and conforms with ISO/IEC 17342:2004: Information technology -- 80 mm (1.46 Gbytes per side) and 120 mm (4.70 Gbytes per side) DVD re-recordable disk (DVD-RW). On DVD-RW, data can be written to several hundred times and read many times. DVD+RW: Stands for DVD+ReWritable. A format of a re-writable DVD disc, which uses phase change recording technology, and conforms with ISO/IEC 17341:2005: Information technology -- Data interchange on 120 mm and 80 mm optical disk using +RW format -- Capacity: 4.70 Gbytes and 1.46 Gbytes per side. On DVD+RW, data can be written to several hundred times and read many times. CD-R: Stands for Compact Disc – Recordable. An extension of the CD format allowing data to be recorded once on a disc by using dye sublimation technology. Defined by part II of the Orange Book standard. Orange Book is the set of specifications created by Philips and Sony to define the optical signal characteristics, physical arrangement, writing methods and testing conditions for CD-R (Orange Book Part II) and CD-RW (Orange Book Part III) discs. Test Disc: An individual disc as used in this aging study. Group: A collection of test discs that are aged under the same accelerated aging condition.
September 2007 7

NIST/LC: OPTICAL DISC LONGEVITY STUDY
Stress: A condition of elevated temperature and relative humidity used to accelerate the aging process for optical media in this study. ECC: Stands for Error Correction Code, additional information added to data to allow errors to be detected and possibly corrected. BLER: Stands for BLock Error Rate, a measure of the average number of raw channel errors when reading or writing CD type media. BLER is a measure of the number of data blocks per second that contain detectable errors at the input of the C1 decoder. E32: Stands for Error 32. In a CD system, there are two stages or levels of error correction codec. Each stage of the codec can correct two bad symbols in a block. The first number in an "E" error always references the number of errors and the second number always references the codec level. For example, the error type E11 means one bad symbol was corrected in the first stage (C1) or level 1; E21 means two bad symbols were corrected in the C1 stage; E31 means that there were three or more bad symbols at the C1 stage. This block is uncorrectable at the C1 stage, and is passed to the C2 stage. E12 means one bad symbol was corrected in the C2 stage and E22 means two bad symbols were corrected in the C2 stage. E32 means that there were three or more bad symbols in one block at the C2 stage. This error is not correctable. PI and PO: Stands for Parity Inner and Parity Outer. Reed-Solomon Product Code (RS-PC) is a method of error correction employing a number (usually two) of groups of Reed-Solomon parity bytes computed from rows, columns, or diagonals of a rectangular data array. DVD uses two-group method of RS-PC for error correction. The redundant codes of rows and columns are called Parity of the Inner code (PI) and of the Outer code (PO) respectively. DVD discs correct small read errors using PI, that operates on rows, and corrects large read errors using PO, that operates on columns of the data array. PIE: Stands for Parity Inner Error. The number of error corrections made on incoming rows of data in the first pass of the decoder using the inner parity correction code. A row of an ECC Block that has at least 1 byte in error constitutes a PI error. PIE is measured over 8 ECC blocks. In any 8 consecutive ECC Blocks the total number of PI errors before correction shall not exceed 280, also called PI Sum 8. POE: Stands for Parity Outer Errors. Parity outer fails. The decoder was unable to correct the data using the outer parity codes. It is measured over 1 ECC block.
September 2007 8

NIST/LC: OPTICAL DISC LONGEVITY STUDY
Incubation Cycle: A complete single incubation cycle includes the initial ramping to stress conditions, the maintenance at that stress condition and ramping back to ambient conditions. This is described in section 4 of this paper. Life expectancy: The length of time (usually measured in years) one can expect, with 95 % confidence, that a disc is expected to store data before uncorrectable errors are imminent, when the disc is maintained at the ambient conditions of 25 °C and 50 % relative humidity. Shelf life: The length of time, up to which, a blank disc is expected to be suitable for recording. EOL: Stands for End of Life. The state of the disc when the level of correctable errors is such that the onset of uncorrectable errors is imminent. For CD type media, this means when BLER reaches 220 and for DVD type media, this means when PIE reaches 280. Also may be used to describe the point at which uncorrectable errors actually occur. 4 Procedure 4.1 Procedural overview: A sampling of ninety recorded test discs was divided into six groups. Each group of discs was exposed to one of six stresses, which are combinations of temperature and relative humidity as described in section 4.3. After each period of incubation, each disc was measured for BLER (in the case of CD type media) or inner parity (PI) errors (in the case of DVD type media). An example of the testing and incubation timeline is given in Fig. 1. Data collected at each test point for each individual disc was used to determine a time to failure (usually measured in hours) for that disc. The times to failure for discs at each stress were fitted to a log-normal distribution to determine a mean time to failure for that stress. The resulting six mean times to failure were regressed against temperature and relative humidity according to an Eyring acceleration model. This model was then used to estimate the distribution of lifetimes at a preferred usage condition.
Stress
Time
Incubation Cycle = Additional Testing= Testing Point
Fig. 1: Example of a testing and incubation timeline for the six stress conditions.
September 2007 9
NIST/LC: OPTICAL DISC LONGEVITY STUDY
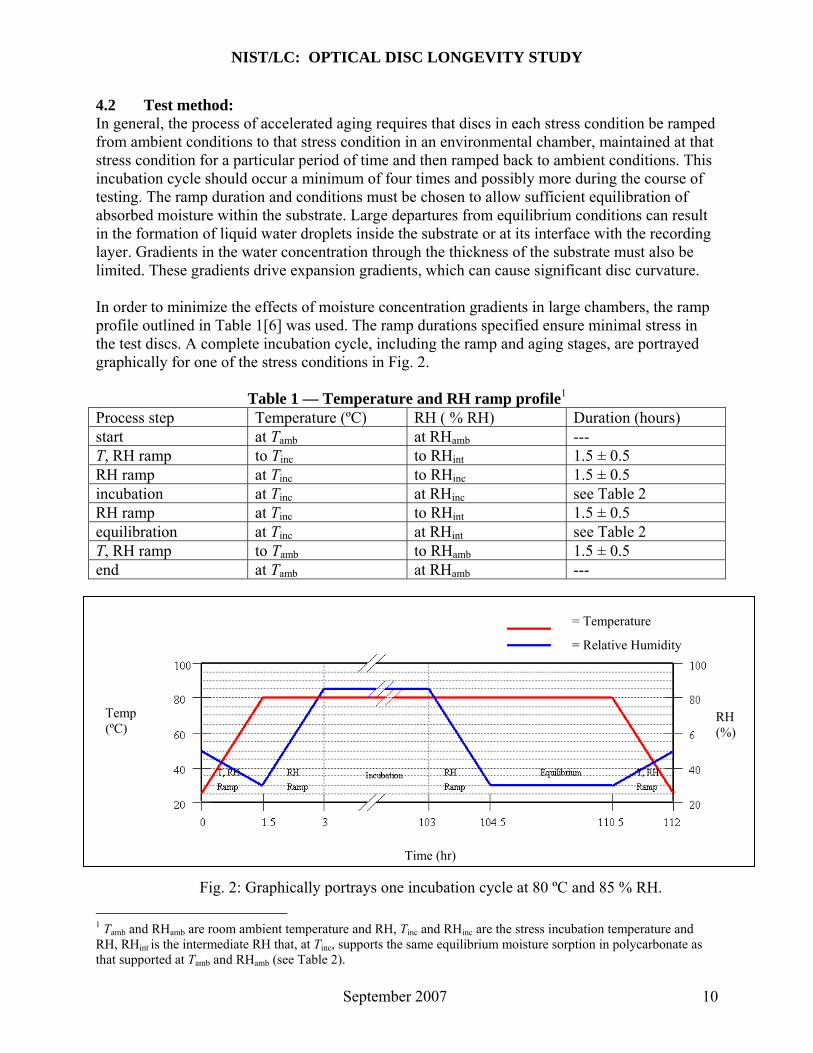
4.2 Test method: In general, the process of accelerated aging requires that discs in each stress condition be ramped from ambient conditions to that stress condition in an environmental chamber, maintained at that stress condition for a particular period of time and then ramped back to ambient conditions. This incubation cycle should occur a minimum of four times and possibly more during the course of testing. The ramp duration and conditions must be chosen to allow sufficient equilibration of absorbed moisture within the substrate. Large departures from equilibrium conditions can result in the formation of liquid water droplets inside the substrate or at its interface with the recording layer. Gradients in the water concentration through the thickness of the substrate must also be limited. These gradients drive expansion gradients, which can cause significant disc curvature. In order to minimize the effects of moisture concentration gradients in large chambers, the ramp profile outlined in Table 1[6] was used. The ramp durations specified ensure minimal stress in the test discs. A complete incubation cycle, including the ramp and aging stages, are portrayed graphically for one of the stress conditions in Fig. 2.
Table 1 — Temperature and RH ramp profile1 Process step Temperature (ºC) RH ( % RH) Duration (hours) start at Tamb at RHamb --- T, RH ramp to Tinc to RHint 1.5 ± 0.5 RH ramp at Tinc to RHinc 1.5 ± 0.5 incubation at Tinc at RHinc see Table 2 RH ramp at Tinc to RHint 1.5 ± 0.5 equilibration at Tinc at RHint see Table 2 T, RH ramp to Tamb to RHamb 1.5 ± 0.5 end at Tamb at RHamb ---
Temp (ºC)
Time (hr)
RH (%)
= Temperature
= Relative Humidity
Fig. 2: Graphically portrays one incubation cycle at 80 ºC and 85 % RH.
1 Tamb and RHamb are room ambient temperature and RH, Tinc and RHinc are the stress incubation temperature and RH, RHint is the intermediate RH that, at Tinc, supports the same equilibrium moisture sorption in polycarbonate as that supported at Tamb and RHamb (see Table 2).
September 2007 10

NIST/LC: OPTICAL DISC LONGEVITY STUDY
A system independent of the chamber control system was used to monitor the temperature and the relative humidity conditions in the test chamber during the stress test for independent verification of every chamber's conditions.
4.3 Test conditions: The six stress conditions used in this study are shown in Fig. 3. Table 2 specifies the temperatures, the relative humidity (RH), the initial incubation cycle durations, the minimum number of incubation cycles and the sample distributions for each stress condition. If necessary, more incubation cycles may be added or the duration of the incubation may be increased to determine the time to failure of the media at any specific stress. A separate group of test discs is used for each stress condition. This procedure constitutes a constant-stress test plan. All temperature stress points have an allowed range ±2 ºC and all relative humidity stress points have an allowed range of ±3 %RH.
Temperature
Relative Humidity
Fig. 3: Stress conditions of acceleration aging.
Table 2 - Summary of stress conditions Group Number of Test stress Initial incubation Minimum # Intermediate Equilibration number test discs (Tinc, RHinc) cycle duration of cycles RH(RHint) duration
1 10 80 ºC, 85 % 100 h 4 31 % 6 h 2 10 80 ºC, 70 % 100 h 4 31 % 5 h 3 15 80 ºC, 55 % 100 h 4 31 % 4 h 4 15 70 ºC, 85 % 150 h 4 33 % 8 h 5 15 70 ºC, 70 % 150 h 4 35 % 7 h 6 25 60 ºC, 85 % 200 h 4 36 % 11 h
The intermediate RH (RHint) in Table 2 is calculated assuming a 25 ºC and 50 % RH ambient. If the ambient conditions are different, the intermediate RH to be used is calculated using the equation:
September 2007 11
NIST/LC: OPTICAL DISC LONGEVITY STUDY
)(*)0037.024.0()0037.024.0(int ambincamb RHTTRH
where
Tamb is the ambient temperature in units of ºC; Tinc is the incubation temperature in units of ºC; RHamb is the ambient RH.
The stress conditions tabulated in Table 2 offer a sufficient combination of temperature and RH to satisfy the mathematical requirements of the Eyring model to demonstrate linearity of the natural logarithm (ln) of the maximum BLER (ln(BLERmax)) versus time in the case of CD type media, and ln(PI errorsmax) versus time in the case of DVD type media, and produce a satisfactory confidence level to make the desired conclusions. 4.4 Test discs: Test discs for this study were selected to be nominally identical with regard to substrate groove structure, layer structure, coating composition, recording capacity, and age prior to test initiation. Media was chosen from different lots and production lines in order to be representative of normal process variations. All discs were maintained within the manufacturer's shipping and at ambient storage conditions prior to recording. Each of the test discs were recorded disc-at-once with a single session recording. In other words, the disc was recorded such that the entire disc is written to in one pass without turning off the laser. All CD type discs in this study met the Yellow Book (Philips-Sony Compact Disc Read Only Memory System Description) specification (also described in the ISO/IEC 10149 or EMCA-130 standards). Likewise, all DVD type media in the study satisfied the DVD specification (described in ISO/IEC 16448:2002 or ECMA-267, third edition, April 2001 standards). 4.4.1 For CD-R discs: Since the emergence of CD-R technology, a number of different dye types have been used as the recording layer, including Cyanine, Phthalocyanine, and Metallized Azo, or their hybrids [7]. However, due to current conditions in the dye market, a single dye type has become the most popular in CD-R media and is based on the Phthalocyanine dye. All CD-R discs in this study used Phthalocyanine dye as the recording layer. Due to limitations with the CD analyzer, it was not possible to include CD-RW type media in this study. 4.4.2 For recordable and rewritable DVD discs: There are several different types of recordable DVD available, including DVD-R for general, DVD-R for Authoring, DVD+R, DVD-RW, DVD+RW, DVD-RAM and more recently dual layer DVD. In this study, we selected DVD-R for general, DVD-RW, DVD+R and DVD+RW.
4.5 Analyses of the discs: Maximum BLER for CD-R The maximum BLER number is the largest BLER (see earlier definition) measured anywhere on a disc. Maximum Inner Parity Errors for DVD
September 2007 12
NIST/LC: OPTICAL DISC LONGEVITY STUDY
The Maximum PI errors number is the largest PIE (see earlier definition) measured anywhere on a disc. 4.6 Measurements and collecting data: This study uses the measured maximum BLER for recordable CD and the measured maximum inner parity (PI) errors for recordable DVD as a high-level estimate of the quality of the media at the time of measurement. The purpose of measuring BLER and PI errors is to establish a practical estimation of a compatible system's ability to read the recorded data without uncorrectable errors occurring. However, the correlation between actual loss of information and the measured maximum BLER and PIE actually depends on several factors including the playback system as well as the media quality. A BLER of 220 and the PI errors of 280 are conservative levels chosen by the recordable CD and DVD specifications as a predictor of the onset of uncorrectable errors and thereby end of life. 4.6.1 Media recording and initial data: There are many formats and speeds of discs (for example, 4X, 8X, 16X…) in the market and yet there is no unified standard for the drive write strategy. Therefore each recorder drive manufacturer develops their own drive to satisfy the write/read requirements of recordable CD and DVD discs. As such, there is no guarantee that the recorder used to burn a disc is fully compatible with that disc. This can, and often does, lead to very high error rates immediately after recording the disc, which in turn can make aging analysis very difficult. It is therefore important to ensure that initial error rates are low by ensuring that the recording drive and the media are as compatible as possible [8,9]. To ensure recorder drive and media compatibility, four Disc Burning Stations (DBS) were built in the NIST laboratory with new recorder drives. Each drive used the latest version of its firmware to ensure its best performance. To determine the recorder with the highest level of compatibility with each brand of media, a limited number of recordings were made for each brand by each recorder in the four DBS. The discs were then burned by the most compatible recorder and initial error rates monitored to ensure that the recorder continued to operate correctly. Where possible, only media with an initial BLER (in the case of CD type media) below 40 and with PIE (in the case of DVD) below 100 were included. 4.6.2 Disc Burning Stations: In an effort to ensure the integrity of the results, all disc burning station (DBS) computer configurations were the same. For this study, each disc burning station (DBS) consisted of a Pentium-4 processor workstation with the following specifications: Intel Pentium-4 Processor 3.6 GHz w/ 800mhz FSB, 1GB DDR2-533 MHz dual channel RAM, Seagate 120 GB 7200 rpm SATA hard drive w/ 8 MB cache, Microsoft Windows XP Pro w/ doc and media.
September 2007 13

NIST/LC: OPTICAL DISC LONGEVITY STUDY
All discs were indexed to associate each with the particular DBS and DVD recorder drive used to record it. The recording drives used in this study include the Sony DRU-510A, 700A, 800A, Pioneer DVR-A09, Plextor PX-716SA and NEC ND-2510A. The drive chosen for the particular brand of media was the drive shown to be most compatible with that media. Each DBS was equipped with Roxio Easy Media Creator 7, version 7.5.0.47 ENU. The same image was recorded on DVD media at the most compatible speed. The same image was recorded on all CD media also at the most compatible speed. 4.6.3 Analyzer: In order to monitor the change in the error rate during the aging, the discs were analyzed after each incubation cycle using optical disc analyzers. A CD analyzer capable of reading BLER (in the case of CD) and a DVD analyzer capable of reading PI error (in the case of DVD) were used. For testing CD: CD CATS SA3 Advanced can measure all relevant parameters of CD discs. All measurements were performed according to optical disc industry standards. All relevant parameters including correctable BLER (including E11, E12, E21, and E22), uncorrectable E32 errors, jitter, asymmetry and more were measured using this system. Unfortunately, this system is not capable of testing CD-RW type media, which is why CD-RW media was not included in this study. For testing DVD: CATS SA300 DVD-R/RW PRO and CATS DVD+R/RW PRO from Audio Development were used to analyze the DVD media in this study. These systems measure recorded and unrecorded DVD discs and include the Pulstec SDP-1000 optical drive. All relevant parameters including inner parity error (PIE), outer parity error (POE), jitter, asymmetry and more were measured using this system. All media testers were regularly calibrated to ensure the integrity of the results. 4.6.4 Collecting data Test discs were not analyzed in their entirety but analyzed at five test bands throughout the diameter of the test disc. DVD test points are located at the following radii (in millimeters): 24.00 to 25.20, 31.95 to 33.15, 39.90 to 41.10, 47.85 to 49.05, and 55.8 to 57.00, from the inside to the outside of the disc. CD-R test points are at the following times (in minutes:seconds): 00:00 to 03:00, 19:00 to 22:00, 38:00 to 41:00, 57:00 to 60:00, 76:00 to 79:00. The same tester was used for any particular test disc through out the study and each disc was indexed to indicate which analyzer/tester was used to analyze that disc. 4.7 Requirements of incubation condition: The temperature and relative humidity levels used in this study were chosen to ensure that there was no change of phase of the moisture within the environmental chamber over the test temperature range, and such that no condensation occurred at cooler areas of the chamber such as the observation windows, cable ports, wiper handles, and so on. Any droplets caused by such condensation could damage the media and/or influence the error rates. Furthermore, the temperature of the testing environment must not be so high so as to cause any plastic
September 2007 14

NIST/LC: OPTICAL DISC LONGEVITY STUDY
deformation within the disc structure. Practical experience shows that 80 ºC and 85 % RH is the upper limit for control within most accelerated test cells. Table 2 shows the complete stress conditions used in this study. Disc samples were uncovered and placed vertically within the chamber. Discs were aligned so that their surfaces were parallel to the chamber airflow. A space of at least 2 mm was maintained between discs. 4.7.1 Environmental Chambers: A Parameter Generation and Control Inc (model: 9131-3119) 30 cubic feet environmental chamber was used to control precisely the temperature and relative humidity through various combination settings of temperatures (5 C to 85 C) and relative humidity (10 % to 95 %). The controlled accuracy is ± 0.2 C for temperature and ±0.5 % for relative humidity. 4.8 Incubation time requirements: Since there were six stress conditions to be implemented, the media from each brand were split into six groups (see Table 2). The first incubation cycle testing was completed in the timeline shown in Fig. 4, and subsequent cycles followed a similar format but with modified incubation durations. The most severe stress (80 ºC, 85 %) was conducted first and tested after incubation to determine if the incubation durations should be increased for subsequent cycles and to what extent. Increasing the incubation durations for subsequent cycles did not increase the total duration of the study since the limiting factor is the number of analyzers available to test the large numbers of media. There were two analyzers available for testing DVD media and one available for testing CD media.
Stress Severity
Time Schedule
= Aging underway
= Testing underway
Fig. 4: Initial incubation cycle testing timeline.
4.9 Step-by-step summary of the analysis for calculation of media life: The following is a brief outline of the steps used to estimate the life expectancy of information stored on recordable optical media as a function of temperature and relative humidity. 1) Determine the failure time for each test disc. 2) Determine the critical value of the median rank of each test disc, and plot the critical value of
the median rank versus failure time on a log-normal graph.
September 2007 15

NIST/LC: OPTICAL DISC LONGEVITY STUDY
3) Verify that the plots for all stresses are reasonably parallel to one another. The log standard deviation for each stress may be calculated using standard techniques or estimated from straight lines drawn through the plots. Calculate the log mean and standard deviation for each stress.
4) Regress the log mean, temperature, and relative humidity for all stresses using the reduced Eyring equation. Calculate the estimated log mean for the standardized temperature and relative humidity (25 ºC and 50 % RH).
5) Determine the acceleration factor for each stress. 6) Normalize all the failure times by multiplying each failure time by the acceleration factor for
its stress. Combine all normalized failure times and censored data into one data set. For this entire set, make one composite log-normal plot. Estimate the log mean and the log standard deviation at the usage conditions from the combined data.
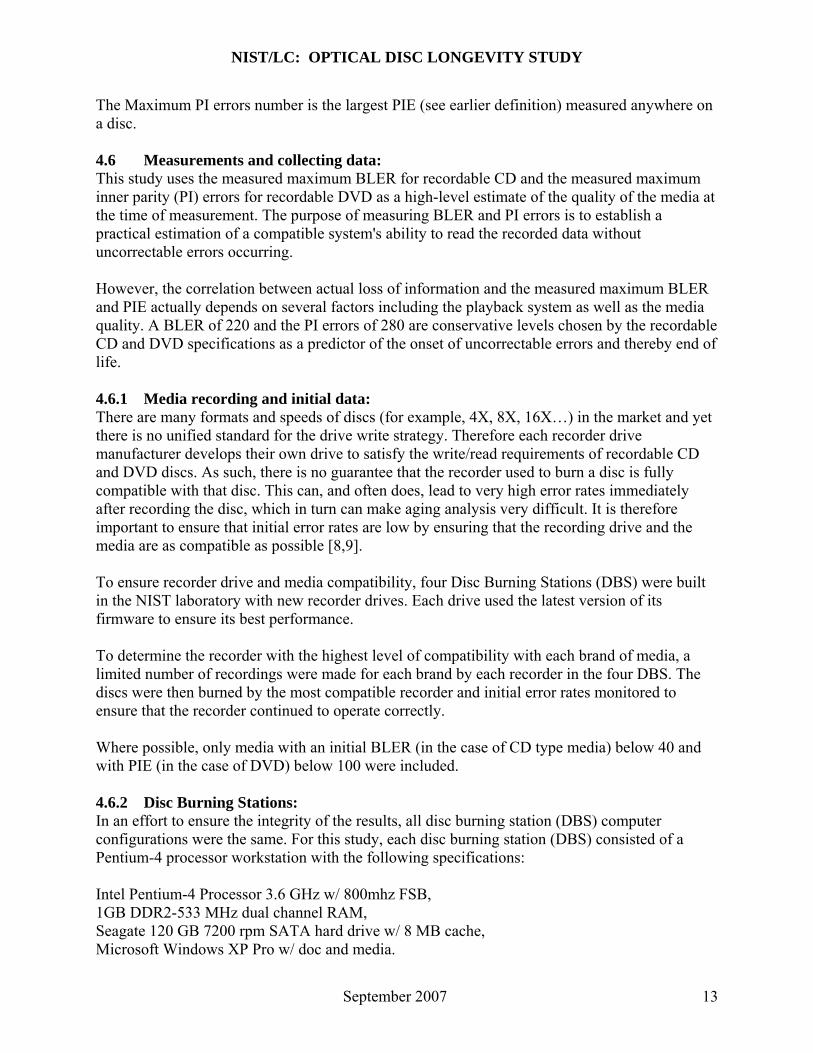
7) Calculate 95 % survival probability with 95 % confidence. 5. Results This study was performed on optical media purchased in 2005. At the time of the study, the quality of optical media varied significantly and the quality has changed with newer versions and products. Therefore, the results of this study should only be considered a snapshot of the longevity of the optical media at the time of purchase. Life Expectancy: For this study, the estimated life expectancy is defined as the length of time one can expect, with 95 % confidence, that the product will survive before the onset of uncorrectable errors are imminent, when stored at the ambient conditions of 25 °C and 50 % relative humidity. In CD type media, the onset of uncorrectable errors is considered imminent when the correctable error rate (BLER) reaches 220. In DVD type media, the onset of uncorrectable errors is considered imminent when the correctable error rate (PIE) reaches 280. Recordable CD: There were seven CD-R media products tested in this study. Ninety sample discs were tested for each product. Equipment to test CD-RW media was not available for this study. Fig. 5 shows the results for these CD-R media. Five of the seven CD-R products had estimated life expectancies in ambient conditions of more than 45 years. The remaining two products had estimated life expectancies in ambient conditions of 30-45 years.
September 2007 16
NIST/LC: OPTICAL DISC LONGEVITY STUDY
CD-R Media Summary (95% survival)
0
10
20
30
40
50
60
70
80
90
100
0-15 years 15-30 years 30-45 years >45 years
Standardized Life Expectancy (SLE)
% o
f to
tal
CD
sam
ple
s
Fig. 5: CD-R Results.
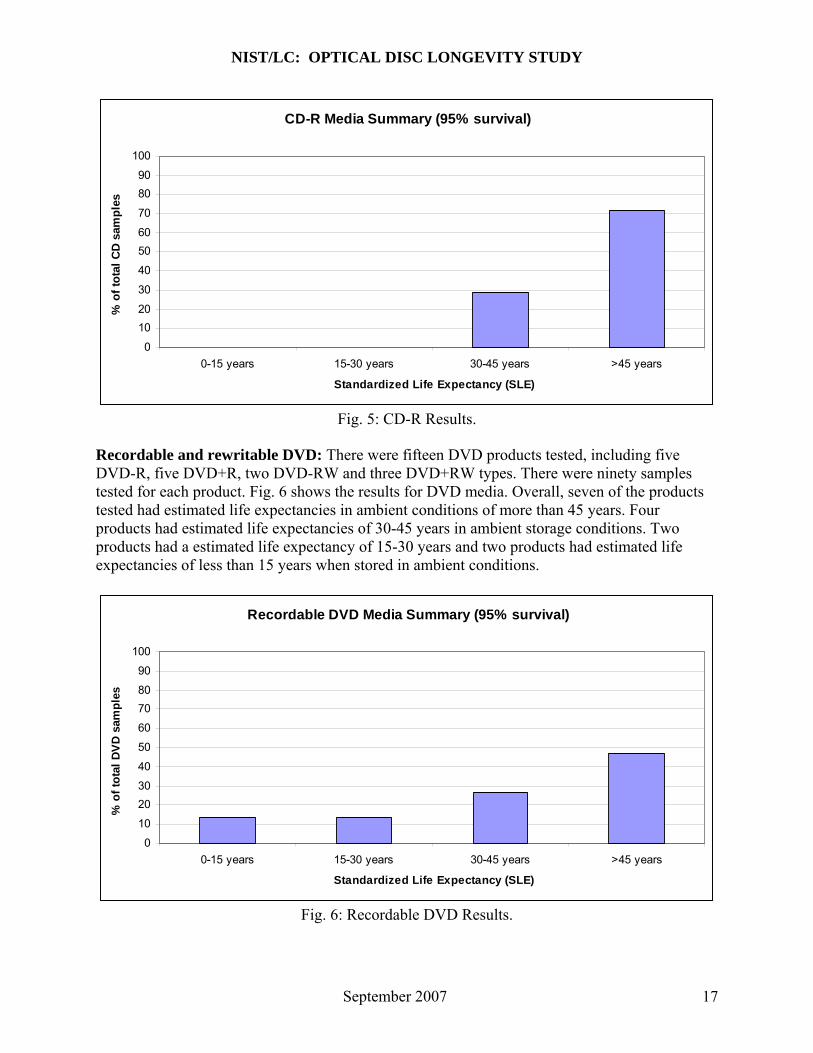
Recordable and rewritable DVD: There were fifteen DVD products tested, including five DVD-R, five DVD+R, two DVD-RW and three DVD+RW types. There were ninety samples tested for each product. Fig. 6 shows the results for DVD media. Overall, seven of the products tested had estimated life expectancies in ambient conditions of more than 45 years. Four products had estimated life expectancies of 30-45 years in ambient storage conditions. Two products had a estimated life expectancy of 15-30 years and two products had estimated life expectancies of less than 15 years when stored in ambient conditions.
Recordable DVD Media Summary (95% survival)
0
10
20
30
40
50
60
70
80
90
100
0-15 years 15-30 years 30-45 years >45 years
Standardized Life Expectancy (SLE)
% o
f to
tal
DV
D s
amp
les
Fig. 6: Recordable DVD Results.
September 2007 17

NIST/LC: OPTICAL DISC LONGEVITY STUDY
Fig. 7 shows the recordable DVD life expectancies (95 % survival rate) by type given as a percentage of the total number of samples of that type.
Recordable DVD Media by Type Summary (95% survival)
0
10
20
30
40
50
60
70
80
90
100
DVD-R DVD+R DVD-RW DVD+RW
Recordable DVD Media Type
% o
f to
tal
DV
D s
amp
les
by
typ
e 0-15 years
15-30 years
30-45 years
>45 years
Fig. 7: Summary of Recordable DVD Results by Type.
To determine a specific standardized lifetime expectancy for the longer lasting media would have required several more aging iterations. Unfortunately, this was not possible during this study but is recommended as a follow on to this study. The step by step example of the analysis is given in Appendix I and describes the mathematical and statistical process used to determine the life expectancy of the media. The final result will show the 95 % survival time with 95 % confidence, at ambient conditions of 25 °C and 50 % relative humidity. 6 Conclusions We have implemented an artificial aging study for estimating the life expectancy of many of the popular products available in the market place (as of 2005). The study was based on the Eyring model. For media tested in this study, there was a significant variation in the longevities among the DVD products, although most life expectancies were greater than 30 years. It should be noted that DVD media technology was evolving (e.g.: recording speed) quickly at the time these products were on the market. All CD media in this study had life expectancies of greater than 30 years. CD/DVD stability divide: It has been speculated that the archival quality of CD is superior to that of DVD. The basis for this lay with the physical differences in CD and DVD optical media and the maturity of the technology. In particular, the size of the bit markings in CD media not only reduces the relative effect of media or dye degradation, but also means that more stable, less sensitive dye may be used. In our testing and analysis, a greater percentage of CD products achieve a long life expectancy relative to the DVD products. It is not clear if the physical and
September 2007 18

NIST/LC: OPTICAL DISC LONGEVITY STUDY
chemical differences between these two technologies will prohibit DVD from being as stable as CD or if any difference in stability will be reduced as DVD technology and manufacturing processes become more mature. No obvious or significant difference in the longevity of differing DVD types emerged in this study. All CD media in this study used Pthalocycaine as the recording layer and the results here may not reflect the longevities of CD-R type media with other types of recording layers. Many factors affect the longevity of optical media, including the stability of the materials used in the recording and substrate layers; the relative sensitivity of the recording layer to the effects of heat, humidity and light; the quality of the manufacturing process; the amount and type of markings or labels attached; the compatibility of the media with the recording device and the quality of the initial recording; the age of the media at the time of recording; the storage and handling conditions encountered and more. All these factors are important in determining the actual life of a particular disc and there are obviously great variations possible within each factor. It is not feasible to model all of the factors and this study does not attempt to. This study limited the modeling to the effects of temperature and relative humidity in order to extrapolate to the ambient storage conditions of conditions of 25 °C and 50 % relative humidity. For more information on many of these factors and as a guide to the care and handling of CDs and DVDs, the following resource is available from CLIR and NIST [11]. The results show that high quality optical media with good quality initial recordings can survive several decades in ambient storage conditions. For future work, it is recommended that new products continue to be tested, especially after the technology further matures and stabilizes. An ongoing process of regularly testing newer CD and DVD products is recommended for the Library of Congress. Future studies should include longevity testing and separate, but complementary read/write compatibility testing. The results of compatibility testing will help researchers ensure that all media identified for longevity testing is recorded optimally. This type of accelerated aging technique may best be used as a way to compare the quality of products [12]. Therefore, it is recommended that a media quality test be developed such that the test discs can be compared to an archival quality test disc. The compatibility and longevity of the test disc would need to be known. 7 Normative references
ISO 18927:2002 Imaging materials – Recordable compact disc systems – Method for estimating the life expectancy based on the effects of temperature and relative humidity, first edition
ECMA-379, 2007 Test Method for Estimation of the Archival Lifetime of Optical Media IEC 60908 (1999-02): Compact disc digital audio system. This document including
amendments approximates the Philips-Sony Red Book ISO/IEC 10149:1995, Read-Only 120 mm Optical Data Disks (CD-ROM) EMCA130 2nd Edition - June 1996 Data interchange on read-only120 mm optical data
disks(CD-ROM)
September 2007 19

NIST/LC: OPTICAL DISC LONGEVITY STUDY
Orange Book, part B, -- Recordable Compact Disc System, November 1990 (SONY and Philips Corp.)
ISO/IEC 16448:2002 Information technology -- 120 mm DVD -- Read-only disk ISO/IEC DIS 23912:2005 Information technology - 80 mm (1.46 Gbytes per side) and
120 mm (4.70 Gbytes per side) DVD Recordable Disk (DVD-R) ISO/IEC 17344:2005: Information technology -- Data interchange on 120 mm and 80
mm Optical Disk using +R format -- Capacity: 4.7 and 1.46 Gbytes per side ISO/IEC 17342:2004: Information technology -- 80 mm (1,46 Gbytes per side) and 120
mm (4,70 Gbytes per side) DVD re-recordable disk (DVD-RW) ISO/IEC 17341:2005: Information technology -- Data interchange on 120 mm and 80
mm optical disk using +RW format -- Capacity: 4,7 Gbytes and 1,46 Gbytes per side ECMA-267, 2001, 120 mm DVD - Read-Only Disk, 3rd edition ECMA-337, DVD+RW - Rewritable Optical Disks, 4.7 GB ECMA-338, DVD-RW - Rewritable Optical Disks, 4.7 GB IEEE 101-1995, Guide for the statistical analysis of thermal life test data
8 Bibliography
[1] Hamada, E, et al, Recording process of recordable compact disc, Optical Data Storage, D. B. Carlin and D. B. Kay, eds., Proc. SPIE 1663, 443–446, 1992.
[2] Yokota, C, et al, Phthalocyanine CD-R for high-speed recording, Optical Data Storage, G. R. Knight, H. Ooki, and Y. Tyan, eds., SPIE Proc. 2514, 249–257, 1995.
[3] Bennett, H.,Understanding CD-R and CD-RW, Optical Storage Technology Association, California, USA, 2003.
[4] Murray, W.P., Accelerated service life predictions of compact disks, ASTM STP 1202, p.263-271. American Society for Testing and Materials, 1994
[5] Tobias, P.A. and Trindade, D.C., Applied Reliability. New York: Van Nostrand Reinhold, 1986 (2nd ed. 1995).
[6] Wrobel, J.J., Ramp profiles for optical disc incubation, SPIE vol. 2338, optical data storage, p. 191-202, 1994.
[7] Slattery, O.T. et al, Stability Comparison of Recordable Optical Discs—A Study of Error Rates in Harsh Conditions, Journal of Research of the National Institute of Standards and Technology, Vol. 109, Number 5, September-October 2004.
[8] Slattery, O.T., DVD-ROM Drive Compatibility Test for DVD-R(General), DVD-RW, DVD+R, DVD+RW and DVD-RAM Discs (Phase1), NIST Special Pub 500-254, 2003
[9] Slattery, O.T., DVD Drive Compatibility Test for DVD-R (General) and DVD+R Discs, including DVD Creation Plan (Phase2), NIST Special Publication 500-258, 2004
[10] Experimental Statistics, National Bureau of Standards Handbook 91. Washington, DC, US: National Institute of Science and Technology, 1963.
[11] Byers, F. Care and Handling of CDs and DVDs: A Guide for Librarians and Archivists, National Institute of Standards and Technology and the Council on Library and Information Resources, 2003.
[12] Porck, H., The Predictive Value of Artificial Aging Tests, European Commission on Preservation and Access, Amsterdam, 2000.
September 2007 20

NIST/LC: OPTICAL DISC LONGEVITY STUDY
APPENDIX I The following are the step by step results and analysis for an example recordable DVD media.
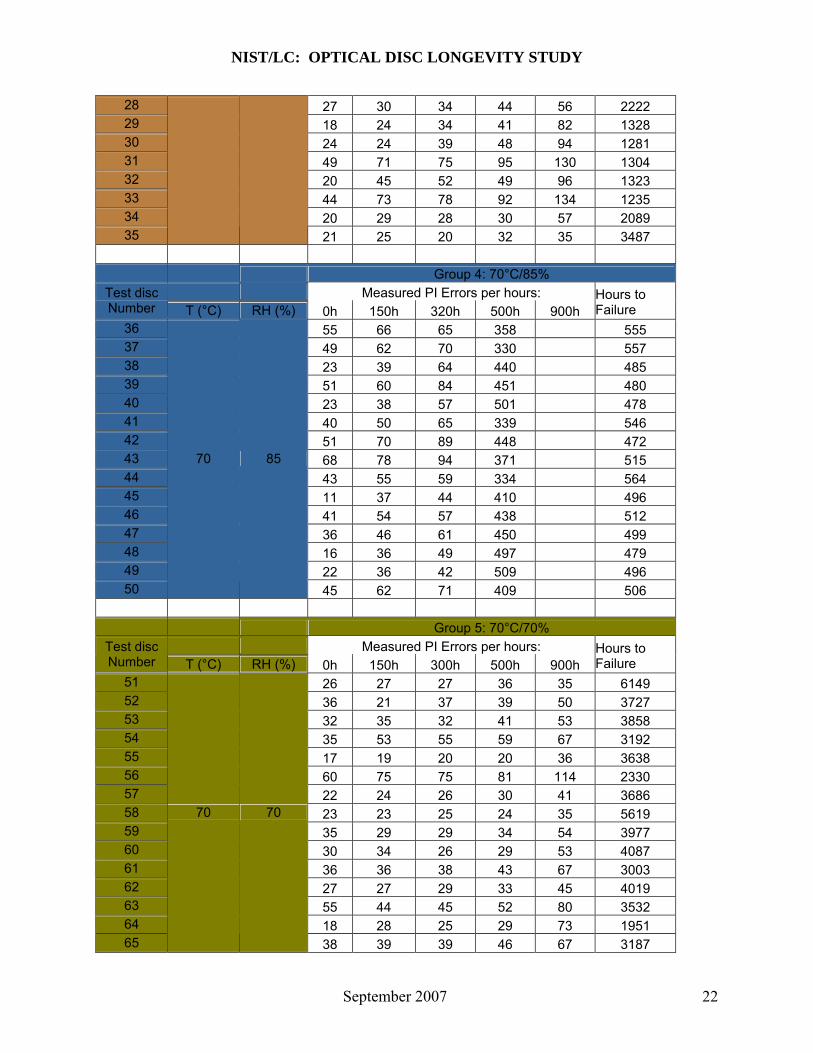
Step 1: For each stress condition, the time to failure is determined for each sample. The failure time (in hours) of each test disc is calculated from the slope and intercept of the regression as the time at which the test disc would have a max PISum8 of 280.
Group 1: 80°C/85%
Measured PI Errors per hours: Test disc Number T (°C) RH (%) 0h 100h 200h 350h 530h
Hours to Failure
1 47 71 77 202 1518 333 2 34 59 89 321 347 3 45 66 91 184 1437 337 4 35 57 73 164 1437 353 5 41 62 87 113 579 442 6 45 67 82 174 1583 336 7 34 65 128 113 565 429 8 39 60 135 218 954 347 9 24 57 63 204 1597 345 10
80 85
23 50 101 292 342 Group 2: 80°C/70%
Measured PI Errors per hours: Test disc Number T (°C) RH (%) 0h 100h 230h 410h 680h
Hours to Failure
11 45 92 99 121 336 644 12 27 83 44 100 277 722 13 55 133 135 192 443 511 14 38 94 109 147 353 595 15 36 89 92 122 325 643 16 36 80 109 145 310 623 17 37 81 86 132 368 609 18 51 113 146 141 348 600 19 31 81 82 121 555 542 20
80 70
21 55 39 75 1044 524 Group 3: 80°C/55%
Measured PI Errors per hours: Test disc Number T (°C) RH (%) 0h 100h 250h 450h 700h
Hours to Failure
21 33 52 66 63 101 1470 22 68 55 56 62 101 2601 23 24 30 47 46 61 1874 24 24 46 44 39 62 2369 25 22 43 36 46 63 1950 26 42 40 40 39 69 3191 27
80 55
31 53 54 69 132 1155
September 2007 21
NIST/LC: OPTICAL DISC LONGEVITY STUDY
28 27 30 34 44 56 2222 29 18 24 34 41 82 1328 30 24 24 39 48 94 1281 31 49 71 75 95 130 1304 32 20 45 52 49 96 1323 33 44 73 78 92 134 1235 34 20 29 28 30 57 2089 35 21 25 20 32 35 3487
Group 4: 70°C/85%
Measured PI Errors per hours: Test disc Number T (°C) RH (%) 0h 150h 320h 500h 900h
Hours to Failure
36 55 66 65 358 555 37 49 62 70 330 557 38 23 39 64 440 485 39 51 60 84 451 480 40 23 38 57 501 478 41 40 50 65 339 546 42 51 70 89 448 472 43 68 78 94 371 515 44 43 55 59 334 564 45 11 37 44 410 496 46 41 54 57 438 512 47 36 46 61 450 499 48 16 36 49 497 479 49 22 36 42 509 496 50
70 85
45 62 71 409 506 Group 5: 70°C/70%
Measured PI Errors per hours: Test disc Number T (°C) RH (%) 0h 150h 300h 500h 900h
Hours to Failure
51 26 27 27 36 35 6149 52 36 21 37 39 50 3727 53 32 35 32 41 53 3858 54 35 53 55 59 67 3192 55 17 19 20 20 36 3638 56 60 75 75 81 114 2330 57 22 24 26 30 41 3686 58 23 23 25 24 35 5619 59 35 29 29 34 54 3977 60 30 34 26 29 53 4087 61 36 36 38 43 67 3003 62 27 27 29 33 45 4019 63 55 44 45 52 80 3532 64 18 28 25 29 73 1951 65
70 70
38 39 39 46 67 3187
September 2007 22

NIST/LC: OPTICAL DISC LONGEVITY STUDY
Group 6: 60°C/85%
Measured PI Errors per hours: Test disc Number T (°C) RH (%) 0h 200h 400h 700h 1100h
Hours to Failure
66 59 77 75 113 1075 782 67 74 74 81 100 850 843 68 18 42 53 62 1125 862 69 24 50 54 63 1014 879 70 18 40 53 81 1406 809 71 20 41 68 60 1000 874 72 25 54 62 78 1027 846 73 32 61 73 85 1198 803 74 28 63 71 80 802 880 75 20 43 70 78 976 850 76 16 64 66 87 1202 803 77 11 42 61 75 1060 842 78 27 48 61 62 1101 862 79 10 43 66 79 1104 828 80 14 39 69 125 1258 777 81 19 37 77 92 1040 823 82 22 64 72 122 1160 773 83 21 50 67 166 999 777 84 22 36 76 111 1457 765 85 25 39 70 74 764 904 86 24 44 94 115 1103 782 87 18 90 76 101 575 898 88 30 44 72 79 1001 848 89 42 57 81 111 1129 781 90
60
85
37 58 66 113 1064 800 Table AI.1: Estimated time to failure.
Step 2: For each stress condition, the failure order, median rank and critical value within their respective stress conditions are determined and the specimens are ordered by increasing times to failure. The median rank is calculated using the estimate (i-0.5)/n, where i is the failure order and n is the total number of test discs in that stress condition. The log mean and the standard deviation of the times to failure are calculated.
Group 1: 80°C/85%
Failure order Hours to failure (H) Ln(H) Median rank Critical value
1 333 5.81 0.05 -1.64 2 336 5.82 0.15 -1.04 3 337 5.82 0.25 -0.67 4 342 5.84 0.35 -0.39 5 345 5.84 0.45 -0.13 6 347 5.85 0.55 0.13 7 347 5.85 0.65 0.39
September 2007 23

NIST/LC: OPTICAL DISC LONGEVITY STUDY
8 353 5.87 0.75 0.67 9 429 6.06 0.85 1.04
10 442 6.09 0.95 1.64
Mean: 5.85
Std Dev: 0.10 Group 2: 80°C/70%
Failure order Hours to failure (H) Ln(H) Median rank Critical value
1 511 6.24 0.05 -1.64 2 524 6.26 0.15 -1.04 3 542 6.30 0.25 -0.67 4 595 6.39 0.35 -0.39 5 600 6.40 0.45 -0.13 6 609 6.41 0.55 0.13 7 623 6.44 0.65 0.39 8 643 6.47 0.75 0.67 9 644 6.47 0.85 1.04
10 722 6.58 0.95 1.64
Mean: 6.40
Std Dev: 0.11 Group 3: 80°C/55%
Failure order Hours to failure (H) Ln(H) Median rank Critical value
1 1155 7.05 0.03 -1.83 2 1235 7.12 0.10 -1.28 3 1281 7.16 0.17 -0.97 4 1304 7.17 0.23 -0.73 5 1323 7.19 0.30 -0.52 6 1328 7.19 0.37 -0.34 7 1470 7.29 0.43 -0.17 8 1874 7.54 0.50 0.00 9 1950 7.58 0.57 0.17
10 2089 7.64 0.63 0.34 11 2222 7.71 0.70 0.52 12 2369 7.77 0.77 0.73 13 2601 7.86 0.83 0.97 14 3191 8.07 0.90 1.28 15 3487 8.16 0.97 1.83
Mean: 7.54
Std Dev: 0.36 Group 4: 70°C/85%
Failure order Hours to failure (H) Ln(H) Median rank Critical value
1 472 6.16 0.03 -1.83 2 478 6.17 0.10 -1.28 3 479 6.17 0.17 -0.97 4 480 6.17 0.23 -0.73
September 2007 24

NIST/LC: OPTICAL DISC LONGEVITY STUDY
5 485 6.18 0.30 -0.52 6 496 6.21 0.37 -0.34 7 496 6.21 0.43 -0.17 8 499 6.21 0.50 0.00 9 506 6.23 0.57 0.17
10 512 6.24 0.63 0.34 11 515 6.24 0.70 0.52 12 546 6.30 0.77 0.73 13 555 6.32 0.83 0.97 14 557 6.32 0.90 1.28 15 564 6.34 0.97 1.83
Mean: 6.21
Std Dev: 0.06 Group 5: 70°C/70%
Failure order Hours to failure (H) Ln(H) Median rank Critical value
1 1951 7.58 0.03 -1.83 2 2330 7.75 0.10 -1.28 3 3003 8.01 0.17 -0.97 4 3187 8.07 0.23 -0.73 5 3192 8.07 0.30 -0.52 6 3532 8.17 0.37 -0.34 7 3638 8.20 0.43 -0.17 8 3686 8.21 0.50 0.00 9 3727 8.22 0.57 0.17
10 3858 8.26 0.63 0.34 11 3977 8.29 0.70 0.52 12 4019 8.30 0.77 0.73 13 4087 8.32 0.83 0.97 14 5619 8.63 0.90 1.28 15 6149 8.72 0.97 1.83
Mean: 8.21
Std Dev: 0.29 Group 6: 60°C/85%
Failure order Hours to failure (H) Ln(H) Median rank Critical value
1 765 6.64 0.02 -2.05 2 773 6.65 0.06 -1.55 3 777 6.66 0.10 -1.28 4 777 6.66 0.14 -1.08 5 781 6.66 0.18 -0.92 6 782 6.66 0.22 -0.77 7 782 6.66 0.26 -0.64 8 800 6.68 0.30 -0.52 9 803 6.69 0.34 -0.41
10 803 6.69 0.38 -0.31 11 809 6.70 0.42 -0.20
September 2007 25
NIST/LC: OPTICAL DISC LONGEVITY STUDY
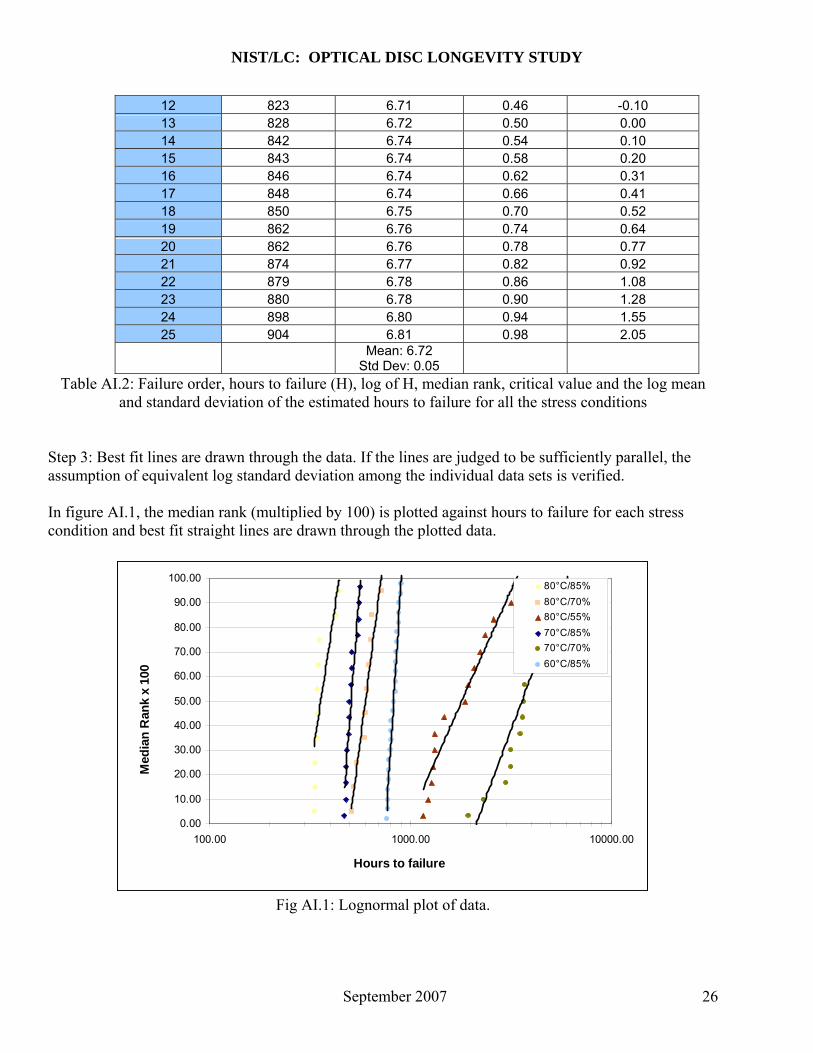
12 823 6.71 0.46 -0.10 13 828 6.72 0.50 0.00 14 842 6.74 0.54 0.10 15 843 6.74 0.58 0.20 16 846 6.74 0.62 0.31 17 848 6.74 0.66 0.41 18 850 6.75 0.70 0.52 19 862 6.76 0.74 0.64 20 862 6.76 0.78 0.77 21 874 6.77 0.82 0.92 22 879 6.78 0.86 1.08 23 880 6.78 0.90 1.28 24 898 6.80 0.94 1.55 25 904 6.81 0.98 2.05
Mean: 6.72
Std Dev: 0.05 Table AI.2: Failure order, hours to failure (H), log of H, median rank, critical value and the log mean
and standard deviation of the estimated hours to failure for all the stress conditions Step 3: Best fit lines are drawn through the data. If the lines are judged to be sufficiently parallel, the assumption of equivalent log standard deviation among the individual data sets is verified. In figure AI.1, the median rank (multiplied by 100) is plotted against hours to failure for each stress condition and best fit straight lines are drawn through the plotted data.
0.00
10.00
20.00
30.00
40.00
50.00
60.00
70.00
80.00
90.00
100.00
100.00 1000.00 10000.00
Hours to failure
Med
ian
Ran
k x
100
80°C/85%
80°C/70%
80°C/55%
70°C/85%
70°C/70%
60°C/85%
Fig AI.1: Lognormal plot of data.
September 2007 26
NIST/LC: OPTICAL DISC LONGEVITY STUDY
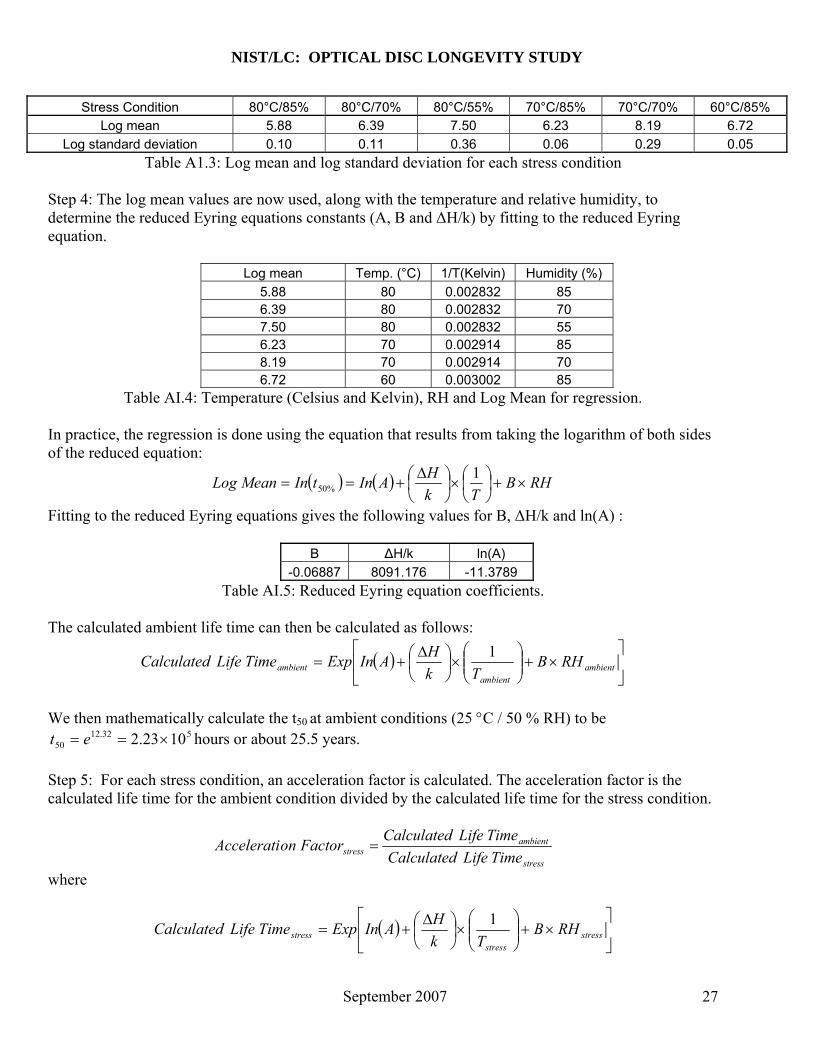
Stress Condition 80°C/85% 80°C/70% 80°C/55% 70°C/85% 70°C/70% 60°C/85% Log mean 5.88 6.39 7.50 6.23 8.19 6.72
Log standard deviation 0.10 0.11 0.36 0.06 0.29 0.05
Table A1.3: Log mean and log standard deviation for each stress condition
Step 4: The log mean values are now used, along with the temperature and relative humidity, to determine the reduced Eyring equations constants (A, B and ΔH/k) by fitting to the reduced Eyring equation.
Log mean Temp. (°C) 1/T(Kelvin) Humidity (%)
5.88 80 0.002832 85 6.39 80 0.002832 70 7.50 80 0.002832 55 6.23 70 0.002914 85 8.19 70 0.002914 70 6.72 60 0.003002 85
Table AI.4: Temperature (Celsius and Kelvin), RH and Log Mean for regression. In practice, the regression is done using the equation that results from taking the logarithm of both sides of the reduced equation:
RHBTk
HAIntInMeanLog
1%50
Fitting to the reduced Eyring equations gives the following values for B, ΔH/k and ln(A) :
B ΔH/k ln(A)
-0.06887 8091.176 -11.3789
Table AI.5: Reduced Eyring equation coefficients. The calculated ambient life time can then be calculated as follows:
ambient
ambientambient RHB
Tk
HAInExpTimeLifeCalculated
1
We then mathematically calculate the t50 at ambient conditions (25 C / 50 % RH) to be
hours or about 25.5 years. 532.1250 1023.2 et
Step 5: For each stress condition, an acceleration factor is calculated. The acceleration factor is the calculated life time for the ambient condition divided by the calculated life time for the stress condition.
stress
ambientstress TimeLifeCalculated
TimeLifeCalculatedFactoronAccelerati
where
stress
stressstress RHB
Tk
HAInExpTimeLifeCalculated
1
September 2007 27
NIST/LC: OPTICAL DISC LONGEVITY STUDY
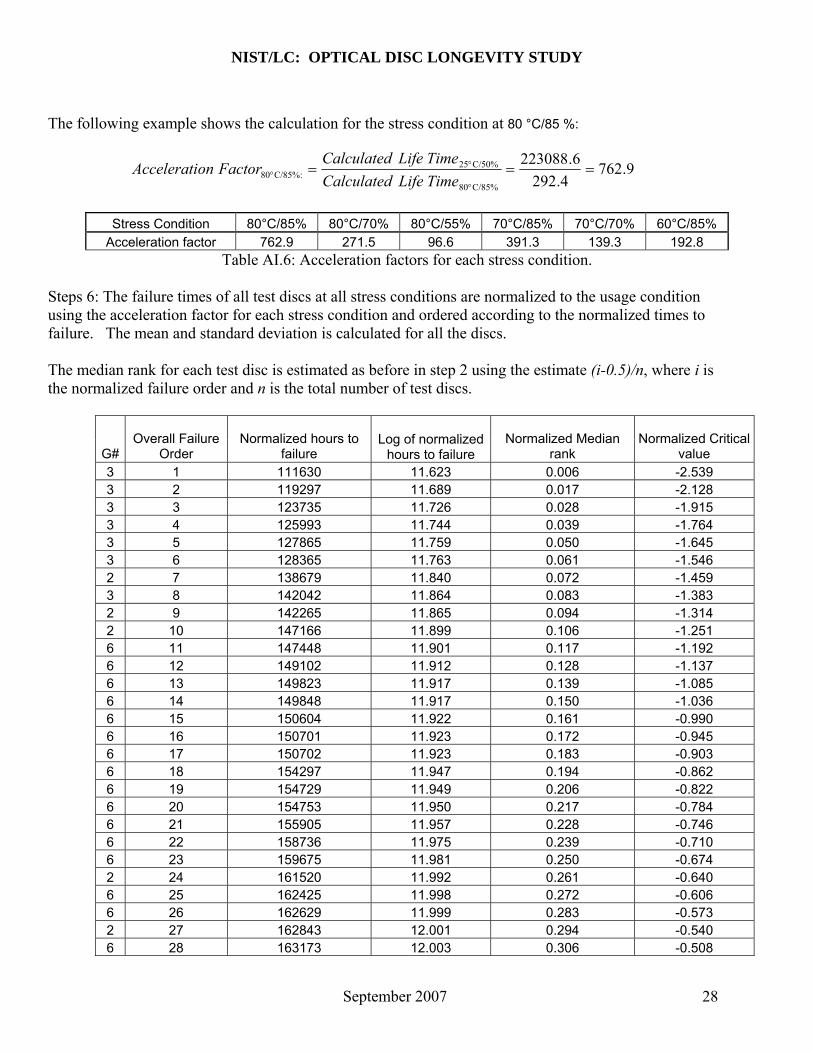
The following example shows the calculation for the stress condition at 80 °C/85 %:
9.7624.292
6.223088
C/85%80
C/50%25:C/85%80
TimeLifeCalculated
TimeLifeCalculatedFactoronAccelerati
Stress Condition 80°C/85% 80°C/70% 80°C/55% 70°C/85% 70°C/70% 60°C/85%
Acceleration factor 762.9 271.5 96.6 391.3 139.3 192.8 Table AI.6: Acceleration factors for each stress condition.
Steps 6: The failure times of all test discs at all stress conditions are normalized to the usage condition using the acceleration factor for each stress condition and ordered according to the normalized times to failure. The mean and standard deviation is calculated for all the discs. The median rank for each test disc is estimated as before in step 2 using the estimate (i-0.5)/n, where i is the normalized failure order and n is the total number of test discs.
G# Overall Failure
Order Normalized hours to
failure
Log of normalized
hours to failure Normalized Median
rank Normalized Critical
value 3 1 111630 11.623 0.006 -2.539 3 2 119297 11.689 0.017 -2.128 3 3 123735 11.726 0.028 -1.915 3 4 125993 11.744 0.039 -1.764 3 5 127865 11.759 0.050 -1.645 3 6 128365 11.763 0.061 -1.546 2 7 138679 11.840 0.072 -1.459 3 8 142042 11.864 0.083 -1.383 2 9 142265 11.865 0.094 -1.314 2 10 147166 11.899 0.106 -1.251 6 11 147448 11.901 0.117 -1.192 6 12 149102 11.912 0.128 -1.137 6 13 149823 11.917 0.139 -1.085 6 14 149848 11.917 0.150 -1.036 6 15 150604 11.922 0.161 -0.990 6 16 150701 11.923 0.172 -0.945 6 17 150702 11.923 0.183 -0.903 6 18 154297 11.947 0.194 -0.862 6 19 154729 11.949 0.206 -0.822 6 20 154753 11.950 0.217 -0.784 6 21 155905 11.957 0.228 -0.746 6 22 158736 11.975 0.239 -0.710 6 23 159675 11.981 0.250 -0.674 2 24 161520 11.992 0.261 -0.640 6 25 162425 11.998 0.272 -0.606 6 26 162629 11.999 0.283 -0.573 2 27 162843 12.001 0.294 -0.540 6 28 163173 12.003 0.306 -0.508
September 2007 28

NIST/LC: OPTICAL DISC LONGEVITY STUDY
6 29 163448 12.004 0.317 -0.477 6 30 163934 12.007 0.328 -0.446 2 31 165225 12.015 0.339 -0.415 6 32 166263 12.021 0.350 -0.385 6 33 166288 12.021 0.361 -0.355 6 34 168580 12.035 0.372 -0.326 2 35 169241 12.039 0.383 -0.297 6 36 169404 12.040 0.394 -0.268 6 37 169578 12.041 0.406 -0.239 6 38 173190 12.062 0.417 -0.210 6 39 174306 12.069 0.428 -0.182 2 40 174455 12.069 0.439 -0.154 2 41 174962 12.072 0.450 -0.126 3 42 181068 12.107 0.461 -0.098 4 43 184609 12.126 0.472 -0.070 4 44 186942 12.139 0.483 -0.042 4 45 187589 12.142 0.494 -0.014 4 46 187641 12.142 0.506 0.014 3 47 188458 12.147 0.517 0.042 4 48 189863 12.154 0.528 0.070 4 49 193890 12.175 0.539 0.098 4 50 194087 12.176 0.550 0.126 4 51 195165 12.182 0.561 0.154 2 52 196027 12.186 0.572 0.182 4 53 197928 12.196 0.583 0.210 4 54 200416 12.208 0.594 0.239 4 55 201425 12.213 0.606 0.268 3 56 201843 12.215 0.617 0.297 4 57 213813 12.273 0.628 0.326 3 58 214677 12.277 0.639 0.355 4 59 217322 12.289 0.650 0.385 4 60 217844 12.292 0.661 0.415 4 61 220833 12.305 0.672 0.446 3 62 228945 12.341 0.683 0.477 3 63 251373 12.435 0.694 0.508 1 64 253925 12.445 0.706 0.540 1 65 256649 12.455 0.717 0.573 1 66 257134 12.457 0.728 0.606 1 67 261155 12.473 0.739 0.640 1 68 262896 12.480 0.750 0.674 1 69 264425 12.485 0.761 0.710 1 70 265075 12.488 0.772 0.746 1 71 268928 12.502 0.783 0.784 5 72 271633 12.512 0.794 0.822 3 73 308305 12.639 0.806 0.862 5 74 324401 12.690 0.817 0.903 1 75 327043 12.698 0.828 0.945 3 76 336984 12.728 0.839 0.990 1 77 337363 12.729 0.850 1.036
September 2007 29
NIST/LC: OPTICAL DISC LONGEVITY STUDY
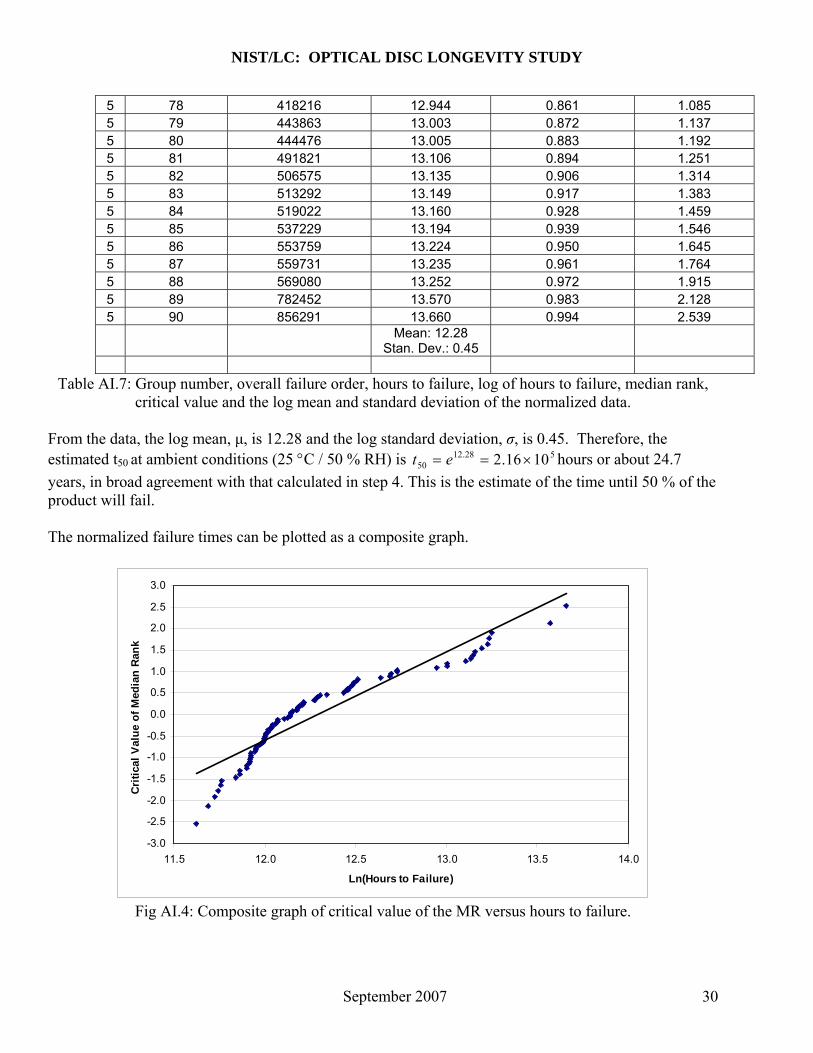
5 78 418216 12.944 0.861 1.085 5 79 443863 13.003 0.872 1.137 5 80 444476 13.005 0.883 1.192 5 81 491821 13.106 0.894 1.251 5 82 506575 13.135 0.906 1.314 5 83 513292 13.149 0.917 1.383 5 84 519022 13.160 0.928 1.459 5 85 537229 13.194 0.939 1.546 5 86 553759 13.224 0.950 1.645 5 87 559731 13.235 0.961 1.764 5 88 569080 13.252 0.972 1.915 5 89 782452 13.570 0.983 2.128 5 90 856291 13.660 0.994 2.539
Mean: 12.28
Stan. Dev.: 0.45
Table AI.7: Group number, overall failure order, hours to failure, log of hours to failure, median rank, critical value and the log mean and standard deviation of the normalized data.
From the data, the log mean, μ, is 12.28 and the log standard deviation, σ, is 0.45. Therefore, the estimated t50 at ambient conditions (25 C / 50 % RH) is hours or about 24.7
years, in broad agreement with that calculated in step 4. This is the estimate of the time until 50 % of the product will fail.
528.1250 1016.2 et
The normalized failure times can be plotted as a composite graph.
-3.0
-2.5
-2.0
-1.5
-1.0
-0.5
0.0
0.5
1.0
1.5
2.0
2.5
3.0
11.5 12.0 12.5 13.0 13.5 14.0
Ln(Hours to Failure)
Cri
tica
l V
alu
e o
f M
edia
n R
ank
Fig AI.4: Composite graph of critical value of the MR versus hours to failure.
September 2007 30

NIST/LC: OPTICAL DISC LONGEVITY STUDY
Step 7: The 95 % survival probability for lifetime (i.e. the estimate of the time until 5 % of the products will fail) at ambient conditions (25 C / 50 % RH) is calculated with 95 % confidence level using the log mean, μ, and the log standard deviation, σ, of the normalized data at ambient conditions (25 C / 50 % RH) and a 95 % confidence factor. The log mean and the log standard deviation are:
28.12 MedianLog 45.0
The 95 % confidence factor is given by
n
96.1 , for a sample size of, n, which is 90 in our study. It
represents an offset to the natural log of the lifetime of the discs for the survival probability.
094.090
45.096.1%95
FactorConfidence
We then estimate the 95 % survival probability with 95 % confidence to be hours or about 10.7 years.
41033.9
Using this model, the life expectancy is calculated for discs maintained at 25 °C/50 % RH. Discs exposed to more severe conditions of temperature and humidity are expected to experience a shorter life.
September 2007 31
NIST/LC: OPTICAL DISC LONGEVITY STUDY
September 2007 32
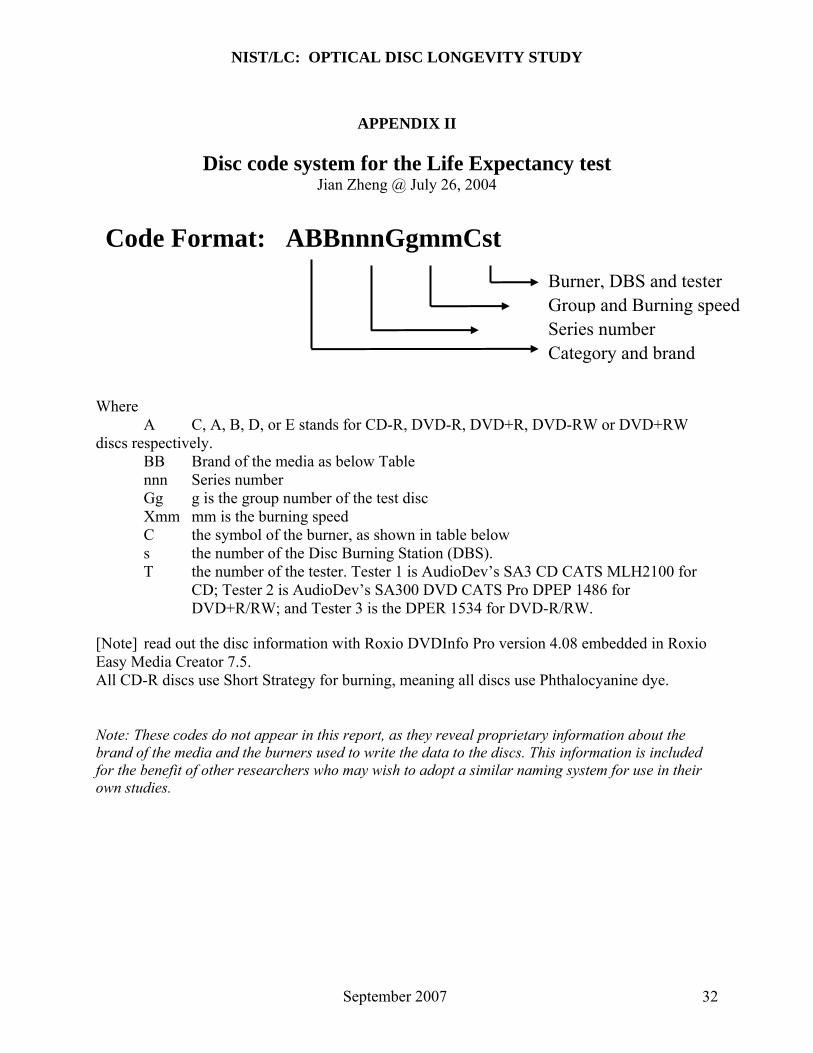
APPENDIX II
Disc code system for the Life Expectancy test Jian Zheng @ July 26, 2004
Burner, DBS and tester Group and Burning speed Series number Category and brand
Code Format: ABBnnnGgmmCst
Where A C, A, B, D, or E stands for CD-R, DVD-R, DVD+R, DVD-RW or DVD+RW discs respectively. BB Brand of the media as below Table nnn Series number Gg g is the group number of the test disc Xmm mm is the burning speed
C the symbol of the burner, as shown in table below s the number of the Disc Burning Station (DBS). T the number of the tester. Tester 1 is AudioDev’s SA3 CD CATS MLH2100 for
CD; Tester 2 is AudioDev’s SA300 DVD CATS Pro DPEP 1486 for DVD+R/RW; and Tester 3 is the DPER 1534 for DVD-R/RW.
[Note] read out the disc information with Roxio DVDInfo Pro version 4.08 embedded in Roxio Easy Media Creator 7.5. All CD-R discs use Short Strategy for burning, meaning all discs use Phthalocyanine dye. Note: These codes do not appear in this report, as they reveal proprietary information about the brand of the media and the burners used to write the data to the discs. This information is included for the benefit of other researchers who may wish to adopt a similar naming system for use in their own studies.