final report “radio frequency spectrum requirement
TRANSCRIPT
12.03.2003 2002_139_Final_report_trs125-2_V1.1.doc 1
© LS telcom AG reserves all rights including intellectual property rights and all rights of disposal
Final Report
“Radio Frequency Spectrum Requirement Calculationsfor
Future Aeronautical Mobile(Route) System. AM(R)S”
TRS-125/02
Version 1.1
Authors
Name
Date
W. Schütz
12.03.2003
M. Schmidt
12.03.2003
Approval
Name
Date
T. Jacob
20.03.2003

12.03.2003 2002_139_Final_report_trs125-2_V1.1.doc 2
© LS telcom AG reserves all rights including intellectual property rights and all rights of disposal
Change History
Ver. Date Author(s) Nature of change Pages
modif. added del.
1.0 12.02.2003 W. SchützM. Schmidt
Document creation
1.1 12.03.2003 W. Schütz Minor Editorial ChangesSpelling
Limitations of PIAC Method,missing Ground Communicationand “Data Explosion” Phenom-ena
8
Remark regarding Safety of LiveApplication
8,30,41
Clarification: Impact of nonhomogenous Aircraft Distribu-tion
16,33
Calculation of Bandwidth with-out Video Service
37
Differences between ITU –Method and used Approach
38 ff.
Clarification: Maximum TransmitPower for Base Station / 50 kmCell Radius
16,32
Clarification: Selection of Eb/NoRequirement
33
Comparison of Net SystemCapabilities for different sys-tems
40

12.03.2003 2002_139_Final_report_trs125-2_V1.1.doc 3
© LS telcom AG reserves all rights including intellectual property rights and all rights of disposal
0. Table of Content
1. EXECUTIVE SUMMARY....................................................................................................... 5
1.1. GENERAL............................................................................................................................ 51.2. SUMMARY OF RESULTS ....................................................................................................... 5
2. VERIFICATION OF EXISTING EUROCONTROL MODEL................................................ 7
2.1. DISCUSSION OF THE METHOD TO CALCULATE THE EXPECTED THROUGHPUT ........................... 72.1.1. Calculation of the average Number of Aircraft .............................................................. 72.1.2. Calculation of the required Bandwidth for the different Services..................................... 8
2.2. DISCUSSION OF CALCULATIONS OF REQUIRED BANDWIDTH................................................... 82.2.1. Analysis of the Calculations in the Link Budget ............................................................. 92.2.2. Analysis of Method to Calculate C/Nto at Cell Border.................................................. 132.2.3. Discussion of the used Assumptions during Calculation ............................................... 15
3. SENSITIVITY ANALYSIS .................................................................................................... 18
3.1. IMPROVED MODEL FOR BANDWIDTH CALCULATION ............................................................183.1.1. General Equation for the required Bandwidth ............................................................. 183.1.2. Impact of fixed RF-Bandwidth .................................................................................... 20
3.2. RESULTS OF SENSITIVITY ANALYSIS....................................................................................213.2.1. Variation of Cell Radius............................................................................................. 223.2.2. Variation of Transmit Power ...................................................................................... 233.2.3. Variation of Adjacent Cell Factor............................................................................... 253.2.4. Variation of Eb/No Requirement................................................................................. 273.2.5. Variation of Frequency .............................................................................................. 28
4. CALCULATION OF REQUIRED BANDWIDTH................................................................. 30
4.1. CALCULATION OF THROUGHPUT PER SERVICE AND AIRCRAFT ..............................................304.2. SYSTEM PARAMETER USED FOR CALCULATION....................................................................324.3. REQUIRED BANDWIDTH FOR VOICE.....................................................................................334.4. REQUIRED BANDWIDTH FOR DATA AND SECURITY...............................................................344.5. REQUIRED BANDWIDTH FOR COMMERCIAL DATA................................................................344.6. REQUIRED BANDWIDTH FOR VIDEO ....................................................................................354.7. REQUIRED BANDWIDTH FOR AVERAGED DATA RATE ...........................................................354.8. TOTAL BANDWIDTH REQUIREMENT ....................................................................................364.9. COMPARISON OF USED METHODOLOGY WITH METHODOLOGY DEFINED BY ITU ....................38

12.03.2003 2002_139_Final_report_trs125-2_V1.1.doc 4
© LS telcom AG reserves all rights including intellectual property rights and all rights of disposal
4.9.1. Comparison of Net System Capabilities....................................................................... 40
5. CONCLUSION....................................................................................................................... 41
6. APPENDIX............................................................................................................................. 42
6.1. REFERENCES ......................................................................................................................426.2. MOTIVATION FOR MULTI RATE MODEL...............................................................................446.3. USED PARAMETER FOR THROUGHPUT CALCULATION...........................................................476.4. MATHEMATICAL CONVENTIONS..........................................................................................516.5. CALCULATION OF C/NO FROM C/IO AND C/NTO:..................................................................526.6. CALCULATION OF B BASED ON C/IO REQUIRED AND U ..........................................................536.7. MODELING OF FACTOR FOR ADJACENT CELL INTERFERENCE:...............................................546.8. GENERAL EQUATION FOR THE CALCULATION OF THE REQUIRED BANDWIDTH B ....................566.9. IMPACT OF SPREADING FACTOR..........................................................................................586.10. SAMPLE CALCULATION OF INTERFERENCE SITUATION FOR CELL WITH TWO SERVICES........60
12.03.2003 2002_139_Final_report_trs125-2_V1.1.doc 5
© LS telcom AG reserves all rights including intellectual property rights and all rights of disposal
1. Executive Summary
1.1. General
The availability of radio spectrum is vital for efficient air traffic management and its safety of lifeservices. Failure to be able to meet the demand for radio spectrum will prevent the full imple-mentation of the ECAC ATM2000+ strategy. Therefore the air traffic capacity will not be adaptedto the future traffic, causing increased delays. The ATM 2000+ strategy recognizes that the de-velopment of communication data links and the use of more spectrally efficient technology areimportant factors to solve the foreseen communication capacity limitation. The ICAO AMCP andEUROCONTROL COMT have decided to request ITU to provide a new radio allocation forthese new communication applications.
For this purpose EUROCONTROL is preparing a number of documents for submissions into theCEPT and the ITU. Aviation is hoping to secure an agenda item for WRC 2006 to open discus-sions for a new radio spectrum allocation for an Aviation Mobile Communication system.
In this context it has been necessary to investigate some preliminary scenarios and carry outprovisional calculations as to the amount of spectrum required. To do this, EUROCONTROLhas developed a preliminary spectrum capacity model working on basic fundamentals.
The scope of this study has been to validate the general feasibility of the method and the takenassumptions during development of the model by EUROCONTROL, to extend the model and toperform provisional bandwidth calculations.
At the current stage of the project a decision regarding the technology has not been taken, thecalculations have been performed for an exemplary state of the art W-CDMA system like it isused in 3G cellular Networks. System parameter have been selected in accordance with currentstandards, and the impact on bandwidth requirement has been analyzed by the means of asensitivity analysis.
The required bandwidth has been determined for different services like voice, data and videoseparately and the total bandwidth requirements have been calculated.
1.2. Summary of Results
The method used to calculate the expected throughput in [1] is based on what is done for ter-restrial cellular networks like UMTS or IMT-2000 by the ITU ([12] and [10]) and the UMTS Fo-rum [11]. One major difference is that in [10] and [11] the required bandwidth is calculated sepa-
12.03.2003 2002_139_Final_report_trs125-2_V1.1.doc 6
© LS telcom AG reserves all rights including intellectual property rights and all rights of disposal
rately and finally summed up over the different services like speech and data while the usedapproach in [1] first sums up the data rates of all services and than calculates the requiredbandwidth. Though the general method to calculate the bit rates per service is applied in a cor-rect way some factors increasing the bit rates like coding, protocol overhead and impact of han-dover are missing or are handled in different ways for the diverse services like voice and data.
The method used to calculate the required bandwidth is based on principle equations for aCDMA System and are valid under several assumptions like ideal working power control, largenumber of aircraft with homogenous spatial distribution and equal data rate per aircraft.Whereas the imprecision coming from most of the assumptions can be justified or removed byslight changes in the model, the latter one is a strong limitation to the method because the pro-jected system will use different data rates in parallel. It is not yet known how this different datarates will be transmitted on the air interface in the new system, but it is possible that a similarmethod like in 3G-CDMA-Systems will be used. If under this scenario the applied method tocalculate the required bandwidth will be exact enough should be topic of further investigations.
The preliminary model developed by EUROCONTROL has been extended by DFS / LS telcom.The extension comprises a more general modeling of the bandwidth calculation and the consid-eration of systems that are using a fixed RF-Bandwidth. The calculation of throughput informa-tion for different services has been implemented in an excel sheet and the general handling ofthe excel module has been improved.
With the extended model a sensitivity analysis has been performed to identify the impact oftechnical parameter of the bandwidth requirements. Based on the results of this analysis theparameter for the bandwidth calculation has been selected.
At the final stage of the project the bandwidth requirement has been calculated. For this thetraffic in the airspace sector has been modeled in two different ways. The one way follows themethod outlined by EUROCONTROL in [1] where an average data rate per aircraft is calcu-lated. The other way has been to calculate channel requirements and use fixed channel rates toobtain the final bandwidth. For the latter one, additional calculations have been performed for asystem with fixed RF-Bandwidth (3,84 Mchip/s and 1,2288 Mchip/s).
Depending on the calculation method the bandwidth requirements are found to be in a range ofapprox. 16 to 22 MHz. (4 to 8 MHz for Uplink (ground to aircraft) and 12 to 14 MHz for Downlink(aircraft to ground)). When video services are not considered the bandwidth requirements arereduced to a range of 10 to 20 MHz.
As the results have been obtained disregarding the impact of inter service interferences furtherstudies should examine this effect to consolidate the found results.

12.03.2003 2002_139_Final_report_trs125-2_V1.1.doc 7
© LS telcom AG reserves all rights including intellectual property rights and all rights of disposal
2. Verification of existing EUROCONTROL Model
This section discusses the calculations used in [1] to determine the required bandwidth for afuture ground based cellular network for Aeronautical Mobile (Route) System AM(R)S. Therehas been no decision taken yet regarding the technology that may be used for this system. Theprovisional calculations [1] have been performed under the assumption that state of the artCDMA-technology will be used.
The calculations are done in two parts that are:
• Calculation of the expected throughput in kBit/s
• Calculation of the required bandwidth to satisfy expected throughput
The two calculation methods will be discussed separately in the following sections.
2.1. Discussion of the Method to calculate the expected Throughput
The calculation of the required capacity is done in the following steps:
• Calculation of the average number of aircraft in one airspace sector for the year 2029which is expected to be the year when the new system will be replaced
• Determination of bit rate for different services like voice, data, and, video for uplink anddownlink
• Summation over all services to get the complete throughput
2.1.1. Calculation of the average Number of Aircraft
The calculation for the average number of aircraft in one airspace sector is done in a straight-forward way. Based on the PIAC calculated for year 2000 the PIAC for 2029 should be calcu-lated. In fact the PIAC for 2030 has been calculated and used for the ongoing analyses of traf-fic.
Under the assumption that the aircraft are distributed homogenous in the complete area of theairspace sector the PIAC may be distributed by the size of the sector. This will lead to the air-craft density per km² that is quite similar to user densities used for the traffic dimensioning ofmobile networks. Nevertheless one limitation for the homogenous distribution may occur, whenthe cell areas of the projected network will get smaller and smaller. The one sector that contains
12.03.2003 2002_139_Final_report_trs125-2_V1.1.doc 8
© LS telcom AG reserves all rights including intellectual property rights and all rights of disposal
the airport will be loaded higher than the other ones because all aircraft will cross this sectorduring start and landing.
As on the one hand the forecast based on PIAC does not include traffic needed for taxiway andground communication, the cell load at the airport cell will be higher than assumed in the usedapproach. On the other hand an umbrella cell for transiting aircraft may serve a part of the trafficand therefore decrease the traffic load in the network.
A constant traffic demand per aircraft for the complete period (year 2000 to 2030) has beenused. A growth in offered traffic per aircraft based on the implementation of new services hasnot been respected.
For calculations in further studies therefore the model used for the traffic forecast should beextended.
2.1.2. Calculation of the required Bandwidth for the different Services
The calculation of the required bandwidth is done for different services and based on statisticalinformation and assumptions coming from existing applications. For each service the neededaverage bit rate is calculated and afterwards the total data rate is obtained by summing up overall services. For some services additional factors like protocol overhead and overhead for han-dover are respected whereas for other services these factors have not been applied. It seemsthat no factor for the overhead coming from channel coding has been used. In fact it is veryprobable that coding will be used and therefore the gross bit rates on the air interface will behigher that the data rates offered to the end user. Additionally an overhead for the control infor-mation used inside the system itself (e.g. for handover and power control) should be added.
In our opinion the effect of soft handover on the required bandwidth should not be modeled in-side the calculation of the required data rate for services but should be implemented in the cal-culation of number of aircraft per cell. This will be in accordance to the fact that soft handoverwill increase the number of aircraft in a cell but not the data rate used per aircraft.
The calculation for voice is based on the average talk time, the time spent in the sector, andfrom the PIAC value for 2030. From this the average number of needed channels (at 20 kBit/s)is calculated. This method does not care about blocking characteristics. At the first glance, thisis uncommon to the dimensioning of telecommunication networks, where typically a blockingmodel like Erlang B is applied for voice services. Nevertheless this approach can be justifiedbecause the safety-of-life applications in aviation do not allow blocking.
2.2. Discussion of Calculations of required Bandwidth
In this paragraph the calculations performed in the file link budgetmodelversion3.xls will beanalyzed. The discussion will be done in the following steps
12.03.2003 2002_139_Final_report_trs125-2_V1.1.doc 9
© LS telcom AG reserves all rights including intellectual property rights and all rights of disposal
• Analysis of the calculations performed in the link budget sheet
• Analysis of used method to calculate C/Nto at the cell border
• Discussion of the used assumptions during calculation
2.2.1. Analysis of the Calculations in the Link Budget
The Excel-File linkbudgetmodelversion3.xls contains 3 sheets (Feuil1, Feuil2 and Feuil3). In thefollowing only Feuil1 and Feuil3 are discussed. Feuil3 contains the same link budgets for differ-ent cell radius as in document [1] whereas Feuil 1 contains two link budgets. The first linkbudged is the same as found in [2] for a data rate of 384 kBit/s the second seems to be an in-termediate step towards the budgets on Feuil3.
The calculations in the spreadsheets are based on some principal equations as found in litera-ture.
For the calculation of the required carrier to noise ratio in the case of digital transmission thefollowing equation applies:
rNE
NC
requiredo
b
requiredo
log10+= [dBHz] (2-1)
Equation (2-1) can be found for example in [6].
The following definitions apply:
requiredo
b
NE
Required energy per bit to noise ratio for a given modulation schemeand a given bit error rate for the transmission. In some definitions (forexample for ETSI UMTS) this value also includes the gain coming fromerror correction methods like interleaving and coding.
r Gross bit rate of the signal including overhead coming from error pro-tection and transmission protocol
)log(10 cC = Received power of wanted signal in dBW
)log(10 oo nN = Power spectral density of all signals exclusive the wanted signal indBHz
For a CDMA system oN consists of two parts, the one coming from thermal noise, the other one
coming from self-interference:

12.03.2003 2002_139_Final_report_trs125-2_V1.1.doc 10
© LS telcom AG reserves all rights including intellectual property rights and all rights of disposal
)log(10 otoo inN += [dBHz] (2-2)
with
ton Power spectral density of thermal noise
oi Power spectral density of other interference
For calculation of the available carrier to self-interference ratio for a single cell loaded with uaircraft the following equation is used:
uIC
available
log10−= [dB] (2-3)
In fact this is an approximation for u >> 1, the correct equation can be obtained under the as-sumption that all received signals form the different aircraft are having the same power c in Watt(ideal power control) [5]:
)1log(10)1(
log10log10 −−=⋅−
== ucu
cic
IC
available
[dB] (2-4)
with
c Power of received signal in watt
i Power of all interfering signals in watt
u Number of aircraft in cell
It is obvious that Equation (2-4) is only valid for u > 1, as for a system with only one aircraft noself-interference is found under the assumption that interference from multi path propagationcan be neglected.
To calculate the required bandwidth that is needed to allow transmission for a given number uof aircraft in a cell two different approaches are used inside the excel-file.
Approach used on Feuil1:
This calculation method is using a straightforward approach to check if a given bandwidth b issufficient to operate u aircraft with a data rate r in a cell with a specific size:
Step 1
The C/No required for a given bit rate r is calculated using equation (2-1).

12.03.2003 2002_139_Final_report_trs125-2_V1.1.doc 11
© LS telcom AG reserves all rights including intellectual property rights and all rights of disposal
Step 2
Under the assumption that the bandwidth b is available and u aircraft are using the system theavailable C/I in the cell is calculated, based on equation (2-3).
Step 3
To check if the C/No requirement is met in the cell, the available C/No is calculated from theavailable C/I. For this, first the available C/Io is calculated from the available C/I:
availableoavailableo IC
Bic
bbi
cic
IC
−=−=== log10)log(10)log(10log10 [dBHz] (2-5)
Afterwards the available C/No is derived from the available C/Io and the C/Nto:
)1010log(10 10100 availableto i
cn
c
availableoN
C −−+−= [dBHz] (2-6)
with
c Signal power in watt
ton Spectral power density of thermal noise
The validity of (2-6) is shown in Appendix 6.5.
The calculation of tonc is done at the cell border based on system parameter like antenna gain
and transmit power (see section 2.2.2 for a discussion of the used method).
Step 4
The required and the available C/No are compared. If the available C/No is higher than the re-quired one, the available bandwidth b is sufficient.
Approach used on Feuil3:
In this approach the required bandwidth b that is needed to operate u aircraft with a data rate rin a cell of a specific size s is calculated. Additional to Feuil1, three further parameter have beenadded in the spreadsheet: The “Cell Loading Factor” the “Cell Capacity Factor” and the “Aggre-gate Data Throughput”. The “Cell Loading Factor” is not used in the calculation whereas the“Cell Capacity Factor” is used to model the influence of adjacent cell interference that has beenneglected in the calculation on Feuil1. The “Aggregate Data Throughput” is standing for theoverall data throughput in the cell. The following steps are used during the calculation:
12.03.2003 2002_139_Final_report_trs125-2_V1.1.doc 12
© LS telcom AG reserves all rights including intellectual property rights and all rights of disposal
Step 1
Calculation of the data rate r used by one aircraft in the cell. For this the following equation isused:
γ⋅=
uV
r [bit/s] (2-7)
with
u Number of aircraft in cell
γ Cell Capacity Factor
ceInterferenCellAdjacentwithouttyCellcapaciceInterferenCellAdjacentwithtyCellcapaci
−−−−−−−−
=γ(2-8)
V Throughput in bit/s
The consideration of γ in equation (2-7) has the effect that the data rate r per user is increasedwhen the adjacent cell interference is getting higher. This is confusing at the first moment be-cause it seems to be logical that r just depends on the overall data throughput and the numberof aircraft. In Appendix 6.7 it is shown that under the assumption of tncu >>⋅ this method is
valid.
Step 2
Calculation of the required C/No according to Equation (2-1)
Step 3
Calculation of the required C/Io from the required C/No calculated in Step 3. For this the follow-ing equation is used.
)1010log(10 1010
0 torequired ncn
c
requiredoIC −−
−−= [dBHz] (2-9)
The validity of (2-9) can be shown in a similar way like it has been done for Equation(2-6) inAppendix 6.5.
Step 4
In the last step the required bandwidth is calculated using the equation

12.03.2003 2002_139_Final_report_trs125-2_V1.1.doc 13
© LS telcom AG reserves all rights including intellectual property rights and all rights of disposal
uIC
bBrequiredo
log10log10 +== [dBHz] (2-10)
Equation (2-10) can be derived from Equation (2-3) as shown in Appendix 6.6.
Please note that, like discussed for equation (2-3), equation (2-10) is only valid for 1>>u . Forsmall numbers of aircraft the term ulog should be replaced by )1log( −u .
Finally based on b the bandwidth required for guard bands is calculated by multiplying b withthe channel reuse factor. The total spectrum required is then calculated by the following equa-tion:
bbfactorreusechannelbtotal +⋅−−= [Hz] (2-11)
Based on Equation (2-11) large guard bands will be respected in the total required bandwidth.In [9] the ITU adds 5% of the calculated bandwidth for guard bands.
2.2.2. Analysis of Method to Calculate C/Nto at Cell Border
In the spreadsheet the signal to thermal noise ratio is calculated based on the following systemparameters:
tP Transmit power in dBW
tG Antenna gain of transmit antenna in dBi
rG Antenna gain of receive antenna in dBi
rF Noise factor of receiver in dB
CableL Cable loss in dB
PathL Path loss in dB
PolL Polarization loss in dB.
231038,1 −⋅=k Boltzman’s constant in Watt/Kelvin
T System temperature in Kelvin
d Distance to cell border in km
f Carrier frequency in MHz
12.03.2003 2002_139_Final_report_trs125-2_V1.1.doc 14
© LS telcom AG reserves all rights including intellectual property rights and all rights of disposal
)log(10 kTFLLGLGPNC
rPolCablerPathttto
−−−−+−+= [dBHz] (2-12)
For the calculation of the path loss the free space attenuation and the hygroscopic attenuationare respected. For the free space attenuation the following equation is used. It can be found forexample in [4]:
fdL spacefree log20log204.32 ++=− (2-13)
The used equation for the hygroscopic loss (Feuil1 in the second link budget) seems not to becorrect because the loss will get smaller when distance will increase. Nevertheless this is notvery important, as the equation has been again replaced in the budgets in Feuil3, which are thefinal ones. The equation used in Feuil3 is
dL chygroscopi ⋅= 133.0 (2-14)
This equation is matching the shape “ Attenuation = Factor * Distance” as found for example inthe recommendations of ITU.
The path loss is then calculated as sum of free space attenuation and hygroscopic attenuation:
chygroscopispacefreePath LLL += − (2-15)
Since the path loss depends of the distance d, the calculation of C/Nto is only valid at this posi-tion in the cell. In the link budgets for d the distance to the cell border is used. This is reason-able because this is the point inside the cell where C/Nto will have the smallest value withoutpower control. Under the assumption that ideal power control will be used the system will adjustthe power c to the same value all over the cell and therefore the same C/Nto will be available inthe whole cell.
The calculation of the C/Nto doesn’t comprise any margins for fading on the air interface. Againunder assumption of ideal fast power control this is valid because power control will equalize thefading notches. In this case a margin for power control headroom should be implemented in thebudged allowing some power reserves at the cell border. This will lead to smaller cell areas.

12.03.2003 2002_139_Final_report_trs125-2_V1.1.doc 15
© LS telcom AG reserves all rights including intellectual property rights and all rights of disposal
2.2.3. Discussion of the used Assumptions during Calculation
The following assumptions have been used during the calculations. They are either made di-rectly in [1] or are coming from the used equations of the excel file:
• Large number of aircraft
• Perfect power control
• Homogenous distribution of aircraft
• Same data rate for all aircraft
Large Number of Aircraft
The assumption that a large number of aircraft is connected in one cell is taken during calcula-tion of the interference in the cell and by respecting the adjacent cell interference in the calcula-tions of Feuil3. During the calculation of self-interference in the cell this assumption can be re-moved by exchanging the term log(u) by log(u-1). The latter limitation may be removed by ap-plying a more general equation for the required bandwidth.
Perfect Power Control
Ideal power control for uplink and downlink means that the ground station controls all signals ina way, that signals from different sources are received with the same power. This has to bevalid for uplink and downlink. It is quite obvious that for the single cell case this can be main-tained for the downlink because each aircraft can adjust it’s transmit power separately accordingto the path loss towards the ground station. Therefore all signals will have the same receivingpower c, even if the aircraft are operating in different distances to the ground station. In theuplink, for the operation of the system, no power control is needed because all signals trans-mitted to the different aircraft in the cell are coming from the same source and are sufferingtherefore the same path loss. When the same transmit power tP is used towards all aircraft, therequirement that all received signals are having the same power c is fulfilled. Power Control inuplink is only used to minimize the overall transmitted power and therefore to minimize adjacentcell interference.
The general situation will not change when adjacent cell interference has to be respected. Againpower control will work as described above, the only difference is, that higher transmit powerswill be needed to fulfill the Eb/No requirements.
Ideal power control assumes that there is no limit for the transmit power available to the aircraft.In reality, of course this is not possible. This leads to the effect that the possible cell sizes willget smaller when interference in the cell increases. This should be respected by a margin in thelink budget.

12.03.2003 2002_139_Final_report_trs125-2_V1.1.doc 16
© LS telcom AG reserves all rights including intellectual property rights and all rights of disposal
Please note that in CDMA-Systems the available transmit power of the ground station has to beshared between all aircraft. The calculation in the link budgets therefore assumes that at theground station in worst-case (all aircraft are operating at the cell border with full transmit power)a total power of WattWattpu t 208020104 =⋅=⋅ is available. For a cell radius of 75km 104aircraft are found in this cell, all having simultaneous communication in uplink (from ground toaircraft). This is just a theoretical limitation. It has to be considered, that it is quite unlikely that aseparate speech connection is established and active towards each aircraft at the same timebecause this would need 104 operators working simultaneous on ground. Typical shared chan-nels will handle group calls where an operator is addressing several aircraft at the same timeand thus reduce the maximum needed transmit power on ground. Smaller cell radius will de-crease the aircraft count per cell (e.g. 47 aircraft in a cell with 50 km cell radius) and decreasestransmit power requirements as well. Finally not all aircraft will operate at the cell border butcloser to the base station, thus leading again to smaller transmit powers.
In downlink (aircraft to ground) each aircraft operates it’s own transmitter and therefore powersharing between different aircrafts does not occur.
Homogenous Distribution of Aircraft
The assumption that the aircraft are distributed homogenous in the area of the airspace sectoris used, when the cells are split and the number of aircraft per cell is calculated by dividing thenumber of aircraft in the sector with the number of the cells per airspace sector.
During the calculation of the interference situation inside a single cell the distribution of the air-craft is not important, because power control will compensate the different path losses based onthe different distances.
For adjacent cell interference the position of aircraft will become important, as aircraft close tothe cell border will suffer and cause higher interference than aircraft in the middle of the cell.Depending of distribution of the aircraft different scenarios are possible. For example, in a ho-mogenous network six other cells surround a cell. Under the assumption that each cell containsthe same number of aircraft the interference coming from surrounding cells may be six timeshigher than interference coming from the own cell, if all aircraft are located at the cell bordertowards the inner cell.
A more detailed analysis under consideration of specific aircraft positions typically is done with aMonte Carlo simulation. This is outside the time frame of this study. We nevertheless assumethat the consideration of adjacent cell interference with a capacity factor is sufficient regardingthe overall accuracy of the applied method.
Same Data Rate for Aircraft
The calculations are based on the assumption that in a cell u aircraft operates a connection withthe same bit rate r. This bit rate r is the mean value calculated from the total throughput and thenumber of aircraft. In reality the throughput will consist of different data streams with different bit

12.03.2003 2002_139_Final_report_trs125-2_V1.1.doc 17
© LS telcom AG reserves all rights including intellectual property rights and all rights of disposal
rates like 20 kBit/s for speech and 384 kBit/s for video. In 3G – CDMA systems the differentdata rates will be transmitted with different spreading factors on the same bandwidth. For eachconnection the following equation has to be fulfilled[5]:
otorequiredo
b
inrc
NE
+=
/log10 [dBHz] (2-16)
If we assume that different data rates require the same Eb/No it is obvious that the receivedpower c will become dependent from the data rate r and therefore the interference situation foreach aircraft will become different. For each aircraft k in the cell the self-interference oki has tobe calculated according to the following equation:
∑≠=
=u
kjjbc
okji
,1(2-17)
The power values jc are dependent from each other because the power control mechanism
tries to minimize the interference in the cell. Because the reception power is depending from thebit rate (see 6.2) different services will have different impact on the overall interference. There-fore for an exact modeling of the interference Equation (2-16) have to solved for each user, or atleast for each service.
If the method, using averaged data rates instead of proper modeling with different data rates,will lead to valid results should be further investigated.
12.03.2003 2002_139_Final_report_trs125-2_V1.1.doc 18
© LS telcom AG reserves all rights including intellectual property rights and all rights of disposal
3. Sensitivity Analysis
The needed bandwidth for the projected communication system depends on various factors andtechnical parameter. At the current stage of the project not much is known about the final sys-tem and the probable range of parameter. Therefore values as defined in current 3G systemshave been used for the calculations.
To ensure that the results will be as close as possible to the real system requirements, a sensi-tivity analysis has been performed to identify the impact of different parameters on the calcu-lated bandwidth. Based on the results of this analysis, the parameter for the final calculationshave been selected.
For the sensitivity analysis the model as developed by EUROCONTROL has been improvedand used. A description of the extended model is given in Chapter 3.1, the different analysesare discussed in Chapter 3.2.
3.1. Improved Model for Bandwidth Calculation
In Chapter 2 the general feasibility of the developed EUROCONTROL model has been ana-lyzed and the feasibility of the method for single rate systems has been acknowledged. Addi-tionally some improvements have been implemented in an excel module that allows the analysiswith a fixed RF-Bandwidth.
3.1.1. General Equation for the required Bandwidth
The base for the extended excel module is the definition of the required Eb/No [5]:
adjootorequiredo
b
iinrc
ne
−++= (3-1)
With
c Power of wanted signal
r Data rate of the signal before spreading
oi Power spectral density of all interference coming from users in the cell

12.03.2003 2002_139_Final_report_trs125-2_V1.1.doc 19
© LS telcom AG reserves all rights including intellectual property rights and all rights of disposal
adjoi − Power spectral density of interference coming from adjacent cells
ton Power spectral density of thermal noise
c Power of wanted signal
Equation (3-1) can be solved either for bandwidth, needed power or number of user. Equation(3-2) gives the solution for the required bandwidth that has been derived in Appendix 6.8:
requiredo
bto
requiredo
b
ner
cn
ne
ru
b⋅⋅−
⋅⋅+⋅−
=1
)1()1( α(3-2)
The following parameter are used in addition to equation (3-1):
u Number of user in the cell
α Factor for adjacent cell interference
Equation (3-2) is valid under the following assumptions:
• Number of user u > 1
• Same receive power c for all users
• Same data rate r for all users
Please note that the factor α that is used to model the interference coming from adjacent cellsis handled in a different way than the cell capacity factorγ used in the spreadsheets comingfrom EUROCONTROL: A value of 0=α stands for no interference from adjacent cells,whereas for example a value of 5.0=α means that the power coming from adjacent cells is50% of the power originating from the own cell.
The cell capacity factor γ is defined as fraction of the capacity with adjacent cell interference tothe capacity without adjacent cell interference. From equation (6-27) for the capacity of thesystem it can be seen that
11
−=γ
α (3-3)
12.03.2003 2002_139_Final_report_trs125-2_V1.1.doc 20
© LS telcom AG reserves all rights including intellectual property rights and all rights of disposal
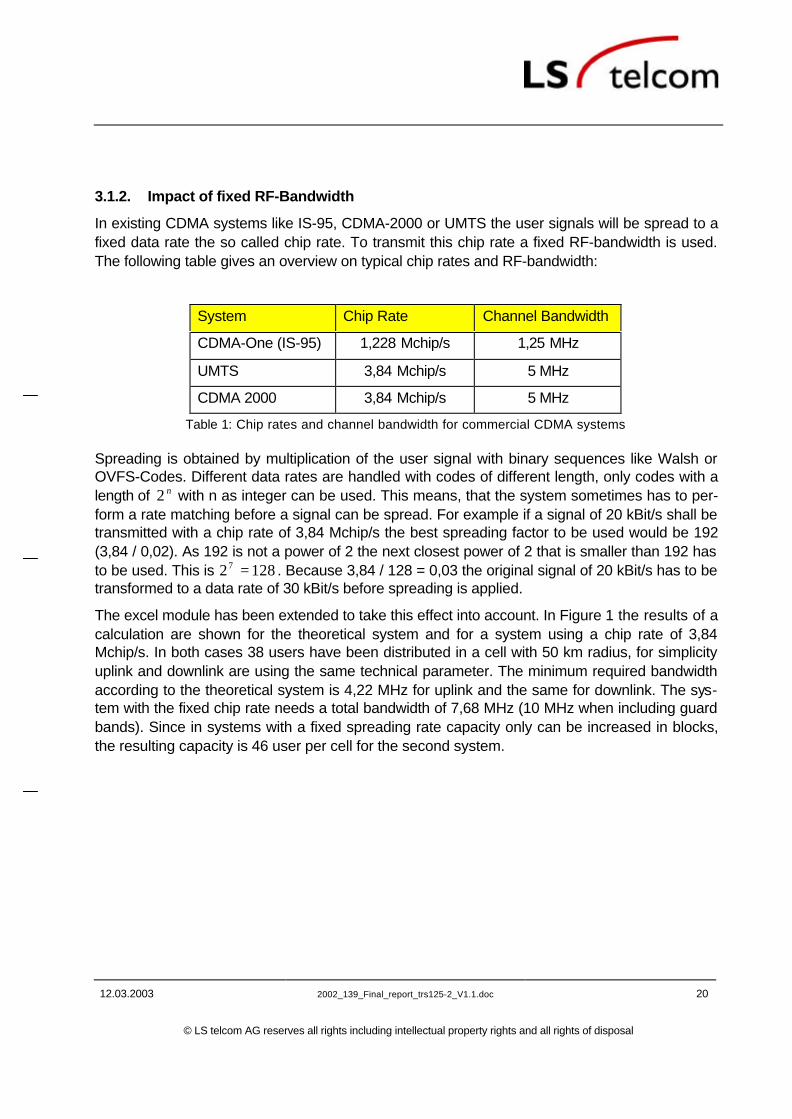
3.1.2. Impact of fixed RF-Bandwidth
In existing CDMA systems like IS-95, CDMA-2000 or UMTS the user signals will be spread to afixed data rate the so called chip rate. To transmit this chip rate a fixed RF-bandwidth is used.The following table gives an overview on typical chip rates and RF-bandwidth:
System Chip Rate Channel Bandwidth
CDMA-One (IS-95) 1,228 Mchip/s 1,25 MHz
UMTS 3,84 Mchip/s 5 MHz
CDMA 2000 3,84 Mchip/s 5 MHz
Table 1: Chip rates and channel bandwidth for commercial CDMA systems
Spreading is obtained by multiplication of the user signal with binary sequences like Walsh orOVFS-Codes. Different data rates are handled with codes of different length, only codes with alength of n2 with n as integer can be used. This means, that the system sometimes has to per-form a rate matching before a signal can be spread. For example if a signal of 20 kBit/s shall betransmitted with a chip rate of 3,84 Mchip/s the best spreading factor to be used would be 192(3,84 / 0,02). As 192 is not a power of 2 the next closest power of 2 that is smaller than 192 hasto be used. This is 12827 = . Because 3,84 / 128 = 0,03 the original signal of 20 kBit/s has to betransformed to a data rate of 30 kBit/s before spreading is applied.
The excel module has been extended to take this effect into account. In Figure 1 the results of acalculation are shown for the theoretical system and for a system using a chip rate of 3,84Mchip/s. In both cases 38 users have been distributed in a cell with 50 km radius, for simplicityuplink and downlink are using the same technical parameter. The minimum required bandwidthaccording to the theoretical system is 4,22 MHz for uplink and the same for downlink. The sys-tem with the fixed chip rate needs a total bandwidth of 7,68 MHz (10 MHz when including guardbands). Since in systems with a fixed spreading rate capacity only can be increased in blocks,the resulting capacity is 46 user per cell for the second system.

12.03.2003 2002_139_Final_report_trs125-2_V1.1.doc 21
© LS telcom AG reserves all rights including intellectual property rights and all rights of disposal
Theoretical system UMTSUL DL UL DL
Channel Bandwidth 5 5 MHzRequired Wideband Spreading (Chip rate) 4,22 4,22 MHz ChipRate 3,84 3,84 MHzChannelrate 20 20 kBit/s Channelrate 30 30 kBit/s
Max User per Channel 23 23 UserSpreading Factor 211,23 211,23 Spreading Factor 128 128required Channels 1,0 1,0 req. Channels 2,0 2,0
Resulting Capacity 38,00 38,00 User Resulting Capacity 46 46 UserRequired Bandwidth 4,22 4,22 MHz Required Bandwidth 7,68 7,68 MHz
Total Bandwidth 10 10 MHz
Figure 1: Excel Module for theoretical System and System with fixed RF-Bandwidth
The calculation for fixed chip rate is done in the following way:
• Based on the user data rate and the chip rate, the feasible spreading factor and thechannel rate are calculated
• The following equation, as derived in Appendix 6.8, is used to calculate the maximumnumber of user that can be served in the bandwidth defined by the system chip rate:
requiredo
b
requiredo
bto
cellper
ne
br
ne
cn
br
u⋅+⋅
⋅−+
⋅+
=−−
)1(
)1
(1
max
α
α
(3-4)
• Finally the number of required channels is calculated by dividing the number of user inthe cell by the maximum number of user per channel.
3.2. Results of Sensitivity Analysis
During the sensitivity analysis the following parameter have been varied:
• Cell radius
• Transmitter power
• Adjacent Cell Factor
• Eb/No requirement
• Transmit frequency

12.03.2003 2002_139_Final_report_trs125-2_V1.1.doc 22
© LS telcom AG reserves all rights including intellectual property rights and all rights of disposal
3.2.1. Variation of Cell Radius
In Figure 2 the required bandwidth is shown in dependency on the cell radius for three differentdata rates. A rate of 20 kBit/s has been selected to obtain information about the voice service.384 kBit/s have been used to model video transmission. Additional a curve showing the sum ofthe bandwidth requirement for the 20kBit/s and 384 kBit/s data rates has been calculated. Adata rate of 31,56 kBit/s has been used as an average of video and voice.
In Table 2 the used parameter are listed.
0
5
10
15
20
25
30
10 30 50 70 90
cell radius in km
ban
dw
idth
in M
Hz
Msingle (r =20kBit/s)
Msingle (r' =31,56kBit/s)
Msingle (r =384kBit/s)
Msingle(r =20kBit/s) +Msingle(r =384kBit/s)
Figure 2: Required Bandwidth vs. Cell radius
Name of Parameter
Data rate: 20kBit/s, 31,56kBit/s, and 384kBit/s
Eb/N0: 6 dB
Adjacent cell interference factor: 0,4

12.03.2003 2002_139_Final_report_trs125-2_V1.1.doc 23
© LS telcom AG reserves all rights including intellectual property rights and all rights of disposal
Name of Parameter
Headroom for power control: 6 dB
Max. Transmitter power: 13 dBW
Number of users: 105 users in airspace sector for voice
2 users per cell for video
Cell radius: variable
Table 2: Parameter used during Variation of Cell Radius
From Figure 2 it can be seen that with increasing cell radius the required bandwidth will in-crease as well. Two different effects can be identified as reason for this. The one can be bestunderstood from the result for 384 kBit/s. For this data rate the number of users has been con-stant (2 user) during the complete calculation. The variation in bandwidth is resulting fromchanges in the received power at cell border. With increasing cell radius the power at cell borderwill get smaller and thermal noise will get more and more dominant. This can be seen directfrom equation (3-2) in which the inverse of tonc is standing in the denominator. With decreasingpower the denominator will tend towards zero and therefore the required bandwidth will becomeinfinite.
The curves for 20kBit/s and 31,56 kBit/s are showing again a rise in required bandwidth forlarger cell sizes. Aside the effect that power at cell border will decrease for increasing cell ra-dius, for this bit rates the number of users per cell has become larger with larger cell radius be-cause a constant user density (constant number of aircraft per km2) has been used. Of coursethis will lead to an increase in required bandwidth as well.
The sum of the results for 20 kBit/s and 384 kBit/s has been used to analyze if the calculation ofthe total required bandwidth based on an averaged data rate over all services is feasible or not.In Figure 2 it is shown that the summation will lead to higher bandwidth requirements than themodeling with an average data rate as the 384 kBit/s will be dominant.
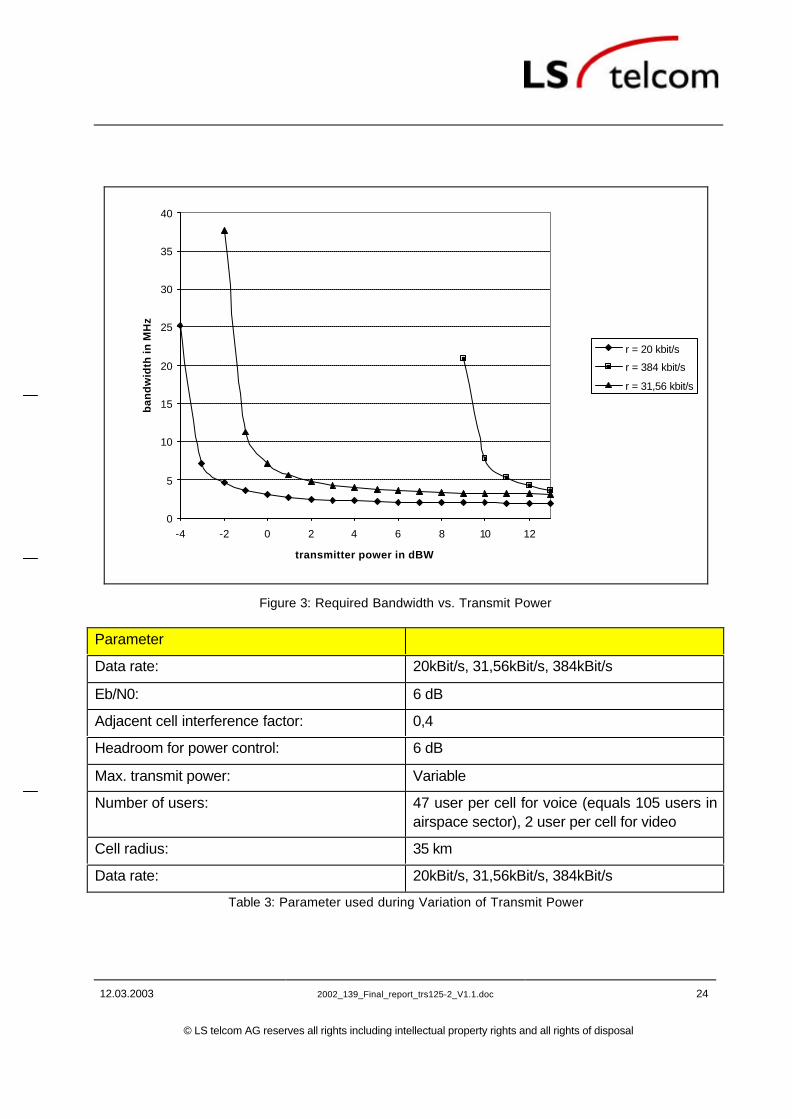
3.2.2. Variation of Transmit Power
In Figure 3 the required bandwidth is shown for data rates of 20, 31.56 and 384 kbit/s for differ-ent transmit powers.
12.03.2003 2002_139_Final_report_trs125-2_V1.1.doc 24
© LS telcom AG reserves all rights including intellectual property rights and all rights of disposal
0
5
10
15
20
25
30
35
40
-4 -2 0 2 4 6 8 10 12
transmitter power in dBW
ban
dw
idth
in M
Hz
r = 20 kbit/s
r = 384 kbit/s
r = 31,56 kbit/s
Figure 3: Required Bandwidth vs. Transmit Power
Parameter
Data rate: 20kBit/s, 31,56kBit/s, 384kBit/s
Eb/N0: 6 dB
Adjacent cell interference factor: 0,4
Headroom for power control: 6 dB
Max. transmit power: Variable
Number of users: 47 user per cell for voice (equals 105 users inairspace sector), 2 user per cell for video
Cell radius: 35 km
Data rate: 20kBit/s, 31,56kBit/s, 384kBit/s
Table 3: Parameter used during Variation of Transmit Power

12.03.2003 2002_139_Final_report_trs125-2_V1.1.doc 25
© LS telcom AG reserves all rights including intellectual property rights and all rights of disposal
From Figure 3 it can be seen, that for large values of the transmit power the required bandwidthis almost constant. When transmit power is decreased bandwidth requirement will start to in-crease and finally becomes infinite. This is the case when the transmit power approaches apower limit.
This effect can be understood from equation (3-2) where the term
requiredo
bto
ne
rc
n⋅⋅−1 (3-5)
is standing in the denominator. When power c is getting smaller, thermal noise power on willbecome more and more dominant. With this, the second part of the term will approach one andtherefore the denominator will become zero. The power limit therefore can be expressed as
requiredo
bto n
ernc ⋅⋅=limit
(3-6)
For higher data rates this power limit is reached earlier (at higher transmit powers) than forsmaller data rates.
The product of spectral power noise density and data rate rn to ⋅ can be understood as resultingnoise power for the signal in base band. The higher the data rate, the higher the thermal noisepower and therefore more reception power is needed to achieve a sufficient carrier to noise ra-tio.
3.2.3. Variation of Adjacent Cell Factor
In Figure 4 the required bandwidth is shown in dependency of the adjacent cell factor for differ-ent cell radius

12.03.2003 2002_139_Final_report_trs125-2_V1.1.doc 26
© LS telcom AG reserves all rights including intellectual property rights and all rights of disposal
0
2
4
6
8
10
12
14
16
18
20
0 0,2 0,4 0,6 0,8 1
adjacent cell factor
ban
dw
idth
in M
Hz
10 km
15 km
35 km
50 km
75 km
Figure 4: Required Bandwidth vs. Adjacent Cell Factor (Cell Radius as Parameter)
Name of Parameter Bit/s
Data rate: 20kBit/s
Eb/N0: 6 dB
Adjacent cell interference factor: Variable
Headroom for power control: 6 dB
Max. Transmitter power: 13 dBW
Number of users: 105 users in airspace sector
Cell radius: Variable
Table 4: Parameter used during Variation of Adjacent Cell Factor
The diagram shows that an increase of the adjacent cell factor will lead to a rise of the requiredbandwidth. This can be seen immediately from (3-2), in which the resulting bandwidth is propor-tional to the factor ( α+1 ).
12.03.2003 2002_139_Final_report_trs125-2_V1.1.doc 27
© LS telcom AG reserves all rights including intellectual property rights and all rights of disposal
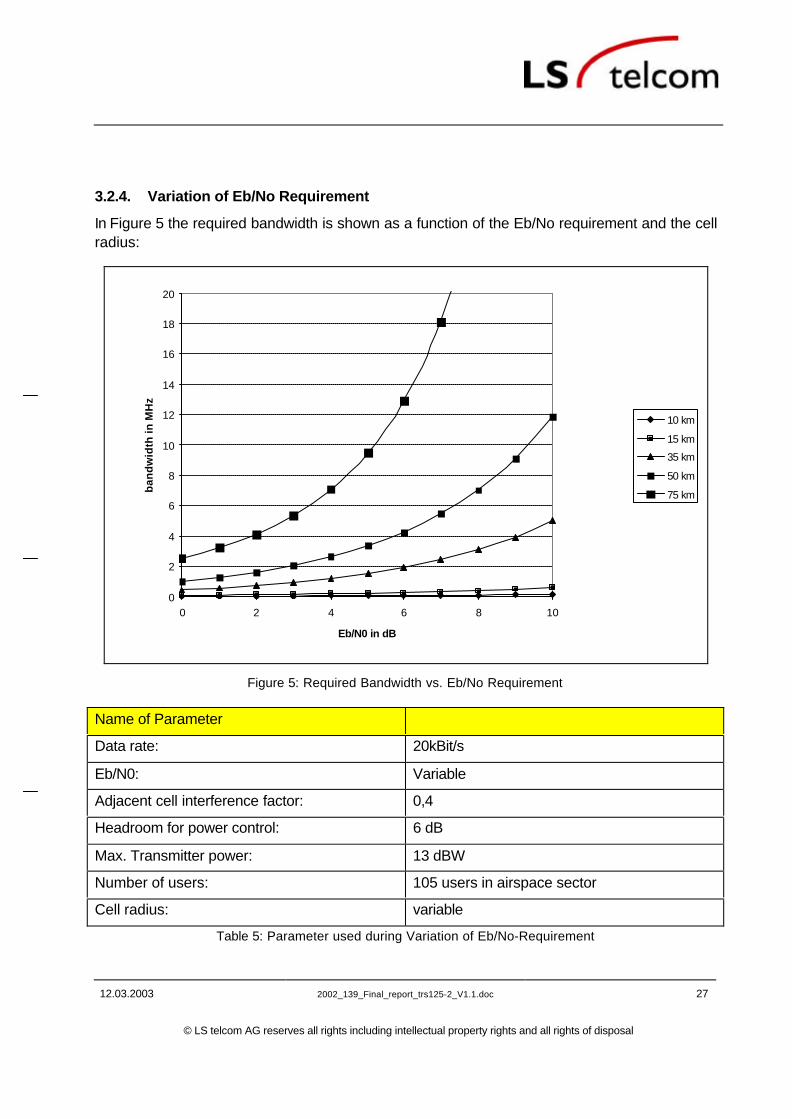
3.2.4. Variation of Eb/No Requirement
In Figure 5 the required bandwidth is shown as a function of the Eb/No requirement and the cellradius:
0
2
4
6
8
10
12
14
16
18
20
0 2 4 6 8 10
Eb/N0 in dB
ban
dw
idth
in M
Hz
10 km
15 km
35 km
50 km
75 km
Figure 5: Required Bandwidth vs. Eb/No Requirement
Name of Parameter
Data rate: 20kBit/s
Eb/N0: Variable
Adjacent cell interference factor: 0,4
Headroom for power control: 6 dB
Max. Transmitter power: 13 dBW
Number of users: 105 users in airspace sector
Cell radius: variable
Table 5: Parameter used during Variation of Eb/No-Requirement

12.03.2003 2002_139_Final_report_trs125-2_V1.1.doc 28
© LS telcom AG reserves all rights including intellectual property rights and all rights of disposal
From Figure 5 it can be seen, that a rise of the Eb/No requirement will lead to an increase in thebandwidth requirement. This effect can be understood from equation (3-2) that has been usedin section 3.2.2 to explain the impact of transmit power. For larger cells the rise in requiredbandwidth is higher than for smaller ones if the Eb/No requirement is increased in the sameway. This is based on the fact that larger cells are operating closer at the transmit power limit.
3.2.5. Variation of Frequency
Figure 6 shows the required bandwidth as function of the transmit frequency for different datarates. The parameters as listed in Table 6 have been used for the simulation.
1,5
1,7
1,9
2,1
2,3
2,5
2,7
2,9
3,1
3,3
3,5
0 500 1000 1500 2000 2500 3000 3500 4000 4500 5000
frequency in MHz
ban
dw
idth
in M
Hz
r =20kbit/s
r =384kbit/s
Figure 6: Required Bandwidth vs. Frequency

12.03.2003 2002_139_Final_report_trs125-2_V1.1.doc 29
© LS telcom AG reserves all rights including intellectual property rights and all rights of disposal
Name of Parameter
Data rate: 20kBit/s, 384kBit/s
Eb/N0: 6 dB
Adjacent cell interference factor: 0,4
Headroom for power control: 6 dB
Max. Transmitter power: 13 dBW
Number of users: 47 user per cell for voice (equals 105 users inairspace sector), 2 user per cell for video
Cell radius: 35 km
Table 6: Parameter used during Variation of Frequency
From Figure 6 it can be seen that for low data rates the required bandwidth is almost constant,whereas for higher data rates the required bandwidth will rise when the transmit frequency isincreased. In fact a modification of frequency will change the reception power because the pathloss depends on the frequency.
The above shown picture has been calculated over a frequency range from 150 MHz to 5 GHz.The difference in pathloss for this range equals to approx. 30 dB.

12.03.2003 2002_139_Final_report_trs125-2_V1.1.doc 30
© LS telcom AG reserves all rights including intellectual property rights and all rights of disposal
4. Calculation of required Bandwidth
The bandwidth requirements have been calculated for the following services separately:
• Voice
• Data + Security1
• Commercial Data
• Video
From the individual requirements the total bandwidth has been calculated by summing up thetraffic for each service.
The calculation has been done in two steps. The first step has been to determine the throughputper aircraft and service, the second step has been to calculate the bandwidth requirements withthe model as described in 3.1.
4.1. Calculation of Throughput per Service and Aircraft
For the calculation of throughput the traffic figures origination from EUROCONTROL [1] havebeen taken and applied for year 2029. Based on this traffic estimation, two approaches havebeen used to determine the data rates.
The first one has been the method used by EUROCONTROL where the overall throughput (forone service) has been divided by the PIAC for year 2029 (105 aircraft for the airspace sector).The bandwidth requirement then has been calculated for a system in which 105 aircraft oper-ated this average data rate.
For the second method a fixed channel rate has been selected for the different services. Thenumber of channels needed to accommodate the traffic originating from the aircraft has beendetermined by dividing the throughput per service by the fixed channel rate. Finally the resulthas been rounded up to the next integer. For this calculation the PIAC for 2029 has been used,no modeling with Erlang B or Erlang C has been applied. This is justified because the safety-of-life applications in aviation do not allow blocking. Based on these results again the requiredbandwidth has been determined. The calculation has been performed without fixed RF-bandwidth, for a chip rate of 3,84 Mchip/s, and a chip rate of 1,2288 Mchip/s.
For current 3G systems like UMTS coding rates of 1/2 and 1/3 are specified [14]. A code rate of1/3 will lead on the one hand to a better protection of the signal; on the other hand this will in-
1 In this group ATC data, flight recorder data and additional monitoring data has been considered together
12.03.2003 2002_139_Final_report_trs125-2_V1.1.doc 31
© LS telcom AG reserves all rights including intellectual property rights and all rights of disposal
crease the bandwidth requirement. Typically with higher coding rates the Eb/No requirementscan be less stringent which will lead to lower bandwidth requirements. Since at the current stateof the project not enough is known to get an exact modeling, a coding rate of 1/2 has been se-lected and at the same time a medium Eb/No requirement has been used. This is in accordancewith the values applied by the UMTS forum for spectrum calculations [11].
The coding rate has been applied before the required number of channels has been calculated.
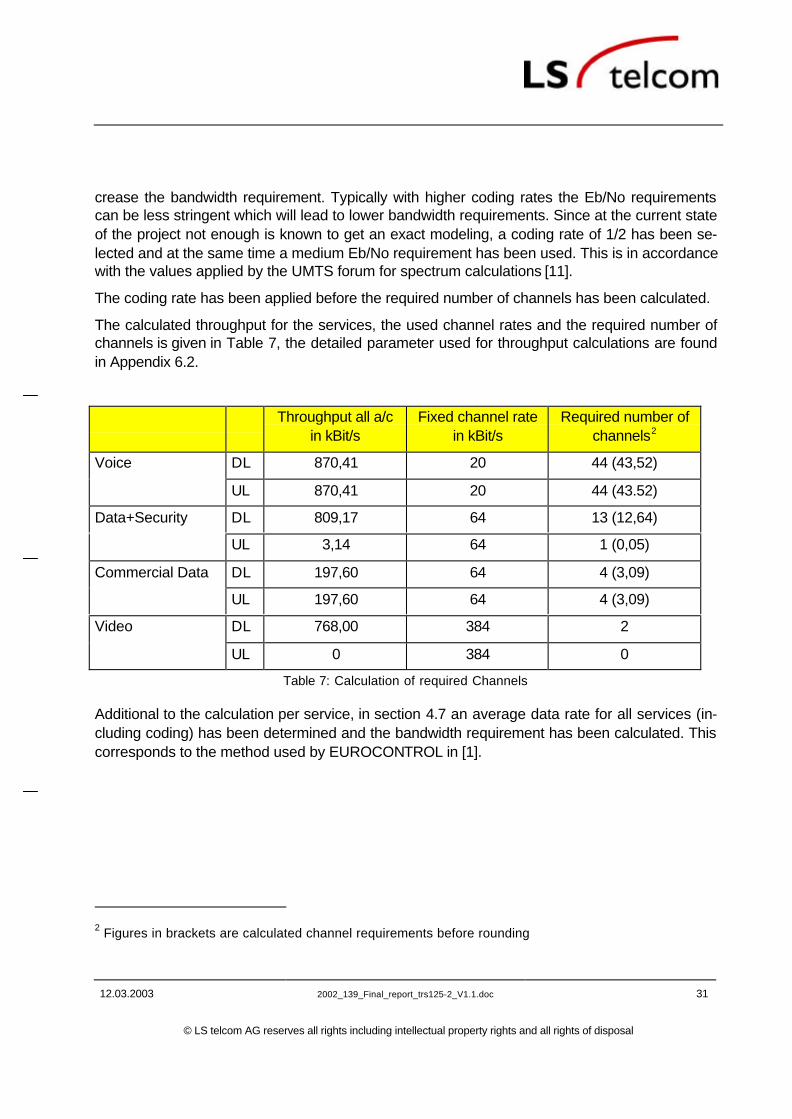
The calculated throughput for the services, the used channel rates and the required number ofchannels is given in Table 7, the detailed parameter used for throughput calculations are foundin Appendix 6.2.
Throughput all a/cin kBit/s
Fixed channel ratein kBit/s
Required number ofchannels2
DL 870,41 20 44 (43,52)Voice
UL 870,41 20 44 (43.52)
DL 809,17 64 13 (12,64)Data+Security
UL 3,14 64 1 (0,05)
DL 197,60 64 4 (3,09)Commercial Data
UL 197,60 64 4 (3,09)
DL 768,00 384 2Video
UL 0 384 0
Table 7: Calculation of required Channels
Additional to the calculation per service, in section 4.7 an average data rate for all services (in-cluding coding) has been determined and the bandwidth requirement has been calculated. Thiscorresponds to the method used by EUROCONTROL in [1].
2 Figures in brackets are calculated channel requirements before rounding

12.03.2003 2002_139_Final_report_trs125-2_V1.1.doc 32
© LS telcom AG reserves all rights including intellectual property rights and all rights of disposal
4.2. System Parameter used for Calculation
In Table 8 the general and electrical parameter that have been used for the calculation areshown. The parameters have been selected based on results of the sensitivity analysis and fig-ures found in literature. For selected parameter a short discussion is given in the following sec-tions.
Power Settings
Uplink (to a/c)
Downlink (from a/c) Unit
Transmitter Power 13,0 10,0 dBWTransmit Antenna Gain 6,0 0,0 dBiReveive Antenna Gain 0,0 6,0 dBiLNA noise factor 1,0 0,6 dBcable/guide and diplexer insertion losses 3,0 1,0 dBPolarisation loss 0,5 0,5 dBHeadroom for power control 6,0 6,0 dBEb/No 6,0 6,0 dBOverall Gains and Losses -4,5 -2,1 dBCell radius 50,0 50,0 kmPahtloss 147,2 147,2 dBAdjacent cell factor 0,6 0,6Soft Handover Factor 0,25 0,25
General Settings
UnitLFPTMA Area 18385 sqkmNumber aircrafts 104,9 a/cSystem Temperature 290 KelvinTransmit frequency 5120 MHzBoltzman const. 1,38E-23 dBW/K/Hz
Table 8: Power and General Calculation Parameters
From the analysis in 3.2.2 it can be seen that the bandwidth requirement is almost independentof the available transmit power (and therefore as well of additional parameter like cable lossesand antenna gains), if the system is not operating close to the power limit. This power limit ei-ther is reached when the path loss is too high (cell radius is to large) or the transmit power is toolow. Transmit power and cell radius therefore cannot be discussed separately.
From Figure 2 in Chapter 3.2.1 it can be seen that the maximum cell range that may be used forvideo is around 50 km. This corresponds to an available transmit power of 10 dBW per videoconnection for downlink. For larger cell radius the bandwidth requirement for video will rise overall bounds.
On the other hand, a cell radius of 50 km and a transmit power of 10 dBW in downlink offersenough power to the system to maintain several connections for voice (20 kBit/s) and data (64kBit/s) in parallel. This is not the case when additional video transmission has to be used. In thiscase additional 10 dBW are required. This implies that an aircraft that has to operate video willneed an extra power amplifier for video on board.
Because on the one hand larger cell radius will increase the bandwidth requirements, but on theother hand smaller cell radius will decrease the economical feasibility of the system, the 50 kmcell range has been selected as compromise for the simulations. The determination of final cell
12.03.2003 2002_139_Final_report_trs125-2_V1.1.doc 33
© LS telcom AG reserves all rights including intellectual property rights and all rights of disposal
sizes is typically subject of radio network planning, where cell radius will be adjusted accordingto cell traffic.
An Eb/No requirement of 6 dB has been used for all services. In literature Eb/No requirementsvary from 2 to 10 dB (e.g. [8],[13],[15],[16]) depending on propagation environment, data rate,modulation scheme and other factors. For example in UMTS Eb/No requirements are differentfor uplink and downlink because different modulation schemes are applied. Additional Eb/Nofigures are not fixed but will be adjusted by means of power control to obtain a specific bit errorrate defined by QoS criteria. Eb/No requirements in literature therefore are typically related to aspecific BER and have been obtained from simulations. The selected figure of 6 dB corre-sponds to a BER of 10-3 for voice transmission. For data transmission figures in a range of 3 to4 dB are given for a BER of 10-6. Smaller values for higher data rates are found because inUMTS power control will work more accurate when higher data rates are transmitted. As it is notknown if for the future system similar effects will occur the same Eb/No requirement has beenused for voice and data services. This is conservative regarding the bandwidth requirement fordata transmission.
For the adjacent cell factor, different figures are found in literature, a typical value is around 0.6[8],[16]. Therefore this value has been used for the calculations. In fact much higher values maybe possible as well. For example, in a homogenous network six other cells surround a cell. Un-der the assumption that each cell contains the same number of aircraft the largest value for theadjacent cell factor is six, if all aircraft are located at the cell border towards the inner cell andinterference is only respected from this first tier. This would be a violation of the assumption ofhomogenous spatial distribution that has been used throughout the study and should be thetopic of further investigations.
The soft handover factor models the higher interference and load in a cell originating from han-dover is considered. A value of 0.25 has been used.[8]
The transmit frequency has been set to 5,12 GHz. This corresponds to the worst case inside thepossible frequency range.
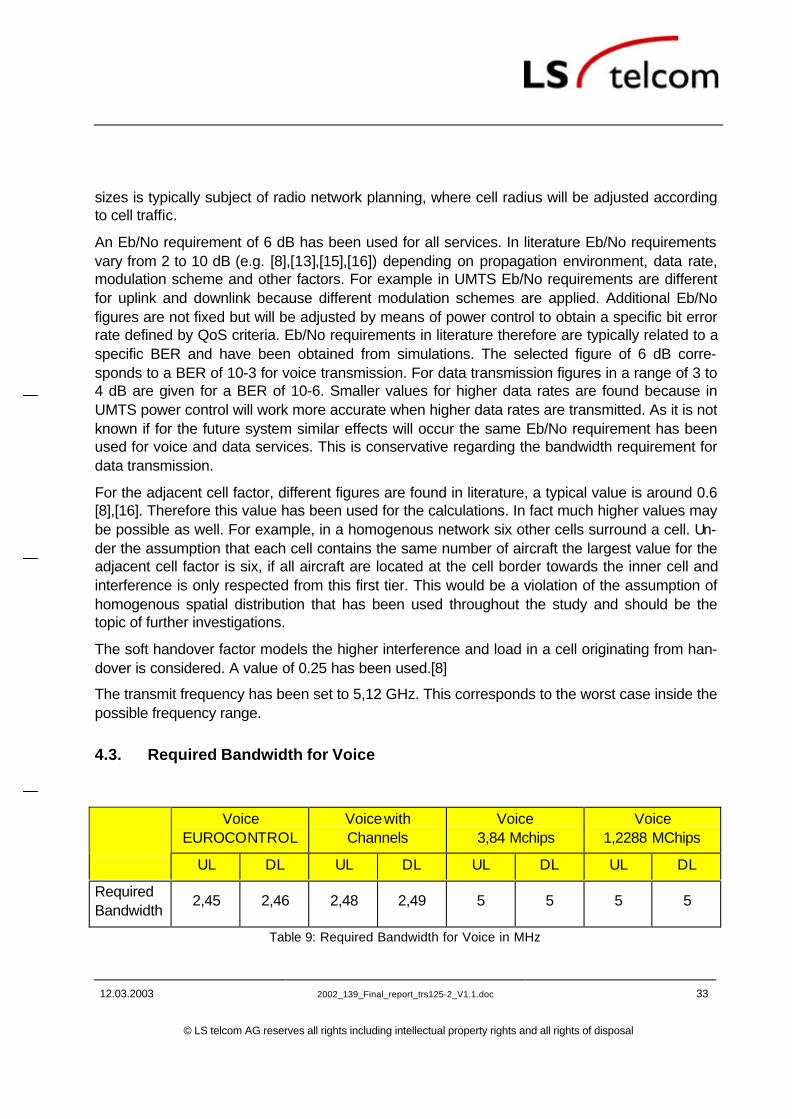
4.3. Required Bandwidth for Voice
VoiceEUROCONTROL
Voice withChannels
Voice 3,84 Mchips
Voice1,2288 MChips
UL DL UL DL UL DL UL DL
RequiredBandwidth
2,45 2,46 2,48 2,49 5 5 5 5
Table 9: Required Bandwidth for Voice in MHz

12.03.2003 2002_139_Final_report_trs125-2_V1.1.doc 34
© LS telcom AG reserves all rights including intellectual property rights and all rights of disposal
For voice a channel bit rate of 20 kBit/s (including coding) has been used. The average datarate for EUROCONTROL method has been 8,29 kBit/s.
4.4. Required Bandwidth for Data and Security
For the modeling with channels the data throughput for one aircraft originating from the differentsources (ATC Data, Monitoring Data, Flight Recorder Data) has been summed up and mappedon 64 kBit/s channels (after coding). For the EUROCONTROL method 20,4 kBit/s in DL and12,8 kBit/s in uplink has been used.
Data & SecurityEUROCONTROL3
Data & SecurityChannels
Data & Security 3,84 Mchips
Data & Security1,2288 MChips
UL DL UL DL UL DL UL DL
RequiredBandwidth
3,81 6,15 0,44 2,23 5 10 1,25 2,5
Table 10: Required Bandwidth for Data and Security in MHz
4.5. Required Bandwidth for Commercial Data
Commercial data has been mapped on 64 kBit/s channels (after coding), an average data rateof 1,88 kBit/s for uplink and downlink has been used for EUROCONTROL approach.
CommercialEUROCONTROL
CommercialChannels
Commercial 3,84 Mchip/s
Commercial1,2288 Mchip/s
UL DL UL DL UL DL UL DL
RequiredBandwidth
0,55 0,55 0,44 0,45 5 5 1,25 1,25
Table 11: Required Bandwidth for Commercial Data in MHz
3 During calculations done in [1] a channel mapping for data services has been done. This method hasbeen applied in the same way for this calculation. See Appendix 6.3 for more details.

12.03.2003 2002_139_Final_report_trs125-2_V1.1.doc 35
© LS telcom AG reserves all rights including intellectual property rights and all rights of disposal
4.6. Required Bandwidth for Video
For video it has been assumed that two channels with 384 kBit/s (after coding) will be needed,for EUROCONTROL approach 7,32 kBit/s have been used.
VideoEUROCONTROL
VideoChannels
Video 3,84 Mchips
Video1,2288 Mchips
UL DL UL DL UL DL UL DL
RequiredBandwidth 0 2,17 0 5,12 0 10 0 2,5
Table 12: Required Bandwidth for Video in MHz
4.7. Required Bandwidth for averaged Data Rate
In this calculation the average data rate has been determined to 22,97 kBit/s for uplink and37,89 kBit/s for downlink (including video). Simulation has been performed for 105 users in theairspace sector.
Averaged data rateEUROCONTROL
Averaged data rateChannels
Averaged data rate 3,84 Mchips
Averaged data rate1,2288 MChips
UL DL UL DL UL DL UL DL
RequiredBandwidth 6,92 11,71 N.A. N.A N.A N.A N.A N.A
Table 13: Required Bandwidth for averaged Data Rate in MHz

12.03.2003 2002_139_Final_report_trs125-2_V1.1.doc 36
© LS telcom AG reserves all rights including intellectual property rights and all rights of disposal
4.8. Total Bandwidth Requirement
The total bandwidth requirement for the system has been calculated by summing up the resultsobtained for each service in the sections 4.3 to 4.6. For the method based on the theoreticalmodel additional bandwidth for guard bands (5%) and for protocol overhead (20%) have beenadded. These values have been taken from [11].
As the systems with a fixed RF-Bandwidth (Chip rate of 3,84 Mchip/s and 1,2288 Mchip/s) al-ready comprises additional spectrum for guard bands and spare capacity for system manage-ment is available, no corrections have been applied to these results.
Total SumEUROCONTROL
Total SumChannel Modeling
Total Sum 3,84 Mchip/s
Total Sum1,2288 Mchip/s
UL DL UL DL UL DL UL DL
RequiredBandwidth
6,81 11,33 3,36 10,29 15 30 7,5 11,25
ProtocolOverhead20%
1,36 2,27 0,67 2,06
GuardBand 5% 0,34 0,57 0,17 0,51
Total re-quiredBandwidth
8,51 14,17 4,2 12,86 15 30 7,5 11,25
Total re-quiredBandwidth(UL + DL)
22,68 17,06 45 18,75
Table 14: Total Bandwidth Requirements in MHz including Video
Refraining from the case with a chip rate of 3,84 Mchip/s the total bandwidth requirementsfound in Table 14 are in the same range for downlink of around 12 to 14 MHz, the calculationwith channels (but without fixed chip rate) needs with approx. 4 MHz less bandwidth than thetwo other methods that needs around 8 MHz. The calculation with a chip rate of 1,2288 Mchip/sleads to smaller values because in this model only approx. 2 % are reserved for guard bandsand protocol overhead.

12.03.2003 2002_139_Final_report_trs125-2_V1.1.doc 37
© LS telcom AG reserves all rights including intellectual property rights and all rights of disposal
The calculation based on a fixed chip rate of 3,84 Mchip/s leads to higher bandwidth require-ments that the other methods. This can be understood from the low granularity of the system inwhich bandwidth only can be allocated in 5 MHz blocks. Since for each service at least 5 MHzhave to be allocated for a system that operates 3 services the minimum required bandwidthresult to 3x5 MHz. A use of free capacity in a frequency block by another service (e.g. usage offree capacity for data services inside the spectrum allocated for voice) is not modeled with thisapproach, the achieved total bandwidth requirements for the 3,84 Mchip/s system thereforehave to be handled with care.
In Table 15 the total bandwidth requirement is given without the video service:
Total SumEUROCONTROL
Total SumChannel Modeling
Total Sum 3,84 Mchip/s
Total Sum1,2288 Mchip/s
UL DL UL DL UL DL UL DL
RequiredBandwidth 6,81 9,16 3,36 5,17 15 20 7,5 8,75
ProtocolOverhead20%
1,36 1,83 0,67 1,03
GuardBand 5%
0,34 0,46 0,17 0,26
Total re-quiredBandwidth
8,51 11,45 4,2 6,46 15 20 7,5 8,75
Total re-quiredBandwidth(UL + DL)
19,96 10,66 35 16,25
Table 15: Total Bandwidth Requirements in MHz without Video
As video is only used in downlink, downlink values in Table 15 are smaller than the results ob-tained in Table 14, whereas the other values remain the same.

12.03.2003 2002_139_Final_report_trs125-2_V1.1.doc 38
© LS telcom AG reserves all rights including intellectual property rights and all rights of disposal
4.9. Comparison of used Methodology with Methodology defined by ITU
The used methodology in Section 4 of this document is very close to the method defined by theITU for terrestrial cellular networks like UMTS or IMT-2000 in [12] and applied by the ITU in [10]and the UMTS Forum in [11]. The structure of the two methods is shown in Figure 7:
Calculation of
Throughput for
Service 1
Calculation of
Throughput for
Service n
System
Simulation
Required
Bandwidth for
Service n
Required
Bandwidth
?
System
Simulation
Required
Bandwidth for
Service 1
Calculation of
Traffic for
Service 1
Calculation of
Traffic for
Service n
Net Capability
Required
Bandwidth for
Service n
Required
Bandwidth
Net Capability
Required
Bandwidth for
Service 1
?
Applied Method Method defined by ITU
Calculation of
Throughput for
Service 1
Calculation of
Throughput for
Service n
System
Simulation
System
Simulation
Required
Bandwidth for
Service n
Required
Bandwidth for
Service n
Required
Bandwidth
Required
Bandwidth
??
System
Simulation
System
Simulation
Required
Bandwidth for
Service 1
Required
Bandwidth for
Service 1
Calculation of
Traffic for
Service 1
Calculation of
Traffic for
Service 1
Calculation of
Traffic for
Service n
Calculation of
Traffic for
Service n
Net CapabilityNet Capability
Required
Bandwidth for
Service n
Required
Bandwidth for
Service n
Required
Bandwidth
Required
Bandwidth
Net CapabilityNet Capability
Required
Bandwidth for
Service 1
Required
Bandwidth for
Service 1
??
Applied Method Method defined by ITU
Figure 7: Comparison of Methodology used to calculate the Bandwidth Requirements
The major difference between the methods is the way in which bandwidth requirements areobtained from the offered traffic. ITU methodology uses the net system capability that is ameasure of the system capacity of a specific technology. It is related to the spectral efficiency ofmobile communication systems but contains many other factors. The net system capability hasthe unit dimension of kBit/s/MHz/cell. It is comprised of a number of effects that are combined ina complex manner appropriate to the radio transmission technology, the service type and the

12.03.2003 2002_139_Final_report_trs125-2_V1.1.doc 39
© LS telcom AG reserves all rights including intellectual property rights and all rights of disposal
environment. For existing systems it is typically obtained from the results of system simulations[12]. However the method to obtain this value is not defined in [10] or [12].
The approach in this document uses the estimated throughput per service as input for themodel that calculates the required bandwidth needed to carry the traffic without determining thenet system capability.
For traffic modeling the ITU methodology uses blocking probabilities for calculation of theneeded network resources on the air interface, traffic calculations are first done on cell level fordifferent service environments and than are generalized for the complete system.
During the traffic calculations done in this paper no blocking modeling has been applied, due tothe safety-of-life applications in aviation. Throughput values have fist been calculated for thecomplete network and allocated to cells during bandwidth determination because the cell radiusis a parameter of the applied model for the bandwidth calculation.
In the ITU methodology, the results for the different services are multiplied with the weightingfactor α , the total bandwidth requirement is multiplied with the adjustment factor β to achievethe final bandwidth.
Weighting factor α is used to adjust for geographical offsets in overlapping environments andto correct effects for non-simultaneous busy hour traffic requirements. Because nothing else isknown at the current stage of the project all services are assumed to have coincident busyhours and are collocated in the same geographical area. The weighting factors therefore havebeen set to one during the calculations.
The adjustment factor β is used to model the impact of effects like trunking inefficiency, spec-trum sharing with other communication systems in the same band, guard bands etc.
Factor β has been set to 1,05 and applied to the bandwidth requirement of each service. Thisallows to judge each service separately and leads to the same result as the method defined byITU where β is applied to the final bandwidth.

12.03.2003 2002_139_Final_report_trs125-2_V1.1.doc 40
© LS telcom AG reserves all rights including intellectual property rights and all rights of disposal
4.9.1. Comparison of Net System Capabilities
In Table 16 different figures of the net system capabilities for GSM and IMT 2000 are given. Thevalues have been taken from publications of the ITU [10] and [12] and the UMTS Forum [11].
Additional an estimation of the net system capability for the projected aviation system has beenobtained from the bandwidth calculations performed in the sections above. For this the calcu-lated throughput in Table 7 has been summed up for uplink and downlink. Voice and data serv-ices have been considered separately, for data the sum for security, commercial data and videotransmission has been taken. Overall throughput has been divided by the bandwidth require-ments and the number of cells for the Paris air space sector. A cell radius of 50 km results in anumber of 2,3 cells for the whole area. Bandwidth requirements for voice have been taken fromTable 9, for data the figures from Table 10 to Table 12 have been summed up. The calculationhas been performed for the approach with channel mapping.
GSM IMT 2000 Aviation System
UMTS ForumReport No. 6
ITU-RM.1390
ITU-RM.2023
Method with channelmapping
VoiceService
54 67 40 - 100 153
DataService
- 73 50 - 200 99 / 1804
Table 16: Net System Capabilities in kBit/s/cell/MHz
A comparison of the net system capabilities shows, that the value of 153 kBit/s/cell/MHzachieved for the aviation system is considerable higher than the values given for IMT 2000 andGSM. The value of 99 kBit/s/cell/MHz for data services is in the range given by ITU but smallerthan the one for voice service. This is not in accordance with the values given by ITU, where thenet system capability for data services tends to be higher than the one for speech services. Areason for this may be that the bandwidth requirements for voice and data services have beencalculated with the same Eb/No requirement. Therefore the net system capability for data hasbeen recalculated with an Eb/No requirement of 2 dB for video has been set to 2dB. In this casea net system capability of 180 kBit/s/cell/MHz for data services is obtained.
4 The net system capability of 180 kBit/s/cell/MHz is obtained when an Eb/No requirement of 2dB is usedfor the video service.

12.03.2003 2002_139_Final_report_trs125-2_V1.1.doc 41
© LS telcom AG reserves all rights including intellectual property rights and all rights of disposal
5. Conclusion
In Chapter 4 the required bandwidth for a future aeronautic system has been calculated. Sincethe final system technology is not yet known, calculations have been performed for an exem-plary system using CDMA technology. Technical parameters for the calculation have been se-lected in accordance with typical existing cellular CDMA-Systems and aeronautical require-ments.
The bandwidth calculations have been done separately for different services with a single ratemodel that has been developed by EUROCONTROL and validated and extended in this studyby DFS / LS telcom. The overall bandwidth requirement has been obtained by summing up therequirements for each service.
The obtained result can be understood as a provisional value for the required bandwidth, be-cause the used approach does not model the impact of interference originating from simultane-ous transmission of different services (with different data rates) in one cell. The consideration ofthe inter service interference may lead to higher bandwidth requirements than those calculatedin this study.
To consolidate the calculations further studies therefore should examine the impact of multi ratetransmission in more detail (A motivation for this is given in Appendix 6.2). At the same timemore accurate models could replace some approximations that have been used during band-width calculation. This comprises the used homogenous spatial distribution of the aircraft andthe modeling of the interference coming from adjacent cells.
The overall structure of the calculations are based on recommendations issued by the ITU in[12] and [10]. Nevertheless some differences are found in the way, how the number of requiredchannels is calculated that are necessary to serve the offered voice and data traffic. An imple-mentation of the Erlang B calculation for circuit switched and Erlang C calculation for packetswitched traffic would correspond better to the method as used by ITU and for traffic dimen-sioning of communication networks in general. Nevertheless, because safety-of-life applicationsin aviation do not allow blocking, the used approach is justified.

12.03.2003 2002_139_Final_report_trs125-2_V1.1.doc 42
© LS telcom AG reserves all rights including intellectual property rights and all rights of disposal
6. Appendix
6.1. References
[1] ‘Radio Frequency Spectrum Requirement Calculation for Future Aeronautical Mobile(Route) System. AM(R)S’Version 5.0 / 14 march 02Dale Stacey, Christian Pelmoine
[2] ‘Consideration of additional Spectrum for Air/Ground Communications’AMCP-WG-F7 WP 68Alain Delrieu
[3] ‘Methods of Calculation of required Spectrum for AMS(R)’AMCP-WG-F7 WP 62S. Masuda, Y. Suzuki
[4] ‘Calculation of Free Space Attenuation’Recommendation ITU-R PN525-2
[5] ‘On the Capacity of a Cellular CDMA System’K. S. Gilhausen et al.IEEE Transactions on Vehicular Technology, VOL 40, NO.2, May 1991
[6] ‘Handbook on Satellite Communications’ITU
[7] ‘Radio Network Planning Process and Methods for WCDMA’Jaana Laiiho, Achim WackerNokia Networks
[8] ‘WCDMA for UMTS’Harri Holma, Antti ToskalaWiley 2000
[9] ‘Methodologies to identify Spectrum Requirements for Systems beyond 3G’Report IST-2000-28584 MIND D3.3 Version 1.0 30.08.2002
[10] ‘Spectrum Requirements for IMT-2000’Report ITU-R M.2023
[11] ‘UMTS/IMT-2000 Spectrum’Report No6 from the UMTS Forum
12.03.2003 2002_139_Final_report_trs125-2_V1.1.doc 43
© LS telcom AG reserves all rights including intellectual property rights and all rights of disposal
[12] ‘Methodology for the Calculation of IMT-2000 Terrestrial Spectrum Requirements’Recommendation ITU-R M.1390
[13] ‘Radio Network Planning and Optimisation for UMTS’Jaana Laiho, Achim Wacker, Thomas NovosadWiley 2002
[14] ‘UMTS Multiplexing and Channel Coding (FDD)’ETSI TS 125.212
[15] ‘CDMA RF System Engineering’Samuel C. YangArtech House Publishers 1998
[16] ‘Handbook of CDMA System Design, Engineering, and Optimization’Members of Technical Staff, Bell LabsPrentice Hall PTR 2000

12.03.2003 2002_139_Final_report_trs125-2_V1.1.doc 44
© LS telcom AG reserves all rights including intellectual property rights and all rights of disposal
6.2. Motivation for Multi Rate Model
The main limitation of the used single rate model is, that the model has been derived under theassumption that all links in a cell are using the same data rate (we therefore refer this model assingle-rate model in the following) and that power control will obtain the same receive power cfor all connections. This does not correspond to the requirements of a system in which differentservices like voice and data will be operated simultaneous and multiple access will be obtainedby code division technology.
Two main issues can be pointed out that will have an impact on the required bandwidth:
• Impact of spreading factor
• Impact of inter service interference
Impact of Spreading Factor
A fundamental concept of spread spectrum CDMA systems is, that a signal with the bandwidth ris transmitted by using a bandwidth b with typically b > r. The ratio b/r is called the spreadingfactor s. The impact of the spreading factor can be understood by analyzing the basic equationfor the required Eb/No that has to be fulfilled for each connection:
adjootorequiredo
b
iinrc
ne
−++= (6-1)
With
oi Power spectral density of all interference coming from users in the cell
adjoi − Power spectral density of interference coming from adjacent cells
ton Power spectral density of thermal noise
c Power of wanted signal
Equation (6-1) can be transformed to equation (6-2) that allows discussing the impact of thespreading factor (see Appendix 6.9):
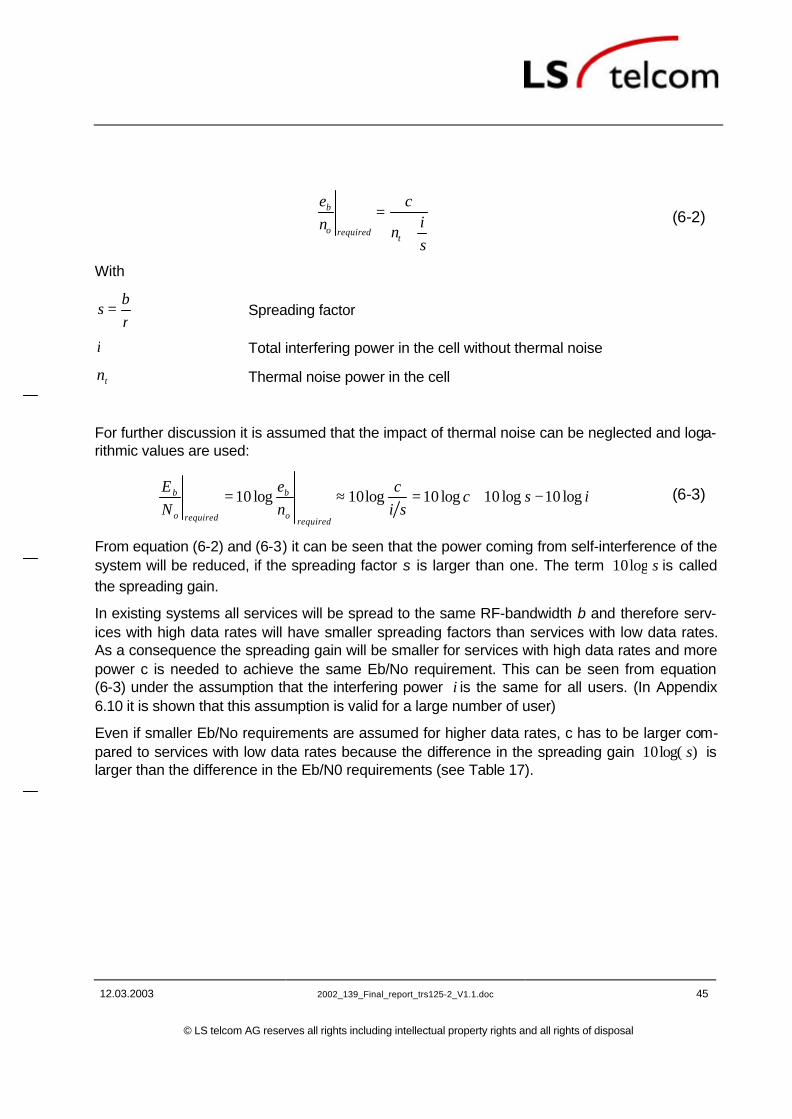
12.03.2003 2002_139_Final_report_trs125-2_V1.1.doc 45
© LS telcom AG reserves all rights including intellectual property rights and all rights of disposal
si
n
cne
trequiredo
b
+= (6-2)
With
rb
s = Spreading factor
i Total interfering power in the cell without thermal noise
tn Thermal noise power in the cell
For further discussion it is assumed that the impact of thermal noise can be neglected and loga-rithmic values are used:
iscsi
cne
NE
requiredo
b
requiredo
b log10log10log10log10log10 −+=≈= (6-3)
From equation (6-2) and (6-3) it can be seen that the power coming from self-interference of thesystem will be reduced, if the spreading factor s is larger than one. The term slog10 is calledthe spreading gain.
In existing systems all services will be spread to the same RF-bandwidth b and therefore serv-ices with high data rates will have smaller spreading factors than services with low data rates.As a consequence the spreading gain will be smaller for services with high data rates and morepower c is needed to achieve the same Eb/No requirement. This can be seen from equation(6-3) under the assumption that the interfering power i is the same for all users. (In Appendix6.10 it is shown that this assumption is valid for a large number of user)
Even if smaller Eb/No requirements are assumed for higher data rates, c has to be larger com-pared to services with low data rates because the difference in the spreading gain )log(10 s islarger than the difference in the Eb/N0 requirements (see Table 17).

12.03.2003 2002_139_Final_report_trs125-2_V1.1.doc 46
© LS telcom AG reserves all rights including intellectual property rights and all rights of disposal
Service Spreading Gain slog10
requiredo
b
NE
Voice 21)128log(10 ≈ dB 6,5 dB
384 kBit/s 9)8log(10 ≈ dB 4 dB
Table 17: Sample values for Spreading Gain and Eb/No5 for UMTS services [13]
From the above said it can be concluded that for a multi rate system, different receive powers cwill be adjusted by power control for the various services.
Interference between Different Services
As in a multi rate system different services will be operated at the same time in the same band-width, the services will interfere with each other.
If for example a cell is loaded with u voice users and v data users, the interference for a specificvoice user will come from u-1 voice users and v data users. The interference for a specific datauser will come from u voice users and v-1 data users.
When the single rate model is used separately for voice and data and afterwards the bandwidthrequirements will be summed up over all services, the final result will underestimate the re-quirements for the future system. The reason for this is, that the single rate calculation for voicewill neglect the interference caused by data users and the single rate calculation for data willneglect the interference caused by voice users. As interference is dependant on the one handfrom the used power level for the transmission and on the other hand the used power is de-pendant of the interference level in the cell, the calculation cannot be done separately for voiceand data.
5 Please note that the values are dependant of various factors like channel mapping, propagation envi-ronment, speed of users etc.
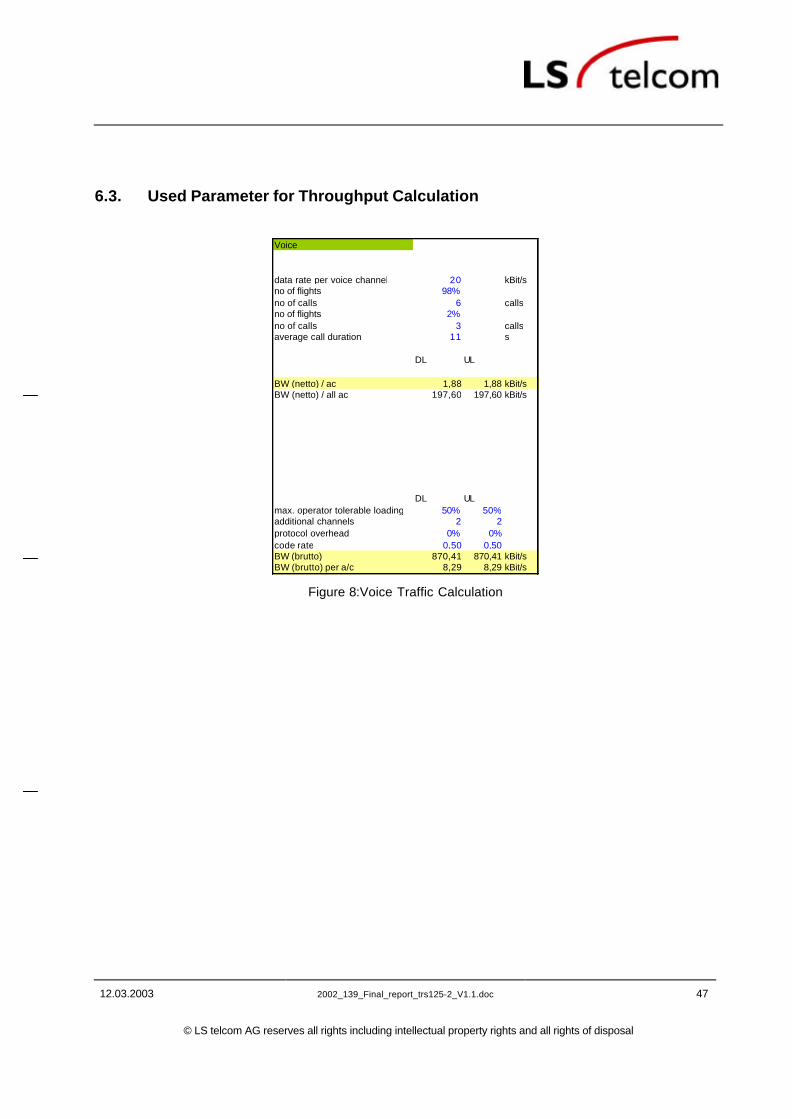
12.03.2003 2002_139_Final_report_trs125-2_V1.1.doc 47
© LS telcom AG reserves all rights including intellectual property rights and all rights of disposal
6.3. Used Parameter for Throughput Calculation
Voice
data rate per voice channel 20 kBit/sno of flights 98%no of calls 6 callsno of flights 2%no of calls 3 callsaverage call duration 11 s
DL UL
BW (netto) / ac 1,88 1,88 kBit/sBW (netto) / all ac 197,60 197,60 kBit/s
DL ULmax. operator tolerable loading 50% 50%additional channels 2 2protocol overhead 0% 0%code rate 0,50 0,50BW (brutto) 870,41 870,41 kBit/sBW (brutto) per a/c 8,29 8,29 kBit/s
Figure 8:Voice Traffic Calculation

12.03.2003 2002_139_Final_report_trs125-2_V1.1.doc 48
© LS telcom AG reserves all rights including intellectual property rights and all rights of disposal
Data
average flight duration 1,5 hDL UL
average requirement 37356 10112 byte
BW (netto) / ac 0,06 0,01 kBit/sBW (netto) / all ac 5,81 1,57 kBit/s
channelbandwidth per ac 64 64 kBit/susing second out of 10 1 1 s
BW (new data) 671,61522 671,615215 kBit/s
protocol overhead 0% 0%code rate 0,50 0,50BW (brutto) 1343,23 1343,23 kBit/sBW (brutto) per a/c 12,80 12,80 kBit/s
1)
2)
Figure 9: Data Traffic Calculation
The original calculation coming from EUROCONTROL [1] uses for data services a channelmapping to channels with a rate of 64 kBit/s. The achieved throughput that has been achievedfrom this method is given in Line 2) of Figure 9. This value has been used for the bandwidthcalculation using an average data rate. For the bandwidth calculation using channel mappingthe value coming from Line 1) of Figure 9 has been used (after applying of a code rate of ½).

12.03.2003 2002_139_Final_report_trs125-2_V1.1.doc 49
© LS telcom AG reserves all rights including intellectual property rights and all rights of disposal
commercial
DL UL
50% 50%
BW (netto) / ac 0,94 0,94 kBit/sBW (netto) / all ac 98,80 98,80 kBit/s
protocol overhead 0% 0%code rate 0,50 0,50BW (brutto) 197,60 197,60 kBit/sBW (brutto) per a/c 1,88 1,88 kBit/s
requirement of existing voice bandwidth
Figure 10: Commercial Data Traffic Calculation
security
flight recorder data additional monitoringDL UL DL UL
no. of parameters 100 0 data rate 0,6 0 kBit/sQuantisation level 32 32 Bitrefresh rate 1 1 1/s
BW (netto) / ac 3,2 0 kBit/s BW (netto) / ac 0,6 0 kBit/sBW (netto) / all ac 335,808 0 kBit/s BW (netto) / all ac 62,964 0 kBit/s
protocol overhead 0% 0% protocol overhead 0% 0%code rate 0,50 0,50 code rate 0,50 0,50BW (brutto) 671,62 0,00 kBit/s BW (brutto) 125,93 0,00 kBit/sBW (brutto) per a/c 6,4 0 kBit/s BW (brutto) per a/c 1,2 0 kBit/s
Figure 11: Security Data Traffic Calculation
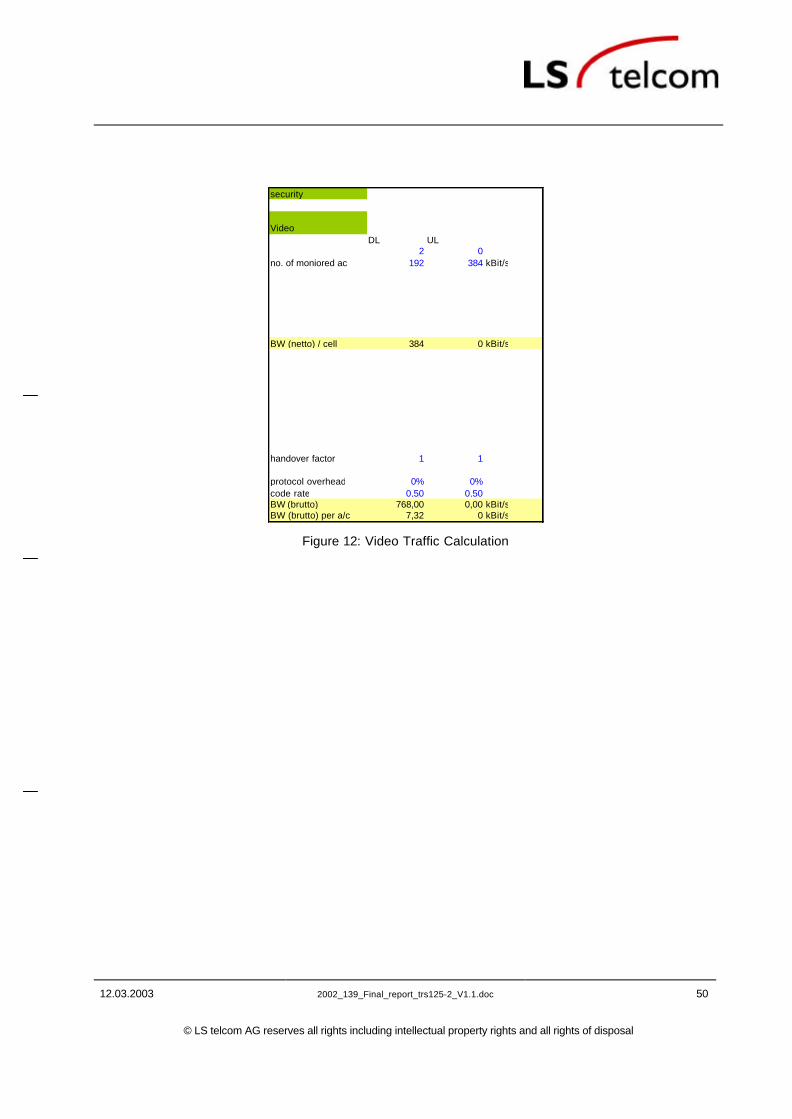
12.03.2003 2002_139_Final_report_trs125-2_V1.1.doc 50
© LS telcom AG reserves all rights including intellectual property rights and all rights of disposal
security
VideoDL UL
2 0192 384 kBit/s
BW (netto) / cell 384 0 kBit/s
handover factor 1 1
protocol overhead 0% 0%code rate 0,50 0,50BW (brutto) 768,00 0,00 kBit/sBW (brutto) per a/c 7,32 0 kBit/s
no. of moniored ac
Figure 12: Video Traffic Calculation

12.03.2003 2002_139_Final_report_trs125-2_V1.1.doc 51
© LS telcom AG reserves all rights including intellectual property rights and all rights of disposal
6.4. Mathematical Conventions
To distinguish between logarithmic values in dB and linear values, uppercase letters for loga-rithmic and lowercase letters for linear values will be used. Fractions of uppercase letters meansthe logarithmic value of the fraction of the related linear values:
ICicic
IC
−=−== log10log10)log(10 [dB]
The function “log” stands for the logarithm to the base 10.
The suffix o will be used to mark power spectral density e.g.:
bandwidthreceivingdensityspectralpowernoisepowernoisebnn o −−−−=−⇒⋅= *
The following letters will be used:
c: carrier power [W]
u: Number of users [dimensionless]
i0: interference power spectral density [W/Hz]
n0: noise power spectral density [W/Hz]
nto: thermal noise power spectral density [W/Hz]
eb: energy per information bit [J]
r: data rate
b: bandwidth
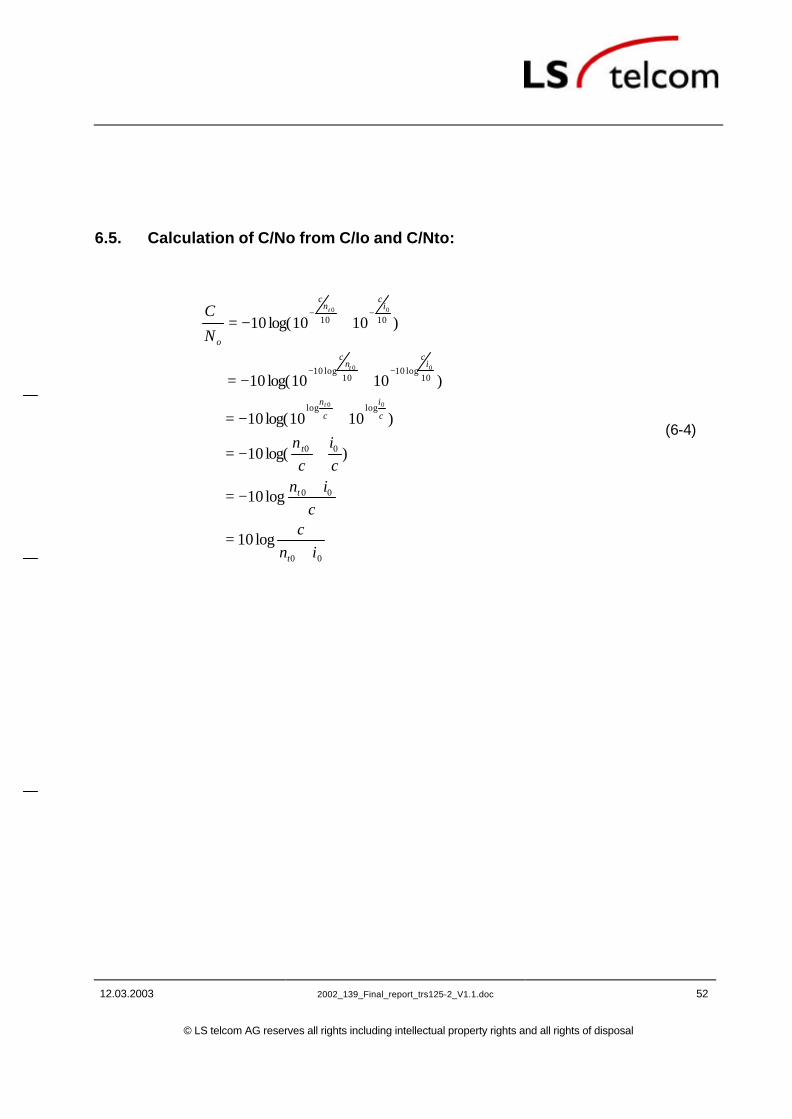
12.03.2003 2002_139_Final_report_trs125-2_V1.1.doc 52
© LS telcom AG reserves all rights including intellectual property rights and all rights of disposal
6.5. Calculation of C/No from C/Io and C/Nto:
00
00
00
loglog
10log10
10log10
1010
log10
log10
)log(10
)1010log(10
)1010log(10
)1010log(10
00
00
00
inc
cinci
cn
N
C
t
t
t
ci
cn
ic
nc
ic
nc
o
t
t
t
+=
+−=
+−=
+−=
+−=
+−=
−−
−−
(6-4)

12.03.2003 2002_139_Final_report_trs125-2_V1.1.doc 53
© LS telcom AG reserves all rights including intellectual property rights and all rights of disposal
6.6. Calculation of B based on C/Io required and u
From
bIC
bic
bic
ic
IC
availableoooavailable
log10log10log10log10log10 −=−=⋅
== (6-5)
and Equation (2-3):
uIC
available
log10−= (6-6)
follows
uIC
bBavailableo
log10log10 +== (6-7)
For a proper working system the following requirement has to been fulfilled:
requiredoavailableo IC
IC
≥ or at least requiredoavailableo I
CIC
= (6-8)
with this finally we get
uIC
bBrequiredo
log10log10 +== (6-9)

12.03.2003 2002_139_Final_report_trs125-2_V1.1.doc 54
© LS telcom AG reserves all rights including intellectual property rights and all rights of disposal
6.7. Modeling of Factor for Adjacent Cell Interference:
Starting point is equation (6-9)
uIC
bBrequiredo
log10log10 +== (6-10)
as derived in Appendix 6.6.
Under the assumption that to NN >> or tncu >>⋅ follows
urNE
uN
Cu
IC
Brequiredo
b
requiredorequiredo
log10log10log10log10 ++=+≈+= (6-11)
B equals the needed bandwidth without adjacent cell interference. If r’ comprises the effects ofadjacent channel interference we get
urNE
Brequiredo
b log10'log10' ++= (6-12)
for the needed bandwidth B’ with adjacent cell interference. With
γr
r =' (6-13)
we get
γγu
rNE
ur
NE
Brequiredo
b
requiredo
b log10log10log10log10' ++=++= (6-14)
From (2-3)
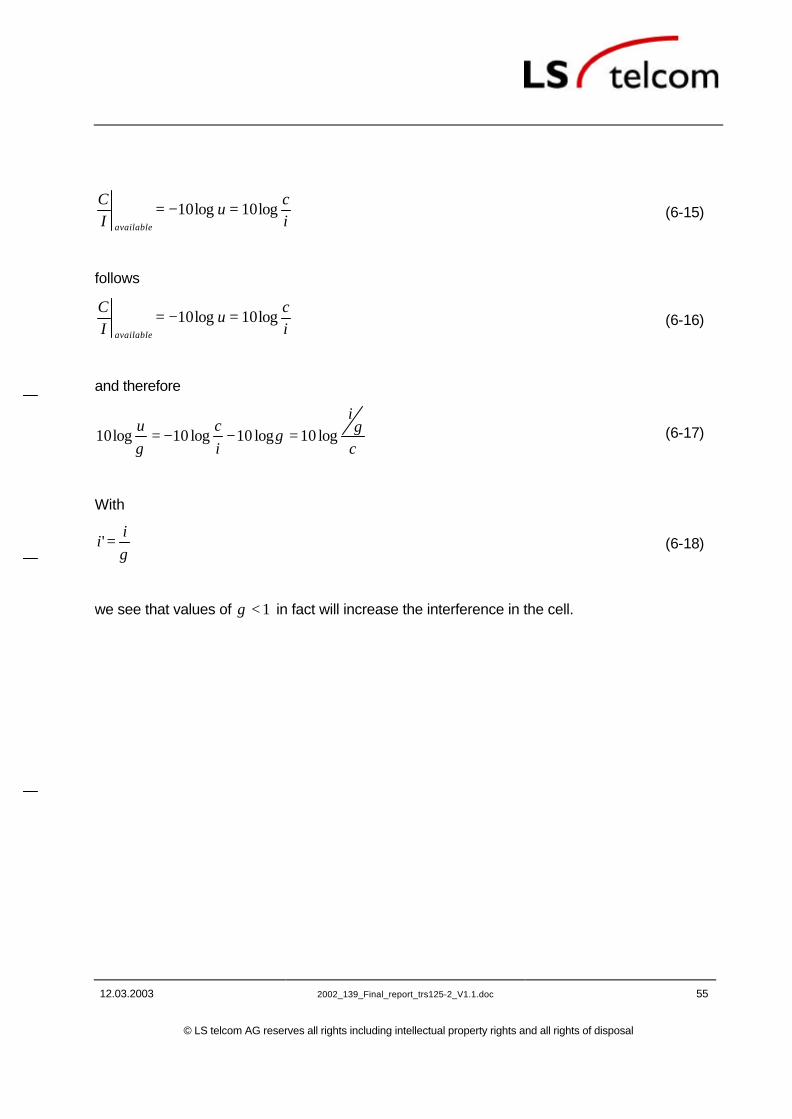
12.03.2003 2002_139_Final_report_trs125-2_V1.1.doc 55
© LS telcom AG reserves all rights including intellectual property rights and all rights of disposal
ic
uIC
available
log10log10 =−= (6-15)
follows
ic
uIC
available
log10log10 =−= (6-16)
and therefore
c
i
icu γγ
γlog10log10log10log10 =−−= (6-17)
With
γi
i =' (6-18)
we see that values of 1<γ in fact will increase the interference in the cell.

12.03.2003 2002_139_Final_report_trs125-2_V1.1.doc 56
© LS telcom AG reserves all rights including intellectual property rights and all rights of disposal
6.8. General Equation for the Calculation of the required Bandwidth b
))1(( adjotoadjootorequiredo
b
ibc
unr
ciin
rc
ne
−− +⋅−+⋅
=++
= (6-19)
αα ⋅⋅−=⋅=− bc
uii oadio )1( (6-20)
with (6-20) in (2-1):
)1()1(
1
))1()1(( αα +⋅⋅−+⋅=
+⋅⋅−+⋅=
br
uncr
bc
unr
cne
totorequiredo
b
(6-21)
1)1()1( =⋅+⋅⋅−+⋅⋅requiredo
b
requiredo
bto n
ebr
une
ncr
α (6-22)
with
requiredo
b
ne
=ε (6-23)
1)1()1( =⋅+⋅⋅−+⋅⋅ εαεbr
uncr
to (6-24)

12.03.2003 2002_139_Final_report_trs125-2_V1.1.doc 57
© LS telcom AG reserves all rights including intellectual property rights and all rights of disposal
Solving (6-24) for Bandwidth b
ε
εα
⋅⋅−
⋅+⋅−⋅=
rc
nur
bto1
)1()1((6-25)
Solving (6-24)for power c
εα
ε
⋅+⋅−−
⋅⋅=
br
u
nrc to
)1()1(1(6-26)
Solving (6-24) for number of user u (Capacity of cell)
)1(
)1
(1
αε
αε
+⋅⋅
−+
⋅⋅+=
br
cn
br
u
to
(6-27)

12.03.2003 2002_139_Final_report_trs125-2_V1.1.doc 58
© LS telcom AG reserves all rights including intellectual property rights and all rights of disposal
6.9. Impact of Spreading Factor
adjootorequiredo
b
iinrc
ne
−++= (6-28)
With
oi Power spectral density of all interference coming from users in the cell
adjoi − Power spectral density of interference coming from adjacent cells
ton Power spectral density of thermal noise
c Power of wanted signal
When we define that the interference coming from adjacent cells is a fraction of the interferencecoming from the own cell we can write
( ) otoootoadjootototal iniiniini ⋅++=⋅++=++= − 1αα (6-29)
and therefore
br
cunr
cin
rc
ne
tootorequiredo
b
⋅⋅−⋅++⋅=
⋅++=
)1()1()1( αα(6-30)
With this, the interference coming from the system itself can be written as
cui ⋅−⋅+= )1()1(α (6-31)
and the power of the thermal noise before decoding will become
tot nrn ⋅=(6-32)

12.03.2003 2002_139_Final_report_trs125-2_V1.1.doc 59
© LS telcom AG reserves all rights including intellectual property rights and all rights of disposal
Finally we find
si
n
c
br
in
cne
ttrequiredo
b
+=
⋅+= (6-33)
with
rb
s = Spreading factor

12.03.2003 2002_139_Final_report_trs125-2_V1.1.doc 60
© LS telcom AG reserves all rights including intellectual property rights and all rights of disposal
6.10. Sample Calculation of Interference Situation for Cell with two Services
Under the assumption that in a cell two services are operating with
1c , 2c Receive power for service 1 and service 2
1u , 2u Number of users for service 1 and service 2
the interference for a user operating service 1 can be written as
( ) celladjacenticucui −+⋅+⋅−= 22111 1 (6-34)
and the interference for a user operating service 2 can be written as
( ) celladjacenticucui −+⋅−+= 22112 1 (6-35)
Under the assumptions 11 >>u and 12 >>u it is obvious that
21 ii ≈ (6-36)