final report ras 2 march 8.doc final - bell bajao · nagar, midc & vishal mega mart, nehru ......
TRANSCRIPT

RRaappiidd AAuuddiieennccee AAsssseessssmmeenntt SSuurrvveeyy
RRoouunndd IIII RReeppoorrtt
Submitted to
Breakthrough
Report
2009-10
Content
Page No Chapter-I Introduction 01-03
1.1 Background 1.2 The Research Component 1.3 Rapid Assessment Survey – Round 2 1.4 Aim 1.5 Coverage 1.6 Respondents 1.7 Tools for study 1.8 Limitations
Chapter-II Respondent Profile & Medium of Exposure 04-08
2.1 Socio-demographic profile 2.2 Number of persons contacted to get eligible respondents 2.3 Medium of Exposure (Multiple Responses) 2.4 Frequency of Exposure 2.5 Last time when
Chapter- III Recall of Campaign on Prevention of Domestic violence 09-18
3.1 Recall of Television spots 3.2 Content Recall of the Radio spots 3.3 Content Recall of the Video Vans 3.4 Content Recall of the Posters /Print advs. 3.5 Learning from messages 3.6 Most liked advertisement 3.7 Action taken after seeing the campaign 3.8 Awareness about PWDV Act 2005 3.9 Heard about Protection of Women from Domestic Violence Act, 2005
Summary and Conclusion Annexure § Questionnaire

List of Tables Table 1.1: Coverage Table 1.2: Contacts Made Table 2.1: Location Table 2.2: Sex Table 2.3: Age Table 2.4: Education level Table 2.5: Occupation Table 2.6: Religion Table 2.7: Marital Status Table 2.8: States Table 2.9: Medium of Exposure Table 2.10: On Television Table 2.11: Number of times Table 2.12: Last time in TV Table 2.13: Last time in Radio Table 2.14: Last time Video Vans Table 3.1: Recall of TV spots Table 3.2: Content Recall of TV spots Table 3.3: Recall of Radio Spots Table 3.4: Content recall of Radio spots Table 3.5: Recall of Video Vans Table 3.6: Content Recall of Video Vans Table 3.7: Recall of Poster Table 3.8: Content recall of Poster Table 3.9: Learning from TVCs Table 3.10: Learning from Radio Spots Table 3.11: Learning from Print Table 3.12: Learning from Video Table 3.13: Most Liked Advertisement Table 3.14: Reasons for liking TVCs Table 3.15: Action Taken Table 3.16: Protection of Women from Domestic Violence Act, 2005 Table 3.17: Components of PWDVA recalled Table: 3.18: Came across DV? Table: 3.19: Actions Taken List of Graphs Graphic Plate 1- Doodh-Got Milk Graphic Plate 2-Alley Cricket Graphic Plate 3 - Boman Irani – Phone Graphic Plate 4 - Boman Irani -Facing Camera Graphic Plate 5: Video Van Graphic Plate 6: Poster

Breakthrough – Rapid Assessment Survey Round II 1
Chapter-I Introduction
1. 1Background Breakthrough's latest campaign "Bell Bajao" (Ring the Bell), urges men to take a stand against domestic
violence. Bell Bajao campaign was launched on August 20, 2008. This 360-degree media campaign had
components of TV spots, radio spots, print advertisement and a mobile video van.
1.2 The Research Component The research component, which has been formulated to give direction to the mass media campaign strategy,
has been conceptualized as a process. The process – keeping in mind the need for flexibility - has three
components: Baseline , Monitoring & Tracking and End line .
1.2.1 Baseline
The Baseline study undertakes a KAP study on Domestic violence and PWDVA 2005 among the target
audience of women and men of 15-49 yrs. It comprised of a field survey on i) KAP based on the indicators
developed ii) Media habits and iii) Information sources used by the audience.
1.2.2 Tracking
Tracking the impact of the designed and implemented IEC strategy, (approximately once every six months),
ensures effective monitoring and proper feedback for strategic flexibility. Impact on the audience and
exposure to the campaign are additionally to be assessed by means of Rapid Assessment Survey (RAS) and
Most Significant stories to be collected from the field.
1.2.3 End line
The End line study is intended to be an evaluation of the IEC strategy after rounds of Tracking. It would
record the change in KAP of the target audience using the same indicators that were used for the Baseline.
The present report is the second round of the Rapid Appraisal Survey on the exposure to the campaign and
their impact on the audience. The report also compares RAS Round 1 and 2 on some indicators.
Breakthrough – Rapid Assessment Survey Round II 2
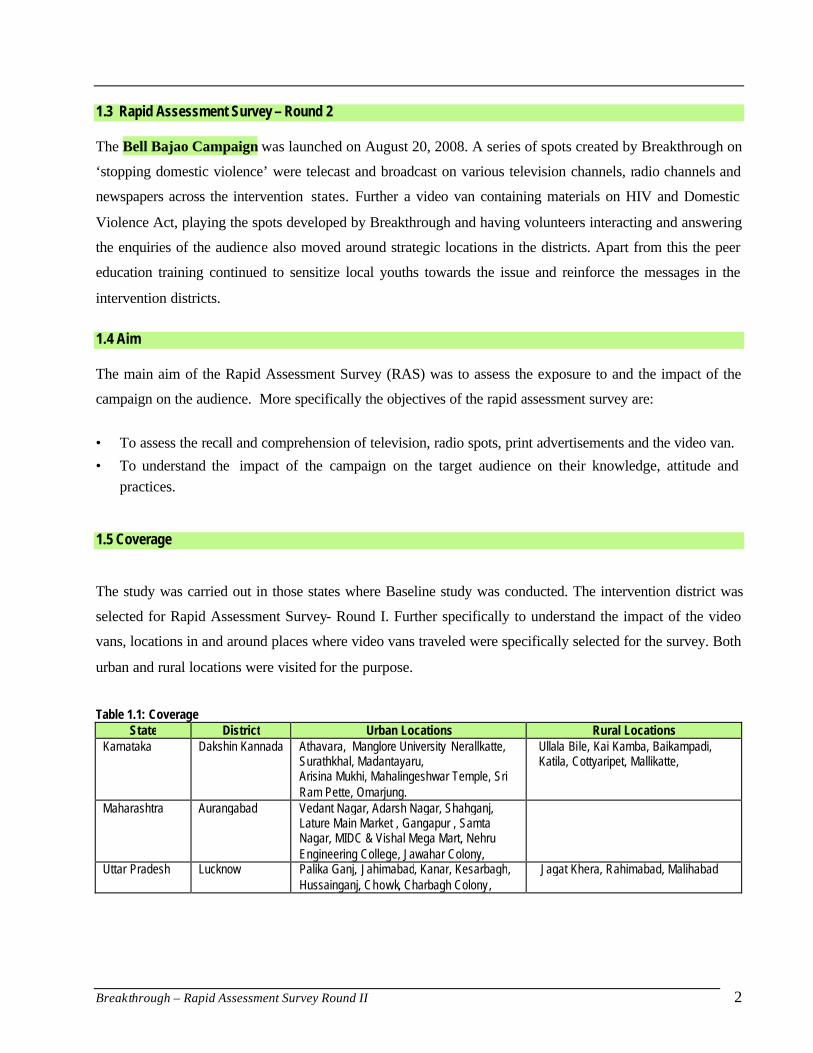
1.3 Rapid Assessment Survey – Round 2 The Bell Bajao Campaign was launched on August 20, 2008. A series of spots created by Breakthrough on
‘stopping domestic violence’ were telecast and broadcast on various television channels, radio channels and
newspapers across the intervention states. Further a video van containing materials on HIV and Domestic
Violence Act, playing the spots developed by Breakthrough and having volunteers interacting and answering
the enquiries of the audience also moved around strategic locations in the districts. Apart from this the peer
education training continued to sensitize local youths towards the issue and reinforce the messages in the
intervention districts.
1.4 Aim The main aim of the Rapid Assessment Survey (RAS) was to assess the exposure to and the impact of the
campaign on the audience. More specifically the objectives of the rapid assessment survey are:
• To assess the recall and comprehension of television, radio spots, print advertisements and the video van.
• To understand the impact of the campaign on the target audience on their knowledge, attitude and practices.
1.5 Coverage The study was carried out in those states where Baseline study was conducted. The intervention district was
selected for Rapid Assessment Survey- Round I. Further specifically to understand the impact of the video
vans, locations in and around places where video vans traveled were specifically selected for the survey. Both
urban and rural locations were visited for the purpose.
Table 1.1: Coverage State District Urban Locations Rural Locations
Karnataka Dakshin Kannada Athavara, Manglore University Nerallkatte, Surathkhal, Madantayaru, Arisina Mukhi, Mahalingeshwar Temple, Sri Ram Pette, Omarjung.
Ullala Bile, Kai Kamba, Baikampadi, Katila, Cottyaripet, Mallikatte,
Maharashtra Aurangabad Vedant Nagar, Adarsh Nagar, Shahganj, Lature Main Market , Gangapur , Samta Nagar, MIDC & Vishal Mega Mart, Nehru Engineering College, Jawahar Colony,
Uttar Pradesh Lucknow Palika Ganj, Jahimabad, Kanar, Kesarbagh, Hussainganj, Chowk, Charbagh Colony,
Jagat Khera, Rahimabad, Malihabad

Breakthrough – Rapid Assessment Survey Round II 3
1.6 Respondents From each state 80 respondents were covered. In all, 240 respondents were covered in 3 states. A screener
was administered to identify those households who have seen, heard or watched anything to do with
prevention of domestic violence. From the screened household women and men aged 15-49 were interviewed.
For covering the required number of respondents in a district, lot more were contacted. As evident from the
table below as against on four times in RAS 1, this time around ten times more contacts had to be made to get
the target of 240 audience.
Table 1.2: Contacts Made (Figures in numbers)
States HH Contacts Made Total respondents R1 R2 R1 R2
Karnataka 198 614 80 79 Maharashtra 417 772 80 81 Uttar Pradesh 356 658 80 81 Total 971 2044 240 241
1.7 Tools for study A screener and a pre-coded questionnaire were designed for the quantitative study to capture the recall and the
impact of the campaign. The questionnaire contained questions pertaining to the campaign recall and its
impact on audience besides few questions on the knowledge about Protection of Women against Domestic
Violence Act 2005. This time however a provision of aided recall was kept. Stills from TVC spots, picture of
the poster and photographs of video vans were used without the logo of Breakthrough or any tagline on them.
This was to help the audience, recall a campaign to which they were exposed quite a long time back. Further
some questions on safe sex negotiations were added too.
1.8 Limitations
Behaviour change cannot be achieved through short duration campaigns. Continuous reinforcement through
various mediums may result to certain amount of change in attitude and practice.
In the context of Bell Bajao Campaign, it is to be noted that only the television spots ran more than once and
for duration of a month or more. The radio spots were only run once in the beginning and were not repeated
later during the entire campaign period. Similarly the video vans traveled around the intervention districts
only once. Further, Aurangabad in Maharashtra acted like a control district as the intervention was not as
intense as in the other two intervention districts. The impact of the campaign needs to be interpreted keeping
in mind the differing degree of implementation. With this background, Round 2 RAS considers learning and
action to some extent as an indicator of impact of the campaign on the audience.

Breakthrough – Rapid Assessment Survey Round II 4
Chapter-II Respondent Profile & Medium of Exposure
2.1 Socio-demographic profile This section provides the socio-demographic profile of the respondents, who have been interviewed for the
present assessment.
§ Location wise Table 2.1: Location (Figures in %)
The disintegrated data above
shows us the percentages of
respondents covered in urban as
well as rural areas. Unlike the last RAS round almost equal number of respondents could be contacted from
urban and rural areas in this round.
§ Age-sex distribution Table 2.2: Sex (Figures in %)
Interestingly in RAS Round 2 more female
respondents were found from all the states.
Table 2.3: Age (Figures in %) About 50 percent of
respondents for this study
were in the age group of 26-
35. The rest were almost
equally distributed in the age group of 15-25 yrs and 26 to 45 yrs.
§ Level of Education Table 2.4: Education level (Figures in %)
Education wise the
respondents were not
evenly distributed
among states as can be
seen in the above table.
Majority of the respondents reported completing their higher secondary school while around 30 percent were
in college or were graduates.
Karnataka Maharashtra Uttar Pradesh Total R1 R2 R1 R2 R1 R2 R1 R2 Urban 50 34.2 98.7 67.9 43.7 50.6 64.2 51.0 Rural 50 65.8 1.3 32.1 56.3 49.4 35.8 49.0
Karnataka Maharashtra Uttar Pradesh Total
R1 R2 R1 R2 R1 R2 R1 R2 Male 50 43.0 48.8 50.6 50 49.4 49.6 47.7
Female 50 57.0 51.3 49.4 50 50.6 50.4 52.3
Karnataka Maharashtra Uttar Pradesh Total R1 R2 R1 R2 R1 R2 R1 R2 15-25 18.8 16.5 38.8 29.6 23.8 33.3 27.1 26.6 26-35 47.5 68.4 41.3 43.2 37.5 38.3 42.1 49.8 36-45 25.0 12.7 18.8 25.9 35.0 25.9 26.3 21.6 46 and above 8.8 2.5 1.3 1.2 3.8 2.5 4.6 2.1
Karnataka Maharashtra Uttar Pradesh Total R1 R2 R1 R2 R1 R2 R1 R2 Illiterate 2.5 6.3 0 32.5 6.2 11.7 4.1 Semi literate 5.0 5.1 0 1.2 8.7 6.2 4.6 4.1 Literate 37.5 25.3 12.5 14.8 27.5 39.5 25.8 26.6 SSC/HSC 45.0 36.7 43.8 48.1 25.0 22.2 37.9 35.7 College/graduate/ PG 10.0 26.6 43.8 35.8 6.3 25.9 20.0 29.5
Breakthrough – Rapid Assessment Survey Round II 5
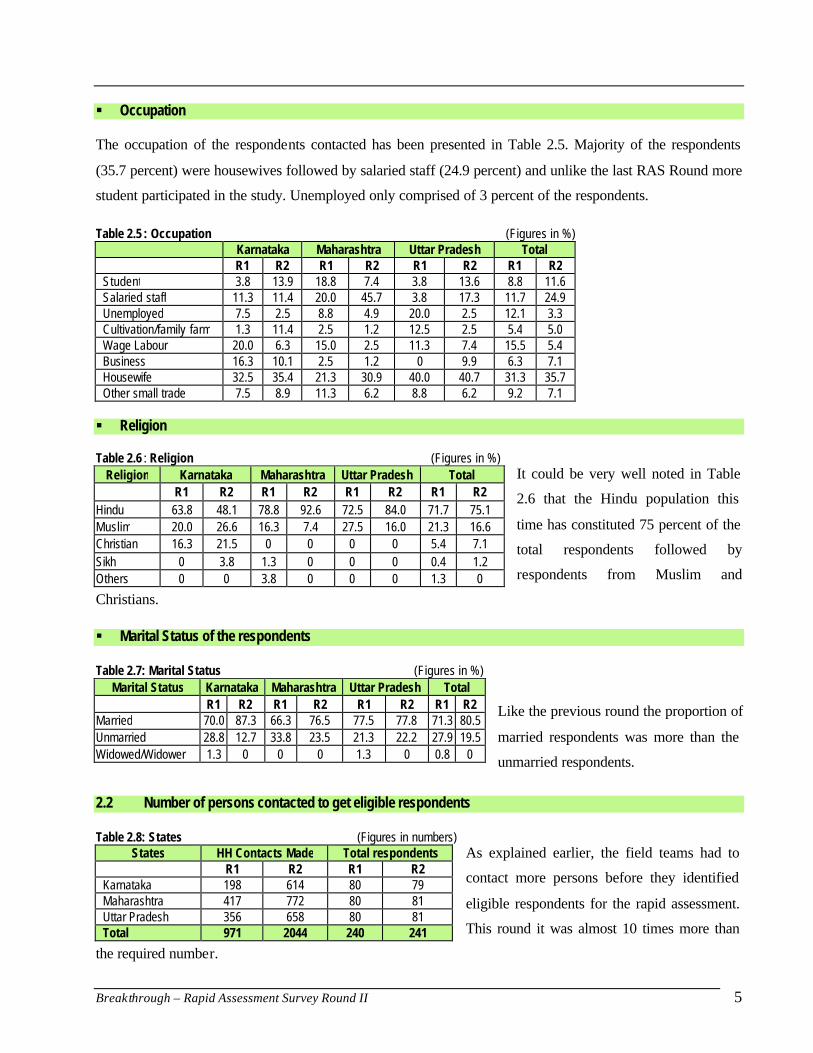
§ Occupation The occupation of the respondents contacted has been presented in Table 2.5. Majority of the respondents
(35.7 percent) were housewives followed by salaried staff (24.9 percent) and unlike the last RAS Round more
student participated in the study. Unemployed only comprised of 3 percent of the respondents.
Table 2.5 : Occupation (Figures in %) Karnataka Maharashtra Uttar Pradesh Total R1 R2 R1 R2 R1 R2 R1 R2 Student 3.8 13.9 18.8 7.4 3.8 13.6 8.8 11.6 Salaried staff 11.3 11.4 20.0 45.7 3.8 17.3 11.7 24.9 Unemployed 7.5 2.5 8.8 4.9 20.0 2.5 12.1 3.3 Cultivation/family farm 1.3 11.4 2.5 1.2 12.5 2.5 5.4 5.0 Wage Labour 20.0 6.3 15.0 2.5 11.3 7.4 15.5 5.4 Business 16.3 10.1 2.5 1.2 0 9.9 6.3 7.1 Housewife 32.5 35.4 21.3 30.9 40.0 40.7 31.3 35.7 Other small trade 7.5 8.9 11.3 6.2 8.8 6.2 9.2 7.1
§ Religion Table 2.6 : Religion (Figures in %)
It could be very well noted in Table
2.6 that the Hindu population this
time has constituted 75 percent of the
total respondents followed by
respondents from Muslim and
Christians. § Marital Status of the respondents Table 2.7: Marital Status (Figures in %)
Like the previous round the proportion of
married respondents was more than the
unmarried respondents.
2.2 Number of persons contacted to get eligible respondents Table 2.8: States (Figures in numbers)
As explained earlier, the field teams had to
contact more persons before they identified
eligible respondents for the rapid assessment.
This round it was almost 10 times more than
the required number.
Religion Karnataka Maharashtra Uttar Pradesh Total R1 R2 R1 R2 R1 R2 R1 R2 Hindu 63.8 48.1 78.8 92.6 72.5 84.0 71.7 75.1 Muslim 20.0 26.6 16.3 7.4 27.5 16.0 21.3 16.6 Christian 16.3 21.5 0 0 0 0 5.4 7.1 Sikh 0 3.8 1.3 0 0 0 0.4 1.2 Others 0 0 3.8 0 0 0 1.3 0
Marital Status Karnataka Maharashtra Uttar Pradesh Total R1 R2 R1 R2 R1 R2 R1 R2 Married 70.0 87.3 66.3 76.5 77.5 77.8 71.3 80.5 Unmarried 28.8 12.7 33.8 23.5 21.3 22.2 27.9 19.5 Widowed/Widower 1.3 0 0 0 1.3 0 0.8 0
States HH Contacts Made Total respondents R1 R2 R1 R2 Karnataka 198 614 80 79 Maharashtra 417 772 80 81 Uttar Pradesh 356 658 80 81 Total 971 2044 240 241

Breakthrough – Rapid Assessment Survey Round II 6
2.3 Medium of Exposure (Multiple Responses) The table below shows us the different channels through which respondents got exposed to the campaign
messages.
Table 2.9 : Medium of Exposure (Figures in %) N=241 Television
Radio
Video Vans
R1
(123) R2
(190) R1 (23)
R2 (18)
R1 (14)
R2 33) R1 (116)
R2 (77)
Karnataka 55.0 53.2 11.3 3.8 1.3 39.3 57.5 50.6 Maharashtra 80.0 98.8 5.0 1.2 15.0 0 7.5 1.2 Uttar Pradesh 18.8 84.0 12.5 17.3 1.3 2.5 80.0 44.4 Total 51.3 78.8 9.6 7.5 5.8 13.7 48.3 32.0
As presented in the Table 2.9 above, around 79 percent of the respondents reported getting exposed to the
television spots of the campaign; just about 32 percent recalled their exposure to the video vans. However the
exposures to radio spot and poster /newspaper were negligible.
Maharastra had highest exposure to television while Uttar Pradesh and Karnataka reported high exposure to
Video Vans. Karnataka’s exposure to print media was the highest.
2.4 Frequency of Exposure For a person to understand the content of the spot, remember it and internalize the message given in the spot,
it is essential that the person come across the spot several times. The study thus tried to find out from the
respondents, the frequency of their watching or listening to an advertisement.
§ On Television Table 2.10: On Television (Figures in %)
States Number of times N 1 2 3 4 5 >5 NR
R1 R2 R1 R2 R1 R2 R1 R2 R1 R2 R1 R2 R1 R2 R1 R2 Kar 44 42 2.3 2.4 11.4 21.4 27.3 33.3 18.2 23.8 18.2 4.8 22.7 2.4 0 5 Maha 64 80 3.1 10.0 25.0 16.3 25.0 10.0 28.1 15.0 15.6 11.3 3.1 37.5 0 0 UP 15 68 33.3 1.5 66.7 35.3 0 36.6 0 17.6 0 1.5 0 7.4 0 0 Total 123 190 6.5 5.3 25.2 24.2 22.8 24.7 21.1 17.9 14.6 6.3 9.8 18.9 0 5
The television spots appeared at different points of time and it can be seen that about one -fourth of the
respondents were exposed to the advertisement in television for two and three times, followed by those who
(18.9 percent) have seen it for more than five times. An analysis of the disintegrated data anyhow shows that
in Maharashtra, more people have watched it for more than five times.
Breakthrough – Rapid Assessment Survey Round II 7
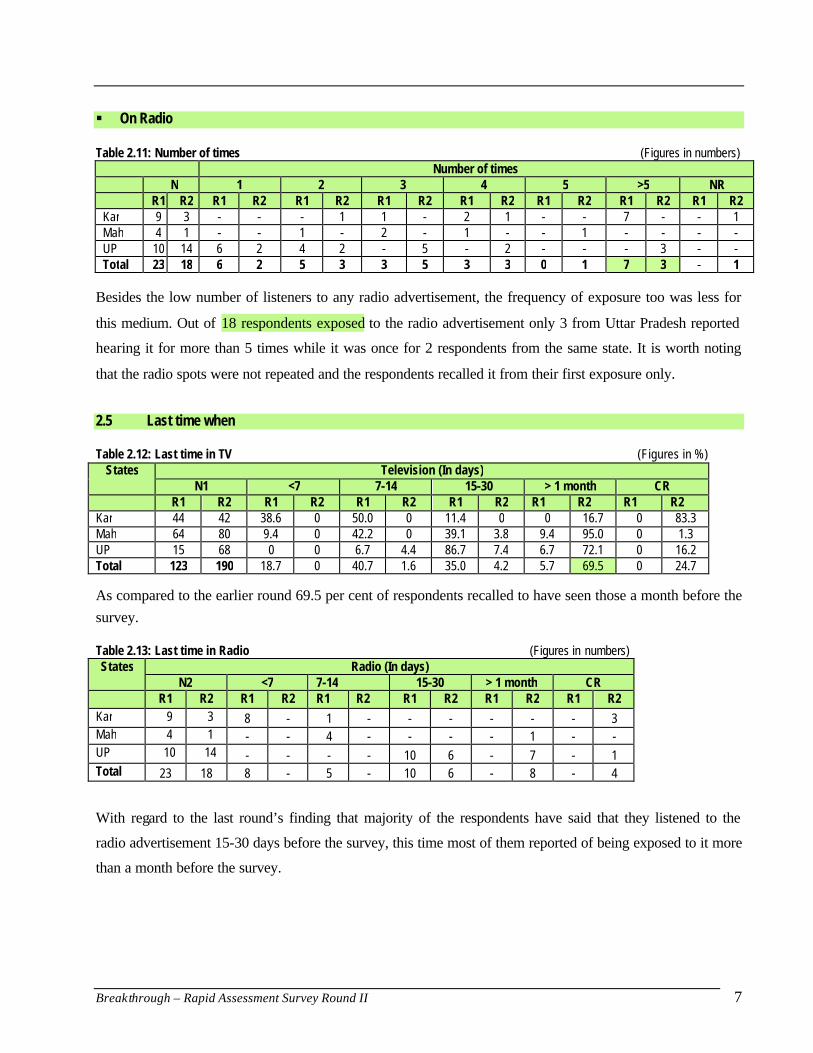
§ On Radio Table 2.11: Number of times (Figures in numbers)
Number of times N 1 2 3 4 5 >5 NR R1 R2 R1 R2 R1 R2 R1 R2 R1 R2 R1 R2 R1 R2 R1 R2
Kar 9 3 - - - 1 1 - 2 1 - - 7 - - 1 Mah 4 1 - - 1 - 2 - 1 - - 1 - - - - UP 10 14 6 2 4 2 - 5 - 2 - - - 3 - - Total 23 18 6 2 5 3 3 5 3 3 0 1 7 3 - 1
Besides the low number of listeners to any radio advertisement, the frequency of exposure too was less for
this medium. Out of 18 respondents exposed to the radio advertisement only 3 from Uttar Pradesh reported
hearing it for more than 5 times while it was once for 2 respondents from the same state. It is worth noting
that the radio spots were not repeated and the respondents recalled it from their first exposure only.
2.5 Last time when Table 2.12: Last time in TV (Figures in %)
As compared to the earlier round 69.5 per cent of respondents recalled to have seen those a month before the survey.
Table 2.13: Last time in Radio (Figures in numbers) States Radio (In days)
N2 <7 7-14 15-30 > 1 month CR R1 R2 R1 R2 R1 R2 R1 R2 R1 R2 R1 R2 Kar 9 3 8 - 1 - - - - - - 3 Mah 4 1 - - 4 - - - - 1 - - UP 10 14 - - - - 10 6 - 7 - 1 Total 23 18 8 - 5 - 10 6 - 8 - 4
With regard to the last round’s finding that majority of the respondents have said that they listened to the
radio advertisement 15-30 days before the survey, this time most of them reported of being exposed to it more
than a month before the survey.
States Television (In days) N1 <7 7-14 15-30 > 1 month CR
R1 R2 R1 R2 R1 R2 R1 R2 R1 R2 R1 R2 Kar 44 42 38.6 0 50.0 0 11.4 0 0 16.7 0 83.3 Mah 64 80 9.4 0 42.2 0 39.1 3.8 9.4 95.0 0 1.3 UP 15 68 0 0 6.7 4.4 86.7 7.4 6.7 72.1 0 16.2 Total 123 190 18.7 0 40.7 1.6 35.0 4.2 5.7 69.5 0 24.7
Breakthrough – Rapid Assessment Survey Round II 8
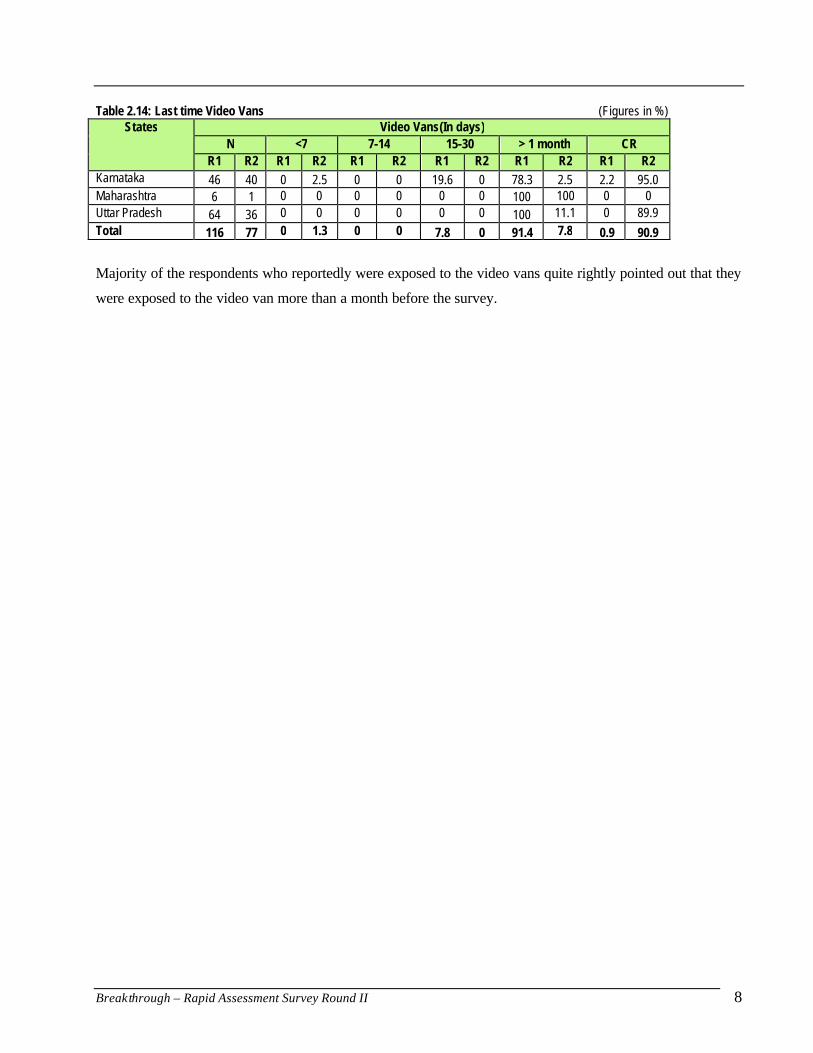
Table 2.14: Last time Video Vans (Figures in %)
Majority of the respondents who reportedly were exposed to the video vans quite rightly pointed out that they
were exposed to the video van more than a month before the survey.
States Video Vans(In days) N <7 7-14 15-30 > 1 month CR
R1 R2 R1 R2 R1 R2 R1 R2 R1 R2 R1 R2 Karnataka 46 40 0 2.5 0 0 19.6 0 78.3 2.5 2.2 95.0 Maharashtra 6 1 0 0 0 0 0 0 100 100 0 0 Uttar Pradesh 64 36 0 0 0 0 0 0 100 11.1 0 89.9 Total 116 77 0 1.3 0 0 7.8 0 91.4 7.8 0.9 90.9
Breakthrough – Rapid Assessment Survey Round II 9
Chapter- III Recall of Campaign on Prevention of Domestic violence
In the Rapid Assessment Survey the respondents were probed further on their level of comprehension, likings
of and learning from the campaign that they were exposed to. In this round as explained earlier to refresh the
respondent’s minds some visual clues were used for aided recall of the contents of advertisement on TV, the
poster and the video vans. The spontaneous and aided recall on each media and spots exposed and the extent
of recall is documented.
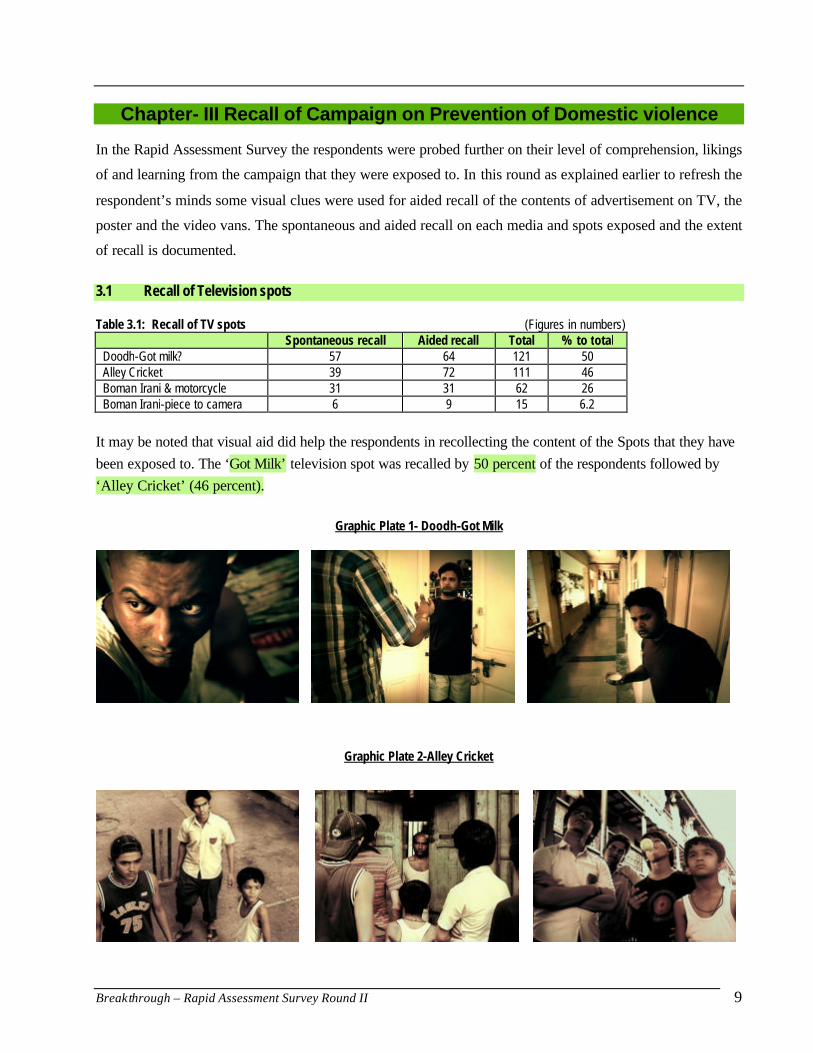
3.1 Recall of Television spots
Table 3.1: Recall of TV spots (Figures in numbers) Spontaneous recall Aided recall Total % to total
Doodh-Got milk? 57 64 121 50 Alley Cricket 39 72 111 46 Boman Irani & motorcycle 31 31 62 26 Boman Irani-piece to camera 6 9 15 6.2
It may be noted that visual aid did help the respondents in recollecting the content of the Spots that they have been exposed to. The ‘Got Milk’ television spot was recalled by 50 percent of the respondents followed by ‘Alley Cricket’ (46 percent).
Graphic Plate 1- Doodh-Got Milk
Graphic Plate 2-Alley Cricket

Breakthrough – Rapid Assessment Survey Round II 10
Graphic Plate 3 - Boman Irani – Phone
Graphic Plate 4 - Boman Irani -Facing Camera
Table 3.2: Content Recall of TV spots (Figures in %) Spots Karnataka Maharashtra Uttar Pradesh Total R1 R2 R1 R2 R1 R2 R1 R2
Doodh Fully 43.2 0 50.0 42.0 0 19.8 41.5 20.7 Partially 18.2 32.9 6.3 22.2 33.3 33.3 13.8 29.5 Not at all 38.6 67.1 43.7 35.8 66.7 46.9 44.7 49.8
Alley Cricket Fully 47.7 0 48.4 30.9 20.0 14.8 44.7 15.4 Partially 20.5 29.1 4.7 21.0 53.3 42.0 16.3 30.7 Not at all 31.8 70.9 46.9 48.1 26.7 43.2 39.0 53.9
Boman Irani Fully 0 0 7.8 29.6 0 7.4 4.1 12.4 Partially 0 21.5 4.7 9.9 6.7 8.6 3.3 13.3 Not at all 100.0 78.5 87.5 60.5 93.4 84.0 92.6 74.3
Boman Irani Face to camera Fully 0 0 7.8 0 26.7 6.2 7.3 2.1 Partially 0 3.8 4.7 0 40.0 8.6 7.3 4.1 Not at all 100.0 96.2 87.6 100 33.3 93.8 85.4 97.5
However the level of comprehension of TVCs was partial for majority of respondents who recalled them.
Breakthrough – Rapid Assessment Survey Round II 11
3.2 Content Recall of the Radio spots Table 3.3: Recall of Radio Spots (Figures in numbers)
Spontaneous recall Aided recall Total % to total Restricted mobility 9 2 11 4.6 Economic dependency 6 2 8 3.3 Unsatisfactory food 3 1 4 1.6
The recall of radio spots were majorly spontaneous retained from the previous exposure. Out of the total 21
respondents who reported exposure to Radio Spots, 11 reported listening to ‘Restricted mobility’. The other
two spots were recalled by 8 and 4 respondents respectively. Table 3.4: Content recall of Radio spots (Figures in numbers)
Spots n=18 Karnataka Maharashtra Uttar Pradesh Total R1 R2 R1 R2 R1 R2 R1 R2
Restricted mobility Fully 4 0 1 1 0 3 5 4 Partially 2 1 1 0 5 6 8 7 Can’t recall 3 2 5 10
Economic dependency Fully 4 0 3 0 0 2 7 2 Partially 2 2 1 0 0 4 3 6 Can’t recall 3 0 10 13
Unsatisfactory food Fully 1 0 0 1 2 0 3 1 Partially 2 1 0 0 6 2 8 3 Can’t recall 6 4 2 12
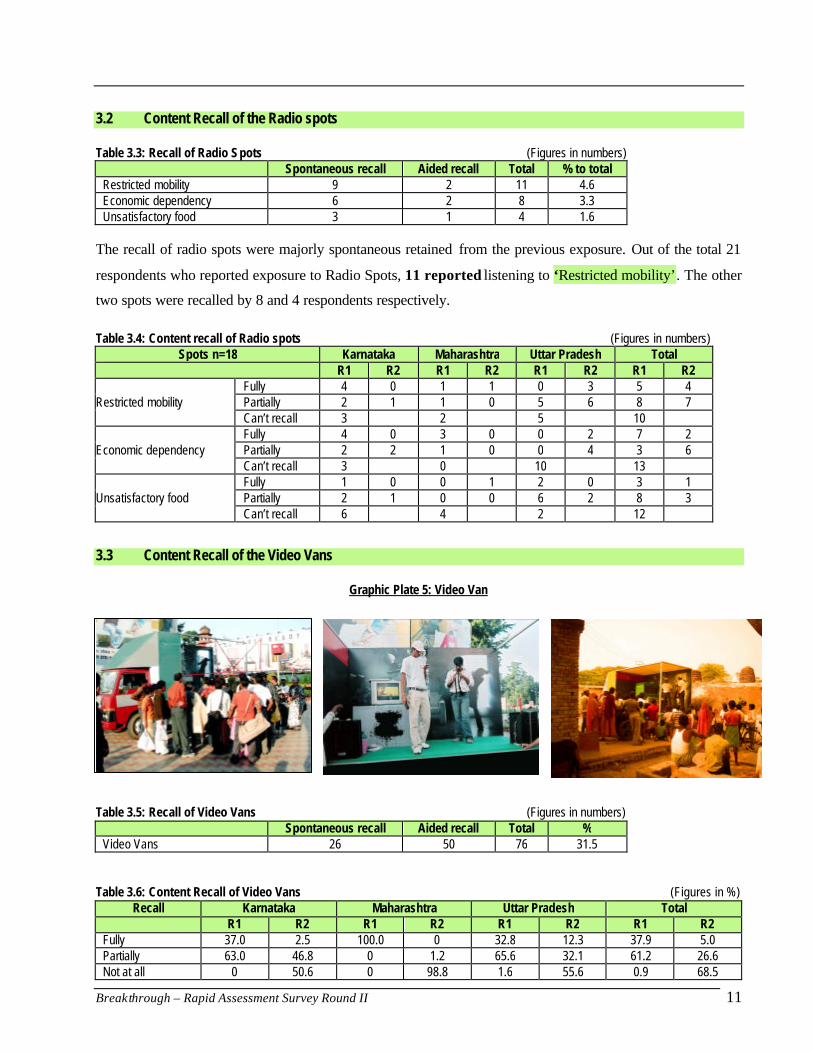
3.3 Content Recall of the Video Vans
Graphic Plate 5: Video Van Table 3.5: Recall of Video Vans (Figures in numbers)
Spontaneous recall Aided recall Total % Video Vans 26 50 76 31.5
Table 3.6: Content Recall of Video Vans (Figures in %)
Recall Karnataka Maharashtra Uttar Pradesh Total R1 R2 R1 R2 R1 R2 R1 R2
Fully 37.0 2.5 100.0 0 32.8 12.3 37.9 5.0 Partially 63.0 46.8 0 1.2 65.6 32.1 61.2 26.6 Not at all 0 50.6 0 98.8 1.6 55.6 0.9 68.5

Breakthrough – Rapid Assessment Survey Round II 12
Around 31 percent of the respondents recalled movement of video vans which happened almost a year ago.
Most of them recalled the spot being shown with a ‘bell’ as an intervention tool. Respondents recalled that the
video van gave away information about the DV Act and HIV/AIDS and also had the help line mentioned in it.
Further they recalled that they have also seen some leaflets and reading materials being distributed through
the video vans.
3.4 Content Recall of the Posters /Print advs.
Graphic Plate 6: Poster
Table 3.7: Recall of Poster (Figures in numbers)
Spontaneous recall Aided recall Total % to total Poster 3 28 31 12.9
Table 3.8: Content recall of Poster (Figures in numbers)
Out of 33 respondents who reported
seeing the poster or print advertisement
31 could partially comprehend the
content in the poster. The recall was
more in Karnataka and UP.
3.5 Learning from messages The respondents were enquired about anything that they learnt form the spots.
3.5a. Television Spots:
The learning from each of the television spots as reported by the respondents has been presented in Table 3.5
below. An analysis of the data brings out that majority of the respondents reported learning from the spots of
Kar Mah UP Total R1 R2 R1 R2 R1 R2 R1 R2
N 1 31 12 0 1 2 14 33 Fully 0 0 11 0 0 0 11 0 Partially 1 30 1 0 1 1 3 31 Not at all 0 1 0 0 0 1 0 2

Breakthrough – Rapid Assessment Survey Round II 13
‘Alley Cricket’ and ‘Doodh’. The most common learning from all the television advertisement was ‘stop
domestic violence by interrupting’ and to make the ‘abuser realize that someone is watching you’, deviating
the fight by interrupting, that children can also play a role in stopping violence was also reported as learning.
That one can interrupt domestic violence ‘giving any trivial reason’ was an eye opener for many.
Interestingly the respondents used the word ‘people quarrelling’ rather than violence. The main concept of
‘interrupting’ domestic violence by any trivial excuse resonated very well with the audience.
Table 3.9: Learning from TVCs (Figures in % ) Doodh- Got Milk? Kar Mah UP Total
R1 R2 R1 R2 R1 R2 R1 R2 Domestic Violence should be stopped 81.5 7.7 5.6 23.1 60.0 7.0 39.7 14.0 Should not fight among our self because due to this neighbors are disturbed 11.1 0 7.7 40.0 7.0 7.4 5.8 If neighbors are quarreling then we should make them understand because due to this others face problem also. Do not indulge in this shameless activity because others are watching
3.7 38.4 41.7 13.4 11.6 23.5 18.2
We can stop the violence by ringing the bell or by diverting the abuser somehow 3.7 50 52.8 52.0 0 72 29.4 58.7 Domestic Violence is illegal 3.8 1.9 1.7 This ad can reduce the frequency of DV 2.3 0.8 One partner should keep quiet during the quarrel 1.9 0..8 Alley Cricket R1 R2 R1 R2 R1 R2 R1 R2 Due to domestic violence children also face problem and they get badly affected by this also. Simultaneously they also contribute towards stopping of violence
56.7 43.4 41.2 14.0 54.5 11.8 49.3 17.9
We should not quarrel in the house and if neighbors are quarreling then we should ring the bell so that he should feel that we know about their quarrel 13.3 13.0 2.9 21 36.4 16.2 12.0 17.1
If the children are also aware about violence then we should also be aware 6.7 34.8 55.9 34.9 9.1 27.9 29.3 31.3 divert the attention/ shift the focus to some thing else 16.7 4.3 11.7 14.7 6.7 11.9 Stopping the domestic Violence and improving their relations 6.7 4.3 7.0 2.7 3.0 Ways to stop violence 9.3 8.8 7.5 Information about helpline and social responsibility 25.0 12.7 Boman Irani R1 R2 R1 R2 R1 R2 R1 R2 If neighbors are quarreling then they should be pacified for some time 21.4 3.1 100 2.9 11.0 5.3 If people are quarreling then we should go and stop them through any excuse so that he should know that we know about their quarrel
21.4 87.5 31.3 1.5 78.0 12.3
Do not quarrel with your wife so that neighbors come to stop the quarrel by any excuse
12.5 15.6 2.9 11.0 6.1
A little interference like ringing the bell can stop violence 50 43.8 11.8 25.4 Any one can ring the bell and it would embarrass people of their own deed 7.1 6.2 5.9 6.2 Don’t recall 75 44.7 Boman Irani Faces Camera R1 R2 R1 R2 R1 R2 R1 R2 If your neighbors are quarreling then you should stop the quarrel. Do not be an onlooker. Go and stop them by any excuse
66.7 100 90.0 16.7 94.4 18.8
Neighbors face problem due to domestic violence 33.3 10.0 5.6 1.4 We should inform them that we know about their quarrel 1.5 1.4 Don’t recall 81.8 78.3 The advertisement on Doodh has made majority of the respondents to think that any attempt to interrupt
domestic violence can work. Although very few, the respondents also reported to have learnt that domestic
violence is illegal. Interestingly one cannot overlook that around one percent of the respondents feel that

Breakthrough – Rapid Assessment Survey Round II 14
advertisements would bring down the frequency of domestic violence on one side and there is nothing that
one can do and that one partner should keep quite during a quarrel on the other.
The spot on Alley Cricket has made respondents to believe that if children are aware it is high time that we
become aware too in order to stop any such acts of violence in their neighbourhood.
Both the spots, where Boman Irani appears triggered respondents to realize that one should not be a mere
onlooker, if they happen to come across any act of domestic violence in their neighbourhood. They have also
learnt that one should stop such acts by any means and also make the persons involved realize that others are
observing them and know about their personal matters.
3.5b. Radio Spots: Table 3.10: Learning from Radio Spots (Figures in number) Kar Mah UP Total Restricted mobility R1 R2 R1 R2 R1 R2 R1 R2 Have faith on your wife do not quarrel without any reason 2 2 2 2 Do not quarrel in the house 2 2 4 Always respect your wife. 2 1 1 4 Wife should not go any where without informing the husband 2 1 5 3 5 We should try to stop such incidence in our neighborhood 1 1 Very small issues are the root cause of domestic violence 1 1 Husband should not use abusive language without listening to his wife 1 1 Economic dependence Have faith on your wife , do not quarrel without any reason 3 1 3 1 6 2 Do not indulge in domestic violence 1 1 Wife should not take money from husbands pocket without informing him due to which husband gets angry and start quarreling 1 1
Women should be economically independent 2 2 Always respect your wife 2 2 Women should go out only for genuine work 1 1 One should not get angry 1 1 2 Unsatisfactory food Do not fight in the house for small matters/trivial issues 1 1 7 8 1 Respect your wife in the house 2 1 3 One should stop such incidence 1 1 Go and have food in hotel if you do not like the cooked food 1 1 The recall of radio was from the early rounds of broadcast and was too less. Like the previous round the spots made the listeners think that one should not indulge in any act of domestic violence without any valid reason. Anyhow, the radio spots have also given away unintended messages among the listeners, as they pointed out that women should not do certain things without prior information to make the husband angry.
3.5c. Print: The print materials (poster, newspaper advertisement, leaflets distributed from video vans etc.) however gave
information about the law that provides support to women in case of violence. Most of the respondents
identified that domestic violence is a crime and the helpline number from the poster.

Breakthrough – Rapid Assessment Survey Round II 15
Table 3.11: Learning from Print (Figures in number) Print/Poster Kar Mah UP Total
R1 R2 R1 R2 R1 R2 R1 R2 Respect your wife in the house and do not fight with women 1 1 1 1 In case of domestic violence women will get legal help by the society 3 12 12 3 Inform to relevant department or call on 1091 1 6 2 1 8 Domestic Violence is a crime 11 11 Most of the women are victims of Domestic Violence 3 3 We should be aware about domestic violence 2 2 Ring the bell and stop the violence 2 2
3.5d Video Vans:
The Video Vans were designed to give away information on both domestic violence and HIV/AIDS through
distributing leaflets, pamphlets, street play, games and quizzes. The data reveals that majority have learnt that
all forms of domestic violence should be stopped by any means and a third person can not be a mere onlooker
and thus shrug off from his responsibility to stop such acts. They also shared that they feel such an interactive
medium can be a very strong tool to interrupt domestic violence and inform people about the law.
Unlike last round the respondents recalling learning on AIDS was less. They reported that they learnt about
the ways in which AIDS would spread and also about the preventive methods. However they all referred to
HIV as ‘AIDS’. The respondents also mentioned that the video van distributed pamphlets but did not specify
on what issue.
Table 3.12: Learning from Video (Figures in %) Video Van N=77 Kar Mah UP Total R1 R2 R1 R2 R1 R2 R1 R2 Do not fight in the house 17.4 19.0 11.1 17.4 5.2
Due to domestic violence children get effected very badly 1.6 0.9
Domestic violence should be stopped and ring the bell 41.3 7.7 100 34.9 41.7 35.7 25.0
If neighbors are quarreling go and stop them. Do not be an onlooker 2.6 22.2 12.2 1.3
Respect the women and help her. Inform the people that if you misbehave with women then she may take legal action
6.5 5.1 100 5.6 4.2 8.7 5.3
Every one should fight against domestic violence 10.9 7.7 8.3 4.3 7.9
We got information about the Law (Domestic Violence Act 2005) 2.2 28.2 13.9 0.9 21.0
Women should raise voice against domestic violence 2.6 1.3
Awareness through pictures & it is a strong medium to stop violence
38.5 11.1 25
Helpline number 2.8 1.3
Routes of transmission of AIDS 19.6 2.6 33.3 34.9 28.7 1.3
Preventive methods of AIDS 33.3 19.0 12.2
How does AIDS spread from mother to children 7.7 7.9 4.3 3.9
Distributed pamphlets 2.6 30.6 15.8
DK/CS 2.2 1.6 1.7
Breakthrough – Rapid Assessment Survey Round II 16
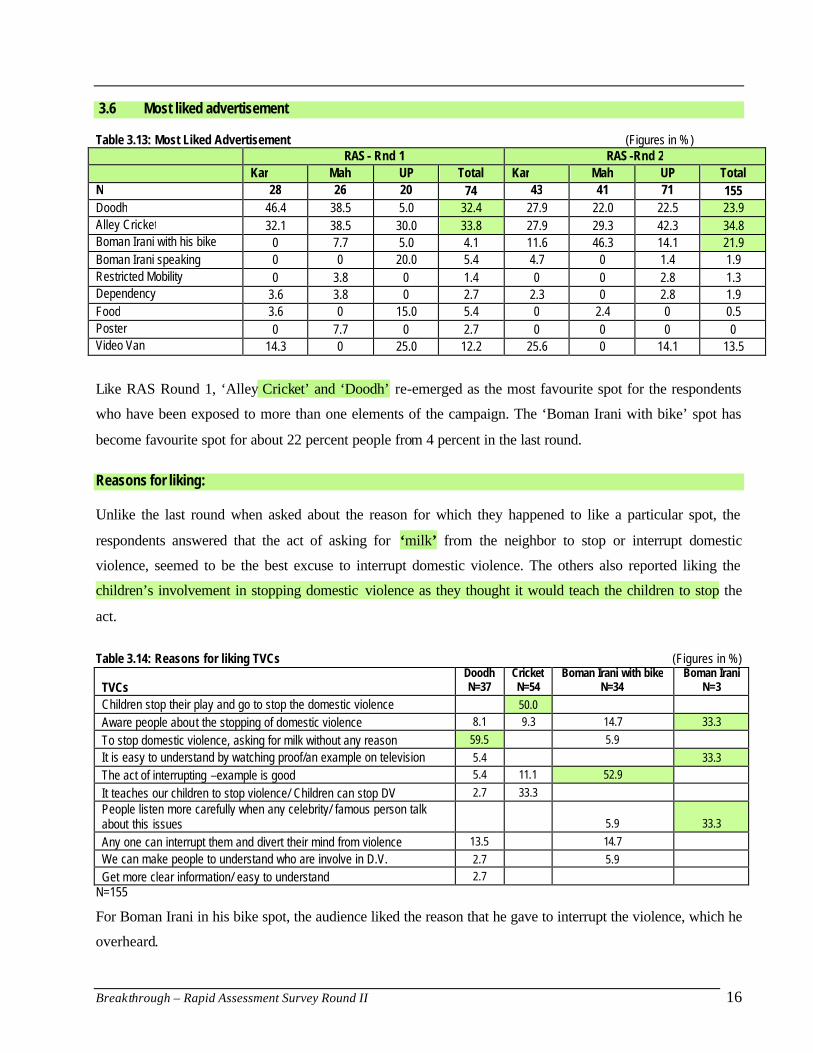
3.6 Most liked advertisement Table 3.13: Most Liked Advertisement (Figures in % ) RAS - Rnd 1 RAS -Rnd 2 Kar Mah UP Total Kar Mah UP Total N 28 26 20 74 43 41 71 155 Doodh 46.4 38.5 5.0 32.4 27.9 22.0 22.5 23.9 Alley Cricket 32.1 38.5 30.0 33.8 27.9 29.3 42.3 34.8 Boman Irani with his bike 0 7.7 5.0 4.1 11.6 46.3 14.1 21.9 Boman Irani speaking 0 0 20.0 5.4 4.7 0 1.4 1.9 Restricted Mobility 0 3.8 0 1.4 0 0 2.8 1.3 Dependency 3.6 3.8 0 2.7 2.3 0 2.8 1.9 Food 3.6 0 15.0 5.4 0 2.4 0 0.5 Poster 0 7.7 0 2.7 0 0 0 0 Video Van 14.3 0 25.0 12.2 25.6 0 14.1 13.5
Like RAS Round 1, ‘Alley Cricket’ and ‘Doodh’ re-emerged as the most favourite spot for the respondents
who have been exposed to more than one elements of the campaign. The ‘Boman Irani with bike’ spot has
become favourite spot for about 22 percent people from 4 percent in the last round.
Reasons for liking: Unlike the last round when asked about the reason for which they happened to like a particular spot, the
respondents answered that the act of asking for ‘milk’ from the neighbor to stop or interrupt domestic
violence, seemed to be the best excuse to interrupt domestic violence. The others also reported liking the
children’s involvement in stopping domestic violence as they thought it would teach the children to stop the
act.
Table 3.14: Reasons for liking TVCs (Figures in %)
TVCs Doodh N=37
Cricket N=54
Boman Irani with bike N=34
Boman Irani N=3
Children stop their play and go to stop the domestic violence 50.0 Aware people about the stopping of domestic violence 8.1 9.3 14.7 33.3
To stop domestic violence, asking for milk without any reason 59.5 5.9 It is easy to understand by watching proof/an example on television 5.4 33.3 The act of interrupting –example is good 5.4 11.1 52.9
It teaches our children to stop violence/ Children can stop DV 2.7 33.3 People listen more carefully when any celebrity/ famous person talk about this issues 5.9 33.3
Any one can interrupt them and divert their mind from violence 13.5 14.7 We can make people to understand who are involve in D.V. 2.7 5.9 Get more clear information/ easy to understand 2.7
N=155
For Boman Irani in his bike spot, the audience liked the reason that he gave to interrupt the violence, which he
overheard.

Breakthrough – Rapid Assessment Survey Round II 17
For the radio spots the respondents said that these ads tell people not to torture women at home.
The video van was preferred by respondents as it was an interactive medium for creating awareness among
masses. The audience see, hear, feel and understand the issue of domestic violence and the need to stop it.
They believed that awareness through the interactive media of drama and street plays can leave more impact
on the people.
3.7 Action taken after seeing the campaign Table 3.15: Action Taken (Figures in % )
N=241 Karnataka Maharashtra Uttar Pradesh Total R1 R2 R1 R2 R1 R2 R1 R2
Discussed with friends/family 53.8 68.4 36.3 2.5 12.5 48.1 34.2 39.4 Stopped domestic violence in neighbourhood 6.3 5.1 0 6.2 3.8 30.9 3.3 14.1 Did nothing 42.5 29.1 63.8 90.1 83.8 14.2 63.3 44.5 It has not happened yet 1.2 0.4 The respondents were asked about the actions taken after hearing, watching any media. Around 40 percent
reported discussing and deliberating on the issue of domestic violence with friends and family. Interestingly
stopping or interrupting DV in neighbourhood was reported by 14 percent of the respondents which showed a
certain rise from the first round.
3.8 Awareness about PWDV Act 2005
Besides understanding the level of recall of the messages given through the television and radio spots the
study also wanted to gauge the level of awareness of all the respondents on domestic violence and related
issues.
3.9 Heard about Protection of Women from Domestic Violence Act, 2005 Table 3.16: Protection of Women from Domestic Violence Act, 2005 (Figures in %)
Karnataka Maharashtra Uttar Pradesh Total R1 R2 R1 R2 R1 R2 R1 R2 Yes 67.5 74.7 50.0 7.4 28.8 65.4 48.8 49.0 No 32.5 25.3 50.0 92.6 71.3 34.6 51.3 51.0
Eventually in this round too, a little less than half of the total respondents reported to know about the PWDV
Act. The disintegrated data reveals that the proportion of respondents reporting hearing about PWDVA
showed a positive increase in Karnataka and Uttar Pradesh. The table below shows that 91 percent of
respondents knew about protection order under the act.
Breakthrough – Rapid Assessment Survey Round II 18
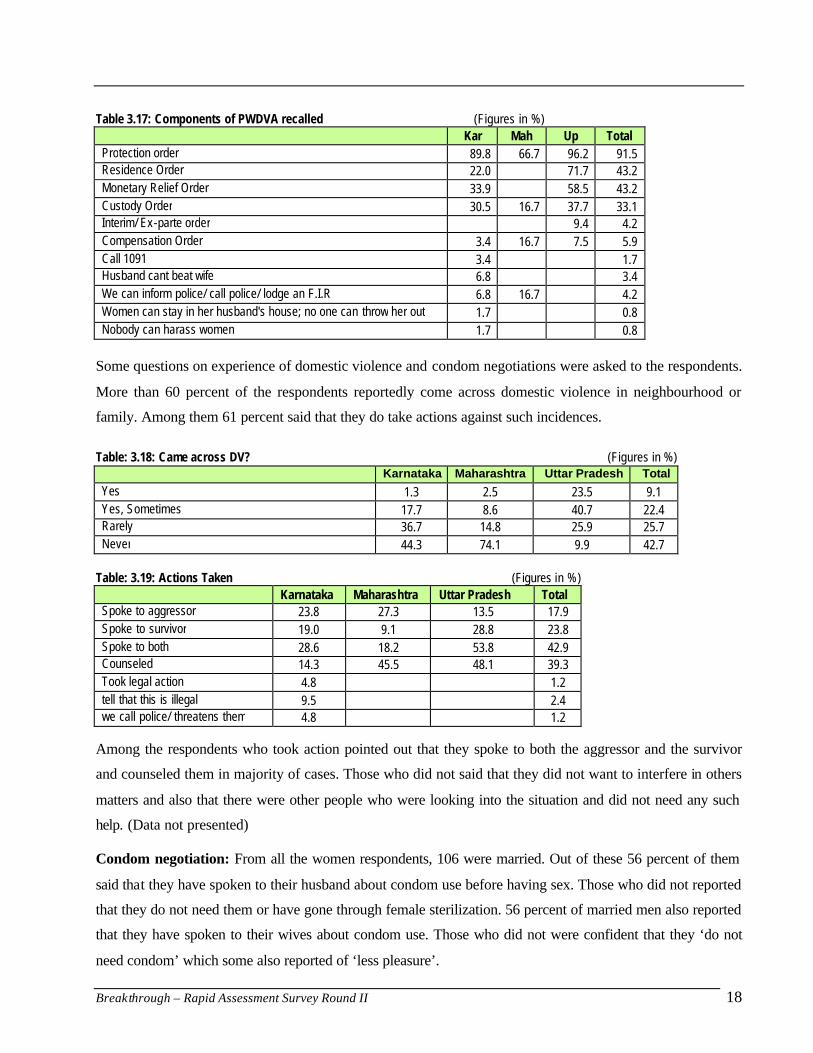
Table 3.17: Components of PWDVA recalled (Figures in %) Kar Mah Up Total Protection order 89.8 66.7 96.2 91.5 Residence Order 22.0 71.7 43.2 Monetary Relief Order 33.9 58.5 43.2 Custody Order 30.5 16.7 37.7 33.1 Interim/ Ex-parte order 9.4 4.2 Compensation Order 3.4 16.7 7.5 5.9 Call 1091 3.4 1.7 Husband cant beat wife 6.8 3.4 We can inform police/ call police/ lodge an F.I.R 6.8 16.7 4.2 Women can stay in her husband's house; no one can throw her out 1.7 0.8 Nobody can harass women 1.7 0.8
Some questions on experience of domestic violence and condom negotiations were asked to the respondents.
More than 60 percent of the respondents reportedly come across domestic violence in neighbourhood or
family. Among them 61 percent said that they do take actions against such incidences.
Table: 3.18: Came across DV? (Figures in %) Karnataka Maharashtra Uttar Pradesh Total Yes 1.3 2.5 23.5 9.1 Yes, Sometimes 17.7 8.6 40.7 22.4 Rarely 36.7 14.8 25.9 25.7 Never 44.3 74.1 9.9 42.7
Table: 3.19: Actions Taken (Figures in %) Karnataka Maharashtra Uttar Pradesh Total Spoke to aggressor 23.8 27.3 13.5 17.9 Spoke to survivor 19.0 9.1 28.8 23.8 Spoke to both 28.6 18.2 53.8 42.9 Counseled 14.3 45.5 48.1 39.3 Took legal action 4.8 1.2 tell that this is illegal 9.5 2.4 we call police/ threatens them 4.8 1.2
Among the respondents who took action pointed out that they spoke to both the aggressor and the survivor
and counseled them in majority of cases. Those who did not said that they did not want to interfere in others
matters and also that there were other people who were looking into the situation and did not need any such
help. (Data not presented)
Condom negotiation: From all the women respondents, 106 were married. Out of these 56 percent of them
said that they have spoken to their husband about condom use before having sex. Those who did not reported
that they do not need them or have gone through female sterilization. 56 percent of married men also reported
that they have spoken to their wives about condom use. Those who did not were confident that they ‘do not
need condom’ which some also reported of ‘less pleasure’.

Breakthrough – Rapid Assessment Survey Round II 19
Summary and Conclusion
The Rapid Assessment Survey Round 2 has been re- conducted in three intervention districts of Karnataka, Maharashtra and Uttar Pradesh. A filter questionnaire was used to identify eligible respondents in the intervention area. To identify 241 respondents (79 in Karnataka and 81 each in the other two states) a total of 2044 contacts had to be made. The survey was intended to take place both in rural in urban areas. However, with difficulties in finding eligible respondents purposively respondents were randomly picked up from locations where video vans have moved. The respondents were equally distributed by sex, were literate and about 50 percent were in the age group of 26-35.
Television spots followed by Video Vans emerged as the major channels of exposure to campaign on Domestic Violence. The ‘Doodh’ has turned out to be the most favourite TVC, which was also recalled correctly by the respondents. ‘Alley Cricket’ was the next best. The ‘Boman Irani’ spots were the third best as only quite a few recalled them. The most common learning from all the television spots was ‘stop domestic violence by interrupting’ and to make the ‘abuser realize that someone is watching you’. The main concept of ‘interrupting’ domestic violence by making any trivial excuse resonated very well with the audience for the ‘Doodh ‘ spot. The spot on ‘Alley cricket’ made the respondents realize that children can also play a major role in stopping any act of domestic violence.
The Radio spot were not broadcast after round I RAS. Thus the recall was from whatever the respondents had heard before. The interactive media would have more outreach than Radio. The same can be commented about the print/ poster. A wall painting or a hoarding with ‘Bell Bajao’ logo on it would definitely have more impact and a 360 degree reinforcement effect than what the print advertisement had.
The Video Vans, much comprehensive in its design did leave a mark on its audience till date as the respondents could recall the contents of it in much detail. Besides the information on ‘stopping domestic violence’ the respondents recalled getting information on the PWDV Act 2005 and prevention and spread of HIV.
The campaign did succeed in informing people about the ‘action’ any common person can take to stop any act of domestic violence and avoid being onlookers. The peer education and reinforcement through repeated telecast has made people to act as we do see a rise in people who actually took a step to stop violence in their neighbourhood. A slight strategic modification in resource distribution and channelizing to a more interactive medium can bring even more awareness among people and trigger more positive action towards reducing domestic violence.
***