final report reducing food waste through retail supply ... · final report reducing food waste...
TRANSCRIPT

Final Report
Reducing Food Waste
through Retail Supply Chain
Collaboration
Companies reducing retail supply chain food and packaging waste by working together through an IGD Performance Improvement Programme
Project code: RSC010-001 ISBN:
Research date: April 2010 –February 2011 Date: March 2011
WRAP helps individuals, businesses and
local authorities to reduce waste and
recycle more, making better use of
resources and helping to tackle climate
change.
Document reference: WRAP, 2010, Cross Sectoral Work Programme to Reduce Food Waste
Arising in the Retail Supply Chain (WRAP Project RSC010-001.
Report prepared by James Tupper, ECR Learning & Change Manager,
and Peter Whitehead, Agribusiness Project Leader, IGD)
Written by: James Tupper, ECR (Efficient Consumer Response) Learning & Change Manager (IGD),
and Peter Whitehead, Agribusiness Programme Leader (IGD)
Legacy research commissioned by the previous government.
Front cover photography: Cross-functional trading partner teams at the On-Boarding Meeting preparing plans of action for the Measure & Understand phase.
WRAP and IGD believe the content of this report to be correct as at the date of writing. However, factors such as prices, levels of recycled content and regulatory
requirements are subject to change and users of the report should check with their suppliers to confirm the current situation. In addition, care should be taken in using
any of the cost information provided as it is based upon numerous project-specific assumptions (such as scale, location, tender context, etc.).
The report does not claim to be exhaustive, nor does it claim to cover all relevant products and specifications available on the market. While steps have been taken to
ensure accuracy, WRAP cannot accept responsibility or be held liable to any person for any loss or damage arising out of or in connection with this information being
inaccurate, incomplete or misleading. It is the responsibility of the potential user of a material or product to consult with the supplier or manufacturer and ascertain
whether a particular product will satisfy their specific requirements. The listing or featuring of a particular product or company does not constitute an endorsement by
WRAP and WRAP cannot guarantee the performance of individual products or materials. This material is copyrighted. It may be reproduced free of charge subject to the
material being accurate and not used in a misleading context. The source of the material must be identified and the copyright status acknowledged. This material must
not be used to endorse or used to suggest WRAP’s endorsement of a commercial product or service. For more detail, please refer to WRAP’s Terms & Conditions on its
web site: www.wrap.org.uk
Reducing Food Waste through Retail Supply Chain Collaboration 3
Executive summary
Aims
In December 2009 WRAP commissioned IGD to conduct a performance improvement programme with leading
grocery retailers and their trading partners aimed at reducing food and drink waste in the supply chain. The
programme was designed to support signatories to the second phase of the Courtauld Commitment and provide a
demonstration to the wider industry, highlighting how collaborative working can prevent waste arising while
providing commercial benefits.
The programme started in December 2009 and ran through 2010, completing in February 2011 following an ex-
post-evaluation meeting.
Specifically, the programme aimed to:
deliver reductions in food and packaging waste previously being disposed of to landfill;
initiate new ways of working and business practices across the supply chain that prevent waste; and
deliver case studies that showcase the benefits of the project and encourage wider and faster uptake of such
collaborative working practices across the grocery industry.
Method
IGD approached a senior Director in several retailer signatories of the Courtauld Commitment at the outset of the
programme with an invitation to participate. Five retailers opted to join the programme nominating a key lead
individual who would be responsible for the work. The retailers then self-selected non-competing product
categories with high levels of waste and invited their respective suppliers to participate. This led to five retailer-
supplier teams each comprising between two and six individuals who carried out the programme with facilitation
from IGD.
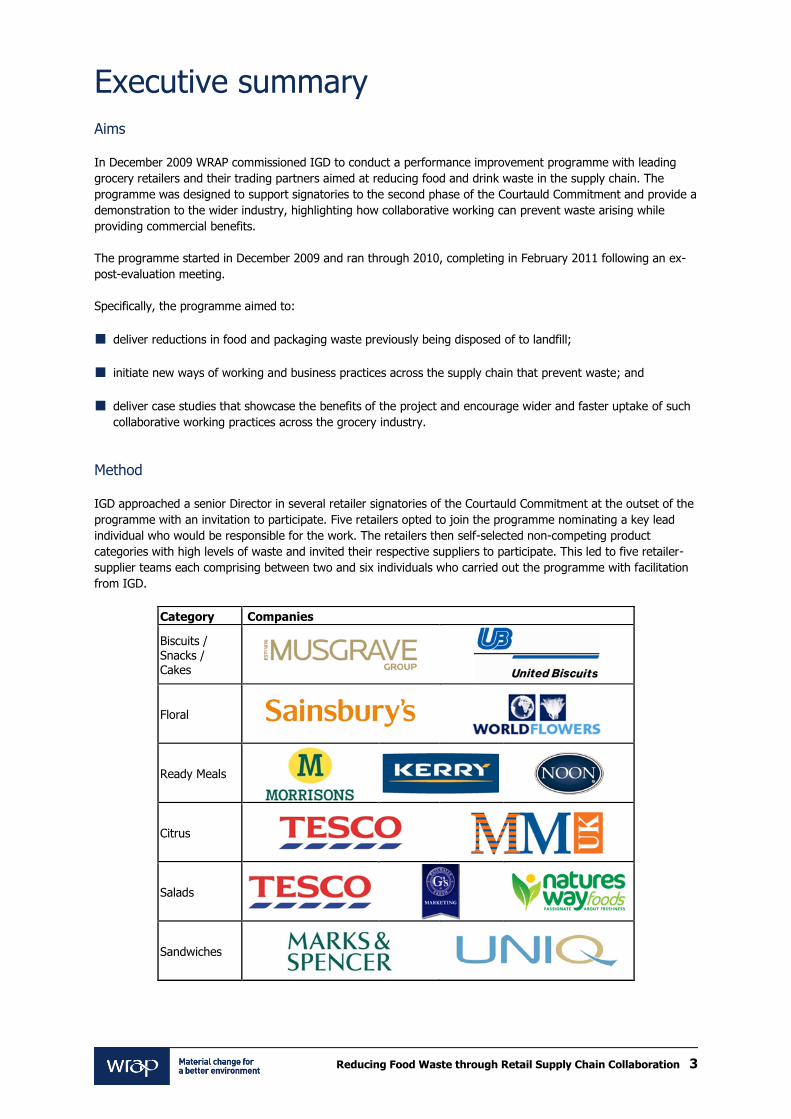
Category Companies
Biscuits / Snacks / Cakes
Floral
Ready Meals
Citrus
Salads
Sandwiches
Reducing Food Waste through Retail Supply Chain Collaboration 4
The retailer-supplier teams focused on:
delivering commercial benefits for their participating businesses so that behavioural changes could be
embedded and sustained;
reducing food and packaging waste including landfill and non-value adding activities for their chosen product
categories; and
developing case studies to be shared encouraging wider uptake.
The facilitation provided by IGD comprised three phases.
First, teams were requested to ‘measure and understand’ their respective category specific supply chains in
order to identify current processes from end-to-end and quantify the amount of waste arising. All teams used
systematic methods such as value stream mapping in both the retailers and suppliers premises. This phase ended
with teams presenting their findings to each other at a progress meeting designed to cross-fertilise ideas and
develop plans for improvement.
In the second phase, ‘re-design and pilot’ the teams targeted one or more root causes of waste (identified in
phase one) and developed new ways of working that would reduce waste. Typically, these involved activities such
as joint business planning between retailer and supplier and agreeing forecasts where previously these were
separate exercises. Better alignment between order management/timing and production schedules was also
achieved. These changes were piloted by the teams and their impact assessed. A progress meeting marked the
completion of this phase in which teams were able to have their findings assessed and peer reviewed.
The third and final phase, ‘roll-out and sustain’ involved teams applying the improvements to other parts of
their businesses, for example other products within the category or other categories. Solutions were embedded
with work instructions in some cases following Board approval. A final progress meeting captured the benefits
and agreed a framework for developing the case studies. Each team agreed to attend an ex-post evaluation
meeting to finalise benefits and assess the overall cost/benefit of the programme.
Results
Overall the programme has prevented approximately 1,400 tonnes of waste arising as of March 2011, with a
further 1,193 tonnes expected to be prevented in the financial year 2011-12. The waste reductions were achieved
using simple methods throughout the programme, thereby not incurring capital or other costs. New ways of
working were developed that are transferable to other supply chains and the reduction was delivered in a
sustainable and profitable way. As a result, as a percent of sales waste has fallen by up to 1% point allowing for
products whose sales have increased over the life of the programme.
The programme has also given rise to what generically might be termed ‘better supplier relations’. Specifically,
all teams have made changes to their working practices as a result of the programme. These changes include:
instigating regular meetings between the retailer and supplier teams;
increasing/introducing daily communications with suppliers;
more detailed forecasting methods linked to an improved order planning process;
improved tools to assess underperforming lines and for decision making;
improved tools to make order amendment more accurate; and
regular touch-points to review progress on a regular basis.
Teams noted that the methods piloted in the programme can be deployed in other categories and certain teams
have plans in this regard. In a similar way teams noted that methods piloted by other teams may have
applicability to their own trading partners.

Reducing Food Waste through Retail Supply Chain Collaboration 5
The new ways of working, identified by the teams which have wider applicability to food retailers and
manufacturers not involved in the programme are listed below.
improved communications between retailers and suppliers over production planning and order timings;
closer cross-functional team-working within each organisation as well as between them;
joint forecasting, both between and within companies using all the expertise available;
range management including removal of slow moving lines (SKU’s);
fixing order quantities based on a significant proportion of current volumes;
reduced packaging and better designs for shelves; and,
changes to the ‘mark down’ windows for products reduced to clear.
There is a great deal of work being undertaken by WRAP under the second phase of the Courtauld Commitment
and by IGD as part of the ECR (UK) programme to help companies identify and reduce their waste. The following
practices were identified by the participants as being particularly beneficial and they form the recommendations
from this project to the wider industry.
Retailers and suppliers should measure waste using tonnes as the common metric, in preference to value or
the number of cases;
retailers and suppliers should develop ‘joint business plans’ to drive their supply chain operations with open
and honest sharing of information;
retailers and suppliers should develop an ‘end-to-end’ understanding of each other’s business using tried and
tested approaches such as value stream mapping; and
retailers and suppliers should focus on waste prevention with suppliers through the use of in-store availability
measures in preference to service levels.
This report has emphasised the value of collaborative working between trading partners through an externally
facilitated performance improvement programme as an effective vehicle for improving waste prevention. Other
sectors of the grocery industry, for example the independent or convenience sector could benefit from a similar
approach.
Given the benefits that have been identified in this report, WRAP is undertaking similar collaborative programmes
across the home improvement, grocery and food service sectors and encourage industry and business to engage
in the same.
The report includes eight case studies that have been developed from this project.
Reducing Food Waste through Retail Supply Chain Collaboration 6
Contents
1.0 Introduction ................................................................................................................................ 8 1.1 Background ........................................................................................................................ 8 1.2 Aims and Objectives ............................................................................................................ 8
2.0 Methods ...................................................................................................................................... 9 2.1 Engagement ..................................................................................................................... 10 2.2 Programme ....................................................................................................................... 11 2.3 Facilitation ........................................................................................................................ 13
2.3.1 Paying Attention to Participants’ Commitment Level ................................................. 13 2.3.2 Paying Attention to Partnership Success Factors ...................................................... 14
3.0 RESULTS .................................................................................................................................... 15 3.1 Tonnes Saved ................................................................................................................... 15 3.2 Commercial Impacts .......................................................................................................... 16 3.3 New Business Practices ...................................................................................................... 17 3.4 Cost Benefit ...................................................................................................................... 18
4.0 Conclusions and Recommendations ......................................................................................... 19 4.1 Recommendations ............................................................................................................. 19
Appendix 1: People ............................................................................................................................... 21 Appendix 2: Case Studies ..................................................................................................................... 22
Figures
Figure 1: Hierarchy of objectives for programme developed with participating retailers. ................................... 10 Figure 2: IGD Performance Improvement Programme structure and dates. ..................................................... 12 Figure 3: The purpose and activities of each of the three phases of the programme. ....................................... 12 Figure 4: The key activities of each the four meetings of the programme. ....................................................... 12 Figure 5: Participant commitment levels during the On-Boarding Meeting ....................................................... 13
Tables
Table 1: Product categories and suppliers identified by participating retailers. ................................................. 11 Table 2: Job functions companies were asked to consider engaging in the first phase. ..................................... 11 Table 3: Participants’ scoring at Progress Meetings of their team’s partnership. ............................................... 14 Table 4: Participants’ estimates of their teams’ supply chain waste prevention due to the programme. .............. 15 Table 5: People involved; their roles and their attendance at the four main meetings. ...................................... 21

Reducing Food Waste through Retail Supply Chain Collaboration 7
Abbreviations Defra Department for Environment, Food and Rural Affairs
FOTM Food on the Move
JS Sainsbury’s
KPI Key Performance Indicators
LEAN A production practice that considers the expenditure of resources for any goal other than the creation of value for the end customer to be wasteful, and thus a target for elimination
M&S Marks & Spencer
MAPE Mean Absolute Percent Error
MOQ Minimum Order Quantity
NPD New Product Development
RAG or RYG Traffic lights: Red Amber Green or Red Yellow Green
SKU Stock Keeping Unit
SNAF Short Notice Amended Forecast
UB United Biscuits
WRAP Waste & Resources Action Programme
Acknowledgements
IGD and WRAP would also like to thank the companies participating in this programme.
Musgrave
United Biscuits
Sainsbury's
World Flowers
Morrisons
Kerry-Noon
Tesco Stores Ltd
MM (UK)
Natures Way Foods
G's Marketing
Marks & Spencer
Uniq Prepared Foods
Particular thanks go to their cross-functional trading-partner team members who did the work, identified the
opportunities, designed and tested solutions, embedded new working methods and prevented hundreds of tonnes
of retail supply chain waste in a commercially sustainable way.
Special thanks go to Kerry-Noon, Natures Way Foods, Morrisons, Marks & Spencer and Sainsbury's for hosting
key meetings during the programme.

Reducing Food Waste through Retail Supply Chain Collaboration 8
1.0 Introduction
1.1 Background
Around 6.5 million tonnes of waste arise in the manufacture, distribution and retailing of food and drink (WRAP,
2010)1. The majority (77%) of this waste rests in food manufacturing. The economic cost of this, ‘supply chain’
waste is estimated at around £5 billion. Previous research into the role of supplier – retailer trading relations by
Cranfield University and IGD for Defra identified management factors as a significant root cause of food and drink
waste2. Much has been done to drive down waste by individual manufacturers and retailers but the potential of
collaborative working in a supply chain context as a means of preventing waste is relatively unexplored.
A framework for waste prevention across the supply chain has been introduced under the 2nd phase of the
Courtauld Commitment through which 49 signatories (as of March 2011) are working to improve resource
efficiency and reduce the carbon and wider environmental impact of the grocery industry. Signatories are working
with WRAP to achieve individual and collective ‘sector’ strategy plans to deliver the following three targets:
to reduce the weight, increase recycling rates and increase the recycled content of all grocery packaging, as
appropriate to reduce the carbon impact of this grocery packaging by 10%;
to reduce household food and drink waste by 4%; and
to reduce traditional grocery product and packaging waste (both solid and liquid) in the grocery supply chain
by 5%.
In support of the supply chain reduction target, WRAP is conducting research projects to identify waste hotspots
where supply chain efficiencies can be made, mapping out the reasons for waste and identifying good practice
guidance. These projects include a series of ‘resource maps’ covering the following sectors: fresh fruit and
vegetables, meat, fish, pre-prepared foods and drinks (alcoholic and non-alcoholic). As part of its support to
signatories to meet Courtauld targets WRAP is also carrying out waste prevention reviews and providing bespoke
advice on how to reduce the waste identified.
In recognition that the new supply chain target is challenging and that previously many retailers and
manufacturers have focused on the diversion of waste from landfill (to, for example, energy recovery) and less on
waste prevention, WRAP invited IGD to facilitate a performance improvement programme to demonstrate the
waste reduction benefits of collaborative working. The programme is the first of its kind designed specifically to
involve trading partners working together to identify and prevent waste in their supply chains.
IGD has a long history of encouraging supply chain collaboration through, for example, management of the
Efficient Consumer Response (ECR -UK) programme. This work includes the development and delivery of IGD
performance improvement programmes utilising a bespoke design that has been run 15 times across UK,
elsewhere in Europe and in North America by IGD or under licence to IGD. The programme enables supply chain
partners and different job functions to work together for a common purpose, build their understanding, challenge
the status quo and change their working methods. The programme enables companies to identify, implement and
sustain step-changes in performance levels along the supply chain that would have been difficult or impossible to
undertake in isolation. In doing so, it also encourages companies to embed the process changes within their
businesses and supply chains.
1.2 Aims and Objectives
The aims of this new performance improvement programme set by WRAP and IGD were as follows:
1 Waste arising in the supply of food and drink to households in the UK (WRAP, 2010) 2 Evidence on the role of supplier-retailer trading relationships and practices in waste generation in the food chain (Defra, 2008)

Reducing Food Waste through Retail Supply Chain Collaboration 9
to deliver reductions in food and packaging waste previously being disposed to landfill;
to initiate new ways of working and business practices across the supply chain that prevent waste; and
to deliver case studies that showcase the benefits of the project and encourage wider and faster uptake more
widely across the grocery industry.
The emphasis in the programme was to find collaborative ways of working that prevent waste arising. The extent
to which waste could be prevented was uncertain at the outset, but WRAP specified that the programme should
deliver significant reductions and set a target over the programme and following embedding within the
businesses of 10,000 tonnes. However, it was recognised that this programme, although based on a tried and
tested approach, was a pilot initiative to explore whether retailer-supplier collaborative working could be an
effective way of helping signatories meet their commitments to Courtauld. Due to the nature of the programme
both WRAP and IGD identified behaviour change that could be sustained to be as important as the waste
reduction target.
Both WRAP and IGD also wished to use the programme to demonstrate to the wider industry (Courtauld
signatories and companies more generally) that collaborative working can prevent waste and reduce costs. A
target of six case studies drawn from the programme was set to showcase the benefits.
It was anticipated that this project would also help improve resource efficiency more generally because other
types of ‘waste’ such as markdowns, inventory and transport would be reduced at the same time. Some of these
impacts are difficult to measure directly but arise through process improvements identified and adopted by
retailer-supplier project teams engaged on the project.
Both WRAP and IGD recognised that if waste prevention was to be sustainable and the new ways of working
embedded across the supply chain, the programme needed to be shown to be of commercial benefit to
participating companies and so this was critical to both the design and execution of projects. Generally
businesses at any one point in time will be running a mix of short term and longer term projects, the latter more
strategic in nature. A short term project of this type would normally be expected to deliver immediate gains while
in effect it is preparing companies for the longer term strategic goal of shifting waste from landfill by preventative
activity.
For many companies waste reduction is ‘business as usual’ and an explicit key performance measure. This
programme was designed to help companies challenge existing approaches while recognising that if companies
are going to take forward change they will only do so if those changes help achieve company wide goals
profitably.
The programme commenced in December 2009 with the recruitment of trading partners and was completed in
February 2011 with an ex-post evaluation meeting.
2.0 Methods
IGD performance improvement programmes engage a mix of businesses and individuals from within the
businesses and facilitate these teams through a programme of phased activities in a simple structure:
companies and their supply chain trading partner(s) are engaged in the programme to tackle real
commercially relevant issues;
cross functional trading partners are recruited to break through the barriers between functions and
businesses;
teams from several supply chains work in parallel to agreed deadlines, competing but also cross fertilising
ideas;
a Measure & Understand phase ensures actions are based on evidence; not myth, legend or gut-feel alone;

Reducing Food Waste through Retail Supply Chain Collaboration 10
a Redesign & Pilot phase wins benefits in the short-term to motivate others from the businesses to join the
change process; and,
a Roll-out & Sustain phase ensures results are delivered and learnings applied; not sidelined by new
initiatives.
The following sections detail the engagement, structure and facilitation of the programme.
2.1 Engagement
IGD approached a senior Director in several retailer signatories of the Courtauld Commitment offering them the
opportunity to participate in the programme and succeeded in attracting five retailers to the programme, as
follows:
Marks & Spencer Tesco Sainsbury’s Morrisons Musgrave
Their participation was secured at a meeting of the retailers at IGD on 5th March 2010 against the following
hierarchy of objectives that stressed the importance of delivering commercial benefit from waste reduction.
Figure 1: Hierarchy of objectives for programme developed with participating retailers.
From the outset and during the programme, focus on
Towards the end and immediately following the programme, focus on
Commercial benefit from waste
performance improvement for
businesses participating directly in the
programme so that behavioural change
can be embeded and sustained.
Reduction in food and packaging waste
arising in the retail supply chain (as
defined for target 3 of the Courtauld
Commitment Phase 2).
Reduction in household waste
(e.g. from pack size reduction).
Reduction in other types of waste /
non-value-adding activities.
Commercial benefit from waste
performance improvement for
businesses not participating in the
programme through both:
hard hitting case studies of successful
food and packaging waste reduction
(with any commercially sensitive
information removed); and
clearer customer requirements that are
more aligned across supply chains to
reduce waste / improve resource
efficiency.
Previous research (for example, Defra, 2008) had identified categories that have both a short shelf life and high
demand volatility as those likely to have the highest percentage levels of waste in relation to sales. While this
information was available to participants, we were not prescriptive about which products were chosen for this
project - each of the retailers were free to identify different product categories. Once these were identified the
process involved the retailers selecting non-competing own label or branded product suppliers. The products
selected ranged from sandwiches and biscuits to flowers and ready meals.
Reducing Food Waste through Retail Supply Chain Collaboration 11
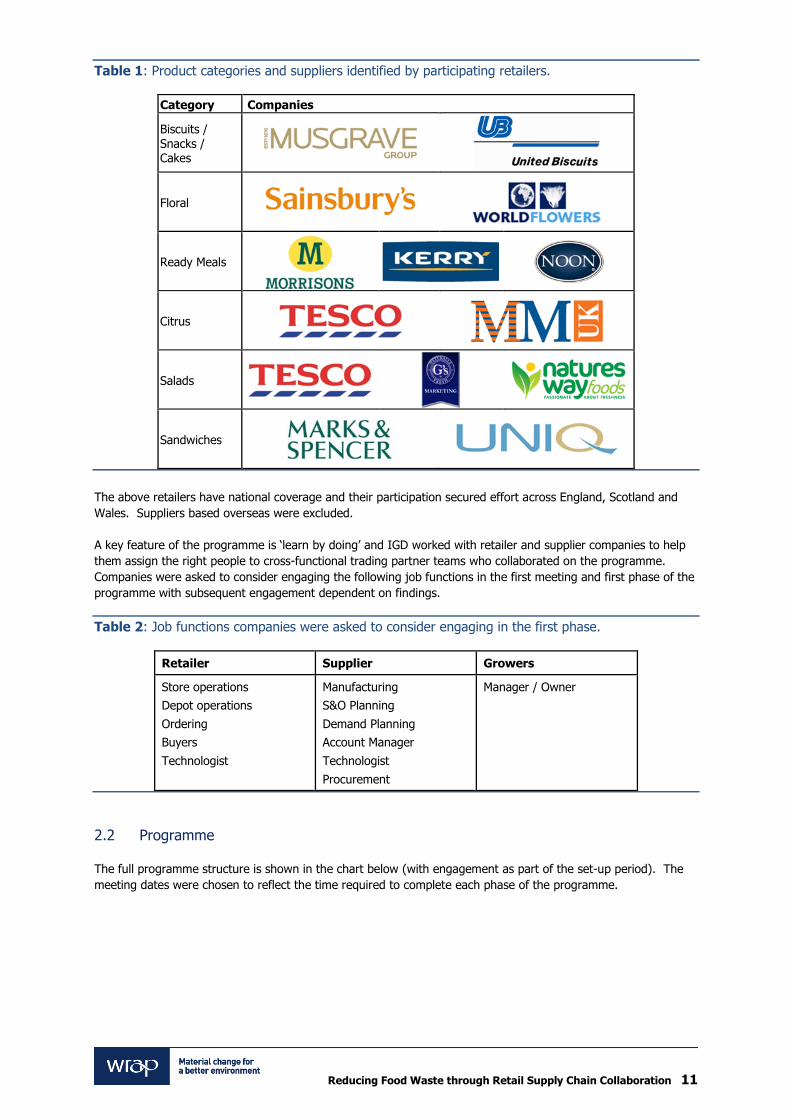
Table 1: Product categories and suppliers identified by participating retailers.
Category Companies
Biscuits / Snacks / Cakes
Floral
Ready Meals
Citrus
Salads
Sandwiches
The above retailers have national coverage and their participation secured effort across England, Scotland and
Wales. Suppliers based overseas were excluded.
A key feature of the programme is ‘learn by doing’ and IGD worked with retailer and supplier companies to help
them assign the right people to cross-functional trading partner teams who collaborated on the programme.
Companies were asked to consider engaging the following job functions in the first meeting and first phase of the
programme with subsequent engagement dependent on findings.
Table 2: Job functions companies were asked to consider engaging in the first phase.
Retailer Supplier Growers
Store operations Depot operations
Ordering
Buyers
Technologist
Manufacturing S&O Planning
Demand Planning
Account Manager
Technologist
Procurement
Manager / Owner
2.2 Programme
The full programme structure is shown in the chart below (with engagement as part of the set-up period). The
meeting dates were chosen to reflect the time required to complete each phase of the programme.

Reducing Food Waste through Retail Supply Chain Collaboration 12
Figure 2: IGD Performance Improvement Programme structure and dates.
© IGD 2010
For WRAP reporting and ex-post monitoring purposes an additional meeting was held with company
representatives on 17th February 2011.
IGD performance improvement programmes have a simple structure, which increases the chances that essential
phases of activity are not skipped because of time pressure or forgotten because, for example, they have been
obscured by unnecessary complexity. The name, purpose and team activity of each phase are outlined below.
Figure 3: The purpose and activities of each of the three phases of the programme.
Phase Purpose of Phase Team Activity During Phase
1. Measure &
Understand
To ensure actions are based
on evidence; not myth and
legend or gut-feel alone.
Performance is measured, root
causes of variance analysed and
alternate solutions are identified.
2. Redesign
& Pilot
To win short-term gains
and to motivate others to
join the change process.
Chosen solutions are developed
and tested locally to contain risk.
Peer scrutiny drives valid trials.
3. Roll-out
& Sustain
To ensure results are delivered
and learnings applied; rather than
sidelined by new initiatives.
Solutions are applied consistently,
improved further, and applied in
other areas.
© IGD 2010
Within the above structure teams have considerable freedom to employ methods that may be already available to
them from within one or other of the partner companies or made available to them by IGD at one of the
meetings or via the reference material provided.
The key activities of each the four meetings are outlined below.
Figure 4: The key activities of each the four meetings of the programme.
Meeting Participants
On-Boarding Develop vision, scope and key performance indicators
Get up-skilled in simple mapping and analysis techniques
Plan cross-functional trading partner team actions
1st Progress Present findings, alternate solutions and draft plans
Elicit improvement suggestions from other teams
Improve team action plans to redesign and pilot
2nd Progress Present the pilot results, learnings and draft plans
Elicit improvement suggestions from other teams
Improve team action plans to roll-out and sustain
Evaluation Present roll-out results, investment made and abilities developed
Estimate waste reductions (tonnes) and commercial benefits (£s)
Detail action plans to further spread and embed improvements
© IGD 2010
Reducing Food Waste through Retail Supply Chain Collaboration 13
2.3 Facilitation
Throughout the programme IGD acted as a facilitator to encourage team working by:
providing retailer and supplier teams with an additional sense of confidence to innovate;
ensuring detailed actions, responsibilities and deadlines were agreed, documented and distributed;
surfacing individuals’ concerns and identifying next steps to overcome them;
utilising individuals’ positive feelings, building high and sustainable energy levels and commitment to the
programme;
committing retailer and supplier teams to work to a series of reporting deadlines that don’t slip;
ensuring coordination and cross fertilisation amongst teams working in parallel;
facilitating scrutiny and constructive criticism of the progress and plans presented by other teams;
ensuring all business results and learning’s are captured; and
identifying success stories/tools that can be shared with other categories to accelerate improvement.
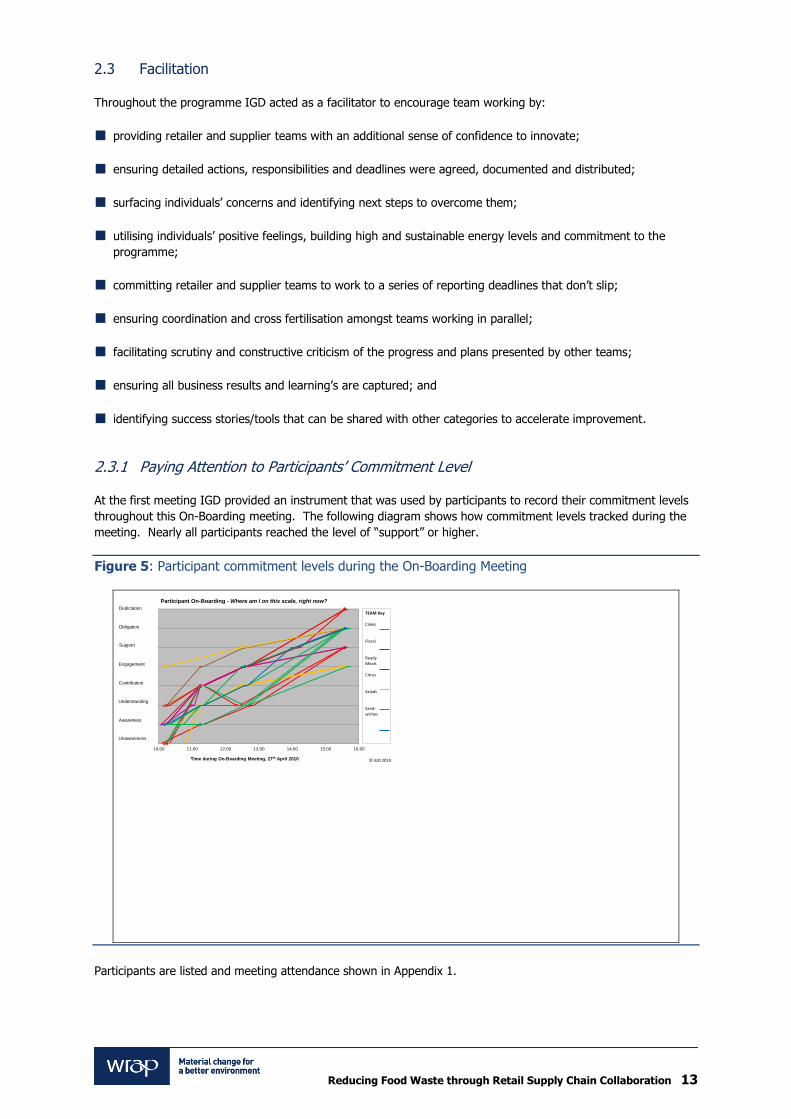
2.3.1 Paying Attention to Participants’ Commitment Level
At the first meeting IGD provided an instrument that was used by participants to record their commitment levels
throughout this On-Boarding meeting. The following diagram shows how commitment levels tracked during the
meeting. Nearly all participants reached the level of “support” or higher.
Figure 5: Participant commitment levels during the On-Boarding Meeting
10:00 11:00 12:00 13:00 14:00 15:00 16:00
Time during On-Boarding Meeting, 27th April 2010
Participant On-Boarding - Where am I on this scale, right now?
Unawareness
Awareness
Understanding
Contribution
Engagement
Support
Obligation
DedictationTEAM Key
Cakes
Floral
Ready Meals
Citrus
Salads
Sand-wiches
© IGD 2010
Participants are listed and meeting attendance shown in Appendix 1.

Reducing Food Waste through Retail Supply Chain Collaboration 14
2.3.2 Paying Attention to Partnership Success Factors
During the Progress Meetings IGD provided an instrument that was used by participants to score their team’s
partnership against 12 success criteria. Participants rated on a five point scale the extent to which they agreed
with each of the statements listed in the table below. The colours on the right of the table indicate the relative
rating of each team; based on the average of team members’ ratings.
Table 3: Participants’ scoring at Progress Meetings of their team’s partnership.
Key TEAM
G Agree A Not sure R Disagree
Cak
es
Flo
ral
Re
ady
M
eal
s
Cit
rus
Sala
ds
San
d-
wic
he
s
Partnership Success Criteria
Symbiosis The partnership achieves more
together than working separately
Value The benefits outweigh
the costs for all parties
Win / Win There is a genuine
spirit of co-operation
Commitment All parties have bought-in
Equality All parties have valid input
Participation There is shared effort and action
Clarity Everyone is clear about the vision,
process, outcomes and their roles
Sponsorship There is ongoing support
from key decision makers
Empowerment There is the appropriate
authority to make decisions
Communications All parties are informing and
being kept informed of news
Transparency Information is being shared
Bubble Hidden agendas, manipulation,
power play are not getting in the way
OVERALL
© IGD 2010
Both the Citrus and Salads teams showed higher levels of uncertainty and dis-agreement than did the other
teams. In the Salads team it reflected the lower “support” from the retail commercial function combined with the
departure of a leading player from one of the suppliers. In the Citrus team the scoring reflected the lower
“support” from a supplier person combined with the departure from the retailer of their leading player. These
departures ultimately caused a halt in progress of the Citrus and Salads teams and they took no further part in
the programme despite having done all the ‘measure and understand’ phase, which identified considerable waste
reduction potential.
The above table reflects the aforementioned adverse circumstances affecting the Citrus and Salad teams. All
other teams were able to address, work around or otherwise overcome the partnership issues highlighted.

Reducing Food Waste through Retail Supply Chain Collaboration 15
3.0 RESULTS
The results of the programme against each of the three objectives identified at the start of the project are set out
below. First, tonnes saved with estimates of the commercial impact this has achieved are presented. Second, we
examine whether the programme led to changes in working practices and third, eight case studies are presented
identifying best practice from the programme (see Annex 2). In a final section the results are brought together
into an overall cost-benefit assessment.
3.1 Tonnes Saved
Estimates by the teams of waste prevented during the programme and what they should achieve during 2011 are
summarised in the table below.
Table 4: Participants’ estimates of their teams’ supply chain waste prevention due to the programme.
Supply Chain Waste Saved (tonnes / annum)
TEAM
Cakes Floral Ready Meals
Sand-wiches
Total
Redesign & Pilot, 2010 18 998 223
15 33
Roll-out & Sustain, 2010 36 114 1,371
Further Scale, 2011 102 500 421 170 1,193
The four teams estimated that 33 tonnes per annum of supply chain waste was prevented during the Redesign &
Pilot phase. An example of this type of change includes re-scheduling phone calls to achieve better production
planning. Such changes, often called ‘just-do-its’ can be implemented without cost and result from detailed
investigation of actual work practices for the particular products involved.
An estimated equivalent of 1,371 tonnes per annum of supply chain waste was prevented during the Roll-out &
Sustain phase. In these cases some system changes may be required but without exception none of the teams
incurred capital costs to make these changes. Further insights into the types of working practice that were
changed are given below and in the case studies.
An estimated equivalent of 1,193 tonnes per annum of supply chain waste should be prevented during 2011 from
further scale-up and embedding of the changes made as a result of the programme. Each team worked over
different time periods and the scale up represents both putting data onto an annual basis as well as applying the
new working practices to other products in the same category (and in certain cases to products in different
categories). Although this figure is more speculative it does represent real plans identified by the teams at the
Evaluation meeting.
Overall the programme has prevented approximately 1,400 tonnes of waste arising as of March 2011, with a
further 1,193 tonnes expected to be prevented in financial year 2011-12. Although this is below the target we
had originally set, it represents a considerable success for the programme. All participants who completed the
project have indicated that the new ways of working are being sustained and rolled out in their supply chains. In
addition, the reports and case studies provided through this programme should aid in ensuring that these new
ways of working are adopted more widely across the food industry.
We asked companies to estimate whether waste as a percent of sales had reduced because of the programme.
Three of the four teams reported that sales of the products in question have increased over the period of the
programme; even allowing for these increases waste as a percent of sales had fallen by around a single
percentage point.
The steps taken within the programme to prevent food waste will also address some aspects of preventing
packaging waste. The teams calculated the weight and type of packaging associated with the main products
recognising that primary packaging will vary even between individual products, for example, different types of
biscuit.
Table 5: Participants’ estimates of the packaging weight and type for each product

Reducing Food Waste through Retail Supply Chain Collaboration 16
Product/Packaging
% packaging
weight to total
Packaging type(s)
Cakes
<1%
Paper (film and
some plastic)
Floral
4%
Card (bucket and
water not included)
Ready Meals
5%
CPET/RPET/PP (and
films)
Sandwiches
6%
90% card (rest
film)
Participants noted that all their packaging was re-cycled. Some teams also noted that they had taken steps
outside of this programme to ‘lightweight’ their packaging.
We had an aspirational target to deliver a reduction in waste of 10,000 tonnes, this was set in the spirit of helping
companies achieve their 5% supply chain waste reduction target specified in the second phase of the Courtauld
Commitment. It should be noted that four retailer teams participated out of the potential signatories and that the
project focused on single products within categories. If the (mainly low and no-cost) opportunities identified in
this project were replicated across the organisations that participated, the actual tonnages saved could be
significantly higher than those achieved within the timeframe of this project
3.2 Commercial Impacts
For the participating businesses to embed and sustain behavioural change the waste prevented by the teams
needs to be commercially beneficial. There are many ways in which waste prevention can reduce costs and
increase sales including, for example, through a reduction in land-fill charges and an increase in product shelf life.
These are presented below for each of the buyer/ supplier partnerships:
Cakes
Musgrave
United
Biscuits
Musgrave (who trade as Budgens and Londis in the UK) have a different business model to
that of the other retailers participating in the programme in that they operate by franchise
agreements. As a result their stores have a good deal of autonomy for example, in deciding
their product ranges. The team estimated an equivalent of 13,800 cases or 36.4 tonnes per
annum of supply chain waste was prevented during the Roll-out & Sustain phase. One
hundred and two tonnes of savings and other benefits are anticipated for 2011 from improved
forecast accuracy, range review, stock reduction and increased product life. Given their
business model implementing a range review is more challenging for Musgrave but the saving
in waste from this alone over the longer term will far outweigh the costs of the programme.
Floral
Sainsbury’s
World
Flowers
Floral is typically a low volume, high value category subject to fluctuating and unpredictable
demand that results in high levels of waste. One of the key changes made by Sainsbury’s and
World Flowers was to introduce fixed order quantities resulting in greater predictability across
the supply chain. The team estimated that a 15% improvement in waste performance at the
retailer is worth approximately £12,000 per week. Further reductions in waste of 15% are
also anticipated in the upstream supply chain. These benefits comprise savings in air-freight,
reduced stock holding and improved factory efficiency. In 2011 a top level reduction in waste
of 222 tonnes per week will be achieved as a result of the programme. Both parties believe
that the programme that focused on two different types of rose is scalable to other flowers
and other categories (for example in fresh produce where trials are planned) and have made
estimates of waste saved in 2011 on this basis.
Ready Meals
Morrisons
Kerry Noon
Morrisons sell 280,000 Indian meals per week (August 2010), the subject of the programme.
Greater collaboration was the key to unlocking improved ways of working focusing on the
better alignment of orders and production. Simple changes, for example to the timing of
orders, led to saving 3% of waste or 223 tonnes in 2010 (which has continued to fall in 2011
despite increased sales) and will save 7% of waste or 421 tonnes in 2011. On this basis, meal
waste prevented will be worth £100,000 per annum and savings in markdowns will be worth
£17,000. The results are potentially applicable to other ready meal suppliers. Ready meal
packaging was also re-designed and its weight reduced.
Sandwiches The short shelf life of sandwiches coupled with unpredictable demand from consumers due,

Reducing Food Waste through Retail Supply Chain Collaboration 17
M&S
UNIQ
for example, to the weather and other factors can lead to high levels of waste. Marks &
Spencer provides a wide range of sandwiches (including ingredients) for their customers with
different types varying in their popularity. By obtaining a fuller understanding of the
contribution made by all sandwich lines and taking action with Uniq to review the range, both
have seen a substantial reduction in their costs. For Marks & Spencer this has been achieved
through reduced stock and lower right–offs, for Uniq there are fewer change-overs and
improved revenues as they are able to push sales without driving up waste.
All of the retailers who participated have published CSR reports that include waste reduction policies (and other
areas of their respective businesses). All four retailers have policies to eliminate the amount of food waste going
to landfill. M&S, Sainsbury’s and Morrisons have set specific dates (2012 for M&S, 2011 for Sainsbury’s and 2013
for Morrisons) to achieve this target.
3.3 New Business Practices
The second objective of the programme was to initiate new ways of working to prevent waste. This is less easy
to quantify but a critical element of the programme if it is to be sustained. To do this we have tracked behaviours
at different stages of the programme.
We asked participants to identify those working practices that changed as a result of the programme and have
become routine. These include:
regular meetings between the retailer and suppliers teams;
daily communications with suppliers – a genuine collaborative approach;
more detailed forecasting methods linked to an improved order planning process;
improved tools to assess underperforming lines and for decision making;
improved tools to make order amendment more accurate; and
regular touch-points to review progress on a regular basis.
The teams noted that while their initial work to measure waste in their specific categories involved some relatively
sophisticated analysis, for example value stream mapping, the changes in working practices are all simple steps
that can be taken without cost (some, for example, involving simple spreadsheets) and can be summarised as
‘better supplier relations’. In practice this means better alignment of order and production management.
The working practices are capable of being used more widely for example in other categories and there are plans
in place to undertake these trials. At least one team remarked that practices piloted by other teams in the
programme had potential applicability to their own trading partners.
The results for each individual project undertaken across the four teams are provided below in the form of eight
case studies. Each case study highlights in more detail the work undertaken by each team, drawing out the
business and environmental benefits both in terms of business results and job behaviours. The table below shows
the focus of the case study and the team responsible.
Table 6: Eight case studies from the programme.
Case Study Trade Partners
1. Snacks and Cakes Promotions Management
Musgrave United Biscuits 2. Biscuits and Snacks Range Management
3. Flowing Cakes Through the Supply Chain – Stockless
4. Floral Supply Chain Waste Prevention Sainsbury’s World Flowers
5. Ready Meal Supply Chain Waste Prevention Morrisons Kerry Noon
6. Collaborative Forecasting of Sandwich Demand
M&S UNIQ 7. Cutting Unprofitable Sandwich Lines to Reduce Waste
8. Reducing to Clear and Prevent Sandwich Waste
The case studies appear in Appendix 2.
Reducing Food Waste through Retail Supply Chain Collaboration 18
3.4 Cost Benefit
In addition to the financial costs incurred by WRAP, the main additional costs on the project were those incurred
by the participating companies through the time of the individuals who worked on the programme. At the
Evaluation Meeting we asked the teams to estimate the time they had invested in the programme. These
estimates from the teams are summarised in the table below.
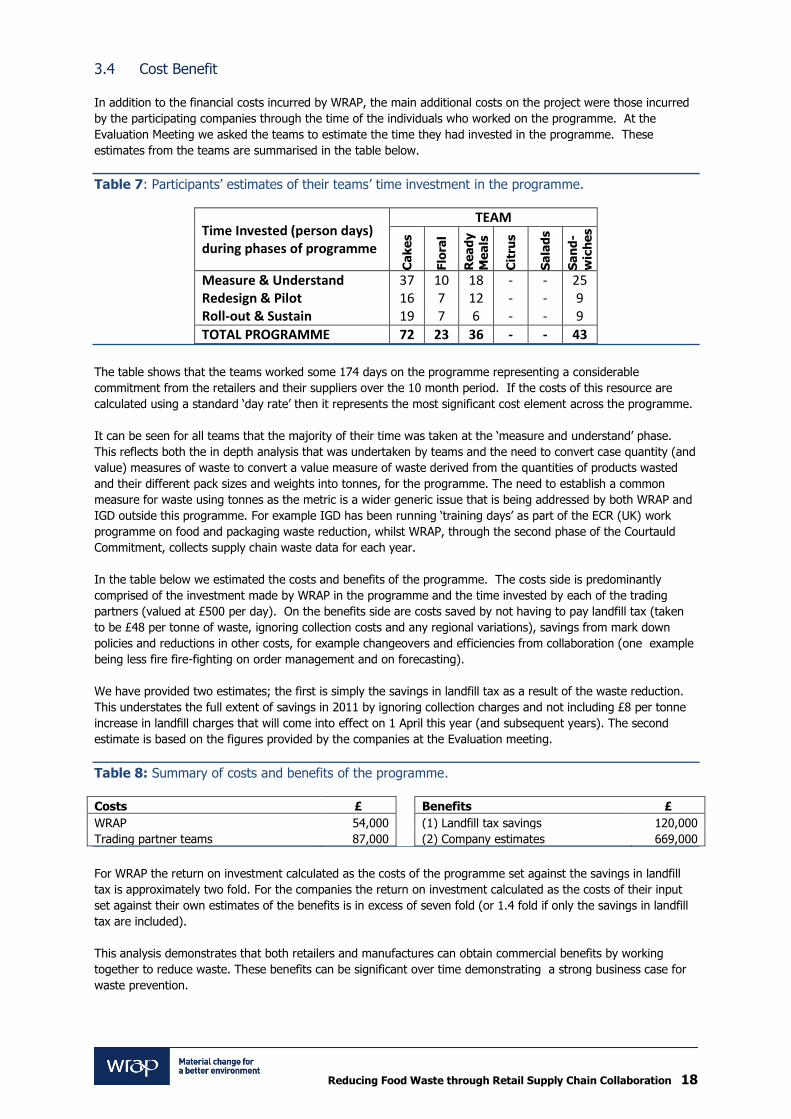
Table 7: Participants’ estimates of their teams’ time investment in the programme.
Time Invested (person days) during phases of programme
TEAM
Ca
ke
s
Flo
ral
Re
ad
y
Me
als
Cit
rus
Sa
lad
s
Sa
nd
-
wic
he
s
Measure & Understand 37 10 18 - - 25 Redesign & Pilot 16 7 12 - - 9 Roll-out & Sustain 19 7 6 - - 9
TOTAL PROGRAMME 72 23 36 - - 43
The table shows that the teams worked some 174 days on the programme representing a considerable
commitment from the retailers and their suppliers over the 10 month period. If the costs of this resource are
calculated using a standard ‘day rate’ then it represents the most significant cost element across the programme.
It can be seen for all teams that the majority of their time was taken at the ‘measure and understand’ phase.
This reflects both the in depth analysis that was undertaken by teams and the need to convert case quantity (and
value) measures of waste to convert a value measure of waste derived from the quantities of products wasted
and their different pack sizes and weights into tonnes, for the programme. The need to establish a common
measure for waste using tonnes as the metric is a wider generic issue that is being addressed by both WRAP and
IGD outside this programme. For example IGD has been running ‘training days’ as part of the ECR (UK) work
programme on food and packaging waste reduction, whilst WRAP, through the second phase of the Courtauld
Commitment, collects supply chain waste data for each year.
In the table below we estimated the costs and benefits of the programme. The costs side is predominantly
comprised of the investment made by WRAP in the programme and the time invested by each of the trading
partners (valued at £500 per day). On the benefits side are costs saved by not having to pay landfill tax (taken
to be £48 per tonne of waste, ignoring collection costs and any regional variations), savings from mark down
policies and reductions in other costs, for example changeovers and efficiencies from collaboration (one example
being less fire fire-fighting on order management and on forecasting).
We have provided two estimates; the first is simply the savings in landfill tax as a result of the waste reduction.
This understates the full extent of savings in 2011 by ignoring collection charges and not including £8 per tonne
increase in landfill charges that will come into effect on 1 April this year (and subsequent years). The second
estimate is based on the figures provided by the companies at the Evaluation meeting.
Table 8: Summary of costs and benefits of the programme.
Costs £ Benefits £
WRAP 54,000 (1) Landfill tax savings 120,000
Trading partner teams 87,000 (2) Company estimates 669,000
For WRAP the return on investment calculated as the costs of the programme set against the savings in landfill
tax is approximately two fold. For the companies the return on investment calculated as the costs of their input
set against their own estimates of the benefits is in excess of seven fold (or 1.4 fold if only the savings in landfill
tax are included).
This analysis demonstrates that both retailers and manufactures can obtain commercial benefits by working
together to reduce waste. These benefits can be significant over time demonstrating a strong business case for
waste prevention.

Reducing Food Waste through Retail Supply Chain Collaboration 19
4.0 Conclusions and Recommendations
Considerable effort is being made to reduce waste by individual retailers and food manufactures. This project has
demonstrated that trading partners who work together can reduce the waste that arises at the interface of their
trading relations. As such, it is the first project of its kind that has tackled waste reduction through collaborative
action along the supply chain.
This waste focused performance improvement programme represents a milestone in the delivery of targets under
the Courtauld Commitment and more widely because:
it demonstrates that retailers and suppliers can collaborate to identify and reduce supply chain waste and that
this can be initiated and accelerated with third party facilitation;
waste prevention – the pinnacle of the waste hierarchy – can be delivered thus reducing the amount of
material that has to be either redistributed, recovered or disposed of; and,
participants secured a positive rate of return for their investment of time and resources thereby
demonstrating and securing a commercial benefit from preventing waste.
The case studies document the many changes that have been introduced as a result of this project to improve
collaborative working. In this programme joint working has taken several different forms (documented
throughout this report), but the teams wished to highlight the importance of involving the retailers’ technical
teams with the supply base and the beneficial role of staff exchanges (‘implants’) on performance.
Overall the project will have led to a reduction in waste amounting to around 2,500 tonnes. Given the pilot nature
of the project and the small number of products that were involved the results, if they can be scaled, suggest
that Courtauld signatories should be able to achieve their commitment to a 5% reduction in supply chain waste.
All the changes made by the participants were done without incurring capital costs and the new ways of working
have broad applicability. The main new ways of working that could have wider application to food retailers and
suppliers not involved in this programme included:
improved communications between retailers and suppliers over production planning and order timings;
closer cross-functional team-working within each organisation as well as between them;
joint forecasting both between and within companies using all the expertise available;
range management including removal of slow moving lines (SKU’s);
fixing order quantities based on a significant proportion of current volumes;
reduced packaging and better designs for shelves; and,
changes to the ‘mark down’ windows for products reduced to clear.
4.1 Recommendations
There is a great deal of work being undertaken by WRAP under the second phase of the Courtauld Commitment
and by IGD as part of the ECR (UK) programme to help companies identify and reduce their waste. The following
practices were identified by the participants as being particularly beneficial and they form the recommendations
from this project to the wider industry.
retailers and suppliers should measure waste using tonnes as the common metric;
retailers and suppliers should develop ‘joint business plans’ to drive their supply chain operations with open
and honest sharing of information;
retailers and suppliers should develop an ‘end-to-end’ understanding of each others businesses using tried
and tested approaches such as value stream mapping; and
retailers and suppliers should focus on waste prevention with suppliers through the use of in-store availability
measures in preference to service levels, which usually specifies delivery schedules and quantities.

Reducing Food Waste through Retail Supply Chain Collaboration 20
This work programme and report has emphasised the value of collaborative working between trading partners
through an externally facilitated performance improvement programme as an effective vehicle for waste
prevention. Other sectors of the grocery industry, for example the independent or convenience sector, could
benefit from a similar approach.
Given the benefits that have been identified in this report, WRAP is undertaking similar collaborative programmes
across the home improvement, grocery and food service sectors and encourage industry and business to engage
in the same.

Reducing Food Waste through Retail Supply Chain Collaboration 21
Appendix 1: People
Table 5: People involved; their roles and their attendance at the four main meetings.
Te
am
Role in Prog
Company Individual Job
27
-Ap
r
24
-Ju
n
14
-Se
p
23
-No
v
Cakes
Sponsor
Musgrave
Scott Wharton Supply Chain Director
Participant
Andy Robertson Head Of Network Planning
Allaudin Elias Supply Chain Manager
United Biscuits
Grace McIntyre Supply Chain Development Manager
Chris Vevers National Account Manager
Flo
ral
Sponsor
Sainsbury's
Warren Davis Senior Supply Chain Manager - Fresh Food
Participant
Andy Atherton Senior Supply Chain Manager - Grocery
Donald Matheson Category Supply Manager
Robert Honeysett Technical Manager
World Flowers
Dawn Hampton Sales Support Manager
Bill Brinson Business Unit Manager
Ready M
eals
Sponsor
Morrisons
Malcolm Basey Supply Chain Director
Participant
Stuart McCarthy Fresh Supply Chain Controller
Darren King Senior Sales Team Leader
Kerry-Noon
Colin Dubber Head of Operations
Charlie Heather Account Manager
Citru
s
Participant
Tesco Stores Ltd
Matt Walsh Fresh Commercial Operations Manager
Adam Morris
Dan Britten Technical Manager - Citrus
Andrew Lewis Buyer - Citrus
MM (UK) Matthew Warren
Naomi Pendleton Head of Technical
Sala
ds
Sponsor
Tesco Stores Ltd
Nick Tatum Produce Operations Director
Participant
Jenny Lee-Barber Buying Manager - Salad
Rosie Willis Technical Manager - Salad
Orrett Kennedy Distribution
Natures
Way Foods
Matthew Rowbury Supply Chain Director
Ian Summerfield Chief Commercial Officer
Ben Horlock National Account Manager - Tesco
G's Daniel Cross Account Manager
Sandw
iches
Sponsor
Marks & Spencer
Syd Reid Merchandising Executive
Participant
Andrew Knott Business Architect
Sean Parslow Category Supply Chain Manager
Gerri Scott Foods Buyer
Steve Simpson Business Analyst
Deena Barritt Project Manager Retail Food 2020
Mitul Lakhani Business Analyst - Strategy & Architecture
Uniq Prep-ared Foods
Richard Moorby Account Manager
Darren Atkinson Supply Chain Manager
Oth
ers
Facilitator IGD
James Tupper ECR Learning & Change Manager
Expert Peter Whitehead Agri-business Programme Leader
Sponsor WRAP
Mark Barthel Special Advisor
Sponsor Sarah Macnaughton Retail Supply Chain Programme Manager

Reducing Food Waste through Retail Supply Chain Collaboration 22
Appendix 2: Case Studies
SNACKS AND CAKES PROMOTIONS MANAGEMENT
United Biscuits (UB) and Musgrave worked on this project to align their forecasts and production
planning more closely to tackle the high levels of waste (56% of all waste), which was arising from
promotional lines. Forecast accuracy improved and promotional waste as a % of sales fell by over
13% points.
Measure and Understand
The Musgrave and United Biscuits team identified significant opportunities through: mind-mapping, scoping and
prioritisation; end-to-end supply chain ‘walk-through’; KPI information gathering; and ‘Lean’ methodology and
process mapping. This process is summarised in Figure 1.
Figure 1: Musgrave – United Biscuits use of LEAN methodology and process mapping.
Improving promotions management was one of three key opportunities identified. Promotional lines represented
over half (56%) of wastage (£). Cakes and Crisps/Snacks/Nuts were the key priority areas.
Redesign & Pilot
The following new ways of working were developed collaboratively:
Strategy Improved joint business planning.
Budget forecasting and assumptions more visible.
Better alignment of timelines.
Planning Working to one aligned process and timeline.
Better understanding of accountabilities and dependencies along the supply chain.
More collaborative forecasting within/between companies.
Earlier forecasting in line with production planning.
Improved planning and communication (e.g. a weekly meeting).
Execution More focus on initial stock phasing into depot.
Improved communication of ‘actual’ versus ‘planned’ performance.
Collaborative monitoring and adjustment of orders.
Focus on end of promotion execution and exit strategy.
Review Category team post promotion review (process and KPIs).
Learnings built into next promotional cycle.

Reducing Food Waste through Retail Supply Chain Collaboration 23
Key Findings and Benefits
Store forecasts shared earlier to ensure they are built into production planning.
Time used for planning rather than wasted on ‘fire-fighting’.
Fewer last minute UB volume amendments.
Short Notice Amended Forecast (SNAF) reduction from average of approximately 10 lines pre-pilot to one line
in current promotional cycle.
Musgrave forecast accuracy has been sustained (76% actual versus forecast).
Promotional wastage as a % of sales is down from 19.5% to 6.3%.
Roll-out & Sustain
Since the 13th September consumer start date, the new integrated UB/Musgrave promotional process and ways of
working have been ‘business as usual’ with post promotional reviews in place.
Figure 2: Feedback on UB/Musgrave ‘business as usual’ promotional process and ways of working
Changes
As a result of the WRAP funded IGD programme Musgrave and United Biscuits have seen significant benefit.
Table 1: Musgrave and United Biscuits Promotions Management – what’s changed?
Before Programme As a Result of Programme
Bu
sin
ess
Re
su
lts 2.93% Product Wastage (% of sales) 1.16% Product Wastage (% of sales)
19.50% Promotional Line Wastage 6.30% Promotional Line Wastage
75% Promotional Forecast Accuracy 76% Promotional Forecast Accuracy
Jo
b B
eh
avio
ur
Insufficient collaborative planning leading to
reactive fire-fighting and non-value added
activities.
Lack of two-way communications and insufficient /
inaccurate information lows (e.g. forecasting) both
o across functions within Musgrave and UB; and
o between companies inc. function to function.
Lack of understanding and alignment of key
business processes (e.g. promotions, seasonal
management).
Unclear people structures and roles /
responsibilities, with ‘silo’ mentality between
businesses and across functions.
Lack of visibility and alignment of Commercial and
Supply Chain strategies and some conflicting
KPI’s.
Promotions process aligned between
Musgrave / UB and within companies across
functions:
o Musgrave / UB integrated process and
timeline;
o roles and responsibilities understood
o communications line clear;
o collaborative planning and review to
build continuous improvement and
reduce non-value adding activities;
o improved alignment of strategic and
commercial planning; and
o end-to-end approach and measurement
Built learnings of collaborative promotions to
other key business process (e.g. seasonal
management).
Musgrave and United Biscuits believe these principles and a streamlined approach could be applied to other
trading partners for mutual benefit.

Reducing Food Waste through Retail Supply Chain Collaboration 24
BISCUITS AND SNACKS RANGE MANAGEMENT
United Biscuits and Musgrave examined their range and found that 60% of products sell less than
10 cases a week and account for over 80% of waste (at value). By looking at minimum order
quantities and removing lines where this is the best commercial decision there is an opportunity to
reduce waste without compromising margin.
Measure and Understand
The Musgrave and United Biscuits team identified significant opportunities through: mind-mapping, scoping and
prioritisation; end-to-end supply chain ‘walk-through’; KPI information gathering; and Lean methodology and
process mapping. Figure 1 shows performance data collected by the team.
Figure 1: Musgrave – United Biscuits gathered KPI information
Improving range management was one of three key opportunities identified. Non-promotional lines represented
just under half (44%) of wastage (£).
The Musgrave and United Biscuits team analysed the wastage of low volume lines. They found that ~60% of the
range is slow selling (<10 cases/week). The slow sellers represented:
~ 25% of sales £;
~ 13% of volume;
over 80% of wastage at value; and
~ 7% as a proportion of sales.
Low volume lines are driving waste mainly in Cakes and Crisps/Snacks/Nuts. There are some lines were the
minimum order quantity (MOQ) drives more stock than stores will sell in the product’s life!
Reducing Food Waste through Retail Supply Chain Collaboration 25
Redesign & Pilot
As a result of the analysis category teams now focus on the end-to-end value chain:
Consumer offer
Rate of sales and margin
Wastage and stock levels
MOQ versus volume.
Improved reporting and dialogue is creating visibility to net profitability. This is driving better decision making for
the existing range and new lines:
opportunity to drive sales, review store distribution’; and
removing range where this is the best commercial decision (five lines to date).
Silo ‘ways of working’ and KPI’s are being broken down. Decisions are increasingly based on all factors, including
wastage. Five lines have been de-listed and this will reduce wastage by 0.7 tonnes per annum.
Roll-out & Sustain
Commercial team changes at UB and Musgrave have delayed the process. The new team are engaged and
recognise the further opportunities to develop in this area.

Reducing Food Waste through Retail Supply Chain Collaboration 26
FLOWING CAKES THROUGH THE SUPPLY CHAIN – STOCKLESS
United Biscuits and Musgrave identified the benefits of moving to a stockless system to reduce cake
wastage (the biggest single driver of waste by value).
Measure and Understand
The Musgrave and United Biscuits team identified significant opportunities through: mind-mapping, scoping and
prioritisation; end-to-end supply chain ‘walk-through’; KPI information gathering; and Lean methodology and
process mapping.
Figure 1: Musgrave – United Biscuits did an end-to-end supply chain ‘walk-through’.
Improving cake flow through was one of three key opportunities identified. Cakes are the biggest single wastage
driver (39% at value £). The opportunity was to move cake from stock-held to stock-less and prevent
approximately 14 tonnes of waste per annum.
Redesign & Pilot
Cake is currently delivered into four depots twice a week and stock-held for store picking. The initiative with UB
and other cake suppliers to Musgrave is to move cake to ‘flow through’:
moving from stock held to stock-less (same day stock into and out of depot);
completely removing depot based ‘short-dated’ wastage;
giving retailers and consumers significantly improved product life;
providing the ability to drive promotional sales, improve availability and remove waste; and
removing depot restriction on size of range and NPD.
The key constraint is that this initiative also drives additional transport costs, so the move to flow through needs
to be part of the overall commercial and environmental plan.
Roll-out & Sustain
UB and Musgrave are working through the operational and commercial requirements to commence in early 2011.
Reducing Food Waste through Retail Supply Chain Collaboration 27
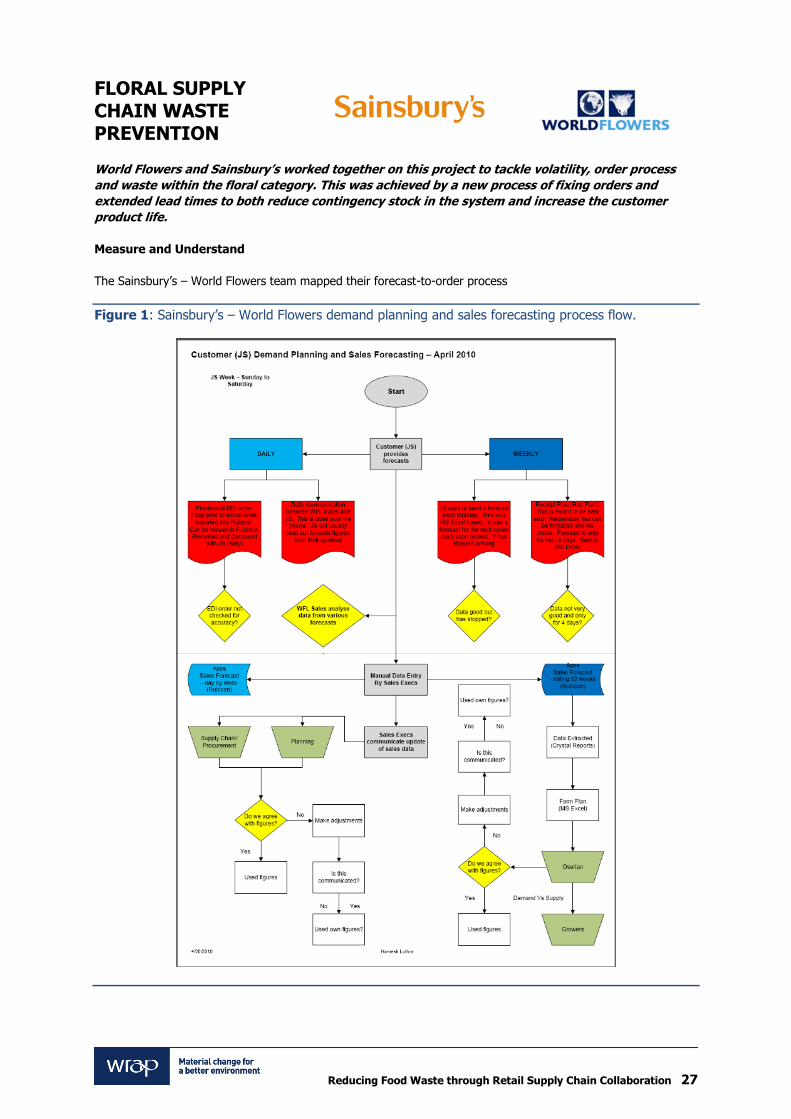
FLORAL SUPPLY CHAIN WASTE PREVENTION
World Flowers and Sainsbury’s worked together on this project to tackle volatility, order process
and waste within the floral category. This was achieved by a new process of fixing orders and
extended lead times to both reduce contingency stock in the system and increase the customer
product life.
Measure and Understand
The Sainsbury’s – World Flowers team mapped their forecast-to-order process
Figure 1: Sainsbury’s – World Flowers demand planning and sales forecasting process flow.

Reducing Food Waste through Retail Supply Chain Collaboration 28
The Sainsbury’s – World Flowers team identified the effects of order changes to forecast.
Table 1: Sainsbury’s – World Flowers effects of order changes to forecast.
Above forecast Below forecast
Order more product to maintain stock levels in UK.
Less product harvested to avoid over stock and
holding time of product.
Airfreight is more expensive as we ship smaller
amounts.
Colour Mixes more difficult to achieve as some
farms not able to react quickly.
Product not at correct cut stage therefore requires
conditioning, which is an extra handling cost.
Too much stock in the system which is moving
towards the end of its holding life.
This older stock [though in spec] has potential to
affect quality.
If we cannot use the stock in time it is thrown away
in the UK having had all the associated costs
applied.
Supply chain again becomes inefficient as we
cancel or delay orders.
Redesign & Pilot
To reduce waste and enable longer runs and better efficiency on production lines, two products were chosen to
put onto fixed orders and onto flexi date code for a trial:
Sweetheart Roses; and
Rose and Carnation Posy.
The change involved forecasting the volume for each line for each day in the week and then fixing orders initially
at 80% of volume. Any daily requirements below the fixed level are increased to the fixed order level. Any daily
requirements above the fixed level are honoured by World Flowers. Sunday is kept as a potential no-delivery day
to allow re-balancing of in store stock levels.
Figure 2: Sainsbury’s – World Flowers Sweetheart volume and availability
Reducing Food Waste through Retail Supply Chain Collaboration 29
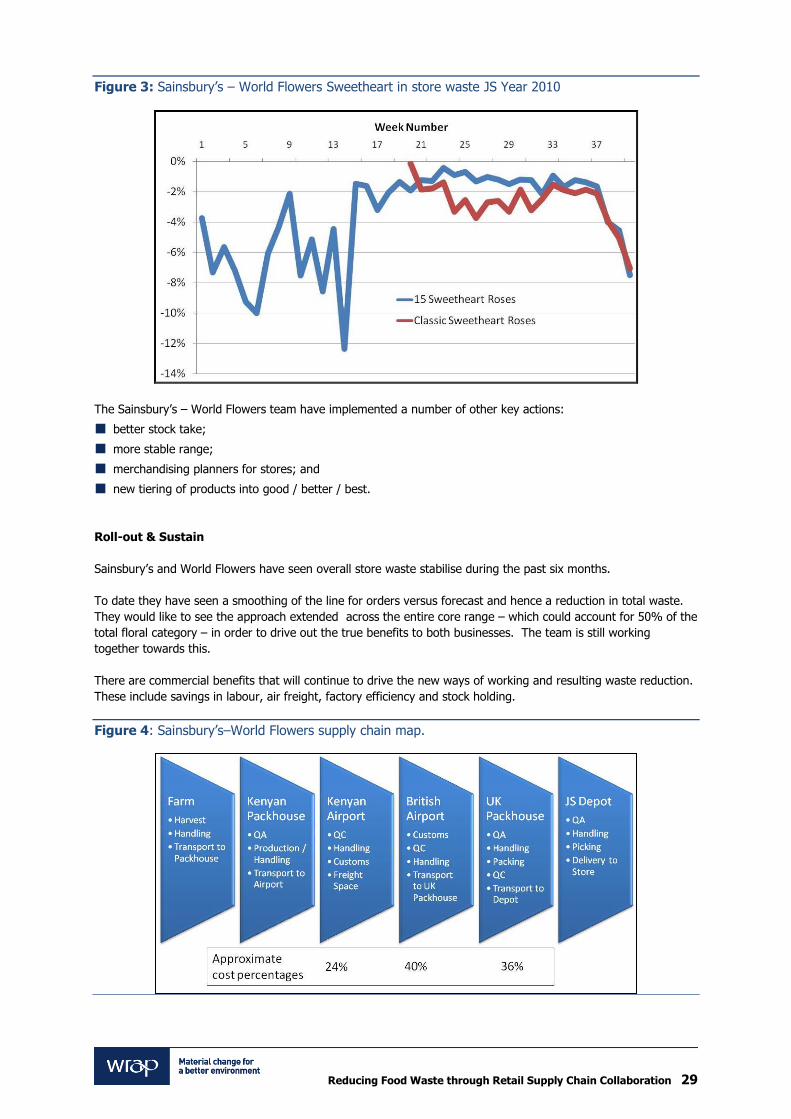
Figure 3: Sainsbury’s – World Flowers Sweetheart in store waste JS Year 2010
The Sainsbury’s – World Flowers team have implemented a number of other key actions:
better stock take;
more stable range;
merchandising planners for stores; and
new tiering of products into good / better / best.
Roll-out & Sustain
Sainsbury’s and World Flowers have seen overall store waste stabilise during the past six months.
To date they have seen a smoothing of the line for orders versus forecast and hence a reduction in total waste.
They would like to see the approach extended across the entire core range – which could account for 50% of the
total floral category – in order to drive out the true benefits to both businesses. The team is still working
together towards this.
There are commercial benefits that will continue to drive the new ways of working and resulting waste reduction.
These include savings in labour, air freight, factory efficiency and stock holding.
Figure 4: Sainsbury’s–World Flowers supply chain map.

Reducing Food Waste through Retail Supply Chain Collaboration 30
The impact of fixed orders includes:
stabilising orders and their phasing;
improved product supply chain from grower to fixture; and
reduction of waste in store, at factory and with grower.
The reduction of contingency stock in the supply chain resulted in:
improved vase life of product and fresher product on shelves;
fuller more abundant fixture enhancing consumer choice; and
best until date improvement giving consumers confidence and encouragement for repeat purchase.
Changes
As a result of the WRAP funded IGD programme Sainsbury’s and World Flowers have seen significant benefit.
Table 2: Sainsbury’s–World Flowers fixing orders – what’s changed?
Before Programme As a Result of Programme
Bu
sin
ess R
esu
lts Fixing 7% of core lines Fixing 15% of core lines
In Store waste erratic Store waste has stabilised
Order fluctuations huge - line efficiencies effected:
too much product ordered little and often and
not efficient; and
too little product and large amount of waste in
UK.
Orders fluctuation still prevalent
Jo
b
Be
ha
vio
ur
Poor communication and lack of confidence in
numbers.
Shared forecasting to build knowledge and trust
Joint Training and evaluation day in January with
JS and WF teams.
Sainsbury’s and World Flowers believe these significant waste reductions could easily be rolled out to other
categories.
Reducing Food Waste through Retail Supply Chain Collaboration 31
READY MEAL SUPPLY CHAIN WASTE PREVENTION
Kerry Noon and Morrisons worked on this project to improve relations and with some simple
changes in working practices, reduced waste product at the point of manufacture by 33%,
increased forecast accuracy by 6% and reduced packaging on some products by 20%. Making
things simple for the customer, retailer and supplier was critical.
Measure and Understand
The Morrisons – Kerry Noon team walked through processes and systems; on site and face to face:
Sales planning Production
planning
Ordering Factory product Store
This gave the team a better understanding of methods and timings, constraints and deadlines and waste issues.
Redesign & Pilot
To prevent supply chain waste, changes were made to ways of estimating orders, timings of orders were aligned
with production schedules, communications were improved and packaging was changed to improve recognition.
Order Estimates were accurate but ‘rounding rules’ on certain lines distorted figures. Rounding rules for
estimates have now been changed to match the order process. Forecasts are now 93% accurate; against an
industry standard of 87% for ready meals.
Order estimates were sent once per week so any volatility throughout the week could cause issues. Estimates
are now sent twice weekly.
Noon had to produce Monday’s requirements on Saturday morning, before the purchase order was received
from Morrisons. This created issues with over production generating waste or short coded stock. Purchase
orders are now sent to Noon for Saturday morning. Noon reviewed its ‘date code received’ matrix and
process for products delivered to Morrisons. They have been able to extended shelf life on one complete
meal and three ‘market street’ products.
Communication tended to be on a needs-must basis, usually to do with problem resolution. Now a daily email
is circulated at 10am and quarterly meetings are scheduled. Daily telephone conversations now take place to
discuss issues and any over production, as required. Noon has been invited to access Morrisons’ Supplier
Database which provides sales, stock holding, forecast and other information which all help with planning.
Noon also reduced case sizes at no on-cost to improve flow to shelf; increasing availability without increasing
waste.
All labels and outer cases looked similar and caused waste because they were difficult for store staff to
replenish and for the shopper to shop. For example, it was difficult to see the difference between one, two or
four meal bags and bags were left on the shelf because they confused some customers.
Supplier, depot and store team members investigated improvement opportunities. To reduce waste the case
label was improved by using colour, a clearer font and by using only store-relevant abbreviations in the
product description: see examples of old and new in figure 1.

Reducing Food Waste through Retail Supply Chain Collaboration 32
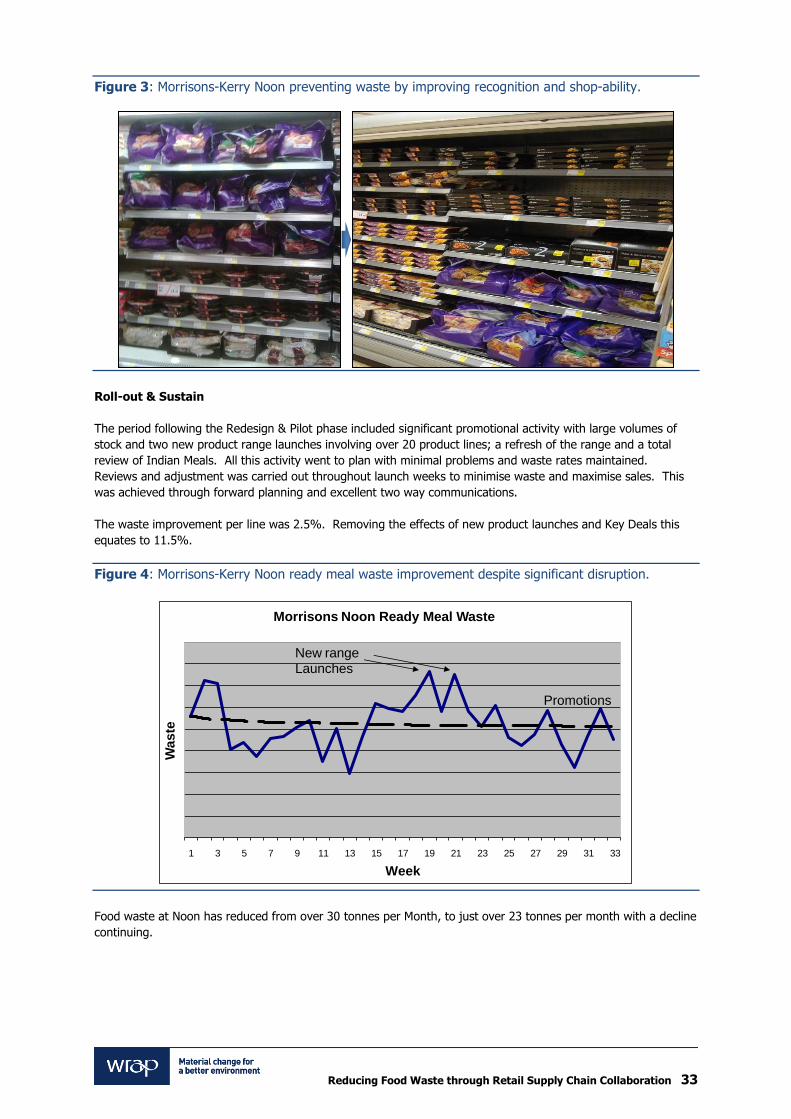
Figure 1: Morrisons-Kerry Noon preventing waste by improving recognition and replenishment.
It was decided further to decrease waste by redesigning the ready meal bags so they were
reduced in size by 20% saving material;
easier to put on shelf and fit more on the shelf;
clearer for customers to understand what they are buying;
easier for the consumer to shop; and
clearly stamped on the label ‘Meal-for-One’.
Figure 2: Morrisons-Kerry Noon preventing waste by redesigning the ready meal bags.
To reduce waste further it was also decided to:
keep meals for one in purple;
move meals for two to clear bags to show off size better;
move meals for four to a box to clearly display value for money;
implement colours for different meals to make easier to shop; and
rearrange ready meals levels and adjust shelf heights.
Reducing Food Waste through Retail Supply Chain Collaboration 33
Figure 3: Morrisons-Kerry Noon preventing waste by improving recognition and shop-ability.
Roll-out & Sustain
The period following the Redesign & Pilot phase included significant promotional activity with large volumes of
stock and two new product range launches involving over 20 product lines; a refresh of the range and a total
review of Indian Meals. All this activity went to plan with minimal problems and waste rates maintained.
Reviews and adjustment was carried out throughout launch weeks to minimise waste and maximise sales. This
was achieved through forward planning and excellent two way communications.
The waste improvement per line was 2.5%. Removing the effects of new product launches and Key Deals this
equates to 11.5%.
Figure 4: Morrisons-Kerry Noon ready meal waste improvement despite significant disruption.
1 3 5 7 9 11 13 15 17 19 21 23 25 27 29 31 33
Wa
ste
Week
Morrisons Noon Ready Meal Waste
New range Launches
Promotions
Food waste at Noon has reduced from over 30 tonnes per Month, to just over 23 tonnes per month with a decline
continuing.
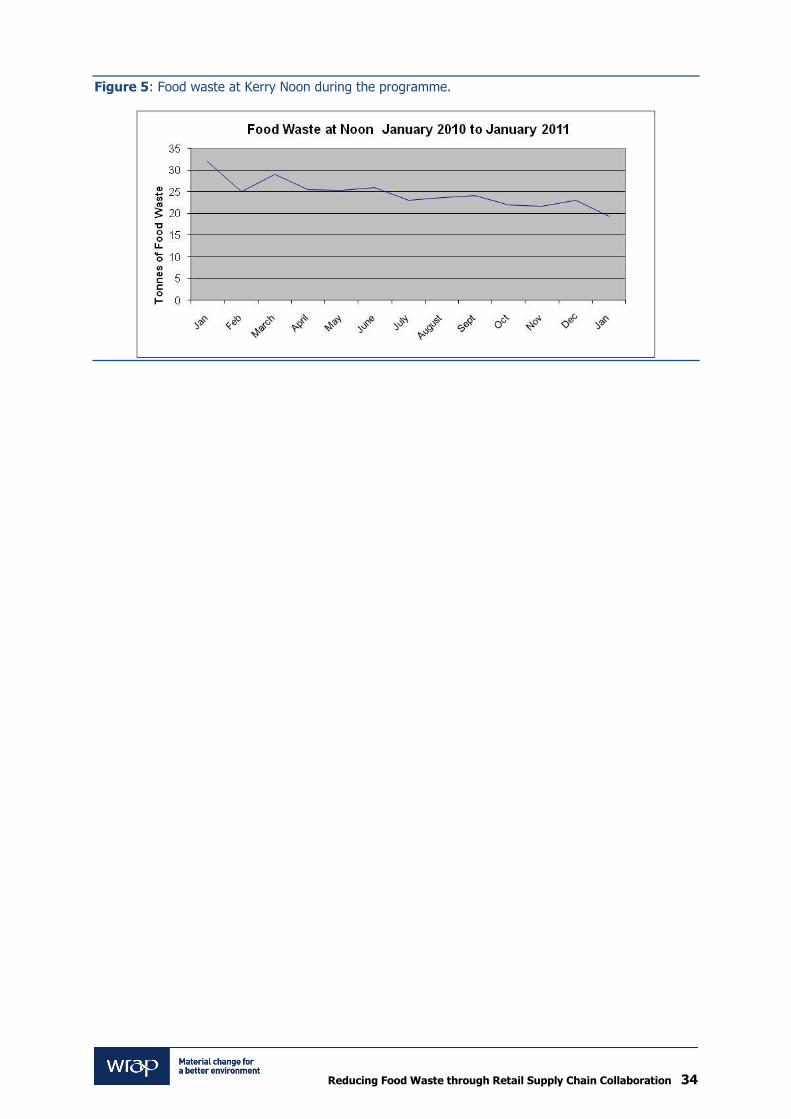
Reducing Food Waste through Retail Supply Chain Collaboration 34
Figure 5: Food waste at Kerry Noon during the programme.
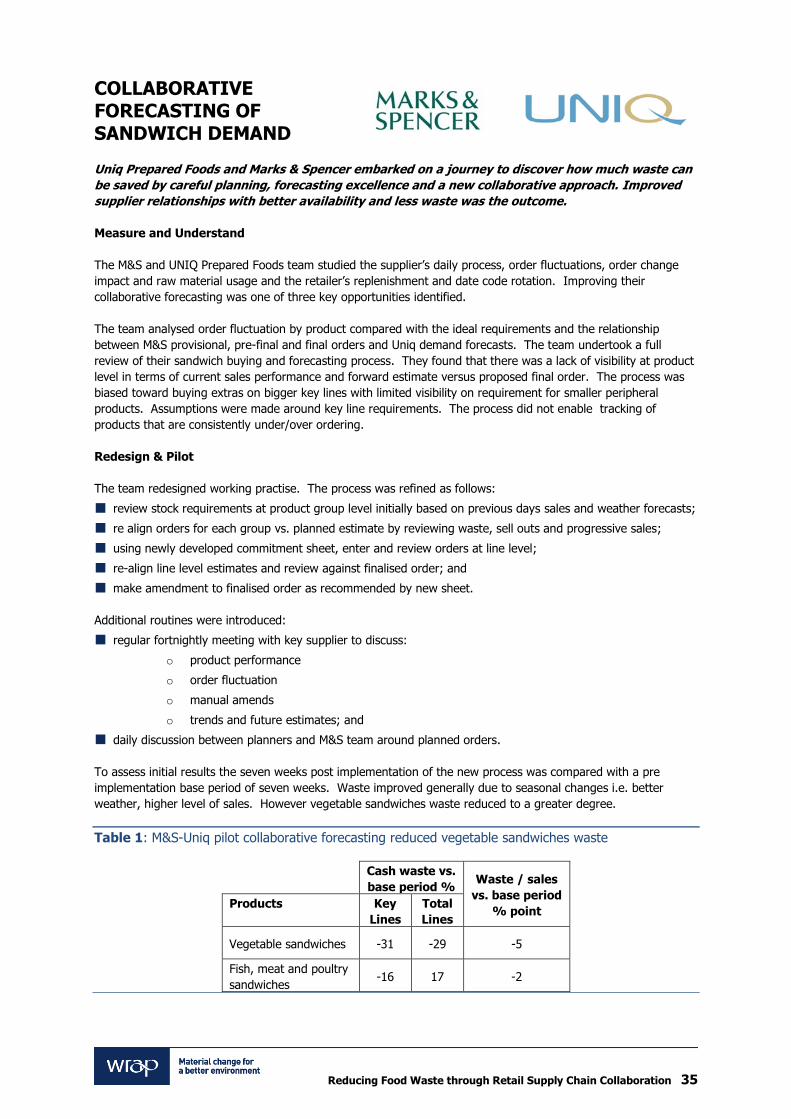
Reducing Food Waste through Retail Supply Chain Collaboration 35
COLLABORATIVE FORECASTING OF SANDWICH DEMAND
Uniq Prepared Foods and Marks & Spencer embarked on a journey to discover how much waste can
be saved by careful planning, forecasting excellence and a new collaborative approach. Improved
supplier relationships with better availability and less waste was the outcome.
Measure and Understand
The M&S and UNIQ Prepared Foods team studied the supplier’s daily process, order fluctuations, order change
impact and raw material usage and the retailer’s replenishment and date code rotation. Improving their
collaborative forecasting was one of three key opportunities identified.
The team analysed order fluctuation by product compared with the ideal requirements and the relationship
between M&S provisional, pre-final and final orders and Uniq demand forecasts. The team undertook a full
review of their sandwich buying and forecasting process. They found that there was a lack of visibility at product
level in terms of current sales performance and forward estimate versus proposed final order. The process was
biased toward buying extras on bigger key lines with limited visibility on requirement for smaller peripheral
products. Assumptions were made around key line requirements. The process did not enable tracking of
products that are consistently under/over ordering.
Redesign & Pilot
The team redesigned working practise. The process was refined as follows:
review stock requirements at product group level initially based on previous days sales and weather forecasts;
re align orders for each group vs. planned estimate by reviewing waste, sell outs and progressive sales;
using newly developed commitment sheet, enter and review orders at line level;
re-align line level estimates and review against finalised order; and
make amendment to finalised order as recommended by new sheet.
Additional routines were introduced:
regular fortnightly meeting with key supplier to discuss:
o product performance
o order fluctuation
o manual amends
o trends and future estimates; and
daily discussion between planners and M&S team around planned orders.
To assess initial results the seven weeks post implementation of the new process was compared with a pre
implementation base period of seven weeks. Waste improved generally due to seasonal changes i.e. better
weather, higher level of sales. However vegetable sandwiches waste reduced to a greater degree.
Table 1: M&S-Uniq pilot collaborative forecasting reduced vegetable sandwiches waste
Cash waste vs.
base period % Waste / sales
vs. base period
% point Products Key
Lines
Total
Lines
Vegetable sandwiches -31 -29 -5
Fish, meat and poultry
sandwiches -16 17 -2
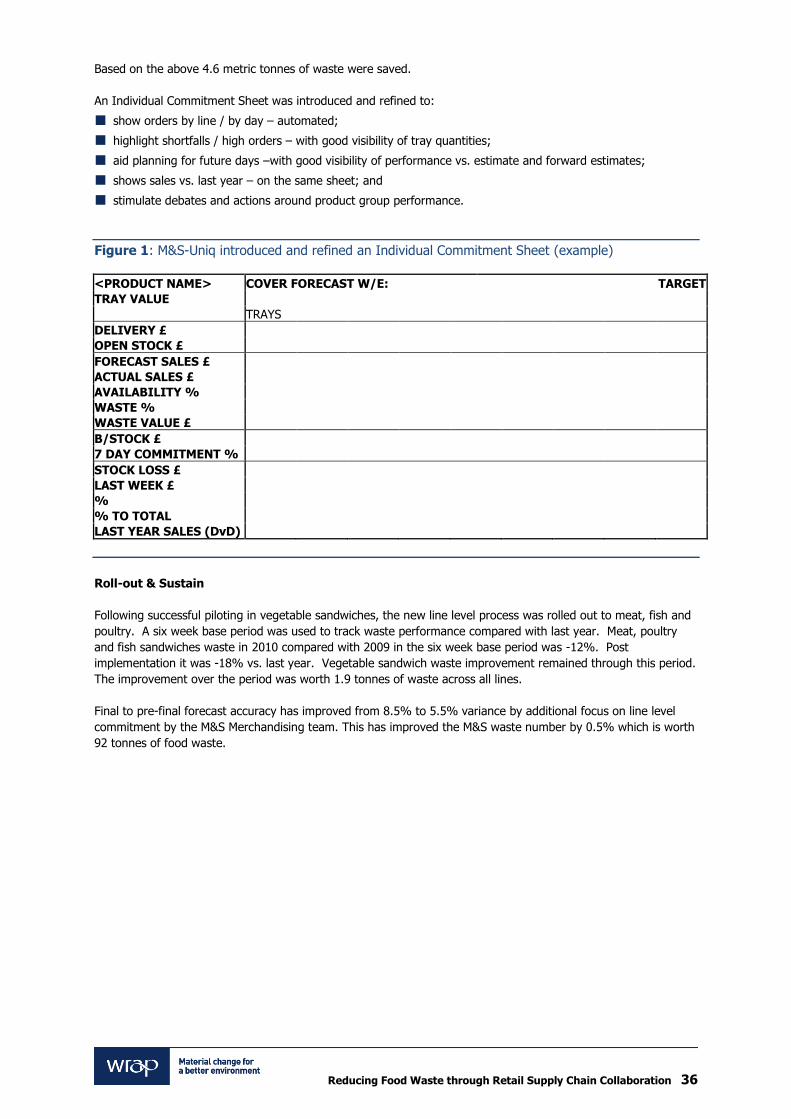
Reducing Food Waste through Retail Supply Chain Collaboration 36
Based on the above 4.6 metric tonnes of waste were saved.
An Individual Commitment Sheet was introduced and refined to:
show orders by line / by day – automated;
highlight shortfalls / high orders – with good visibility of tray quantities;
aid planning for future days –with good visibility of performance vs. estimate and forward estimates;
shows sales vs. last year – on the same sheet; and
stimulate debates and actions around product group performance.
Figure 1: M&S-Uniq introduced and refined an Individual Commitment Sheet (example)
<PRODUCT NAME> COVER FORECAST W/E: TARGET
TRAY VALUE
TRAYS
DELIVERY £ OPEN STOCK £ FORECAST SALES £ ACTUAL SALES £ AVAILABILITY % WASTE % WASTE VALUE £ B/STOCK £
7 DAY COMMITMENT %
STOCK LOSS £ LAST WEEK £ % % TO TOTAL LAST YEAR SALES (DvD)
Roll-out & Sustain
Following successful piloting in vegetable sandwiches, the new line level process was rolled out to meat, fish and
poultry. A six week base period was used to track waste performance compared with last year. Meat, poultry
and fish sandwiches waste in 2010 compared with 2009 in the six week base period was -12%. Post
implementation it was -18% vs. last year. Vegetable sandwich waste improvement remained through this period.
The improvement over the period was worth 1.9 tonnes of waste across all lines.
Final to pre-final forecast accuracy has improved from 8.5% to 5.5% variance by additional focus on line level
commitment by the M&S Merchandising team. This has improved the M&S waste number by 0.5% which is worth
92 tonnes of food waste.

Reducing Food Waste through Retail Supply Chain Collaboration 37
Figure 2: M&S-Uniq final to pre-final forecast accuracy has improved
M&S and Uniq’s forecasts are more aligned delivering a forecast accuracy improvement from 68% to 82%. This
reduces the need to revisit production and is saving around four tonnes of food waste annually.
Figure 3: M&S-Uniq forecast Mean Absolute Percent Error (MAPE)

Reducing Food Waste through Retail Supply Chain Collaboration 38
Changes
As a result of the WRAP funded IGD programme M&S and UNIQ Prepared Foods have seen significant benefit.
Table 2: M&S-Uniq collaborative forecasting – what’s changed?
Before Programme As a Result of Programme
Bu
sin
ess R
esu
lts
Higher waste on high selling key products.
A focus on the availability of ‘core’ best selling lines
at the expense of smaller lines.
Gaps in the understanding about how some
individual products trade and create orders.
Stores get too much of the ‘core’ bestselling lines
creating waste.
Stores do not get enough of the smaller lines leaving
potential gaps.
Reduced waste levels on best-selling lines in stores.
Reduced waste at suppliers.
Greater availability across the entire range.
Improved awareness of supplier constraints and
lead times.
Better planning at suppliers.
Greater understanding of how individual products
trade.
Jo
b B
eh
avio
ur Forward estimates planned at product level.
Use ‘core’ best selling lines to build up to required
stock levels.
Acceptance of higher waste on best selling lines to
increase availability.
Better forecasts through greater collaboration i.e.
daily forecast checks over the phone, knowledge
exchange on volatile ingredients.
Improved planning of future weeks across all lines.
Developed an effective tool to manage orders and
to more accurately plan orders across all lines
including smaller peripheral products.
Build a forecasting template that we can share info
around performance and agree actions to
counteract any problems.
Improved collaboration with regular structured
meeting between key suppliers and M&S team.
Waste managed holistically across all lines.
M&S and UNIQ Prepared Foods believe these significant waste reductions could easily be rolled out to other
categories / customers.

Reducing Food Waste through Retail Supply Chain Collaboration 39
CUTTING UNPROFITABLE SANDWICH LINES TO REDUCE WASTE
Uniq Prepared Food and Marks & Spencer wished to create a decision making tool for analysing
poor performing lines that will reduce waste and cut through endless debate on how to handle
these products. The new tool can help all businesses arrive at the correct decision fast.
Measure and Understand
The M&S and UNIQ Prepared Foods team studied the supplier’s daily process, order fluctuations, order change
impact and raw material usage and the retailer’s replenishment and date code rotation. Improving de-listing
decisions about wasteful low volume lines was one of three key opportunities that they identified.
The team identified that weak underlying demand is the driver of supplier waste and dumped stock for some
products. They agreed that a true cost analysis needed to be carried out from both a supplier and customer
point of view. How much do these products really add to the bottom line for both companies? Should they
eliminate certain lines?
Redesign & Pilot
The team devised a method of assessing the true profitability of lines within a category and defined a process for
either improving true profitability or eliminating worst performers from the category. So that the impact on waste
could be assessed, waste tonnage was measured for a defined basket of low volume lines.
Figure 1: M&S-Uniq line review process redesigned to address wasteful low volume lines.
An analysis tool was devised and applied to a selected basket of Food on the Move (FOTM) lines for a 12 week
period.

Reducing Food Waste through Retail Supply Chain Collaboration 40
Figure 2: M&S-Uniq analysis toll introduced to address wasteful low volume lines.
The baseline retail waste generated by the selected basket of FOTM lines alone was 0.9 tonnes per week.
Following the 12 week trial this dropped to 0.14 tonnes per week – an annualised saving of 39.5 tonnes.
Roll-out & Sustain
Analysis has been re-run for total FOTM catalogue. Impact of dumped stock, write-off, multi-buy costs and net
reductions has been taken into account. The entire category has been ranked ‘red/yellow/green’.
Figure 3: M&S-Uniq analysis for total ‘ood on the Move’ catalogue.
The total baseline waste has been measured across all lines equating to 28 tonnes per week. The next basket of
‘problem children’ has been selected and key actions identified against each.

Reducing Food Waste through Retail Supply Chain Collaboration 41
Figure 4: M&S-Uniq analysis of problem children and actions.
Success criteria for the above type of actions have been identified. Progress is being reviewed at bi-weekly
commercial and supply chain review.
Changes
M&S and UNIQ Prepared Foods have seen significant benefit through the completion of the WRAP funded IGD
programme.
Table 1: M&S-Uniq de-listing decisions about wasteful low volume lines – what’s changed?
Before Programme As a Result of Programme
Bu
sin
ess R
esu
lts
Variable waste across the catalogue. Full understanding of contribution lines made to the
catalogue.
Lines de-listed based on waste. De-list decisions made on total business case –
ultimately driving profitability of the catalogue.
Jo
b B
eh
avio
ur Decisions made on whether to keep lines in the
catalogue made on available data. Comprehensive total-cost based decision making.
Supplier giving a greater focus to maintaining and
growing the range.
Collaborative approach to range changes based on
what is best for the category.
M&S and UNIQ Prepared Foods believe these significant waste reductions could easily be rolled out to other
categories / customers.

Reducing Food Waste through Retail Supply Chain Collaboration 42
REDUCING TO CLEAR AND PREVENT SANDWICH WASTE
Marks & Spencer demonstrate in this case study the benefits of an additional price reduction point
earlier in the day and the introduction of additional price points into the policy thereby securing a
greater margin on waste sales to customers.
Measure and Understand
The M&S and UNIQ Prepared Foods team studied the supplier’s daily process, order fluctuations, order change
impact and raw material usage and the retailer’s replenishment and date code rotation. Improving reduce to
clear routines in store was one of three key opportunities identified.
Redesign & Pilot
The team focused on reducing the amount of product that goes unsold and to waste. They decided to extend
the reduction window before the end of trade on all categories from four to eight hours. They undertook a four
week trial. They measured baseline waste tonnage for a defined basket of low volume lines to understand the
improvement achieved by the extended reduction window.
Baseline waste was 4.6 tonnes over a four week period. During the trial waste was 3.5 tonnes; giving a 24%
reduction in waste sent to landfill. In terms of product value (£), gross waste did not increase with the extended
window, 12% more was recovered and there was a reduction in write off stock as a percentage of sales.
Following the initial trial, two further subsequent trials were introduced:
1. Two reductions daily and early reduction start-
four additional price points introduced;
first done in the morning post opening at approximately 10am; and,
second done one hour before close of trade.
2. Three reductions daily and later reduction start-
four additional price points introduced;
first done in the afternoon post lunch trade at approximately 2pm;
second done four hours before close of trade; and,
third done one hour before close of trade.
The analyses of both trials are shown below.
Figure 1: M&S-Uniq reduce to clear trial results (with numbers removed to protect confidentiality).

Reducing Food Waste through Retail Supply Chain Collaboration 43
The team saw the amount of product waste (Net Waste / Sales %) reduced on average by 12% between the two
subsequent trials. The amount of product not sold at full price (Gross Waste / Sales %) increased by 12%
however 57% more of this was recovered through the additional price reduction. The amount of product that
went unsold decreased significantly and there was a 25% reduction in losses (Net Loss / Sales %) for the retailer.
Roll-out & Sustain
The team will present their findings to senior management at M&S for sign-off and roll-out across the estate.
Changes
As a result of the WRAP funded IGD programme M&S and UNIQ Prepared Foods have seen significant benefit.
Table 1: M&S-Uniq reduce to clear – what’s changed?
Before Programme As a Result of Programme
Bu
sin
ess
Re
su
lts
Greater amounts of short-life food going to waste. Reduced (by 25%) amounts of short-life food
going to waste.
Jo
b
Be
ha
vio
ur
Products that have end of day shelf life reduced
four hours before close of trade.
Products that have end of day shelf life reduced
eight hours before close of trade – pending review
of all trials.
M&S and UNIQ Prepared Foods believe these significant waste reductions could easily be rolled out to other
categories / customers.

Printed on xx% recycled
content paper
www.wrap.org.uk/retail_supply_chain