final report - rhodes university€¦ · web viewwaste management is a global issue, however, in...
TRANSCRIPT

Final Report
Informal dumping in Grahamstown: Distribution and socio-economic impacts
Group 8 Roxanne Starkey 12s4762 Kirstin Stephens 12s1308 Namso Nyamela 11n4490
Roger Van Tonder 11v0939 Angus Allen 12a1233 Timothy Merkel g14M0039

Table of Contents
List of Figures.........................................................................................................................................3
Abstract.................................................................................................................................................4
Acknowledgements...............................................................................................................................5
Introduction...........................................................................................................................................6
1.1. Objective and Key Questions.............................................................................................9
2. Study Area...................................................................................................................................10
3. Methods......................................................................................................................................11
3.1. Informal dump site density and size................................................................................11
3.2. Household surveys and key informant interviews...........................................................12
3.3. Data analysis....................................................................................................................12
4. Limitations...................................................................................................................................13
5. Results.........................................................................................................................................14
5.1. Grahamstown demographics in East and West...............................................................14
5.2 The extent of informal dumping and how it differs between different socio-economic sectors of Grahamstown..............................................................................................................15
5.2.1 Size and distribution of dump sites.....................................................................................15
5.3 Perceptions of informal dumping and how it differs between different socio-economic sectors of Grahamstown..............................................................................................................................17
5.3.1 Service delivery............................................................................................................20
5.4 The health risks associated with informal dumping in Grahamstown.............................21
5.4.1 Quality of life...............................................................................................................22
5.4.2 Health impact perceptions...........................................................................................22
5.5 The effects of informal dumping on land value on and around dump sites in Grahamstown..............................................................................................................................24
6 Discussion....................................................................................................................................26
6.1 The extent and perceptions of informal dumping and how it differs between different socio-economic sectors of Grahamstown....................................................................................26
6.2 The health risks associated with informal dumping in Grahamstown.............................29
63. The effects of informal dumping on land value on and around dump sites in Grahamstown30
7 Conclusion...................................................................................................................................30
8 References...................................................................................................................................32
9 Appendix......................................................................................................................................35
1

Information (for admin only)...............................................................................................................35
Section 1: Demographics.....................................................................................................................35
Section 2: Informal dumping awareness.............................................................................................36
2.8 Does having a dump site in your neighbourhood effect your quality of life in any way?..........37
Section 3: Service delivery...................................................................................................................37
Section 3: Health impact from informal dumping...............................................................................37
Section 4: Land value...........................................................................................................................38
List of Figures
Figure 1. Grahamstown Map (Google Maps, 2014).............................................................................10Figure 2. A Map of Post-Apartheid Grahamstown showing different areas according to race (Fox, 2012)...................................................................................................................................................11Figure 3. A comparison of size of dump sites between Grahamstown West and Grahamstown East (small: <5m, medium: 5 – 15m, large: 15 – 25m, very large: >25m)....................................................15Figure 4. Distribution and size of all informal dump sites located in Grahamstown……………………… 16
Figure 5. Percentage of respondents who answered yes to a number of questions pertaining to dump site awareness in their area.................................................................................................................17Figure 6. Number of dump sites respondents were aware of in their area, as a percentage of total respondents.........................................................................................................................................17Figure 7. Reasons why respondents use the dump sites in Grahamstown East and West..................18Figure 8. Reasons given by respondents as to why people make use of informal dump sites, as a percentage of total responses per category. *Other includes; job creation, municipality backlogged with work, dump site close to township, pickers leaving found waste................................................19Figure 9. Most common waste materials dumped according to respondents in Grahamstown West and East...............................................................................................................................................20Figure 10. Ways in which the dump sites may affect the respondent’s quality of life in Grahamstown East and West as a percentage of total responses per category. *Other includes; stress, pests, endangers children, environmental concerns and issues....................................................................22Figure 11. Respondents replies as to whether they have experienced any health related impacts from the dump site in their area (Grahamstown East and West), as well as general health risk knowledge...........................................................................................................................................23Figure 12.Health issues that respondents have experienced due to the presents of a dump site in their area (Grahamstown East and West)...........................................................................................24Figure 13. Responses from Grahamstown East and West concerning property value........................25Figure 14. Respondents reasons for why they think the presents of a dump site in their area affects their property values in Grahamstown East and West. *Other includes; health impacts, safety issues and dump site proximity......................................................................................................................26
Table 1. Social and economic structure of households in Grahamstown East and West.....................14
2

Abstract
Waste management is a global issue, however, in developing countries deficiencies in resources and
infrastructure, as well as low stakeholder involvement in the waste management process, often lead
to the issue of Informal dumping. In South Africa, waste management problems are often unequally
experienced across socioeconomic divisions, due to the unequal distribution of resources that
occurred during Apartheid. This study was conducted about the different perceptions and extent of
informal dumping in Grahamstown, a small town in South Africa composed of two distinctly different
socioeconomic districts. GIS and GPS technologies were used to construct a map of informal dump
sites in Grahamstown and to calculate the density of dump sites, and surveys were conducted with
80 households near these dump sites in both sections of town. It was found that Grahamstown East,
the poorer area of town, contained a higher density of dump sites than Grahamstown West. This
was most likely because of uneven service delivery and a lack of education about waste
management in Grahamstown East. Respondents in Grahamstown East experienced more health
related impacts and both areas felt that informal dump sites decreased their land value. Therefore,
the informal dumping problem was found to be more severe and thus have greater impacts in
Grahamstown East. Nevertheless, as this research was based upon perceptions, more research is
needed to determine the actual cause of the differences in extent of dumping between
Grahamstown East and West. This information, could be useful to Makana municipality in terms of
waste management and improving the issue of informal dumping in Grahamstown.
Keywords: informal dumping, Grahamstown, waste management, respondents, household
3

Acknowledgements
Our sincerest appreciation goes to all of our participants who willingly opened their homes and
shared their views in aid of our research. We also thank the estate agents, doctors and clinic
workers: Ms Gill Armitage (Meyer), Ms Debi Brody, Dr Francios Zietsman, Dr Dario Berenisco, and all
those that requested to remain anonymous. Thank you for sharing you expert knowledge and
wisdom towards the development of our research. Most of all, we would like to thank our
supervisor, Dr Georgina Cundill, for her guidance, assistance and support throughout the formation
and procedure of our research, as well as the Environmental Science Department and Rhodes
University for the opportunity to conduct this research.
4

Introduction
Population growth, urbanisation, economic growth and an increase in the standard of living are all
associated with greater generation of solid waste in urban areas, particularly by households, and
have led to the need for solid waste management (Guerrero, Maas & Hogland, 2013). Waste
management is an essential social service provided by municipalities to keep their regions clean
(Asnani, 2006). It involves the collection, transportation, treatment, disposal and trade of waste
(Zotos et al., 2009). Ineffective waste management strategies can result in the informal dumping of
household and other waste.
Developed countries generally have effective waste management programmes compared to
developing countries (Zotos et al., 2009). This is achieved through investing in waste management
infrastructure to provide safe, effective, efficient, economically and environmentally friendly
management (Finnveden et al., 2007; Zotos et al., 2009). Such infrastructure can include provision of
bins, separation of waste, street sweeping, and promotion of recycling, as well as the re-using and
converting of biodegradable waste into energy, composting, incineration, sanitary landfills and gas
landfill recovery (Asnani, 2006; Zotos et al., 2009). Other strategies include encouraging private
sector participation in waste management as a means of lowering costs, as well as authorities and
bodies that are dedicated to meeting waste management goals (Zotos et al., 2009).
Some developed countries make use of policies and regulations that have heavy penalties for illegal
dumping (Ichinose & Yamamoto, 2011). These policies can be effective in deterring activities that
would harm the public and natural resources (Muoghalu, Robinson & Glascock, 1990). However,
such efficiency does have its disadvantages, such as the issue of waste distancing (Clapp, 2002). This
occurs when people are not aware of the effects of the waste they produce and thus are unwilling to
change their behaviour (Rathje & Murphy, 2001). To overcome this, developed countries make use
of education methods that promote environmentally responsible choices (Clapp, 2002).
Developing countries, on the other hand, tend to have relatively weak waste management strategies
(Zotos et al., 2009; Guerrero et al., 2013). This is a result of many issues. The rapid urbanization of
developing countries has produced a considerable strain upon already insufficient or incomplete
waste management resources (Zotos et al., 2009; Guerrero et al., 2013). There are often limitations
in funding and resources, which consequently result in infrastructural limitations, such as insufficient
waste collection vehicles, poor roads, limited disposal facilities, and poor communication networks
(Guerrero et al., 2013). Limitations in monetary resources can also result in limited training and pay
5

for waste management workers, causing poor motivation and productivity. Additionally, developing
countries can suffer from inefficient monitoring strategies, lack of stakeholder education about the
sustainable ways of consumption, and a deficiency in stakeholder participation and social
responsibility for waste management (Godfrey, 2008; Zotos et al., 2009). These factors often result
in irregular and unreliable municipal waste collection programmes, and citizens may resort to
informal dumping to remove waste from their homes (Godfrey, 2008).
South Africa also has significant issues with providing effective waste management services, but
standards vary across the country and within smaller areas (Matete & Trois, 2008). Historically, the
apartheid government divided all urban areas according to race, and provided different resources
and standards of service delivery depending on the racial group (Maylam, 1990; McDonald, 2008).
White communities were typically well provided for in terms of infrastructure and service delivery,
while black communities were provided much less substantial services (McDonald, 2008; McDonald
& Pape, 2002). After the new democratic government came into place, it attempted to rectify these
inequalities (Maylam, 1990). In 1996 the South African Constitution placed waste removal, disposal,
and cleaning services under the jurisdiction and mandate of local municipalities, with the aim of
ensuring that all South Africans live in an environment that is not detrimental to their health or
wellbeing (Etengeneng, 2012). In 2000, the Municipal Systems Act (No. 32) required municipalities to
deliver services in a financially and environmentally sustainable way (Matete & Trois, 2008). The
White Paper for Integrated Pollution and Waste Management for South Africa (Notice 227 of 2000)
aimed policy at finding an integrated management system for pollution prevention and minimisation
of waste at point sources (Etengeneng, 2012). Most recently the National Environmental
Management: Waste Management Act (2007) promoted environmental awareness and
sustainability, waste minimisation, pollution prevention and waste services improvement
(Etengeneng, 2012). Despite all this, however, suburban areas still receive more municipal services
than townships (McDonald & Pape, 2002). Since the advent of democracy, improving waste service
delivery has been a low priority, and finances allocated for improvement have been poorly utilised
(McDonald & Pape, 2002; Matete & Trois, 2008). The result is that infrastructure in townships still
needs to be improved, while suburban infrastructure largely remains in place from the apartheid
system (McDonald & Pape, 2002). Therefore, today, previously black areas, such as townships
experience more challenges than previously white suburban areas, such as informal dumping
(McDonald & Pape, 2002).
In terms of informal dumping, South Africa faces similar challenges to most developing countries.
Case studies across South Africa done by Afrika (2010) found that informal dumping of household
waste increased when municipal collection services were irregular and unreliable. Asnani (2006)
6

suggests that collection services could be inadequate due to improper infrastructure with regards to
bin collection systems, poor roads and insufficient vehicles for collection and transportation, as well
as poor communication on collection time schedules (Guerrero et al., 2013). In addition, the
availability and pricing of waste treatment facilities can lead to the problem of informal dumping; for
instance, in the Central Business District of Johannesburg shopkeepers avoid payment of waste
disposal fees by dumping their waste on the pavement (Swilling & Hutt, 1999). Although informal
dumping is usually publicly considered unacceptable, it often occurs at night, making it hard to
impede (Swilling & Hutt, 1999).
The frequency of informal dumping increases when there is a lack of waste treatment facilities or
absence of adequate waste removal services (Ichinose & Yamamoto, 2011). The fewer waste
treatment facilities there are, the more the price of waste collection and subsequent disposal will
increase, leading to an unwillingness of companies to correctly dispose of their waste, and an
increased preference to resort to informal dumping (Ichinose & Yamamoto, 2011). In addition, if
penalties for informal dumping are poorly enforced or small relative to proper treatment costs, or if
a population is not adequately educated about the need for proper and sanitary waste disposal,
informal dumping is more likely to occur (Muoghalu et al., 1990). Informal dumping has significant
ecological, social and economic consequences. It is aesthetically displeasing and leads to the
depreciation of land value (Yuan, et al., 2011). After having been subjected to informal dumping, the
cost of recovering land to a natural state is high, and represents an additional cost to waste
management budgets (Swilling & Hutt, 1999; Yuan, et al., 2011). Because of the additional cost,
municipalities are less likely to prioritise recovery activities, and waste from informal dump sites can
build up unhindered (Swilling & Hutt, 1999).
Informal dumping can significantly decrease land productivity and functionality, depending on the
nature of waste: certain materials are organic and decompose easily, but other materials can be
quite toxic, contaminating soils and groundwater and poisoning natural biota. (Pap, 2004; Swilling &
Hutt, 1999). In general, informal dumping contaminates the environment, causing a decline in the
strength and resilience of natural ecosystems, as well as having negative impacts upon biodiversity
and causing loss of ecosystem services (Swilling & Hutt, 1999; Yuan, et al., 2011). Over time,
informal dumping may also block storm drainage and cause floods in the event of heavy rain
(Medina, 2005).
Informal dump sites can have significant negative effects on human health (Medina, 2005). The
accumulation of untreated rubbish provides havens for pests which can be household nuisances or
be vectors for dangerous diseases, as well as allowing for the proliferation of harmful bacteria
7

(Swilling & Hutt, 1999; Medina, 2005). Informal dump sites can contain the carcasses of dead
animals, which also release bad odours and may contain disease (Swilling & Hutt, 1999). In addition,
informal dumping can cause a loss in both the cultural and economic services that land can provide,
by decreasing both its aesthetic value and its economic worth.
This study will examine a town in the Makana Municipality of the Eastern Cape Province. Makana
has a small population size and area, and the quantity of waste produced should therefore be
smaller and easier to manage than that of a larger area (Godfrey, 2008). However, Makana still
suffers significantly from waste disposal issues, as it is an economically poor area and has significant
limitations in terms of resources, as well as deficiencies in the distribution of those limited resources
(Godfrey, 2008). For example, in Makana, garden skips are placed in the streets to be utilised for
garden refuse, but many of these skips are in poor condition, rusted and contain large holes
(Ekelund & Nyström, 2007). In addition, residents of Makana do not confine their uses of these skips
to garden refuse, but will additionally engage in informal dumping of household waste both in and
around these skips (Ekelund & Nyström, 2007). Thus, informal dumping is a major problem in
Makana and forms the subject of inquiry of this study.
1.1. Objective and Key Questions
The objective of this study was to assess the distribution and socio-economic impacts of informal
dumping in Grahamstown. In order to achieve this objective, the following key questions were
explored:
(1) How does the extent of informal dumping differ between different socio-economic sectors
of Grahamstown?
(2) How does the perceptions of informal dumping differ between different socio-economic
sectors of Grahamstown?
(3) What are the health risks associated with informal dumping in Grahamstown? and
(4) What are the effects of informal dumping on land value on and around dump sites in
Grahamstown?
Health risks and the effect of informal dumping on land value were investigated in terms of both
professional opinion and residents perceptions.
8

2. Study Area
Grahamstown (33.3°S, 26.5°E, Figure 1) is located in the Makana Municipality, South Africa. Due to
South Africa's history of Apartheid, Grahamstown, like most other South African towns still has areas
with the feature of race as a dividing line between the socioeconomic classes (Figure 2). Although
black South Africans were not resettled during Apartheid in Grahamstown, the divide was enforced
by the laws of Apartheid (Møller et al., 2001). Today, although there are no laws in place to prevent
integration, the divide is still evident due to the extensive levels of poverty that prevent
Grahamstown East (former black area) residents from integrating into Grahamstown West (former
white area) (Christopher, 2012). Additionally, with little economic investment in Grahamstown East
(the former black township) during Apartheid, it has remained as an area with lower levels of income
among residents and low service delivery (Møller et al., 2001).
In the latest census report, the Grahamstown population was estimated at 50 217 (Frith, 2011).
Grahamstown West has a total population of 9 541 with a population density of density of 267 per
km², Grahamstown East has a total population of 35 499 with a population density of 4 471 per km²
(Frith, 2011). Almost 75 % of households pay a service levy and the majority of it is used for water
and refuse removal (Møller et al., 2001).
Figure 1. Grahamstown Map (Google Maps, 2014)
9

Figure 2. A Map of Post-Apartheid Grahamstown showing different areas according to race (Fox, 2012)
3. Methods3.1. Informal dump site density and size
In order to assess the extent of informal dumping between the different socio-economic sectors of
Grahamstown, ArcMap 10.1 (Geographic Information System (GIS) software) and a Global
Positioning System (GPS) was used to map all the dump sites in Grahamstown. The two groups
working on informal dumping in Grahamstown were divided into pairs and each given an area of
Grahamstown. Every street in each area was explored and any informal dump sites that were found
were recorded using a GPS.
At each dump site, information was recorded about the dump site including size and presence of
children. In order to determine size a scale was used; dump sites were classified as small (<5m),
medium (5 – 15m), large (15 – 25m) or very large (>25m). The presence of children was recorded in
order to assess our key question: What are the health risks associated with informal dumping in
Grahamstown? This was simply recorded as presence or absence.
In order to compare the extent of informal dumping between the different socio-economic areas,
Grahamstown was divided into Grahamstown East and Grahamstown West and the density of
informal dump sites in each area was calculated using ArcMap 10.1. To do this, the area of
Grahamstown was digitised into two polygons that made up Grahamstown East and West. This was
10

done under the projection Transvers Mercator, Longitude 27, with the datum D_WGS_1984, as this
is the common projection for South African Maps (Carter, 1997). This was important as it enabled
the calculation of the area of Grahamstown East and West in square kilometres (Esri, 1995). The
location of each dump site was then mapped as points over the polygons, Grahamstown East and
West, as recorded using GPS. The points were then colour coded according to their size.
3.2. Household surveys and key informant interviews
In order to assess the effect of informal dumping on perceptions, health and land value, eight dump
sites, four from each socio-economic area (Grahamstown East and Grahamstown West), were
randomly selected. This was done using Microsoft Excel and the dump sites were only selected from
the large and very large dump sites that were found. Household surveys (see appendix) at each
dump site were then conducted using targeted door-to-door sampling with the first ten households
that were willing to participate. Eighty household surveys were conducted in total, 40 from each
socio-economic area. These household surveys were conducted during August 2014. In
Grahamstown East two translators were used (Nkosekhaya Hlitane and Vuyo Ntamo) as the more
common language spoken was isiXhosa. In addition, several key informant interviews were
conducted: two with estate agents, two with doctors and one with a clinic worker. This was in order
to get a professional opinion on the effects of dump sites on health and land value.
3.3. Data analysis
The density of the dump sites per socio-economic area was calculated using the total number of
informal dump sites in each area divided by the size of the area in square kilometres (density =
number of dump sitesarea[km2]
). Data from the household surveys was analysed using descriptive statistics
and coding for qualitative analysis. Descriptive statistics gives a platform of illustrating, describing
and analysing data in a simple and meaningful way in order to demonstrate the prominent features
of the data such as patterns and the spread of data (Laerd Statistics, 2013).
Our data analysis made use of percentages, diagrams such as pie charts and graphs as well as tables.
Demographics were shown using tables, the extent of dumping in the two areas was shown
according to size using a map and pie charts, and people’s perceptions were illustrated using
percentages and bar graphs.
11

4. Limitations
Limitations encountered during method application included, difficulty in defining some of the dump
sites because litter trails connected dump sites, making it difficult to distinguish between dump sites.
To solve this litter trails were not considered as part of the dump site, groups of litter less than 1m
across were considered litter trails. Then when mapping, due to time constraints and the large
number of dump sites, Grahamstown was divided between two groups working on dump sites. This
could have led to sampling error with regards to the data collection as with so many people
collecting data, sampling effort likely differed amongst the data collectors. However, in order to
avoid this, when recording information about the dump sites we used the same data sheet.
Also, there are concerns about overlapping GPS points in our map, however, to calculate density the
hard copy data sheets were used to count the number of dump sites in each area, instead of the
points on the map. This ensured that the density was calculated according to the actual number of
dump sites found on each side of Grahamstown.
A buffer zone could have been used; a section of about three streets between Grahamstown East
and West where interviews were not conducted. This is because the boundary between
Grahamstown East and West is not distinct and therefore a buffer zone would have made for more
accurate samples. Additionally, when it came to the key informant interviews, most estate agents
dealt with houses in Grahamstown West (which is only one of the study areas), far from informal
dump sites. Thus their insight about dump sites and land value in Grahamstown East is mostly based
on general knowledge.
During survey collection in Grahamstown East additional translators were hired to increase
efficiency, however, there were translators that were not a part of the Environmental Science course
and therefore did not fully understand the purpose and methods of the project. Thus they were less
inclined to ask further leading questions related to the aims of the project and encourage answers
more related to our project aims. Then, when conducting the surveys residents were not ranked
according to their distance from the dump site, perceptions of residents living closer to the dump
site were different from those living further away. By using a ranking system this trend could have
been shown and used to explain some of the differences in perceptions between residents.
12

5. Results5.1. Grahamstown demographics in East and West
An average household in Grahamstown East consisted of two people in the working age class of 17-
59 years, at least one child (<16 years) and one pensioner (>60 years), making up an average
household of four people (Table 1). This however, differed in Grahamstown West as only one out of
every five houses had someone living there above the age of 60 years.
In Grahamstown West there was at least one person employed within the household whilst in
Grahamstown East 0.8 people were employed per household. There was a greater percentage of
respondents permanently employed in Grahamstown West at 84% compared to 51% of respondents
being permanently employed in Grahamstown East. Grahamstown East had a greater percentage of
temporary and ad hoc employed respondents compared to Grahamstown West (Table 1).
Grants played a larger role in household income in Grahamstown East, with one in every five
households receiving grants whilst in Grahamstown West only one in 25 households received a grant
(Table 1). Overall, the reliance of Grahamstown East households on grants and temporary or ad hoc
employment suggests that Grahamstown East is of a lower economic level than Grahamstown West.
Table 1. Social and economic structure of households in Grahamstown East and West
Category Grahamstown East
Grahamstown
West
Average number of people in
household
<16 1 ± 1.2 1 ± 0.8
17-59 2 ± 1.1 2 ± 0.9
>60 1 ± 0.6 0.2 ± 0.5
Employment
Average number of
people employed in
household 0.8 ± 0.8 1.4 ± 0.8
Permanent (%) 51 86
Temporary (%) 24 4
Ad hoc (%) 24 9
Grants (pension, child,
disability etc.)
% of households 20 5
13

5.2 The extent of informal dumping and how it differs between different socio-economic sectors of Grahamstown
5.2.1 Size and distribution of dump sites
Most dump sites in Grahamstown West were small (37%) whereas in Grahamstown East most dump
sites were medium (47%) (Figure 3). Although the majority of dump sites in Grahamstown East were
bigger in size, very large dump sites made up a greater proportion (14%) in Grahamstown West than
in Grahamstown East (8%).
Small; 37%
Medium; 29%
Large; 20%
Very Large; 14%
Grahamstown West
Small; 25%
Medium; 47%
Large; 21%
Very Large; 8%
Grahamstown East
Figure 3. A comparison of size of dump sites between Grahamstown West and Grahamstown East (small: <5m, medium: 5 – 15m, large: 15 – 25m, very large: >25m)
There were 175 dump sites recorded in Grahamstown East whereas only 35 dump sites were located
in Grahamstown West. The density of dump sites in Grahamstown East was 13.5 per km2 compared
to 1.7 per km2 (Figure 4).
14

5.3 Perceptions of informal dumping and how it differs between different socio-economic sectors of Grahamstown
Almost all of the Grahamstown East respondents acknowledged that there was a dump site in their
area (Figure 5). This differs to Grahamstown West households as 75% of respondents acknowledged
that there was at least one dump site in their area. Sixty five percent of respondents from
Grahamstown East said that they knew of two to five dumping sites compared to 35% of
Grahamstown West respondents (Figure 6).
Aware of d
ump site
Made u
se of d
ump sites
Secreti
ve ab
out dumping
0102030405060708090
100
Grahamstown EastGrahamstown West
% o
f res
pond
ents
Figure 5. Percentage of respondents who answered yes to a number of questions pertaining to
dump site awareness in their area.
0 to 1 2 to 5 >50
10
20
30
40
50
60
70
Grahamstown EastGrahamstown West
Number of dump sites noticed
% o
f res
pond
ents
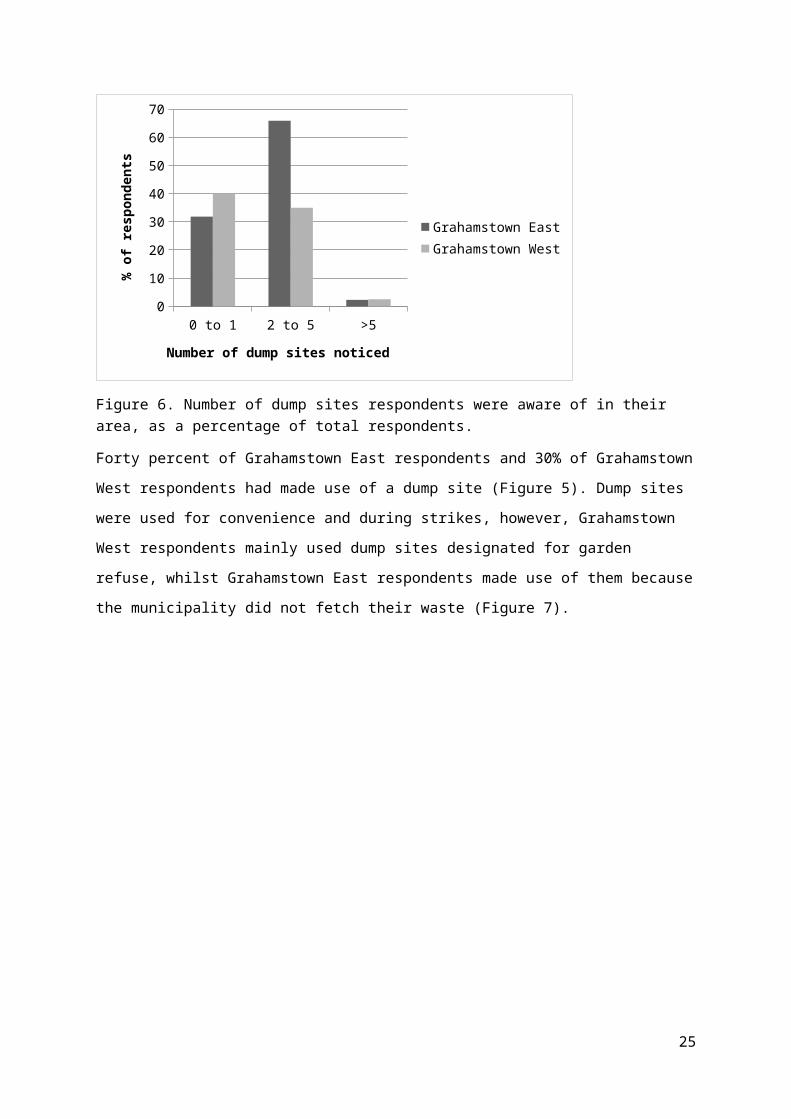
Figure 6. Number of dump sites respondents were aware of in their area, as a percentage of total respondents.
15

Forty percent of Grahamstown East respondents and 30% of Grahamstown West respondents had
made use of a dump site (Figure 5). Dump sites were used for convenience and during strikes,
however, Grahamstown West respondents mainly used dump sites designated for garden refuse,
whilst Grahamstown East respondents made use of them because the municipality did not fetch
their waste (Figure 7).
Waste not collected Convenience Skip for garden refuse0
5
10
15
20
25
30
Grahamstown EastGrahamstown West
Reasons
% o
f res
pond
ents
Figure 7. Reasons why respondents use the dump sites in Grahamstown East and West
Grahamstown East respondents believed that others make use of the dump sites because the people
who dump have not been educated on the consequences of dumping, nor as to where it is legal to
dump certain wastes (Figure 8). Grahamstown West respondents felt however, that people make
use of the informal dump sites due to convenience and then municipal strikes. A respondent
explained that when strikes occur they do not know where to put their waste and because they do
not want it in their yards or outside their homes, they make use of the informal dump sites.
16

Dispose
of wast
e
Strike
s
Low "educati
on" / se
nsitivit
y to dumping
Convenien
ce
*Other
0
5
10
15
20
25
30
35
40
45
Grahamstown EastGrahamstown West
Reasons
% o
f re
spon
dent
s
Figure 8. Reasons given by respondents as to why people make use of informal dump sites, as a percentage of total responses per category. *Other includes; job creation, municipality backlogged with work, dump site being close to the township, pickers leaving found waste
The most commonly dumped waste materials in Grahamstown East were household waste and
sanitary waste (such as nappies), this was followed by dead animals and garden refuse (Figure 9).
Grahamstown West households indicated that household or domestic waste was the most
commonly dumped material followed by garden refuse and building rubble (Figure 9). This differs to
what we observed, in Grahamstown West the most commonly dumped waste was garden and
building rubble, followed by household waste.
17

Household w
aste
Garden
refuse
Building r
ubble
Sanita
ry
Medica
l
Dead an
imals
0
10
20
30
40
50
60
70
80
Grahamstown EastGrahamstown West
Waste material
% o
f res
pond
ents
Figure 9. Most common waste materials dumped according to respondents in Grahamstown West and East
5.3.1 Service delivery
It was found that in Grahamstown East, according to the majority of respondents, the informal dump
sites are cleared monthly or never, this was closely followed by the opinion that the dump sites are
seldom cleared. In Grahamstown West, the majority of respondents indicated that the informal
dump sites were cleared either weekly or seldom or they didn’t know. Additionally, eighty percent of
people felt that the sites were cleared inefficiently and ineffectively. Grahamstown East
respondents’ opinions were equally distributed as 50% thought it was and 50% thought it wasn’t
cleared efficiently. However, 72% of Grahamstown West respondents felt that the dumps sites were
not efficiently or effectively cleared.
In Grahamstown West, it was found that Municipal waste was collected on a weekly basis according
to 92% of the respondents and 71% of households found this sufficient. Ninety six percent of
respondents in Grahamstown East indicated that Municipal waste was collected weekly. However,
50% of Grahamstown East respondents thought this was insufficient.
18
5.4 The health risks associated with informal dumping in Grahamstown
According to the medical professionals the main health risks were from household waste. Decaying
organic matter or human waste can lead to gastro-intestinal infections if contamination occurs. Ecoli
from faeces can cause a bacterial infection and food poisoning can lead to diarrhoea and vomiting.
Other potential bacterial infections include tetanus if someone gets wounded at a dump site. Also,
people could get injured obtaining chemical injuries and burns. In addition, the presence of inorganic
chemical toxins such as paint, methylated spirits etc. can also cause illness. If physical agents such as
turpentine or paraffin are inhaled it can lead to Pneumonia.
There is also a chance of heavy metal poisoning through metals such as lead and mercury. Viral
diseases that can be obtained at a dump site include Hepatitis A and B, HIV through the transmission
of body fluids (unlikely but still possible), or through contact with animals and their skins,
Haemorrhagic fever virus, Rabies from dogs and rodents and Pasteurella (similar to the bubonic
plague). Dump sites are unsightly and this can lead to depression and other mental health issues.
When dump sites burn they can cause environmental pollution, aggravating respiratory tract
infections. Furthermore, offensive smells can also trigger asthmatic or allergic reactions. Lastly, if
dump sites are in close vicinity to water there is potential for pollution of drinking water and the
possibilities of diseases are amplified as water can act as a vector spreading diseases such as Typhoid
and Cholera.
The Middle Terrace Clinic mostly treated patients that resided in Grahamstown East. Health issues
the clinic worker suggested to be related to dump sites included an itchy throat, coughing and
phlegm. This can be due to playing in the water next to the dump sites, and from breathing the dirty
air and fumes from when people burn the rubbish. Additionally, there are lots of germs that can be
caught from dump sites if time is spent near them, according to the clinic worker, many children get
sick because they play in and around the dump sites. Not all patients live close to dump sites, so it is
not always certain if health issues are caused by dump sites, the cause is only known if they say that
they live close to a dump site.
The clinic worker indicated that many people came to the clinic with rashes on their arms and legs
and also other areas, this can often be related to the dump sites. Other injuries include general sores
and scalp infections, but it is not always known if these are directly caused by dump sites.
19

5.4.1 Quality of life
Ninety three percent of Grahamstown East respondents felt that the presence of a dump site in their
area affects their quality of life. Only 73% of Grahamstown West residents felt that their quality of
life was impacted by the presence of a dump site in their area. The most common explanation was
that “the dump site is too far away from my house” or “I don’t live directly opposite it so it doesn’t
bother me”.
Grahamstown East respondents indicated that bad odour given off from the dump sites was the
main factor affecting their quality of life, Grahamstown West residents on the other hand did not list
bad odour as being an issue (Figure 10). Instead, they indicated that the major factor affecting their
quality of life was that the dump sites are aesthetically displeasing, followed by the increased crime
and safety issues dump sites cause by attracting the wrong kind of people.
Health Risk
s
Poor air q
uality
Waste b
lown around
Astheti
cally
displea
sing
Crime a
nd safty i
ssues
Bad odour
*Other
05
101520253035404550
Grahamstown EastGrahamstown West
Impacts on quality of life
% o
f res
pond
ents
Figure 10. Ways in which the dump sites affected the respondent’s quality of life in Grahamstown East and West as a percentage of total responses per category. *Other includes: stress, pests, endangers children, environmental concerns and issues.
5.4.2 Health impact perceptions
The majority of Grahamstown East residents (82%) perceived to have experienced health issues from
the dump site in their area compared to 42% of Grahamstown West respondents (Figure 11). The
16% of Grahamstown East and 11% of Grahamstown West respondents who did incur injuries
explained that it was only minor cuts and scrapes (Figure 11). It was found that 51% of Grahamstown
20

East and 47% of Grahamstown West respondents said that they had no knowledge of the health
impacts that dump sites in general may pose. Associated dump site health risks which the remainder
(49%) of Grahamstown East respondents and Grahamstown West respondents (53%) knew of
included: respiratory illnesses such as asthma and children and animals getting sicknesses from
playing and eating in the dump sites, however, they could not explain what illnesses (see Figure 11).
Health im
pacted
Experi
enced
injurie
s
Knowledge
of gen
eral d
ump site r
elated
health
risks
0102030405060708090
Grahamstown EastGrahamstown West
Responses
% o
f res
pond
ents
Figure 11. Respondents replies as to whether they have experienced any health related impacts from the dump site in their area (Grahamstown East and West), as well as general health risk knowledge.
The biggest heath issues Grahamstown East respondents had experienced were respiratory illnesses,
such as asthma and general sickness mainly in children (Figure 12). Additionally, they indicated that
TB was a possible health risk as medical waste and household waste is dumped on dump sites and
one could easily contract the disease. Grahamstown West respondents however, indicated that the
dump sites were unhygienic, cause respiratory illnesses and bring about flies and pests such as rats
(Figure 12).
21

Unhygien
icPest
s
Respira
tory illn
esses
Sanita
ry
Genera
l sickn
ess TBTo
xins
Sores
/Rash
Not sure
0
10
20
30
40
50
60
Grahamstown EastGrahamstown West
Health risks
% o
f res
pond
ents
Figure 12.Health issues that respondents have experienced due to the presents of a dump site in their area (Grahamstown East and West)
More children were present near dump sites in Grahamstown East (41%) as compared to
Grahamstown West (9%). This could suggest that more children are vulnerable to injuries and health
impacts from the dump sites in Grahamstown East than in Grahamstown West.
5.5 The effects of informal dumping on land value on and around dump sites in Grahamstown
According to key informants there are multiple factors that contribute to the decrease of property
price. These include the presence of informal dump sites, the state of the economy and the suburb.
The price of the property is determined mainly by the suburb it is located in. The more expensive the
suburb is, the greater the decrease when there is an informal dump site. Issues with having a dump
site nearby include: increased crime rates, fire hazards, smell, aesthetics, insects and inviting more
strangers to the area.
Seventy three percent of Grahamstown East respondents felt that the presence of a dump site in
their area affected their land value (Figure 13). Eighty two percent of respondents in Grahamstown
West said that the dump sites affected their property values. Grahamstown East and West property
values depreciate because the dump sites are either aesthetically displeasing or people simply do
22

not want to live close to an informal dump site (Figure 14). The 27% of respondents from
Grahamstown East and the 8% from Grahamstown West, said the dump sites did not affect their
property value because the dump sites are either not very obvious or close to their household.
The majority of people were not moving from the area due to there being a dump site present and
57% of Grahamstown East and 72% of Grahamstown West respondents would not move away from
their area even if funds would allow (Figure 13). Reasons given by respondents for this finding is that
they don’t live directly opposite the dump sites.
Lastly it was found that more Grahamstown East respondents (86%) would not buy a property
knowing there is a dump site nearby, whereas only 67% of Grahamstown West would not by the
property. Ten percent of Grahamstown West respondents indicated that they would buy a property
close to a dump site if the dump site was or could be managed, if it was a biodegradable dump site
and if it was small.
Affects la
nd value
People
moving a
way fro
m area
Presen
ce en
courages
moving t
o another
area
Would buy near
dump site
0
10
20
30
40
50
60
70
80
90
Grahamstown EastGrahamstown West
Responses
% o
f re
spon
dent
s
Figure 13. Responses from Grahamstown East and West concerning property value
23

Poor aest
hetics
People
don’t wan
t to liv
e close
to dump sites
Lowers sta
ndard of li
ving
*Other
05
10152025303540
Grahamstown EastGrahamstown West
Reasons
% o
f res
pond
ents
Figure 14. Respondents’ reasons for why they think the presents of a dump site in their area affects their property values in Grahamstown East and West. *Other includes; health impacts, safety issues and dump site proximity.
6. Discussion6.1 The extent and perceptions of informal dumping and how it
differs between different socio-economic sectors of Grahamstown
Grahamstown East had a more extensive dumping problem with larger dump sites and a greater
density of dump sites. Due to the high density of dump sites in Grahamstown East, respondents from
Grahamstown East were more likely to live in close proximity to a dump site and therefore were
more aware of and knew of more dump sites located in their area than Grahamstown West
residents.
More Grahamstown East respondents said that they make use of dump sites than Grahamstown
West respondents. This partly explains the higher density of dump sites in Grahamstown East. Out of
the people who made use of the dump sites, the majority of Grahamstown West residents utilised
the dump sites as they are designated for garden refuse whereas Grahamstown East residents used
the dump sites because their waste was not collected. This suggests that mostly garden refuse is
dumped in Grahamstown West whereas mostly household waste is dumped in Grahamstown East.
However, Grahamstown West residents perceived household waste to be the most commonly
24
dumped and only secondly garden refuse. Although we observed garden refuse to be the most
commonly dumped material in Grahamstown West, perhaps residents saw household waste being
dumped as a bigger problem and thus mentioned it above garden refuse. This is because household
waste was being dumped in skips designated for garden refuse and because household waste causes
a greater risk to your health as mentioned by one of our medical practitioner key informants and
Medina (2005) (Ekelund & Nyström, 2007). Thus more research is needed to quantify the type of
waste dumped in Grahamstown West and East to clarify the difference between residents’
perceptions and our observations.
The dumping of garden refuse in Grahamstown West could be because of the cost of disposing of
garden waste, in Grahamstown West disposing or garden waste often requires residents to drive to a
skip, an extra cost and effort. The increasing cost of disposal can result in informal dumping as
people try to avoid the extra cost (Fullerton and Kinnaman, 1995). If cost is the cause of dumping in
Grahamstown West, penalties could be a potential solution for illegal dumping as they can be
effective at reducing its occurrence (Muoghalu et al., 1990; Ichinose & Yamamoto, 2011).
Grahamstown East households found household waste and sanitary waste to be the most commonly
dumped, this suggests that informal dumping is more of a problem in Grahamstown East due to the
lack of service delivery. Furthermore, Grahamstown East respondents said that they used the dump
sites because their waste was not collected and they on average found that dump sites were cleared
less often as compared to Grahamstown West residents. Additionally, more Grahamstown East
residents indicated that their waste was not always collected weekly or often enough, suggesting
less regular service delivery in Grahamstown East. In South Africa, low income areas have low service
delivery as funds and infrastructure have been allocated to the higher income areas as priority is
given to residents who pay for these services (Miraftab, 2004; McDonald, 2008). As a result,
infrastructure in previously black areas still needs to be improved and more challenges such as
informal dumping are experienced, while previously white suburban infrastructure largely remains in
place from the apartheid system (McDonald & Pape, 2002). Potential solutions include encouraging
private sector participation in waste management as a means of lowering costs, as well as
appointing authorities that are dedicated to meeting waste management goals (Zotos et al., 2009).
Overall, the lack of service delivery in the lower income areas leads to a larger problem of informal
dumping. This is shown by the higher density of dump sites in Grahamstown East and the perceived
lack of service delivery according to respondents.
Problems with dumping in both areas may be that, as a developing country, South Africa’s service
delivery is not always efficient due to a lack of funding; this leads to informal dumping (Samson,
25

2004). Lack of funding can lead to limited training and pay for waste management workers, causing
poor motivation and productivity. A large cause of the lack of service delivery in South Africa is the
insufficient collection of tax revenues because of many people that do not pay (Fjeldstad, 2004). This
results in inadequate service delivery as well as higher taxes for those who do pay (Fjeldstad, 2004).
Additionally, on a smaller scale, Makana municipality has problems with informal dumping as it has
limited resources, distributed ineffectively and is an economically poor area (Godfrey, 2008). This
was reinforced by the Grahamstown West respondents who felt that lack of service delivery led to
informal dumping. Additionally, from all respondents there was a lack of clarity on how often the
informal dump sites were cleared, suggesting that it is not always a regular occurrence. Conversely,
most respondents stated that the municipality came weekly to collect their waste. Therefore
research on the actual efficiency of service delivery in Grahamstown is needed to determine
whether it is the main cause of informal dumping.
Most Grahamstown East respondents viewed lack of sensitivity/education about dumping as the
causes of informal dumping. This result is because these respondents were in close proximity to
dump sites and therefore they themselves felt that others dumped because they did not understand
the repercussions it had on those living closest to the dump sites. Thus they perceive that if the
others that use the dump sites knew how much it impacted those closest to the dump sites they
would be less inclined to dump. This suggests that if the issue of informal dumping is not due to a
lack of service delivery, it may be because people need to be educated on the consequences of
informal dumping. In developing countries like South Africa, there is often a lack of stakeholder
participation and social responsibility for waste management, usually as a result of poor education
(Godfrey, 2008; Zotos et al., 2009). Communities often use educational programs to discourage
informal dumping and it has been found that education can reduce the amount of informal dumping
by promoting environmentally responsible choices (Muoghalu et al., 1990; Miranda & Aldy, 1998;
Clapp, 2002; Hasan, 2004). Thus more research is needed into people’s knowledge of the
consequences of informal dumping in Grahamstown. The limited research we did on people’s
perceptions on the consequences of informal dumping seems to suggest that education is needed as
only about half of respondents knew that there were health risks from informal dump sites.
Grahamstown West respondents felt that convenience was the main reason for informal dumping.
This could be because Grahamstown West residents have a higher level of employment and
therefore have less time, encouraging dumping as an option as it is more convenient.
26

6.2 The health risks associated with informal dumping in Grahamstown
The higher density of dump sites in Grahamstown East was found to result in more health impacts
and effects on quality of life for Grahamstown East respondents than Grahamstown West
respondents. Furthermore, as household and sanitary waste were more common in Grahamstown
East the risk of health related impacts was higher as stated by our key informants. Additionally,
uncollected household waste can pose a significant risk to human health (Medina, 2005). In
Grahamstown East the most common effect on quality of life was listed as bad odour which can
trigger asthmatic reactions which were found to be common in Grahamstown East. These and other
health impacts such as sicknesses in children were more common in Grahamstown East.
Additionally, more people were injured in Grahamstown East and this can lead to tetanus if the
wound is contaminated.
In Grahamstown West the most common effects from dump sites were that they are aesthetically
displeasing, increase crime, unhygienic, and bring about flies and pests such as rats. Pests can spread
diseases such as Pasteurella and Rabies (Swilling & Hutt, 1999; Medina, 2005). Thus more serious
health impacts were found in Grahamstown East due to the higher density of dump sites as well as
more children playing near dump sites. Grahamstown East is a poorer area as shown by the lower
level of employment, thus there is less recreational opportunities for their children and therefore
they are more likely to play in a dump site and thus affect their health. Conversely, Grahamstown
West residents focused more on their mental wellbeing as compared to Grahamstown East residents
who focused on their physical wellbeing. This is probably because Grahamstown East residents
experience more health impacts, living closer to dump sites than Grahamstown West residents.
Respiratory illnesses were found to be common in both Grahamstown East and West, although
slightly more common in Grahamstown East, most likely due to the density of dump sites.
Respiratory illnesses can occur when dump sites burn and cause environmental pollution (Medina,
2005). In particular children and the elderly already with chronic respiratory illnesses were found to
be the most vulnerable (Rushton, 2003). This is an issue in Grahamstown East where more elderly
residents were found to make up the household.
In terms of perceived general health impacts of dump sites Grahamstown East respondents
mentioned TB as a potential consequence. TB cannot be spread by dump sites, it is transferred
between people and is transmitted via the air (Health 24, 2011). Thus this is a misconception
probably due to the lower income and thus education levels of Grahamstown East residents.
27

63. The effects of informal dumping on land value on and around dump sites in Grahamstown
Most respondents felt that having a dump site near them would affect their land value. Other
research on informal dumping has found that dump sites do decrease land value (Lakshmikantha,
2006; Yuan, et al., 2011). Grahamstown West respondents most likely felt that dump sites decreased
their land value because there would be a greater decrease in their land value as Grahamstown
West is a higher income area (as mentioned by one of our estate agent key informants). Both areas
stated that the reason for decreased land value was that dump sites were aesthetically displeasing,
people don’t want to live near dump sites and that dump sites lower your standard of living. Nelson,
Genereux & Genereux (1992) and Lakshmikantha (2006) found that debris, odour and appearance
can affect land value and that dump sites can decrease your standard of living and the aesthetics of
the area. This is why most residents would not buy a property knowing there was a dump site
nearby. Thus it was found that in both areas dump sites decreased aesthetics, which made the
property price decrease. Although most respondents do not want to move themselves because of
the dump site, of those who do want to move are mostly Grahamstown East residents. Also, more
Grahamstown East residents would not have bought a property with a dump site nearby. This is
probably because the informal dumping problem is more severe in Grahamstown East.
7. Conclusion
In conclusion we were able to achieve our objective of assessing the distribution and socio-economic
impacts of informal dumping in Grahamstown. This was done by answering our key questions. In
terms of the extent of informal dumping in Grahamstown, there was a difference between the two
different socio-economic sectors. The lower economic sector, Grahamstown East, had a more
extensive dumping problem than the higher economic sector of Grahamstown West due to a higher
density of dump sites per kilometre squared.
In terms of the differing perceptions of informal dumping between the different socio-economic
sectors, more respondents in Grahamstown East made use of dump sites to dump household waste
because their waste was not collected. Also, Grahamstown East respondents perceived household
waste to be the most frequently dumped waste due to a lack of service delivery. In South Africa, due
to lack of funding, priority is given to residents who pay for these services and thus, as a lower
income area, service delivery could be a larger issue in Grahamstown East. A potential solution is to
encourage private sector participation in waste management as a means of lowering costs. However,
28

Grahamstown East respondents believed the cause of dumping to be poor education. This could be
the case as low education on waste management issues often leads to informal dumping. Therefore
further research is needed on education and the efficiency of service delivery in both socio-
economic areas to determine the actual cause of informal dumping.
In Grahamstown West, respondents mostly dumped garden refuge. This could be to avoid the extra
cost involved in disposing of garden refuse. Penalties for illegal informal dumping could be
implemented to balance out the costs associated with not disposing of the waste. However,
respondents perceived household waste to be the most commonly dumped. Nonetheless, we
observed that garden waste was the most common material dumped in Grahamstown West.
Perhaps residents saw household waste being dumped as a bigger problem and thus mentioned it
above garden refuse. Therefore, more research is needed to quantify the different types of waste
dumped to clarify the difference between residents’ perceptions and our observations.
The health risks associated with informal dumping In Grahamstown were experienced by more
respondents in Grahamstown East. This was due to the higher density of dump sites in
Grahamstown East and thus, quantity of household waste which poses a health risk. The perceived
health risks identified by respondents included but aren’t limited to; respiratory illness, sicknesses in
children and injuries. It was found that Grahamstown East respondents perceived that dump sites
impacted their physical health more than mental health. Grahamstown West respondents mostly
perceived mental well-being, such as decreased aesthetics.
In terms of the perceived impacts on informal dumping, it was found that all respondents in
Grahamstown East and West perceived that land value would be affected by the presence of an
informal dump site in their area. This was due to the perception that informal dump sites decrease
aesthetics as well as standard of living. Additionally, it was found that of those who wanted to move
because of the dump site or who would not buy a property knowing that there was a dump site
nearby, it was mostly Grahamstown East residents due to the higher density of dump sites in their
area.
Therefore, informal dumping is a problem in Grahamstown affecting both socioeconomic areas in
terms of health impacts and land value. Overall, informal dumping is a more serious problem in
Grahamstown East, with a higher density of dump sites per square kilometre. This is most likely
because of uneven service delivery and a lack of education about waste management. Nevertheless,
as this research was based upon perceptions, more research is needed to determine the actual
cause of the differences in extent of dumping between Grahamstown East and West. This
29

information, could be useful to Makana municipality in terms of waste management and improving
the issue of informal dumping in Grahamstown.
8. References
Afrika, M., 2010. Toolkit-South Africa's good waste management practices: lessons learned. Free State waste summit, Bloemfontein.
Asnani, P., 2006. Solid waste management. In: Rastogi, A. India infrastructure report 2006: Urban infrastructure. New Delhi: Oxford University Press.
Carter, J., 1997. What is the Gauss conform system? [Online]. Available: http://www.dwaf.gov.za/iwqs/gauss/node4.html . [17/09/2014].
Christopher, A.J., 2012. Urban Segregation in Post Apartheid South Africa. Sage Journals, 51(6): 449-466.
Clapp, J., 2002. The distancing of waste: Overconsumption in a global economy. In: Princen, T., Maniates, M. and Conca, K. (eds.). Confronting consumption. Massachusetts: MIT Press.
Ekelund, L. and Nyström, K., 2007. Composting of Municipal Waste in South Africa: Sustainability aspects. Upsala Universitet.
Esri, 1995. ArcGIS Help 10.1: Calculating area, length, and other geometric properties. [Online]. Available: http://resources.arcgis.com/en/help/main/10.1/index.html#//005s00000027000000 . [09/09/2014].
Etengeneng, D., 2012, Municipal Solid Waste Management in Grahamstown, Republic of South Africa. Bachelor of Natural Resources Thesis, Degree Programme in Integrated Coastal Zone Management, Novia University of Applied Sciences.
Finnveden, G., Björklund, A., Reich, M.C., Eriksson, O. and Sörbom, A., 2007. Flexible and robust strategies for waste management in Sweden. Waste Management, 27(8): S1-S8.
Fjeldstad, O., 2004. What's trust got to do with it? Non-payment of service charges in local authorities in South Africa. The Journal of Modern African Studies, 42(04): 539-562.
Fox, R., 2012. Grahamstown’s Urban Development: Maps, Photo Pairs, Excursion Guide. [Online]. Available: http://roddyfox.wordpress.com/2012/11/20/population-census-2011-makana-municipalitys-age-sex-data/. [31/03/2014].
Frith, 2011. Census 2011. [Online]. Available: http://census2011.adrianfrith.com/. [21/09/2014].
Fullerton, D. and Kinnaman, T.C., 1995. Garbage, recycling, and illicit burning or dumping. Journal of Environmental Economics and Management, 29(1): 78-91.
Godfrey, L., 2008. Facilitating the improved management of waste in South Africa through a national waste information system. Waste management, 28(9): 1660-1671.
Google Maps, 2014. Grahamstown. [Online]. Available: https://www.google.co.za/maps/@-33.3052282,26.5574273,13z. [31/03/2014].
30

Guerrero, L.A., Maas, G. and Hogland, W., 2013. Solid waste management challenges for cities in developing countries. Waste Management, 33(1): 220-232.
Hasan, S., 2004. Public awareness is key to successful waste management. Journal of Environmental Science and Health, Part A, 39(2): 483-492.
Health 24, 2011. What causes TB? [Online]. Available: http://www.health24.com/Medical/Tuberculosis/Transmission/What-causes-TB-20120721. [30/08/2014].
Ichinose, D. and Yamamoto, M., 2011. On the relationship between the provision of waste management service and informal dumping. Resource and Energy Economics, 33(1): 79-93.
Laerd Statistics, 2013. Descriptive and Inferential Statistics. [Online]. Available: https://statistics.laerd.com/statistical-guides/descriptive-inferential-statistics.php . [22/09/2014].
Lakshmikantha, H., 2006. Report on waste dump sites around Bangalore. Waste Management, 26(6): 640-650.
Matete, N. and Trois, C., 2008. Towards zero waste in emerging countries–a South African experience. Waste Management, 28(8): 1480-1492.
Maylam, P., 1990. The Rise and Decline of Urban Apartheid in South Africa. African Affairs, 89(354): 57-84.
McDonald, D., 2008. World City Syndrome: Neoliberalism and Inequality in Cape Town. New York: Taylor and Francis Group.
McDonald, A and Pape, J., 2002. Cost Recovery and the Crisis of Service Delivery in South Africa, Cape Town: Human Science Research Council Publishers.
Medina, M., 2005. Serving the unserved: informal refuse collection in Mexico. Waste management & research, 23(5): 390-397.
Miraftab, F., 2004. Neoliberalism and casualization of public sector services: the case of waste collection services in Cape Town, South Africa. International Journal of Urban and Regional Research, 28(4): 874-892.
Miranda, M.L. and Aldy, J.E., 1998. Unit pricing of residential municipal solid waste: lessons from nine case study communities. Journal of environmental management, 52(1): 79-93.
Møller, V., Manona, C. W., van Hees, C., Pillay, E., & Tobi, A., 2001. Living in Grahamstown East/Rini: A social indicators report (No. 6). Institute of Social and Economic Research, Rhodes University.
Muoghalu, M. I., Robinson, H. D. and Glascock, J. L., 1990. Hazardous waste lawsuits, stockholder returns, and deterrence. Southern Economic Journal, 57: 357-370.
Nelson, A.C., Genereux, J. and Genereux, M., 1992. Price effects of landfills on house values. Land Economics, 68(4): 359-365.
Pap, R., 2004. Solid Waste Management in Jamaica: Household and Institutional Perspectives. In: Haugestad, A. K. and Wulfhorst, J.D. Future as Fairness: Ecological Justice and Global Citizenship. Netherlands: Rodopi.
31

Rathje, W. L. and Murphy, C., 2001. Rubbish!: the archaeology of garbage. New York: University of Arizona Press.
Rushton, L., 2003. Health hazards and waste management. British medical bulletin, 68: 183-197.
Samson, M., 2004. Organizing in the informal economy: a case study of the municipal waste management industry in South Africa. SEED Working Paper No. 66. Geneva: International Labour Office.
Swilling, M. and Hutt, D., 1999. Johannesburg, South Africa. In: Onibokun, A. G. Managing the monster: Urban waste and governance in Africa. Ottawa: International Development Research Centre.
Yuan, H. P., Shen, L. Y., Hao, J. J. and Lu, W. S., 2011. A model for cost–benefit analysis of construction and demolition waste management throughout the waste chain. Resources, conservation and recycling, 55(6): 604-612
Zotos, G., Karagiannidis, A., Zampetoglou, S., Malamakis, A., Antonopoulos, I., Kontogianni, S. and Tchobanoglous, G., 2009. Developing a holistic strategy for integrated waste management within municipal planning: Challenges, policies, solutions and perspectives for Hellenic municipalities in the zero-waste, low-cost direction. Waste Management. 29(5): 1686-1692.
32

9. Appendix
Informal dumping in Grahamstown: Distribution and
socio-economic impacts(Household questionnaire)
Information (for admin only)
Area (West or East)Street name
Section 1: Demographics
1.1.Household compositionPlease provide details on the composition of your household
Age <16 17-59 >60Number of people in your householdMalesFemales
1.2.Employment
1.2.1. How many adults are employed? ______
1.2.2. What are the types of employment?
Type of Employment Number of peoplePermanentTemporaryAd hoc
1.2.3. Does anyone receive grants? (circle)
33

Pension Child Grant Disability Unemployment None
Section 2: Informal dumping awareness
2.1. Are you aware that there is a dump site located in your neighbourhood?
Yes No
2.2. If yes, how many dump sites have you noticed in your neighbourhood?
0-1 2-5 More than 5
2.4. Have you made use of the dump site in your neighbourhood?
Yes No
2.5. If yes, why? If no, why do you think other people use the dump site? __________________________________________________________________________________________________________________________________________________________________________________________________________________________________________________________________________________________________________________________________________________________________________________________________________________________
2.6. Do you think people are secretive about dumping?
Yes No
2.7. In your area, what is the most common waste material dumped?
34

2.8 Does having a dump site in your neighbourhood effect your quality of life in any way?__________________________________________________________________________________________________________________________________________________________________________________________________________________________________________________________________________________________________________________________________________________________________________________________________________________________
Section 3: Service delivery
3.1. How often are the informal dumps cleared? (Circle)
Daily Weekly Monthly Every few months
Seldom Never
3.2.In your opinion, are they cleared efficiently and/or effectively?
Yes No
3.3 How often does the municipality collect household waste?
Weekly Monthly Seldom Never
3.4 In your opinion is this sufficient?
Yes No
Section 3: Health impact from informal dumping
3.1 Do you think the dump site affects your health in any way? Please explain
35

3.2 Have you experienced injuries from the dump site? Please explain
3.3 Are you aware of any health impacts from dump sites (in general)? Please Explain
__________________________________________________________________________________________________________________________________________________________________________________________________________________________________________________________________________________________________________________________________________________________________________________________________________________________
Section 4: Land value
4.1. Do you think the dump site affects your land value?
Yes No
4.1.1 Why?
__________________________________________________________________________________________________________________________________________________________________________________________________________________________________________________________________________________________________________________________________________________________________________________________________________________________
4.2. Do you think people are moving away or selling because of the dump site?
Yes No
4.3. Does the presence of dump sites in your area make you want to move?
Yes No
4.4 Would you buy a property knowing there is a dump site in the neighbourhood?
Yes No
36