final report spgs timber market study
TRANSCRIPT

Final report
SPGS Timber Market Study
Commissioned by: Sawlog Production Grant Scheme, Kampala, Nov. 2010

Contact
SPGS Timber Market Study 2010
Client:
Sawlog Production Grant Scheme
Authors:
Christian Held
Grit Techel
Kai Windhorst

Final report SPGS Market Study Page I
Content
Executive Summary ....................................................................................................................... 1
1 Introduction .......................................................................................................................... 4
2 Supply .................................................................................................................................... 5
2.1 Plantation estate ........................................................................................................... 5
2.2 Supply projections ......................................................................................................... 7
3 Investor information needs ................................................................................................. 10
4 Uganda regional timber trade ............................................................................................. 11
4.1 Trade with round wood ............................................................................................... 11
4.2 Trade with poles .......................................................................................................... 14
4.3 Trade with sawn wood ................................................................................................ 15
4.4 Other wood products .................................................................................................. 18
4.4.1 Veneer ................................................................................................................. 18
4.4.2 Plywood ............................................................................................................... 18
4.4.3 Particle and fibre boards ..................................................................................... 19
4.4.4 Carpentry and joinery.......................................................................................... 19
4.5 Summary and discussion ............................................................................................. 19
5 Market analysis ................................................................................................................... 21
5.1 Retail market ............................................................................................................... 22
5.2 Secondary processors.................................................................................................. 24
6 Demand and price projections ............................................................................................ 27
7 Recommendations .............................................................................................................. 30
8 Literature ............................................................................................................................. 31
Annexes ....................................................................................................................................... 32
Figures for international trade with other wood products ..................................................... 32
SPGS Plantation Clusters ......................................................................................................... 36
SPGS Market report................................................................................................................. 37
Interviewed companies and organisations ............................................................................. 39

Final report SPGS Market Study Page II
Figures
Figure 1: Plantation area for clusters and years ........................................................................... 5
Figure 2: Proportion of different plantation sizes on area under commercial plantation ........... 6
Figure 3: Distribution of planters of different size over clusters .................................................. 6
Figure 4: Expected harvestable volume per cluster based on planted areas ............................... 8
Figure 5: Round wood trade data 2007 – 2009 for Uganda ........................................................ 11
Figure 6: Industrial round wood exports according to species 2003 - 2008 ............................... 12
Figure 7: Industrial round wood imports according to species 2003 – 2008 .............................. 13
Figure 8: Countries of origin of industrial round wood imports 2004 - 2008 ............................. 13
Figure 9: Trade with poles 2006 – 2008: Major trade partners .................................................. 14
Figure 10: Trade with poles 2006 – 2008: Species ...................................................................... 15
Figure 11: Sawn wood trade data for Uganda 2007 – 2009 ....................................................... 15
Figure 12: Price levels for sawn wood trade 2007 - 2009 ........................................................... 16
Figure 13: Import quantities and average values of rough sawn wood 2007 - 2009 ................. 17
Figure 14: Countries of origin for sawn wood 2005 to 2008 ...................................................... 17
Figure 15: Kenyan round wood imports from Uganda 2004 - 2008 .......................................... 18
Figure 16: Price trend for Pine for standard sizes ....................................................................... 22
Figure 17: Price trend for Eucalyptus across standard sizes ....................................................... 22
Figure 18: Price trend for Mvule ................................................................................................. 23
Figure 19: Price trend for Mahogany .......................................................................................... 23
Figure 20: Price trend for Kirundu ............................................................................................... 23
Figure 21: Timber in the Construction Sector Index ................................................................... 26
Figure 22: Round wood consumption 2003 – 2008 .................................................................... 27
Figure 23: Projection of timber volume demand and supply for different recovery rates for the
year 2030 ..................................................................................................................................... 29
Figure 24: Plantation area needed to sustainably cover the timber demand based on the
predicted demand for 2030 ........................................................................................................ 29
Figure 25: Veneer trade data for Uganda 2007 - 2009 ............................................................... 32
Figure 26: Plywood trade data for Uganda 2007 - 2009 ............................................................. 32
Figure 27: Average values of for plywood imports and exports 2007 - 2009 ............................. 33
Figure 28: Major regional trade partners for Plywood ............................................................... 33
Figure 29: Particle board trade data for Uganda 2007 - 2009 .................................................... 34
Figure 30: Fibre board trade data for Uganda 2007 - 2009 ........................................................ 34
Figure 31: Carpentry and joinery trade data for Uganda 2007 - 2009 ........................................ 35
Figure 32: Major trade partners for carpentry and joinery products ......................................... 35

Final report SPGS Market Study Page III
Tables
Table 1: Species names ................................................................................................................ IV
Table 2: Current retail prices for selected species and sizes ...................................................... 24
Table 3: Estimated future demand for saw logs at 20% recovery rate ....................................... 28
Table 4: Demand vs. supply scenarios at different recovery rates in 2030 ................................ 28
Abbreviations
AG Aktiengesellschaft - German for stock-based company
AS Aksjeselskap - Norwegian for stock-based company
CFR Central Forest Reserve
CIF Cost Insurance Freight
CSI Construction Sector Index
DRC Democratic Republic of Congo
EU European Union
FAO Food and Agriculture Organization
FOB Free on Board
GDP Gross Domestic Product
GR Green Resources
HS Harmonised Trade System
Ltd. Limited Company
NCT Natal Cooperative Timber
NFA National Forestry Authority
NFC New Forests Company
NHCC National Housing and Construction Corporation
SPGS Sawlog Production Grant Scheme
SUB Sustainable Use of Biomass
UGX Uganda Shilling
UIA Uganda Investment Authority
UNRA Uganda National Roads Authority
URA Uganda Revenue Authority
USD United States Dollar

Final report SPGS Market Study Page IV
List of species names
Table 1: Species names
Name as in report Trade name(s) Scientific name(s)
Cypress Cypress Cupressus lusitanica
Eucalyptus Eucalyptus Eucalyptus grandis
Kirundu - Antiaris toxicaria
Mahogany African Mahogany Khaya senegalensis, K. nyasica
Musizi Musizi Maesopsis eminii
Mvule Iroko, Mvule Milicia excelsa
Nkalati Mululu, White Star Apple Chrysophyllum albidum
Pine Pine Pinus spp.: P. caribaea,
P. oocarpa, P. patula

Final report SPGS Market Study Page 1
Executive Summary
The timber available in Uganda’s markets at the moment is supplied to a large extend from
natural forests. This is increasingly supplemented from often illegal imports from natural for-
ests in neighbouring countries in particular the Democratic Republic of Congo and legal im-
ports from e.g. South African plantations. Plantation species like pine and eucalypts are har-
vested in the few remaining mature plantations on Central Forest Reserves (CFR) established
more than 30 years ago.
The establishment of commercial timber plantations encouraged by the Sawlog Production
Grant Scheme started in 2004. At the same time the National Forestry Authority resumed
planting in CFR’s. Today approximately 40,000 hectares of plantations exist. These plantations
are spread throughout the country. More than 60 percent of the plantations are privately
owned, having an average size of less than 500 hectares. This fragmentation complicates plant-
ing and marketing efforts. This is further exaggerated by the fact that reliable market informa-
tion is restricted and hard to come by limiting investments within the sector.
Based on today’s plantation area of approximately 40,000 hectares, planting plans of investors
under the SPGS grant scheme and applying Alders (2003) model for pine assuming medium site
qualities approximately 900,000 cubic meters of round wood can be expected annually be-
tween 2025 and 2032.
Statistics from the Food and Agriculture Organisation and the Uganda Revenue Authority re-
port that Uganda imported approximately 13,000 cubic meter of round wood and 1,000 cubic
meter of sawn timber in 20081. Timber is mainly sourced from Kenya, Tanzania and South Af-
rica for plantation species and DRC for native hardwoods. Due to the financial crisis imports
dropped significantly between 2008 and 2009. Imports of other wood products such as veneer,
plywood, fibre and particle board are steadily increasing, signalling shortages in solid timber
and the resulting substitution. Exports of Ugandan made wood products to neighbouring coun-
tries are at the moment insignificant with the exception of poles. However, in the future, with
better and a wider variety of processing technologies markets in neighbouring countries have a
lot of potential especially for reconstituted and value added products.
Species traded foremost are cheaper timbers mainly used in construction: pine, eucalypt and
Kirundu; the much more expensive native hardwoods such as Mahogany, Mvule and Nkalati
are used for furniture and interior construction.
The overall price trend for these timbers has remained stable. However a large drop occurred
at the end of 2008, coinciding with the financial crisis. It is likely that prices will eventually
reach their former high level with the economy once more picking up speed.
Timber is sourced through retailers, saw millers and in a few cases directly from company
owned forests. Vertical integration, combining the different stages, is common because it im-
proves procurement security and increases profit margins.
1 Assuming an average wood density of 0,75 g/cm³.

Final report SPGS Market Study Page 2
The most important criteria when buying timber are:
Availability,
Customer preferences,
Durability and
Workability.
Due to difficulties in timber procurement, quality is still not an important criteria. Quality is
largely determined by absence of fungi, cracks and insect attack. However, quality sawn timber
gets a better price when purchased by large processing companies. At small retail level no
price differences were apparent.
Today the vast majority of the timber produced in Uganda is processed and consumed in
Uganda. Export quantities for all timber and timber products are low. This shows the high de-
mand of wood based products which cannot be satisfied from local sources only.
Additionally recovery rates (when converting round wood to sawn timber) are rather low with
20 percent only, owing to the employment of rather outdated technology. This has a huge
impact on the volume of round wood consumed and subsequently plantation area needed.
Assuming a conservative growth rate of the timber demand of three percent and a recovery
rate of 20%; the demand is expected to be approximately 2.5 million cubic meter of round
wood in 2030. Despite the fact that plantation timber supply peaks in 2030 it will not be able
to meet this demand, leaving a deficit of approximately 800,000 cubic meter round wood.
However, provided that recovery rates can be improved a lot within the next 20 years going up
to 40% a surplus of approx. 400,000 cubic meters could be achieved assuming the same plan-
tation area. To cover the timber needs sustainably by 2030 under a business as usual scenario
14,000 ha must be established annually.
It is apparent that many of the findings of the previous timber market study (UNIQUE, 2005)
still hold true.
The timber value chain is characterised as a seller’s market and still dominated by price.
Due to the timber shortage even poor quality timber sells quickly.
Vertical integration as a counter strategy is common and
Because of the growing timber shortage there is an increasing trend for substitution.
Improvement can be seen in the successful implementation of commercial timber plantations
that will relieve the timber shortage partially in the far future.
Recommendations
The findings in the report clearly indicate the need:
For continued plantation establishment and
To encourage local and foreign investment into processing plants with better technologies
that will increase recovery rates and use otherwise wasted wood.
1. Further support for planters and the wood processing industry should be provided in order
to create a sustainable and viable forest sector.
2. The SPGS cluster approach should be refined and the data base for yield prediction im-
proved in order to be able to make more accurate predictions about where and when as

Final report SPGS Market Study Page 3
well as how much timber will be available. Well founded predictions like that will help to
encourage investment into the processing sector.
3. Market transparency should be improved, for example with regular reports as envisioned
by SPGS (Timber Market section in the quarterly published SPGS newsletter). This will pro-
vide investors with the necessary information for sound business planning.

Final report SPGS Market Study Page 4
1 Introduction Early 2005 the Sawlog Production Grant Scheme (SPGS) commissioned a study (UNIQUE 2005)
to assess the value chain for timber and timber products in Uganda. One of the main findings
of this study was that there is a lack of data on market structure, prices and volumes traded
along the value chain which are necessary to make informed investment decisions in the for-
estry and timber sector. To justify investments in both forestry and the following processing
industry including new technologies it is important to improve market transparency. This study
also indicates that there is a growing understanding for timber quality, especially among tim-
ber dealers and upper price segment furniture producers.
SPGS perceived a need to update the previous findings and to develop a timber market moni-
toring system to:
Provide the private sector with up-to-date market information on a quarterly basis.
Help to attract foreign investment in the forestry and wood processing sector.
To that end UNIQUE:
Analysed the timber supply in Uganda (chapter 2),
Identified investors information needs (chapter 3)
Analysed timber trade within the region (chapter 4),
Conducted an end user market analysis (chapter 5) and
Developed a regional timber demand and supply scenario (chapter 6).
Additionally
Guidelines for the market survey were developed,
SPGS staff trained in investigation and evaluation of relevant data and
A template for the quarterly market report was designed.

Final report SPGS Market Study Page 5
2 Supply
2.1 Plantation estate
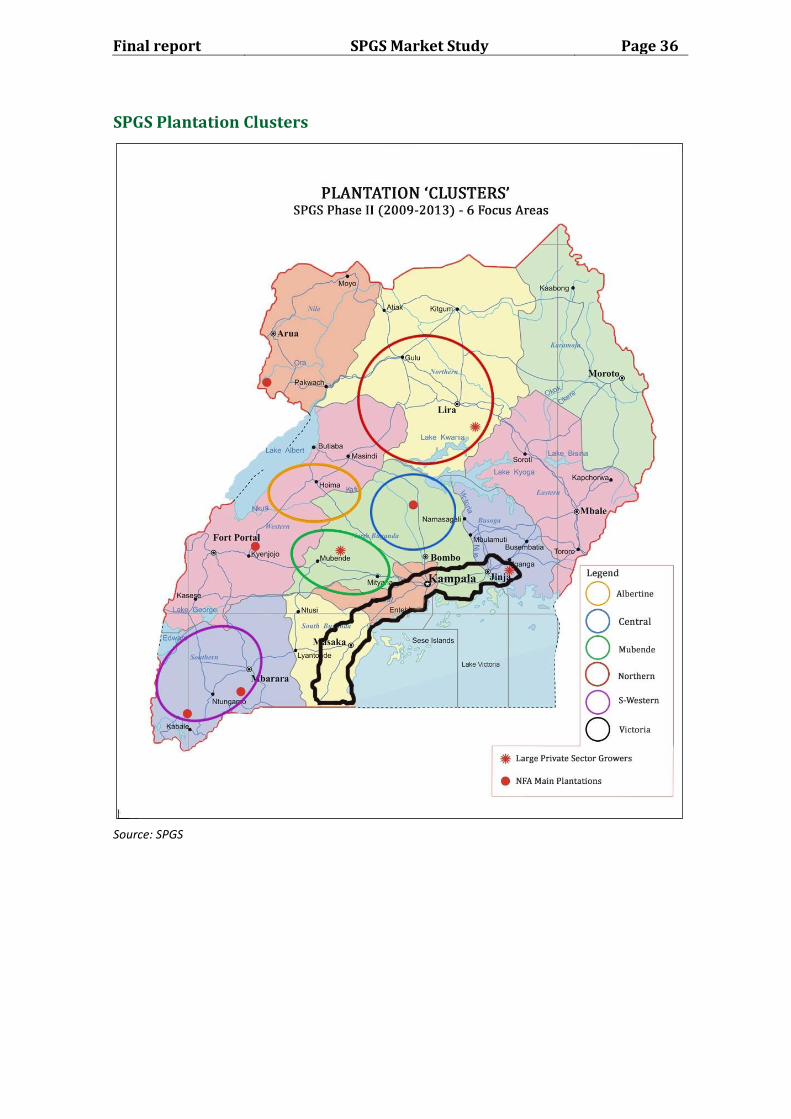
The Sawlog Production Grant Scheme (SPGS) has identified six plantation clusters (see Annex)
which represent focus areas and are based on number of planters and area under plantation.
For the purpose of this study we have kept this approach and will reflect our findings as much
as possible on cluster level.
Approximately 40,000ha of commercial plantations have been established since 2000 in
Uganda. Figure 1 shows the area planted annually for clusters. Planting has increased steadily
since 2004, with a recent peak in 2008.
Figure 1: Plantation area for clusters and years
Plantations are established mainly by private planters (approx. 24,000ha) and by the National
Forestry Authority (NFA) (approx. 16,000ha)2. Many of the private planters are aggregated
under the SPGS. Additionally many very small to small plantations exist throughout the coun-
try. The extent of these woodlots is unknown.
The main species planted are Pine and Eucalyptus. At the moment of the study the contribu-
tion of each species to the entire area under plantation was unknown.
2 The number for area under plantation provided by the NFA may include plantations established by
private planters on Central Forest Reserves. Subsequently the estimate of the total forest plantation area could be too high.

Final report SPGS Market Study Page 6
Private planters can be roughly divided into three categories by the area planted. Small ones
own plantations of less than 100ha, medium sized planters manage up to 500ha and larger
planters are above that. Large planters manage most of the land under plantation (41%),
closely followed by medium sized planters (37%) (see Figure 2). Small planters contribute with
only 22%. Figure 3 illustrates how these planters are distributed within the country. No single
region with especially many small or only big planters can be identified. The cluster with most
of the bigger planters is Mubende, which coincides with it also being the cluster with the larg-
est plantation area (see Figure 1).
Figure 2: Proportion of different plantation sizes on area under commercial plantation
Figure 3: Distribution of planters of different size over clusters
37%
41%
22%
> 500 ha 100 < x < 500 ha < 100 ha

Final report SPGS Market Study Page 7
Major investors in Uganda’s plantation industry are:
Global Woods/Sustainable Use of Biomass: GW AG with its subsidiary Sustainable Use of
Biomass (SUB) Ltd. is counted among the big five plantation companies in Uganda because
of its potential area of 8,000 ha in one CFR. Located in Kikonda CFR it encountered a simi-
lar situation as its competitors in having small remnants of old pine stands on its area,
which by now are almost completely harvested.
Green Resources: GR AS, a Norwegian/British company, has various subsidiaries in
Uganda, namely Busoga Forest Company Ltd. and a recent takeover of the operations of
Deutsche Forst Consult Ltd. expanded its plantation area in Bukaleba CFR. Another interest
is the Norwegian Afforestation Group AS within Kachung CFR in Dokolo District, Northern
Uganda.
The company has a mix of green field pine afforestation and reforestation on Central For-
est Reserves amounting to a potential area of 12,000 ha. The expansion of their plantation
area coincides like all post-2004 plantings in Uganda with a plantation subsidy from the
SPGS.
National Forestry Authority: The NFA’s plantation activities are highly dependent on do-
nor inputs. Mainly Norwegian and World Bank money is financing the institution at the
moment. The planting figure in 2005 was quite high as NFA was inundated with EU donor
funding which phased out in 2007 (planting areas Rwoho and Katuugo Central Forest Re-
serves (CFR)). Since then NFA had to find alternative sources of income and as a plantation
owner took charge of the last existing timber supply possibilities to raise revenue. Low
volumes of pine timber will come online again 2012-2015 from plantations that were
planted in the 1990s. Unfortunately the quality is extremely poor due to substandard seed
and weeding.
New Forest Company: NFC Ltd., a British owned plantation company came into the planta-
tion market in 2006 after lengthy land negotiations. They concentrate on pine but plant
Eucalypts on very good sites for poles and timber. Their team has established sizeable
plantations within the last three years mainly in Central Uganda (Namwasa and Luwunga
CFR’s). NFC is trying actively to acquire more land for plantation establishment. At the
moment they have a potential area of 20,000 ha in Uganda.
NFC is not supplying any timber into the market at the moment, but their plantations are
expected to contribute to the market with poles and larger thinnings in 2016.
NFC established a pole treatment plant which started working in 2010.
Nileply: Nileply is in the unique situation of having already a secondary processing plant in
Uganda. At the moment Nileply is sourcing Eucalyptus peeler logs from as far as Lendu CFR
in Northern Uganda close to the DRC border and plywood raw material from any possible
source within Uganda to feed its Jinja plant. Nileply wants to be self-sufficient by 2020
sourcing from its own plantations. The company has had numerous problems with political
interference in its plantations on CFR, mainly encroachment issues and arson. Nileply
sourced over 25,000 ha of land part of which are / will be afforested.
2.2 Supply projections
Due to the fact that plantation establishment has restarted only in 2004 after a long period of
neglect the supply of cheap timber will come to an end within a few years. Mature pine planta-
tions in Uganda are limited, with the last ones being harvested at the moment. The NFA plans

Final report SPGS Market Study Page 8
to establish 2,500ha each year distributed over core CFR’s (Lendu, Abera, Opit, South Busoga,
Mafuga, Rwoho, Muhangi and Bugamba). However in recent years this target could not be met
due to monetary constraints (personal communication NFA, 2010). Private planters with the
SPGS grant scheme plan to establish approx. 15,000 ha more until 2012 (as of SPGS database
May 2010). However, actual plantation establishment can differ substantially from the pre-
dicted figures; numbers need to be updated annually.
Figure 4 provides an overview of the merchantable timber volume that can be expected in the
future. For this the following assumptions have been made:
Rotation period: Assuming that the majority will be Pine plantations (rotation period 20-
25 years) with comparatively few Eucalyptus timber plantations (rotation period 12-15
years) the average rotation period for timber plantations is assumed to be 20 years.
Thinning regime: It is assumed that stands will be thinned according to SPGS recommen-
dations (three thinnings of each approximately 35% until year 12).
Harvesting volume: Based on available growth tables (Alder et al., 2003) for pine and
some risk adjustments the harvestable volume at the end of the rotation period is esti-
mated to be an average of 200 m³ per hectare assuming a medium site index of 14. Poten-
tial on-site harvesting losses e.g. from poor felling practices are not considered.
The figure below is based on the already existing plantations and predictions for future plant-
ing of SPGS clients until 2012. NFA figures are incorporated only until the first planting season
of 2010. The downward trend from 2031 onwards is thus explained and will likely (with con-
tinued plantation establishment) not take place in reality. As emphasized by the “Total” vol-
ume bars the wood supply will not be steady but shows large fluctuations of up to one million
cubic meters between following years. These fluctuations in supply will either lead to price
signals indicating market saturation or else plantation owners in a given region can coordinate
their respective harvests by harvesting earlier or postponing harvests accordingly.
Figure 4: Expected harvestable volume per cluster based on planted areas

Final report SPGS Market Study Page 9
The predicted supply from plantations will peak at around 2.4 million cubic meters in 2030. The average harvestable volume is 1.3 million cubic meters between 2025 and 20323. Assum-ing average harvesting (damage, inefficient harvesting techniques) and transport losses (dam-age, theft) of around 30% this results in around 0.9 million cubic meters on average and 1.7 million cubic meters at peak of saw logs available for sawmilling.
3 Plantation establishment became substantial only in 2005.

Final report SPGS Market Study Page 10
3 Investor information needs
Plantations in Uganda are dominated by small and medium sized growers who comprise al-
most 60% of the land under commercial plantation. Plantations of all sizes are distributed
evenly throughout Uganda, making planting efforts fragmented (see Figure 2 and Figure 3).
The consequences for the timber market are envisaged to be either a collective marketing
scheme like Natal Cooperative Timber (NCT) in South Africa or an all-for-themselves buyers
market as current information inequities will persist in later scenarios. A possible scenario is
that small and medium growers in a certain location band together like the 2,000ha plus
“Mubende group” which consist of high profile individuals who planted on two adjacent CFR’s
and private land.
Information on timber demand and market trends is researched by the mother companies of
large scale investors and integrated accordingly into their business models and plans. Contrary
to them medium and small sized planters usually possess very little reliable market informa-
tion. According to UNIQUE (2010a) they are in particular interested on markets for thinning
products and in how they could possibly profit by adding further value to their products, e.g.
by incorporating harvesting and sawmilling.
Investors should be informed on:
Major timber users/processors and their requirements,
Price trends for different products throughout the value chain,
Profit margins throughout the value chain,
Vertical and horizontal integration and
Price parameters influenced by silviculture (esp. pruning).

Final report SPGS Market Study Page 11
4 Uganda regional timber trade
4.1 Trade with round wood
Ugandan export of round wood timber is banned (ministerial ban on timber export imposed in
1992) in order to avoid depleting the indigenous forests. However, data from the Uganda
Revenue Authority (URA) shows higher round wood exports than imports (Figure 5). This posi-
tive trade balance for round wood may result from re-exports of round wood imports, using
Uganda as a transit country. Round wood imports that remain in Uganda for further processing
can be distinguished into two major segments:
Tropical hardwood imports. These imports are mostly illegal and serve either the informal
markets or the high value segments (e.g. Mahogany).
The second segment is Conifer and Eucalypt round wood (also poles) coming from planta-
tions. These imports serve the same markets as the Ugandan plantations do, thereby im-
port of Pine timber is very limited.
There is a significant difference between import and export values for round wood. One rea-
son for this difference is that imports are recorded at Cost Insurance Freight (CIF) prices and
exports are recorded at Free on Board (FOB) prices and are therefore up to 40% less. Further-
more, round wood imports comprise treated timber and high value species, whereas exports
consist mainly of untreated round wood of small dimensions.
Figure 5: Round wood trade data 2007 – 2009 for Uganda
Round wood (HS 4403) trade data for Uganda 2007 to 2009 (Source: URA 2010)
Round wood trade data from the Food and Agriculture Organization (FAO) (Figure 6 and Figure
7) differs from URA data (Figure 5). The variations are basically caused by delayed recordings
of trade volumes, resulting in shifts of traded volumes between years (e.g. imports recorded
by FAO in 2007, partially occur in URA data for 2008). However, if corrected the traded vol-
umes are corresponding.
Export volumes of round wood (Figure 6) are mainly constituted of non-coniferous species,
whereby tropical hardwoods (indigenous species) are not of significant weight. The majority of
exports are made up of exotic hardwood species, i.e. Eucalyptus. The export of round wood
-
2,000,000
4,000,000
6,000,000
8,000,000
10,000,000
12,000,000
14,000,000
16,000,000
Import Values (USD) Import Quantities (kg) Export Values (USD) Export Quantities (kg)
2007 2008 2009

Final report SPGS Market Study Page 12
under this classification has increased rapidly since 2006 to around 15,000m³ in 2008. Conifer-
ous round wood exports have also grown with a growth rate of almost 200% from 2007 to
2008.
Figure 6: Industrial round wood exports according to species 2003 - 2008
FAO data on Ugandan industrial round wood exports 2003 – 2008 in m³ (Source: FAOStat 2010)
Industrial round wood imports (Figure 7) comprise mainly conifers with a recent peak in
2007/2008. Round wood trade in the region is heavily affected by illegal imports from
neighbouring Democratic Republic of Congo (DRC). Thus, official import of hardwood species
competes with illegally cut hardwoods from natural forests. Therefore official import figures
remain relatively low (around some hundred tonnes annually) and most likely don’t reflect
actual imports.
Within a study conducted by Forest Monitor (2007), the major flows of timber and wood
products in the great lakes region were compiled considering illegal timber trade from DRC.
The information indicates that about 40,000m³ of round wood are imported to Uganda, of
which 20,000m³ are in transit to Kenya and others. That means that 20,000m³ remain in
Uganda for further processing (which is actually more than double the volume that has been
imported officially in the peak year 2007/2008). The economic implications of illegal timber
trade are widely known: negative impact on price level, which indirectly have impact on labour
wages, losses to national revenue authorities and negative economic effects of environmental
damages caused by illegal logging.
The remarkable peak of round wood imports in 2007/2008 (Figure 7 and Figure 8) cannot be
explained definitely. Since exports in these years have also increased significantly, the high
import figures may be caused by transit trade through Uganda to other destinations.
-
2,000
4,000
6,000
8,000
10,000
12,000
14,000
16,000
2003 2004 2005 2006 2007 2008
Export coniferous round wood (m³)
Export non-coniferous round wood (m³)
Export tropical hardwood round wood (m³)

Final report SPGS Market Study Page 13
Figure 7: Industrial round wood imports according to species 2003 – 2008
FAO data on Ugandan industrial round wood imports 2003 – 2008 in m³ (Source: FAOstat 2010)
The main countries of origin for industrial round wood imports to Uganda are the direct
neighbours (Kenya and Tanzania) as well as South Africa (Figure 8). Imports from all three
countries have increased over the last years, with South Africa having reached an all time high
in 2008 with more than 7,000 tons of round wood exported to Uganda.
Figure 8: Countries of origin of industrial round wood imports 2004 - 2008
Major source countries of industrial round wood imports 2004 – 2008 in tons (Source: UN COMTRADE data 2010)
-
1,000
2,000
3,000
4,000
5,000
6,000
7,000
8,000
2003 2004 2005 2006 2007 2008
Import coniferous round wood (m³)
Import non-coniferous round wood (m³)
Import tropical hardwood round wood (m³)
0
1,000
2,000
3,000
4,000
5,000
6,000
7,000
8,000
2004 2005 2006 2007 2008
Kenya South Africa Tanzania

Final report SPGS Market Study Page 14
4.2 Trade with poles
In recent years Uganda has increased its exports of poles to the neighbouring countries (see
Figure 9) peaking at an export volume of more than 1,400 tons in 2008, while South Africa’s
role as major supplier for poles for Ugandan consumers has significantly decreased. The major
outlet for Ugandan poles is Kenya. Other destinations are not yet of importance. This export
trend is positive since plantations in Uganda will be able to produce for foreign markets in the
years to come.
Figure 9: Trade with poles 2006 – 2008: Major trade partners
Major trade partners for poles 2006 to 2008 in tons (Source: UN COMTRADE data 2010)
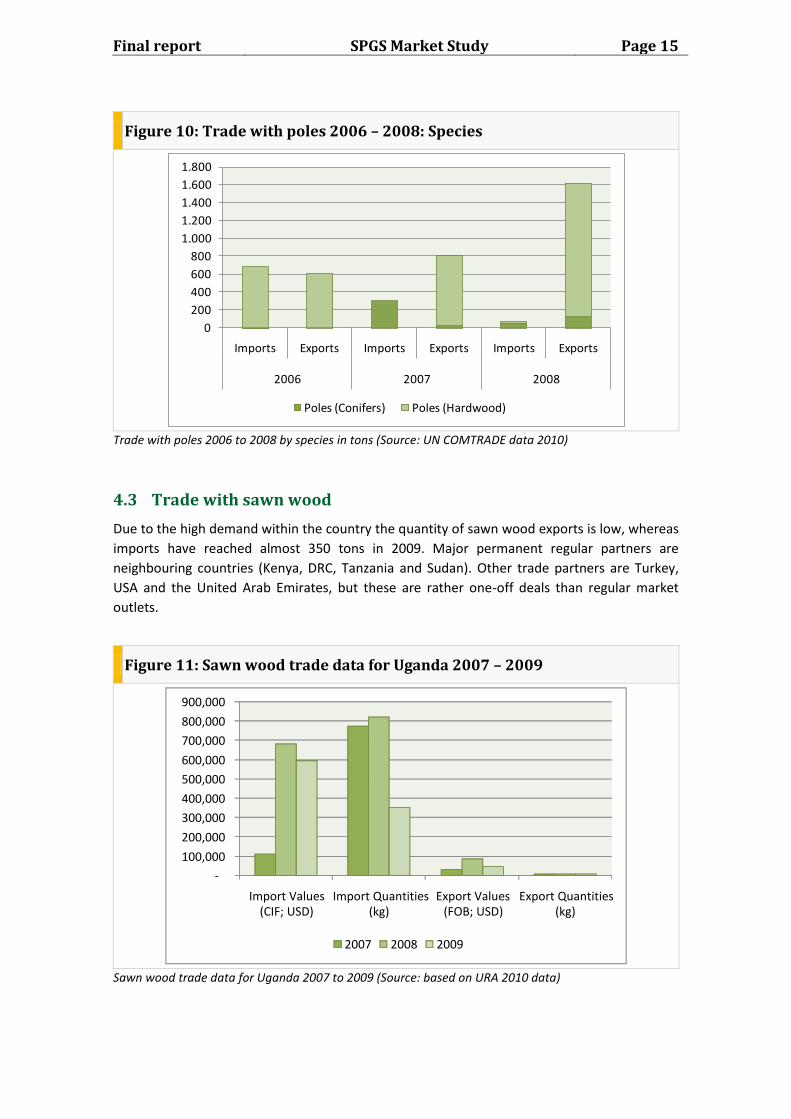
Overall, hardwood poles are dominating Ugandan exports, while pole imports in 2007 and
2008 consisted mainly of conifers (Figure 10).
0
200
400
600
800
1.000
1.200
1.400
1.600
1.800
Imports Exports Imports Exports Imports Exports
2006 2007 2008
South Africa Kenya Others
Final report SPGS Market Study Page 15
Figure 10: Trade with poles 2006 – 2008: Species
Trade with poles 2006 to 2008 by species in tons (Source: UN COMTRADE data 2010)
4.3 Trade with sawn wood
Due to the high demand within the country the quantity of sawn wood exports is low, whereas
imports have reached almost 350 tons in 2009. Major permanent regular partners are
neighbouring countries (Kenya, DRC, Tanzania and Sudan). Other trade partners are Turkey,
USA and the United Arab Emirates, but these are rather one-off deals than regular market
outlets.
Figure 11: Sawn wood trade data for Uganda 2007 – 2009
Sawn wood trade data for Uganda 2007 to 2009 (Source: based on URA 2010 data)
0
200
400
600
800
1.000
1.200
1.400
1.600
1.800
Imports Exports Imports Exports Imports Exports
2006 2007 2008
Poles (Conifers) Poles (Hardwood)
-
100,000
200,000
300,000
400,000
500,000
600,000
700,000
800,000
900,000
Import Values (CIF; USD)
Import Quantities (kg)
Export Values (FOB; USD)
Export Quantities (kg)
2007 2008 2009

Final report SPGS Market Study Page 16
Overall analysis of URA data shows that import of sawn wood has significantly dropped by
more than 50% in 2009 coming from more than 800 tonnes in the years before (Figure 11).
Price levels for imported and exported sawn wood have converged (Figure 12). Both develop-
ments are indicators that the demand for sawn wood has decreased in 2009, which is certainly
an effect of the international economic crisis.
Figure 12: Price levels for sawn wood trade 2007 - 2009
Price levels for Ugandan sawn wood (HS 4407) imports and exports 2007 to 2009 (Source: calculated based on URA 2010 data)
Pine and eucalypt sawn wood products are hardly identified in the trade statistics as such.
However, rough sawn wood (not moulded, not treated, not kiln dried; see Figure 13) is im-
ported at an average value of around 150 USD (CIF) per ton (or approx. USD 100 per m³)4.
Prices have slightly increased over the past three years. The price level for imported sawn
wood is significantly below the market prices of Ugandan produced sawn timber (see Table)5.
Imported quantities dropped from almost 800 tonnes in 2007 to about 200 tonnes in 2009
(Figure 13), which might be an effect of reduced activities in Uganda’s construction sector but
could also have been caused by increased supply from Ugandan sources.
Sawn wood exports are not of any importance so far. However, in 2008 exports cumulated
with an increasing number of destinations. Quantities of several tones were exported to DRC,
Kenya, Tanzania and Sudan. Other destinations included China and the United Arab Emirates.
4 Assuming an average wood density of 0,7 g/cm³ of air dried timber.
5 Assuming that 20-30% of import value (CIF) is transport. The FOB price in the country of origin is be-
tween 70-80 USD / m³. Exchange rate UGX 100,000 = USD 44 (www.oanda.com Aug – Sep 2010)
-
200
400
600
800
1.000
1.200
1.400
1.600
1.800
2.000
2007 2008 2009
Import value per ton (CIF; USD) Export value per ton (FOB; USD)

Final report SPGS Market Study Page 17
Figure 13: Import quantities and average values of rough sawn wood 2007 - 2009
Quantities and price levels for Ugandan (HS 4407) imports of minor sawn wood products (untreated, not dried) 2007 to 2009 (Source: calculated based on URA 2010 data)
Imported sawn wood mainly comes from the neighbouring countries of Rwanda, Sudan and
DRC (see Figure 14). Kenya and Tanzania only export marginal quantities of sawn wood to
Uganda.
Figure 14: Countries of origin for sawn wood 2005 to 2008
Countries of origin of imported sawn wood (in tons) 2005 to 2008 (Source: UN COMTRADE data 2010)
Major trade partner for sawn exports from Uganda has been Kenya (see Figure 15) that has increased imports significantly since 2004. Other destinations for Ugandan sawn wood are Rwanda, Sudan and others. However, these countries hardly reach significant volumes.
0
100
200
300
400
500
600
700
800
900
2007 2008 2009
Import value exotic sawnwood not moulded, not kiln dried (USD/t)
Import quantities exotic sawnwood not moulded, not kiln dried (t)
-
0,50
1,00
1,50
2,00
2,50
3,00
3,50
4,00
2005 2006 2007 2008
DRC Rwanda Sudan

Final report SPGS Market Study Page 18
Figure 15: Kenyan round wood imports from Uganda 2004 - 2008
Kenyan sawn wood imports (in tons) from Uganda 2004 – 2008 (Source: UN COMTRADE data 2010)
4.4 Other wood products
4.4.1 Veneer
Imports of veneer sheets used in plywood production and furniture manufacturing have in-
creased by more than 450% since 2007 and reached approx. 78 tons in 2009 (Annex: Figure
25). The majority of the imported veneer is processed in Uganda. Export figures are volatile
and are constituted of re-exports and small exports of Ugandan produced veneer.
The significant increase in veneer imports indicate increasing demand on the Ugandan market,
driven by Ugandan based manufacturers of plywood and furniture. This sector does not seem
to be affected by the economic crisis as much as the construction sector.
4.4.2 Plywood
Uganda’s Plywood imports have increased by more than 100% within the last three years
reaching more than 2,000 tonnes in 2009 (Annex: Figure 26). Exports are also increasing;
driven by – amongst other traders – Ugandan based Nileply Ltd. which is increasingly entering
the markets of the neighbouring countries (mainly Sudan, DRC and Kenya).
Price levels differ significantly between imported and exported plywood (Annex: Figure 26 and
Figure 27). While exported plywood was about 4,000 USD per tonne, the plywood imports
hardly reached 1,000 USD per tonne. However, price levels for exports have significantly fallen
since 2007, which either may be a consequence of decreasing demand (caused by the eco-
nomic crisis) or by increased competition from imported plywood from Asia.
Major trade regional partner for plywood is Kenya (Annex: Figure 28). Almost all plywood im-
ports originate from there. Imports from Kenya were stable until 2006 and have increased
significantly (almost 300%) since 2007. However, whether the plywood imported from Kenya is
produced in-country or imported from overseas is not clear. In terms of exports, Kenya, Sudan
0
10
20
30
40
50
60
70
80
90
2005 2006 2007 2008

Final report SPGS Market Study Page 19
and DRC are the important destinations, with DRC being the most important amongst them.
However, exports to DRC have fallen over the past years.
4.4.3 Particle and fibre boards
Particle and fibre boards are highly demanded products in Uganda. Imported quantities of
particle boards reached almost 2,500 tonnes in 2009 (Annex: Figure 29). Development of im-
port quantities has remained stable over the past three years. Fibre board imports were about
2,800 tonnes in 2009 coming from 1,200 tonnes in 2007 (Annex: Figure 30). Until 2009 exports
of both product groups were not significant. However, in 2009 a sharp rise in particle board
exports was recorded. If this is not a false recording in the statistic database, this can only be
re-exports to neighbouring countries.
4.4.4 Carpentry and joinery
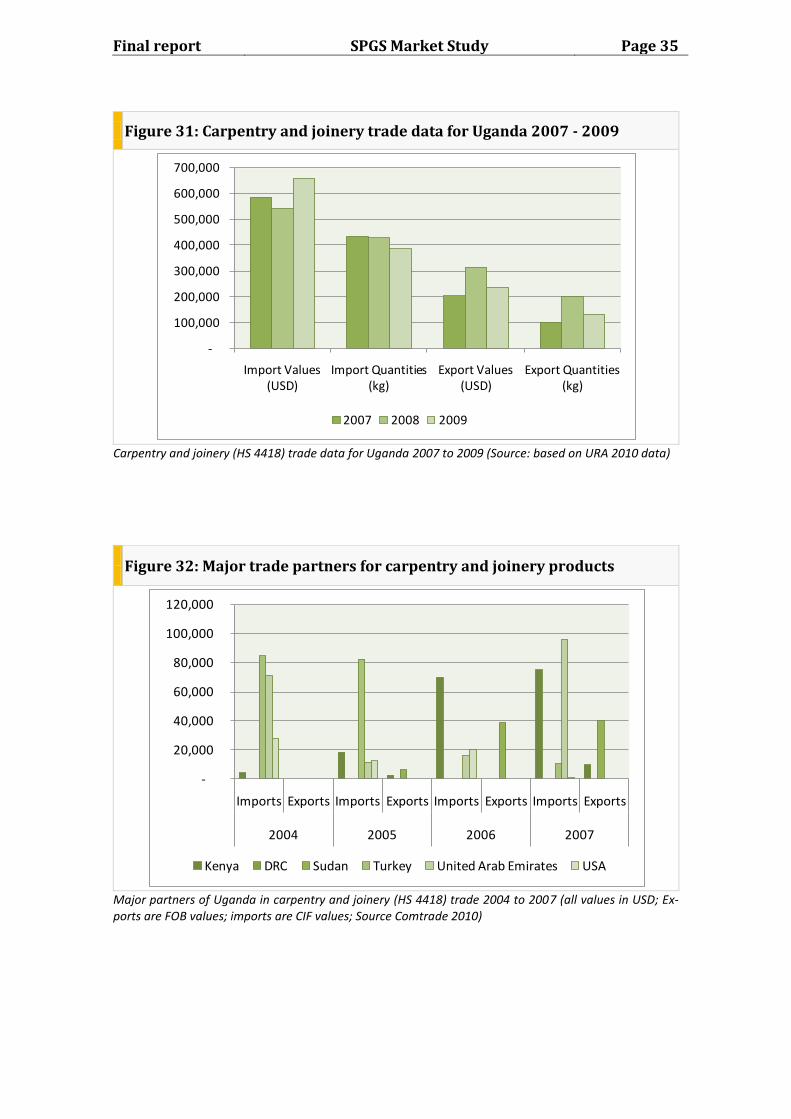
Carpentry and joinery products, mainly builders’ joinery / carpentry, doors and windows are
important trade items. Although the trade balance for Uganda is negative, this product group
is of special importance for local value adding, offering employment and income for many
small and medium enterprises in Uganda. Import values and quantities are more or less stable
since 2007. Export values and quantities vary between 100 and 200 tonnes and 200,000 and
300,000 USD respectively. (Annex: Figure 31)
Major trade partners in terms of imports are Kenya, Turkey and the United Arab Emirates. In
terms of exports Kenya, DRC and Sudan are the most important destinations for Ugandan join-
ery / carpentry products. (Annex: Figure 32)
4.5 Summary and discussion
International trade statistics show that the demand for timber and wood based products in
Uganda is very high and cannot be satisfied with the resources available internally. The notable
exception is poles. Here export figures are rising while import figures show a decline. However,
round wood (HS4403) trade figures may to a certain extend include poles (HS4404) depending
on how URA classified imports and exports.
Imports of raw products (round wood, poles and sawn wood) come from mainly DRC, Sudan
and South Africa. Exports, again with the exception of poles to Kenya, are negligible. More
advanced products like veneer, plywood, particle and fibre board, carpentry and joinery have
stronger export markets. Importing countries are especially Kenya, Sudan and DRC. Imports
come mainly from Kenya.
Imports of plywood, particle and fibreboard have risen substantially during the last years sug-
gesting that substitution of timber with these reconstituted wood products is taking place.
Trade values per unit are significantly higher for carpentry, particle and fibre board and ply-
wood than they are for sawn timber. This in combination with the export ban for round wood,
comparatively low wages in Uganda and high amounts of low value raw materials available
(thinnings, off cuts, shavings and saw dust from low conversion technology) needed for their
production makes a strong case for investment in production facilities that can supply the na-
tional and regional markets. Regional markets like Kenya, Tanzania, Sudan, DRC and Rwanda

Final report SPGS Market Study Page 20
should be targeted with processed wood products rather than round wood or sawn timber in
the future.

Final report SPGS Market Study Page 21
5 Market analysis
The market analysis is based on interviews with wholesalers and retailers as well as on expert
judgments of UNIQUE experts.
The market can be stratified by timber volume traded, location of a given business, the end
use the traded timber will see and the grade of vertical integration.
Volume traded: The market is comprised of a multitude of small and medium sized retailers
and workshops and only a few big companies in the furniture and construction sector and at
the moment only one factory producing reconstituted timber products (Nileply).
The quantity of the timber traded in Uganda is unknown, but changes in volume traded are
reflected to a certain extend in prices (see chapter 5.1).
While interviewees are often willing to share the volume of timber used in their businesses,
the actual number of businesses in the market and their respective size in terms of timber
consumption are unknown. Official statistics showing timber movement and use across the
country are scarce, incomplete and difficult to access (e.g. NFA timber movement permits).
Business location: Most of the timber is sourced from the DRC (native species) or CFR’s and
private farms in western and south-western Uganda (native and plantation species). While
timber traders, processers and consumers can be found all over Uganda, most of the timber
traded is used in the bigger population centres like Kampala where much of the economic de-
velopment takes place.
Prices are likely to reflect the proximity and therefore direct accessibility of the resource (de-
mand can be satisfied without intermediaries) as well as transport distances.
At the moment timber prices are expected to rise due to the enforcement of maximum ton-
nage of lorries by Uganda National Road Authority (UNRA). Various sources stated that they
will be able to transport only half to two-thirds of the usual amount of timber with one trans-
port. Price per piece (standard sizes of 4x2x14 or 6x2x14) will likely be increased by UGX 500
up to UGX 1,500.
The higher transport costs will be passed on to the final customer. However, it was also stated
that dealers expect the enforcement to slacken considerably towards the end of the year.
End use: Timber is used mainly in construction, for interior fittings and furniture.
The end use determines species and quality required (see chapters 5.1 and 5.2).
Vertical integration: Businesses can source their timber through intermediaries or directly
from the producer/saw miller. In some cases processors possess their own plantations (e.g.
Nileply) and/or saw mills.
By encompassing operations upstream or downstream along the value chain dependencies on
other actors are minimized thereby reducing transaction costs and increasing the overall profit
margin. The downside of vertical integration is clearly the broadening focus of operations mak-
ing it more difficult to develop core competencies and a clear focus for the business.

Final report SPGS Market Study Page 22
5.1 Retail market
Retailers provide a broad selection of species that are used for carpentry as well as in con-
struction. Pine, eucalypts and Kirundu show quick turnover, while native hardwoods such as
Mahogany, Mvule and Nkalati are used in lesser quantities due to their higher price and differ-
ent use. Figure 16 to Figure 20 show the inflation adjusted retail price trend for some of these
species. The overall trend shows an increase with a sharp drop at the end of 2008. This drop
lags approximately one year behind the height of the worldwide financial crisis and can be
attributed to less investment especially in the housing sector. Only the price of pine seems to
recover since the beginning of 2010.
Asked for their preferences for certain tree species most timber dealers mentioned foreign
species, in particular pine, whereas the carpenters preferred hardwoods. Due to the restricted
availability of the most favoured hardwoods – Mahogany and Mvule – and the resulting high
prices, carpenters often revert to lesser known species like Nkalati. Musizi in contrary was
rarely named. Availability is the main criteria according to which the interviewed people
ranked their preferences for certain wood species. Demand on the market or customer prefer-
ences were just the second most important criteria indicating a strong sellers market and a
resource shortage. Basically all timber – irrespective of species or quality – can currently be
quickly sold. Among the carpenters durability was the most important criteria followed by
workability and customer preferences.
Figure 16: Price trend for Pine for standard sizes
Figure 17: Price trend for Eucalyptus across standard sizes
350000
400000
450000
500000
550000
600000
650000
700000
750000
800000
Q2/3 Q1 Q2 Q3 Q4 Q1 Q2 Q3 Q4 Q1 Q2
2007 2008 2009 2010
12x1x14
4x2x14
6x2x14
UGX/m³
150000
200000
250000
300000
350000
2005 2006 2007 2008 2009 2010UGX/m3
4/6x2x14

Final report SPGS Market Study Page 23
Figure 18: Price trend for Mvule
Figure 19: Price trend for Mahogany
Figure 20: Price trend for Kirundu
Retailers stated that due to the scarcity of cypress, which by now has almost entirely disap-
peared from the market, pine is used as cheap substitute in construction. By now pine is
gradually being replaced by eucalyptus, despite its often inferior characteristics.
The prices provided in Table 2 are retail prices. Retailers also sell timber in large quantities
directly from the saw mill to the buyer. Here no average prices are available. However, as
stated by some retailers the price difference between wholesale and retail is approximately
10%.
600000
650000
700000
750000
800000
850000
900000
Q2/3 Q1 Q2 Q3 Q4 Q1 Q2 Q3 Q4 Q1 Q2
2007 2008 2009 2010
UGX/m3
750000
800000
850000
900000
950000
1000000
Q2/3 Q1 Q2 Q3 Q4 Q1 Q2 Q3 Q4 Q1 Q2
2007 2008 2009 2010
12x2x14
UGX/m³
100000
150000
200000
250000
300000
350000
Q2/3 Q1 Q2 Q3 Q4 Q1 Q2 Q3 Q4 Q1 Q2
2007 2008 2009 2010
12x1x14
UGX/m3
12x2x14

Final report SPGS Market Study Page 24
Table 2: Current retail prices for selected species and sizes
Specie Size Price (UGX)
Per m³ Per piece
Eucalyptus Poles 97,000 2,100
Kirundu 12X1X14 279,000 9,300
Eucalyptus 4X3X14 303,000 10,000
Musizi 12X1X13 409,000 13,500
Pine 6X2X14 459,000 15,200
4X2X14 545,000 12,000
12X1X14 760,000 25,100
Mvule 12X2X13 921,000 60,800
Mahogany 12X2X14 967,000 63,900
Nkalati 12X2X14 1,029,000 68,000
12X1X14 1,211,000 40,000
Quality, other than deviation from standard size, is barely addressed by the retailer, i.e.
through grading of sawn timber. It is up to the customer to select the planks according to his
preferences; the price will be the same.
Adding value by treating or drying timber is not practiced at the retail stage. It is the secondary
processor who will do so or else timber is used in construction without further enhancement.
5.2 Secondary processors
Vertical integration is a business strategy commonly found along the timber value chain in
Uganda. Most of the bigger businesses (revenue above UGX 100 million and / or more than 20
employees) are vertically integrated; some encompassing all stages along the chain. An exam-
ple for horizontal integration – integration of businesses from the same level of the chain, e.g.
two sawmilling companies joining – could not be identified in the course of this study.
The difficulties in accessing resources forced several sawmilling businesses to shift their focus.
Instead of downsizing or even going out of business the more entrepreneurial saw millers di-
versified downstream into furniture production with several businesses realising the growing
potential of the upper quality segment. Additionally, the irregular supply on the market re-
sulted in secondary processors integrating upstream into sawmilling and partly even into for-
estry to secure resource access. The trend, however, clearly points to businesses increasingly
concentrating on secondary processing.
Especially larger companies are often not clearly specialised into either construction or furni-
ture production. Often they will provide the entire work including furnishing the house.
Procurement security in terms of quantity and quality is a major concern of all businesses
commenting. Sourcing is done through retailers or saw millers, or in a few cases from company
owned plantations. Native species mostly come from private forests and are bought through
timber dealers. The most sought after species, Mahogany and Mvule, which are close to deple-
tion in Ugandan forests, are increasingly imported from eastern Congo (DRC) and southern
Sudan. The trade from Sudan is likely to increase in the future because of the improving secu-

Final report SPGS Market Study Page 25
rity situation both in northern Uganda and southern Sudan. Also Sudan has extensive mature
plantations of Teak; the surplus produced will likely go to export markets like Uganda (White,
2008). However, the legal status of those imports remains opaque – especially concerning the
clearance of the timber by the respective authorities in Congo and Sudan since those are still
feeble and unable to control illegal activities. (Tennigkeit, 2005).
The majority of the interviewed companies used internal quality standards to select the tim-
ber. Those standards, however, vary significantly in terms of sophistication and in their influ-
ence on the procurement policy. Some companies source their wood still primarily according
to price just considering basic criteria like: no severe defects (cracks, splits) or widespread
fungi or insect attack. Small businesses often source their wood according to need – based on
actual orders. Other companies give specifications already to the suppliers and hence establish
more long-term relationships. Basic quality control systems are in place. Quality timber is
sourced when available and stored until used.
Overall, the willingness to pay a premium for better and in particular constant quality is there.
There is a clear tendency to establish more long-term relationships to suppliers being reliable
to deliver according to quality specifications. In the upper quality segment relationships be-
tween buyers and suppliers become increasingly more trustful.
Some companies reacted to the increasing difficulties in getting adequate timber by shifting to
wood-based panels (especially chip-boards and fibre-boards) which are imported through
Kenya from South Africa or China. The wood-based panels can be sourced without major diffi-
culties, do have reliable quality standards and are competitively priced.
Companies employ different strategies to deal with difficulties in sourcing timber:
Substitution of pine with low quality hardwoods,
Aggregation of timber from local timber dealers; storage, re-cut and drying is done inter-
nally and
Substitution of timber with other materials.
Price differences between the retail market and wholesale users are small. They are in the
range of 5 – 10% and are influenced by quality requirements.
Timbers used in construction are pine, eucalypts and Kirundu. One company stated interest in
buying cypress when available despite its higher prices because of its superior characteristics.
Hardwoods, in particular Mahogany, Mvule and Nkalati are used for furniture and interior fur-
nishings. Plywood and fibre board are also used increasingly in combination with veneer or
laminate.
The annual consumption figures of construction companies vary significantly depending on
commercial, industrial or housing projects they undertake. The higher the proportion of hous-
ing estates on the books of the construction companies the higher the proportion of high qual-
ity timber needed. Low quality pine timber with the dimension 6x1x14 (feet x inch x inch) is
used and re-used for shuttering in concreting by companies like NHCC.
Figure 21 shows the development of the construction sector index (CSI) for timber since 2008.
While it does not indicate changes in volume or provides prices for different wood products it
can serve as an indicator of the overall price trend for timber since 2006 (the base year). After
a sudden increase in prices at the end of 2008 prices for timber used in the construction sector
have remained stable. The discrepancy to retail prices (which showed a strong downward
trend in early 2009) may be caused by an increase in volume of timber used in construction,

Final report SPGS Market Study Page 26
due to lower prices. Ultimately the CSI can only serve as broad long term indicator but is not
likely to show smaller or short lived changes in the timber market.
Figure 21: Timber in the Construction Sector Index
The percentage above each column shows the increase of timber prices in comparison to the period before. Source: UBOS (2009, 2010)
1% 0%
34%
13% 0% 0% 0% 1%
0
50
100
150
200
250
Q1 Q2 Q3 Q4 Q1 Q2 Q3 Q4 Q1
2008 2009 2010
CSI

Final report SPGS Market Study Page 27
6 Demand and price projections The available data for timber production and consumption in Uganda is fragmented and unre-
liable. Accordingly, it cannot be recommended to develop and use an econometric model to
forecast the future timber demand in Uganda.
When estimating future timber demand in the Ugandan context it is important to use a trans-
parent approach so that, with more precise information, the estimates can be adjusted. The
following parameters are needed to give an estimate for the future demand of saw logs:
Historic round wood consumption: According to FAO data, industrial round wood con-
sumption in Uganda has increased from 2000 to 2008 by around 28%. This is an average
annual increase of 3.5% (Figure 22).
Figure 22: Round wood consumption 2003 – 2008
Industrial round wood consumption in Uganda 2000 to 2008 (Source: FAOstat 2010)
The vast majority of the in-country produced and imported industrial round wood is proc-
essed to sawn timber and finally consumed in Uganda, while the export figures of sawn
timber are very low.
Current annual consumption of sawn timber: FAO in 2005 surveyed the operating pit
sawyers and saw mills in Uganda assessing their production capacities and actual produc-
tion. The study established that about 240,000m³ of sawn timber is produced in Uganda
annually. In 2005 around 1.2 million m³ of round wood were consumed in Uganda, indi-
cating that recovery over all types of sawmills is only 20%.
The FAO figures will be used as starting point for the projection of future timber demand
in Uganda (Figure 22), assuming an average recovery rate of 20%.
Growth rate of sawn timber consumption (linear): The growth of timber consumption is
closely related to the Gross Domestic Product (GDP) growth. In the last 10 years the GDP
in Uganda has increased. (Between 2007 and 2008 by 8% alone.) This growth is expected
to continue in the next years, however at lower rates due to the actual financial and eco-
-
200,000
400,000
600,000
800,000
1,000,000
1,200,000
2003 2004 2005 2006 2007 2008
Consumption coniferous round wood (m³)
Consumption hardwood round wood (m³)

Final report SPGS Market Study Page 28
nomic crisis (GDP of around 6% in 2009). Further, European Studies (UNECE 2005) show
that – with growing maturity of the economy – the average growth in timber consumption
is lower than the average GDP-growth.
For the period between 1993 and 2010 the FAO (2003) estimated an average rate of 4%
growth in sawn timber consumption for Africa. Based on the available data this was
roughly confirmed for Uganda by FALKENBERG & SEPP until 1999.
Substitution effects: With the lack of adequate figures for price elasticity, substitution ef-
fects have to be estimated and figured in. Growing shortage of timber will result in price
increases and strengthen the trend towards substitution. Considering these observations,
the most realistic average growth rates for the next 20 years for sawn timber consump-
tion are estimated to be around 3% annually.
Population growth and forest area decrease: The projection assumption is supported by
the correlation between population growth and forest area in Uganda. ACODE (2007) es-
timated a decreasing forest area per capita from 0.3ha in 1995 to 0.1ha in 2020.
As displayed in Table 3, a demand for saw logs of about 2.5 million m³ can be expected in 20
years time (at an annual growth rate of 3% and assuming a recovery rate of 20%) based on the
assumptions detailed above. The predicted supply from plantations of 1.7 million m³ (year
2030, see chapter 2) will not cover the predicted demand in 2030.
Table 3: Estimated future demand for saw logs at 20% recovery rate (in Mio. m³)
Annual growth rate 2005 2010 2015 2020 2025 2030
1% 1.20 1.26 1.33 1.39 1.46 1.54
2% 1.20 1.33 1.46 1.62 1.78 1.97
3% 1.20 1.40 1.61 1.87 2.17 2.51
4% 1.20 1.46 1.78 2.16 2.63 3.20
5% 1.20 1.53 1.95 2.49 3.18 4.06
This figure changes significantly with higher recovery rates (Table 4). At a recovery rate of 40%
the demand for saw logs is almost half as high (down to 1.25 million m³) as predicted in this
forecast (up to 2.5 million m³). With proper management, usage of more efficient technology
and capacity building the average recovery rate of sawmilling operations in plantations can be
expected to go up to 40% in 2030. Table 4 and Figure 23 show deficit and surplus in terms of
timber volume for the year 2030, when the supply reaches its peak. Increased recovery rates
can significantly contribute to ensured timber supply.
Table 4: Demand vs. supply scenarios at different recovery rates in 2030
Recovery rate Predicted demand
(in m³)
Predicted production from plantations
(in m³)
Surplus / Deficit
(in m³)
20% 2,510,000 1,676,000 -834,000
30% 1,673,333 1,676,000 3,000
40% 1,255,000 1,676,000 421,000

Final report SPGS Market Study Page 29
Figure 23: Projection of timber volume demand and supply for different recovery rates for the year 2030
Figure 24 shows the total area of plantations established that is needed to cover the national
timber demand in 2030 sustainably. At a growth rate of three percent and a recovery rate of
20 % more than 300,000 ha must be established until 2030. That equals more than 14,000 ha
annually when taking into account the already established 40,000 ha of commercial planta-
tions.
Figure 24: Plantation area needed to sustainably cover the timber de-mand based on the predicted demand for 2030
Assuming a rotation period of 20 years, 30% harvesting losses and harvestable volume of 200 m³/ha
0
500
1000
1500
2000
2500
3000
20% 30% 40%
Recovery rate
V in ,000 m³
Predicted demand Predicted production
0
100000
200000
300000
400000
500000
600000
1% 2% 3% 4% 5%
Are
a (h
a)
Growth rate
20% 30% 40%Recovery rate:

Final report SPGS Market Study Page 30
7 Recommendations
The findings in the report clearly indicate the need:
For continued plantation establishment and
To encourage local and foreign investment into processing plants with better technologies
that will increase recovery rates and use otherwise wasted wood.
Therefore we recommend:
1. Further support for planters and the wood processing industry should be provided in order
to create a sustainable and viable forest sector.
Training of investors in plantations and their employees must be kept up and expanded
into related topics such as saw milling techniques and marketing of a variety of timber
products. (See also UNIQUE, 2010a)
Regular networking events that will strengthen regional integration and cooperation of the
sector horizontally and vertically should be initiated with the help of Uganda Timber
Growers Association (UTGA), SPGS and other potentially interested organisations like
Uganda Investment Authority (UIA) and the Private Sector Foundation.
2. The SPGS cluster approach should be refined and the data base for yield prediction im-
proved in order to be able to make more accurate predictions about where and when as
well as how much timber will be available (see UNIQUE 2010b). Well founded predictions
like that will help to encourage investment into the processing sector.
Clusters can be refined according to access roads and already existing secondary industry
or areas where these industries can be established (e.g. considering the often quite high
energy demand). Additionally proximity to trading centres with high demand might be
considered.
This will also enable the UTGA to follow the cluster approach when providing services to its
clients.
SPGS might consider outsourcing data gathering and storage to a third party provider, pro-
vided that SPGS clients will give their consent.
3. Market transparency should be improved, for example with regular reports as envisioned
by SPGS (Timber Market section in the quarterly published SPGS newsletter, see Annex).
This will provide investors with the necessary information for sound business planning.
In the future this can be expanded into a market information system like the South African
Lumber Index, which depends on advertising and subscription. However, at the moment
Uganda’s forestry sector and wood processing industry is likely not ready to incorporate
such a costly tool into their business planning. This will hopefully change when businesses
realize the benefits they can gain from reliable market information.

Final report SPGS Market Study Page 31
8 Literature
ACODE (2007): Wealth Distribution, Poverty and Timber Governance in Uganda. A Case Study
of Budongo Forest Reserve. ACODE Policy Research Series No. 26, 2007 (http://www.acode-
u.org/documents/Timber.pdf)
Alder D., Drichi P., Elungat D., (2003): Yields of Eucalyptus and Caribbean Pine in Uganda.
Uganda Forest Resources Management and Conservation Programme. National Forest Author-
ity, Kampala, Uganda
FALKENBERG, M. and SEPP, S. (1999): Economic Evaluation of the Forest Sector in Uganda: a
contribution to the Forest Sector Review. The Uganda Forest Sector Co-ordination Secretariat,
Republic of Uganda
FAO (2003): Forestry Outlook Study for Africa. Regional report - opportunities and challenges
towards 2020. FAO Rome.
Available online under URL http://www.fao.org/DOCREP/005/Y4521E/Y4521E00.HTM
FAO (2005): Pitsawn timber production in natural forests of Uganda by Odokonyero, G., FAO,
Rome. Available online under URL ftp://ftp.fao.org/docrep/fao/009/a0249e/a0249e.pdf
Forest Monitor (2007): The Timber Trade and Poverty Alleviation - Upper Great Lakes Region,
June 2007. Available online under URL
(http://www.forestsmonitor.org/en/Timber_in_E_DRC_and_S_Sudan)
Tennigkeit T. (2005): Market opportunity investigation in the forestry sector in Southern Su-
dan; Report to the Southern Sudan Revitalisation Project, USAid
White S. (2008): Commercial sawn wood supply and demand in Southern Sudan – recommendations for forest sector planning. Sudan Transitional Environment Program. WINROCK INTERNATIONAL. Available at SPGS
UBOS (2009): Construction Sector Indices. Uganda Bureau of Statistics, Kampala
UBOS (2010): Construction Sector Indices. Uganda Bureau of Statistics, Kampala
UNECE (2005): European forest sector outlook study 1960-2000-2020. Geneva Timber and
Forest Study Paper 20. Available online under URL
http://www.fao.org/docrep/008/ae428e/ae428e00.htm
UNIQUE (2005): Reducing the uncertainty for forest investors in Uganda: Value chain assessment for timber and timber products. UNIQUE forestry consultants, Kampala. Available online under URL http://www.sawlog.ug/downloads/Ugandan%20Timber%20market.pdf
UNIQUE (2010a): SPGS Training Needs Assessment. UNIQUE forestry consultants, Kampala. Soon available online under URL http://www.sawlog.ug/index.php?option=com_content&view=article&id=26&Itemid=71
UNIQUE (2010b): Modelling of forest growth and yield in Uganda. UNIQUE forestry consultants, Kampala. Soon available online under URL http://www.sawlog.ug/index.php?option=com_content&view=article&id=26&Itemid=71
Statistical online sources:
UN COMTRADE data: http://comtrade.un.org/, accessed June 2010
FAOstat 2010: http://faostat.fao.org/site/628/default.aspx, accessed June 2010

Final report SPGS Market Study Page 32
Annexes
Figures for international trade with other wood products
Figure 25: Veneer trade data for Uganda 2007 - 2009
Veneer (HS 4408) trade data for Uganda 2007 to 2009 (Source: based on URA 2010 data)
Figure 26: Plywood trade data for Uganda 2007 - 2009
Plywood (HS 4412) trade data for Uganda 2007 to 2009 (Source: based on URA 2010 data)
-
50,000
100,000
150,000
200,000
250,000
Import Values (USD)
Import Quantities (kg)
Export Values (USD)
Export Quantities (kg)
2007 2008 2009
-
500,000
1,000,000
1,500,000
2,000,000
2,500,000
3,000,000
Import Values (USD)
Import Quantities (kg)
Export Values (USD)
Export Quantities (kg)
2007 2008 2009

Final report SPGS Market Study Page 33
Figure 27: Average values of for plywood imports and exports 2007 - 2009
Average values for Ugandan plywood (HS 4412) trade 2007 to 2009 (Source: calculated based on URA 2010 data)
Figure 28: Major regional trade partners for Plywood
Major regional partners of Uganda in plywood (HS 4412) trade 2004 to 2008 (all values in USD; Exports are FOB values; imports are CIF values; Source Comtrade 2010)
-
1,000
2,000
3,000
4,000
5,000
6,000
7,000
8,000
2007 2008 2009
Import value per tonne (USD) Export value per tonne (USD)
-100,000 200,000 300,000 400,000 500,000 600,000 700,000 800,000 900,000
1,000,000
Imp
ort
s
Exp
ort
s
Imp
ort
s
Exp
ort
s
Imp
ort
s
Exp
ort
s
Imp
ort
s
Exp
ort
s
Imp
ort
s
Exp
ort
s
2004 2005 2006 2007 2008
Kenya DRC Sudan

Final report SPGS Market Study Page 34
Figure 29: Particle board trade data for Uganda 2007 - 2009
Particle board (HS 4410) trade data for Uganda 2007 to 2009 (Source: based on URA 2010 data)
Figure 30: Fibre board trade data for Uganda 2007 - 2009
Fibre board (HS 4411) trade data for Uganda 2007 to 2009 (Source: based on URA 2010 data)
-
500,000
1,000,000
1,500,000
2,000,000
2,500,000
3,000,000
Import Values (USD)
Import Quantities (kg)
Export Values (USD)
Export Quantities (kg)
2007 2008 2009
-
500,000
1,000,000
1,500,000
2,000,000
2,500,000
3,000,000
Import Values (USD)
Import Quantities (kg)
Export Values (USD)
Export Quantities (kg)
2007 2008 2009
Final report SPGS Market Study Page 35
Figure 31: Carpentry and joinery trade data for Uganda 2007 - 2009
Carpentry and joinery (HS 4418) trade data for Uganda 2007 to 2009 (Source: based on URA 2010 data)
Figure 32: Major trade partners for carpentry and joinery products
Major partners of Uganda in carpentry and joinery (HS 4418) trade 2004 to 2007 (all values in USD; Ex-ports are FOB values; imports are CIF values; Source Comtrade 2010)
-
100,000
200,000
300,000
400,000
500,000
600,000
700,000
Import Values (USD)
Import Quantities (kg)
Export Values (USD)
Export Quantities (kg)
2007 2008 2009
-
20,000
40,000
60,000
80,000
100,000
120,000
Imports Exports Imports Exports Imports Exports Imports Exports
2004 2005 2006 2007
Kenya DRC Sudan Turkey United Arab Emirates USA
Final report SPGS Market Study Page 36
SPGS Plantation Clusters
Source: SPGS

Final report SPGS Market Study Page 37
SPGS Market report

Final report SPGS Market Study Page 38

Final report SPGS Market Study Page 39
Interviewed companies and organisations
Interviewed Companies and organisations
Company Type of Business Name Time of in-terview
Budongo Saw mills Furniture J.V. Patek Aug 10
ERIMU Furniture and timber dealers M. Kizito Apr 09
Global Woods Planter J. Mokwena, M. Baldus Apr 09
Green Resources Planter D. Ayiekoh Apr 09
Interio Construct Formerly construction and furni-ture
F. Eichinger Aug 10
Kapkwata Saw Mills Ltd. Furniture and timber dealers J. Phaguda Apr 09
National Housing Construction P. Onyango Jul 10
New Forests Company Planter P. Le Roux Apr 09, Oct 10
NFA
Timber trade J. Ndimukulaga Jul 10
Plantations I. Kikangi Jul 10
Timber sale
Jul 10
Nileply Planter Bashkar Kannan Apr 09, Oct 10
ROKO Construction, Interior and Furni-ture
A. Flores Jul 10
Seyani International construction and interior D. Vekaria Jul 10
UBoS
Statistics – Construction Sector Index
P. Opio Jul 10
Statistics – Imports/exports A. Ki Lubega Jul 10
