final report to food standards agency nitrate surveillance
TRANSCRIPT

Final Report to Food Standards Agency
Nitrate Surveillance Programme:
May 2014 – April 2019
Contract Number FS513408

Principal workers
Julie Smith Principal Research Scientist ADAS Rosemaund
Karen Wheeler Senior Research Manager ADAS Rosemaund
Sean Stevenson Business Development Manager NRM Laboratories
Chris Dyer Senior Statistician ADAS (home based)
Tony Forrester Sample Officer ADAS Associate (home based)
Geoff Bailey Sample Officer ADAS Starcross
Stephen Hamilton Sample Officer DARD, Northern Ireland
Geoff Thorpe Sample Officer ADAS Associate (home based)
Gary Boardman Sample Officer ADAS Boxworth
Aldwyn Clarke Sample Officer ADAS Llanafan
Stephen Barnes Sample Officer ADAS Associate (home based)

Contents
Executive Summary ...................................................................................................... 2
1 Introduction ............................................................................................................ 3
2 Quality Assurance .................................................................................................. 4
3 Objectives ............................................................................................................... 4
4 Methodology ........................................................................................................... 5
Site selection and grower representation ..................................................................... 5
Sample collection and transportation to the laboratory ................................................ 5
Crop husbandry details ................................................................................................ 5
Sample preparation in the laboratory ........................................................................... 5
Analytical analysis ........................................................................................................ 6
Quality control (QC) ..................................................................................................... 6
Communication of results to FSA ................................................................................. 7
Communication of results to growers and wholesalers ................................................ 7
Data analysis and reporting ......................................................................................... 7
5 Results .................................................................................................................... 8
Sample overview by region .......................................................................................... 8
Nitrate concentration by region .................................................................................... 9
Sample overview by month ........................................................................................ 12
Nitrate concentration by month .................................................................................. 13
Sample overview by crop and category ..................................................................... 17
Nitrate concentration by category .............................................................................. 18
Long term trends in nitrate concentration ................................................................... 24
Long term trends in samples exceeding the maximum permitted limit ....................... 28
6 Conclusions .......................................................................................................... 33
7 Recommendations ............................................................................................... 34
8 References ............................................................................................................ 35

Nitrate Surveillance Final Report, 2014 – 2018 v3 amended 130220 2
Executive Summary
Every EU Member State is required to monitor and report levels of nitrate in specified
foodstuffs as part of the European Commission regulation and the UK also requires
this information in support of negotiations on the review of regulations. The
requirement to carry out monitoring for nitrate in lettuce, spinach and rocket is being
met by the UK Nitrate Surveillance Programme.
A total of 1000 samples were collected between May 2014 and April 2019. There
were 553 domestic lettuce samples, 108 spinach samples, 76 rocket samples, 31
‘other leafy green vegetables’ and 232 imported samples.
Differences in nitrate concentration were observed between sample categories.
Rocket had the highest concentration and iceberg lettuce had the lowest. Imported
and domestic samples were broadly comparable. Mean nitrate concentration was
relatively stable within categories when comparing with long term average values. A
total of 2.99% of domestic samples exceeded the regulation limit, comprising
produce from across categories, months and regions.
The overall percentage of domestic samples exceeding the regulation limit has
significantly decreased over the last 15 years and has remained consistent, at
approximately 3%, for the last 5 years (2014 - 2018). However, >10% of rocket
samples exceeded the limit and the trend suggests that the annual number of rocket
samples exceeding the limit is increasing.
Although some individual samples contained significant amounts of nitrate the
surveillance programme has shown that the UK is largely producing leafy green
vegetables with nitrate concentrations within the regulation limits.
The existing data could be examined more closely to identify relationships between
tissue nitrate concentration, fertiliser input, crop husbandry and environmental
factors. An improved understanding would enable industry to refine their growing
practices and help the Food Standards Agency to better predict which crops are
likely to exceed the maximum permitted nitrate limits.
Nitrate Surveillance Final Report, 2014 – 2018 v3 amended 130220 3
Introduction
Nitrates are chemicals that exist in plants, soils and water. The concentration of
nitrate in plant tissues is variable but green leafy vegetables, when consumed raw
can contain relatively high amounts. Concentration above a threshold value can pose
a human health risk and high nitrate levels have been associated with certain types
of cancer. Lettuce, spinach and rocket are important leafy vegetable crops in the UK
and are the source plant material for this report.
Concerns regarding high concentrations of nitrate in the diet have led the European
Commission (EC) to introduce maximum residue levels in lettuce, spinach and
rocket. The EC limits represent a nitrates concentration threshold for consumer
health but also a compromise based on individual Member States “national levels” in
order to prevent intra-community trade barriers. The Contaminants in Food (England)
Regulations 2013 implements the directly applicable EU Commission Regulation
(EC) No. 1881/2006 and EC regulation 466/2001
A Commission Regulation (EC) No 1258/2011 came into force in December 2011.
This Regulation set out new, permanent limits in green leafy vegetables; except the
limits for rocket which applied specifically from 1 April 2012. It ends the previous
temporary derogation which permitted the UK and some other EU countries to
exceed maximum nitrate limits for fresh lettuce and spinach grown and intended for
consumption on their own respective territories. Furthermore, the regulation now
allows Member States to communicate results of the monitoring programme to the
European Food Safety Authority (EFSA) on a regular basis, rather than the
mandatory deadline of June 30 each year.
Every Member State is required to monitor and report levels of nitrate as part of a
European Commission regulation and the UK also requires this information in
support of negotiations on the review of regulations. The requirement to carry out
surveillance for nitrate in lettuce, spinach and rocket has been met by the UK
Monitoring Programme. This has been undertaken since May 1996 and reported in
earlier MAFF (now Defra) and FSA Food Surveillance Information Sheets. Monitoring
of UK grown lettuce, spinach and rocket is currently being led by RSK ADAS Ltd
(ADAS) in partnership with NRM Laboratories.
Nitrate Surveillance Final Report, 2014 – 2018 v3 amended 130220 4
Quality Assurance
The study was conducted in compliance with the requirements of the Food Standards
Agency, as set out in RRD27, February 2008. Sampling methodology conforms to
the European Commission guidelines given in Commission Regulation
EC/1882/2006 and with the quality assurance procedures adopted for the 2002-2007
surveys.
ADAS has its own in-house Quality Management System (QMS) developed to meet
the requirements of externally accredited standards applied to parts of the business.
Compliance with QMS is monitored through formal audit by the operationally
independent Quality Management Group. ADAS is registered with Lloyd’s Register
Quality Assurance (LRQA) for: ‘Provision of independent research, consultancy and
contracting services, focused primarily on environmental management, regional
development, agriculture, horticulture and the food supply chain, to Government, levy
bodies and private sector companies’.
Chemical analysis carried out by NRM Ltd meets the requirements of the Joint Code
of Practice for Quality Assurance in Research, complies with Commission Regulation
(EC) No 1882/2006 and complies with the provisions of items 1 & 2 of Annex III to
Regulations (EC) No 882/2004.
Objectives
1 To collect a total of 1000 samples of fresh produce over the monitoring period,
principally lettuce, rocket and spinach, including domestic and imported
samples (approximately 200 samples per year).
2 To carry out the chemical determination of nitrate concentration in fresh tissue
in accordance with the appropriate Directives.
3 To report results to the agency in an electronic format.
4 To ensure the participating growers receive a copy of their results.
Nitrate Surveillance Final Report, 2014 – 2018 v3 amended 130220 5
Methodology
Site selection and grower representation
Sampling schedules were prepared by ADAS each year and agreed by the Food
Standards Agency (FSA). The schedule ensured that sampling of fresh produce
complied with the European Commission guidelines given in Regulation
EC/1882/2006 and met with the requirement to spread the sampling over
representative geographical regions throughout the UK. The schedule also ensured
that seasonal growing trends were adequately reflected.
Sample collection and transportation to the laboratory
Domestic and imported samples were collected by trained Sample Officers, in
accordance with Commission Regulation EC/1882/2006. For domestic samples, a
minimum of 10 heads of lettuce or 1.0 kg of spinach, rocket and other leafy green
vegetables was randomly collected from various points within the lot by walking a ‘W’
pattern across the sampling area. Lot size did not exceed 2 ha and plants which were
atypical of the lot (such as diseased plants) were avoided. Imported samples were
collected from the wholesaler by taking one lettuce or a ‘handful’ of spinach and
rocket out of each crate and ensuring that a minimum of ten separate crates from a
batch were used. Samples were labelled with a unique identity which was fully
traceable throughout the project and were maintained at <10oC during transportation
to the laboratory.
Crop husbandry details
Details were collected by the Sample Officers to accompany each sample. For
domestic samples, details included grower, date and time sample was collected,
variety or type, location, lot size and fertiliser input. Limited information was collected
for the imported samples and included wholesaler, date of sample collection, country
of origin, variety or type and any relevant labelling to ensure traceability.
Sample preparation in the laboratory
Samples were checked upon receipt to ensure they had remained intact and had not
degraded during transit. Samples were prepared in accordance with the
requirements of EC Regulation 1882/2006. The whole sample was homogenised
using a protocol developed by NRM Ltd. Four representative sub-samples were
taken, (A, B, C and D). Sub-sample A was used immediately for analysis. Sub-
sample B was kept refrigerated in case the sample exceeded the limit and repeat
analysis was required. Sub-samples C and D were frozen and kept in storage for 12
months following the reporting of results, in case of dispute.

Nitrate Surveillance Final Report, 2014 – 2018 v3 amended 130220 6
Analytical analysis
Analysis commenced immediately after preparation and used a UKAS accredited
method which fully meets the requirements of EC Regulation 1882/2006. The method
is accredited to BS EN ISO 17025: 2005 and has been since 2000. The method uses
an extraction procedure which involves freezing in liquid nitrogen prior to
homogenisation. Detection is based on flow injection colorimetry and is currently
used by NRM Ltd for analysis of all commercial samples. If a nitrate value was ≥ 90%
of the maximum nitrate level (Table 1) for a particular product then a repeat
extraction and analysis of refrigerated Sample B was triggered, to confirm the high
value. Nitrate concentrations were expressed in milligrams of nitrate per kilogram of
sample fresh weight (mg kg-1).
Table 1. Maximum permitted concentrations of nitrates in lettuce, spinach and rocket.
Product Maximum permitted levels (NO3 mg kg-1)
Fresh lettuce, iceberg type Lettuce grown under cover
Lettuce grown in the open air 2500 2000
Fresh lettuce, non-iceberg type
Harvested 01 October to 31 March: Lettuce grown under cover Lettuce grown in the open air Harvested 01 April to 30 September: Lettuce grown under cover Lettuce grown in the open air
5000 4000 4000 3000
Rocket
Harvested 01 October to 31 March Harvested 01 April to 30 September
7000 6000
Fresh spinach 3500 Preserved or frozen spinach 2000 Other leafy green vegetables n/a
Quality control (QC)
An in-house reference material was included with every batch of samples at a
frequency of at least one in twenty. A spiked sample was also be included at the
same frequency. A reagent blank was prepared with each batch of samples. A mid-
range standard was included at the end of each batch to ensure any drift over the run
was within acceptable limits (+/- 5%). All QC results were monitored to ensure they
Nitrate Surveillance Final Report, 2014 – 2018 v3 amended 130220 7
conform to NRM’s policy on Quality Control (i.e. precision, accuracy, 9 point bias,
ascending or descending trends etc.). Results were reported to ADAS within five
days of sample receipt.
Communication of results to FSA
Results were reported anonymously to the FSA on a monthly basis. Monthly mean
values and running totals of maximum, minimum and mean nitrate levels grouped
according to category were tabulated and have been included in the respective
Annual Reports, along with the number of samples exceeding the maximum nitrate
levels.
Communication of results to growers and wholesalers
A template letter was agreed with the FSA for the reporting of results to participants.
ADAS reported the results directly to the grower/wholesaler and a copy of the letter
was also sent to the FSA. If the nitrate level in a sample exceeded the maximum
permitted limit then, following confirmation of the result by NRM, ADAS informed the
responsible person at the Agency before reporting the result to the
grower/wholesaler.
Data analysis and reporting
For each project year (01 May – 30 April) results were anonymised and summarised
in Excel (v. 2013). Mean nitrate concentrations were calculated for each category of
produce and long term mean data were calculated from 2002 -18. In 2012 and 2013
the programme focussed on spinach and rocket so no lettuce data were available for
those years. Rocket samples were only included in the programme from 2012
onwards. Statistical summarisation and regression analyses were carried out using
GenStat (18th edition). Annual reports were submitted to the Food Standards Agency
in May of each year and data were also supplied on the EFSA template.
Nitrate Surveillance Final Report, 2014 – 2018 v3 amended 130220 8
Results
Sample overview by region
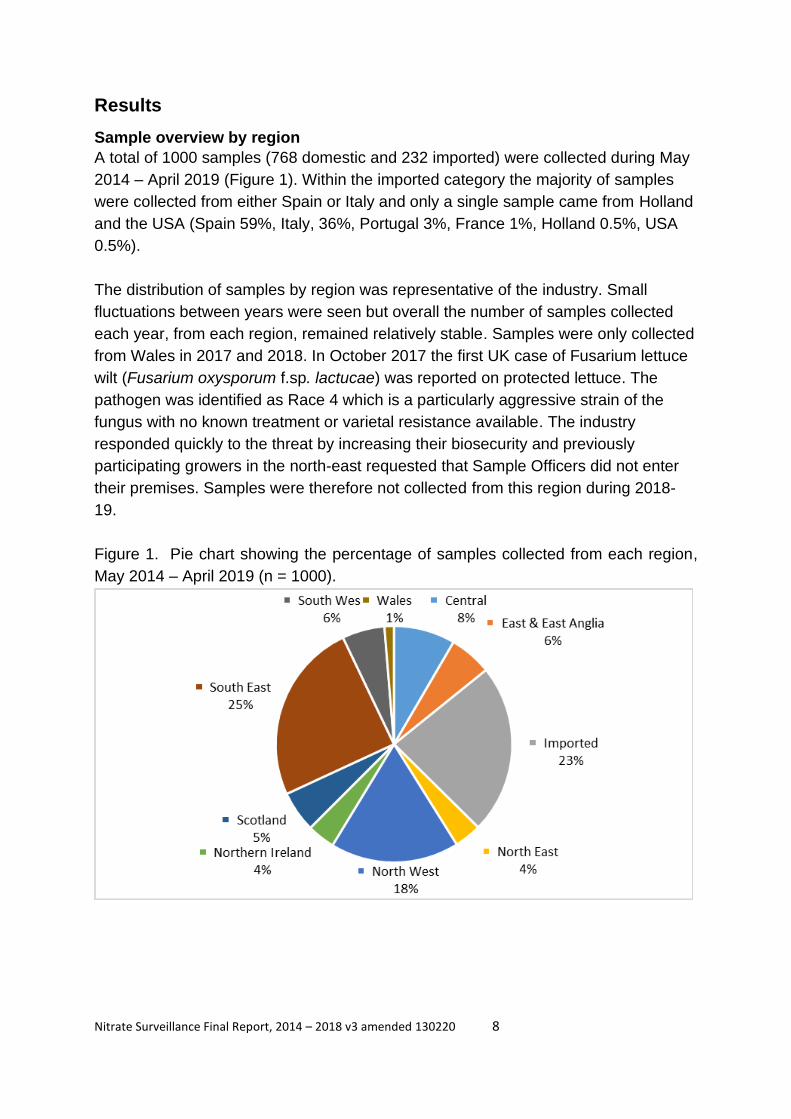
A total of 1000 samples (768 domestic and 232 imported) were collected during May
2014 – April 2019 (Figure 1). Within the imported category the majority of samples
were collected from either Spain or Italy and only a single sample came from Holland
and the USA (Spain 59%, Italy, 36%, Portugal 3%, France 1%, Holland 0.5%, USA
0.5%).
The distribution of samples by region was representative of the industry. Small
fluctuations between years were seen but overall the number of samples collected
each year, from each region, remained relatively stable. Samples were only collected
from Wales in 2017 and 2018. In October 2017 the first UK case of Fusarium lettuce
wilt (Fusarium oxysporum f.sp. lactucae) was reported on protected lettuce. The
pathogen was identified as Race 4 which is a particularly aggressive strain of the
fungus with no known treatment or varietal resistance available. The industry
responded quickly to the threat by increasing their biosecurity and previously
participating growers in the north-east requested that Sample Officers did not enter
their premises. Samples were therefore not collected from this region during 2018-
19.
Figure 1. Pie chart showing the percentage of samples collected from each region,
May 2014 – April 2019 (n = 1000).
Nitrate Surveillance Final Report, 2014 – 2018 v3 amended 130220 9
Nitrate concentration by region
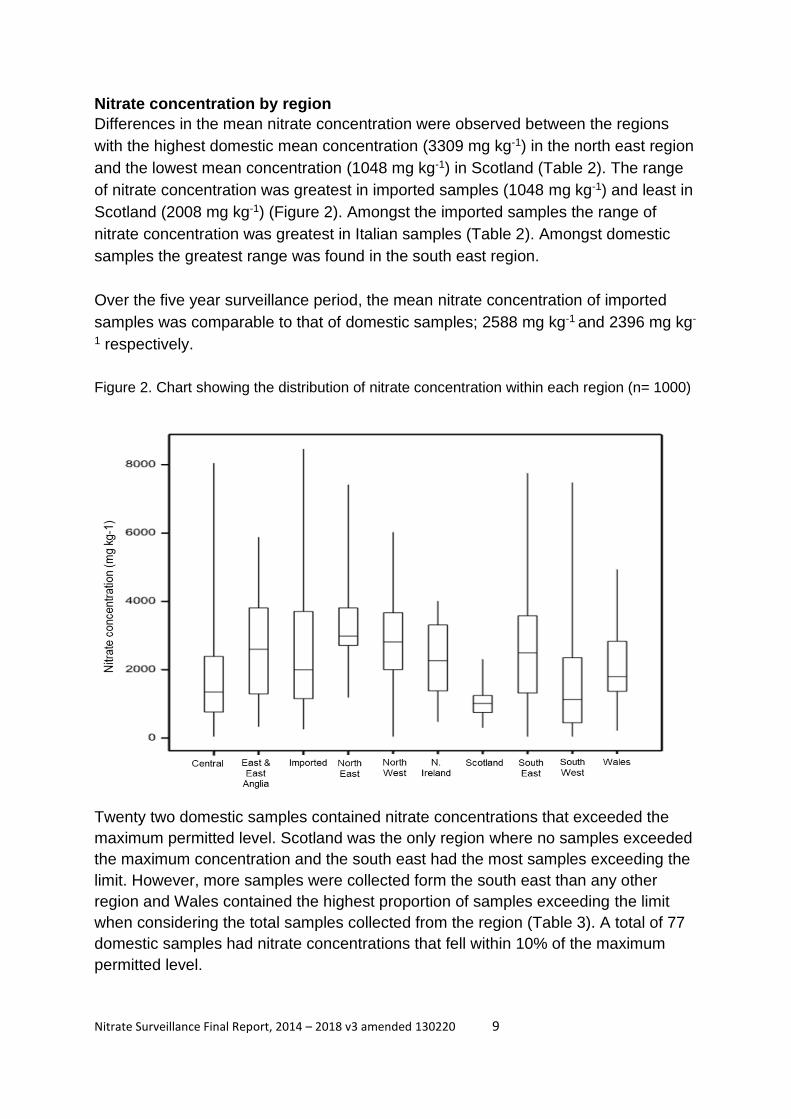
Differences in the mean nitrate concentration were observed between the regions
with the highest domestic mean concentration (3309 mg kg-1) in the north east region
and the lowest mean concentration (1048 mg kg-1) in Scotland (Table 2). The range
of nitrate concentration was greatest in imported samples (1048 mg kg-1) and least in
Scotland (2008 mg kg-1) (Figure 2). Amongst the imported samples the range of
nitrate concentration was greatest in Italian samples (Table 2). Amongst domestic
samples the greatest range was found in the south east region.
Over the five year surveillance period, the mean nitrate concentration of imported
samples was comparable to that of domestic samples; 2588 mg kg-1 and 2396 mg kg-
1 respectively.
Figure 2. Chart showing the distribution of nitrate concentration within each region (n= 1000)
Twenty two domestic samples contained nitrate concentrations that exceeded the
maximum permitted level. Scotland was the only region where no samples exceeded
the maximum concentration and the south east had the most samples exceeding the
limit. However, more samples were collected form the south east than any other
region and Wales contained the highest proportion of samples exceeding the limit
when considering the total samples collected from the region (Table 3). A total of 77
domestic samples had nitrate concentrations that fell within 10% of the maximum
permitted level.

Nitrate Surveillance Final Report, 2014 – 2018 v3 amended 130220 10
Table 2. Nitrate levels for domestic and imported samples, 2014 – 2018 (n = 1000)
Nitrate concentration (mg kg-1)
Region No. samples Mean Median Minimum Maximum Range Lower
quartile Upper
quartile
Central 84 1790 1347 50 8052 8002 764 2390 East & E. Anglia 58 2620 2601 338 5885 5546 1292 3811 North East 37 3309 2988 1189 7422 6233 2711 3811 North West 176 2789 2811 50 6036 5986 2003 3669 N. Ireland 38 2242 2267 486 4015 3529 1384 3312 Scotland 56 1048 1014 306 2314 2008 752 1246 South East 248 2633 2493 50 7761 7711 1321 3582 South West 58 1718 1130 50 7484 7434 449 2352 Wales 13 2134 1797 221 4944 4724 1369 2832 Imported: 232 2588 2001 262 8465 8203 1155 3706
(France) (2) (1481) (1481) (904) (2058) (1154) (904) (2058) (Holland) (1) (3100) (3100) (3100) (3100) (0) (3100) (3100)
(Italy) (84) (3712) (3596) (346) (8465) (8119) (1863) (5705) (Portugal) (7) (3008) (3207) (816) (4437) (3621) (1654) (4336)
(Spain) (137) (1893) (1526) (262) (6305) (6044) (1036) (2370) (USA) (1) (2036) (2036) (2036) (2036) (0) (2036) (2036)

Nitrate Surveillance Final Report, 2014 – 2018 v3 amended 130220 11
Table 3. Samples exceeding the regulatory limit shown by region, 2014 – 2018 (n = 768)
Region No.
samples
No. samples within 10% of limit
(inc. those exceeding limit)
No. samples exceeding limit following retest
Percentage within 10% of limit
(inc. those exceeding limit)
Percentage of samples
exceeding limit following retest
Central 84 6 1 7.14 1.19
East & East Anglia 58 9 3 15.52 5.17
North East 37 7 2 18.92 5.41
North West 176 16 3 9.09 1.70
N. Ireland 38 8 1 21.05 2.63
Scotland 56 0 0 0.00 0.00
South East 248 27 8 10.89 3.23
South West 58 2 2 3.45 3.45
Wales 13 2 2 15.38 15.38
Nitrate Surveillance Final Report, 2014 – 2018 v3 amended 130220 12
Sample overview by month
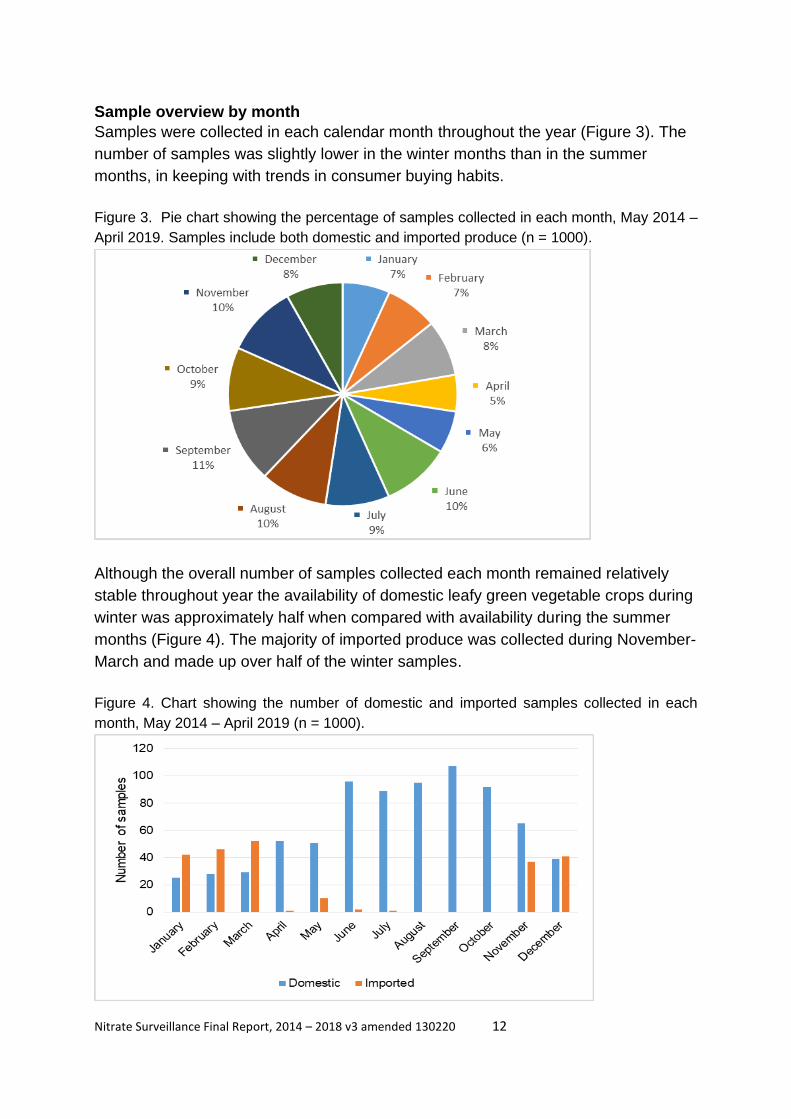
Samples were collected in each calendar month throughout the year (Figure 3). The
number of samples was slightly lower in the winter months than in the summer
months, in keeping with trends in consumer buying habits.
Figure 3. Pie chart showing the percentage of samples collected in each month, May 2014 –
April 2019. Samples include both domestic and imported produce (n = 1000).
Although the overall number of samples collected each month remained relatively
stable throughout year the availability of domestic leafy green vegetable crops during
winter was approximately half when compared with availability during the summer
months (Figure 4). The majority of imported produce was collected during November-
March and made up over half of the winter samples.
Figure 4. Chart showing the number of domestic and imported samples collected in each
month, May 2014 – April 2019 (n = 1000).

Nitrate Surveillance Final Report, 2014 – 2018 v3 amended 130220 13
Nitrate concentration by month
When considering both domestic and imported samples, differences in the mean
nitrate concentration were observed between months with the highest mean
concentration (3283 mg kg-1) in December and the lowest mean concentration (1454
mg kg-1) in June (Table 4). The range of nitrate concentration was relatively
consistent through the year and was greatest in December (7928 mg kg-1) and lowest
in March (5613 mg kg-1) (Figure 5).
Figure 5. Chart showing the monthly distribution of nitrate concentration across all
samples, May 2014 – April 2019 (n = 1000).
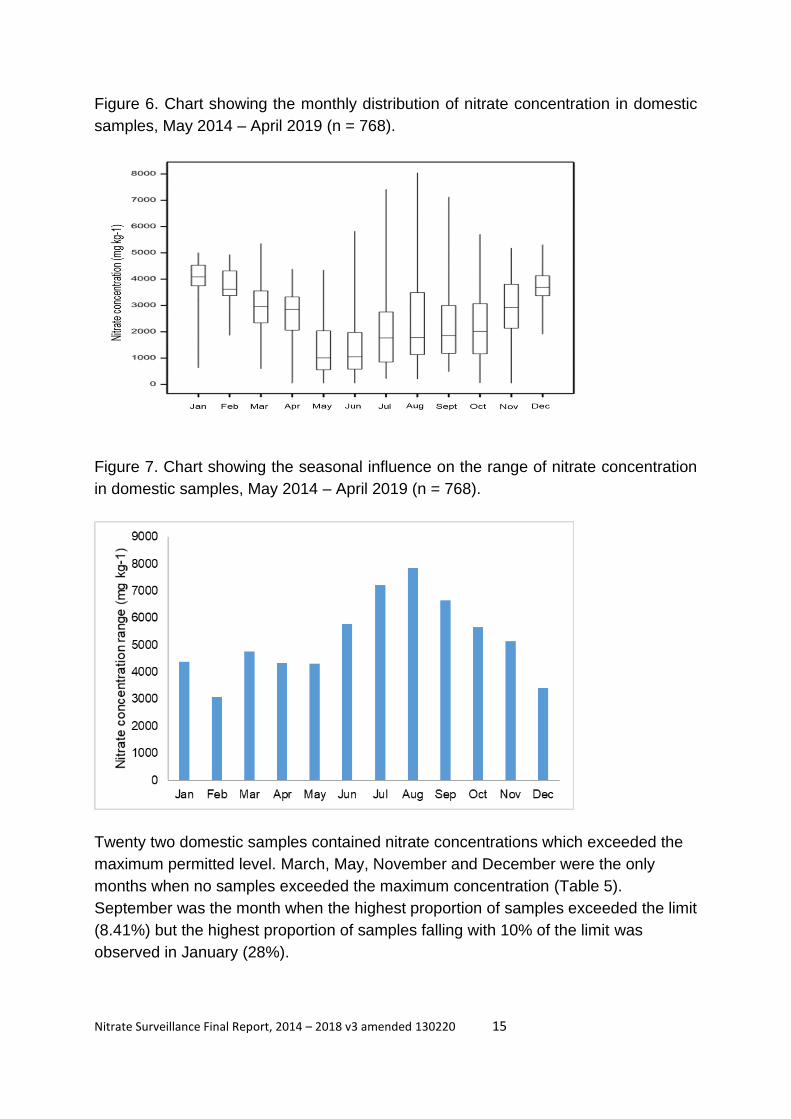
The mean nitrate levels in imported samples collected during summer and winter
months were comparable (2542 mg kg-1 summer and 2591 mg kg-1 winter). When
only the domestic samples were considered there was a greater separation in mean
nitrate concentration between months (Figure 6). A clear seasonal effect was seen
whereby the highest mean nitrate levels were observed during the winter months and
the lowest mean levels were seen in summer. The range of nitrate concentration was
also influenced by month and samples were most variable and had the widest range
in summer (Jun – Oct) (Figure 7).

Nitrate Surveillance Final Report, 2014 – 2018 v3 amended 130220 14
Table 4. Nitrate levels for monthly samples, 2014 – 2018 (n = 1000)
Nitrate concentration (mg kg-1)
Month No.
samples Mean Median Minimum Maximum Range Lower
quartile Upper
quartile
January 67 3032 3003 634 7686 7052 1527 4250 February 74 3063 3090 432 6406 5974 1703 4240 March 81 2510 2289 415 6028 5613 1235 3453 April 53 2675 2877 50 5720 5670 2072 3360 May 61 1540 1006 50 6215 6165 527 2296 June 98 1454 1050 50 5831 5781 566 2008 July 90 2124 1775 221 7422 7201 870 2798 August 95 2521 1778 206 8052 7845 1131 3491 September 107 2310 1856 486 7131 6645 1177 3000 October 92 2187 2021 60 5713 5653 1160 3071 November 102 2815 2686 50 6164 6114 1921 3801 December 80 3282 3416 536 8465 7928 1909 4208
Nitrate Surveillance Final Report, 2014 – 2018 v3 amended 130220 15
Figure 6. Chart showing the monthly distribution of nitrate concentration in domestic
samples, May 2014 – April 2019 (n = 768).
Figure 7. Chart showing the seasonal influence on the range of nitrate concentration
in domestic samples, May 2014 – April 2019 (n = 768).
Twenty two domestic samples contained nitrate concentrations which exceeded the
maximum permitted level. March, May, November and December were the only
months when no samples exceeded the maximum concentration (Table 5).
September was the month when the highest proportion of samples exceeded the limit
(8.41%) but the highest proportion of samples falling with 10% of the limit was
observed in January (28%).

Nitrate Surveillance Final Report, 2014 – 2018 v3 amended 130220 16
Table 5. Domestic samples exceeding the regulatory limit, shown by month, 2014 – 2018 (n = 768)
Month No.
samples
No. samples within 10% of limit
(inc. those exceeding limit)
No. samples exceeding limit following retest
Percentage within 10% of limit
(inc. those exceeding limit)
Percentage of samples
exceeding limit following retest
January 25 7 2 28.00 8.00
February 28 3 1 10.71 3.57
March 29 2 0 6.90 0.00
April 52 4 1 7.69 1.92
May 51 0 0 0.00 0.00
June 96 6 1 6.25 1.04
July 89 7 2 7.87 2.25
August 95 13 3 13.68 3.16
September 107 17 9 15.89 8.41
October 92 7 3 7.61 3.26
November 65 5 0 7.69 0.00
December 39 6 0 15.38 0.00
Total 768 77 22 10.03 2.86
Nitrate Surveillance Final Report, 2014 – 2018 v3 amended 130220 17
Sample overview by crop and category
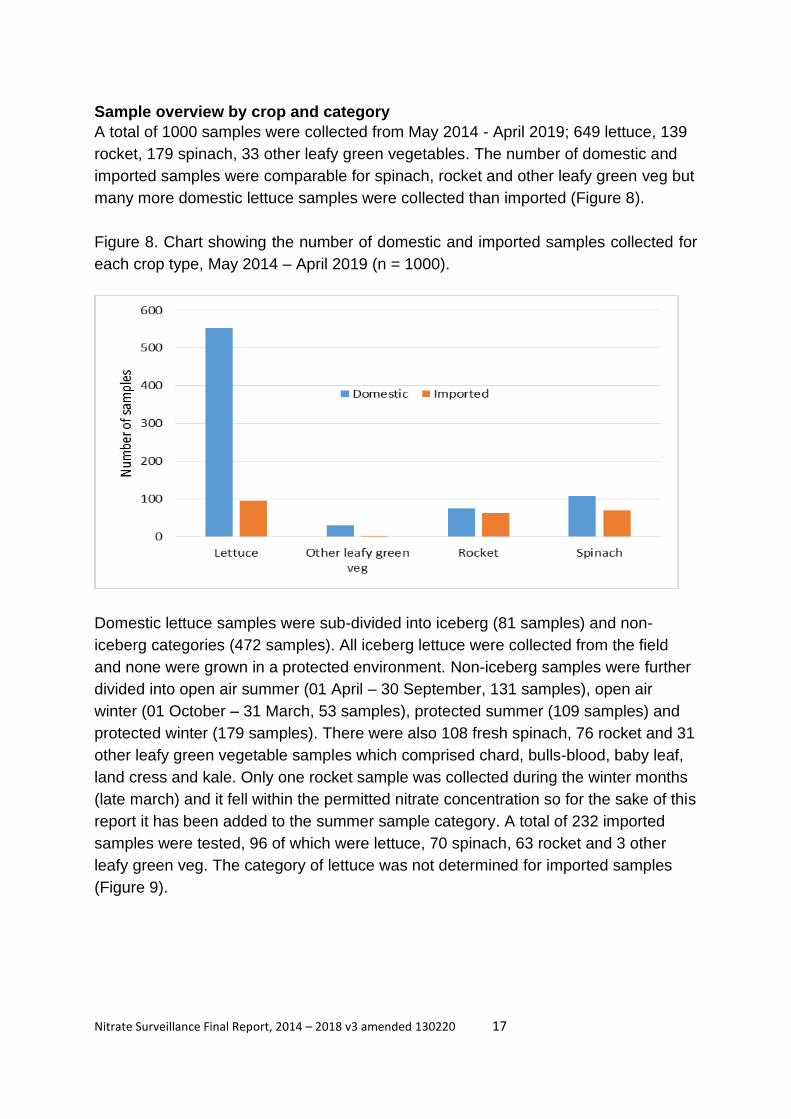
A total of 1000 samples were collected from May 2014 - April 2019; 649 lettuce, 139
rocket, 179 spinach, 33 other leafy green vegetables. The number of domestic and
imported samples were comparable for spinach, rocket and other leafy green veg but
many more domestic lettuce samples were collected than imported (Figure 8).
Figure 8. Chart showing the number of domestic and imported samples collected for
each crop type, May 2014 – April 2019 (n = 1000).
Domestic lettuce samples were sub-divided into iceberg (81 samples) and non-
iceberg categories (472 samples). All iceberg lettuce were collected from the field
and none were grown in a protected environment. Non-iceberg samples were further
divided into open air summer (01 April – 30 September, 131 samples), open air
winter (01 October – 31 March, 53 samples), protected summer (109 samples) and
protected winter (179 samples). There were also 108 fresh spinach, 76 rocket and 31
other leafy green vegetable samples which comprised chard, bulls-blood, baby leaf,
land cress and kale. Only one rocket sample was collected during the winter months
(late march) and it fell within the permitted nitrate concentration so for the sake of this
report it has been added to the summer sample category. A total of 232 imported
samples were tested, 96 of which were lettuce, 70 spinach, 63 rocket and 3 other
leafy green veg. The category of lettuce was not determined for imported samples
(Figure 9).

Nitrate Surveillance Final Report, 2014 – 2018 v3 amended 130220 18
Figure 9. Pie chart showing the percentage of samples collected for each category,
May 2014 – April 2019 (n = 1000).
Nitrate concentration by category
Imported samples had the greatest range in nitrate concentration (8203 mg kg-1)
(Table 6) and upon closer examination it was seen that the range was influenced
strongly by the rocket samples (Figure 10). Other types of imported crop had lower
mean nitrate concentrations and a smaller range of values across the year. For
imported rocket samples 4.76% (3 out of 63 samples) would have exceeded the
permitted limit compared with 9.21% (7 out of 76 samples) of domestic rocket.
12.70% of imported samples (8 out of 63) fell within 10% of the regulation limit
compared with 22.37% of domestic samples (17 out of 76). 11.43% of imported
spinach (8 out of 70 samples) would have exceeded the limit compared with 3.70%
(4 out of 108 samples) of domestic spinach. 15.71% of imported samples (11 out of
70) fell within 10% of the regulation limit compared with 7.41% of domestic samples
(8 out of 108). Imported rocket and spinach samples had a slightly higher nitrate
concentration compared with domestic rocket and spinach samples. Imported lettuce
was lower in nitrate concentration (1387 mg kg-1) compared with domestic lettuce
samples (2286 mg kg-1) but information about the type of lettuce was not collected so
it is not possible to comment on the number that would have exceeded the limit if the
regulation was applied to imported lettuce.

Nitrate Surveillance Final Report, 2014 – 2018 v3 amended 130220 19
Table 6. Nitrate levels for each sample category, 2014 – 2018 (n = 1000)
Nitrate concentration (mg kg-1)
Category No.
samples Mean Median Minimum Maximum Range Lower
quartile Upper
quartile
Iceberg, open air 81 967 930 104 2943 2839 733 1170 Iceberg, protected 0 - - - - - - - Non-iceberg, open air, summer 131 1218 1136 50 3830 3780 705 1553 Non-iceberg, open air, winter 53 1668 1455 50 3397 3347 1149 2314 Non-iceberg, protected, summer 109 2830 2877 229 7422 7193 2298 3363 Non-iceberg, protected, winter 179 3519 3572 60 5713 5653 2992 4222 Spinach 108 1766 1736 50 4944 4894 1003 2382 Rocket 76 4131 4276 62 8052 7990 2842 5199 Other leafy green veg 31 2275 1776 50 7001 6951 1022 3229 Imported (all) 232 2588 2001 262 8465 8203 1155 3706
Imported lettuce 96 1387 1181 262 4740 4478 851 1798 Imported spinach 70 2188 2067 432 4780 4348 1597 2680
Imported rocket 63 4906 5289 346 8465 8119 3877 6027 Imported other leafy green veg 3 1662 2058 530 2396 1867 912 2312

Nitrate Surveillance Final Report, 2014 – 2018 v3 amended 130220 20
Within the domestic sample categories rocket had the highest mean nitrate
concentration (4131 mg kg-1), the highest maximum nitrate concentration (8052 mg
kg-1) and the greatest range of values (7990 mg kg-1) (Table 6 and Figure 11). Rocket
also exceeded the maximum nitrate concentration the most with 9.21% (7 out of 76
samples) failing and 22.37% of samples falling within 10% of the maximum (Table 7).
Non-iceberg type lettuce grown in a protective environment was the category with the
next highest mean nitrate level, range and number of samples exceeding the
maximum limit. Winter samples had a higher mean concentration than summer
samples (3519 mg kg-1and 2830 mg kg-1). However, the range was higher for
summer samples and the proportion of samples exceeding the limit was higher
during the summer months (5.50% summer, 1.12% winter). The number of samples
falling within 10% of the permitted limit was comparable between categories (16.51%
summer, 13.97% winter).
Iceberg lettuce grown in the field had the lowest mean nitrate concentration of all the
categories (967 mg kg-1) and the smallest range. Only one sample (1.23%) exceeded
the maximum permitted limit. The only category where no samples exceeded the
permitted limit was non-iceberg lettuce grown in the field, in winter.
Figure 10. Chart showing the distribution of nitrate concentration for different sample
categories, May 2014 – April 2019 (n = 1000).

Nitrate Surveillance Final Report, 2014 – 2018 v3 amended 130220 21
Figure 11. Chart showing the range of nitrate concentration for each sample category,
May 2014 – April 2019 (n = 1000).

Nitrate Surveillance Final Report, 2014 – 2018 v3 amended 130220 22
Table 7. Domestic samples exceeding the regulatory limit shown by category, 2014 – 2018 (n = 768)
Category No.
samples
No. samples within 10% of limit
(inc. those exceeding limit)
No. samples exceeding limit following retest
Percentage within 10% of limit
(inc. those exceeding limit)
Percentage of samples
exceeding limit following retest
Iceberg, open air 81 3 1 3.70 1.23
Iceberg, protected 0 0 0 0 0
Non-iceberg, open air, summer 131 6 2 4.58 1.53
Non-iceberg, open air, winter 53 0 0 0.00 0.00
Non-iceberg, protected, summer 109 18 6 16.51 5.50
Non-iceberg, protected, winter 179 25 2 13.97 1.12
Spinach 108 8 4 7.41 3.70
Rocket 76 17 7 22.37 9.21
* Other leafy green vegetables 31 (n/a) n/a n/a n/a n/a
Total 737 77 22 10.45 2.99
* Other leafy green vegetables not subject to regulation limits for maximum nitrate concentration

Nitrate Surveillance Final Report, 2014 – 2018 v3 amended 130220 23
When all domestic samples except for the ‘other leafy green veg’ category were
considered (n= 737), there was no significant relationship between the number of
samples collected within a category and the number of samples which exceeded the
regulatory limits (P= 0.48, data not shown). Likewise, the number of samples
collected did not significantly influence the range of nitrate concentration (P= 0.14,
data not shown). However, the number of samples that exceeded the maximum
nitrate limit within each category showed a significant and positive correlation with
both the range of nitrate concentration (P= 0.003, variance accounted for 75.1%)
(Figure 12) and the mean nitrate concentration (P= 0.035, variance accounted for
47.8%) (Figure 13).
Figure 12. Graph showing that more samples exceeded the maximum permitted nitrate
limit when categories of produce had a greater range of nitrate concentration (P=
0.003).
Figure 13. Graph showing that more samples exceeded the maximum permitted nitrate
limit when categories of produce had a higher mean nitrate concentration (P= 0.035).
Nitrate Surveillance Final Report, 2014 – 2018 v3 amended 130220 24
Long term trends in nitrate concentration
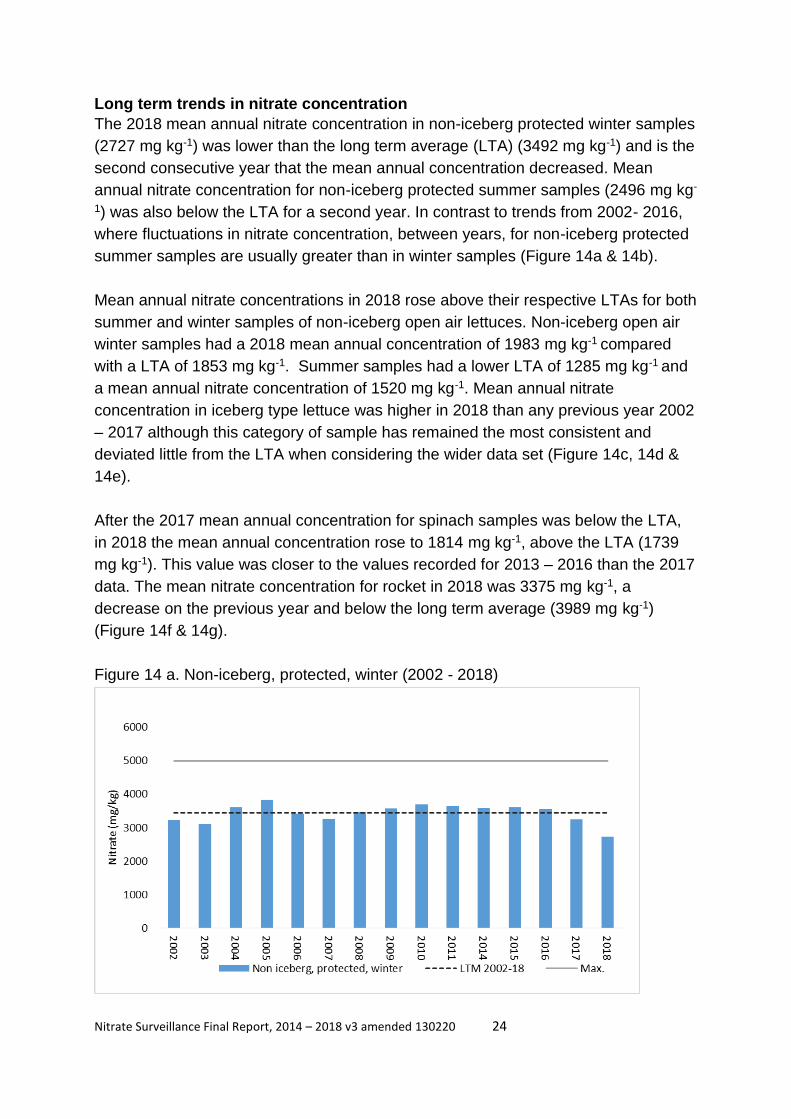
The 2018 mean annual nitrate concentration in non-iceberg protected winter samples
(2727 mg kg-1) was lower than the long term average (LTA) (3492 mg kg-1) and is the
second consecutive year that the mean annual concentration decreased. Mean
annual nitrate concentration for non-iceberg protected summer samples (2496 mg kg-
1) was also below the LTA for a second year. In contrast to trends from 2002- 2016,
where fluctuations in nitrate concentration, between years, for non-iceberg protected
summer samples are usually greater than in winter samples (Figure 14a & 14b).
Mean annual nitrate concentrations in 2018 rose above their respective LTAs for both
summer and winter samples of non-iceberg open air lettuces. Non-iceberg open air
winter samples had a 2018 mean annual concentration of 1983 mg kg-1 compared
with a LTA of 1853 mg kg-1. Summer samples had a lower LTA of 1285 mg kg-1 and
a mean annual nitrate concentration of 1520 mg kg-1. Mean annual nitrate
concentration in iceberg type lettuce was higher in 2018 than any previous year 2002
– 2017 although this category of sample has remained the most consistent and
deviated little from the LTA when considering the wider data set (Figure 14c, 14d &
14e).
After the 2017 mean annual concentration for spinach samples was below the LTA,
in 2018 the mean annual concentration rose to 1814 mg kg-1, above the LTA (1739
mg kg-1). This value was closer to the values recorded for 2013 – 2016 than the 2017
data. The mean nitrate concentration for rocket in 2018 was 3375 mg kg-1, a
decrease on the previous year and below the long term average (3989 mg kg-1)
(Figure 14f & 14g).
Figure 14 a. Non-iceberg, protected, winter (2002 - 2018)

Nitrate Surveillance Final Report, 2014 – 2018 v3 amended 130220 25
Figure 14 b. Non-iceberg, protected, summer (2002 - 2018)
Figure 14 c. Non-iceberg, open air, winter (2002 - 2018)

Nitrate Surveillance Final Report, 2014 – 2018 v3 amended 130220 26
Figure 14 d. Non-iceberg, open air, summer (2002 - 2018)
Figure 14 e. Iceberg, open air (2002 - 2018)

Nitrate Surveillance Final Report, 2014 – 2018 v3 amended 130220 27
Figure 14 f. Fresh spinach (2002 - 2018)
Figure 14 g. Rocket (2012 - 2018). Data not available prior to 2012
Figure 14 a-g. Long term trends in mean nitrate concentration for each category of
domestic produce. Blue bars represent mean nitrate concentration for each year,
solid grey line represents the maximum permitted nitrate concentration and the black
dotted line represents the long term average nitrate value (calculated from 2002-
2018). Axes have been standardised to a nitrate concentration value of 6000 mg/kg.

Nitrate Surveillance Final Report, 2014 – 2018 v3 amended 130220 28
Long term trends in samples exceeding the maximum permitted limit
The percentage of domestic samples exceeding the regulation limit has shown a
decreasing trend over the last decade (P = <0.001, se = 2.20) (Figure 15). The
available data show that the percentage of samples exceeding the permitted nitrate
concentration has fallen by approximately 3% every 5 years (2004-08 mean 9.03%,
2009-13 mean 5.78%, 2014 -18 mean 2.86%). However, a significant positive
relationship was found between the total number of samples collected each year and
the number of samples exceeding the regulation limit (P= 0.008, se= 5.79, variance
accounted for 34.2%) (data not shown).
Figure 15. Graph showing the percentage of UK grown samples collected each year
from 2002 – 2018 which exceed the regulation limit (P = <0.001, se = 2.20).
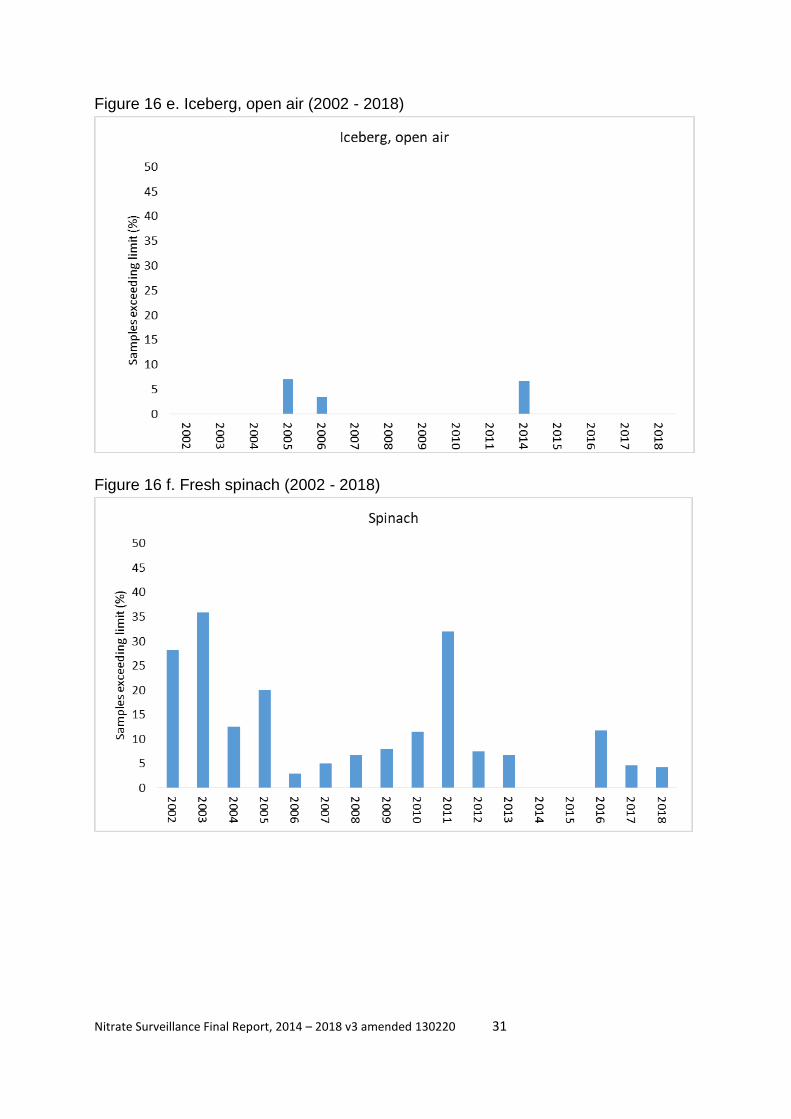
Only five iceberg samples out of the 429 collected since 2002 have exceeded the
limit (Figure 16). Even fewer non-iceberg lettuces grown in open air in winter have
exceeded the maximum nitrate concentration; the only sample exceeding the limit
was recorded in 2007. Open air summer crops have largely remained below 10%
with the exception of the 2006 season. The percentage of samples each year that
exceed the limit within the non-iceberg protected crops has remained below 10% for
the last seven years for both the summer and winter categories.
Spinach samples exceed the maximum permitted nitrate concentration set for the UK
more frequently than other categories over the 2002 – 2018 period and the number
of samples exceeding the limit is, on the whole, more variable than for lettuce crops.
Rocket has only been included in the programme from 2012 onwards but the 7-year

Nitrate Surveillance Final Report, 2014 – 2018 v3 amended 130220 29
trend suggests that the percentage of samples which exceed the maximum permitted
nitrate concentration is increasing.
Figure 16 a. Non-iceberg, protected, winter (2002 - 2018)
Figure 16 b. Non-iceberg, protected, summer (2002 - 2018)

Nitrate Surveillance Final Report, 2014 – 2018 v3 amended 130220 30
Figure 16 c. Non-iceberg, open air, winter (2002 - 2018)
Figure 16 d. Non-iceberg, open air, summer (2002 - 2018)
Nitrate Surveillance Final Report, 2014 – 2018 v3 amended 130220 31
Figure 16 e. Iceberg, open air (2002 - 2018)
Figure 16 f. Fresh spinach (2002 - 2018)

Nitrate Surveillance Final Report, 2014 – 2018 v3 amended 130220 32
Figure 16 g. Rocket (2012 - 2018). Data not available prior to 2012
Figure 16. Long term trends in the percentage of samples that exceed the maximum
permitted nitrate concentration (expressed as a percentage of the total number of
samples collected for each category). Axes have been standardised to 50% and data
reported from 2002 – 2018 with the exception of rocket, where data are not available
prior to 2012.
During the most recent surveillance period (2014 – 2018) the percentage of samples
within each category that exceed the regulation limit were loosely grouped into four
sections; 0%, 0.1 - 3%, 3.1 – 7%, 7.1 – 10% (Table 8).
Table 8. The percentage of domestic samples exceeding the regulation limit during
2014 - 2018. Categories ranked from low to high.
Category Percentage of samples
exceeding regulation limit (2014 – 2018)
Non iceberg, open air, winter 0.0
Non iceberg, protected, winter 1.2
Iceberg, open air 1.3
Non iceberg, open air, summer 1.5
Spinach 4.1
Non iceberg, protected, summer 5.8
Rocket 10.1

Nitrate Surveillance Final Report, 2014 – 2018 v3 amended 130220 33
Conclusions
• The surveillance programme collected samples of leafy green vegetables from
across months, regions and categories so the data are considered representative of
the industry.
• The majority of samples collected were lettuce. Comparable numbers of spinach
and rocket were collected and a small proportion of the samples were other leafy
green vegetables such as chard and mixed baby leaf.
• There was a seasonal effect on nitrate concentration for domestic samples with the
highest mean concentrations occurring during the winter months.
• Despite mean nitrate concentration being highest in the winter months,
concentration varied the most during the summer months with the greatest range of
values observed in July, August and September.
• Differences in nitrate concentration were observed between sample categories.
Rocket had the highest concentration and iceberg lettuce had the lowest mean
concentration. Imported and domestic samples were broadly comparable.
• Mean nitrate concentration was found to be relatively stable within categories of
produce when looking across years and comparing with long term average values.
• The number of domestic samples found to exceed the regulation limit during 2014 –
2018 was approximately 3% and exceedencies occurred in all but one category of
produce.
• The number of samples collected for each category did not influence the likelihood
of samples within the category exceeding the regulation limit, nor did the month in
which the sample was collected. However, across a wider surveillance period (2002
– 2018), a positive relationship was found between the total number of samples
collected each year and the total number of samples that exceed the regulation limit.
• A high mean nitrate concentration and a large range in nitrate concentration were
both found to significantly increase the number of samples exceeding the regulation
limit.
• Maximum permitted nitrate concentrations are not in place for ‘other leafy green
vegetables’ such as chard, kale and mixed baby leaf but some samples were found
to contain relatively high concentrations.

Nitrate Surveillance Final Report, 2014 – 2018 v3 amended 130220 34
• The overall percentage of samples exceeding the regulation limit has significantly
decreased over the last 15 years but has remained fairly consistent, at approximately
3%, for the last 5 years (2014 - 2018).
• Few samples of non-iceberg winter, non-iceberg summer open air and iceberg open
air lettuce exceeded the regulation limit during the last 5 years.
• During the same surveillance period, >10% of domestic rocket samples exceeded
the limit and the trend suggests the annual number of samples exceeding the limit is
increasing.
• Although some individual samples contain significant amounts of nitrate the
surveillance programme has shown that the UK is largely producing leafy green
vegetables with nitrate concentrations within the regulation limits.
• The mean nitrate concentrations observed for the different categories of produce
are comparable with those from other European Union countries (Brkić et al.).
Recommendations
• Continue the surveillance and ensure a minimum of 200 samples per annum are
collected.
• Consider removing low risk categories such as iceberg type lettuce from the
programme.
• Increase the number of samples collected for higher risk categories such as rocket.
• Include a wider range of vegetables and herbs in the programme which are
reported in literature to have high nitrate concentrations, e.g. cabbage, dill, celery,
beetroot and radish.
• Extend the data analysis. ADAS has been involved with the collection of leafy green
vegetable samples for 17 seasons (2002 – 2018). During this time we have compiled
a unique dataset and it is unlikely that a comparable data set exists elsewhere in the
UK. The data includes not only information about sample type and nitrate levels but
also variety, fertiliser inputs, lot sizes and meteorological data. If funding was
available the data could be explored further to better our understanding of
interactions between nitrate concentration, lettuce type, crop husbandry, agricultural
practices, fertiliser input, edaphic factors and environmental factors including climate
change scenarios. The outcome of such a study would enable industry to refine their

Nitrate Surveillance Final Report, 2014 – 2018 v3 amended 130220 35
growing practices as well as helping the Food Standards Agency to better
understand which crops were likely to exceed the maximum permitted nitrate limits.
References
D Brkić, J Bošnir, M Bevardi, A Gross Bošković, S Miloš, D Lasić, A Krivohlavek, A
Racz, A Mojsović Ćuić, N Uršulin Trstenjak. (2017) Nitrate in leafy green vegetables
and estimated intake. Afr J Tradit Complement Altern Med. 2017; 14(3): 31–41.
Burns, I. (2000). Development of a decision support system for nitrogen fertiliser
application in glasshouse lettuce (LINK). Final LINK project report to HDC. Copyright,
Horticulture Research International, Wellesbourne, Warwick, CV35 9EF.
European Commission (2001). Commission Regulation (EC) No. 466/2001 of 8
March 2001. Official Journal of the European Communities No. 77/1.
European Commission (2006). Commission Regulation (EC) No. 1881/2006 of 20
Dec 2006. Official Journal of the European Communities No. L364/5.
European Commission (2006). Commission Regulation (EC) No. 1882/2006 of 20
Dec 2006. Official Journal of the European Communities No. L364/25.
European Commission (2011). Commission Regulation (EC) No. 1258/2011 of 02
Dec 2011. Official Journal of the European Union No. L320/15.
European Food Safety Authority (2008). Nitrate in vegetables. EFSA Journal 68:91–
79.
van Eysinga, J. P. N. L. R. (1984). Nitrate in vegetables under protected cultivation.
Acta Horticulturae, 145, The Use of Fertiliser in Protected Vegetable Production; 251-
256.
Farrington, D. S. (1991) A comparison of the accuracy of extraction methods used in
nitrate residues monitoring programme. Final report on Project C03016 to the Food
Standards Agency.
Food Standards Agency Project C04038. UK Monitoring Programme for nitrate in
lettuce and spinach, analysis of samples. Direct Laboratories (2004-2006).
Food Standards Agency Project C04056. UK Monitoring Programme for nitrate in
lettuce and spinach. Eurofins Laboratories (2006-2008).

Nitrate Surveillance Final Report, 2014 – 2018 v3 amended 130220 36
HDC Project FV370 (2010). Wild rocket: managing and reducing nitrate levels.
Industry Code of Good Practice to minimise nitrate content of lettuce grown under
protected cropping culture in UK. Version 2 May 1999.
Richardson, S. J. and Hardgrave, M. (1992). Effect of temperature, carbon dioxide
enrichment, nitrogen form and rate of nitrogen fertiliser on the yield and nitrate
content of two varieties of glasshouse lettuce. Journal of the Science of Food and
Agriculture, 59; 345-349.
Roques, S and Weightman, R. M. (2010). Wild rocket: managing and reducing nitrate
levels. Final report on project FV370 for the Horticultural Development Company.
AHDB-HDC, Stoneleigh Park, Kenilworth, Warwicks, CV8 2TL UK, December 2010.
Silgram, M. (2005). Scientific and technical revision of the IRRIGUIDE water balance
model. Final report for UK Defra project NT2517. 12pp.
Silgram, M., Hatley, D., Gooday, R. (2007). IRRIGUIDE: a decision support tool for
drainage estimation and irrigation scheduling. Proceedings of the 6th Biennial
Conference of the European Federation of IT in agriculture (EFITA)/World Coongress
on Computing in Agriculture (WCCA) 2007 joint conference “Environmental and rural
sustainability”. Glasgow, UK, 2-5 July 2007.
M. Thompson (ed.) and R. Wood, “Guidelines on Internal Quality Control in Analytical
Chemistry Laboratories”, Pure Appl. Chem., 1995, 67, 649-666.
Weightman, R. M., Dyer, C., Buxton, J. and Farrington, D. S. (2006). Effects of light
level, time of harvest and position within field on variability of tissue nitrate
concentration in commercial crops of lettuce (Lactuca sativa) and endive (Cichorium
endiva). Food Additives and Contaminants, 23 (5); 462-469.
Weightman RM, Smith JA, Huckle AJ, Hudson EM. (2012). Monitoring and controlling
levels of nitrate in UK fresh produce. Aspects of Applied Biology. Acrylamide, furans
and other food-borne contaminants.