final report - university of denver
TRANSCRIPT

Final Report
The Effects of Individualized Actigraph Feedback on Fatigue Management in Railroad Engineers
Patrick Sherry, Ph.D. &
Karen E. Philbrick, Ph.D.
University of Denver
This research was sponsored in part by Grants from the National Center for Intermodal Transportation,
The Federal Railroad Administration, and the Burlington Northern Sante Fe Railroad
DISCLAIMER: The contents of this report reflect the views of the authors, who are responsible for the facts and the accuracy of the information presented herein. This document is disseminated under the sponsorship of the Department of Transportation, University Transportation Centers Program, in the interest of information exchange. The U.S. Government assumes no liability for the contents or use thereof.

Galesburg Fatigue Study
Executive Summary
A total of twenty-one participants completed the three-month study designed to assess the functionality of improving individual sleep habits with actigraph performance feedback. There were eleven participants in the feedback group and ten participants in the non-feedback group. Each of these individuals completed three surveys. The first survey was administered on June 17th 2002, the second on July 14th 2002, and the third survey on August 28th 2002. Participants wore the non-performance feedback actigraphs for a 30 day baseline period followed by a 30 day period where half of the participants wore a feedback actigraph and half continued to wear the non-performance feedback actigraph. Results indicate that study participants in the found the performance actigraph to be a useful tool for fatigue management. While there were not statistically significant differences between the feedback and non-feedback actigraph participants on indices assessing stress, fatigue, job satisfaction, anxiety, or quality of life, significant differences were found between the two groups on questions assessing the usefulness of the actigraph. Specifically, the most robust findings indicated that the performance sleep watch helped participants in the experimental group monitor their fatigue levels. Lack of significance in this case is not surprising due to the small sample size. Oin order to be able to detect an effect we would have needed approximately 45 people in each condition. Thus, the present results, occurring in the predicted direction, are promising and and suggest the need for further study. Interestingly, however, the trends were in the predicted direction suggesting that if the results sample size had been large we might have been able to detect a significant effect. Finally, 70% of engineers in the experimental group indicated that the performance readings made them more aware of their fatigue levels to a “Considerable or Very Great Degree”. Again, this suggests that for this group, the performance readings increased their awareness of the need for rest. Approximately 56% of participants felt more prepared to “deal with fatigue” as a result of the performance readings on the actigraph. Statistical comparisons of the variability of the measures of sleep obtained from the actigraphs indicate that the variance of several of the measures was significantly different between the two groups. More importantly however, the fact that there is a significant difference in variability between the two groups on several sleep measures is in accordance with our predictions. Namely, it was thought that the performance feedback watches would lead to increased sleep and overall improved sleep hygiene. The results would suggest that those wearing the performance feedback watches had significantly less variability in their sleep. The present results are in line with these hypotheses.
Sherry & Philbrick 2

Galesburg Fatigue Study
Introduction
History of Fatigue in the Transportation Industry
The study of the role of fatigue and transportation has a long history. As early as 1907, Congress enacted the Hours of Service Act to enhance railroad safety by limiting the number of hours that railroad engineers and other railroad employees could work. However, the earliest published study of the effects of fatigue on locomotive engineers was in 1971 (Grant, 1971). Due to the ever-changing complexity of the demands faced by drivers and operators in all modes of transportation, the topic of fatigue continues to be the focus of intense study (Sherry, Bart, & Atwater, 1997). Over the past few years there have been increased efforts to address the problems of fatigue in the railroad industry. A USDOT/FRA report in 1991 (Pollard, 1991) identified causes of fatigue, such as: uncertainty about the time of one’s next assignment, excessive working hours, long commutes and waiting times before beginning work, unsatisfactory conditions for sleeping at some terminals, and the decision not to rest during the day even when subject to call the next night. Suggestions for remedying the situation included: a minimum of eight hours notice before being called to work, greater predictability in scheduling trains, and division of assignments according to blocks of time. However, it is important to realize that at this point while much is known, much is not known about fatigue in the transportation industry. Measuring fatigue in the workplace is a complex process. It is common to use both subjective and objective measures of fatigue and alertness to evaluate the impact of a countermeasure, as multiple measures allow the investigator to triangulate the truth and produce a more convincing conclusion. There are four kinds of measures that are typically used in measuring fatigue; physiological, behavioral, subjective self-report and performance measures. Behavioral measures of sleep have been gaining popularity in the last few years. These devices, most commonly known as actigraphs, have been used to measure sleep based on the frequency of body movement. The test subject wears a wristwatch-like recording device that detects wrist movements. The number of body movements recorded during a specified time period, or epoch, has been significantly correlated with the presence of sleep. Several studies have been conducted using actigraphy that have found a significant relationship between EEG levels and the presence of sleep as indicated by actigraph measures. Actigraphy has been used to determine the amount of sleep that a person is obtaining and these measures are useful for studies that cannot be conducted under controlled settings. Actigraphy measurements, and sleep wake algorithms, have been validated by demonstrating significant correlations with data obtained from polysomnographic measures (r = .90) (Cole, et al, 1992). Thus, it appears that the use of actigraphy may be as useful and valid as other more expensive and time-consuming options.
Sherry & Philbrick 3
Galesburg Fatigue Study
Role of Feedback in Safety Performance Behavioral Approaches to Safety Behaviorism began in the early 1900s as an attempt to understand the human learning process and was largely promoted by a psychologist named Watson (1930). It was later, in the 20th century, that B.F. Skinner wrote a book called Walden Two (1948) in which he outlined a utopian society based on the application of behavioral principles. This led to the modern study of behavior modification.
The application of behavioral psychology to industrial and business settings was popularized in the late 70’s and early 80’s. Petersen began writing about the behavioral influences on the occurrence of accidents and injuries in the workplace (Petersen, 1984). He described the role of specific acts or tasks that occur in the process of completing or performing ones prescribed duties. A typical example is the act of placing one's hand in the way of a press or a blade to remove an obstruction and in the process suffering a cut or other injury. Similarly, the act of using a seat belt is considered a safe act that reduces the risk of serious injury following a collision. These and other acts or procedures engaged in while carrying out job duties are considered behavioral influences on the occurrences of accidents or injuries.
A complete understanding of the factors that influence the occurrence of safe work behavior, however, must be seen in the context of the interaction of the person and the environment. It is typically accepted that the behavior of a specific individual is related to the situation that they find themselves in. In the late 1940’s Kurt Lewin and his colleagues at the University of Iowa began to theorize on the effects of the interaction of these variables. Lewin proposed the notion that the interaction of the person with the environment would specifically influence the occurrence of behavior. These ideas then led to the development of the now famous formula:
B = ƒ (P * E)
Where B equals behavior, P is a person or person variable, and E is the environment or an environmental variable. Thus the formula indicates that behavior is a function of the interaction of the person and the environment.
If we look at behavior in this context then we will see that we are interested in the effects of other variables on the performance of a specific behavior. Accordingly, we are concerned with the occurrence of desired safe work behaviors and therefore in the subset of performance indicators which will be related to the acceptance and engagement in critical work behavior.
Over the past 30 years a number of models have been proposed to understand unsafe work performance or in common terms unsafe acts. For example, in 1911 Greenwood and Woods, as part of the Industrial Research Board in Australia, statistically examined accident rates in a munitions factory. Analysis of the data suggested that some people were consistently more involved in accidents than others, thereby supporting the proposition that “accident
Sherry & Philbrick 4

Galesburg Fatigue Study
proneness” existed. This became a model for explaining and understanding safety thinking and research for almost 50 years (Cooper, 1998).
Heinrich (1931) however, proposed that accidents were caused either by an unsafe act, an unsafe condition, or both. His theory was termed Heinrich’s Domino Model of Accident Causation and it brought in to play the idea that safe behavior was important as well as the roles that behavior, conditions, or the situation played. Essentially, the Domino model postulated that accidents were caused by a sequence of events, which covered five distinct phases. The first phase was considered the hereditary and environment of the person which would predispose them to act in a certain way. Heinrich argued that each of these was like a series of dominos arranged in such a way that if one fell then the others were likely to fall in sequence. Heinrich concluded that the key domino was that pertaining to unsafe acts and the notion that 80% of accidents were triggered by unsafe acts, with the remaining 20% being triggered by unsafe conditions.
Figure 1. Domino Theory of Safety Performance Weaver (1971) modified the original theory to propose that the last three dominos in the sequence were caused by management omissions. Weaver believed that the underlying cause of accidents were unsafe acts. However, he believed that the cause could be determined by asking, “What was the unsafe act? Why was it allowed to occur? “ and “Were rules and procedures known to all concerned?”. In essence, this model placed considerable responsibility for performance of accidents onto the shoulders of management and supervision, while also recognizing the importance of the system, which contributed to the conditions, which produced performance.
In 1976, Adams suggested that organizational, rather than person-centered factors, were related to the occurrence of accidents. In effect, he moved away from the “accident proneness” model and into a more complete culture and situation-centered focus. Adams suggested that unsafe work performance was due to the management structure; organization objectives; the organization of the work, and how work tasks were planned and executed. Thus, according to Cooper (1998), Adams was one of the first theorists to specifically highlight the multiple interactions between organizational structure, systems and sub-systems, and unsafe conditions and/or employee’s safety work performance.
It was not until Reason (1990) argued that all organizations carried the seeds of their own demise, that theorists began looking at the organizational structure to understand the roots of unsafe behavior. He suggested that a system carried its own latent failures in the form of managerial factors and individual factors. Reason identified various types of accident
Sherry & Philbrick 5

Galesburg Fatigue Study
performance factors and argued for the focus on the overall management system, particularly in relation to the implementation of the organization’s strategic decisions.
Haynes, Pine, & Fitch (1982) evaluated the effectiveness of an intervention package (feedback, competition, and incentives) in reducing the accident rate of urban transit operators. One hundred operators were divided into teams and offered rewards for accident-free driving over 18 weeks. Results showed a 24.9% reduction in accident rates, establishing a definite link between the intervention and reduction in accident rates, severity, and cost.
Karan and Kopelman (1987) provided outcome feedback regarding the actual frequency of accidents at a vehicle dispatch and maintenance facility. This outcome feedback was not provided at two similar comparison facilities. Over a 43-week experimental period, the rate of vehicular accidents declined by roughly 5% in the experimental facility, while accidents increased by roughly 17% in the two comparison facilities—thus, there was an overall improvement of approximately 22%. Concurrently, the rate of industrial accidents declined by roughly 12% in the experimental facility versus an increase of 4% in the comparison facilities--an overall improvement of approximately 16%.
There are numerous examples of the application of this type of model to the occupational safety arena. Two studies by Sulzer-Azaroff (1981, 1997) demonstrated the application of these principles to an industrial laboratory setting and a nursing home. Both situations met with considerable behavioral change. Additionally, a study by Sierro, Boon, Kok, and Sierro (1989) was designed to change the driving behavior of mail-van drivers so as to encourage energy saving. Based on empirical analysis, three approaches were used to influence driving behavior: providing information, providing task assignment and control, and providing feedback on gasoline consumption. The effectiveness of the program was tested in a field experiment. Attitudes, social norms, and reported behavior changed, and energy savings of more than 7% were achieved, compared with a control group.
More recently, Cooper (1998) offered a model of safe work behavior that identified a reciprocal relationship between an organization’s safety management systems, the prevailing safety climate, and the daily goal-directed safety behavior. Cooper argued that each of these components could be directly measured and quantified. From a practical standpoint, the model can be applied to each component variable. For example, Cooper suggested measuring people’s attitudes (Person) about the prevailing climate (Situation), the level of perceived risk (Person), and management’s commitment to safety (Situation). According to the model, the ability to implement new safety behavior is affected by the levels of commitment, competing goals, and quality of organizational communication.
Behavior
Situation
Person
Figure 2. Behavioral Based Safety Performance Model.
Sherry & Philbrick 6

Galesburg Fatigue Study
A similar model of factors that affect safe work performance was suggested by Geller (1998). This model included the Person, Environment, and Behavior variables in a model labeled the Safety Triad (Geller, 1989). In this model, the three factors are thought to be dynamic and interactive, such that changes in one factor eventually impact the other two. For example, behaviors that reduce the probability of injury often involve environmental change and lead to attitudes consistent with safe work performance. According to Geller, the behavior based approach starts by identifying observable behaviors targeted for change and the environmental conditions and contingencies that can be manipulated to influence the target behaviors in desired directions.
A second type of behavioral influence on occupational safety is the role of antecedent factors such as psychological or attitudinal influences. Most traditional safety programs emphasize a need to increase employee's awareness of safety hazards and in so doing prevent injury. This is considered an environmental influence on behavior. The influences on behavior may change worker activities such that unsafe acts occur. Other research however, has shown that job satisfaction, stress (Weller & Sherry, 1992), and attitudes toward supervisors (Sherry, 1991) are significantly related to the occurrence of accidents, health, and job safety.
As can be seen from the figure below, Sherry (1992) argued that the effects of person and organizational behavior on the behaviors that lead to safe work performance are significant. However, there are several other factors that in turn influence behavior. Behavior is influenced by the effects of antecedents, consequences, and actions that precede a specific behavior and is paramount to understanding and eventually controlling the behavior that is deemed to be risky or even unsafe. Again, Sherry (1992), using a behavioral approach to safety, attempted to identify the antecedents, behaviors desired, and the consequences of those behaviors. This ABC approach to understanding work performance was useful in changing the behavior of the employees of a railroad car repair facility.
Sherry & Philbrick 7
Figure 2. Factors Affecting Safety

Galesburg Fatigue Study
Writing about the need to improve the environmental conditions under which behavior change might be maintained, Krause, Hidley and Hodson (1990) promoted the idea that a safety corporate environment needed to be created so as to sustain the behaviors that needed to be changed. Krause, Hidley and Hodson (1990) applied behavioral principles to improve safety performance by engaging workers in the improvement process, teaching them to identify critical safety behaviors, perform observations to gather data, provide feedback to encourage improvement, and use gathered data to target system factors for positive change. This approach combines the principles of applied behavior analysis (and “behavior modification”), quality management, organization development, and risk management. This approach attempts to put at its crux the need to focus on behaviors, actual human activities performed in the workplace, as opposed to focusing on accidents and incidents rates. One transportation application of behavioral approaches to safety cited in Knipling and Olsgard (2000) involved a North American oil and gas company. Drivers identified a cluster of 16 behaviors common to their history of vehicle-related accidents and injuries. These 16 behaviors fell into two categories: preventive maintenance (e.g., inspecting brakes) and driving behaviors (e.g., following distance, checking mirrors, avoiding distractions). Once these behaviors were identified and operationally defined, observations were initiated to collect data, provide feedback, and encourage improvement. Both self-observation and peer-to-peer observation was encouraged. Management monitored progress but the emphasis was not on surveillance or punishment for recalcitrant drivers.
Geller (1998) too, writes about an antecedent, behavior, consequent process in which it is imperative to define a critical target behavior. This critical behavior is then observed during a pre-intervention baseline period to set behavior change goals and also to understand the natural environmental or social factors influencing the target behaviors. Next, there is an intervention designed to change the target behaviors in the desired direction. Finally, a test to determine the impact of the intervention procedure by continuing to observe and record the target behaviors during the intervention program was developed.
Geller (2000) evaluated behavior-based interventions (BBIs) designed to increase the safe-driving practices of nineteen 44 year-old pizza deliverers. He focused on goal-setting and feedback techniques, including: (a) non-numerical goals in an awareness and promise card intervention; (b) non-numerical goals mandated as company policy; (c) participative and assigned group goal setting and feedback; (d) group goal setting and feedback with added public individualized feedback; (e) individualized feedback and competition; and (f) private individualized feedback paired with dynamic, static, or dynamic and static goals.
An additional BBI evaluated a community program in which pizza deliverers acted as behavior change (BC) agents for safety-belt use. Two BBI effectiveness models were evaluated for their ability to help practitioners design BBIs that maximize both short-term and long-term impacts as well as desirable response generalization. The amounts of individual involvement, peer support, response information, and external consequences influenced the beneficial impacts of the BBIs. Additionally, behavior change and maintenance after BBI withdrawal varied with the degree of peer support and involvement in the BBIs' designs. Employee involvement increased desirable response generalization while
Sherry & Philbrick 8

Galesburg Fatigue Study
external consequences seemed to be associated with undesirable spread of presumed counter control effects. This review then, has identified the behavioral based safety approach as one that may be useful in addressing the concerns that operators have regarding the adoption and utilization of various OBSM systems. Perhaps, through the use of behaviorally based safety concepts, the resistance and reluctance to engage in safe work behaviors that involve the utilization of OBSM systems can be reduced.
Effects of Feedback
Much of the success of the behavioral approach to safety is based on the notion that feedback of any type can have a positive effect on safety behavior. The basic idea comes from operant theory (Skinner, 1947) as well as cognitive – behavioral theories on behavior change (Beck, 1993). However, the effects of feedback on performance have only received attention in the psychological research literature.
A review article by Balzer (1989) found that in some conditions feedback interventions improve performance, in other conditions feedback interventions have no apparent effect on performance, and in yet others feedback interventions debilitate performance. These conditions or moderators of the effect of feedback interventions (FIs) on performance are poorly understood and go far beyond the view that feedback interventions improve performance unless the feedback is too negative. However, many researchers still assume that feedback interventions consistently improve performance.
Two meta-analyses, testing theories that contained feedback as a component, found only a weak contribution of feedback to performance. First, Harris and Rosenthal (1985) tested several hypotheses designed to explain the well-documented beneficial effect of expectations of others (agents) on one's performance. When agents (primarily teachers) expect high performance from others (primarily students), they may provide more feedback, more challenging goals, and create a better climate for the students. This meta-analysis showed that the amount of feedback provided by the agent had only a meager effect on performance (r = .07), whereas other variables, such as the climate that the agent created for the other person had strong effects on performance, (r = .36) (Harris & Rosenthal, 1985 ). Second, a test of the job-characteristics model showed that perceived knowledge of results had a weak relationship with performance ( r = .09) but a stronger effect on variables such as overall job satisfaction ( r = .41; Fried & Ferris, 1987 ). The meta-analysis showed, not surprisingly, that FIs improve performance by approximately .4 of a standard deviation (a finding similar to a limited meta-analysis of FIs by Guzzo, Jette, & Katzell, 1985 ). However, there was also a great variability in FI effects such that in over one third of the cases FIs reduced performance. Most of the observed variability cannot be explained by sampling or other errors. As such, it provides strong empirical support for the conclusion of FI researchers who are identified with various theoretical approaches: namely, FIs are double-edged swords because FIs do not always increase performance and under certain conditions are detrimental to performance.
Sherry & Philbrick 9

Galesburg Fatigue Study
FI cues that seem to direct attention to task-motivation or task-learning processes may augment FI effects on performance. This pattern of findings provides reasonable support for the first two propositions. Specifically, both praise and FI designed to discourage were postulated to increase attention to meta-task processes and were found to attenuate FI effects. Furthermore, both the attenuating effect of praise and the non-significant effect of an FI are not easily predicted by most FI-related theories. The debilitating effects of praise on performance received some direct experimental support both in the laboratory and in the field and were explained, respectively, by a model of self-attention (Baumeister et al., 1990 ) and by control theory (Waldersee & Luthans, 1994 ).
Physical tasks and following rules tasks yielded weaker FI effects, and memory tasks yielded stronger FI effects. Other results strongly suggest that task type places a serious boundary condition on the knowledge and effectiveness of various interventions designed to improve performance (cf. Hammond, 1992 ). Therefore, some researchers suggest that the lack of a valid task taxonomy that can be used across vastly different tasks (e.g., vigilance, memory, and adherence to regulations) poses a serious obstacle for FI research. Moreover, even within similar types of tasks the "effects of feedback seem to be very sensitive to the task environment [difficulty]" (Castellan & Swaine, 1977, p. 118).
The effects of individual differences on the effects of FI have also recently been examined. In a laboratory study using college students Nease (1999) found that individuals with high self-efficacy are less accepting of consistently negative feedback than are low-self-efficacy individuals, who do not appear to differ in their acceptance of repeated negative feedback.
Nease (1999) argued that these results were consistent with previous research on self-verification theory which posits that people tend to endorse feedback about themselves as valid only when that feedback fits within their conceptions of self (Markus, 1977 ; Swann, 1987). Moreover, studies supporting this theory have also found that people tend to attribute self-confirmatory feedback to personal characteristics, whereas feedback that is disconfirmatory is attributed to the source of the feedback (Swann, Griffin, Predmore, & Gaines, 1987 ). Other research has found that individuals with low levels of self-esteem are willing to accept more responsibility for negative feedback and are more likely to perceive that feedback as accurate compared with high-self-esteem individuals (Jussim, Yen, & Aiello, 1995 ).
These results suggest the need to further investigate the overall characteristics of the task and the cues associated with the task to be performed. As yet, it cannot be said with any certainty that feedback alone will increase performance. Individuals may choose to ignore feedback for many reasons including task characteristics and personality variables. Further research is needed to clarify these phenomena.
Thus, research studies suggest that it is a combination of factors that work together to affect performance. To understand which factors have the ability to alter behavior, further study of performance feedback is needed to understand the effects that this type of feedback may have on an individual’s behavior.
Sherry & Philbrick 10

Galesburg Fatigue Study
Description of the Project and Data Collection Procedures The current project was designed to obtain individual participation in the monitoring of fatigue through the use of individual fatigue monitors. The goal of this study was to determine whether individual feedback devices, such as actigraphs, could be useful for helping railroad employees better plan their sleep and wake activity. Project participation consisted of the completion of a consent-form, several survey questionnaires, a daily sleep log, and wearing an Actigraph, which measured sleep and work during the course of the project. Prior to soliciting participation, it was necessary to identify those conditions that would exclude an engineer from participation. Specifically, those persons who were not able to wear the activity monitors for the full 60-day period were not eligible to participate. Similarly, persons who had a diagnosed condition that affected their sleep patterns, and persons who were working a schedule that would be dramatically different from the typical pool assignment also were not eligible for participation. Once an individual agreed to participate, he or she was notified that data collected as a result of participation in the project would only be shared with the participants themselves. They were also notified that the BNSF agreed not to request or seek to obtain data collected as a result of this project. Finally, participants were informed that only summary statistics such as means and percentages, not individual scores or results, would be revealed to the BNSF or any other group or entity in the course of discussing the results of the project. Each person was assured that participation was voluntary and could be discontinued at any time. Participant Information In order to begin the project in Galesburg Illinois, and to recruit the necessary participants, it was necessary to spend a significant period of time at the Galesburg depot. The goal of this project was to recruit thirty engineers who would commit to wearing an Actigraph sleep watch, 24 hours a day, for two consecutive thirty day periods. In addition to wearing the sleep watch, participants were asked to complete a daily sleep log that cataloged their activities for each of the thirty days. This was a simple task, whereby a participant would account for their actions according to a legend (e.g., “s” = sleep/ “w” = work/ etc.). Additionally, all engineers and conductors going in to or out of the Galesburg depot were asked to complete a survey designed to identify fatigue related issues. To recruit the actigraph participants, it was necessary for a researcher to greet each individual as he or she came on or went off duty. Participants were informed of the purpose of the study and invited to participate by 1) completing a survey, 2) wearing an actigraph sleep watch, and 3) completing a daily sleep log. Only the identities of the engineers in the Chicago, Creston, and LaCrosse pools were identified to the researchers. A total of 29 individuals agreed to complete all three portions of the study in May of 2002. Below is an illustrative breakdown of these participants by craft and pool assignment.
Sherry & Philbrick 11

Galesburg Fatigue Study
Engineer Conductor Trainmaster Management Chicago 12 Creston 10 1 LaCrosse 3 Galesburg 2 1
In addition to collecting surveys from these individuals, an additional 100 engineers and conductors completed the Galesburg Time 1 Fatigue Survey. Demographic Results are presented in the table below.
Characteristic N Gender Male 123 Female 1 Race White 108 Asian 1 Black 10 American Indian 1 Hispanic 1 Other 2 Age 20-29 years 19 30-39 years 37 40-49 years 37 50-59 years 28 60-69 years 4 Educational Level High School Degree 45 1-3 years of College 54 4-5 years of College 20 Craft Engineer 58 Conductor 58 Engineer/Conductor 8 Hostler 1 Although 129 engineers and conductors completed the Time 1 survey, not all of the respondents indicated their gender, age, race, educational attainment, or craft. Thus, the numbers reported for each characteristic in the above table may not total 129. Age of survey respondents ranged from 22 to 65 years, with a mean of 41 years of age. The average number of years of education reported was 13.29, indicating that the average Galesburg survey respondent had a high school degree as well as one additional year of post high school education. Number of years as a railroad employee ranged from 1 to 46, with the average tenure as an employee being 13.97 years.
Sherry & Philbrick 12

Galesburg Fatigue Study
The Galesburg Time 2 Fatigue Survey was given June 15, 2002. While many of the content questions were intentionally identical to the Time 1 survey (to aid in making comparisons), the demographic data collected was slightly different. Specifically, gender, race, age, and educational attainment were not asked. Fifty-nine individuals completed the Time 2 survey. Of these respondents, 22 were conductors, 35 were engineers, and 2 did not indicate their craft. The Galesburg Time 3 Fatigue Survey was given July 15th, 2002. This survey was given only to those individuals who were also wearing an actigraph. This differs from the Time 1 and 2 survey collection procedure, as these were given to all engineers and conductors at the depot during the data collection period. A total of 18 individuals completed the T3 survey, 17 of which were engineers. As previously indicated, 29 individuals initially agreed to participate in this study by wearing an actigraph and completing a daily sleep log. Eight, or 28%, of these 29 participants discontinued participation in the study during the first month. Thus, a total of 21 participants completed this study in its entirety. Below is an illustrative breakdown of these participants by craft and pool assignment. Engineer Conductor Trainmaster Management Chicago 10 Creston 7 1 LaCrosse 3 Galesburg
During the first month of the study all participants wore the same type of non-performance actigraph. This was done for a variety of reasons. First and foremost, it allowed the researchers to gather baseline activity data on each participant, and it also allowed each participant a period of time to become accustomed to keeping a daily sleep log and to wearing a large “wristwatch” for approximately 24 hours a day. After the first thirty-day period ended, researchers arrived back on site in Galesburg to meet, in person, with each study participant. At that time, Time 1 sleep logs were collected, the Time 2 survey was administered, and the battery in each actigraph was changed to ensure continual motion recording. It was during the second meeting with each participant that the performance monitoring actigraphs were randomly distributed to half of the sample. A total of ten participants received the performance watches and eleven participants received the non-performance watches. Each of the individual’s who received the performance watch were given instruction on how to interpret the performance reading as well as instruction on various fatigue countermeasures. For example, if an individual saw that his or her performance reading was in the 70’s and knew that he or she was likely to be called to work in the evening, the merit of napping instead of completing domestic chores was discussed and emphasized. Each individual in the experimental group was also instructed not to discuss their type of actigraph with the other participants in the study. Finally, approximately two weeks after the performance watches were distributed, a researcher called each individual to inquire about how the watch was working and to address any questions and/or concerns that were presented.
Sherry & Philbrick 13

Galesburg Fatigue Study
At the end of the second month of the study, each participant received a $25.00 gift certificate to a local restaurant. Similarly, at the end of the third month each participant received an additional $25.00 gift certificate, for a combined total of $50.00 for wearing an actigraph for three months. A total of three measurements took place in 2002. Again, researchers arrived on site in Galesburg Illinois on May 15th, July 15th, and on August 15th. At the Time 1 measurement, fatigue surveys were administered and actigraphs were distributed. At the Time 2 measurement, fatigue surveys were again administered and a brief meeting was held with each actigraph participant. During this meeting, half of the participants received a feedback actigragh and the batteries were changed in the non-feedback actigraphs. At the Time 3 measurement, a final questionnaire was given to the actigraph participants only and the “watches”, as well as the sleep logs, were collected. Thus, three sources of information were gathered at the final measurement time. Assessment Instruments The assessment instruments that were administered at each phase consisted of the following: Phase I – Baseline – 30 days
1. Fatigue Survey • Stanford Sleepiness Scale • Eppworth Sleepiness Scale • Denver Job Satisfaction Scale • Denver Fatigue Adjective Checklist • Denver Sleepiness Scale • Denver Depression Scale • Denver Anxiety Scale • Denver Stress Scale • Denver Quality of Life Scale • Shift Work Index - Exhaustion • Shift Work Index - Depression • Shift Work Index - Quality of Life
2. Actigraph Monitoring 3. Sleep and Activity Logs
Phase II - Post Testing – 30 days
1. Fatigue Survey (please see above for included indices) 2. Actigraph Monitoring 3. Sleep and Activity Logs
Sherry & Philbrick 14

Galesburg Fatigue Study
Additional Information Regarding Study Materials Actigraphs -- These devices are essentially motion detectors. They are able to keep track of
the amount of body movement that occurs. They are mechanical and do not harm the individual wearing them. They do not keep track of pulse or electrical activity. They must be worn continuously but should be taken off for showering or bathing or vigorous exercise. Various studies over the years have demonstrated a very strong relationship between body movement and sleep.
Here is what an Actigraph looks like….
Participants were asked to wear the device for 30 days. At the end of the thirty-day period they were given feedback on their work/rest habits during the monitoring period and then were asked to wear the device for another thirty days. Each study participant was shown his or her Actigraph feedback chart and a discussion of the information contained in the report took place. Such feedback charts look like the one listed below and basically describe the work/rest sleep/wake pattern that the individual engaged in during the 30-day monitoring period. The chart below shows the sleep/wake activity for a person for approximately seven days. The dark black lines show the activity. The turquoise shaded areas show the likely sleep episodes.
Sherry & Philbrick 15

Galesburg Fatigue Study
Researchers were on-site to address any questions and/or concerns that participants had to the information they were given regarding their work/rest habits. Such information included mean activity score, sleep after wake onset, sleep efficiency, wake episodes, and activity indices.
Sherry & Philbrick 16

Galesburg Fatigue Study
Self-Report Survey Results There are several ways to determine whether a person is fatigued or not. We can simply ask the person if they are fatigued or sleepy or tired. We can examine their brain waves, we can examine their performance, or we can see how long it takes them to fall asleep. All of these approaches have pros and cons. In field settings, like the railroad, it is most economical to ask participants to complete standardized questionnaires that have been correlated with laboratory findings. This technique is typically used to make preliminary assessments of persons who are presenting with possible sleep disorders in medical settings. These questionnaires then give a reasonable indication of the level of fatigue and tiredness that persons are experiencing. Comparisons Between Time 1, Time 2, and Time 3 To determine whether scores on any of the self-report indices changed significantly for the actigraph participants from Time 1 to Time 3, one-way ANOVA’s were conducted. Significance levels, in addition to means and standard deviations, are reported below.
N Mean Standard Deviation Significance (2-tailed)SSS-Current Alertness 38 3.3158 1.4539 .590 SSS-Alertness Last Week 38 4.0263 1.1505 .898 Eppworth Sleepiness Scale 40 8.6000 4.0115 .396 Denver Job Satisfaction Scale 41 2.4797 .9281 .000 Denver Fatigue Adjective Checklist 41 2.4111 .7923 .441 Denver Sleepiness Scale 41 2.9106 .5376 .728 Denver Depression Scale 41 2.9512 6.8042 .361 Denver Anxiety Scale 41 2.1744 .6895 .384 Denver Stress Scale 41 2.7073 .7069 .695 Denver Quality of Life Scale 41 2.4439 .7906 .265 Shift Work Index - Exhaustion 41 2.7195 .8124 .256 Shift Work Index – Depression 41 2.9824 .5937 .001 Shift Work Index - Quality of Life 41 2.6301 .9955 .000
Results of these analyses yielded three significant findings. Specifically, there are significant differences on the Denver Job Satisfaction Scale between the different points of measurement, (F (2,38) = 25.805, p<.000). These results suggest that satisfaction with one’s job increased over the course of this study. In fact, at the Time 3 measurement, 38.9% of respondents indicated that they were satisfied with their job, to either a “Considerable” or a “Very Great Degree”. Results of the one-way ANOVA on the Shift Work Index – Depression scale were also significant, (F (2,38) = 9.330, p<.001). This finding indicates that, from Time 1 to Time 3, subjective feelings of depression decreased, as evidenced by the endorsement of fewer items assessing unhappiness and lethargy, while feelings of well-being increased. Participants felt more capable of making decisions (mean = 3.89) and experienced increased enjoyment of day-to-day activities (mean = 2.78).
Sherry & Philbrick 17
Galesburg Fatigue Study
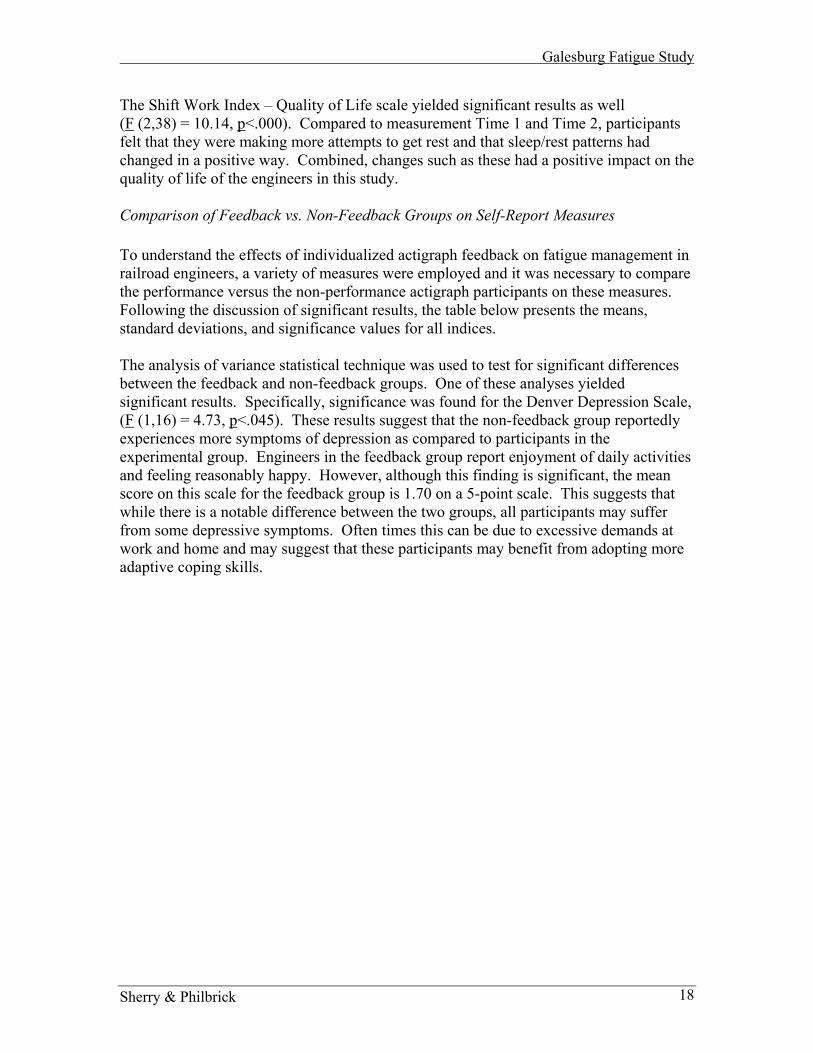
The Shift Work Index – Quality of Life scale yielded significant results as well (F (2,38) = 10.14, p<.000). Compared to measurement Time 1 and Time 2, participants felt that they were making more attempts to get rest and that sleep/rest patterns had changed in a positive way. Combined, changes such as these had a positive impact on the quality of life of the engineers in this study. Comparison of Feedback vs. Non-Feedback Groups on Self-Report Measures To understand the effects of individualized actigraph feedback on fatigue management in railroad engineers, a variety of measures were employed and it was necessary to compare the performance versus the non-performance actigraph participants on these measures. Following the discussion of significant results, the table below presents the means, standard deviations, and significance values for all indices. The analysis of variance statistical technique was used to test for significant differences between the feedback and non-feedback groups. One of these analyses yielded significant results. Specifically, significance was found for the Denver Depression Scale, (F (1,16) = 4.73, p<.045). These results suggest that the non-feedback group reportedly experiences more symptoms of depression as compared to participants in the experimental group. Engineers in the feedback group report enjoyment of daily activities and feeling reasonably happy. However, although this finding is significant, the mean score on this scale for the feedback group is 1.70 on a 5-point scale. This suggests that while there is a notable difference between the two groups, all participants may suffer from some depressive symptoms. Often times this can be due to excessive demands at work and home and may suggest that these participants may benefit from adopting more adaptive coping skills.
Sherry & Philbrick 18

Galesburg Fatigue Study
Comparisons Between Feedback vs Non-Feedback Groups
9 3.1111 1.9003 .8898 3.0000 1.1952
17 3.0588 1.56019 3.7778 .9718 .3098 3.1250 1.5526
17 3.4706 1.280510 8.2000 3.2249 .387
7 6.8571 2.7946
17 7.6471 3.0402
10 3.1667 .6713 .3758 2.9167 .4272
18 3.0556 .574510 2.1429 .7882 .968
8 2.1607 1.045418 2.1508 .882610 2.5667 .5890 .364
8 2.2500 .849818 2.4259 .712210 1.7000 .6749 .045
8 1.1250 .353618 1.4444 .615710 1.9000 .7789 .850
8 1.8250 .877918 1.8667 .800010 2.8000 .7246 .111
8 2.1979 .789218 2.5324 .793210 2.3000 .7557 .440
8 2.6250 .988118 2.4444 .855610 2.2000 .7528 .800
8 2.0938 .999418 2.1528 .845110 2.4667 .3770 .401
8 2.2917 .485918 2.3889 .424810 2.2000 .7730 .272
8 1.7917 .733318 2.0185 .7625
FeedbackNoFeedbackTotalFeedbackNoFeedbackTotalFeedbackNoFeedbackTotal
FeedbackNoFeedbackTotalFeedbackNoFeedbackTotalFeedbackNoFeedbackTotalFeedbackNoFeedbackTotalFeedbackNoFeedbackTotalFeedbackNoFeedbackTotalFeedbackNoFeedbackTotalFeedbackNoFeedbackTotalFeedbackNoFeedbackTotalFeedbackNoFeedbackTotal
Stanford SleepinessScale - Current
Stanford SleepinessScale - Last Week
T3 EppworthSleepiness Scale
T3 Denver JobSatisfaction Scale
T3 Denver FatigueAdjective Checklist
T3 DenverSleepiness Scale
T3 DenverDepression Scale
T3 Denver AnxietyScale
T3 Denver StressScale
T3 Denver Quality ofLife Scale
T3 Shift Work Index -Exhaustion Scale
T3 Shift Work Index -Depression Scale
T3 Shift Work Index -Quality of Life Scale
N Mean Std. DeviationSingnificance
Level
Sherry & Philbrick 19

Galesburg Fatigue Study
Although not significant, scores for the feedback group on the SSS, current fatigue and previous week’s fatigue, as well as scores on the Denver Stress Scale declined from Time 1 to Time 3. Please refer to the graphs below to see a visual representation of these trends.
Stanford Sleepiness Scale
1
2
3
4
5
6
7
Time 1 Time 2 Time 3
SSS - CurrentSSS - Previous Week
Denver Stress Scale
1
1.5
2
2.5
3
3.5
4
4.5
5
Time 1 Time 2 Time 3
Feedback vs Non-Feedback Groups: Repeated Measures Analysis of Variance Repeated measures analysis of variance was used to determine differences between pre and post-test scores for the feedback and non-feedback groups on several indices. Specifically these statistical analyses were conducted on the Eppworth Sleepiness Scale, the Denver Job Satisfaction Scale, the Denver Fatigue Adjective Checklist, the Denver Sleepiness Scale, the Denver Anxiety Scale, the Denver Stress Scale, the Denver Quality
Sherry & Philbrick 20

Galesburg Fatigue Study
of Life Scale, the Shift Work Index – Exhaustion Scale, the Shift Work – Depression Scale, and finally the Shift Work Quality of Life Scale. This statistical analysis was chosen since within-subjects variables always involve taking repeated measurements from each subject, as was done for these groups of participants at Time 1, Time 2, and Time 3 measurements. In within-subject designs, the same subjects are tested in each condition. Therefore, differences among subjects can be measured and separated from error with this method of analysis. While the overall results were not significant for these analyses, some interesting trends were noted. Below are graphs representing the trends that were highlighted via the use of repeated measures analysis of variance.
Repeated Measure on Eppworth
Feedback vs Non-Feedback Groups
Time
21
18
16
14
12
10
8
6
4
2
Feedback
NoFeedback
This graph shows the results for the means plot repeated measures analysis of variance for the Eppworth Sleepiness Scale. Results indicate that there were large differences between the feedback and non-feedback groups at pre-test. These differences became much smaller at post- test. While the overall results are not significant, there is clearly a trend showing that the feedback group has improved, indicating that the likelihood of the feedback participants “Dozing or Falling Asleep” in eight different types of situations is reduced. The slope of the feedback line is much steeper than that of the non-feedback group. Clearly, larger sample sizes would permit a more robust test of the effects of performance feedback on the Eppworth Sleepiness Scale.
Sherry & Philbrick 21

Galesburg Fatigue Study
Repeated Measures on Adjectives
Feedback vs Non-Feedback Groups
Time
321
5.0
4.5
4.0
3.5
3.0
2.5
2.0
1.5
1.0
Feedback
NoFeedback
This graph shows the results for the means plot repeated measures analysis of variance for the Denver Fatigue Adjective Checklist. At pre-test the differences between these two groups were larger than at post-test. Although not significant, there is clearly a trend showing that, at the Time 3 measurement, both the feedback and the non-feedback groups endorsed fewer adjectives related to fatigue. Thus, adjectives such as exhausted, fatigued, listless, bushed, sluggish, weary, and worn-out were used to a lesser extent to describe one’s subjective feelings of tiredness. Performance Watch Feedback Several questions were added to the Time 3 survey to determine the usefulness of the sleep watch. This survey was given to all of the actigaph participants. The table below depicts the results of the statistical analyses conducted to determine if significant differences existed between those individuals who were randomly selected to receive the performance watch and those that received the non-performance watch. For those engineers that wore the performance actigraph, the most robust finding indicated that the performance sleep watch helped those individuals monitor their fatigue levels (F (1,14) = 14.86, p<.002) . The mean response for the question assessing fatigue level monitoring was 4.44 on a 5-point scale, where 1 = “To a Very Little Degree” and 5 = “To a Very Great Degree”. Nine performance participants responded to this question, and seven out of nine people indicated that the watch helped them to monitor their fatigue to a “Very Great Degree” – the highest rating available. Thus, this suggests that participants in this group utilized the percent performance feedback option on the actigraph as an objective means to monitor their fatigue level.
Sherry & Philbrick 22

Galesburg Fatigue Study
In terms of the sleep watch helping feedback participants to manage their fatigue, findings were significant (F (1,14) = 5.24, p<.038). When asked to what degree the watch made the users more aware of their need for rest and sleep, the mean response was 3.90, thus indicating that the watch made them more aware of their need for rest/sleep to a “Considerable Degree”. In fact, 70% of engineers in the experimental group indicated that the performance readings made them more aware of their fatigue levels to a “Considerable or Very Great Degree”. Thus, it appears that the performance readings helped people manage their fatigue because they could base decisions on when to rest and when to complete domestic chores as well as activities of daily living based on percent performance. Participants became significantly more aware of their fatigue levels as a result of percent performance feedback (F (1,16) = 6.82, p<.019). The mechanism by which participants could “measure” their fatigue appeared to be very useful. The percent performance readings on the actigraph increased peoples’ awareness of how fatigued they were throughout the day. Based on this information, these individuals could make more informed choices about the activities they should or should not engage in. Although not significant, approximately 56% of participants felt more prepared to “deal with fatigue” as a result of the performance readings on the actigraph. When the participants in the experimental group were asked to rate the degree to which they would recommend the performance sleep watch to others, the mean response was 3.90. Thus, 80% of participants would recommend the sleep watch to others to a “Considerable or Very Great Degree”. This suggests then, that for these participants the performance readings were useful and could, indeed, be helpful to other railroad employees.
Sherry & Philbrick 23

Galesburg Fatigue Study
Comparison of Feedback vs Non-Feedback Groups
10 2.6000 1.0750 .6798 2.3750 1.1877
18 2.5000 1.09819 3.5556 1.6667 .0387 1.7143 1.4960
16 2.7500 1.80749 4.4444 1.1304 .0027 1.7143 1.7043
16 3.2500 1.9494
10 3.9000 1.1972 .1257 3.0000 1.0000
17 3.5294 1.178910 3.9000 1.2867 .019
8 2.2500 1.388718 3.1667 1.543510 2.9000 1.5239 .168
8 1.8750 1.457718 2.4444 1.542410 2.6000 1.5776 .332
8 1.8750 1.457718 2.2778 1.526510 3.5000 1.2693 .146
8 2.5000 1.511918 3.0556 1.4337
9 2.4444 1.9437 .2256 1.3333 1.0328
15 2.0000 1.69039 3.3333 2.0000 .1216 1.6667 1.7512
15 2.6667 2.0237
FeedbackNoFeedbackTotalFeedbackNoFeedbackTotalFeedbackNoFeedbackTotal
FeedbackNoFeedbackTotalFeedbackNoFeedbackTotalFeedbackNoFeedbackTotalFeedbackNoFeedbackTotalFeedbackNoFeedbackTotalFeedbackNoFeedbackTotalFeedbackNoFeedbackTotal
Has PerformanceReading on the SleepWatch Helped You
Has Sleep Watch HelpedYou Manage Your Fatigue
Has Sleep Watch HelpedYou Monitor Your Fatigue
Recommend thePerformance Sleep Watch
More Aware of FatigueDue to Sleep Watch
Sleep Watch Use ifAvailable at Low Cost
If Under $100 Would YouPurchase Sleep Watch
If Improvements WereMade Would You UseSleep Watch
Increased Naps Due toPerformance Readings
More Prepared to Dealwith Fatigue Because ofWatch
N Mean Std. Deviation p<
Sherry & Philbrick 24
Galesburg Fatigue Study
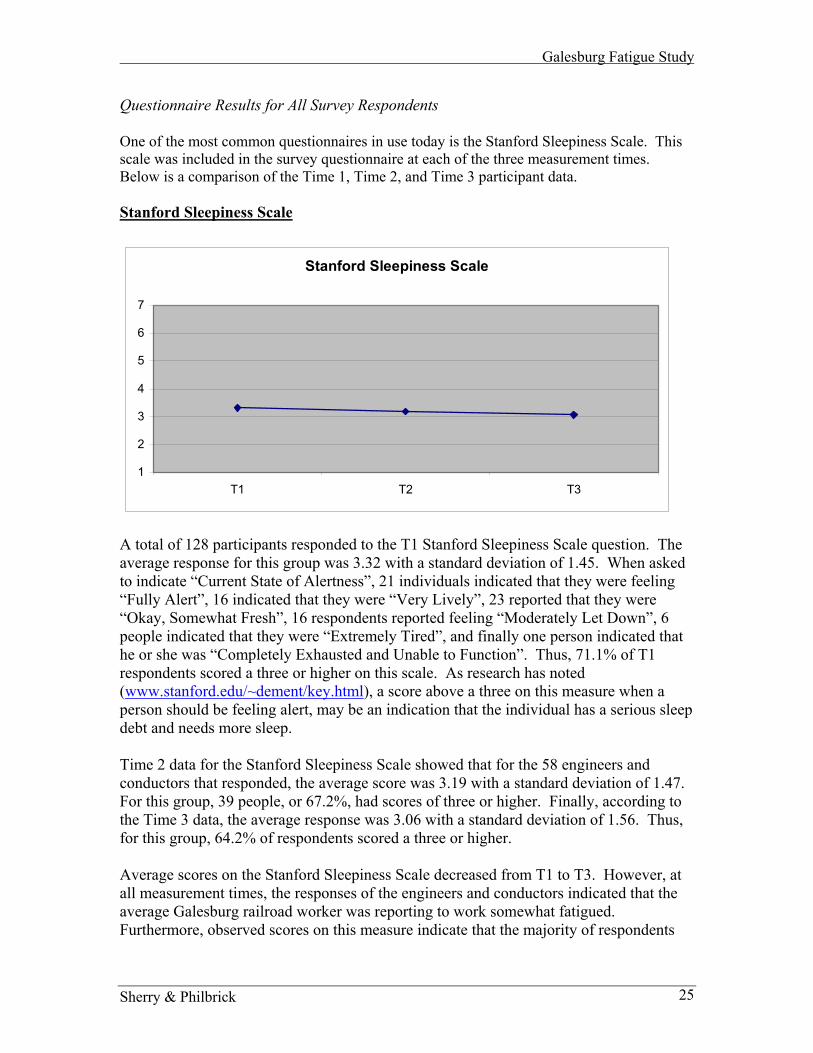
Questionnaire Results for All Survey Respondents One of the most common questionnaires in use today is the Stanford Sleepiness Scale. This scale was included in the survey questionnaire at each of the three measurement times. Below is a comparison of the Time 1, Time 2, and Time 3 participant data. Stanford Sleepiness Scale
Stanford Sleepiness Scale
1
2
3
4
5
6
7
T1 T2 T3
A total of 128 participants responded to the T1 Stanford Sleepiness Scale question. The average response for this group was 3.32 with a standard deviation of 1.45. When asked to indicate “Current State of Alertness”, 21 individuals indicated that they were feeling “Fully Alert”, 16 indicated that they were “Very Lively”, 23 reported that they were “Okay, Somewhat Fresh”, 16 respondents reported feeling “Moderately Let Down”, 6 people indicated that they were “Extremely Tired”, and finally one person indicated that he or she was “Completely Exhausted and Unable to Function”. Thus, 71.1% of T1 respondents scored a three or higher on this scale. As research has noted (www.stanford.edu/~dement/key.html), a score above a three on this measure when a person should be feeling alert, may be an indication that the individual has a serious sleep debt and needs more sleep. Time 2 data for the Stanford Sleepiness Scale showed that for the 58 engineers and conductors that responded, the average score was 3.19 with a standard deviation of 1.47. For this group, 39 people, or 67.2%, had scores of three or higher. Finally, according to the Time 3 data, the average response was 3.06 with a standard deviation of 1.56. Thus, for this group, 64.2% of respondents scored a three or higher. Average scores on the Stanford Sleepiness Scale decreased from T1 to T3. However, at all measurement times, the responses of the engineers and conductors indicated that the average Galesburg railroad worker was reporting to work somewhat fatigued. Furthermore, observed scores on this measure indicate that the majority of respondents
Sherry & Philbrick 25

Galesburg Fatigue Study
are not at peak performance when at work and that these same individuals may be in danger of developing a serious sleep debt. The other instrument that is commonly used in assessing sleep and fatigue related difficulties, is the Eppworth Sleepiness Scale. The Eppworth Scale is routinely used in Sleep Disorders Clinics around the world to identify persons at risk for sleep apnea and other sleep disorders. Scores on this instrument are indicative of a high potential for sleep disorders. The Eppworth Sleepiness Scale assesses the degree to which individuals are likely to doze off or fall asleep in eight different types of situations. In general, the cutoff of 8 or 9 points is thought to indicate some risk. Scores over 10 or 12 are thought to be in the clinically significant range meaning that additional study is needed. For the purposes of this study then we would expect that persons above 10 would be experiencing very high and abnormal degrees of tiredness in comparison to the normal population. Eppworth Sleepiness Scale
Eppworth Sleepiness Scale
0
4
8
12
16
20
24
T1 T2 T3
Respondents answer the questions that comprise this scale by responding to each scenario with a scale ranging from 0 (“Would Never Doze”) to 3 (“High Chance of Dozing”). The range for this scale is 0 to 24. For Time 1 survey respondents the observed range was 2 to 19, with a mean of 8.85 and a standard deviation of 3.89. For Time 2, the range was 1 to 16, with a mean of 8.24 and a standard deviation of 4.15. And, finally, for Time 3 the range was 3 to 14 with a mean of 7.65 and a standard deviation of 3.04.
Sherry & Philbrick 26

Galesburg Fatigue Study
Results from the three measurement times suggest that, for the average respondent, there was a “Slight Chance of Dozing” in the situations referred to. However, 33.8% of Time 1 respondents had scores higher than 10, as did 31% of Time 2 respondents, and 17.6% of Time 3 respondents. This suggests that the engineers and conductors that had scores higher than 10 are reporting to work while experiencing very high and/or abnormal degrees of tiredness in comparison to the normal population. Repeated Measures Analysis A final set of analyses examined the differences between the feedback and non-feedback group on various measures over time. As can be seen from the following figure there was some significant interaction between time and group condition such that at time three the persons in the no feedback group reported significantly greater levels of social involvement than they had at the beginning of the study.
Comparison of Means on
Quality of Life Index
TIME
321
1=G
ood
5=P
oor 5.0
4.5
4.0
3.5
3.0
2.5
2.0
1.5
1.0
Feedback
No Feedback
Sherry & Philbrick 27

Galesburg Fatigue Study
A similar result was found with the Exhaustion scale which measures the intensity with which a number of fatigue related adjectives are endorsed. As can be seen from the graph below there is an overall tendency for the scores to slope to the right which indicates a gradual improvement in fatigue as measured by the exhaustion scale.. In addition, the two groups differ in overall magnitude of exhaustion. Thus, there is a nearly significant difference between the experimental and control groups such that the feedback group is somewhat higher than the non-feedback group. Overall, there is a significant reduction in exhaustion over time.
Comparison of Means on Exhaustion Scale
TIME
321
1=Lo
w
5=H
igh
5.0
4.5
4.0
3.5
3.0
2.5
2.0
1.5
1.0
Feedback
NoFeedback
Sherry & Philbrick 28

Galesburg Fatigue Study
There were however nearly significant differences between the two groups at post-testing on depression, suggesting an interaction between the feedback condition and mood. As can be seen from the graph, the feedback group is lower on depression at Time 3 than the non-feedback group.
Comparison of Means on Depression
TIME
321
1=N
ot D
epre
ssed
4=
Hig
hly
Dep
ress
ed 4.0
3.5
3.0
2.5
2.0
1.5
1.0
Feedback
No Feedback
Discussion Overall, study participants in the experimental group reported that the performance actigraph was a useful tool for fatigue management. While there were not statistically significant differences between the feedback and non-feedback actigraph participants on indices assessing stress, fatigue, or anxiety, significant differences were found between the two groups on questions assessing the usefulness of the actigraph. Specifically, the most robust finding indicated that the performance sleep watch helped participants in the experimental group monitor their fatigue levels. Lack of significance in this case is not surprising due to the small sample size. Oin order to be able to detect an effect we would have needed approximately 45 people in each condition. Thus, the present results, occurring in the predicted direction, are promising and and suggest the need for further study. Interestingly, however, the trends were in the predicted direction suggesting that if the results sample size had been large we might have been able to detect a significant effect.
Sherry & Philbrick 29

Galesburg Fatigue Study
Finally, 70% of engineers in the experimental group indicated that the performance readings made them more aware of their fatigue levels to a “Considerable or Very Great Degree”. Again, this suggests that for this group, the performance readings increased their awareness of the need for rest. Approximately 56% of participants felt more prepared to “deal with fatigue” as a result of the performance readings on the actigraph. Statistical comparisons of the variability of the measures of sleep obtained from the actigraphs indicate that the variance of several of the measures was significantly different between the two groups. More importantly however, the fact that there is a significant difference in variability between the two groups on several sleep measures is in accordance with our predictions. Namely, it was thought that the performance feedback watches would lead to increased sleep and overall improved sleep hygiene. The results would suggest that those wearing the performance feedback watches had significantly less variability in their sleep. Perhaps the performance feedback contributed to decisions to sleep longer.
Sherry & Philbrick 30

Galesburg Fatigue Study
References
Adams, E. (1976). Accident causation and management systems. Professional Safety, 8, 77-81.
Balzer, W., Doherty, M.; & O’Connor, R.. (1989). Effects of cognitive feedback
on performance. Psychological Bulletin.
Castellan, N. J. & Swaine, M. (1977). Long-term feedback and differential feedback effects in nonmetric multiple-cue probability learning. Behavioral Sciences, 22, 116-128.
Cole, R.J., Kripke, D.F., Gruen, W.F., Mullaney, D.J., and Gillin, J.C. (1992). Automatic sleep/wake identification from wrist activity. Sleep, 15, 461-469.
Cooper, D. (1998). Improving safety culture. New York: Wiley.
Geller, E.S. (1998). The psychology of safety. New York: CRC Press. Grant, J. S. (1971). Concepts of fatigue and vigilance in relation to railway
operations. Ergonomics, 14(1): 111-118.
Guzzo, Jette, & Katzell, (1985). The effects of psychologically based intervention programs on worker productivity: A meta-analysis. Personnel Psychology, 38(2) 275-291.
Haynes, R. S. Pine, R. C., Fitch, H. G. (1982). Reducing accident rates with organizational behavior modification. Academy of Management Journal, 25(2), 407-416.
Jussim, L., Yen, H. J., & Aiello, J. R. (1995). Self-consistency, self-enhancement, and accuracy in reactions to feedback. 322-356.
Journal of Experimental Social Psychology, 31,
Karan, B.S., & Kopelman, R.E. (1987). The effects of objective feedback.
Knipling, R.R., & Olsgard, P. J. (2000). The behavioral power of on-board safety monitoring feedback. Paper presented at the 10th Annual Meeting of the Intelligent Transportation Society of America (ITS America), Boston, May 1-4, 2000.
Krause, T. R., Hidley, J. H., & Hodson, S. J. (1990). The behavior based safety process: Managing involvement for an injury free culture. NY: Van Nostrand-Reinhold.
Markus, H. (1977). Self-schemes and processing information about the self. Journal of Personality and Social, 35, 63-78.
Sherry & Philbrick 31

Galesburg Fatigue Study
Nease, A. A., Mudgett, & Quinones (1999). Relationship among feedback sign, self-efficacy, and acceptance of performance feedback. Journal of Applied Psychology, 84 (5), 806-814
Petersen, D. (1984). Human error reduction and safety management. New York: Aloray.Psychological Bulletin.
Pollard, J. K. (1991). Issues in Locomotive Crew Management and Scheduling. USDOT Report # DOT/FRA/RRP-91-06.
Reason, J. (1990). Managing the management risk: New approaches to organizational safety. In B. Wilpert and T. Quale (Eds.), Reliability and safety in hazardous work systems. Hove, UK: Psychology Press, Ltd.
Sherry, P. (1992). Peer involvement and behavioral safety: A case study. Paper presented at the annual meeting of the American Association of Railroads Safety Conference, Little Rock, June 8, 1992.
Sherry, P. (1991). Person environment fit and accident prediction. Journal of Business and Psychology, 2, 123-132.
Sherry, P., Bart, S., & Atwater, J. (1997). Distractibility, fatigue, job stress, and accidents in long haul truck drivers. Paper presented at the annual meeting of the Rocky Mountain Psychological Association, Reno, Nevada.
Sierro, S., Boon, M., Kok, G. , & Sierro, F. (1989). Modification of driving
behavior in a large transport organization: A field experiment. Journal of Applied Psychology, 74, 417-423.
Sulzer-Azaroff, B. (1982). Behavioral approaches to occupational safety and health. In L. Frederiksen (Ed.) Handbook of organizational behavior management. New York : Wiley.
Sulzer-Azaroff, B. (1982). The modification of occupational safety behavior. The Journal of Occupational Accidents, 9, 177-197.
Swann, W. B. (1987). Identity negotiation: Where two roads meet. Journal of Personality and Social Psychology, 53, 1038-1051.
Swann, W. B., Griffin, J. J., Predmore, S. C. & Gaines, B. (1987). The cognitive-affective crossfire: When self-consistency confronts self-enhancement. Journal of Personality & Social Psychology, 52(5), 881-889.
Waldersee & Luthans, (1994). The impact of positive and corrective feedback on customer service performance. Journal of Organizational Behavior, 15(1), 83-95.
Sherry & Philbrick 32

Galesburg Fatigue Study
Sherry & Philbrick 33
Watson, J.B. (1930). Behaviorism. New York: Norton.
Weller, D., & Sherry, P. (1992). Role of supervisor support in buffering the stress-strain relationship. A paper presented at the APA/NIOSH Conference. Washington, D.C., November 19, 1992.