final report - university of oklahoma · insect repellent design final report erin ashley scott...
TRANSCRIPT
Insect Repellent DesignFinal Report
Erin AshleyScott DomanMay 4, 2006

IntroductionThe Repellent Market
� DEET (N,N-diethyl-m-toluamide) was discovered in 1946
� The market has remained largely unchanged since then
� Consumer pressures have led companies to seek gentler and safer alternatives to DEET
� OFF! and Cutter are the major players in the repellent market

IntroductionThe Repellent Market
� The company that can come up with an economically feasible, user-friendly, safe product stands to gain a large share of the market.
� Initial aim: develop a new repellent that will accomplish these objectives� Investigate insect/repellent interactions

BackgroundInsect Receptors
Types of Receptors� Thermoreceptors� Mechanoreceptors
• Tactile receptors• Sound receptors
� Photoreceptors� Chemoreceptors
• Gustatory receptors• Olfactory receptors Source: http://www.mediabum.com/images/mosquito.jpg

BackgroundInsect Chemoreceptors
� Olfactory chemoreceptors are usually located on the antennae
� Each antenna is covered in hair-like sensilla containing neurons
� Each antenna can have as many as 75,000 receptor cells
Source: http://www.insectscience.org/3.2/ref/fig5.jpg
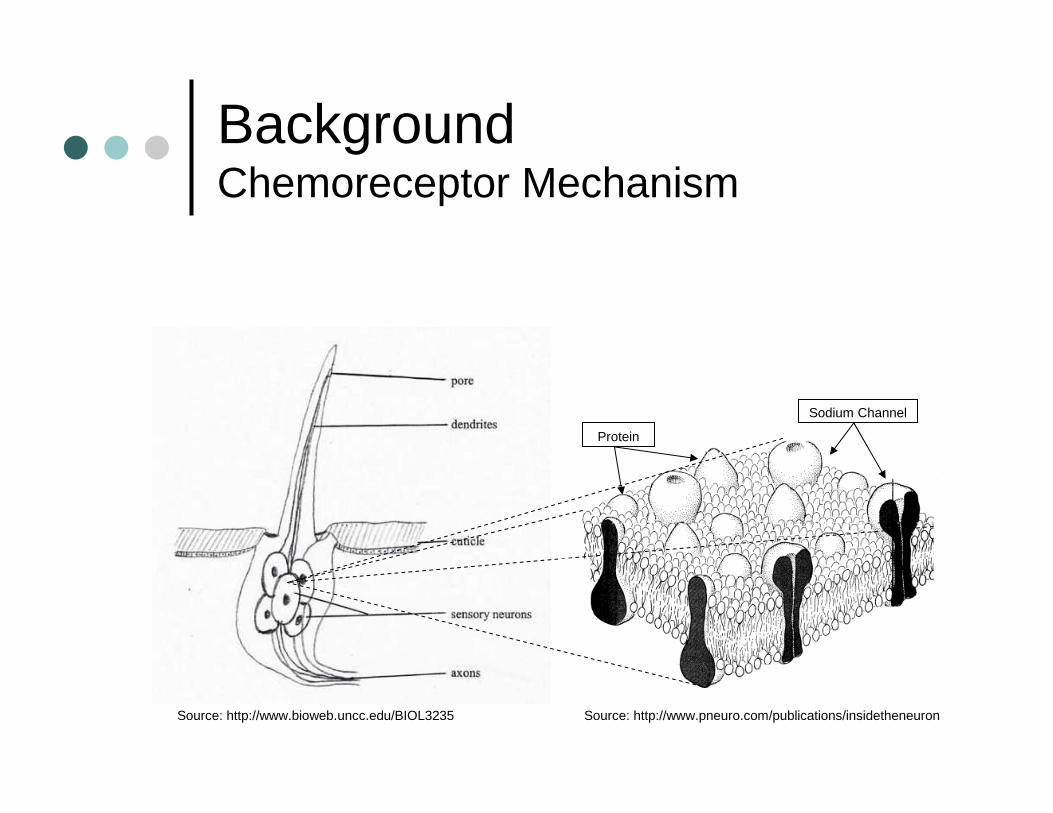
BackgroundChemoreceptor Mechanism
Protein
Sodium Channel
Source: http://www.pneuro.com/publications/insidetheneuronSource: http://www.bioweb.uncc.edu/BIOL3235

BackgroundInsects of Interest
� How do insects use their receptors to find humans?� Visual Stimuli: long distances� Chemical Stimuli: short distances
• Carbon dioxide from skin and breath• Lactic acid from skin
� Temperature Stimuli: very close range
� What types of insects are interested in humans?� Mosquitoes� Ticks� Fleas
Source: http://static.howstuffworks.com/gif/mosquito6a.jpg
BackgroundRepellent Mechanisms
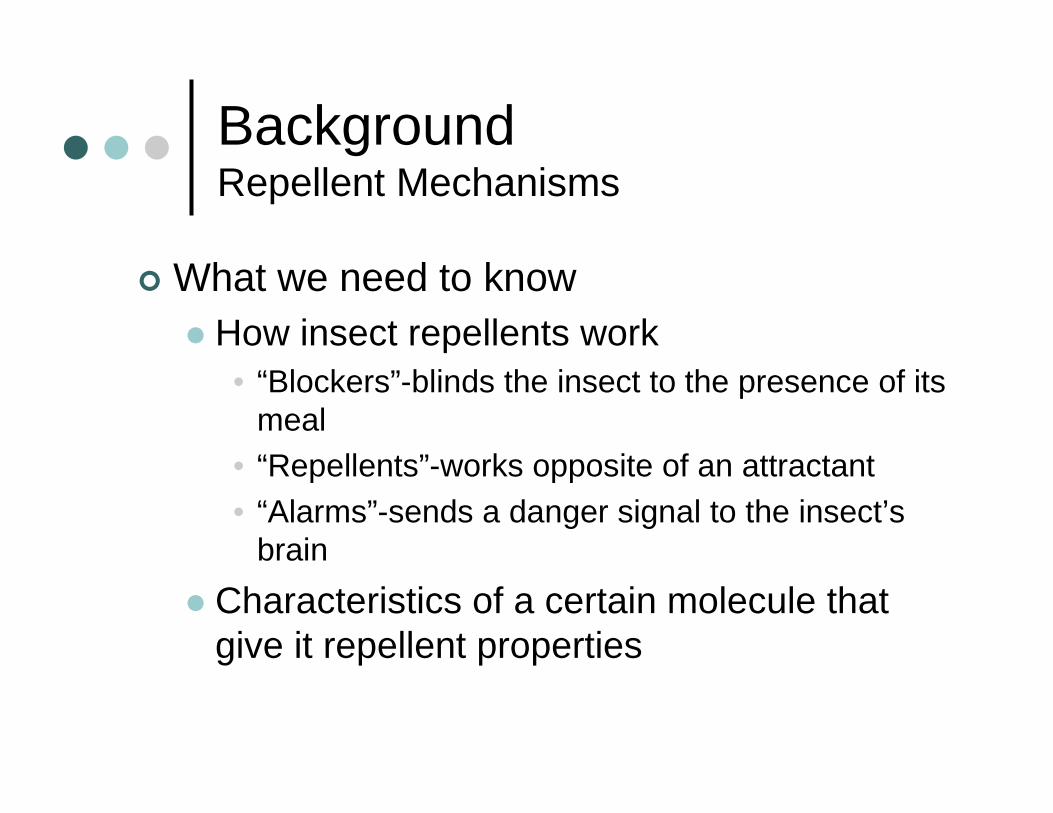
� What we need to know� How insect repellents work
• “Blockers”-blinds the insect to the presence of its meal
• “Repellents”-works opposite of an attractant• “Alarms”-sends a danger signal to the insect’s
brain
� Characteristics of a certain molecule that give it repellent properties

BackgroundRepellent Mechanisms
� Unfortunately, the true mechanisms of repellents are not known!
� According to Dr. Joel Coats at Iowa State University, “Structure-activity relationships of repellents are unclear, and little definitive work has been done.…Vapor pressure is the only parameter significantly related to mosquito repellent activity.”
Source: Coats, Joel, “Insect Repellents- Past, Present, and Future”
BackgroundA New Pursuit
� Instead of developing a new repellent, we plan to re-engineer an existing repellent
� Market research is performed to determine which repellents to re-engineer

BackgroundRepellents in the U.S. Market
� DEET• The most commonly used insect repellent• One of few repellents that can be applied to the
skin• Unpleasant scent• Damages plastic and other synthetic materials
Source: http://en.wikipedia.org/wiki/DEET

BackgroundRepellents in the U.S. Market
� Picaridin• Recently introduced in the US in Cutter Advanced• Shown to be as effective as DEET at equal concentrations• Recommended by Center for Disease Control (CDC) and
World Health Organization (WHO)• No scent• Does not damage synthetic materials
Source: http://picaridin.com/science.htm
BackgroundRepellents in the U.S. Market
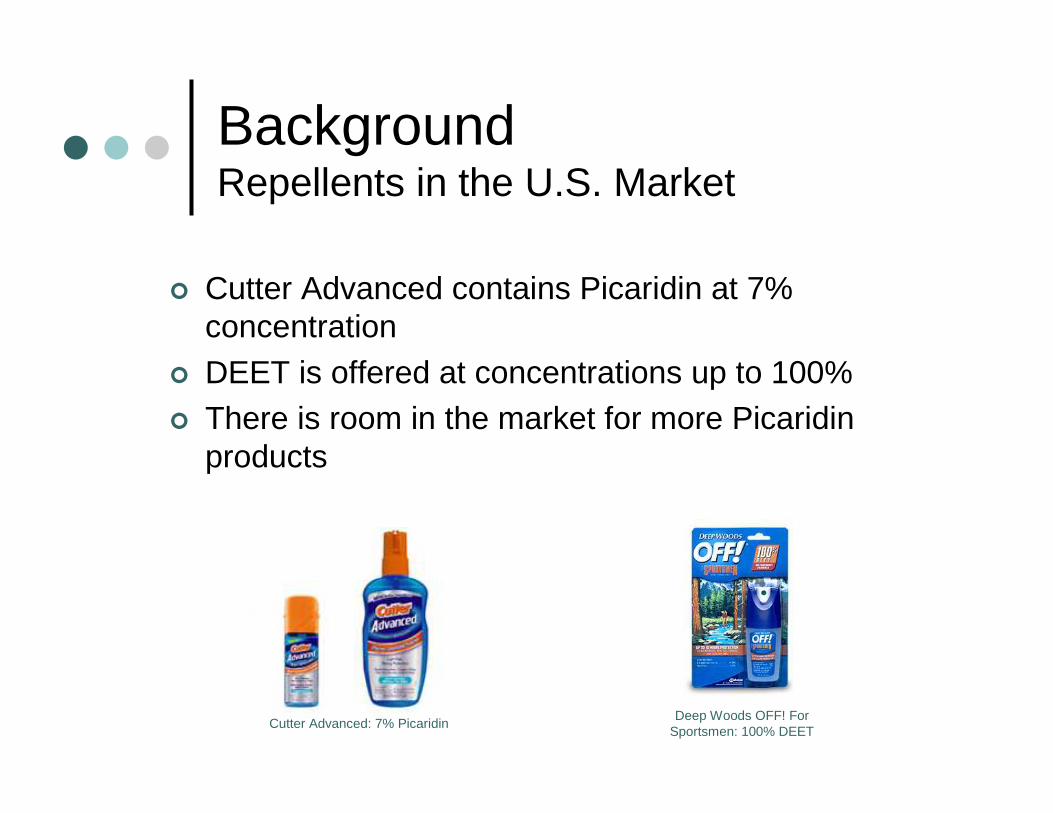
� Cutter Advanced contains Picaridin at 7% concentration
� DEET is offered at concentrations up to 100%� There is room in the market for more Picaridin
products
Cutter Advanced: 7% PicaridinDeep Woods OFF! For
Sportsmen: 100% DEET

Achieving the Objective
� Develop a new repellent formula with Picaridin as the active ingredient� Create a utility function to measure the
wants and needs of repellent consumers� Design a production and distribution model
� Analyze the economics and maximize the profit of this formula

Caveats
� This is a preliminary model
� Many assumptions made based on educated guesses

The Utility Function
� Describes the satisfaction a consumer receives from using a product:
U = ΣUiwi
U is the utility; w is the weighted average of each characteristic of the product that the consumer deems
important; i is each characteristic
� Need to decide w, construct equations for each characteristic
The Utility FunctionRepellent Characteristics
� Maximize utility of each of the following characteristics for an overall maximum utility� Effectiveness� Durability� Feel� Form (Lotion or Spray)� Toxicity� Scent

The Utility FunctionWeights
� A sample population was surveyed to determine the preferences of consumers.
� Target consumer: campers and hikers
� These preferences were used to assign wi to each physical property (sum= 1).
� Assumptions
0.05Scent
0.09Toxicity
0.14Form
0.19Feel
0.24Durability
0.29Effectiveness
WeightProperty
The Utility FunctionIngredients
� Each ingredient chosen to increase the overall utility� To increase effectiveness and durability:
use Picaridin� To improve scent and texture, add
fragrance and aloe� To dissolve ingredients and lower cost,
add ethanol
The Utility FunctionGeneral Method
� For each chosen characteristic:1. Relate utility to levels of the characteristic2. Relate these levels to results of a
consumer test
3. Relate test results to some physical property of the repellent formula
4. Relate utility to repellent physical property for optimization

The Utility FunctionEffectiveness
� Industry Standard Test� Mosquitoes in a box with a repellent sample on one side� Percentage of the population on that side of the box after a
certain time shows the repellent’s effectiveness.
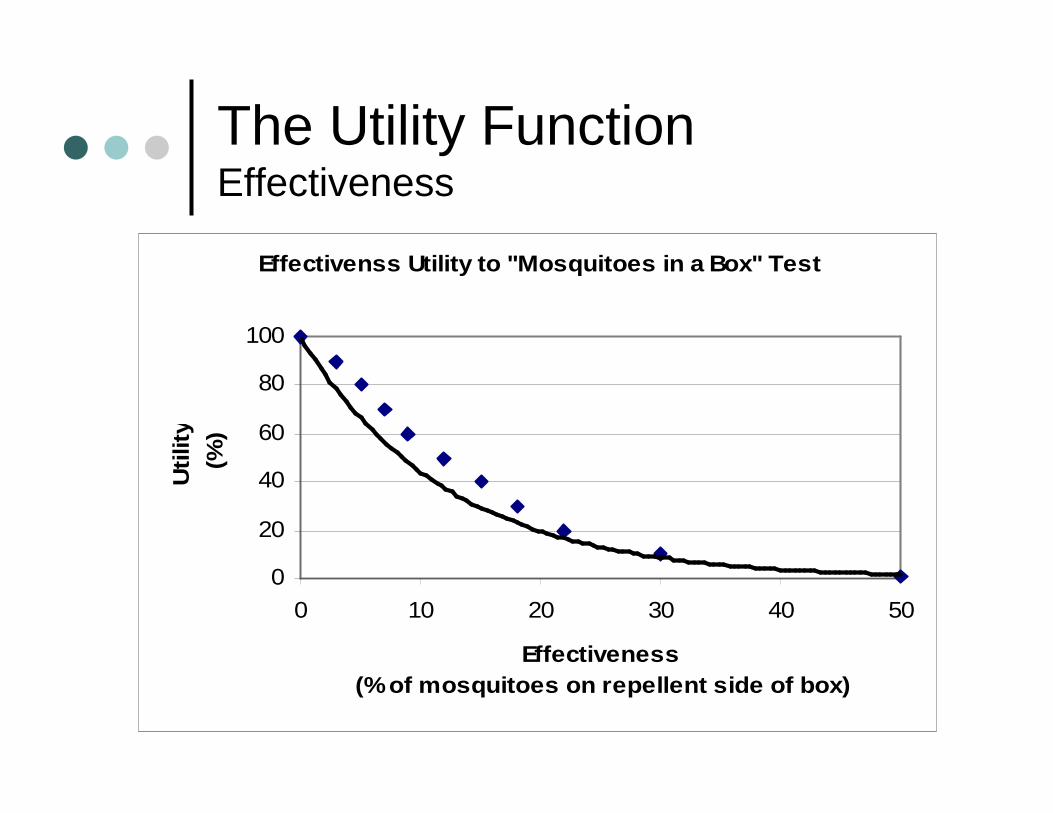
The Utility FunctionEffectiveness
Effectivenss Utility to "Mosquitoes in a Box" Test
0
20
40
60
80
100
0 10 20 30 40 50
Effectiveness (% of mosquitoes on repellent side of box)
Uti
lity
(%
)
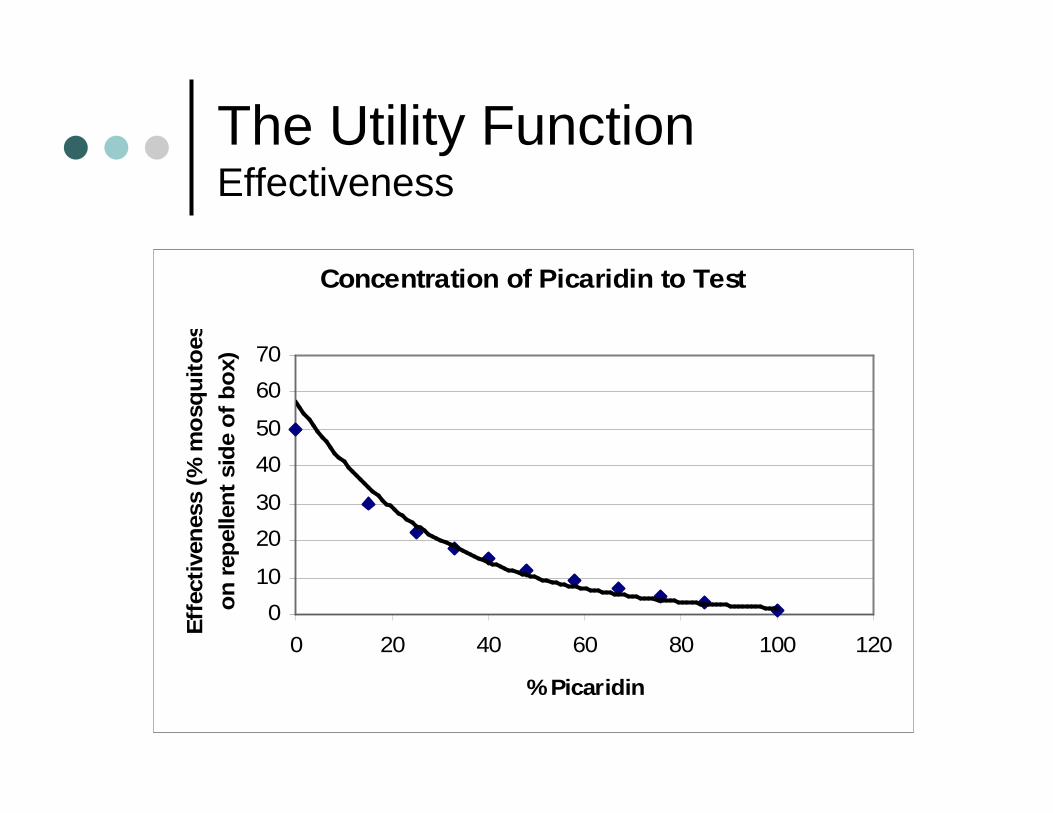
The Utility FunctionEffectiveness
Concentration of Picaridin to Test
0
10
20
30
40
50
60
70
0 20 40 60 80 100 120
% Picaridin
Eff
ecti
ven
ess
(% m
osq
uit
oes
o
n r
epel
len
t si
de
of
bo
x)

Final Utility to Picaridin Relationship:U = 1.023*%Picaridin
The Utility FunctionEffectiveness
Utility to Concentration of Picaridin
0
20
40
60
80
100
0 20 40 60 80 100
% Picaridin
Uti
lity
(%)

The Utility FunctionDurability
� Relate durability utility to levels of durability: Amount of time repellent stays effective
0102030405060708090
100
0 2 4 6 8 10 12
Repellent Durability (hours)
Uti
lity
(%
)
The Utility FunctionDurability
� Relate time to physical property of formula: Vapor pressure of the mixture� Model evaporation of repellent off skin as a
function of time� Calculate the amount of time needed for
the concentration of repellent at a certain distance from the skin to fall below a set threshold concentration

The Utility FunctionDurability
� Fick’s second law of diffusion
� cA = concentration of component A� DAB = diffusion coefficient of component A
� t = time� z = distance from skin, set at 0.3 m
2
2
z
cD
t
c AAB
A
∂∂
=∂
∂

The Utility FunctionDurability
� Fick’s second law becomes
where CAs = surface concentration
using Raoult’s Law approximation
πt
ec
t
c tD
z
AsAAB
4
2
−
⋅=
∂∂
( )RT
VPx
RT
pc AA
As ==

The Utility FunctionDurability
� Set time interval = 10 minutes� Set initial concentrations of all components� Start: CAs = partial pressure of each component� Calculate CA of each component at z = 0.3 m� Calculate amount of moles lost from liquid� Recalculate liquid concentrations� Recalculate new CAs based on new concentrations� Repeat process until CA of Picaridin reaches 0.05 mol/m3

The Utility FunctionDurability
0
2
4
6
8
10
12
0 1000 2000 3000 4000 5000
Vapor Pressure (Pa)
Du
rati
on
(h
r)
After correlating durability to several physical properties, initial vapor pressure of the
mixture showed the strongest relationship.

The Utility FunctionDurability
0
2
4
6
8
10
12
0 1000 2000 3000 4000 5000
Vapor Pressure (Pa)
Du
rati
on
(h
r)
0
10
2030
40
50
6070
80
90
0 1000 2000 3000 4000 5000
Vapor Pressure of Mixture (Pa)
Uti
lity
(%
)
After correlating durability to several physical properties, initial vapor pressure of the
mixture showed the strongest relationship.
This data was combined with the utility versus durability data to form a relationship between utility and mixture
vapor pressure.
VPeU41072.3664.9100
−×−=
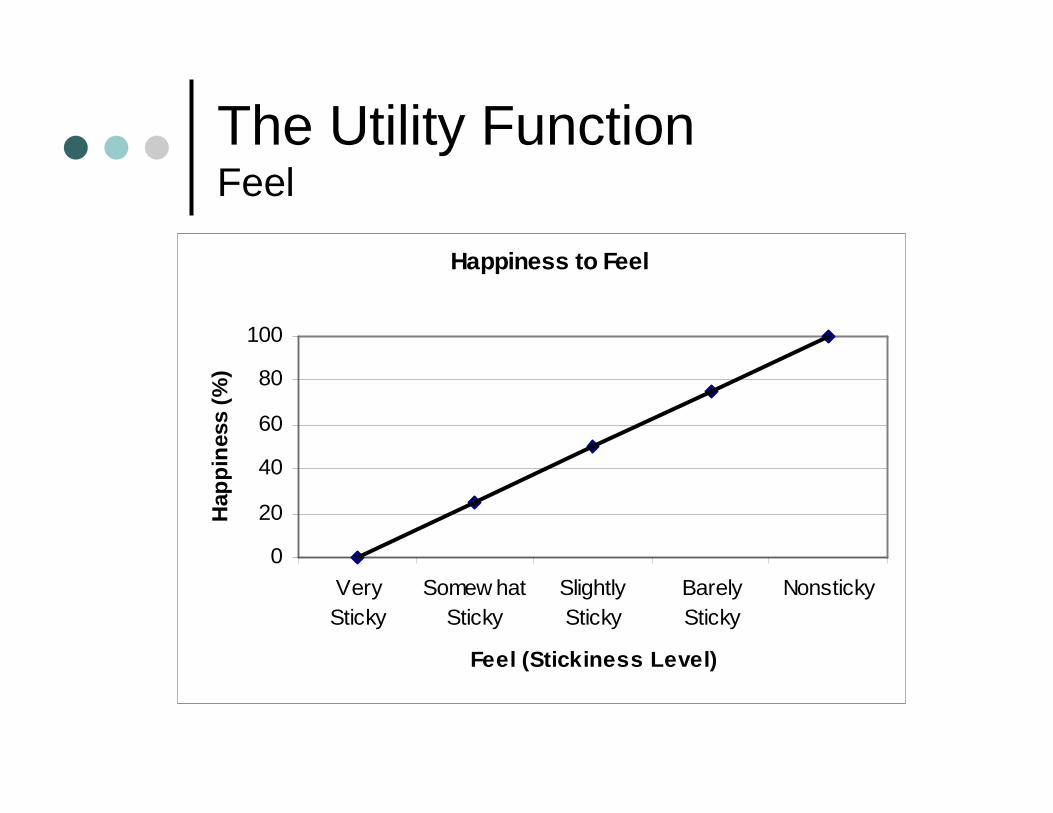
The Utility FunctionFeel
Happiness to Feel
0
20
40
60
80
100
VerySticky
Somew hatSticky
SlightlySticky
BarelySticky
Nonsticky
Feel (Stickiness Level)
Hap
pin
ess
(%)
The Utility FunctionFeel
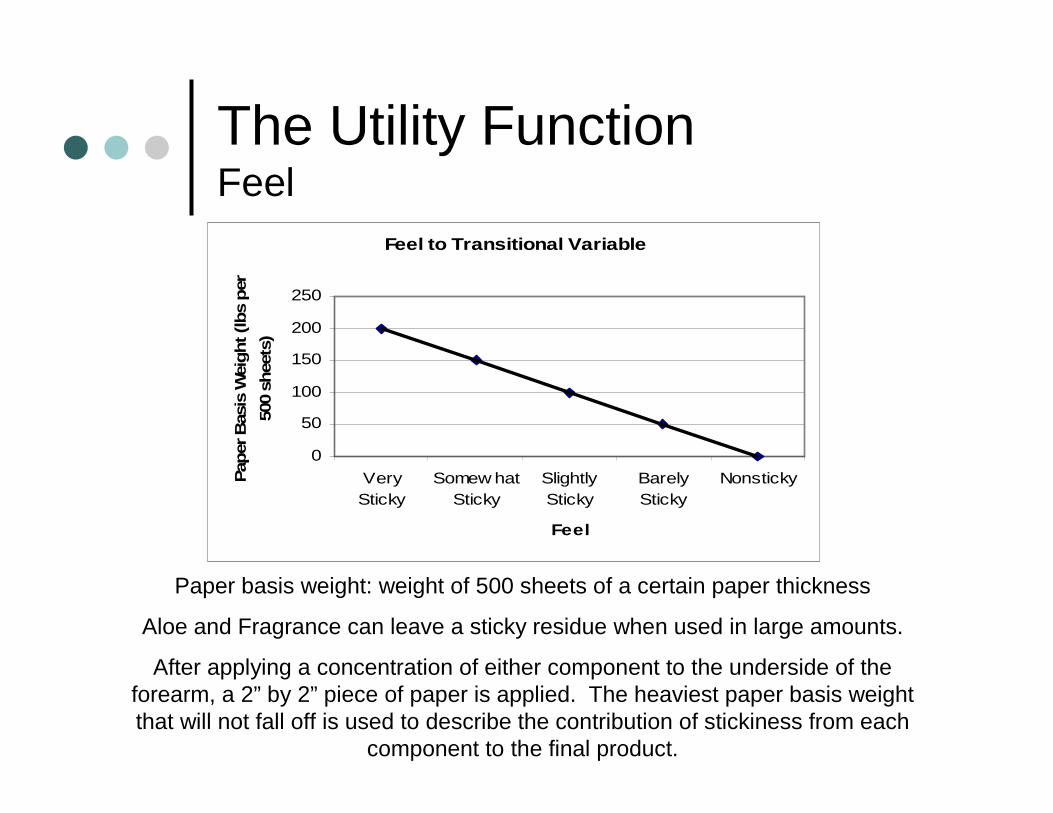
Feel to Transitional Variable
0
50
100
150
200
250
VerySticky
Somew hatSticky
SlightlySticky
BarelySticky
Nonsticky
Feel
Pap
er B
asis
Wei
ght (lbs
per
500
shee
ts)
Paper basis weight: weight of 500 sheets of a certain paper thickness
Aloe and Fragrance can leave a sticky residue when used in large amounts.
After applying a concentration of either component to the underside of the forearm, a 2” by 2” piece of paper is applied. The heaviest paper basis weight that will not fall off is used to describe the contribution of stickiness from each
component to the final product.

The Utility FunctionFeelFeel to Amount of Fragrance
0
50
100
150
200
250
0 20 40 60 80 100
Amount of Fragrance (% of formulation)
Pap
er B
asis
Wei
gh
t (l
bs
per
50
0 sh
eets
)
Feel to Amount of Aloe
0
50
100
150
200
250
0 20 40 60 80 100
Amount of Aloe (% of formulation)
Fee
l (st
icki
nes
s)

The Utility FunctionFeelFeel to Amount of Fragrance
0
50
100
150
200
250
0 20 40 60 80 100
Amount of Fragrance (% of formulation)
Pap
er B
asis
Wei
gh
t (l
bs
per
50
0 sh
eets
)
Feel to Amount of Aloe
0
50
100
150
200
250
0 20 40 60 80 100
Amount of Aloe (% of formulation)
Fee
l (st
icki
nes
s)
Utility to Amount of Fragrance
y = -0.9589x + 100
R2 = 0.99350
20
40
60
80
100
0 20 40 60 80 100
Amount of Fragrance (%)
Util
ity (%
)
Utility to Amount of Aloe
y = -0.7112x + 100R2 = 0.9878
0
20
40
60
80
100
0 20 40 60 80 100
Amount of Aloe (%)
Utilit
y (%
)
The Utility FunctionFeel
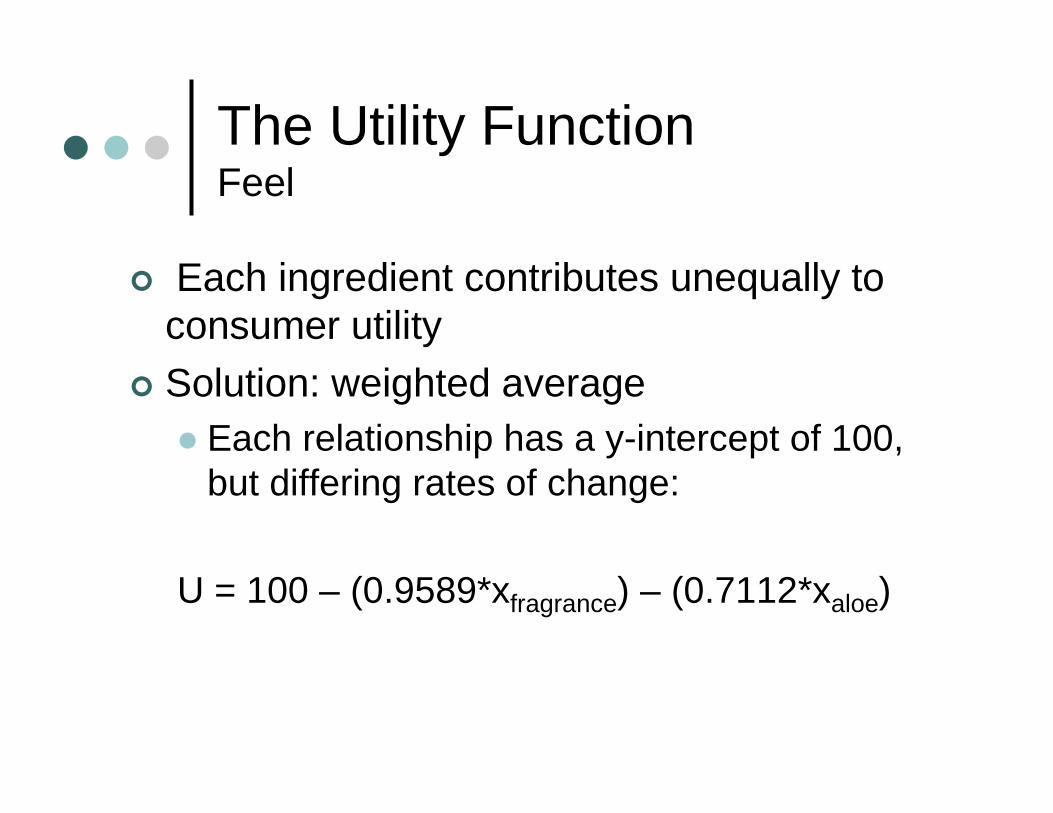
� Each ingredient contributes unequally to consumer utility
� Solution: weighted average� Each relationship has a y-intercept of 100,
but differing rates of change:
U = 100 – (0.9589*xfragrance) – (0.7112*xaloe)

The Utility FunctionForm
Happiness to Form
0
20
40
60
80
100
Lotion SprayForm
Hap
pin
ess
(%)
Market research data showed that 83% of consumers prefer spray repellent over the lotion form.
A repellent in spray form would give ‘100% happiness’ to 83% of
consumers, but less happiness to the other 17%, approximated at 50%.
Thus, a spray repellent would have an overall consumer utility of 92%.

The Utility FunctionForm
Happiness to Form
0
20
40
60
80
100
Lotion SprayForm
Hap
pin
ess
(%)
Form to Viscosity
50 60 70 80 90 100 110
Lotion
Spray
Vis
cosi
ty
(cen
tist
oke
s)
Form
Market research data showed that 83% of consumers prefer spray repellent over the lotion form.
A repellent in spray form would give ‘100% happiness’ to 83% of
consumers, but less happiness to the other 17%, approximated at 50%.
Thus, a spray repellent would have an overall consumer utility of 92%.
Liquids with a kinematic viscosity over 75 centistokes1 will be too thick to be
sprayed by a finger pump.
The relationship between form and utility can then be determined using an
“If-Then” statement.1www.jamestowndistributors.com/decoder_epifanestopcoats.jsp

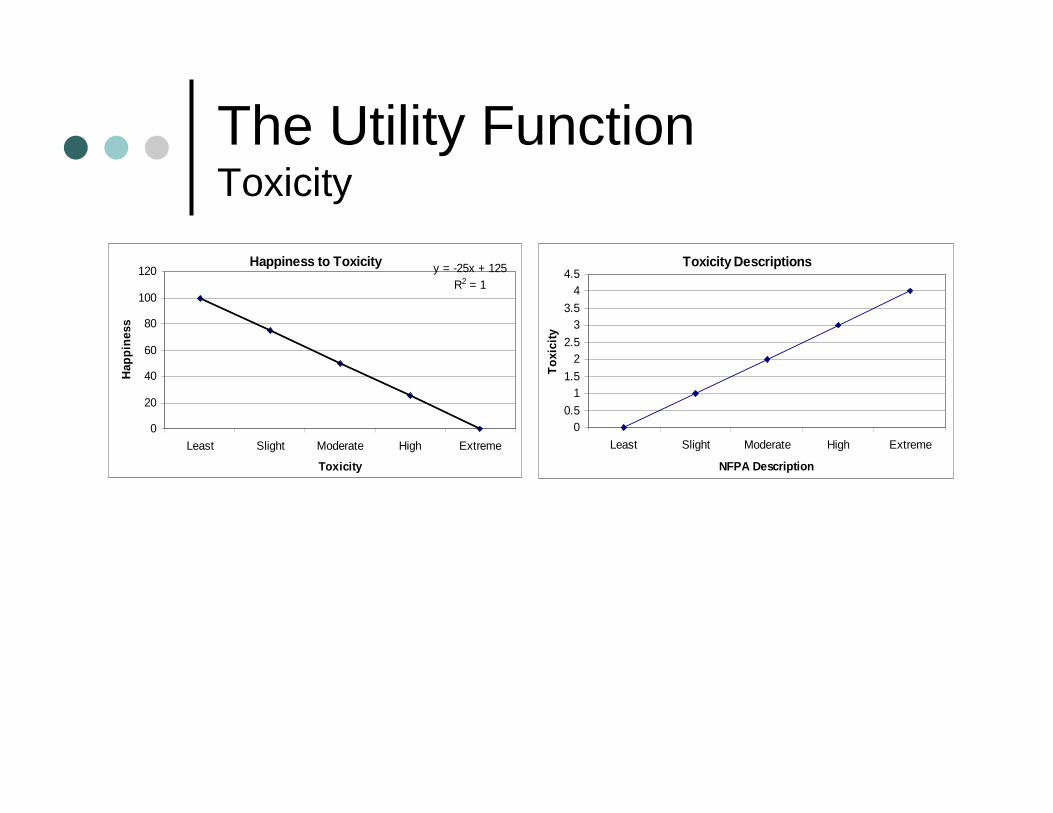
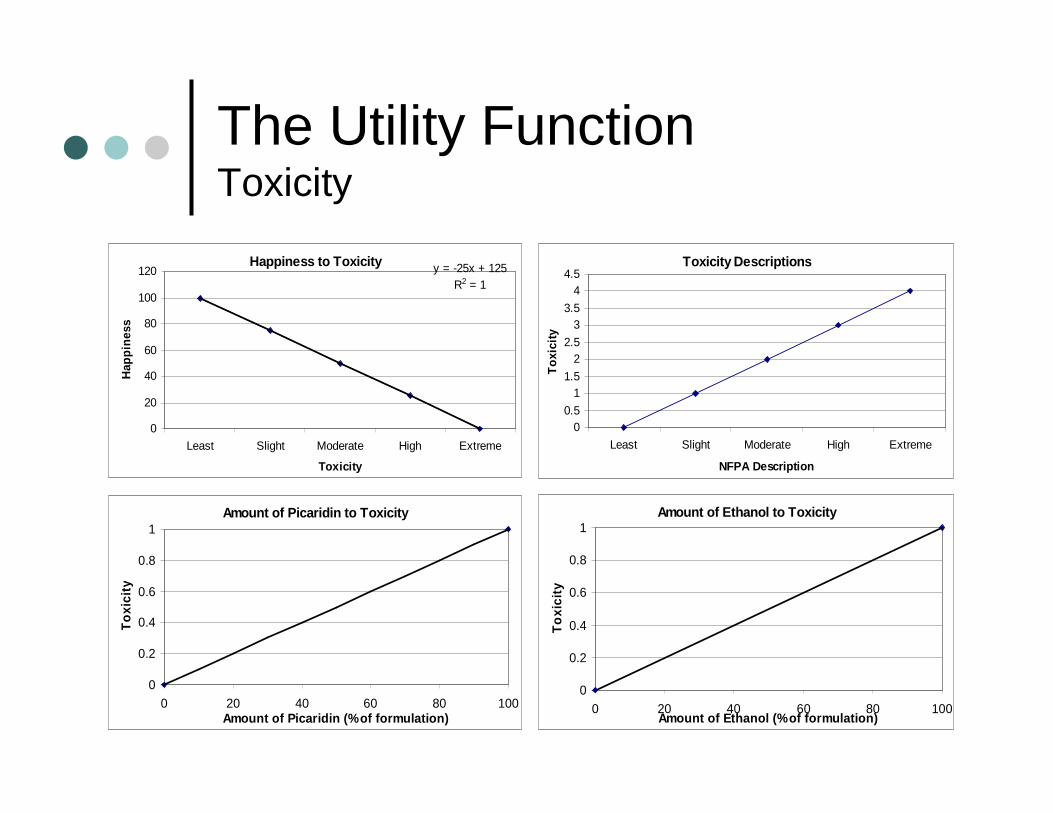
The Utility FunctionToxicity
Happiness to Toxicity y = -25x + 125R2 = 1
0
20
40
60
80
100
120
Least Slight Moderate High Extreme
Toxicity
Hap
pin
ess
The Utility FunctionToxicity
Happiness to Toxicity y = -25x + 125R2 = 1
0
20
40
60
80
100
120
Least Slight Moderate High Extreme
Toxicity
Hap
pin
ess
Toxicity Descriptions
00.5
11.5
22.5
33.5
44.5
Least Slight Moderate High Extreme
NFPA Description
To
xici
ty
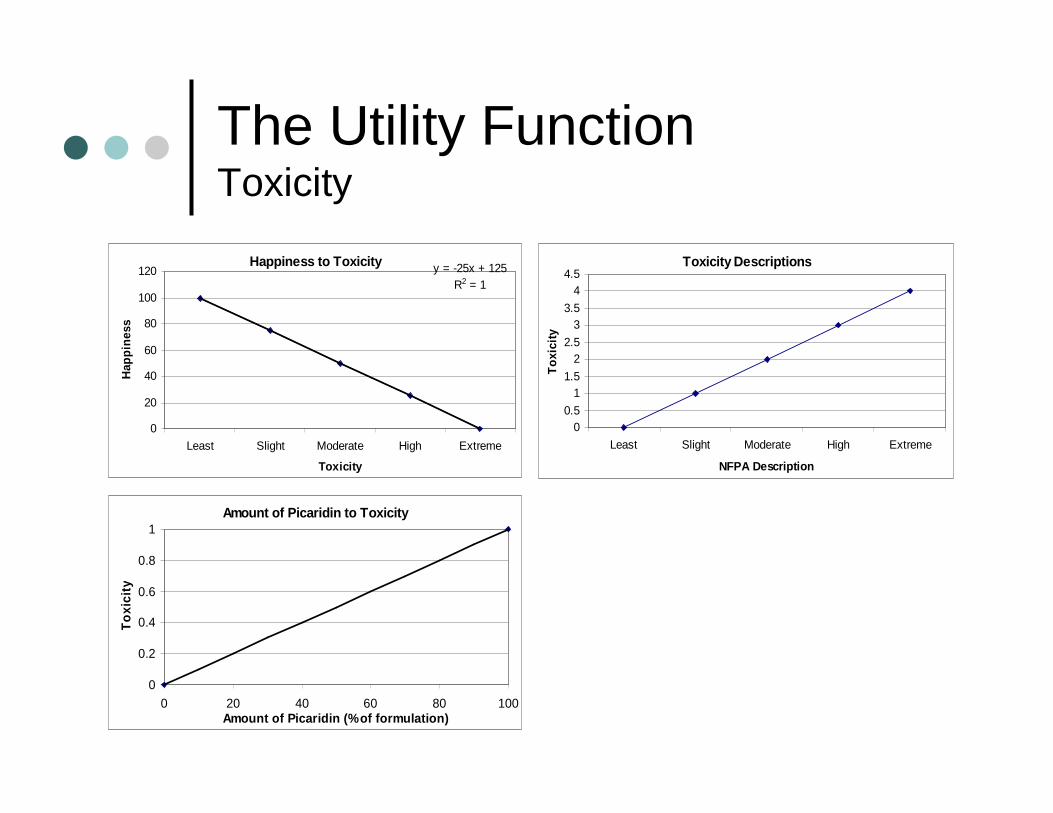
The Utility FunctionToxicity
Happiness to Toxicity y = -25x + 125R2 = 1
0
20
40
60
80
100
120
Least Slight Moderate High Extreme
Toxicity
Hap
pin
ess
Amount of Picaridin to Toxicity
0
0.2
0.4
0.6
0.8
1
0 20 40 60 80 100Amount of Picaridin (% of formulation)
To
xici
ty
Toxicity Descriptions
00.5
11.5
22.5
33.5
44.5
Least Slight Moderate High Extreme
NFPA Description
To
xici
ty
The Utility FunctionToxicity
Happiness to Toxicity y = -25x + 125R2 = 1
0
20
40
60
80
100
120
Least Slight Moderate High Extreme
Toxicity
Hap
pin
ess
Amount of Ethanol to Toxicity
0
0.2
0.4
0.6
0.8
1
0 20 40 60 80 100Amount of Ethanol (% of formulation)
To
xici
ty
Amount of Picaridin to Toxicity
0
0.2
0.4
0.6
0.8
1
0 20 40 60 80 100Amount of Picaridin (% of formulation)
To
xici
ty
Toxicity Descriptions
00.5
11.5
22.5
33.5
44.5
Least Slight Moderate High Extreme
NFPA Description
To
xici
ty

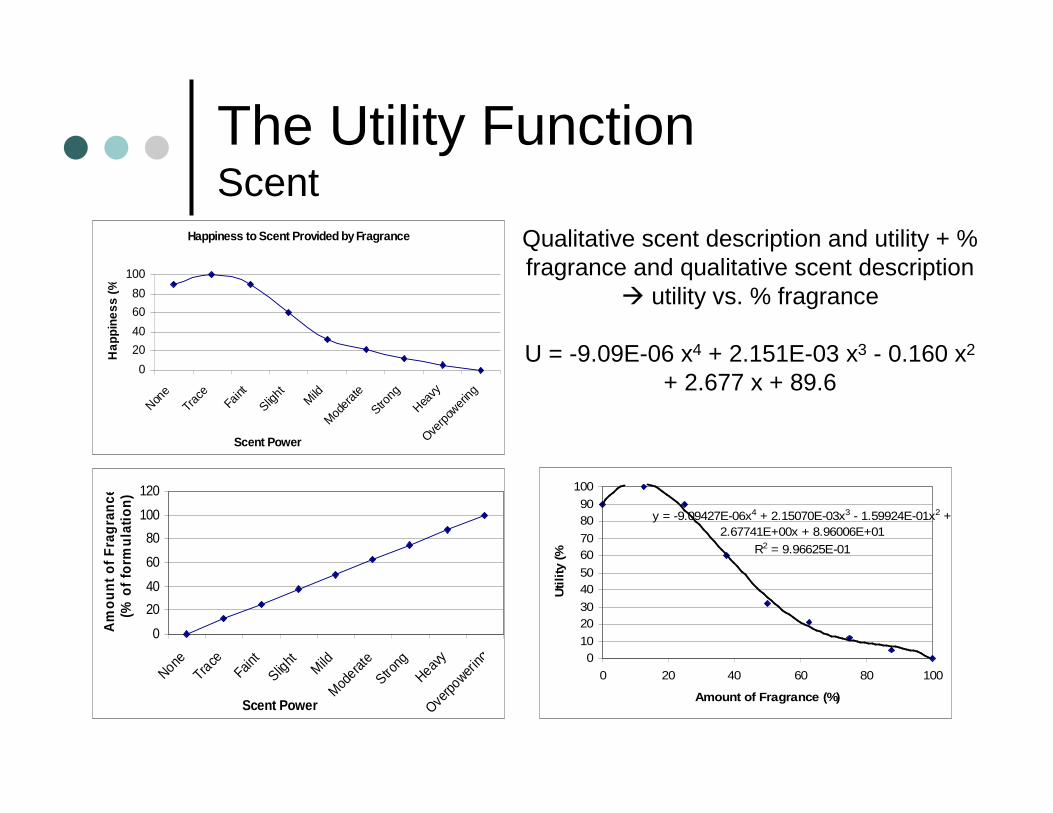
The Utility FunctionScent
Happiness to Scent Provided by Fragrance
0
20
40
60
80
100
None
Trac
e
Faint
Slight
MildMod
erate
Strong
Heavy
Overp
ower
ing
Scent Power
Hap
pine
ss (%
)
Qualitative scent description and utility

The Utility FunctionScent
Happiness to Scent Provided by Fragrance
0
20
40
60
80
100
None
Trac
e
Faint
Slight
MildMod
erate
Strong
Heavy
Overp
ower
ing
Scent Power
Hap
pine
ss (%
)
0
20
40
60
80
100
120
NoneTra
ce
Faint
Slight
MildMod
erate
Strong
Heavy
Overpo
wering
Scent Power
Am
ou
nt
of
Fra
gra
nce
(%
of
form
ula
tio
n)
Qualitative scent description and utility + % fragrance and qualitative scent description
� utility vs. % fragrance
U = -9.09E-06 x4 + 2.151E-03 x3 - 0.160 x2
+ 2.677 x + 89.6
y = -9.09427E-06x4 + 2.15070E-03x3 - 1.59924E-01x2 + 2.67741E+00x + 8.96006E+01
R2 = 9.96625E-01
010
2030
4050
6070
8090
100
0 20 40 60 80 100
Amount of Fragrance (%)
Uti
lity
(%
)
The Utility FunctionScent
Happiness to Scent Provided by Ethanol
0
20
40
60
80
100
120
None
Trace
Faint
Slight
Mild
Mod
erate
Strong
Heavy
Overp
owering
Scent Power
Hap
pin
ess
(%)
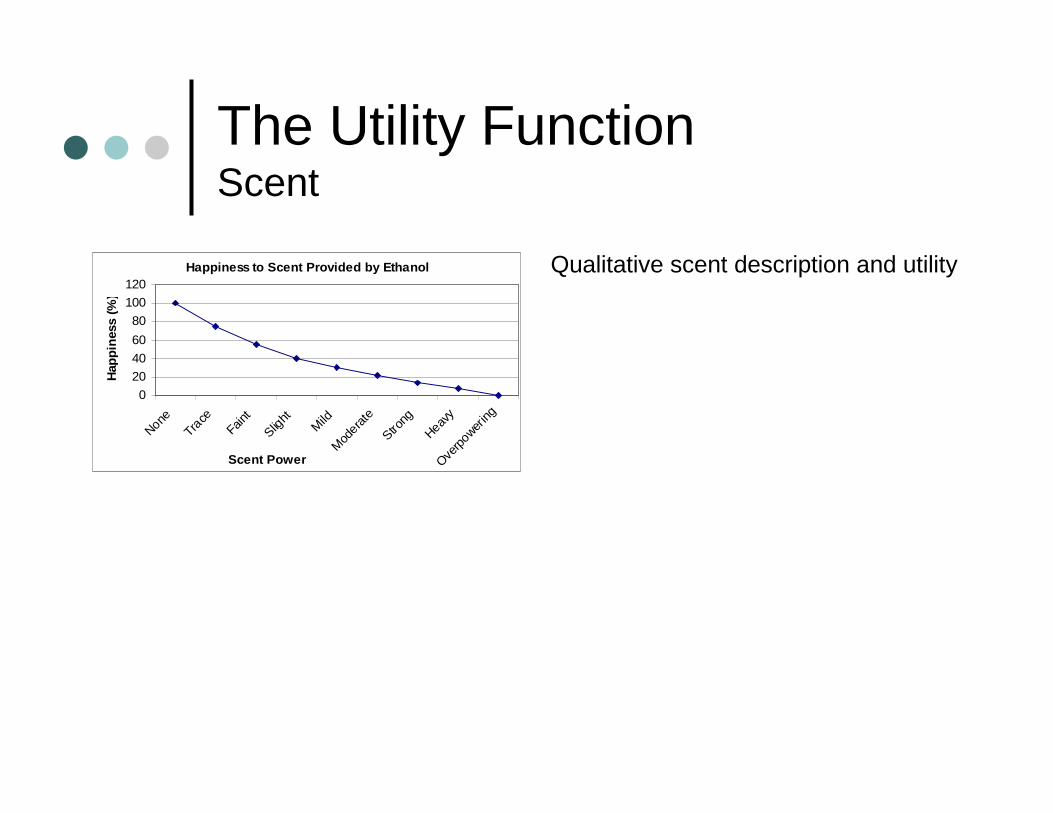
Qualitative scent description and utility
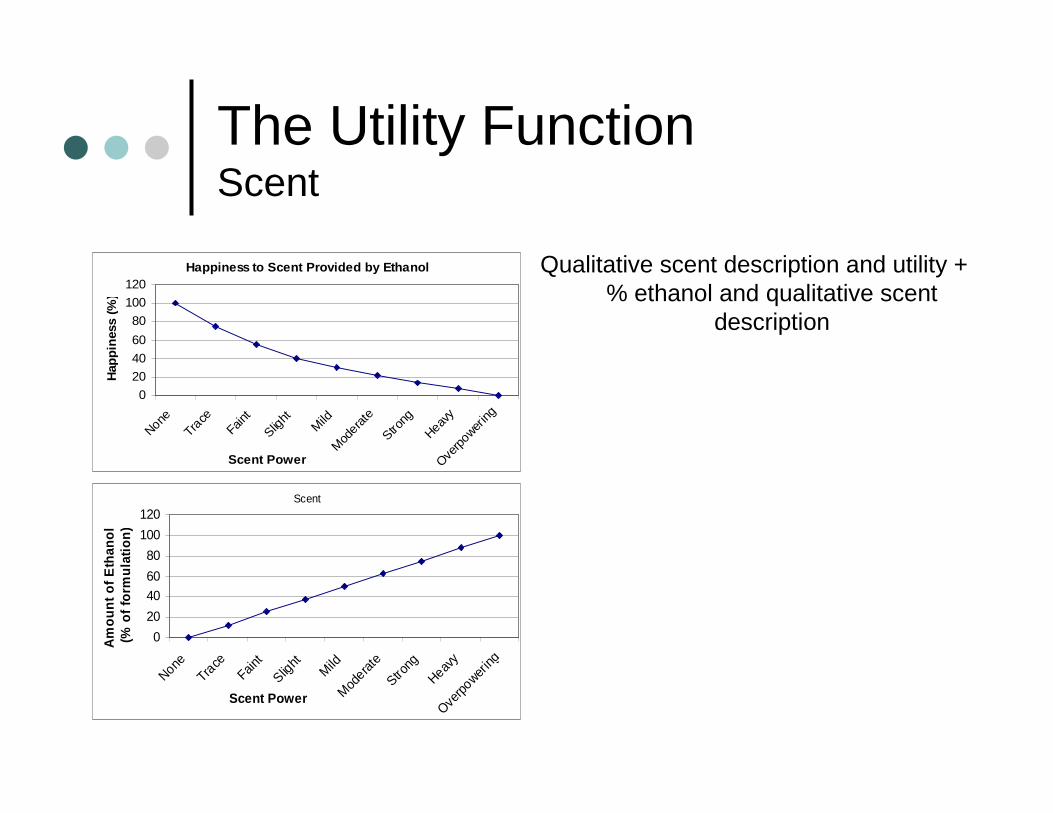
The Utility FunctionScent
Happiness to Scent Provided by Ethanol
0
20
40
60
80
100
120
None
Trace
Faint
Slight
Mild
Mod
erate
Strong
Heavy
Overp
owering
Scent Power
Hap
pin
ess
(%)
Qualitative scent description and utility + % ethanol and qualitative scent
description
Scent
0
20
40
60
80
100
120
None
Trace
Faint
Slight
MildMod
erate
Strong
Heavy
Overpo
wering
Scent Power
Am
ou
nt
of
Eth
ano
l (
% o
f fo
rmu
lati
on
)
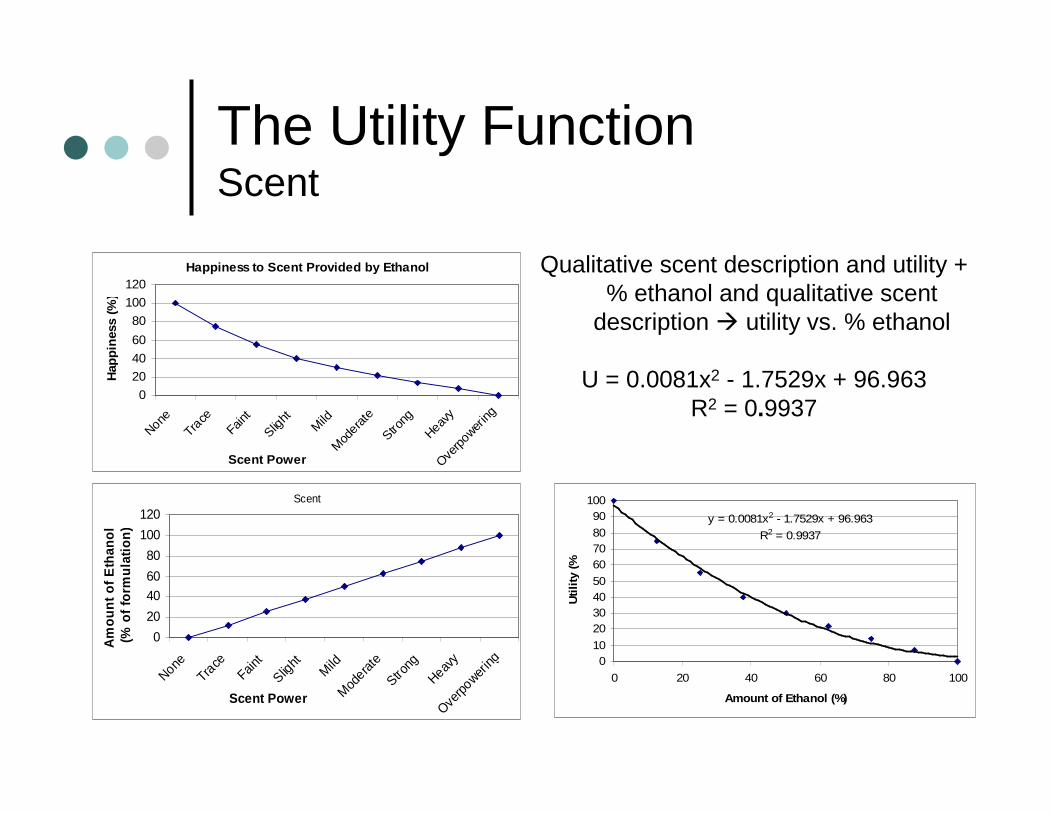
The Utility FunctionScent
Happiness to Scent Provided by Ethanol
0
20
40
60
80
100
120
None
Trace
Faint
Slight
Mild
Mod
erate
Strong
Heavy
Overp
owering
Scent Power
Hap
pin
ess
(%)
Qualitative scent description and utility + % ethanol and qualitative scent
description � utility vs. % ethanol
U = 0.0081x2 - 1.7529x + 96.963R2 = 0.9937
Scent
0
20
40
60
80
100
120
None
Trace
Faint
Slight
MildMod
erate
Strong
Heavy
Overpo
wering
Scent Power
Am
ou
nt
of
Eth
ano
l (
% o
f fo
rmu
lati
on
)
y = 0.0081x2 - 1.7529x + 96.963
R2 = 0.9937
010
20304050
607080
90100
0 20 40 60 80 100
Amount of Ethanol (%)
Uti
lity
(%
)

The Utility FunctionScent
• One ingredient has a positive effect, one has a negative effect on consumer utility
Solution:
Weighted average:(Uethanol * xethanol + Ufragrance * xfragrance )
(xethanol + xfragrance )
• Assumptions:
Picaridin, aloe are essentially odorless
OptimizationCost Analysis
� Raw Material Costs
� Process Costs� All process equipment� Buildings� Utilities� Labor
� Shipping Costs� Optimized plant location: Little Rock, AR� Products shipped to 16 locations across the U.S.
� Advertising Costs� Annual budget set at $1 million
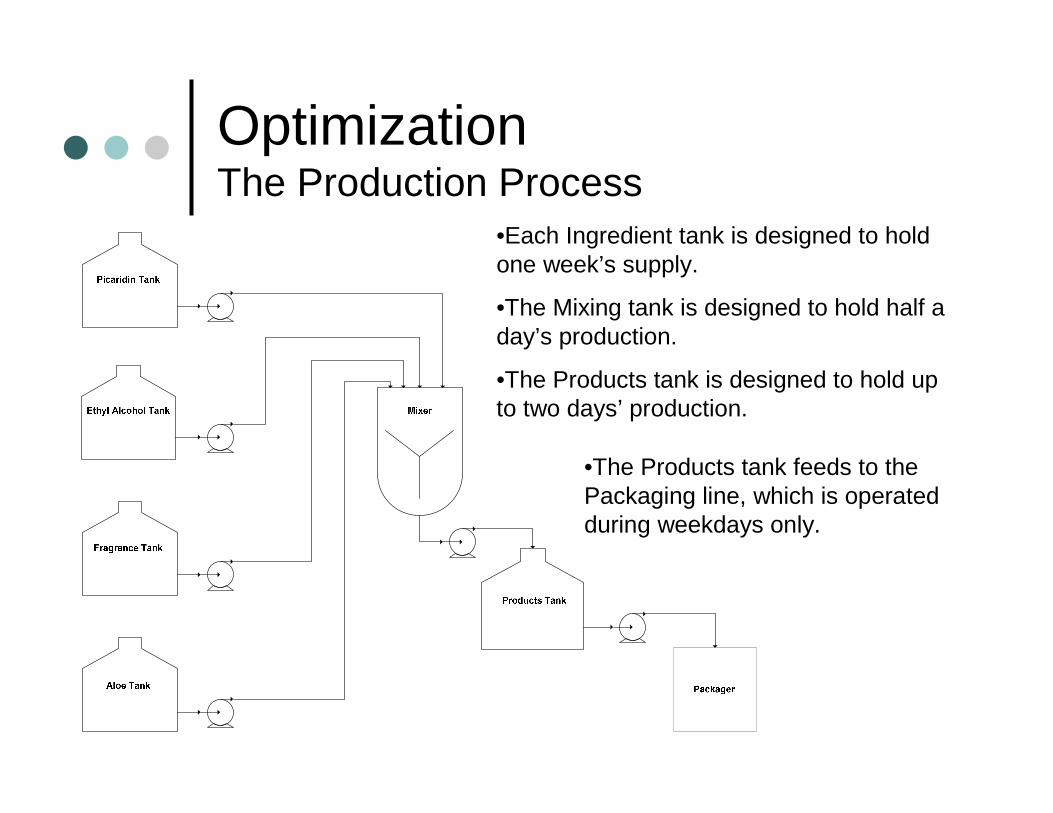
OptimizationThe Production Process
•Each Ingredient tank is designed to hold one week’s supply.
•The Mixing tank is designed to hold half a day’s production.
•The Products tank is designed to hold up to two days’ production.
•The Products tank feeds to the Packaging line, which is operated during weekdays only.

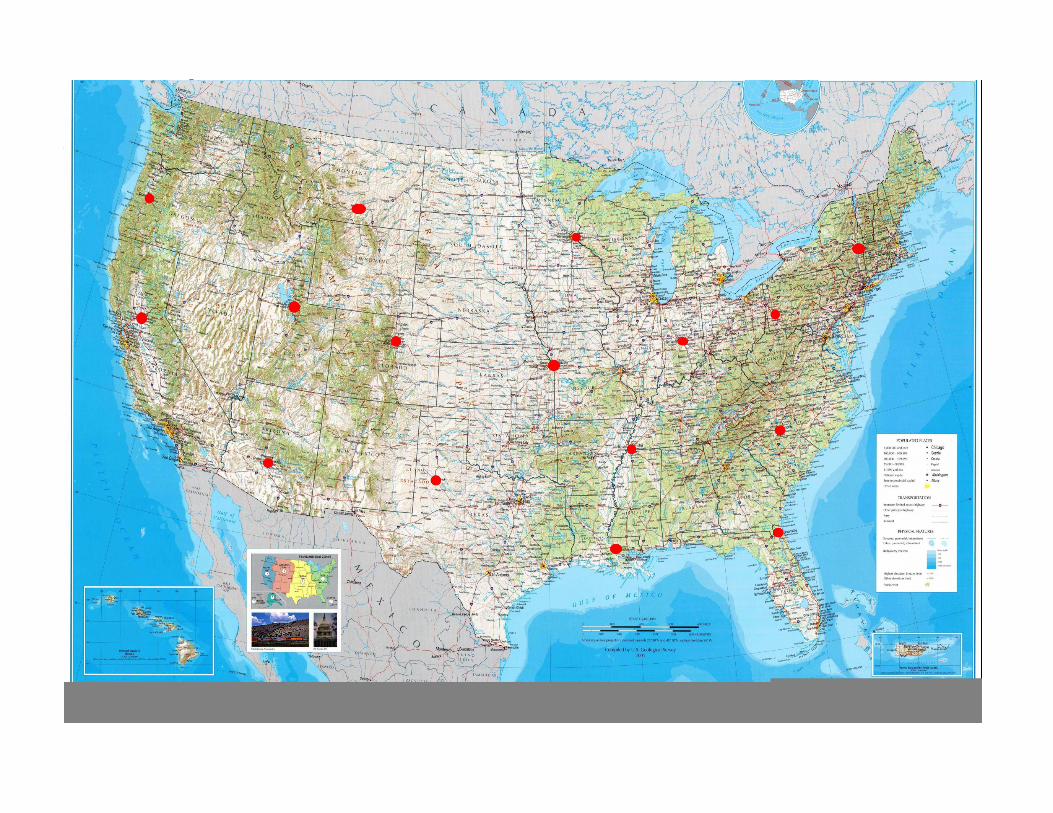
� Distribution centers were chosen to be able to cover all sections of the US.
� Percentage of production sent to each center was allotted to supply each region based on population and perceived need for the product.
� Assumptions: consumer utility is the same in each market (same target consumer); relative prices remain constant in each region; budget constraints have constant ratio to prices
OptimizationShipping

OptimizationShipping
7795Pittsburgh, PA
6487Charlotte, NC
1297Memphis, TN
7066St Paul, MN
3047Baton Rouge, LA
11326Billings, MT
11426Phoenix, AZ
11337Sacramento, CA
6837Albany, NY
4847Jacksonville, FL
3267Indianapolis, IN
5517Kansas City, MO
7676Lubbock, TX
16355Denver, CO
11445Salt Lake City, UT
17525Eugene, OR
Shipping DistancePercent of Production ReceivedDistribution Center
OptimizationShipping
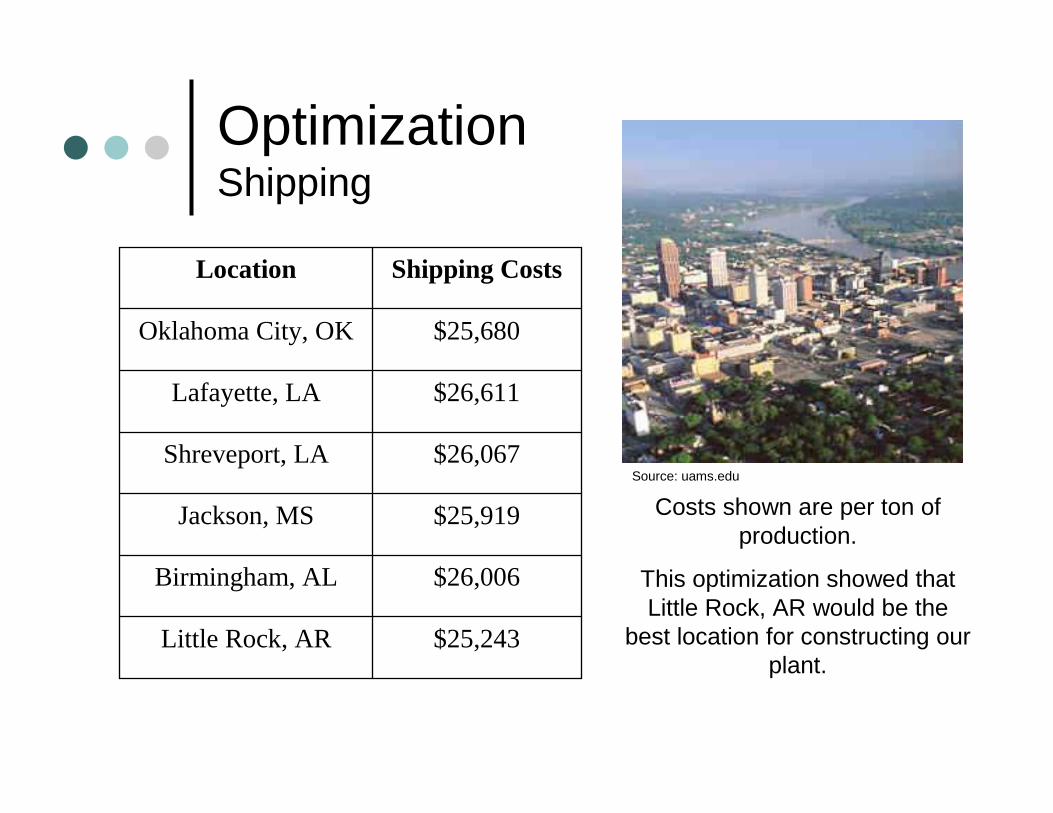
$25,243Little Rock, AR
$26,006Birmingham, AL
$25,919Jackson, MS
$26,067Shreveport, LA
$26,611Lafayette, LA
$25,680Oklahoma City, OK
Shipping CostsLocation
Costs shown are per ton of production.
This optimization showed that Little Rock, AR would be the
best location for constructing our plant.
Source: uams.edu

OptimizationEconomic Analysis
� Budget Constraint:P1D1 + P2D2 ≤ Y
P is price; D is demand; Y is budget constraint; 1 is our product; 2 is the competition
� Price and Demand:βP1D1 = αP2D2D1
α/D2β
β is relative utility; α is relative consumer awareness
Source: http://www.bytefusion.com/products/ens/secexmail/smart_guy_teaching_hr.gif
OptimizationEconomic Analysis
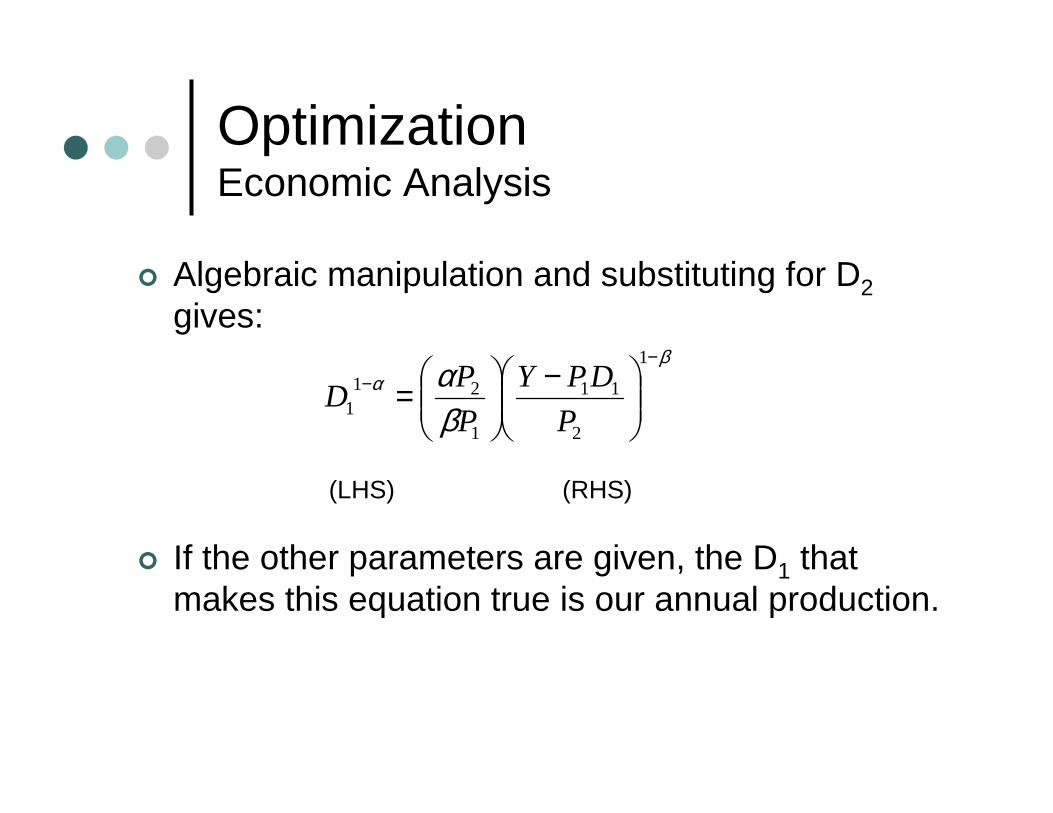
� Algebraic manipulation and substituting for D2gives:
(LHS) (RHS)
� If the other parameters are given, the D1 that makes this equation true is our annual production.
βα
βα
−−
−
=
1
2
11
1
211 P
DPY
P
PD
OptimizationProcedure
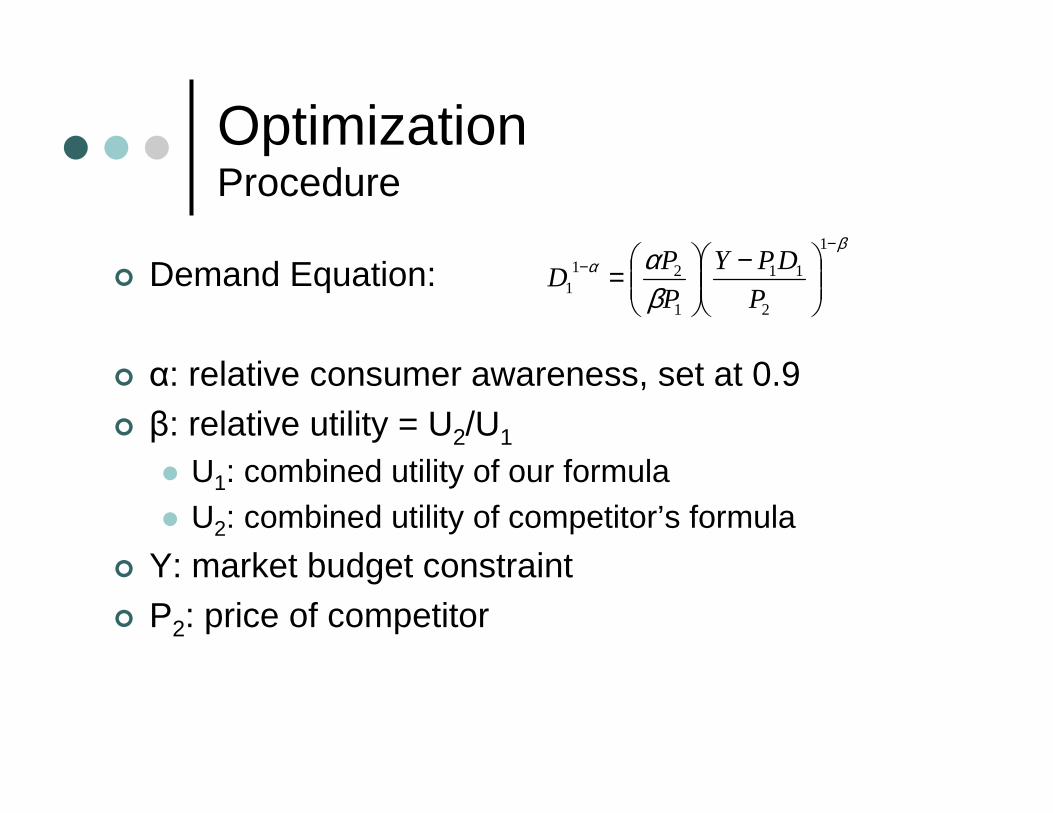
� Demand Equation:
� α: relative consumer awareness, set at 0.9� β: relative utility = U2/U1
� U1: combined utility of our formula� U2: combined utility of competitor’s formula
� Y: market budget constraint� P2: price of competitor
βα
βα
−−
−
=
1
2
11
1
211 P
DPY
P
PD
OptimizationProcedure
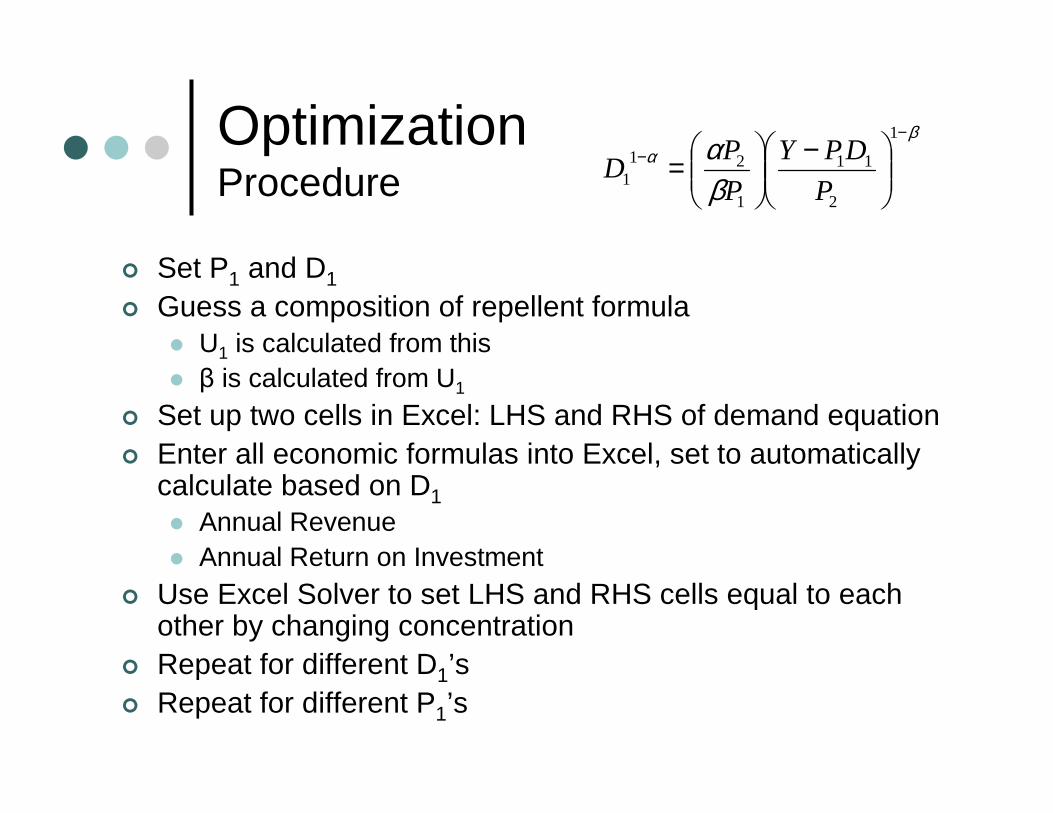
� Set P1 and D1
� Guess a composition of repellent formula� U1 is calculated from this� β is calculated from U1
� Set up two cells in Excel: LHS and RHS of demand equation� Enter all economic formulas into Excel, set to automatically
calculate based on D1� Annual Revenue� Annual Return on Investment
� Use Excel Solver to set LHS and RHS cells equal to each other by changing concentration
� Repeat for different D1’s� Repeat for different P1’s
βα
βα
−−
−
=
1
2
11
1
211 P
DPY
P
PD
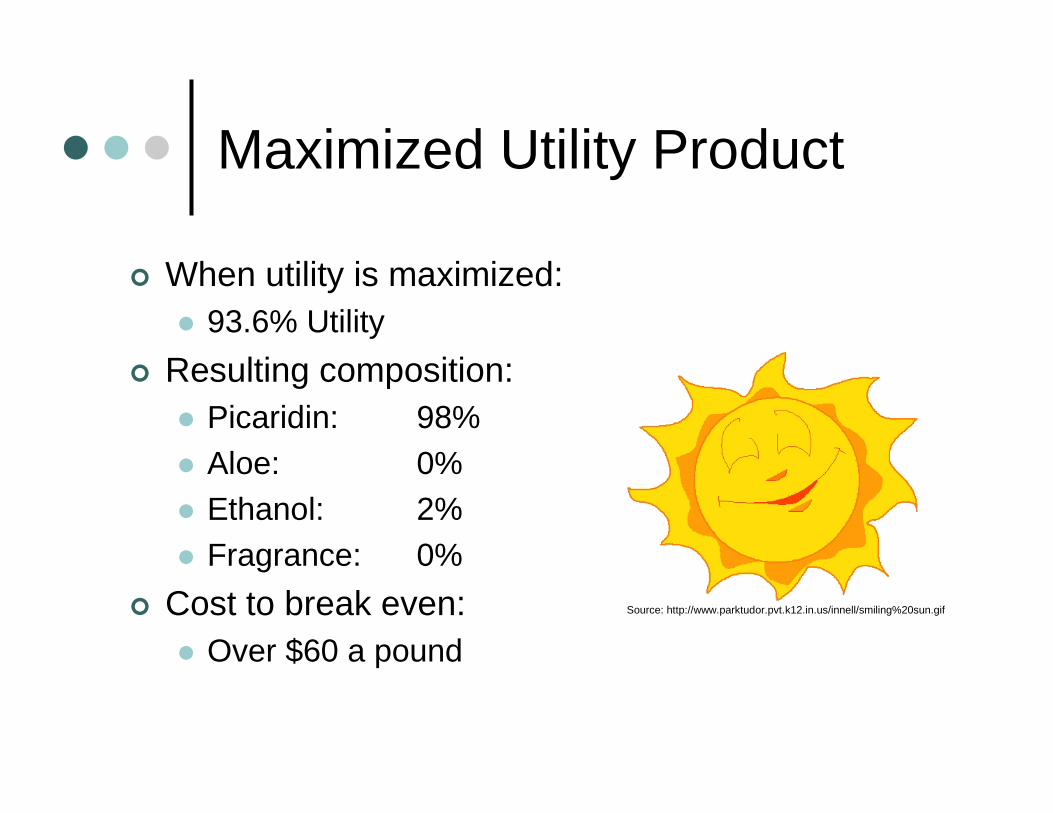
Maximized Utility Product
� When utility is maximized:� 93.6% Utility
� Resulting composition:� Picaridin: 98%� Aloe: 0%� Ethanol: 2%� Fragrance: 0%
� Cost to break even:� Over $60 a pound
Source: http://www.parktudor.pvt.k12.in.us/innell/smiling%20sun.gif
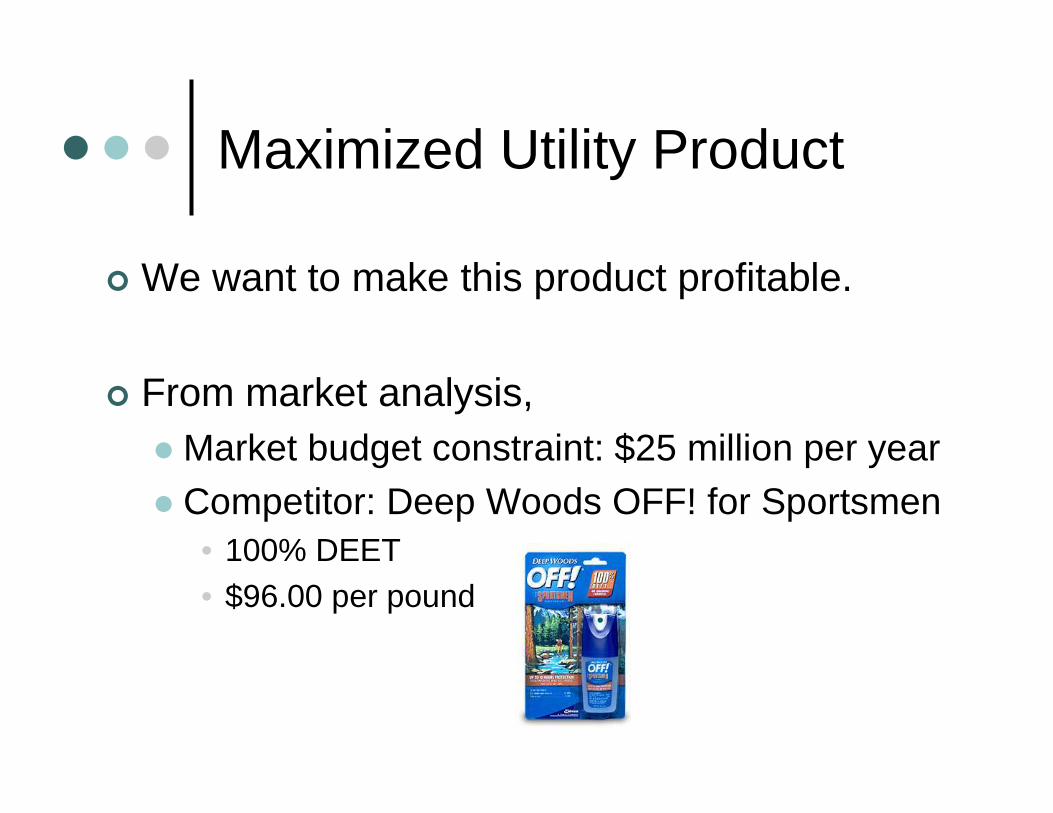
Maximized Utility Product
� We want to make this product profitable.
� From market analysis,� Market budget constraint: $25 million per year� Competitor: Deep Woods OFF! for Sportsmen
• 100% DEET• $96.00 per pound

Maximized Utility Product
� This product can be profitable!� Demand: 125,000 pounds per year� Price: $80 per pound ($5 per 1 oz. bottle)
� Net Income: $310,000 per year
� However, raw material costs are the largest cost, so any deviations in these could have a large effect.
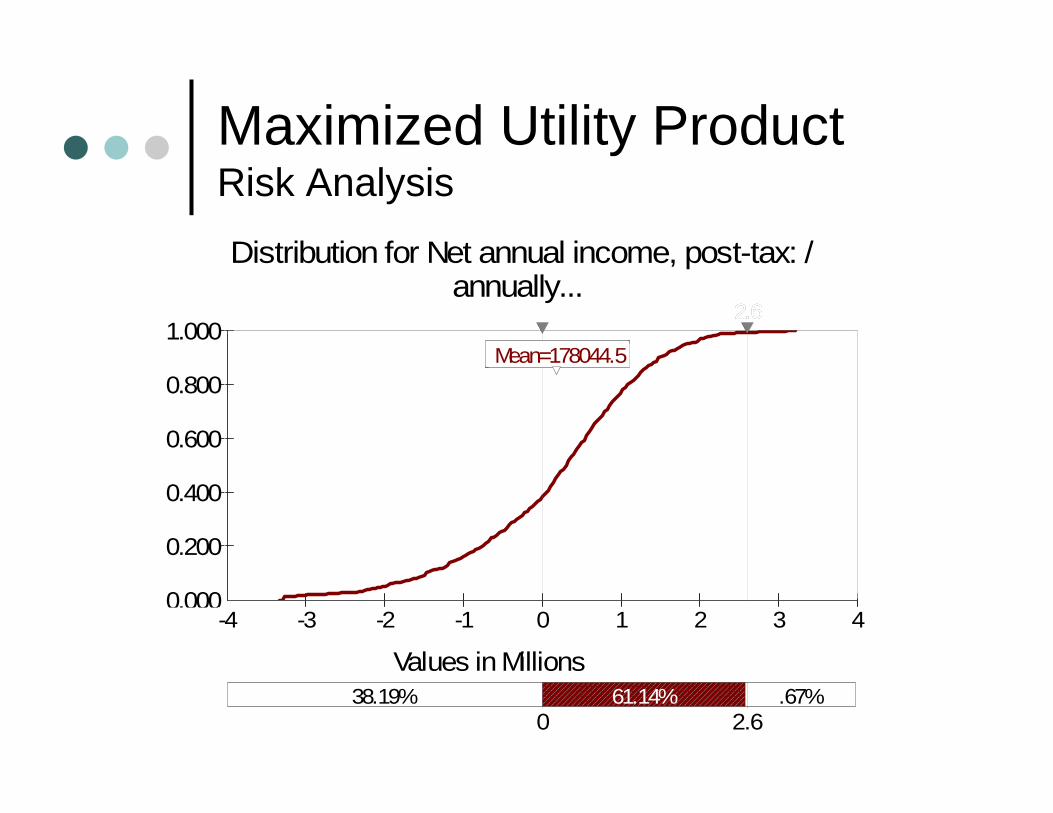
Maximized Utility ProductRisk Analysis
Distribution for Net annual income, post-tax: /annually...
Values in Millions
0.000
0.200
0.400
0.600
0.800
1.000
Mean=178044.5
-4 -3 -2 -1 0 1 2 3 4
2.62.62.62.6
-4 -3 -2 -1 0 1 2 3 4
38.19% 61.14% .67% 0 2.6
Mean=178044.5 Mean=178044.5

Maximizing Profit
� The previous approach was deemed too risky, so it was decided to develop a product with a larger consumer pool.
� New aim: common repellents� Less effective� Less expensive
� New market budget constraint: $250 million per year
� New competitor: Cutter Advanced� 7% Picaridin� $16.00 per pound
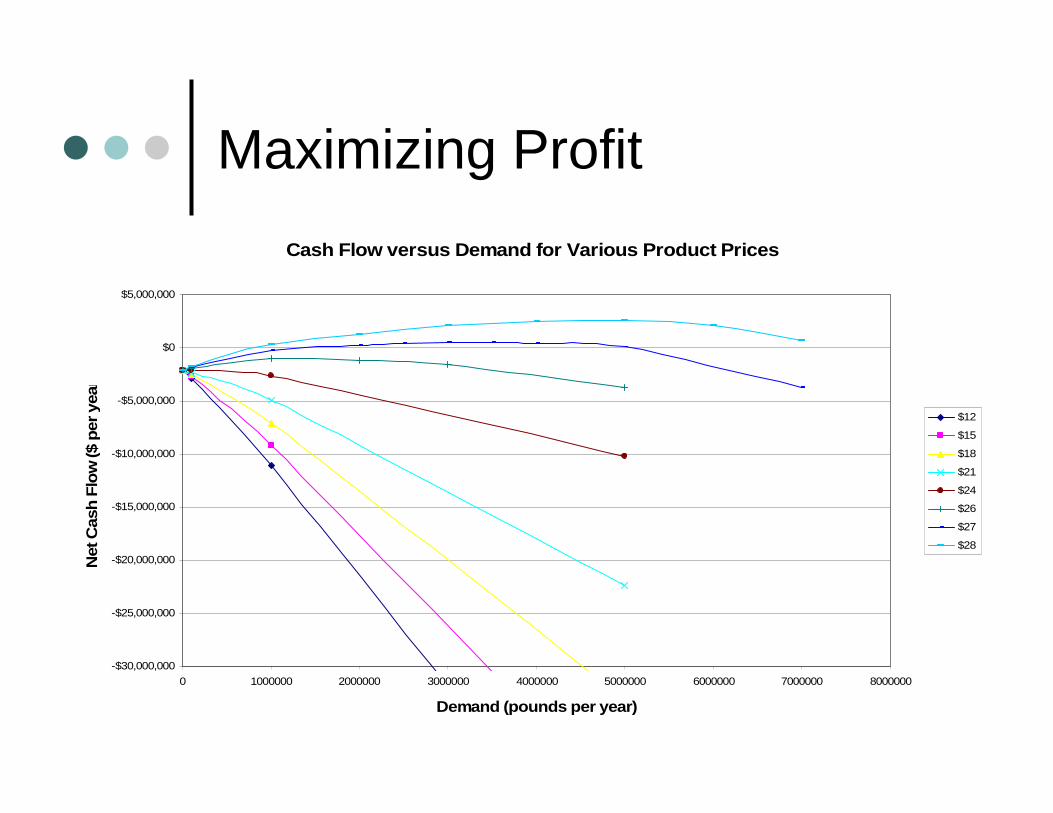
Maximizing Profit
Cash Flow versus Demand for Various Product Prices
-$30,000,000
-$25,000,000
-$20,000,000
-$15,000,000
-$10,000,000
-$5,000,000
$0
$5,000,000
0 1000000 2000000 3000000 4000000 5000000 6000000 7000000 8000000
Demand (pounds per year)
Net
Cas
h F
low
($ p
er y
ear)
$12
$15
$18
$21
$24
$26
$27
$28

Maximized Profit Product
� Resulting composition� Picaridin: 43%� Aloe: 1%� Ethanol: 55%� Fragrance: 1%
� Demand: 5 million pounds per year� Price: $28 per pound ($10.50 per 6 oz. bottle)� Net Income: $2.55 million per year
Source: http://www.mobileedproductions.com/images/chem1bandw.gif

Maximized Profit ProductRisk Analysis
� A standard deviation of 20% was assumed in the raw materials costs
� 55% chance of our product being profitable� Expected profit is -$500,000
Distribution for Net annual income, post-tax: /annually...
Values in Millions
0.000
0.200
0.400
0.600
0.800
1.000
Mean=-499329.3
-80 -60 -40 -20 0 20 40 60-80 -60 -40 -20 0 20 40 60
44.96% 54.23% .81% 0 40
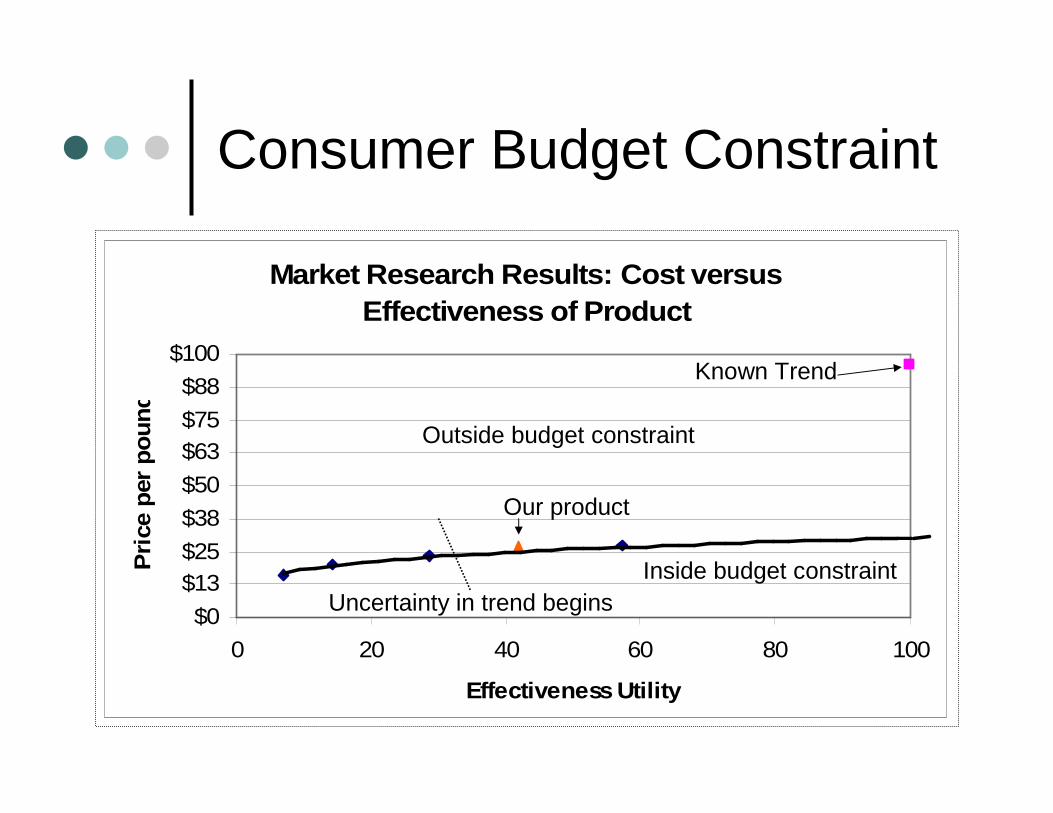
Market Research Results: Cost versus Effectiveness of Product
$0
$13$25
$38
$50
$63$75
$88
$100
0 20 40 60 80 100
Effectiveness Utility
Pri
ce p
er p
ou
nd
Consumer Budget Constraint
Our product
Uncertainty in trend begins
Outside budget constraint
Inside budget constraint
Known Trend
Conclusions
� The Safer Choice� Market the specialty repellent
• Less risk involved• Less profit possible (millions)
� The More Lucrative Choice� Market the common repellent at a higher price
• Riskier• Higher possible profit (10s of millions)• Because of uncertainty of budget constraint, further market
research should be performed
Source: http://www.oc88.com
Environmental Impact
� Production only involves mixing� No gas releases� No harmful byproducts
� All ingredients non-toxic� Leaks present no serious
environmental concerns
� Largest impact is related to shipping (truck emissions)
Source: http://residentialvessels.com
/environment.htm
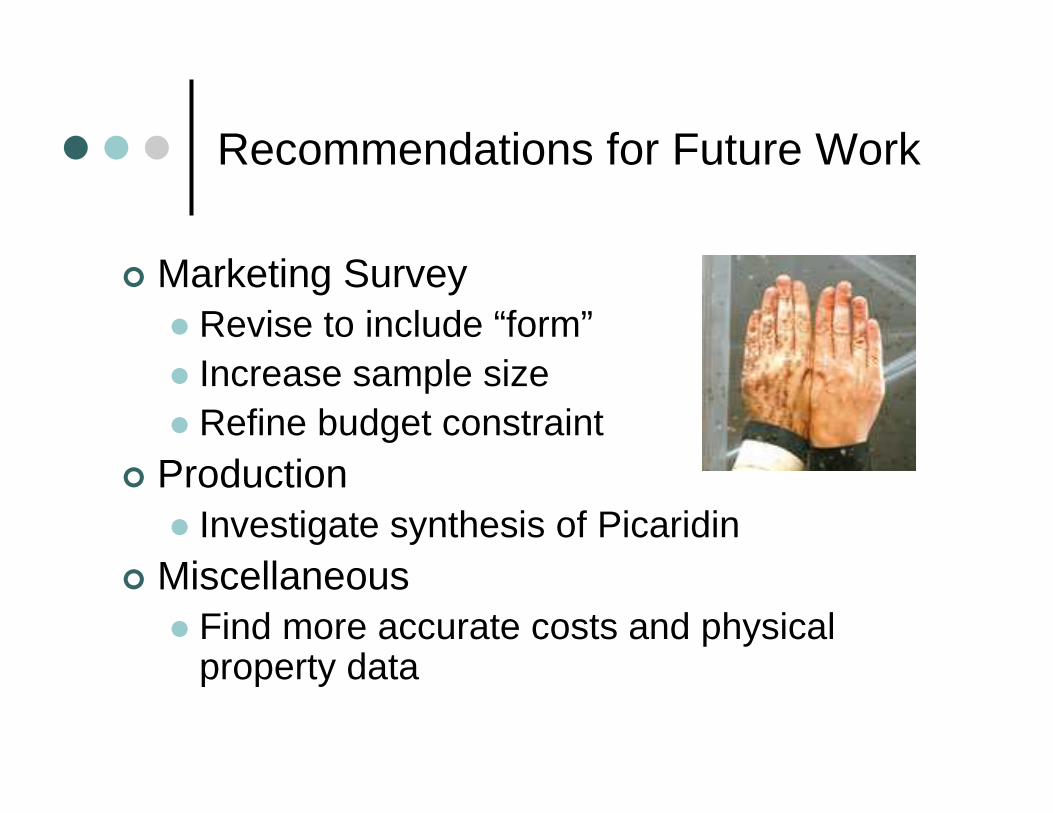
Recommendations for Future Work
� Marketing Survey� Revise to include “form”� Increase sample size� Refine budget constraint
� Production� Investigate synthesis of Picaridin
� Miscellaneous� Find more accurate costs and physical
property data

Any Questions?