final report - world agroforestry centre | transforming ... · final report international ... bca...
TRANSCRIPT

Developing Pro-Poor Markets for Environmental Services in the Philippines
FINAL REPORT
International Institute for Environment and Development
by
RESOURCES, ENVIRONMENT AND ECONOMICS CENTER FOR STUDIES (REECS), Inc.
February 2003

ii
TABLE OF CONTENTS List of Tables List of Figures List of Acronyms 1. INTRODUCTION……………………………………………………………………………… 1
1.1 Background……………………………………………………………………………. 1 1.2 Purpose and Objectives of Research……………………………………………… 2 1.3 Methodology………………………………………………………………………….. 3 1.4 Structure of the Report………………………………………………………………. 3
2. MARKETS FOR ENVIRONMENTAL SERVICES IN THE PHILIPPINES – SOME
EXISTING INITIATIVES………………………………………………………………………. 5 2.1 Landscape and Seascape Beauty………………………………………………….. 11 2.2 Watershed Protection………………………………………………………………... 17 2.3 Biodiversity Conservation…………………………………………………………… 23 2.4 Carbon Sequestration………………………………………………………………… 26 2.5 Environmental Waste Disposal Services…………………………………………. 27 2.6 Elevation Services…………………………………………………………………….. 27
3. INSTITUTIONAL SUPPORT MECHANISMS FOR ENVIRONMENTAL SERVICE MARKETS – CURRENT ISSUES AND PROBLEMS……………………………………… 30 3.1 National Integrated Protected Areas System (NIPAS)…………………………. 30
3.1.1 NIPAS Act……………………………………………………………………. 30 3.1.2 User Fees for NIPAS Sites…………………………………………………. 31 3.1.3 Protected Area Management Boards (PAMBs)………………………... 32 3.1.4 Implementation of User Fees – Some Emerging Difficulties………. 43 3.1.5 Integrated Protected Area Fund (IPAF)…………………………………. 44
3.1.5.1 Definition…………………………………………………………… 44 3.1.5.2 Current Flow of IPAF Disbursements…………………………. 45 3.1.5.3 Problems in IPAF Disbursements………………………………. 49
3.1.6 Potential Solutions on Issues Regarding NIPAS Act Implementation…………………………………………………………….. 53
3.1.7 Conclusion…………………………………………………………………… 57 3.2 Balian, Pangil, Laguna: A Case Study on Watershed Protection by a
Community-Based Organization………………………………………………….. 57 3.2.1 The Study Site……………………………………………………………….. 57 3.2.2 Historical Background……………………………………………………... 59 3.2.3 Current Operations…………………………………………………………. 62 3.2.4 Institutional and Resource Use Conflicts………………………………. 64 3.2.5 Potential for Developing Markets for Watershed Protection
Services……………………………………………………………………….. 66 3.2.6 Lessons Learned…………………………………………………………….. 67
iii
4. SOCIO-ECONOMIC FRAMEWORK FOR EVALUATING AND MONITORING MARKETS FOR ENVIRONMENTAL SERVICES………………………………………….. 70 4.1 Apo Island Protected Landscape and Seascape (AIPLAS)…………………….. 71
4.1.1 Description of the Study Area……………………………………………. 71 4.1.2 Economic Profile……………………………………………………………. 76 4.1.3 Protection Efforts……………………………………………………………. 76 4.1.4 Resource Use Conflicts……………………………………………………. 77 4.1.5 Revenues Generated………………………………………………………. 77 4.1.6 Key Informant Interviews: Testing the Methodology……………….. 81
4.1.6.1 Institutional/Process Indicators…………………………………. 81 4.1.6.2 Impact Indicators – Economic…………………………………. 82 4.1.6.3 Impact Indicators – Social and Biophysical…………………. 82
4.1.7 Conclusion…………………………………………………………………… 84 4.2 Reforestation, Watershed Management, Health and/or Environment
Enhancement Fund (RWMHEEF) of the Department of Energy…………….. 85 4.2.1 Definition……………………………………………………………………. 85 4.2.2 Institutional Set-up…………………………………………………………. 87 4.2.3 The Universal Charge……………………………………………………... 90 4.2.4 Guidelines in Approving Project Proposals…………………………... 90 4.2.5 Funds Accrued, Funds Disbursed……………………………………….. 92
4.2.5.1 Amount on Paper…………………………………………………. 92 4.2.5.2 Actual Money on Hand…………………………………………. 95
4.2.6 Matrix of Approved Projects……………………………………………… 96 4.2.6.1 List of Projects by Type………………………………………….. 96 4.2.6.2 Beneficiaries……………………………………………………….. 98
4.2.7 Socio-Economic Impact Analysis………………………………………... 98 4.2.8 Conclusion…………………………………………………………………… 102
5. PROPOSAL FOR FURTHER RESEARCH………………………………………………….. 104 References Appendix A DENR Administrative Order No. 2000-51 Appendix B DENR Administrative Order No. 13, Series of 1992 Appendix C-1 Schedule of Interview for All the Study Components Appendix C-2 Schedule of Presentations on the Integrated Protected Area Fund (IPAF) Appendisx D DBM Circular Letter No. 99-9 Appendix E Municipal Ordinance Declaring Balian Water Sources as Protected Area Appendix F Presidential Proclamation No. 438 Appendix G AIPLAS PAMB Resolution No. 1 Appendix H Matrix of the AIPLAS Survey
iv
Guide Questions and Set of Respondents August 2002 Appendix I Rule 29, Republic Act No. 9136 Implementing Rules and Regulations Appendix J Sample Memorandum of Agreement, DOE and Bataan Appendix K Guidelines on the Review/Evaluation of Project Proposals
For DLF and RWMHEEF

v
LIST OF TABLES Table 1 List of Environmental Valuation Studies Conducted in the Philippines 1988-2002 Table 2a Protected Areas Proclaimed under NIPAS Area and PAMB Structure by Region and Protected Area As of December 2002 Table 2b Protected Areas Proposed for NIPAS As of September 2002 Table 3 Protected Areas with IPAF Disbursements
Average Total Number of Days, Total Income, Total IPAF Disbursement and Status of NIPAS Proclamation by Protected Area As of December 2002
Table 4 Protected Areas with IPAF Revenues Area and Total Income by Region and Protected Area As of December 2002 Table 5 Mean Percent of Living and Dead Substrate Cover in Apo Island Fish
Sanctuary Negros Oriental, 1981, 1982, 1983, 1985, 1992 and 2002
Table 6 Schedule of Fees and Charges Apo Island Protected Landscape and Seascape Table 7 Revenues and Number of Tourists by Quarter Apo Island Protected Landscape and Seascape
2000-April 2002 Table 8 Results of the Key Informant Interviews on Apo Island
Dauin, Negros Oriental, September 2002 Frequencies in Percent
Table 9 Preferred Development and Livelihood Projects to be Funded Under Development and Livelihood Fund
Table 10 Accruals and Disbursements, Benefits Under Republic Act 9136
1994-2002 Table 11 Total Generating Capacity of Power Plants that have Availed of Funds from RWMHEEF Under E.R. 1-94 As of July 24, 2002
vi
Table 12 Approved Reforestation, Watershed Management, Health and/or Environment Enhancement Projects Under Energy Regulations No. 1-94 By Type of Project, January 1995 to June 2002

vii
LIST OF FIGURES Figure 1 IPAF Funds Flow Figure 2 Administrative Flowchart of Current IPAF Process Figure 3 Proposed Administrative Flowchart of IPAF Process Figure 4 Location Map of Balian, Pangil, Laguna Figure 5 Interwood Logging Concession Figure 6 Relative Location Map of Apo Island Marine Sanctuary Figure 7 Flowchart of Availment of Development Livelihood Fund and Reforestation,
Watershed Management, Health and Environmental Enhancement Fund Figure 8 Program for Granting of Financial Benefits to Host Communities Under E.R.
1-94, as Amended Figure 9 Flowchart of Funds, Payment and Withdrawal for Development Livelihood
Fund and Reforestation, Watershed Management, Health and/or Environment Enhancement Fund

viii
LIST OF ACRONYMS AICBGR Inter-Agency on the Collection of Biological and Genetic Resources AIPLAS Apo Island Protected Landscape and Seascape ARED Assistant Regional Director ARMM Autonomous Region of Muslim Mindanao ATCRD Appropriate Technology Center for Rural Development BCA Benefit-Cost Analysis CA Commonwealth Act CAR Cordillera Administrative Region CBP Community-Based Program CENRO Community Environment and Natural Resources Officer CPPAP Conservation for Priority Protected Areas Program CRA Commercial Research Agreement CRM Community Resource Management EI Economic Instruments EIAB Energy Industry Administration Bureau EF Electrification Fund EMS Environment Management Specialist ENR Environment and Natural Resources ENRAP Environmental and Natural Resources Accounting Project EO Executive Order EPIRA Electric Power Industry Reform Act ER Energy Regulation ERC Energy Regulatory Commission ERMP Environmental Resource Management Project ES Environmental Service DAO DENR Administrative Order DBM Department of Budget and Management DENR Department of Environment and Natural Resources DLF Development and Livelihood Fund DOE Department of Energy DOH Department of Health GEF Global Environmental Facility HEA Head Executive Assistant IACBGR Inter-Agency on the Collection of Biological and Genetic Resources ICC Indigenous Cultural Community IEC Information and Education Campaign IP Indigenous People IPAF Integrated Protected Area Fund IPAS Integrated Protected Areas IPP Independent Power Producer IRR Implementing Rules and Regulations KKP Kabang Kalikasan ng Pilipinas (World Wildlife Fund) LGC Local Government Code LGU Local Government Unit LK Lingap Kalikasan LLDA Laguna Lake Development Authority
ix
MCDP Marine Conservation Development Program MES Markets for Environment Services MFR Makiling Forest Reserve MKRNP Mt. Kitanglad Range Natural Park MMC Marine Management Committee MOA Memorandum of Agreement MS Master of Science MSFR Mangrove Swamp Forest Reserve NAPWNC Ninoy Aquino Parks and Wildlife Nature Center NCA Notice of Cash Allocation NCIP National Commission of Indigenous People NGO Non-Government Organization NIPA NGOs for Integrated Protected Area, Inc. NIPAS National Integrated Protected Areas System NP National Park NPA New People’s Army NPC National Power Corporation NWRB National Water Resources Board OIC Officer in Charge OGA Other Government Agencies OGF Old Growth Forest OVI Objectively Verifiable Indicators PA Protected Area PAMB Protected Area Management Board PAWB Protected Areas and Wildlife Bureau PCSD Philippine Council for Sustainable Development PCU Program Coordinating Unit PENRO Provincial Environment and Natural Resources Officer PhD Doctor of Philosophy PL Protected Landscapes PLS Protected Landscapes and Seascapes PO People’s Organization PRRM Philippine Rural Reconstruction Movement PS Protected Seascapes PTA Philippine Tourism Authority QC Quezon City RA Republic Act RED Regional Executive Director REECS Resources, Environment and Economics Center for Studies, Inc. RUPES Rewarding Upland Poor as Payment for Environmental Services RWMHEEF Reforestation, Watershed Management, Health and/or Environment
Enhancement Fund SARO Special Allotment Release Order SBPTI Samahan ng Bailan Para Sa Pagpapauwi ng Tubig Inumin SESAM School of Environmental Science and Management SME Small and Medium Enterprises SRS Senior Research Specialist TLA Timber License Agreement TOR Terms of Reference

x
UPLB University of the Philippines Los Baños USAID United States Agency for International Development WAC World Agroforestry Center WB World Bank WFR Watershed Forest Reserve WTP Willingness to Pay WFP Work and Financial Plan WS Wildlife Sanctuary
Developing Pro-Poor Markets for Environmental Services in the Philippines: FINAL REPORT
Resources, Environment and Economics Center for Studies (REECS), Inc. 1
DEVELOPING PRO-POOR MARKETS FOR ENVIRONMENTAL SERVICES IN THE PHILIPPINES
FINAL REPORT
Resources, Environment and Economics Center for Studies, Inc. February 2003
1. INTRODUCTION 1.1 Background The term “markets for environmental services”, or MES, may sound new to most people, including those who have been working in the environmental sector. Yet the concept is not entirely alien, particularly to stakeholders directly affected by environmental and natural resource management. The literature defines market development for environmental services as the creation of incentive systems, mainly through the price system, that provide the link between providers of the environmental service and beneficiaries of the service1. In this sense, markets for environmental services are distinguished from traditional markets, the latter referring more to hierarchical and cooperative systems of organizing production and consumption. Environmental services on the other hand refer to services provided by the natural environment that ultimately benefit people. Examples of such services include landscape and seascape beauty, watershed protection, carbon sequestration, and biodiversity conservation (Landell-Mills and Porras 2002). These services were traditionally enjoyed for free. However, current conditions of scarcity have led to the development of markets for environmental services in various forms and mechanisms. The role of the government is further distinguished in the MES arena. Because of the public nature of most of these services, the government becomes a very active player in market development. In the case of national parks, for instance, government becomes the seller of such services by ensuring their provision through protection and conservation efforts. Payments come in the form of economic instruments instituted in these protected areas, with the assumption that revenues from these instruments will sustain protection activities, and consequently environmental services. The Philippines is one of several developing countries that have begun developing markets for environmental services. Pioneering efforts in environmental and natural resources valuation were undertaken, which became the bases of economic instruments that aim to promote wise use of the environment and natural resources. In the course of introducing these economic instruments, there have been parallel efforts to address livelihood and income concerns for communities living in affected areas. Both efforts directly address different objectives, with economic instruments mainly targeting efficiency and alternative livelihood projects trying to address equity concerns. Sometimes, there is a dovetailing effect in implementing these efforts simultaneously. Still, at other times, they seem to be implemented in a dichotomous manner.
1 Landell-Mills, N. and Porras, I. 2002. Silver Bullet or Fools’ Gold?

Developing Pro-Poor Markets for Environmental Services in the Philippines: FINAL REPORT
Resources, Environment and Economics Center for Studies (REECS), Inc. 2
An assessment is therefore in order to be able to characterize the development of markets for environmental services in the Philippines. The nascent character of MES in the developing world makes it difficult to establish scientific linkages between improvements in biodiversity and economic instruments. What is feasible is to make an initial assessment on the impacts of these markets on the poor residing in the area, both in terms of potential income effects and whether they are slowly empowered in making decisions as providers of these environmental services. 1.2 Purpose and Objectives of Research This study aims to conduct a preliminary assessment of the development of markets for environmental services (ES) in the Philippines. The assessment will pay particular attention to the distribution of costs and benefits among different stakeholder groups, in light of widespread public concern about the impacts of market-based instruments on the poor. It further aims to include an assessment of the process by which such instruments were introduced (e.g. the extent of public participation in decision-making). Ideally, the assessment would address the full social, economic and environmental impacts of market-based instruments at every stage, from initial development through to monitoring and enforcement. In practice though, most instruments are still in the early stages of development or implementation. Hence this assessment will be limited to the design, introduction and preliminary impacts of economic instruments. This will include impacts on people’s livelihoods and revenue generation for sustainable management of the resource or the area.
There are three major objectives of this study. The first involves a documentation of all efforts undertaken with respect to developing markets for environmental services in the Philippines. Part of this objective is a brief description of the current environmental services being provided, and a literature review of some initiatives towards development of MES in each of these services. The second objective is to conduct a rapid assessment of institutional mechanisms that have evolved in the development of markets for environmental services. This would include an analysis of current issues and problems associated with MES development, as well as recommendations on the necessary elements of institutional mechanisms based on actual field experiences. Finally, the third objective is to develop and test a robust framework for monitoring and evaluating the efficacy of markets for environmental services in three respects:
1. Environmental – are market-based approaches effective at protecting/providing the
desired quantity and quality of environmental services, without adverse environmental impacts?
2. Economic – are they more cost-effective than previous/alternative instruments? do they
create positive incentives for continuous environmental improvement? do they create alternative/improved livelihood opportunities for the resident community members, especially for the poor? And
3. Social – are the costs and benefits of MES shared equitably? are the processes of design
and implementation of MES inclusive, transparent and flexible, to allow learning and adaptation while fostering support from key stakeholder groups?
Developing Pro-Poor Markets for Environmental Services in the Philippines: FINAL REPORT
Resources, Environment and Economics Center for Studies (REECS), Inc. 3
1.3 Methodology In developing a socio-economic framework to evaluate MES and assessing the institutional mechanisms involved, the following main questions are asked:
1. What are the forms of markets that exist? What are the economic instruments used? 2. Do these markets target conservation and development objectives simultaneously, or
are they exclusive to the environment? If the former is true, what mechanisms are involved to ensure this?
3. Are there actual or potential social costs involved in the creation of these markets? Or are there social benefits that may or have inadvertently arisen out of the creation of these markets?
4. What are the various institutional mechanisms that exist in providing for markets for environmental services? Are these mechanisms effective or not? In cases of government-controlled mechanisms, is there transparency and widespread participation of other stakeholders in their creation and implementation?
5. Are the current institutional mechanisms cost-effective, or are they more costly compared to previous arrangements prior to their creation?
Some questions are descriptive in nature, as there has not yet been any attempt to document MES development in the country prior to this study. Meanwhile, other questions deal with the economic and social benefits and costs of such markets, and the accompanying institutional mechanisms for their implementation.
Two case studies were used for the assessment of institutional mechanisms, while two other case studies were used for testing the framework of assessing the efficacy of markets. Key informant interviews and secondary data gathering were the main methods used to gather data. The interviews were conducted intermittently between May and September of 2002. Some data gaps were likewise filled in during January of 2003. Secondary data was mainly from published and gray literature and outputs of previously conducted projects in the country.
1.4 Structure of the Report The report is divided into five parts. Section I gives a brief introduction of the study, with a short discussion of the objectives and the methodologies employed for data gathering. Section II lists down the various environmental services for which markets have been created in the Philippines, along with a literature review of studies conducted for each type of service. Section III talks about the institutional support mechanisms for environmental service markets. Two case studies are presented here. The first deals with the national government as the institutional mechanism for market development in protected areas (PAs) under the National Integrated Protected Areas System (NIPAS). The second talks about a community-based organization that provides watershed protection services to its constituents and residents of the village where the watershed is located. The fourth part of the study contains the proposed framework for evaluating and monitoring markets for environmental services. The framework is tested in two cases. The first is a protected area under the NIPAS system, which is considered to be one of the most successful PAs in terms of reef enhancement and revenue generation. The second case study deals with a Fund established under the Department of Energy which is meant to encourage reforestation,
Developing Pro-Poor Markets for Environmental Services in the Philippines: FINAL REPORT
Resources, Environment and Economics Center for Studies (REECS), Inc. 4
watershed management, and health or environment enhancement in areas where energy projects locate. Finally, Section V contains proposals for further research.
Developing Pro-Poor Markets for Environmental Services in the Philippines: FINAL REPORT
Resources, Environment and Economics Center for Studies (REECS), Inc. 5
2. MARKETS FOR ENVIRONMENTAL SERVICES IN THE PHILIPPINES – SOME EXISTING INITIATIVES
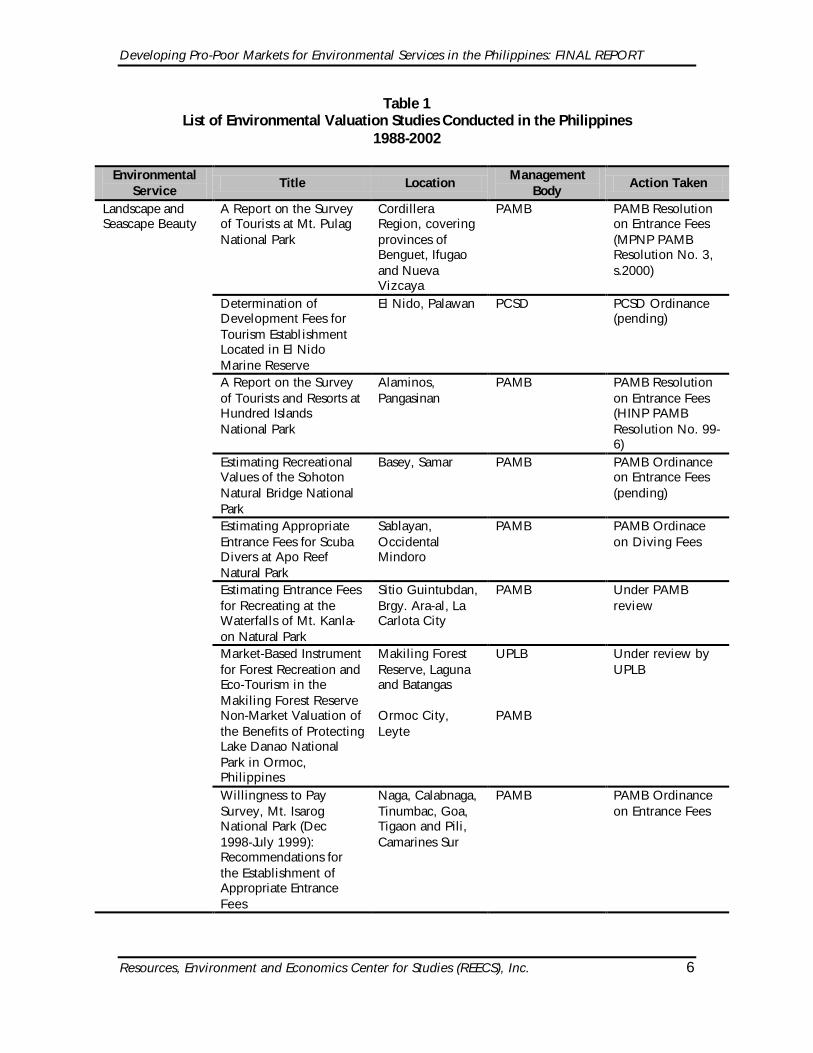
The environment is replete with services that humans have exploited and used in improving standards of living. Not only has it provided for food, water and shelter needs, it has also provided for protection and security against harsh conditions brought about by natural occurrences. Sometimes, benefits from the environment come in intangible forms, such as cultural heritage. Many of these services and benefits have traditionally been enjoyed for free by beneficiaries, due to the lack of corresponding market prices. However, ensuring their continued supply now involves costs on the part of the providers. Economic theory shows that in situations where scarcity occurs, prices are the regulatory mechanism that can clear the market between demand and supply. The environment is no exception to this. Evidence of such markets around the world has been documented in the book entitled “Silver Bullet or Fools’ Gold?” by Landell-Mills and Porras, 2002. The Philippines has its own experience in the development of markets for environmental services. Most of these initiatives are documented below according to the type of service being provided. Basically, there are four typical environmental services where market development has been initiated in the country: landscape and seascape beauty, watershed protection, biodiversity conservation and carbon sequestration. There are two additional types of environmental service where markets are starting to develop as well, namely elevation and environmental waste disposal. Elevation refers to the use of mountain ranges for commercial operations of private companies. On the other hand, environmental waste disposal refers to the use of the natural environment as a sink for wastes. Markets are developing in such a way that users of this service are being made to pay, the amounts of which are determined by the economic value of that service. Following is a cursory review of economic valuation studies conducted for each type of service. Many of these studies were translated into economic instruments through legal ordinances issued by the government body in-charge of managing and protecting the area concerned. Table 1 contains a summary list of these studies, including action taken whenever relevant.
Developing Pro-Poor Markets for Environmental Services in the Philippines: FINAL REPORT
Resources, Environment and Economics Center for Studies (REECS), Inc. 6
Table 1 List of Environmental Valuation Studies Conducted in the Philippines
1988-2002
Environmental Service
Title Location Management
Body Action Taken
Landscape and Seascape Beauty
A Report on the Survey of Tourists at Mt. Pulag National Park
Cordillera Region, covering provinces of Benguet, Ifugao and Nueva Vizcaya
PAMB PAMB Resolution on Entrance Fees (MPNP PAMB Resolution No. 3, s.2000)
Determination of Development Fees for Tourism Establishment Located in El Nido Marine Reserve
El Nido, Palawan PCSD PCSD Ordinance (pending)
A Report on the Survey of Tourists and Resorts at Hundred Islands National Park
Alaminos, Pangasinan
PAMB PAMB Resolution on Entrance Fees (HINP PAMB Resolution No. 99-6)
Estimating Recreational Values of the Sohoton Natural Bridge National Park
Basey, Samar PAMB PAMB Ordinance on Entrance Fees (pending)
Estimating Appropriate Entrance Fees for Scuba Divers at Apo Reef Natural Park
Sablayan, Occidental Mindoro
PAMB PAMB Ordinace on Diving Fees
Estimating Entrance Fees for Recreating at the Waterfalls of Mt. Kanla-on Natural Park
Sitio Guintubdan, Brgy. Ara-al, La Carlota City
PAMB Under PAMB review
Market-Based Instrument for Forest Recreation and Eco-Tourism in the Makiling Forest Reserve
Makiling Forest Reserve, Laguna and Batangas
UPLB Under review by UPLB
Non-Market Valuation of the Benefits of Protecting Lake Danao National Park in Ormoc, Philippines
Ormoc City, Leyte
PAMB
Willingness to Pay Survey, Mt. Isarog National Park (Dec 1998-July 1999): Recommendations for the Establishment of Appropriate Entrance Fees
Naga, Calabnaga, Tinumbac, Goa, Tigaon and Pili, Camarines Sur
PAMB PAMB Ordinance on Entrance Fees
Developing Pro-Poor Markets for Environmental Services in the Philippines: FINAL REPORT
Resources, Environment and Economics Center for Studies (REECS), Inc. 7
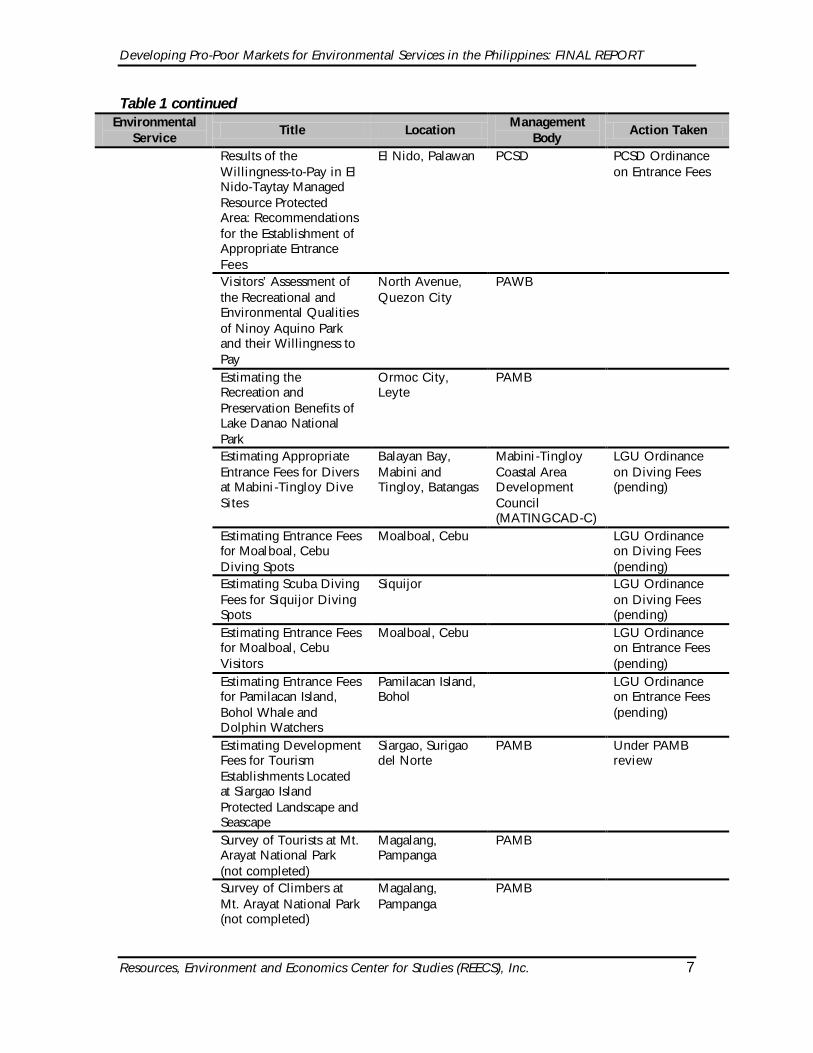
Table 1 continued Environmental
Service Title Location
Management Body
Action Taken
Results of the Willingness-to-Pay in El Nido-Taytay Managed Resource Protected Area: Recommendations for the Establishment of Appropriate Entrance Fees
El Nido, Palawan PCSD PCSD Ordinance on Entrance Fees
Visitors’ Assessment of the Recreational and Environmental Qualities of Ninoy Aquino Park and their Willingness to Pay
North Avenue, Quezon City
PAWB
Estimating the Recreation and Preservation Benefits of Lake Danao National Park
Ormoc City, Leyte
PAMB
Estimating Appropriate Entrance Fees for Divers at Mabini-Tingloy Dive Sites
Balayan Bay, Mabini and Tingloy, Batangas
Mabini-Tingloy Coastal Area Development Council (MATINGCAD-C)
LGU Ordinance on Diving Fees (pending)
Estimating Entrance Fees for Moalboal, Cebu Diving Spots
Moalboal, Cebu LGU Ordinance on Diving Fees (pending)
Estimating Scuba Diving Fees for Siquijor Diving Spots
Siquijor LGU Ordinance on Diving Fees (pending)
Estimating Entrance Fees for Moalboal, Cebu Visitors
Moalboal, Cebu LGU Ordinance on Entrance Fees (pending)
Estimating Entrance Fees for Pamilacan Island, Bohol Whale and Dolphin Watchers
Pamilacan Island, Bohol
LGU Ordinance on Entrance Fees (pending)
Estimating Development Fees for Tourism Establishments Located at Siargao Island Protected Landscape and Seascape
Siargao, Surigao del Norte
PAMB Under PAMB review
Survey of Tourists at Mt. Arayat National Park (not completed)
Magalang, Pampanga
PAMB
Survey of Climbers at Mt. Arayat National Park (not completed)
Magalang, Pampanga
PAMB

Developing Pro-Poor Markets for Environmental Services in the Philippines: FINAL REPORT
Resources, Environment and Economics Center for Studies (REECS), Inc. 8
Table 1 continued Environmental
Service Title Location
Management Body
Action Taken
Survey of Tourists at Hinulugang Taktak National Park (not completed)
Antipolo, Rizal PAMB Under PAMB review
Watershed Protection
Estimating Irrigation Fees from Farmers Drawing Water Coming from Bataan Natual Park
Hermosa, Orani, Samal, Abucay, Pilar, Balanga, Bagac and Morong, Bataan
PAMB Under PAMB review
Estimating Resource User Fees for Agricultural Production in Mt. Apo Natural Park
Kidapawan, Makilala, Magpet, Cotabato and Bansala, Digos, Sta. Cruz in Davao City, Davao del Sur
PAMB Under PAMB review
Estimating Development Fees for Gamefowl Farms Operating in Mt. Kanla-on Natural Park
Sitio Guintubdan, Brgy. Ara-al, La Carlota City
PAMB Under PAMB review
Estimating Development Fees for Geothermal Extraction by PNOC at Mt. Kanla-on Natural Park
Brgy. Mailum, Bago City, Negros Occidental
PAMB Under PAMB review
Derivation of Government Share from Energy Resource Extraction Project
Philippine National Oil Company-Southern Negros Geothermal Project (PNOC-SNGP), covering municipalities of Sta. Catalina, Siaton, Zamboanguita, Dauin, Bacong, Valencia, Sibulan, San Jose, Amlan, Tanjay and Pamplona, Negros Oriental
LGU DAO on Forest Charges (DAO No. 2000-30)
Estimating Resource User Fees for Agricultural Production in Mt. Kanla-on Natural Park, Negros Island, Phils
Murcia and La Castellana, Bago, La Carlota, Canlaon and San Carlos, Negros Island
PAMB Under PAMB review

Developing Pro-Poor Markets for Environmental Services in the Philippines: FINAL REPORT
Resources, Environment and Economics Center for Studies (REECS), Inc. 9
Table 1 continued Environmental
Service Title Location
Management Body
Action Taken
Pricing of Grassland Resources in the Philippines: Rent, Grassland Degradation and Rehabilitation and Alternative Land Uses
DAO No. 99-36.
Estimation of Watershed Protection Fees for Extraction of Spring Water Coming from Mt. Kanla-on Natural Park
Bago City, Negros Occidental
PAMB Under PAMB review
Water Consumption of Various Water Users and Watershed Protection and Conservation Fee Based on a Cost Recovery Principle
Makiling Forest Reserve, Laguna and Batangas
UPLB
Watershed and Groundwater Depletion in the Philippines: The Cagayan de Oro Experience
Cagayan de Oro PAMB Under PAMB review
Economic Valuation of the Protection of Maasin Watershed Reservation in Iloilo, Philippines
Maasin, Iloilo PAMB LGU Ordinace
Watershed Restoration and Protection in the Bais Bay Basin, Philippines
Bais Bay Basin, Negros Oriental
Estimating Erosion Costs: A Philippine Case Study in the Lower Agno River Watershed
Itogon, Benguet and Baguio City
PAMB
The On-site and Downstream Costs of Soil Erosion: Valuation Results for Two Philippine Watesheds and Implications for Conservation Policy
Magat Watershed and Pantabangan Watershed, Nueva Ecija
Six Case Studies of Community-Based Forest Resource Management in the Philippines (Site Six: Kalahan Forest Reserve, Sta. Fe, Nueva Vizcaya)
Sta. Fe, Nueva Vizcaya
Kalahan Educational Foundation (KEF)
DAO on CBFMA charges

Developing Pro-Poor Markets for Environmental Services in the Philippines: FINAL REPORT
Resources, Environment and Economics Center for Studies (REECS), Inc. 10
Table 1 continued Environmental
Service Title Location
Management Body
Action Taken
Biodiversity Conservation
Economic Implications of Biodiversity Preservation in Mt. Pangasugan, Philippines
Baybay, Leyte
Draft DENR Administrative Order on Benefit-Sharing Schemes in the Implementation of EO 247 other wise know as “Prescribing Guidelines and Establishing a Regulatory Framework for the Prospecting of Biological and Genetic Resources, Their By-Products and Derivatives, For Scientific and Commercial Purposes, and for Other Purposes”
Draft DAO –under DENR review
Carbon Sequestration
Carbon Uptake of Samar Island’s Forest/Biomass: A Preliminary Estimation
Samar Island PAMB Used in BCA of management options for SIFR
An Estimation and Valuation of Carbon Storage Function of Angat River Watershed and Forest Area
Norzagaray, San Jose, Bulacan and Montalban, Nueva Vizcaya
Economic Analysis of Land-Use Options
Used by WAC
Environmental Waste Disposal Services
Framework for the Application of an Environmental User Fee System for Water Pollution Management in the Philippines
Draft DAO – under DENR review
Analysis of a Wastewater Discharge Permit Fee for Industrial Waste Water Pollution: The Case of Marilao River, Bulacan
Marilao, Bulacan Draft DAO – under DENR review
Value of Direct Environmental Waste Disposal Services: 1995 Update
Used in ENR Accounting
Environmental Waste Disposal Services: General Santos City (Main Report)
General Santos City
Used in ENR Accounting
Developing Pro-Poor Markets for Environmental Services in the Philippines: FINAL REPORT
Resources, Environment and Economics Center for Studies (REECS), Inc. 11
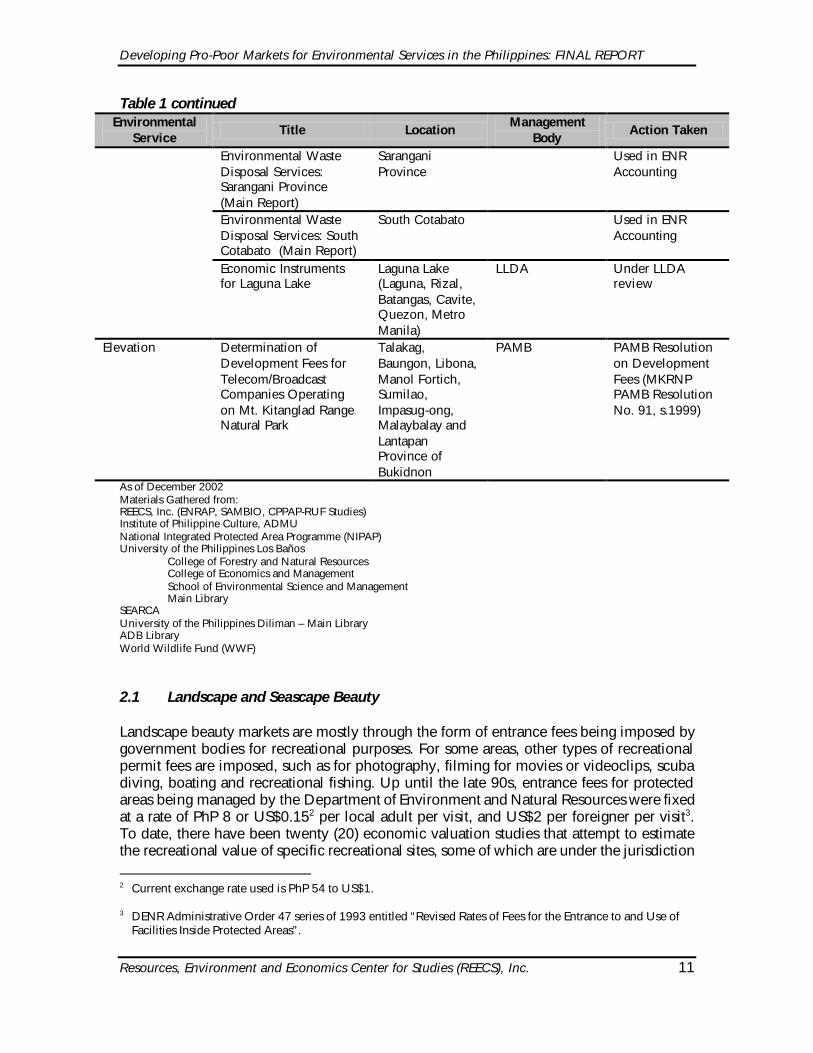
Table 1 continued Environmental
Service Title Location
Management Body
Action Taken
Environmental Waste Disposal Services: Sarangani Province (Main Report)
Sarangani Province
Used in ENR Accounting
Environmental Waste Disposal Services: South Cotabato (Main Report)
South Cotabato Used in ENR Accounting
Economic Instruments for Laguna Lake
Laguna Lake (Laguna, Rizal, Batangas, Cavite, Quezon, Metro Manila)
LLDA Under LLDA review
Elevation Determination of Development Fees for Telecom/Broadcast Companies Operating on Mt. Kitanglad Range Natural Park
Talakag, Baungon, Libona, Manol Fortich, Sumilao, Impasug-ong, Malaybalay and Lantapan Province of Bukidnon
PAMB PAMB Resolution on Development Fees (MKRNP PAMB Resolution No. 91, s.1999)
As of December 2002 Materials Gathered from: REECS, Inc. (ENRAP, SAMBIO, CPPAP-RUF Studies) Institute of Philippine Culture, ADMU National Integrated Protected Area Programme (NIPAP) University of the Philippines Los Baños College of Forestry and Natural Resources College of Economics and Management School of Environmental Science and Management Main Library SEARCA University of the Philippines Diliman – Main Library ADB Library World Wildlife Fund (WWF) 2.1 Landscape and Seascape Beauty Landscape beauty markets are mostly through the form of entrance fees being imposed by government bodies for recreational purposes. For some areas, other types of recreational permit fees are imposed, such as for photography, filming for movies or videoclips, scuba diving, boating and recreational fishing. Up until the late 90s, entrance fees for protected areas being managed by the Department of Environment and Natural Resources were fixed at a rate of PhP 8 or US$0.152 per local adult per visit, and US$2 per foreigner per visit3. To date, there have been twenty (20) economic valuation studies that attempt to estimate the recreational value of specific recreational sites, some of which are under the jurisdiction 2 Current exchange rate used is PhP 54 to US$1. 3 DENR Administrative Order 47 series of 1993 entitled “Revised Rates of Fees for the Entrance to and Use of
Facilities Inside Protected Areas”.

Developing Pro-Poor Markets for Environmental Services in the Philippines: FINAL REPORT
Resources, Environment and Economics Center for Studies (REECS), Inc. 12
of the DENR, and some being managed locally by their respective municipal government offices. Among these, five (5) were used as basis for entrance fees currently being imposed by the management bodies, while nine (9) are still being reviewed for the potential imposition of user fees. Two particular studies4 recommended fees to be charged against other beneficiaries in the tourism sector, such as resort owners, through what is called a development fee. The concept of this fee is that the owners are made to pay for the premium they enjoy because of the location of their establishments. Such a premium is hypothesized to be maintained because of the protection efforts being accorded the protected area. Box No. 1: Case Study on the Estimation of Park Entrance Fees at Mt. Pulag National Park a) Facts
Location: Cordillera Region, covering the provinces of Benguet, Ifugao and
Nueva Vizcaya Area: 11,550 hectares Unique Features: Highest peak in Luzon, third highest in Philippines
Flora, a succession of pine, mossy and natural grassland at highest level Consists of three mountains: Mt. Pulag; Mt. Tabayoc; and Mt. Panatoan
Accessed through Baguio City via paved and dirt roads and trails No. of visitors (9/97 to 8/98): approximately 1,000 Peak months: November to May Management: Protected Area Management Board (PAMB) Current Entrance Fee Structure:
PhP50 entrance for PAMB PhP25 green fee for municipality of Kabayan
b) Chronology of Activities
• Presented pilot testing activity to DENR-CAR on April 2, 1998 • Developed survey questionnaire • Hired and trained PAWB and Park Rangers as enumerators • On-site survey from April 3 to 11, 1998 (by team) continued by PA staff thereafter,
covering a total of 130 visitors • Mail-in survey from May to September 1998, covering 200 questionnaires. This was
necessary due to insufficient number of visitors covered on-site • Data encoded between August to November 1998 • Data analyzed and report written between November 1998 to February 1999 • Presented preliminary results to PAMB in February 1999 • PAMB Action: Formation of a committee to study the recommendations for future
implementation
4 Studies on estimating development fees for El Nido and Siargao tourism establishments.

Developing Pro-Poor Markets for Environmental Services in the Philippines: FINAL REPORT
Resources, Environment and Economics Center for Studies (REECS), Inc. 13
c) Results Willingness to Pay (WTP) to enter MPNP: Contingent Valuation Method (CVM) With 0 bids W/o 0 bids Incremental WTP at current level PhP30.69 PhP39.04 Incremental WTP with improved services: With 0 bids W/o 0 bids Road/ Trail conditions PhP 9.99 PhP13.53 Maps and information PhP 9.35 PhP11.58 Enforcement of environmental laws PhP12.71 PhP14.66 Frequency of Incremental WTP at Current Level of Services:
Amount Frequency 0 71 10 7 25 75 50 92 100 27
Travel Cost Model (TCM)
Breakdown of Travel Costs/Visitor Amount Percent to Total
Trip expenses (Gas, toll, fare, food, etc.) PhP2,075 83 percent On-site expenses (food, film, etc.) 378 15 percent Entrance fee 46 2 percent
Total Expenses 2,499 100 percent Note: Not all visitors paid the entrance fee.
Developing Pro-Poor Markets for Environmental Services in the Philippines: FINAL REPORT
Resources, Environment and Economics Center for Studies (REECS), Inc. 14
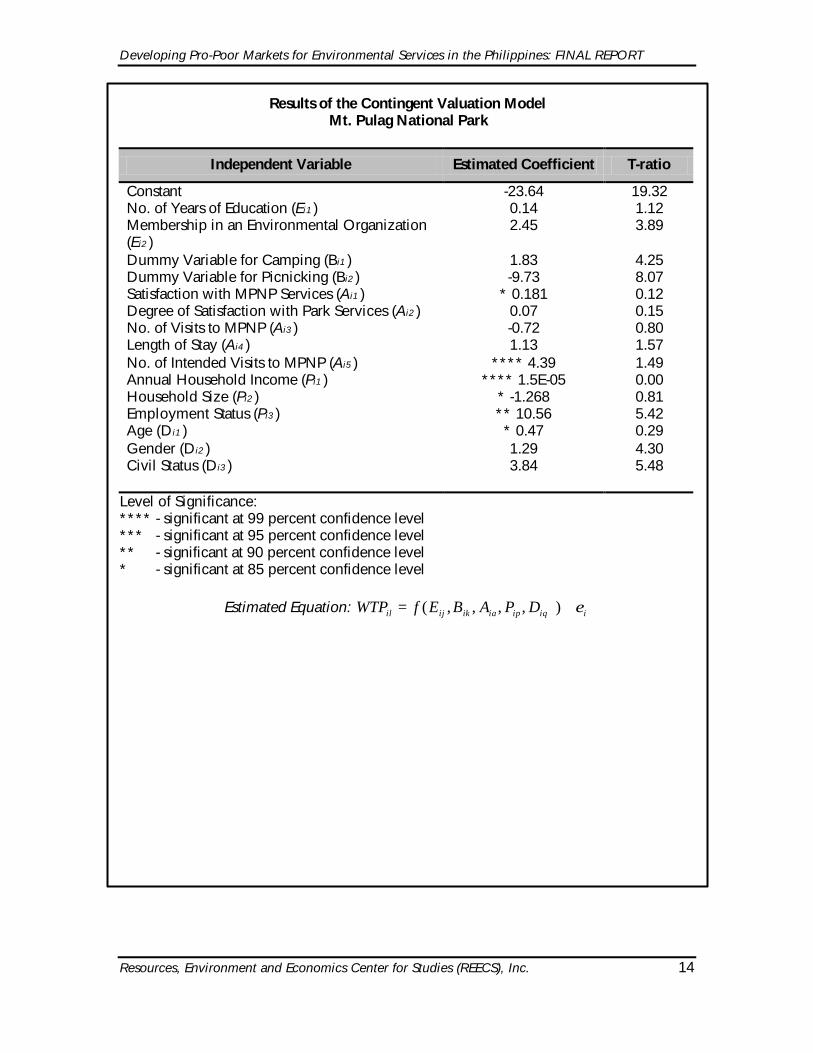
Results of the Contingent Valuation Model Mt. Pulag National Park
Independent Variable Estimated Coefficient T-ratio
Constant -23.64 19.32 No. of Years of Education (Ei1 ) 0.14 1.12 Membership in an Environmental Organization (Ei2 )
2.45 3.89
Dummy Variable for Camping (Bi1 ) 1.83 4.25 Dummy Variable for Picnicking (Bi2 ) -9.73 8.07 Satisfaction with MPNP Services (Ai1 ) * 0.181 0.12 Degree of Satisfaction with Park Services (Ai2 ) 0.07 0.15 No. of Visits to MPNP (Ai3 ) -0.72 0.80 Length of Stay (Ai4 ) 1.13 1.57 No. of Intended Visits to MPNP (Ai5 ) **** 4.39 1.49 Annual Household Income (Pi1 ) **** 1.5E-05 0.00 Household Size (Pi2 ) * -1.268 0.81 Employment Status (Pi3 ) ** 10.56 5.42 Age (Di1 ) * 0.47 0.29 Gender (Di2 ) 1.29 4.30 Civil Status (Di3 ) 3.84 5.48
Level of Significance: **** - significant at 99 percent confidence level *** - significant at 95 percent confidence level ** - significant at 90 percent confidence level * - significant at 85 percent confidence level
Estimated Equation: iiqipiaikijil DPABEfWTP ε+= ),,,,(
Developing Pro-Poor Markets for Environmental Services in the Philippines: FINAL REPORT
Resources, Environment and Economics Center for Studies (REECS), Inc. 15
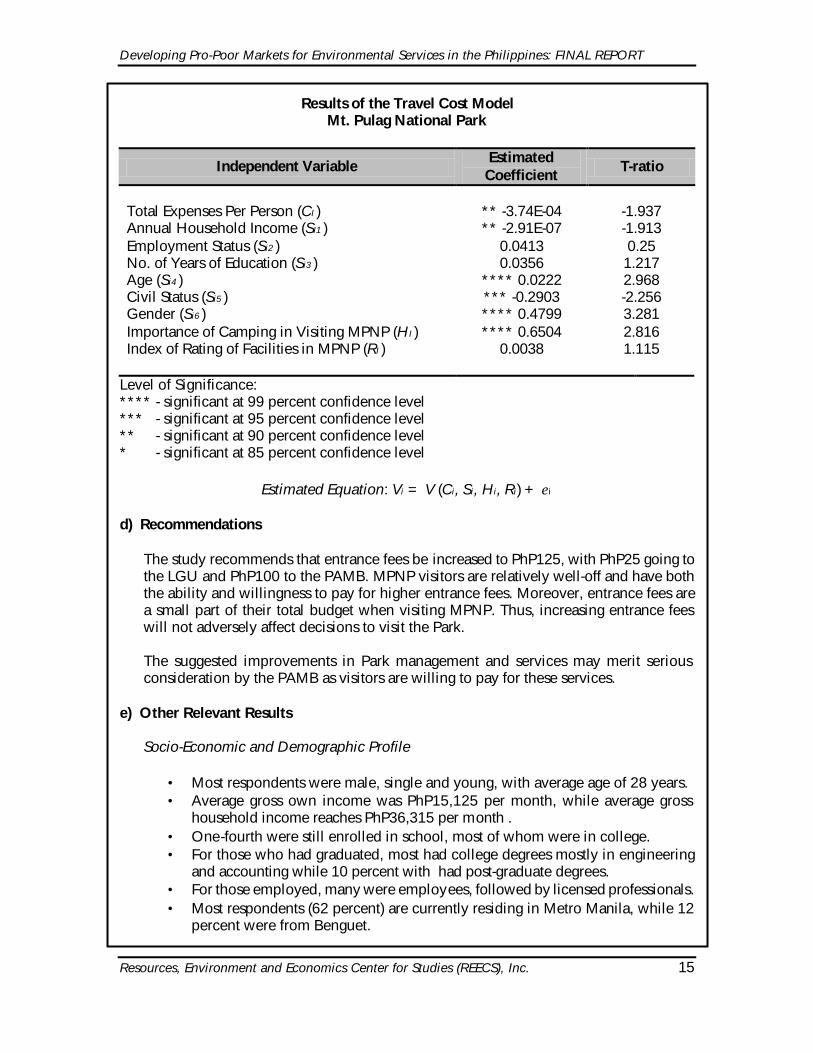
Results of the Travel Cost Model Mt. Pulag National Park
Independent Variable Estimated Coefficient T-ratio
Total Expenses Per Person (CI ) ** -3.74E-04 -1.937 Annual Household Income (SI1 ) ** -2.91E-07 -1.913 Employment Status (Si2 ) 0.0413 0.25 No. of Years of Education (Si3 ) 0.0356 1.217 Age (Si4 ) **** 0.0222 2.968 Civil Status (Si5 ) *** -0.2903 -2.256 Gender (Si6 ) **** 0.4799 3.281 Importance of Camping in Visiting MPNP (HI ) **** 0.6504 2.816 Index of Rating of Facilities in MPNP (RI ) 0.0038 1.115
Level of Significance: **** - significant at 99 percent confidence level *** - significant at 95 percent confidence level ** - significant at 90 percent confidence level * - significant at 85 percent confidence level
Estimated Equation: Vi = V (Ci, Si, Hi, Ri) + εi
d) Recommendations
The study recommends that entrance fees be increased to PhP125, with PhP25 going to the LGU and PhP100 to the PAMB. MPNP visitors are relatively well-off and have both the ability and willingness to pay for higher entrance fees. Moreover, entrance fees are a small part of their total budget when visiting MPNP. Thus, increasing entrance fees will not adversely affect decisions to visit the Park. The suggested improvements in Park management and services may merit serious consideration by the PAMB as visitors are willing to pay for these services.
e) Other Relevant Results Socio-Economic and Demographic Profile
• Most respondents were male, single and young, with average age of 28 years. • Average gross own income was PhP15,125 per month, while average gross
household income reaches PhP36,315 per month . • One-fourth were still enrolled in school, most of whom were in college. • For those who had graduated, most had college degrees mostly in engineering
and accounting while 10 percent with had post-graduate degrees. • For those employed, many were employees, followed by licensed professionals. • Most respondents (62 percent) are currently residing in Metro Manila, while 12
percent were from Benguet.

Developing Pro-Poor Markets for Environmental Services in the Philippines: FINAL REPORT
Resources, Environment and Economics Center for Studies (REECS), Inc. 16
• 88 percent of respondents belonged to one or more organizations mostly to sports-related groups and environmental groups.
Travel Profile
• 82.2 percent of respondents first heard about MPNP from their friends and/or
relatives. • Respondents were second-time visitors on the average, who had intentions of
going back at least twice within the next two years. • Ave. stay of visitor at the Park is three days, with one day for travel time. • Most came from residence (79.8 percent), traveling an average of 376 km using
bus and hired vehicles after a one-day layover at Baguio City. • Average number of people in a group is 15, most of which were friends.
Primary Reasons for Choosing MPNP
• Scenery • Climate • Challenge of climb
Most Cited Substitute Sites Mt. Banahaw, Quezon; Mt. Makulot, Batangas; Mt. Makiling; Mt. Fami, Laguna; Mt. Cristobal, Quezon
Activities Conducted at the Site, In Order of Frequency
Mountain climbing, Sightseeing, Camping, Photography, Picnicking, Research
Satisfaction Level with Services Excellent: Peace and quiet
Good: Access to the Park, Availability of water for drinking/ refill, Personal safety
Fair: Road/trail conditions, Cleanliness, Comfort Rooms, Camping Areas, Park amenities
Preferred Types of Development
• One third of respondents did not want any further development in the area • For those who preferred development, the following types were stated:
Comfort rooms, first aid stations, campsites, hikers' rest areas, signal stations, and better roads to rangers' station
Source: Padilla, JE and RMP Rosales, et. al. January 2000. Manual for the Implementation of the Fee System Guidelines in
Protected Areas. ENRAP IV Technical Paper. USAID and DENR, Philippines
Developing Pro-Poor Markets for Environmental Services in the Philippines: FINAL REPORT
Resources, Environment and Economics Center for Studies (REECS), Inc. 17
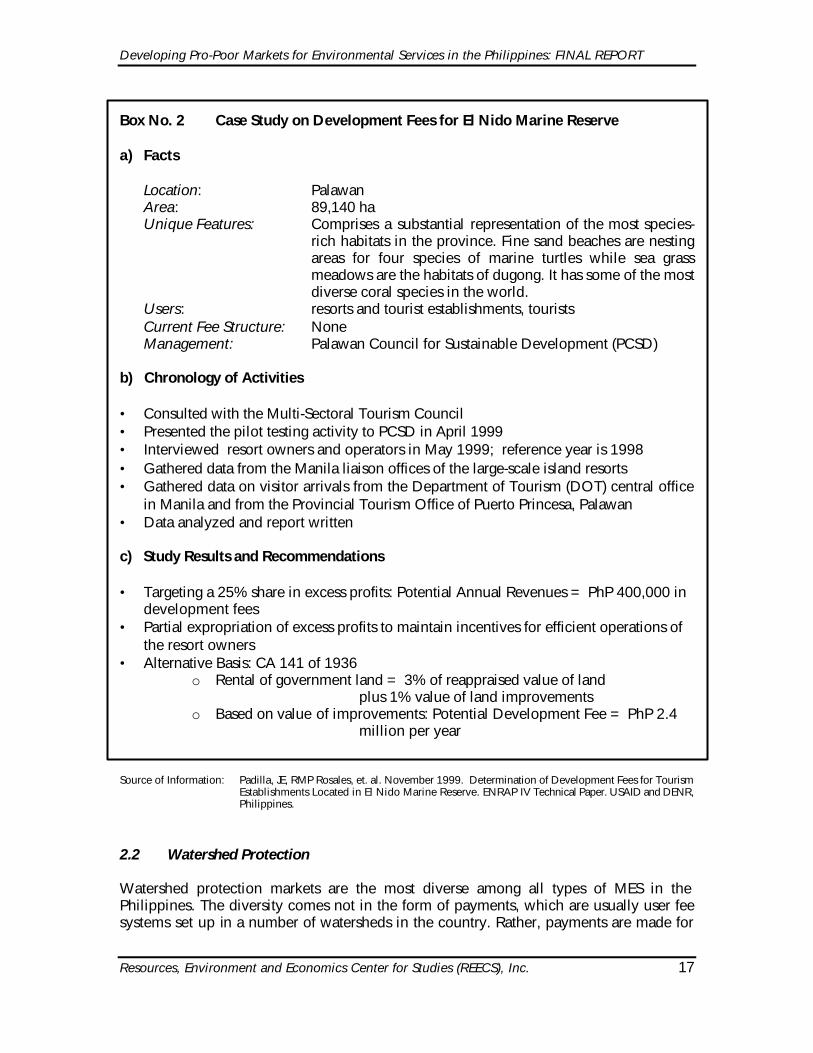
Box No. 2 Case Study on Development Fees for El Nido Marine Reserve a) Facts
Location: Palawan Area: 89,140 ha Unique Features: Comprises a substantial representation of the most species-
rich habitats in the province. Fine sand beaches are nesting areas for four species of marine turtles while sea grass meadows are the habitats of dugong. It has some of the most diverse coral species in the world.
Users: resorts and tourist establishments, tourists Current Fee Structure: None Management: Palawan Council for Sustainable Development (PCSD)
b) Chronology of Activities
• Consulted with the Multi-Sectoral Tourism Council • Presented the pilot testing activity to PCSD in April 1999 • Interviewed resort owners and operators in May 1999; reference year is 1998 • Gathered data from the Manila liaison offices of the large-scale island resorts • Gathered data on visitor arrivals from the Department of Tourism (DOT) central office
in Manila and from the Provincial Tourism Office of Puerto Princesa, Palawan • Data analyzed and report written c) Study Results and Recommendations • Targeting a 25% share in excess profits: Potential Annual Revenues = PhP 400,000 in
development fees • Partial expropriation of excess profits to maintain incentives for efficient operations of
the resort owners • Alternative Basis: CA 141 of 1936
o Rental of government land = 3% of reappraised value of land plus 1% value of land improvements o Based on value of improvements: Potential Development Fee = PhP 2.4 million per year
Source of Information: Padilla, JE, RMP Rosales, et. al. November 1999. Determination of Development Fees for Tourism
Establishments Located in El Nido Marine Reserve. ENRAP IV Technical Paper. USAID and DENR, Philippines.
2.2 Watershed Protection Watershed protection markets are the most diverse among all types of MES in the Philippines. The diversity comes not in the form of payments, which are usually user fee systems set up in a number of watersheds in the country. Rather, payments are made for
Developing Pro-Poor Markets for Environmental Services in the Philippines: FINAL REPORT
Resources, Environment and Economics Center for Studies (REECS), Inc. 18
varying uses within the watershed. Nevertheless, all these payment schemes were set up basically with watershed protection as the end goal. Fifteen studies related to the development of markets for watershed protection have been conducted (see Table 1). Among these, seven pertain to estimating values of the watershed relating to water quality, while two deal with erosion control functions of the watershed. Meanwhile, eight other studies relate to estimating values for the use of resources within the watershed. Although not directly measuring watershed protection as a service, these eight studies are included here because of the fact that the user fees form part of a Fund, i.e. the Integrated Protected Area Fund (IPAF), which is used for watershed protection activities by the management bodies involved (see Section III.A for a broader discussion of IPAF). Seven out of the fifteen studies are now under review by the respective PAMBs, for possibly setting up user fee systems. Three studies have led to the drafting of DENR Administrative Orders regulating the particular use through appropriate charges. Finally, one study has been translated into an ordinance issued by the concerned local government unit in raising revenues for watershed protection activities in the area.
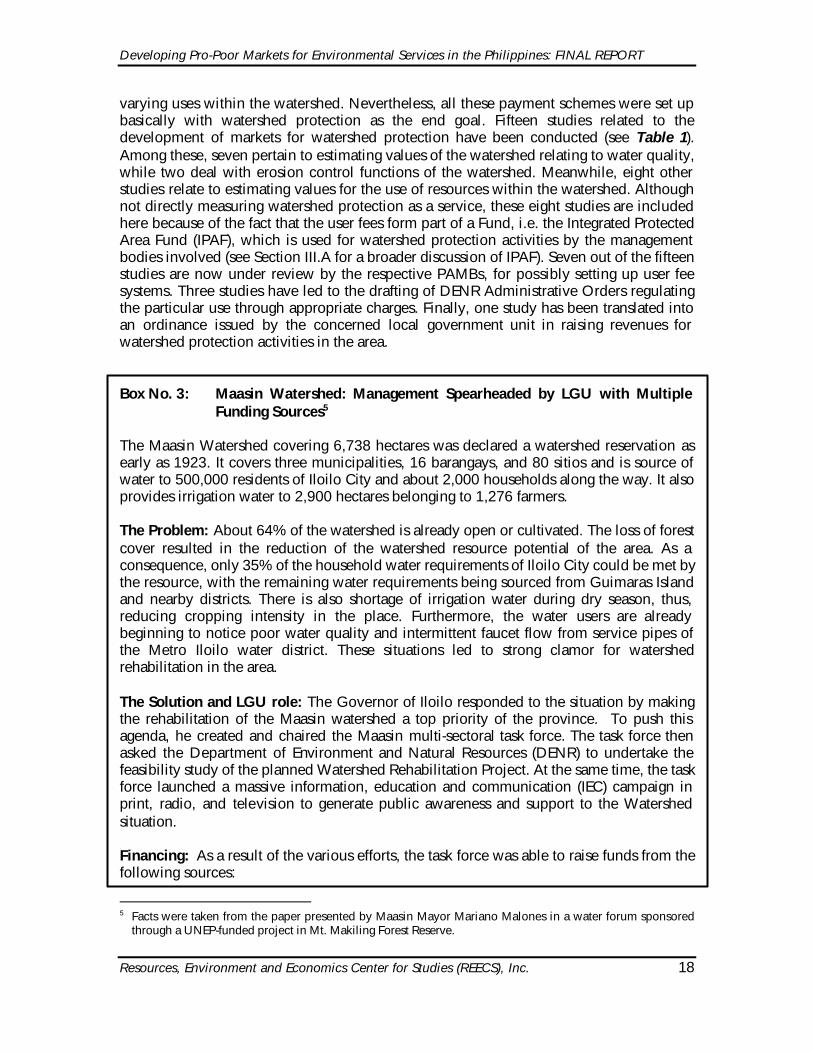
Box No. 3: Maasin Watershed: Management Spearheaded by LGU with Multiple
Funding Sources5 The Maasin Watershed covering 6,738 hectares was declared a watershed reservation as early as 1923. It covers three municipalities, 16 barangays, and 80 sitios and is source of water to 500,000 residents of Iloilo City and about 2,000 households along the way. It also provides irrigation water to 2,900 hectares belonging to 1,276 farmers. The Problem: About 64% of the watershed is already open or cultivated. The loss of forest cover resulted in the reduction of the watershed resource potential of the area. As a consequence, only 35% of the household water requirements of Iloilo City could be met by the resource, with the remaining water requirements being sourced from Guimaras Island and nearby districts. There is also shortage of irrigation water during dry season, thus, reducing cropping intensity in the place. Furthermore, the water users are already beginning to notice poor water quality and intermittent faucet flow from service pipes of the Metro Iloilo water district. These situations led to strong clamor for watershed rehabilitation in the area. The Solution and LGU role: The Governor of Iloilo responded to the situation by making the rehabilitation of the Maasin watershed a top priority of the province. To push this agenda, he created and chaired the Maasin multi-sectoral task force. The task force then asked the Department of Environment and Natural Resources (DENR) to undertake the feasibility study of the planned Watershed Rehabilitation Project. At the same time, the task force launched a massive information, education and communication (IEC) campaign in print, radio, and television to generate public awareness and support to the Watershed situation. Financing: As a result of the various efforts, the task force was able to raise funds from the following sources:
5 Facts were taken from the paper presented by Maasin Mayor Mariano Malones in a water forum sponsored
through a UNEP-funded project in Mt. Makiling Forest Reserve.
Developing Pro-Poor Markets for Environmental Services in the Philippines: FINAL REPORT
Resources, Environment and Economics Center for Studies (REECS), Inc. 19
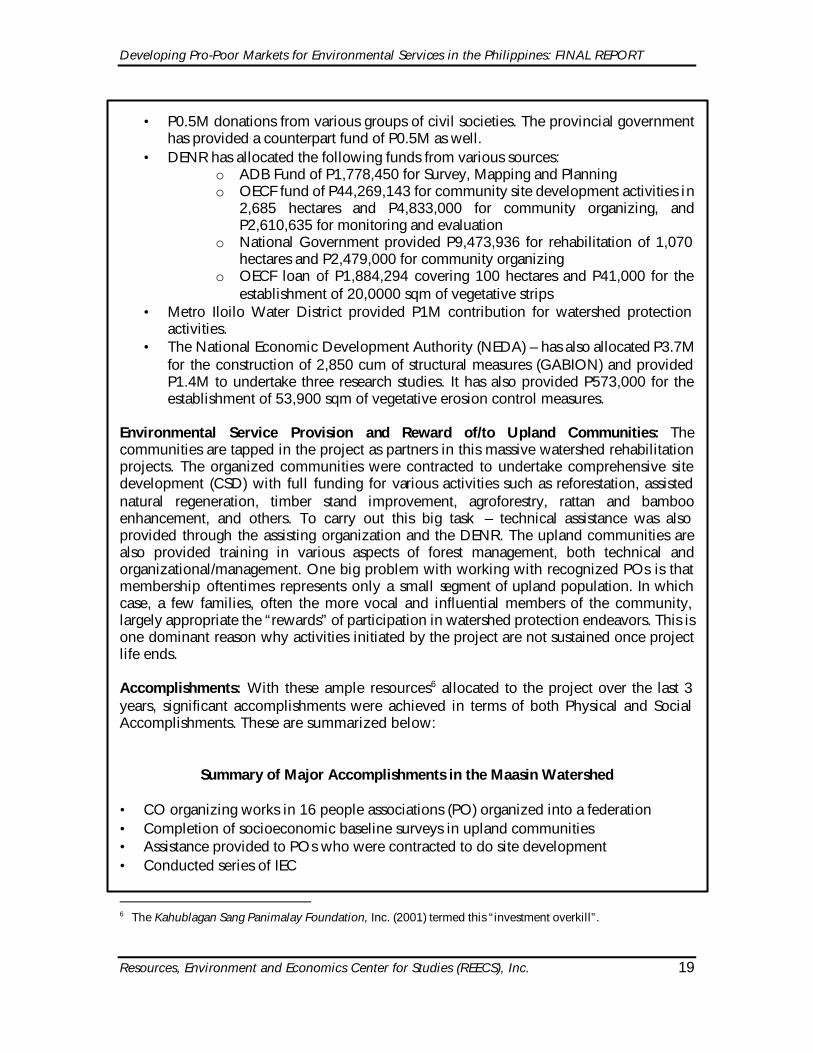
• P0.5M donations from various groups of civil societies. The provincial government
has provided a counterpart fund of P0.5M as well. • DENR has allocated the following funds from various sources:
o ADB Fund of P1,778,450 for Survey, Mapping and Planning o OECF fund of P44,269,143 for community site development activities in
2,685 hectares and P4,833,000 for community organizing, and P2,610,635 for monitoring and evaluation
o National Government provided P9,473,936 for rehabilitation of 1,070 hectares and P2,479,000 for community organizing
o OECF loan of P1,884,294 covering 100 hectares and P41,000 for the establishment of 20,0000 sqm of vegetative strips
• Metro Iloilo Water District provided P1M contribution for watershed protection activities.
• The National Economic Development Authority (NEDA) – has also allocated P3.7M for the construction of 2,850 cum of structural measures (GABION) and provided P1.4M to undertake three research studies. It has also provided P573,000 for the establishment of 53,900 sqm of vegetative erosion control measures.
Environmental Service Provision and Reward of/to Upland Communities: The communities are tapped in the project as partners in this massive watershed rehabilitation projects. The organized communities were contracted to undertake comprehensive site development (CSD) with full funding for various activities such as reforestation, assisted natural regeneration, timber stand improvement, agroforestry, rattan and bamboo enhancement, and others. To carry out this big task – technical assistance was also provided through the assisting organization and the DENR. The upland communities are also provided training in various aspects of forest management, both technical and organizational/management. One big problem with working with recognized POs is that membership oftentimes represents only a small segment of upland population. In which case, a few families, often the more vocal and influential members of the community, largely appropriate the “rewards” of participation in watershed protection endeavors. This is one dominant reason why activities initiated by the project are not sustained once project life ends. Accomplishments: With these ample resources6 allocated to the project over the last 3 years, significant accomplishments were achieved in terms of both Physical and Social Accomplishments. These are summarized below:
Summary of Major Accomplishments in the Maasin Watershed
• CO organizing works in 16 people associations (PO) organized into a federation • Completion of socioeconomic baseline surveys in upland communities • Assistance provided to POs who were contracted to do site development • Conducted series of IEC
6 The Kahublagan Sang Panimalay Foundation, Inc. (2001) termed this “investment overkill”.

Developing Pro-Poor Markets for Environmental Services in the Philippines: FINAL REPORT
Resources, Environment and Economics Center for Studies (REECS), Inc. 20
• Provided numerous training for team building, leadership, preparation of feasibility studies, and others
• Tenure security embodied in the community-based forest management agreement (CB4FMA)7 that allows 25 years of stewardship renewable for another 25 years.
• Assisted PO in establishment of 17 livelihood projects • Physical accomplishments of the OECF Loan as of December 1999 comprise of:
reforested 1,050 ha; agroforestry (749 out of 884 ha target); bamboo (249 ha) and riverbank stabilization (60 ha) and rattan (94 of the 111 ha target).
• The GOP funding accomplished the following: riverbank rehabilitation of 270 ha, agroforestry development in 300 ha, ANR in 300 ha, and vegetative measures in 20,000 sq.m
• The following protective infrastructures were also put in place: 85 km trails; 700 m fire lines; 77 units of nursery, look-out tower of 7 units, 14 Gabion, and 6 units of concrete dam.
Sustaining the gains: The efforts made under the CBRMP can be considered a success. The area’s old growth forest was protected and open cultivated areas were reduced significantly in exchange for various watershed protection initiatives mentioned earlier. There were also substantial investments in IEC, capacity building and training of project implementers – the people organizations, being the active players. The remaining concerns of the LGU is sustaining the watershed protection efforts through sustained IEC activities, successful livelihood activities and maintenance of people organizations’ commitment to what have been achieved this far. To this end, the Ford Foundation immediately responded with the funding of “Watersheds’ Learning Communities” in mid 1999 to 2001. This project basically adopts an IEC and networking approach to mobilize community participation in environmental protection projects within the watershed, including solid waste management. The project supported the school-on-air; “Ugat Sang Tubig” that was launched in 1998 has formed 70 barangay information centers. These centers become institutionalized in the local government and serve as venue for initiating community actions that benefit the environment – termed as “People’s Initiatives”. In these initiatives, the role of the youth, children and women are encouraged. Equally important is the success of the Project in facilitating the creation of the Iloilo Watershed Management Council through a Provincial Ordinance. This social infrastructure is very important in sustaining and operationalizing the watershed approach of managing forest resources in this important area – something that is really going to be a ‘learning experience’. Source: Francisco, HA. February 2002. Environmental Service “Payments”: Experiences, Constraints and Potential in the
Philppines. Developing Mechanisms for Rewarding the Upland Poor in Asia for the Environmental Services They Provide. Regional Inception/Planning Workshop. Puncak, Indonesia.
7 The release of this instrument suffered a major drawback when the local government unit did not endorse this
to the DENR – largely due to what they termed “limited understanding by LGU of the benefits and potentials of community-based forest management” and political differences. In spite of agreements among LGUs, the DENR has not yet released the tenure instrument causing major disappointment among the people (Kalublagan Sang Panimalay Foundation, Inc. 2001).
Developing Pro-Poor Markets for Environmental Services in the Philippines: FINAL REPORT
Resources, Environment and Economics Center for Studies (REECS), Inc. 21
Box No. 4: The Makiling Forest Reserve (MFR): Managed by the University of the Philippines
The Mt. Makiling Forest Reserve (MFR) is a 4,244-hectare forestland whose administration and management are vested in the University of the Philippines Los Baños (UPLB). It is an important resource because of its biological diversity, watershed, recreation, geo-thermal and scientific functions8. It is also a major source of livelihood to some 300 households living within the watershed and is being farmed by another 700 farmer-claimants who are residing outside of the watershed in adjoining communities. The Problem: There are reports of poor water quality in some areas and inadequate supply during the dry season. This was largely attributed to the relatively growing proportion of degraded lands in the MFR that require rehabilitation. There are also signs of continuing encroachment in the area, signifying inadequacy of monitoring and enforcement mechanisms due in part to inadequate resources allotted for resource protection and rehabilitation of the MFR. The Solution: The University has shifted the focus from punitive (eviction policy) in the late 1970s to open policy of partnership with communities in protection efforts in the 1990s. The 1980s was characterized by a period of inaction by the University, at which time, the people organizations, with assistance from a project funded by CIDA through the School of Environmental Science and Management (SESAM) and from some NGOs, have gained strength in number and organizational and bargaining skills. By the mid 1990s, there was a renewed concern by the University, specifically, the College of Forestry and Natural Resources (CFNR) for improved management of MFR. Towards this end, it has developed the Master Plan for the MFR area, which was signed as Executive Order by the President of the Philippines in 1996. One of the key elements of this Plan is the issuance of accreditation system to formally recognize the bona fide residents of the area through some form of tenure in exchange for the people’s commitment to conserve and protect the forest.9 The Master Plan also puts strong emphasis in the involvement of various stakeholders in MFR management. It has also identified several projects for the maintenance of biodiversity in the area and the rehabilitation of the degraded areas, as well as the continuing promotion of sustainable farming practices in the uplands. The major constraint the University faces is the inadequacy of funds to generate the resources it needs to support the various programs and initiatives embodied in the Plan. Environmental Service Provision by Upland Communities: In the 1990s, the upland communities in MFR have begun to demonstrate their eagerness to be considered as a key player in issues concerning MFR. This interest has resulted largely from the community organizing (CO) efforts made by certain NGO and through the University Project in the community early part of the 1990s. For instance, the upland farmers through the people
8 The basic function of MFR is as a social and experimental laboratory for the University; hence, its control was
placed under UPLB. 9 Not much success on this instrument has been achieved, however, because of resistance of certain people
organizations (POs) to acknowledge the authority of the University in the MFR. The community organizing efforts have succeeded in dividing POs into two groups: the more vocal –“anti” University who has been taught of the power of an organized group in getting what they want – and the other, more pro-institution, but less vocal group who are willing to cooperate with the University’s Programs in MFR.
Developing Pro-Poor Markets for Environmental Services in the Philippines: FINAL REPORT
Resources, Environment and Economics Center for Studies (REECS), Inc. 22
organizations (POs) have collaborated with the University in boundary delineation efforts that entail the planting of tree species along MFR boundary. They also helped put signs that mark the area as a protected zone. Some of the farmers also participate in reforestation activities, funded through the University, largely as labor. They have also been involved in protecting the water sources of the area in exchange for the pump donated to the community by an NGO. Most importantly, majority of the upland farmers are adopting agroforestry systems in their occupied areas. In addition, the POs themselves have made a commitment to prevent entrants into the place and also to prevent further expansion by members into the remaining forest zones. There were cases of apprehensions and cases filed in court from these efforts though one traveling to the site can still easily spot new land clearings and additional houses being built along the forest boundary. Prior to the 1990s, the involvement of the upland farmers were limited to their engagement as hired workers in some reforestation activities by the University. Environmental ‘Payments’ or Rewards to Upland Communities: In return for the cooperation of the upland communities in forest protection, the University has provided various forms of rewards to the upland communities. A few years back, it has offered to accredit bona fide farmers through some form of memorandum of understanding between the farmer and the University. However, some of the more active vocal farmer-groups want a more secure tenure than this arrangement; something that the University felt it is in no position to provide. Since, there is no consensus on this aspect among the POs, the efforts by the University to push this was put to a halt. The POs who participated in forest boundary delineation were given some cash incentives for the services they rendered. Those who participate in reforestation efforts were also paid for their labor. The University has also sponsored a number of training on sustainable land uses and practices and also on livelihood development. There are also limited scholarship supports to high school students in the University’s efforts to provide the young people better employment opportunities. Lately, the University has also given the upland farmers medical discounts for the use of the University Infirmary. It has also provided skills-training to those who can be employed in the resorts in the Los Baños-Calamba area, as a commitment made by these resort operators as a form of their in-king contribution or ‘payment’ for watershed protection services of the upland communities. Some business sectors have also sponsored reforestation/tree-planting projects, which were contracted to the PO. There was also an NGO, which provided a water pump in return for the POs efforts to protect the water sources. Currently, there is no payment made to the farmers who are adopting agro-forestry systems and other sustainable practices and this situation is likely to remain. There is an un-written understanding that upland farmers may cultivate the land in MFR, in exchange for the environmental services that they provide. In a way, the environmental service becomes a ‘payment’ by the farmers for their continued use of the land resource or vice-versa, the use of the land becomes the ‘payment’ by society for the environmental service – akin to a barter transaction. Potential for ESP Payments (RUPES): To address the concern regarding inadequacy of funds required to implement the projects embodied in the MFR Master Plan and at the same time, to effect the desired attitude towards the use of environment and natural resources in the area and in the downstream communities, the University has initiated
Developing Pro-Poor Markets for Environmental Services in the Philippines: FINAL REPORT
Resources, Environment and Economics Center for Studies (REECS), Inc. 23
efforts to use Economic Instruments for MFR resources10. The development of economic instruments, particularly, watershed protection fee to be imposed to water users (industrial and household), recreationists, and other off-site beneficiaries of watershed protection was studied. Various public consultations and meetings with concerned agencies were held and a decision was reached that there is a need for a multi-sectoral group to be formed to managed the Fund into which the revenues from the watershed protection fees would be deposited. The major bottleneck to this effort of imposing a watershed protection fee is the legal basis of such a collection. Though the University has claimed that it has the legal authority to do so by virtue of the Republic Act 6967 that vests control over MFR to the University, which was supplemented by Executive Order 349 that approves the MFR Master Plan, it is not clear if these bases will hold water on the legal court. It was nonetheless established that there seem to be a general acceptance of the principle that “beneficiaries of the forest should contribute financially to efforts of managing the resource” among the different stakeholders. Still, the legality of such a collection by the University needs to be resolved. Alternative possibilities under discussions are collaboration with the National Water Resources Board or the Local Government Unit (LGU). Discussions on this matter points to the strength of the Local Government Code (see Summary of Major Accomplishments in the Maasin Watershed in Box 2) as the best alternative to impose the fee. The recent experience in the Maasin watershed sets a precedent that may be adopted by other LGUs. The only complication is that the reliance by the University on the LGU would mean the transfer (or sharing) of control of MFR management to the LGU. There is still a general apprehension in certain sectors of the University that bringing in LGU into the picture may jeopardize the function of MFR as social laboratory. This is especially so since some LGUs have already expressed the desire to gain control over the resource, knowing its huge revenue potential. Some of their constituents are also residents of the MFR, and therefore it will give them political mileage to have the controlling force over the resource. Where the situation will end – is anybody’s guess but is something that can be influenced after careful design of the strategy that the University must take. To this end, the MFR seems to offer a good potential for RUPES application in the Philippines since some initiatives have already been made towards this direction. Source: Francisco, HA. February 2002. Environmental Service “Payments”: Experiences, Constraints and Potential in the
Philppines. Developing Mechanisms for Rewarding the Upland Poor in Asia for the Environmental Services They Provide. Regional Inception/Planning Workshop. Puncak, Indonesia.
2.3 Biodiversity Conservation Biodiversity conservation markets in the Philippines are still at infancy stage. So far, there have only been two studies in this field. The first attempts to measure the economic implications of biodiversity preservation in a particular forest in the country. The second study was translated into a draft administrative order that regulates bioprospecting activities in the Philippines. In particular, it prescribes a scheme whereby benefits from bioprospecting are shared among the various stakeholders involved. The administrative
10 This activity was funded by UNEP in collaboration with the Resources, Environment and Economics Center
for Studies, Inc. (REECs) in 1998 to 2000.
Developing Pro-Poor Markets for Environmental Services in the Philippines: FINAL REPORT
Resources, Environment and Economics Center for Studies (REECS), Inc. 24
order has yet to be signed officially, and is still being harmonized with the newly passed Wildlife Act11 which contains provisions on commercial bioprospecting.
Box No. 5 Guidelines in the Collection and Monitoring of the Prospecting of
Biological and Genetic Materials and Prescribing the Royalties, and Benefit-Sharing Scheme Thereto.
Pursuant to the provisions of Executive Order No. 247 (Bioprospecting Law) and R.A. 9147 (Wildlife Act), this document provides the guidelines in the determination of bioprospecting fees and rehabilitation/performance bond, the payment/transfer of royalties and benefit-sharing, the collection of biological and genetic materials, and the standard monitoring scheme for use by the Inter-Agency on the Collection of Biological and Genetic Resources (IACBGR). The relevant provisions relating to bioprospecting fees are as follows:
Section 7. Determination of the Bioprospecting Fee through Negotiation - The IACBGR shall negotiate bioprospecting fees to be charged for an area, whether marine or terrestrial, applied for under E.O. 247 at the initial review and evaluation of the commercial research proposal, taking into consideration, among others, the following: a) The nature of the applicant, whether individual or corporation; b) The diversity of biological resources in the area of collection; c) The budget of the research; d) The quantity of specimen to be collected; e) The nature of the specimen to be collected; f) The method of collection; and, g) The duration of the collection phase. Section 8. Bioprospecting fee – As a guideline, the minimum bioprospecting fee shall be set at such amount specified under this section, or computed on a per unit area basis provided herein, whichever is higher. Subject to the foregoing, the minimum bioprospecting fee shall be US$3,000.00 or US$ 3.00 per hectare of area over which the applicant shall have commercial bioprospecting rights. Should the applicant desire to have sole commercial bioprospecting rights in a specific area, the minimum bioprospecting fee shall be US$ 5,000 or US$5.00 per hectare. Section 9. Rehabilitation/Performance Bond - The applicant shall post a rehabilitation / performance bond in an amount equivalent to twenty- five (25%) of the negotiated bioprospecting fee.
11 Republic Act No. 9147. July 2001.”An Act Providing for the Conservation and Protection of Wildlife
Resources and their Habitats, Appropriating Funds therefore and for Other Purposes.
Developing Pro-Poor Markets for Environmental Services in the Philippines: FINAL REPORT
Resources, Environment and Economics Center for Studies (REECS), Inc. 25
Benefits from bioprospecting that are to be shared with local stakeholders are as follows: Section 16. Fees and Royalties - Subject to the rules on prior informed consent from the concerned local community, and where applicable, from the concerned Protected Area Management Board and Indigenous Peoples, any CRA holder shall pay to the foregoing the following milestone payments: a. Annual User’s Fee – Upon signing of the research agreement, the CRA hold shall pay the amount of One Hundred US Dollars ($100) for every hectare under its use for sourcing genetic materials each year during the term of the CRA. However, if the area covered shall be for the exclusive bioprospecting use barring other commercial researchers of whatever purpose, the CRA-holder shall pay the amount of $1,000 annually for every hectare under its exclusive access. b. Patent Application Payment. – Upon filing of and for each application for patent for any product derived from or by reason of any biological or genetic resources from any area under the research agreement, the CRA holder shall pay the amount of Fifteen Thousand US Dollars ($15,000). This shall include applications filed in the Philippines or in any other country and regardless of whether such shall fall within the exclusive bioprospecting period or beyond. Provided that any Filipino individual or local organization shall pay the amount of only One Thousand Five Hundred US Dollars, while local SMEs and local non-profit organizations shall pay an amount of only One Hundred Fifty US Dollars $150 for each application for patent. c. Patent Processing Payment – During the pendency of each patent application, the CRA holder shall pay the amount of One Hundred Thousand US Dollars ($100,000) every year until patent is approved, with the remaining balance from $485,000 to be settled upon patent approval. Payments of $100,000 will commence a year after the patent application is filed. If payments for this milestone exceed $485,000, the difference will not be refunded to the CRA holder. If, at any point in time thereafter, the CRA holder decides to discontinue the patent application, then the payment of $100,000 every year shall cease. Any amount paid prior to the discontinuation of the patent application shall be non-refundable. Provided during the pendency of each patent application, any Filipino individual or local organization applicant shall pay only the non-refundable amount of Ten Thousand US Dollars $10,000 every year until the approval of the patent, with the remaining balance from $48,500 to be settled upon patent approval. Provided further that for local SMEs and local non-profit organizations, during the pendency of each patent application, they shall only pay the non-refundable amount of $1,000 every year until the approval of the patent, with the remaining balance from $4,850 to be settled upon patent approval. d. Royalties - The amount of One percent (1%) of Gross Sales earned from the product by the CRA holder, parent company, or subsidiary, throughout the duration of the patent, in the event of any commercial use shall be paid. All earlier payments referred to in the

Developing Pro-Poor Markets for Environmental Services in the Philippines: FINAL REPORT
Resources, Environment and Economics Center for Studies (REECS), Inc. 26
preceding section shall be credited against the computed royalties determined in this Section to each appropriate stakeholder group. Section 18. Forms of Payment. - Payments may be made in cash or in kind. The CRA holder may enter into special written agreements with the concerned stakeholder for the payment of the latter’s share in non-monetary forms. However, for this purpose, the amount to be credited against royalties and fees due from the CRA holder shall be limited to the proportionate share of the actual recipient-payee. The in-kind payments may be given earlier but not later than the period specified for each milestone payment in the preceding Article. Section 19. Forms of In-kind Payments. - In-kind payments may include: a) Equipment for inventory and monitoring b) Supplies and equipment for resource conservation activities c) Technology transfer d) Formal training including educational facilities e) Infrastructure directly related to the management of the area f) Health care Section 20. Valuation of In-kind Payments. The proper valuation for in-kind payments shall be upon the prior approval of the IACBGR and the recipients. Valuation of in-kind payments shall be based on: a) acquisition cost of equipment/ infrastructure/ supplies b) cost of training for formal training c) cost of training in host country of trainer in case of technology transfer d) actual costs incurred (labor, infrastructure, IEC materials and similar expenses) for
conservation and protection activities
Other non-monetary benefits such as sharing and transfer of knowledge, capacity building, support for conservation, and in-situ development are likewise recognized within the Administrative Order. Source: Agsaoay, E., I. Ambal, E. Araral, M.S.delos Angeles, P. Ong, J.E. Padilla and R.M.P. Rosales. 2002.
Draft DENR Administrative Order. Benefit Sharing Schemes in the Implementation of EO 247 otherwise know as “Prescribing Guidelines and Establishing a Regulatory Framework for the Prospecting of Biological and Genetic Resources, Their By-Products and Derivatives, For Scientific and Commercial Purposes, and for Other Purposes. Unpublished.
2.4 Carbon Sequestration Despite the fact that carbon sequestration is a widely recognized environmental service where developing countries have a comparative advantage in, markets therefore have yet to take off in the Philippines. There have been three studies documented, all of which attempt to estimate the carbon uptake of forests in the country. The first study was done for the Samar Forest Reserve, and the second for the Angat River Watershed. The results of the study for the Samar Forest Reserve were used to compute for the net present values of the various management options being considered by the government. The third study is a paper lifted from a dissertation on the economics of land use options, one component of
Developing Pro-Poor Markets for Environmental Services in the Philippines: FINAL REPORT
Resources, Environment and Economics Center for Studies (REECS), Inc. 27
which is estimating carbon sequestration functions of agroforestry activities. The paper is currently being presented in various international fora and is part of the ongoing work of the World Agroforestry Center (WAC). 2.5 Environmental Waste Disposal Services As mentioned earlier, this type of service refers to the use of the natural environment as a sink for human and industrial wastes. Seven studies have estimated the value of this service in chosen sites, which were eventually used for inclusion of the environment and natural resources in national income accounts. All seven studies were part of the USAID-funded project entitled Environmental and Natural Accounting Project (ENRAP), which was implemented between 1991 to 2000. The framework for an environmental user fee system for wastewater discharges into river systems is still being processed by the DENR for possible national implementation. The revenues derived would eventually be used for river rehabilitation programs of the DENR.
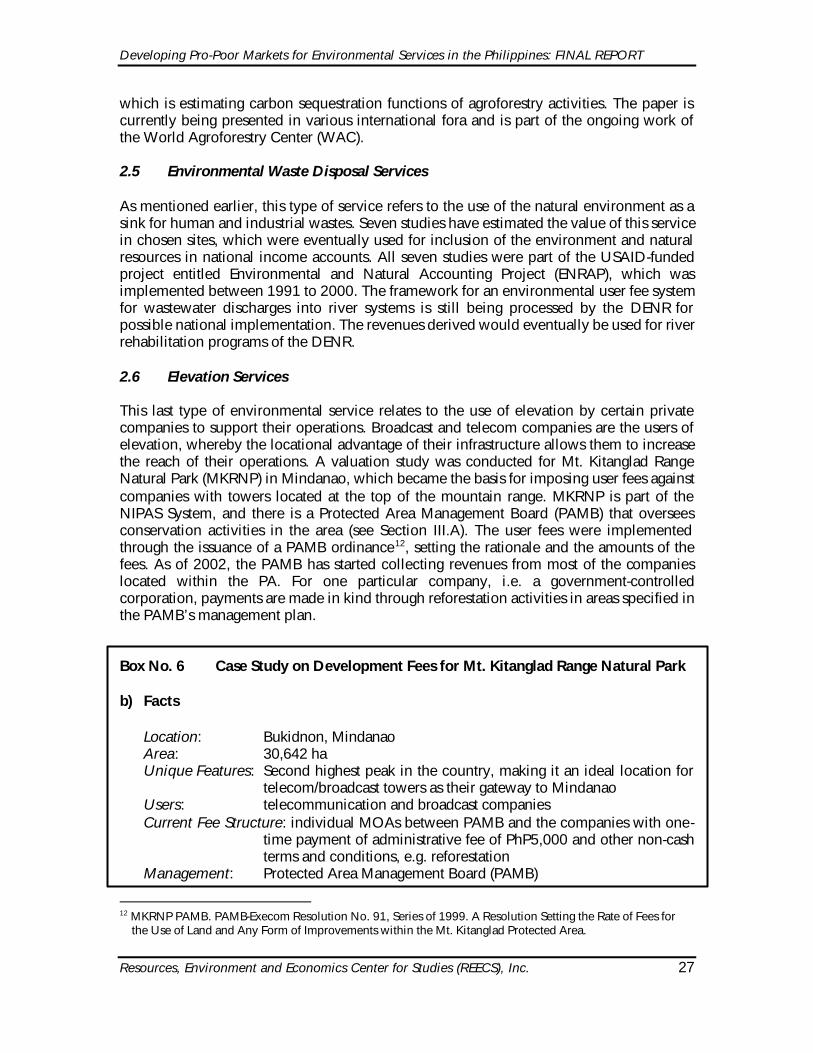
2.6 Elevation Services
This last type of environmental service relates to the use of elevation by certain private companies to support their operations. Broadcast and telecom companies are the users of elevation, whereby the locational advantage of their infrastructure allows them to increase the reach of their operations. A valuation study was conducted for Mt. Kitanglad Range Natural Park (MKRNP) in Mindanao, which became the basis for imposing user fees against companies with towers located at the top of the mountain range. MKRNP is part of the NIPAS System, and there is a Protected Area Management Board (PAMB) that oversees conservation activities in the area (see Section III.A). The user fees were implemented through the issuance of a PAMB ordinance12, setting the rationale and the amounts of the fees. As of 2002, the PAMB has started collecting revenues from most of the companies located within the PA. For one particular company, i.e. a government-controlled corporation, payments are made in kind through reforestation activities in areas specified in the PAMB’s management plan. Box No. 6 Case Study on Development Fees for Mt. Kitanglad Range Natural Park b) Facts
Location: Bukidnon, Mindanao Area: 30,642 ha Unique Features: Second highest peak in the country, making it an ideal location for
telecom/broadcast towers as their gateway to Mindanao Users: telecommunication and broadcast companies Current Fee Structure: individual MOAs between PAMB and the companies with one-
time payment of administrative fee of PhP5,000 and other non-cash terms and conditions, e.g. reforestation
Management: Protected Area Management Board (PAMB)
12 MKRNP PAMB. PAMB-Execom Resolution No. 91, Series of 1999. A Resolution Setting the Rate of Fees for
the Use of Land and Any Form of Improvements within the Mt. Kitanglad Protected Area.
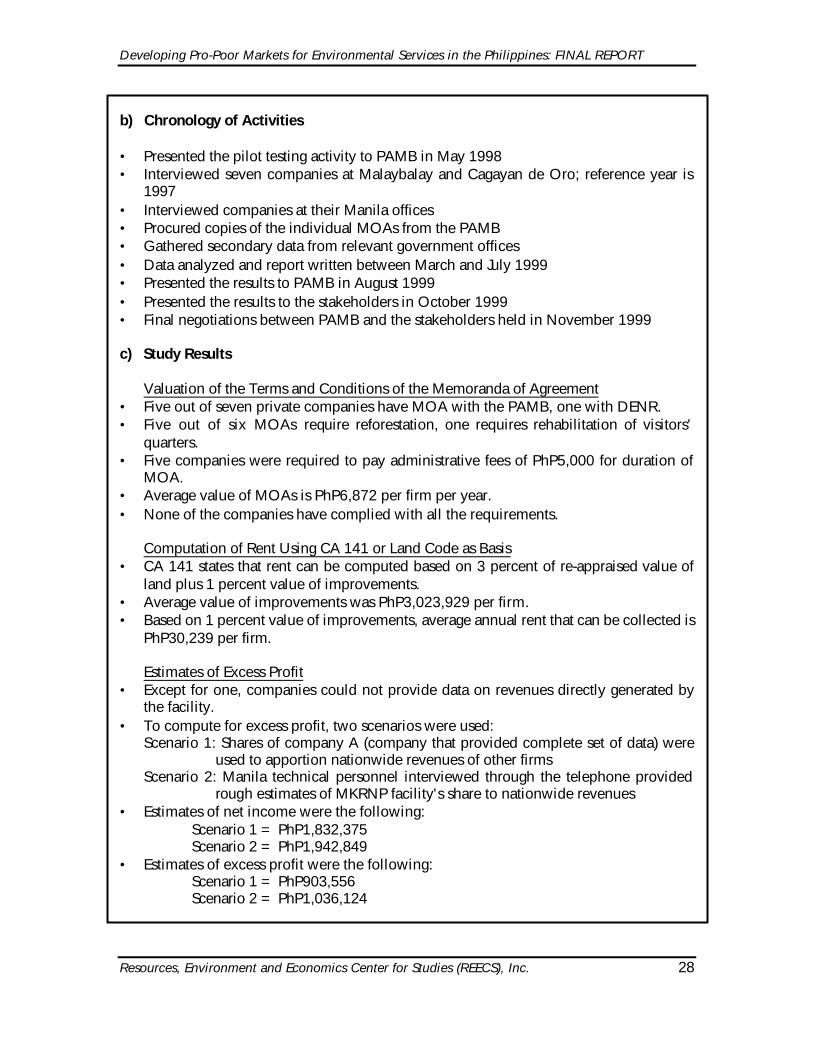
Developing Pro-Poor Markets for Environmental Services in the Philippines: FINAL REPORT
Resources, Environment and Economics Center for Studies (REECS), Inc. 28
b) Chronology of Activities
• Presented the pilot testing activity to PAMB in May 1998 • Interviewed seven companies at Malaybalay and Cagayan de Oro; reference year is
1997 • Interviewed companies at their Manila offices • Procured copies of the individual MOAs from the PAMB • Gathered secondary data from relevant government offices • Data analyzed and report written between March and July 1999 • Presented the results to PAMB in August 1999 • Presented the results to the stakeholders in October 1999 • Final negotiations between PAMB and the stakeholders held in November 1999 c) Study Results
Valuation of the Terms and Conditions of the Memoranda of Agreement
• Five out of seven private companies have MOA with the PAMB, one with DENR. • Five out of six MOAs require reforestation, one requires rehabilitation of visitors'
quarters. • Five companies were required to pay administrative fees of PhP5,000 for duration of
MOA. • Average value of MOAs is PhP6,872 per firm per year. • None of the companies have complied with all the requirements.
Computation of Rent Using CA 141 or Land Code as Basis
• CA 141 states that rent can be computed based on 3 percent of re-appraised value of land plus 1 percent value of improvements.
• Average value of improvements was PhP3,023,929 per firm. • Based on 1 percent value of improvements, average annual rent that can be collected is
PhP30,239 per firm. Estimates of Excess Profit
• Except for one, companies could not provide data on revenues directly generated by the facility.
• To compute for excess profit, two scenarios were used: Scenario 1: Shares of company A (company that provided complete set of data) were
used to apportion nationwide revenues of other firms Scenario 2: Manila technical personnel interviewed through the telephone provided
rough estimates of MKRNP facility's share to nationwide revenues • Estimates of net income were the following:
Scenario 1 = PhP1,832,375 Scenario 2 = PhP1,942,849
• Estimates of excess profit were the following: Scenario 1 = PhP903,556 Scenario 2 = PhP1,036,124

Developing Pro-Poor Markets for Environmental Services in the Philippines: FINAL REPORT
Resources, Environment and Economics Center for Studies (REECS), Inc. 29
d) Recommendations
• MOA contributions at PhP6,872 per firm are minimal. • PAMB can charge at least PhP30,239 per firm per year based on CA 141, or PhP90,356
per firm per year based on 10 percent of excess profit. • Foregone revenues amount to:
- PhP23,367 to PhP83,483 per firm per year - PhP116,836 to PhP417,417 per firm for duration of MOA - PhP701,014 to PhP2,504,503 for all firms for duration of MOAs
Source: Padilla, JE and RMP Rosales, et. al. January 2000. Manual for the Implementation of the Fee System Guidelines in
Protected Areas. ENRAP IV Technical Paper. USAID and DENR, Philippines

Developing Pro-Poor Markets for Environmental Services in the Philippines: FINAL REPORT
Resources, Environment and Economics Center for Studies (REECS), Inc. 30
3. INSTITUTIONAL SUPPORT MECHANISMS FOR ENVIRONMENTAL SERVICE MARKETS – CURRENT ISSUES AND PROBLEMS
While existing markets for environmental services in the Philippines are not widespread and largely nascent affairs, a number of preliminary lessons may be highlighted relating to the necessary institutional backdrop for these markets. Government involvement has been key in most existing cases. There are more or less two types of markets: the first is made up of arrangements that were created through national government policy or initiative, while the second type involves local government efforts. These are not markets in the widely understood sense of the word, because private property rights have not been established, and government is still at the helm of the “market exchange” (see section I.A). Nevertheless, it is through the establishment of economic instruments, in which government influences supply and demand through the pricing mechanism, whereby such quasi markets for environmental services come into being. This is further illustrated in the discussion on Protected Area Management Boards (PAMBs) below. There is, however, a third type of market which is evolving in the country. These are less dependent on government intervention and more rooted in community-based management of protected areas. One case study is examined in this report: that of a local organization that has managed its watershed, particularly its natural springs and forest lands, for decades, long before environmental issues came to fore (details are contained in the second case study of this section). In what follows, we examine in more detail examples of two types of markets. We look first at the national government’s system of integrated protected areas, which includes the Integrated Protected Area Fund (IPAF), and how this works as a centralized system for channeling payments for environmental services to providers. Then we consider community-based efforts to set up payment systems at the local level, focusing in on the particular case of watershed protection financing in Balian, Laguna. For both case studies, outlined are the stakeholders involved in the provision of the relevant environmental service/s. Also mentioned is the policy and legal framework which helped create the market in question. Finally, the institutional mechanisms developed to support the relevant initiatives will be discussed, including some lessons learned on how such mechanisms affect the development of markets for environmental services.
3.1 National Integrated Protected Areas System (NIPAS) 3.1.1 NIPAS Act In 1992, the Philippine Congress enacted Republic Act No. 7586 establishing the National Integrated Protected Areas System (NIPAS) for the Philippines. The NIPAS law mandates the creation of protected areas to conserve biodiversity. It further provides the basic framework for the conservation and management of protected areas in general. One of the features of the Act is the establishment of an Integrated Protected Area Fund (IPAF) to finance projects of the system. All funds generated from the protected areas shall accrue to the IPAF, 75% of which will be retained by the area where the funds were generated, and 25% going to a central IPAF to finance other non-revenue generating PAs and the operations of the IPAF Governing Board. Figure 1 illustrates how funds flow through the IPAF to and from the protected areas (PAs) under the NIPAS system.
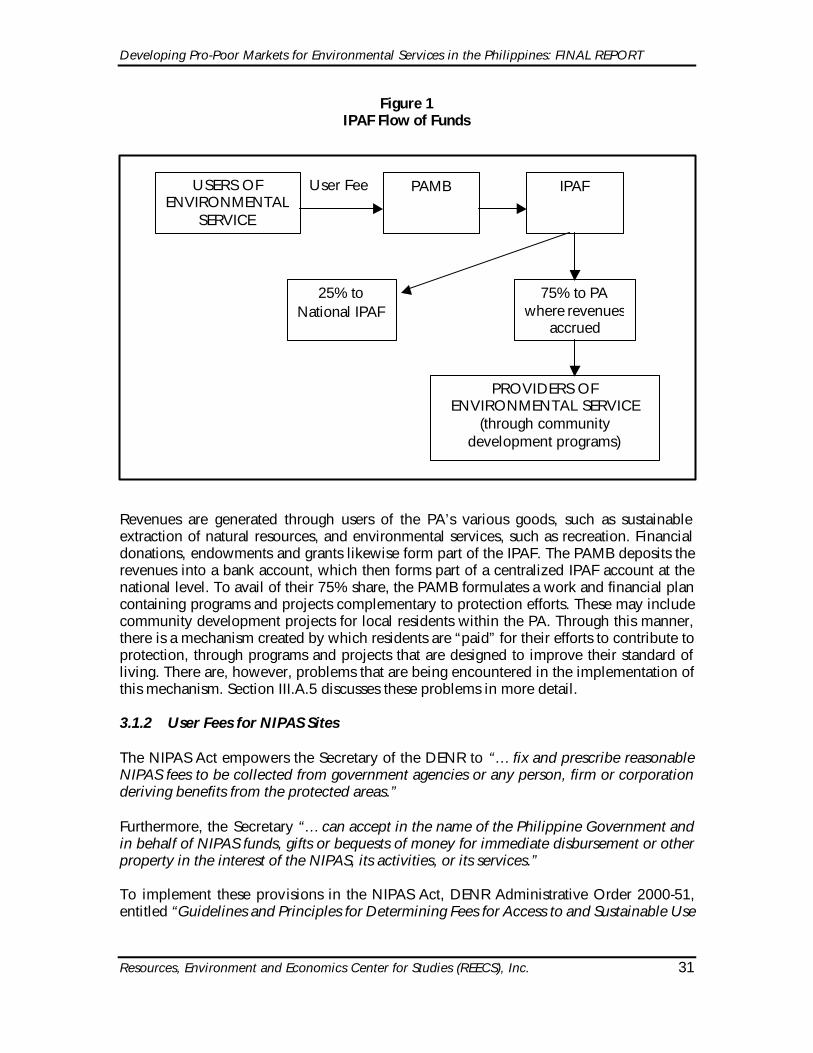
Developing Pro-Poor Markets for Environmental Services in the Philippines: FINAL REPORT
Resources, Environment and Economics Center for Studies (REECS), Inc. 31
Figure 1 IPAF Flow of Funds
Revenues are generated through users of the PA’s various goods, such as sustainable extraction of natural resources, and environmental services, such as recreation. Financial donations, endowments and grants likewise form part of the IPAF. The PAMB deposits the revenues into a bank account, which then forms part of a centralized IPAF account at the national level. To avail of their 75% share, the PAMB formulates a work and financial plan containing programs and projects complementary to protection efforts. These may include community development projects for local residents within the PA. Through this manner, there is a mechanism created by which residents are “paid” for their efforts to contribute to protection, through programs and projects that are designed to improve their standard of living. There are, however, problems that are being encountered in the implementation of this mechanism. Section III.A.5 discusses these problems in more detail. 3.1.2 User Fees for NIPAS Sites The NIPAS Act empowers the Secretary of the DENR to “… fix and prescribe reasonable NIPAS fees to be collected from government agencies or any person, firm or corporation deriving benefits from the protected areas.” Furthermore, the Secretary “… can accept in the name of the Philippine Government and in behalf of NIPAS funds, gifts or bequests of money for immediate disbursement or other property in the interest of the NIPAS, its activities, or its services.” To implement these provisions in the NIPAS Act, DENR Administrative Order 2000-51, entitled “Guidelines and Principles for Determining Fees for Access to and Sustainable Use
USERS OF ENVIRONMENTAL
SERVICE
User Fee PAMB IPAF
25% to National IPAF
75% to PA where revenues
accrued
PROVIDERS OF ENVIRONMENTAL SERVICE
(through community development programs)
Developing Pro-Poor Markets for Environmental Services in the Philippines: FINAL REPORT
Resources, Environment and Economics Center for Studies (REECS), Inc. 32
of Resources in Protected Areas” was formulated (Appendix A). The guidelines were based on a review of the current uses and users of resources in protected areas based on available information from the Protected Area Profiles and from the Protected Areas and Wildlife Bureau (PAWB). The identified types of fees also followed from the same review. As shown in the literature review, there have been a number of these NIPAS sites that have had the benefit of Willingness To Pay (WTP) studies as bases for their respective user fee systems. Out of the total number of PAs, there have been around 17 studies for estimating the recreational value of various tourist spots. These have been put into law through the passage of resolutions by the respective management boards, and around 10 are already collecting the fees from tourists. For other types of environmental services, there have been a number of national parks that are likewise collecting some form of user fee, many of which have had the benefit of economic surveys, as listed in Table 1. There are, however, a number of PAs that are charging various user fees but are not based on economic studies. Nevertheless, there is some form of monetary payment being done for whatever environmental service the fee is charged for. 3.1.3 Protected Area Management Boards (PAMBs) The NIPAS Act further created Protected Area Management Boards (PAMBs) for each site. The composition of the PAMB includes the DENR, the local government unit/s concerned, indigenous peoples’ groups (where relevant), and representatives from concerned NGOs and local community organizations. Out of the 209 presidentially proclaimed PAs and 182 additional proposed PAs (by the DENR), 88 have been included under the NIPAS System (see Table 2a). All the rest are still being processed for inclusion under NIPAS (see Table 2b). Furthermore, out of the total proclaimed and proposed PAs, 140 have established their PAMBs. Note that there are some areas with existing PAMBs despite the fact that they have not yet been proclaimed under NIPAS due to pending legal and technical requirements13. In sum, around 36% of existing and proposed PAs have established their PAMBs to date. The Protected Area and Wildlife Bureau (PAWB) is tasked to coordinate and monitor the activities of each PAMB.
13 Source: Protected Areas and Wildlife Bureau (Biodiversity Division), DENR. December 2002.

Developing Pro-Poor Markets for Environmental Services in the Philippines: FINAL REPORT
Resources, Environment and Economics Center for Studies (REECS), Inc. 33
Table 2a Protected Areas Proclaimed Under NIPAS
Area and PAMB Structure by Region and Protected Area As of December 2002
PAMB Structure
Region Protected Area Area
(in has.) Govt Non-Govt Total
CAR Upper Agno River Basin Resource Reserve
77,561.00
32 2 34
1 Lidlidda PL 2,266.49 9 4 13 Agoo-Damortis PLS 10,513.30 26 2 28 Libunao PL 46.70 4 3 7 Bigbiga PL 135.71 5 3 8 Sta. Lucia PL 174.16 7 6 13 Bessang Pass Natural Monument/
Landmark 693.32 No rec
2 Peñablanca PL 4,136.00 16 1 17 Magapit PL 3,403.62 10 2 12 Casecnan PL 88,846.80 No rec Batanes PL 213,578.00 47 8 55 Northern Sierra Madre Natural Park 359,486.00 14 23 37 Salinas Natural Monument 6,675.56 No rec Palaui Island Marine Reserve 7,415.48 No rec 3 Roosevelt PL 786.04 Expired Masinloc and Oyon Bays Marine
Reserve 7,568.00 13 3 16
4A Taal Volcano PL 62,292.14 23 4 27
Simbahan-Talagas PL 1,157.44 6 2 8 Amro River PL 6,471.08 8 3 11 Dinadiawan River PL 3,371.33 None Talaytay PL 3,526.29 9 4 13 Buenavista PL 284.27 None Maulawin Spring PL 149.01 No rec Pamitinan PL 600.00 No rec Hinulugang Taktak PL 3.20 None
4B Puerto Princesa Subterranean River Natural Park
22,202.00 No rec
Mt. Guiting-Guiting Natural Park 15,265.48 No rec Apo Reef Natural Park 15,792.00 No rec El Nido Managed Resource PA 89,134.76 17 7 24 Mt.Calavite Wildlife Sanctuary 18,016.19 4 8 12 Malampaya Sound PLS 200,115.00 35 10 45 5 Chico Island Wildlife Sanctuary 7.77 None Naro Island Wildlife Sanctuary 109.98 None Malabungot PLS 120.62 None Lagonoy Natural Biotic Area 444.60 Expired
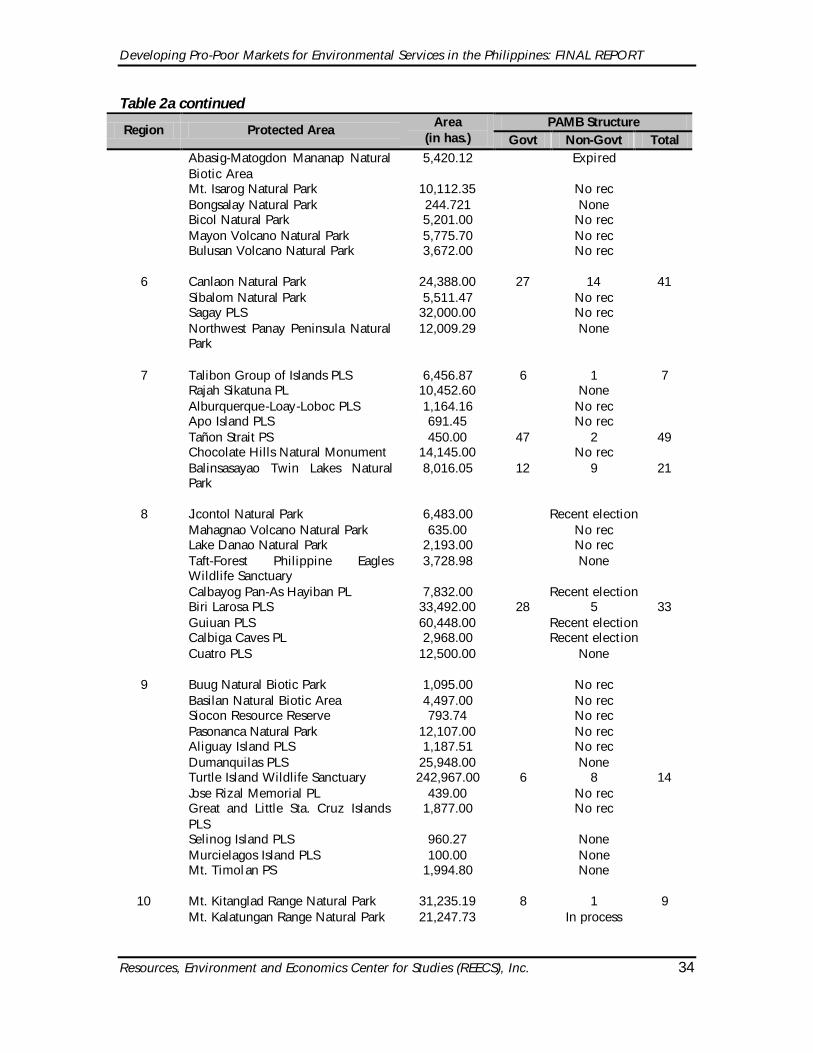
Developing Pro-Poor Markets for Environmental Services in the Philippines: FINAL REPORT
Resources, Environment and Economics Center for Studies (REECS), Inc. 34
Table 2a continued PAMB Structure
Region Protected Area Area
(in has.) Govt Non-Govt Total Abasig-Matogdon Mananap Natural
Biotic Area 5,420.12 Expired
Mt. Isarog Natural Park 10,112.35 No rec Bongsalay Natural Park 244.721 None Bicol Natural Park 5,201.00 No rec Mayon Volcano Natural Park 5,775.70 No rec Bulusan Volcano Natural Park 3,672.00 No rec 6 Canlaon Natural Park 24,388.00 27 14 41 Sibalom Natural Park 5,511.47 No rec Sagay PLS 32,000.00 No rec Northwest Panay Peninsula Natural
Park 12,009.29 None
7 Talibon Group of Islands PLS 6,456.87 6 1 7 Rajah Sikatuna PL 10,452.60 None Alburquerque-Loay-Loboc PLS 1,164.16 No rec Apo Island PLS 691.45 No rec Tañon Strait PS 450.00 47 2 49 Chocolate Hills Natural Monument 14,145.00 No rec Balinsasayao Twin Lakes Natural
Park 8,016.05 12 9 21
8 Jicontol Natural Park 6,483.00 Recent election Mahagnao Volcano Natural Park 635.00 No rec Lake Danao Natural Park 2,193.00 No rec Taft-Forest Philippine Eagles
Wildlife Sanctuary 3,728.98 None
Calbayog Pan-As Hayiban PL 7,832.00 Recent election Biri Larosa PLS 33,492.00 28 5 33 Guiuan PLS 60,448.00 Recent election Calbiga Caves PL 2,968.00 Recent election Cuatro PLS 12,500.00 None 9 Buug Natural Biotic Park 1,095.00 No rec Basilan Natural Biotic Area 4,497.00 No rec Siocon Resource Reserve 793.74 No rec Pasonanca Natural Park 12,107.00 No rec Aliguay Island PLS 1,187.51 No rec Dumanquilas PLS 25,948.00 None Turtle Island Wildlife Sanctuary 242,967.00 6 8 14 Jose Rizal Memorial PL 439.00 No rec Great and Little Sta. Cruz Islands
PLS 1,877.00 No rec
Selinog Island PLS 960.27 None Murcielagos Island PLS 100.00 None Mt. Timolan PS 1,994.80 None
10 Mt. Kitanglad Range Natural Park 31,235.19 8 1 9 Mt. Kalatungan Range Natural Park 21,247.73 In process
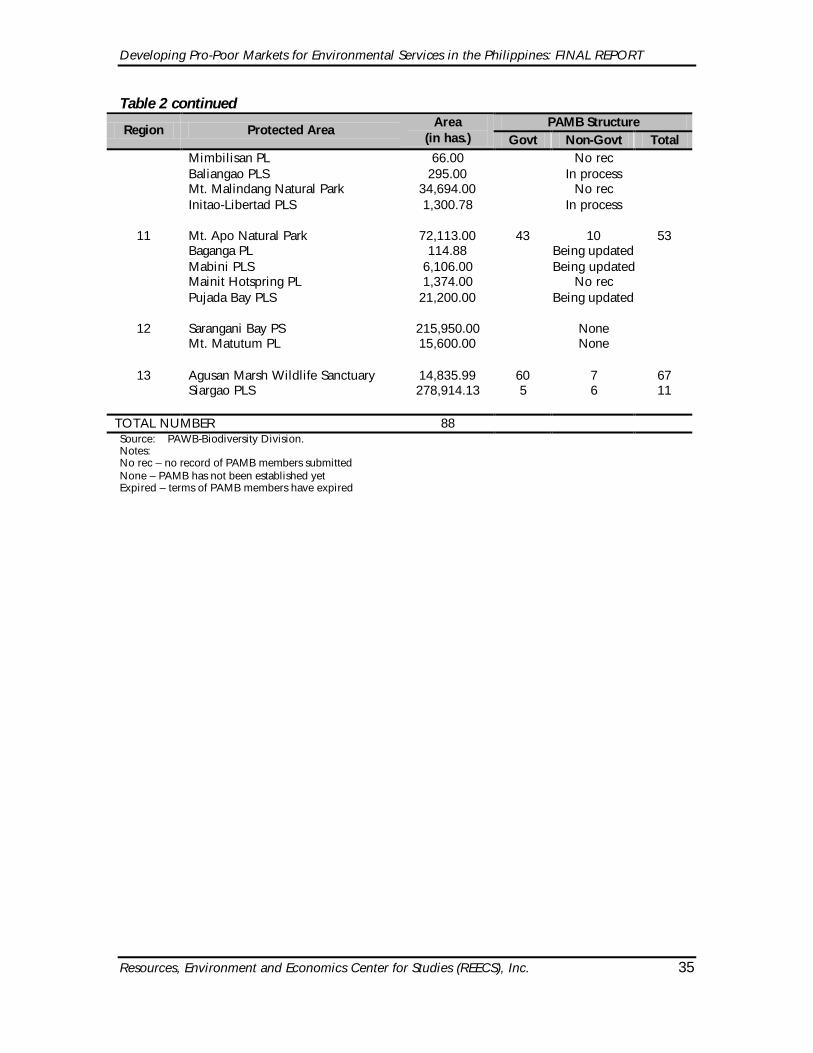
Developing Pro-Poor Markets for Environmental Services in the Philippines: FINAL REPORT
Resources, Environment and Economics Center for Studies (REECS), Inc. 35
Table 2 continued PAMB Structure
Region Protected Area Area
(in has.) Govt Non-Govt Total Mimbilisan PL 66.00 No rec Baliangao PLS 295.00 In process Mt. Malindang Natural Park 34,694.00 No rec Initao-Libertad PLS 1,300.78 In process
11 Mt. Apo Natural Park 72,113.00 43 10 53 Baganga PL 114.88 Being updated Mabini PLS 6,106.00 Being updated Mainit Hotspring PL 1,374.00 No rec Pujada Bay PLS 21,200.00 Being updated
12 Sarangani Bay PS 215,950.00 None Mt. Matutum PL 15,600.00 None
13 Agusan Marsh Wildlife Sanctuary 14,835.99 60 7 67 Siargao PLS 278,914.13 5 6 11
TOTAL NUMBER 88 Source: PAWB-Biodiversity Division. Notes: No rec – no record of PAMB members submitted None – PAMB has not been established yet Expired – terms of PAMB members have expired
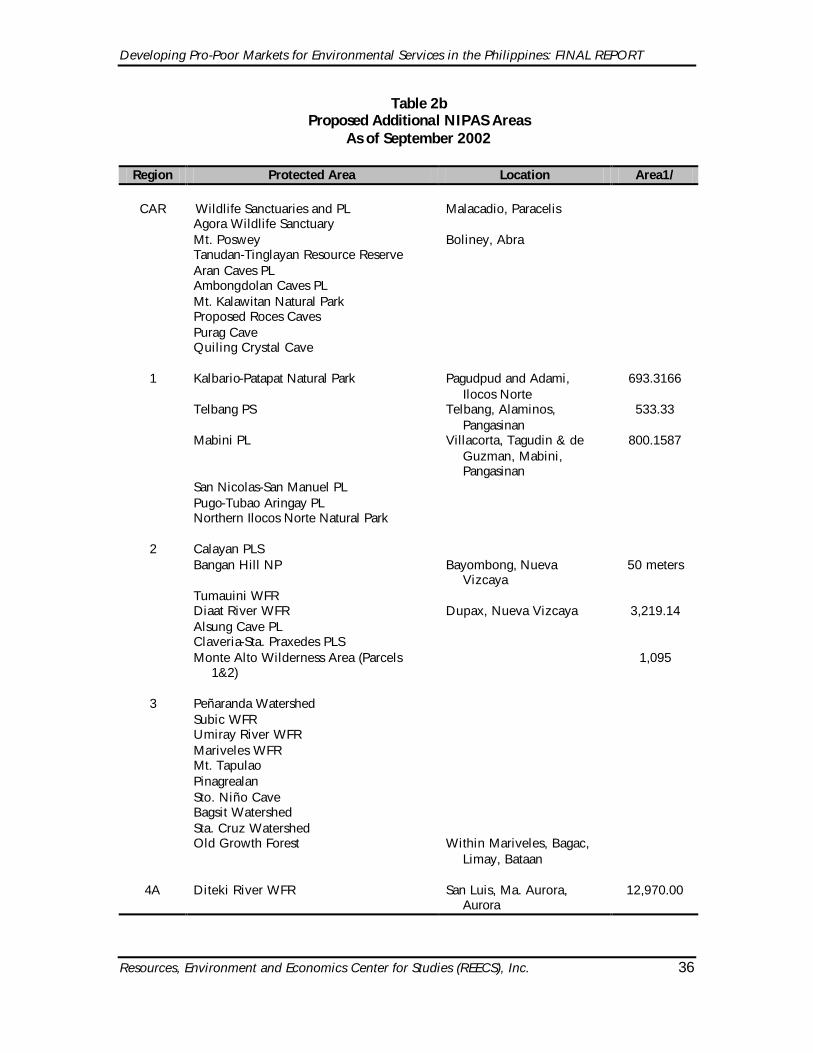
Developing Pro-Poor Markets for Environmental Services in the Philippines: FINAL REPORT
Resources, Environment and Economics Center for Studies (REECS), Inc. 36
Table 2b Proposed Additional NIPAS Areas
As of September 2002
Region Protected Area Location Area1/
CAR Wildlife Sanctuaries and PL Malacadio, Paracelis Agora Wildlife Sanctuary Mt. Poswey Boliney, Abra Tanudan-Tinglayan Resource Reserve Aran Caves PL Ambongdolan Caves PL Mt. Kalawitan Natural Park Proposed Roces Caves Purag Cave Quiling Crystal Cave 1 Kalbario-Patapat Natural Park Pagudpud and Adami,
Ilocos Norte 693.3166
Telbang PS Telbang, Alaminos, Pangasinan
533.33
Mabini PL Villacorta, Tagudin & de Guzman, Mabini, Pangasinan
800.1587
San Nicolas-San Manuel PL Pugo-Tubao Aringay PL Northern Ilocos Norte Natural Park 2 Calayan PLS Bangan Hill NP Bayombong, Nueva
Vizcaya 50 meters
Tumauini WFR Diaat River WFR Dupax, Nueva Vizcaya 3,219.14 Alsung Cave PL Claveria-Sta. Praxedes PLS Monte Alto Wilderness Area (Parcels
1&2) 1,095
3 Peñaranda Watershed Subic WFR Umiray River WFR Mariveles WFR Mt. Tapulao Pinagrealan Sto. Niño Cave Bagsit Watershed Sta. Cruz Watershed Old Growth Forest Within Mariveles, Bagac,
Limay, Bataan
4A Diteki River WFR San Luis, Ma. Aurora,
Aurora 12,970.00
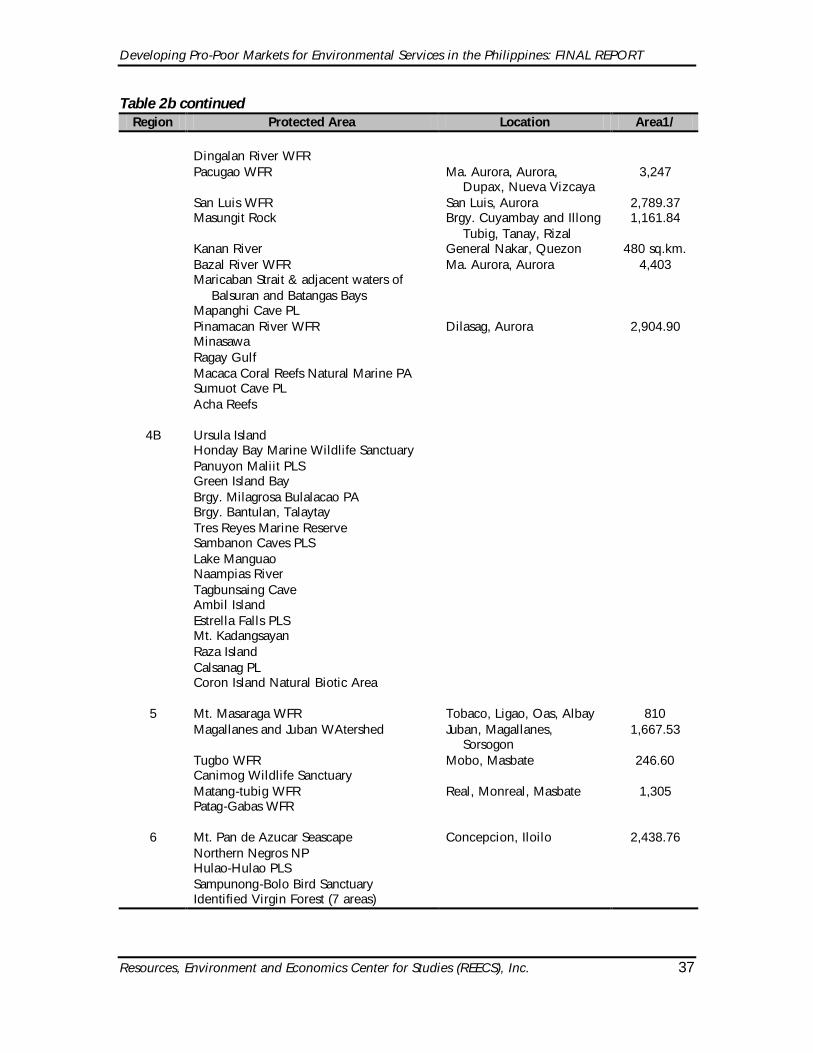
Developing Pro-Poor Markets for Environmental Services in the Philippines: FINAL REPORT
Resources, Environment and Economics Center for Studies (REECS), Inc. 37
Table 2b continued Region Protected Area Location Area1/
Dingalan River WFR Pacugao WFR Ma. Aurora, Aurora,
Dupax, Nueva Vizcaya 3,247
San Luis WFR San Luis, Aurora 2,789.37 Masungit Rock Brgy. Cuyambay and Illong
Tubig, Tanay, Rizal 1,161.84
Kanan River General Nakar, Quezon 480 sq.km. Bazal River WFR Ma. Aurora, Aurora 4,403 Maricaban Strait & adjacent waters of
Balsuran and Batangas Bays
Mapanghi Cave PL Pinamacan River WFR Dilasag, Aurora 2,904.90 Minasawa Ragay Gulf Macaca Coral Reefs Natural Marine PA Sumuot Cave PL Acha Reefs
4B Ursula Island Honday Bay Marine Wildlife Sanctuary Panuyon Maliit PLS Green Island Bay Brgy. Milagrosa Bulalacao PA Brgy. Bantulan, Talaytay Tres Reyes Marine Reserve Sambanon Caves PLS Lake Manguao Naampias River Tagbunsaing Cave Ambil Island Estrella Falls PLS Mt. Kadangsayan Raza Island Calsanag PL Coron Island Natural Biotic Area 5 Mt. Masaraga WFR Tobaco, Ligao, Oas, Albay 810 Magallanes and Juban WAtershed Juban, Magallanes,
Sorsogon 1,667.53
Tugbo WFR Mobo, Masbate 246.60 Canimog Wildlife Sanctuary Matang-tubig WFR Real, Monreal, Masbate 1,305 Patag-Gabas WFR 6 Mt. Pan de Azucar Seascape Concepcion, Iloilo 2,438.76 Northern Negros NP Hulao-Hulao PLS Sampunong-Bolo Bird Sanctuary Identified Virgin Forest (7 areas)
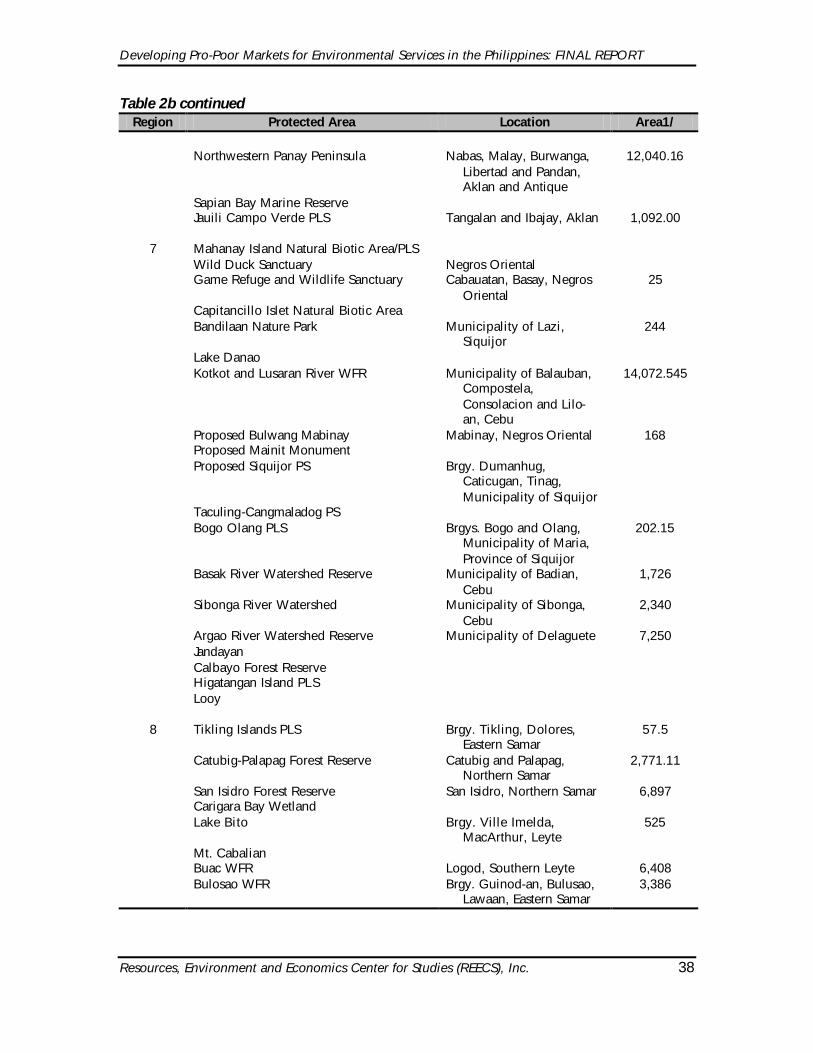
Developing Pro-Poor Markets for Environmental Services in the Philippines: FINAL REPORT
Resources, Environment and Economics Center for Studies (REECS), Inc. 38
Table 2b continued Region Protected Area Location Area1/
Northwestern Panay Peninsula Nabas, Malay, Burwanga,
Libertad and Pandan, Aklan and Antique
12,040.16
Sapian Bay Marine Reserve Jauili Campo Verde PLS Tangalan and Ibajay, Aklan 1,092.00 7 Mahanay Island Natural Biotic Area/PLS Wild Duck Sanctuary Negros Oriental Game Refuge and Wildlife Sanctuary Cabauatan, Basay, Negros
Oriental 25
Capitancillo Islet Natural Biotic Area Bandilaan Nature Park Municipality of Lazi,
Siquijor 244
Lake Danao Kotkot and Lusaran River WFR Municipality of Balauban,
Compostela, Consolacion and Lilo-an, Cebu
14,072.545
Proposed Bulwang Mabinay Mabinay, Negros Oriental 168 Proposed Mainit Monument Proposed Siquijor PS Brgy. Dumanhug,
Caticugan, Tinag, Municipality of Siquijor
Taculing-Cangmaladog PS Bogo Olang PLS Brgys. Bogo and Olang,
Municipality of Maria, Province of Siquijor
202.15
Basak River Watershed Reserve Municipality of Badian, Cebu
1,726
Sibonga River Watershed Municipality of Sibonga, Cebu
2,340
Argao River Watershed Reserve Municipality of Delaguete 7,250 Jandayan Calbayo Forest Reserve Higatangan Island PLS Looy 8 Tikling Islands PLS Brgy. Tikling, Dolores,
Eastern Samar 57.5
Catubig-Palapag Forest Reserve Catubig and Palapag, Northern Samar
2,771.11
San Isidro Forest Reserve San Isidro, Northern Samar 6,897 Carigara Bay Wetland Lake Bito Brgy. Ville Imelda,
MacArthur, Leyte 525
Mt. Cabalian Buac WFR Logod, Southern Leyte 6,408 Bulosao WFR Brgy. Guinod-an, Bulusao,
Lawaan, Eastern Samar 3,386
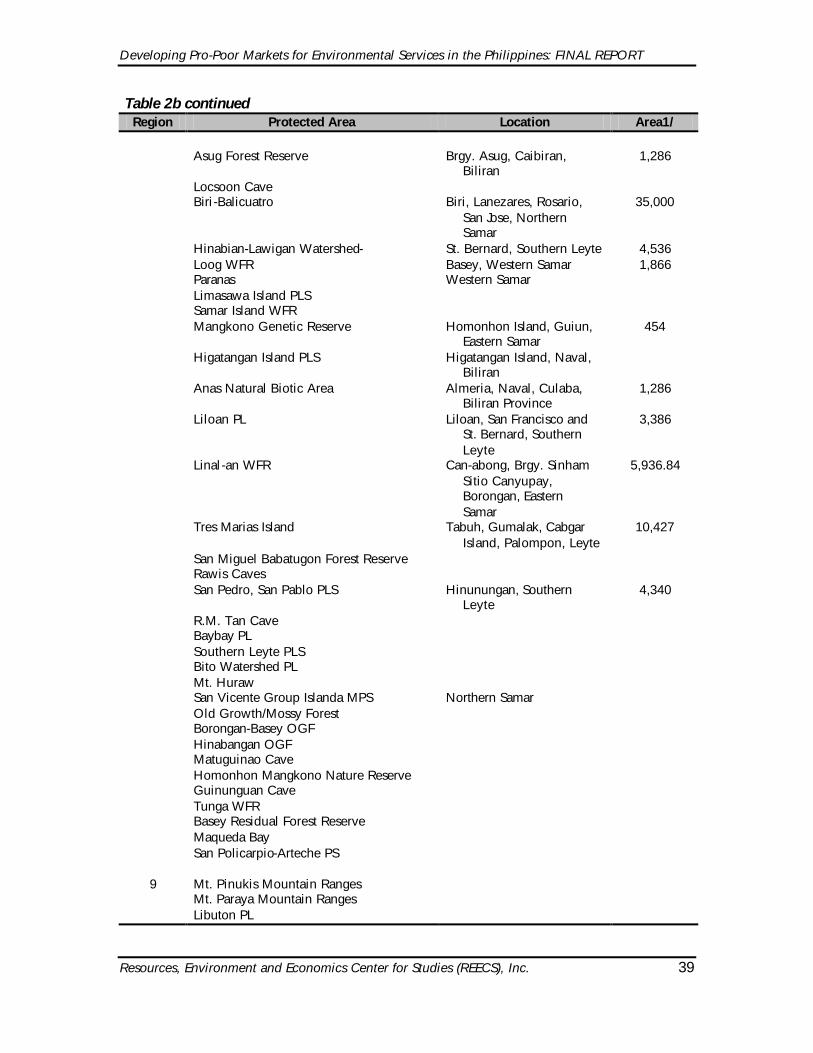
Developing Pro-Poor Markets for Environmental Services in the Philippines: FINAL REPORT
Resources, Environment and Economics Center for Studies (REECS), Inc. 39
Table 2b continued Region Protected Area Location Area1/
Asug Forest Reserve Brgy. Asug, Caibiran,
Biliran 1,286
Locsoon Cave Biri-Balicuatro Biri, Lanezares, Rosario,
San Jose, Northern Samar
35,000
Hinabian-Lawigan Watershed- St. Bernard, Southern Leyte 4,536 Loog WFR Basey, Western Samar 1,866 Paranas Western Samar Limasawa Island PLS Samar Island WFR Mangkono Genetic Reserve Homonhon Island, Guiun,
Eastern Samar 454
Higatangan Island PLS Higatangan Island, Naval, Biliran
Anas Natural Biotic Area Almeria, Naval, Culaba, Biliran Province
1,286
Liloan PL Liloan, San Francisco and St. Bernard, Southern Leyte
3,386
Linal-an WFR Can-abong, Brgy. Sinham Sitio Canyupay, Borongan, Eastern Samar
5,936.84
Tres Marias Island Tabuh, Gumalak, Cabgar Island, Palompon, Leyte
10,427
San Miguel Babatugon Forest Reserve Rawis Caves San Pedro, San Pablo PLS Hinunungan, Southern
Leyte 4,340
R.M. Tan Cave Baybay PL Southern Leyte PLS Bito Watershed PL Mt. Huraw San Vicente Group Islanda MPS Northern Samar Old Growth/Mossy Forest Borongan-Basey OGF Hinabangan OGF Matuguinao Cave Homonhon Mangkono Nature Reserve Guinunguan Cave Tunga WFR Basey Residual Forest Reserve Maqueda Bay San Policarpio-Arteche PS 9 Mt. Pinukis Mountain Ranges Mt. Paraya Mountain Ranges Libuton PL
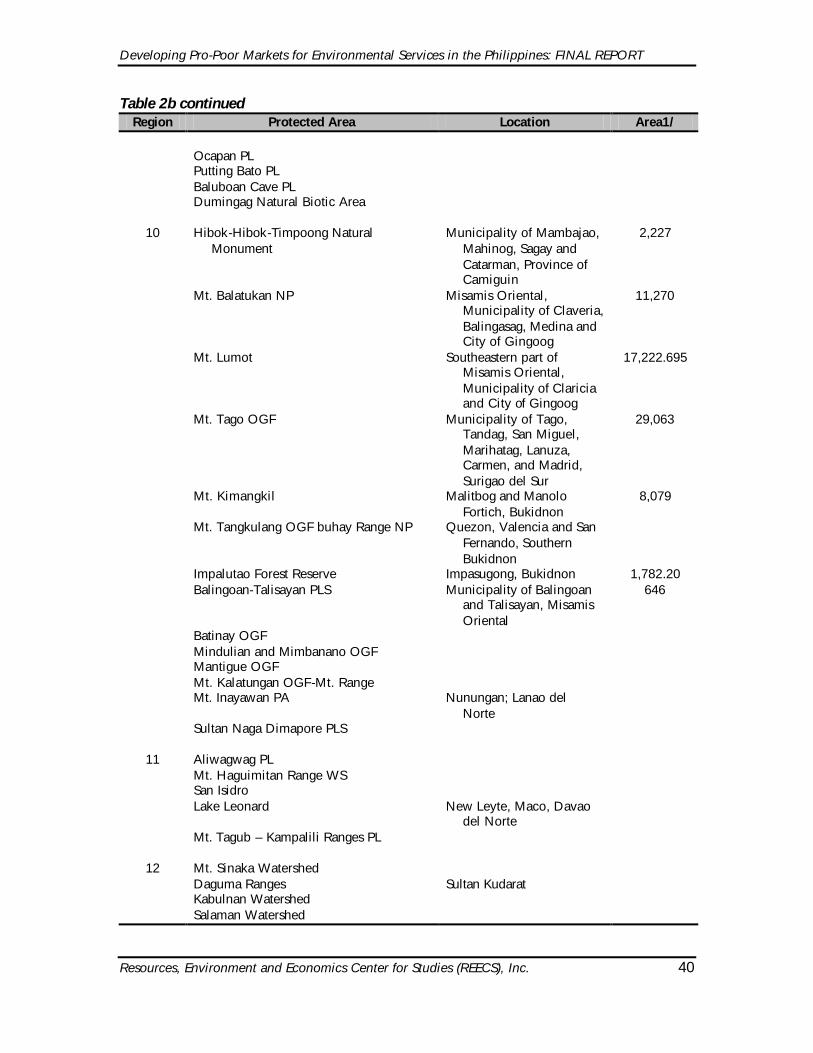
Developing Pro-Poor Markets for Environmental Services in the Philippines: FINAL REPORT
Resources, Environment and Economics Center for Studies (REECS), Inc. 40
Table 2b continued Region Protected Area Location Area1/
Ocapan PL Putting Bato PL Baluboan Cave PL Dumingag Natural Biotic Area
10 Hibok-Hibok-Timpoong Natural Monument
Municipality of Mambajao, Mahinog, Sagay and Catarman, Province of Camiguin
2,227
Mt. Balatukan NP Misamis Oriental, Municipality of Claveria, Balingasag, Medina and City of Gingoog
11,270
Mt. Lumot Southeastern part of Misamis Oriental, Municipality of Claricia and City of Gingoog
17,222.695
Mt. Tago OGF Municipality of Tago, Tandag, San Miguel, Marihatag, Lanuza, Carmen, and Madrid, Surigao del Sur
29,063
Mt. Kimangkil Malitbog and Manolo Fortich, Bukidnon
8,079
Mt. Tangkulang OGF buhay Range NP Quezon, Valencia and San Fernando, Southern Bukidnon
Impalutao Forest Reserve Impasugong, Bukidnon 1,782.20 Balingoan-Talisayan PLS Municipality of Balingoan
and Talisayan, Misamis Oriental
646
Batinay OGF Mindulian and Mimbanano OGF Mantigue OGF Mt. Kalatungan OGF-Mt. Range Mt. Inayawan PA Nunungan; Lanao del
Norte
Sultan Naga Dimapore PLS
11 Aliwagwag PL Mt. Haguimitan Range WS San Isidro Lake Leonard New Leyte, Maco, Davao
del Norte
Mt. Tagub – Kampalili Ranges PL
12 Mt. Sinaka Watershed Daguma Ranges Sultan Kudarat Kabulnan Watershed Salaman Watershed

Developing Pro-Poor Markets for Environmental Services in the Philippines: FINAL REPORT
Resources, Environment and Economics Center for Studies (REECS), Inc. 41
Table 2b continued Region Protected Area Location Area1/
Paril-Sangay PS
13 General Island PL Lingig PLS Mancangi PLS Pinagdayuhan and Buyuan NP Britanica-Gata PLS Adlay Watershed Tago River Watershed Tubay Wildlife Sanctuary Kinablangan Watershed Lake Mainit Wildlife Sanctuary
ARMM Liguasan Marsh Wilderness Area Nunungan, Lanao del Sur
Total Number 182 1/In hectares unless otherwise specified. Source: PAWB-Biodiversity Division. From the composition of the PAMB, it is evident that government realizes the value of having representation from all stakeholders directly connected with environmental management. For one thing, the characteristic of PAs in the Philippines is such that most of these remote areas are already inhabited by people, and the concept of “strictly no use” is politically unfeasible. Hence, government has accepted the fact that comprehensive and sustainable management of protected areas will need to include all stakeholders in decision-making. Tenurial instruments are being issued to migrants who have occupied the area for more than five years prior to the passage of the NIPAS Act (See Appendix B). In a way, property rights have been issued to them, which in turn provides a greater incentive for these people to manage the resources properly. Box No. 7 Establishment and Management of Community-Based Programs in
Protected Areas: Issuing Property Rights to Local Communities Living inside Protected Areas
On Jan. 3, 2002, the Department of Environment and Natural Resources (DENR) issued an Administrative Order (DAO) entitled “Establishment and Management of Community-Based Programs in Protected Areas”. The Order was meant to provide qualified migrant communities and interested indigenous people tenure over established community-based program (CBP) areas located within PAs under the NIPAS System. CBPs should be consistent with the Protected Area Management Plan formulated by the PAMB. Migrants should be certified by the PAMB as qualified tenured migrants (i.e. living in the area five years or more prior to the enactment of the NIPAS Act), while IPs should be certified by the National Commission of Indigenous People (NCIP) as recognized IPs staying in the PA.
Developing Pro-Poor Markets for Environmental Services in the Philippines: FINAL REPORT
Resources, Environment and Economics Center for Studies (REECS), Inc. 42
The CBP should describe the communities’ long-term vision, aspirations, commitment and strategies for protection, rehabilitation, development and sustainable utilization of the resources within the protected area. Procedures in preparing the Plan are contained in the Manual on the Establishment and Management of Community-Based Program in Protected Areas, which in turn was drafted by the PAWB-DENR. All fees collected from the implementation of the CBP will likewise revert back to the IPAF, and will be subjected to the same procedure of disbursement of IPAF funds. Source: DENR Administrative Order 2002-02. January 2002. “Establishment and Management of Community-
Based Programs in Protected Areas”. DENR, Philippines. Interviews with two former program managers of the World-Bank funded Conservation of Priority Protected Areas Program (CPPAP), a project that helped establish and implement ten PAs in the country for eight years, were conducted14. According to them, one of the most important contributions of the NIPAS Act was the democratic composition of the PAMBs, whereby civil society (or simply non-government organizations) were given a role in directly managing PAs. Prior to the NIPAS Act, PA management was solely entrusted to the State, through DENR personnel and elected government officials. But because of the nature of the political process in the Philippines, whereby officials are elected every three years, coupled with the usual problems of inefficiency of the bureaucracy due to overburdened staff, PA management left much to be desired. Officials hardly undertook long-term planning, and rarely did they invest in programs that would result into long-term benefits. With the introduction of non-government personnel in PAMBs, there was more room for sustainability and continuity, and consequently long-term planning. Furthermore, because community representatives were given a chance to participate in PA planning and implementation, their priorities were given more attention and had a higher chance of being met. There is thus a clearer link between suppliers and beneficiaries of environmental services. Even among government personnel, the PAMB served as a venue for rationalizing government programs in the area. Because all relevant levels of government were members of the PAMB, it became a venue for coordinating their own development programs and projects among themselves, something that was not a common practice prior to the NIPAS Act. Not only are they able to detect gaps and overlaps and resolve conflicts, they are also able to complement their programs through the IPAF funds generated by the PA. As in all pioneering efforts, birth pains are to be expected though. The composition and rationale of the PAMB are to be lauded. But in order for the whole system to work, there is the premise that every member is equipped with the same level of negotiating skills. Unfortunately, this is not the case. In particular, representatives of Indigenous Peoples’ (IP) groups and local people’s organizations sometimes get marginalized when discussions ensue. In the end, they are not able to articulate their positions, and they sometimes feel that their views become misrepresented. Nevertheless, these are problems of capacity building, rather than problems inherent in creating the PAMB per se. They are not deemed as justification for changing the PAMB and its role in PA management.
14 Personal interviews with Mr. Randy Dacanay of the Philippine Rural Reconstruction Movement (PRRM) and
Ms. Angelita Meniado of PAWB-DENR.
Developing Pro-Poor Markets for Environmental Services in the Philippines: FINAL REPORT
Resources, Environment and Economics Center for Studies (REECS), Inc. 43
Box No. 8 Conservation of Priority Protected Areas Project (CPPAP) The Conservation of Priority Protected Areas Project or CPPAP, a biodiversity conservation project funded by the World Bank, was implemented in the Philippines from 1994 to 2002. Its main objective was to pilot-test the NIPAS Act in chosen areas. Ten priority sites were chosen on the basis of their biogeographical location, peace and order condition, legal status, size of the area and financing needs, among other criteria.
The ten priority sites identified for CPPAP intervention are the following:
§ Mt. Kanlaon Natural Park § Mt. Kitanglad Range Natural Park § Apo Reef Natural Park § Siargao Protected Landscape and Seascape § Mt. Apo Natural Park § Bataan Natural Park § Sierra Madre Natural Park § Batanes Protected Landscape and Seascape § Agusan Marsh Wildlife Sanctuary § Turtle Islands Protected Landscape and Seascape
Its eight years of implementation was conducted with a budget of US$ 20 million financed by the Global Environmental Facility through the World Bank, with a government counterpart fund of 10% of the WB-GEF grant. Out of the total GEF amount, US$ 17.13 million was provided to NIPA and the rest to DENR. CPPAP’s five major components include: § Protected area planning and management § Biodiversity conservation § Tenurial security § Livelihood systems § Project management and coordination
A sustainable development paradigm was adopted by the CPPAP as its overall framework. A set of objectively verifiable indicators (OVI) was developed for indicating milestones for the five components, and as indicators for achievement of the overall goal and purpose of the project.
Source: Department of Environment and Natural Resources. Conservation of Priority Protected Areas Project. CPPAP-PCU,
NAPWNC, North Avenue, Diliman, Quezon City.
3.1.4 Implementation of User Fees – Some Emerging Difficulties Upon arrival at a decision on how much to charge for user fees, the PAMB comes up with a resolution indicating the amount and the mechanism for collection of such fees. The advantage of this set-up is that PAMBs are legally mandated to charge fees, and can come up with their own fee system they deem suitable for their resources and the users thereof.
Developing Pro-Poor Markets for Environmental Services in the Philippines: FINAL REPORT
Resources, Environment and Economics Center for Studies (REECS), Inc. 44
And since the PAMB is theoretically well-represented by all the major stakeholders in the area, there is a quick acceptance by the community once the Board reaches its decision.
Inefficiencies arise when the PAMB is composed of a huge number of stakeholders, making it difficult to come up with a quorum during their quarterly meetings. For instance, in Mt. Apo National Park, the PAMB is composed of 250 members due to the large coverage of the PA. It sometimes takes years before major decisions are resolved because of the difficulty of gathering a sufficient number of representatives during their regular meetings.
Still, there are certain legal issues that need to be resolved between the NIPAS Act and other conflicting laws. For instance, the Local Government Code (LGC) provides for local governments to share as much as 30% in the national wealth, for all types of resources found within their jurisdiction. Although the LGC was drafted earlier, the NIPAS Act did not specifically override the revenue generating functions of Local Government Units (LGUs) in the environment and natural resources sector. In some areas, this pits the local government against the PAMB in generating revenues, creating a lot of confusion and consequently delaying the implementation of plans and programs for the PA. Then there is the conflict with the National Water Resources Board that claims that they are the sole government entity that can issue water rights and distribute them accordingly. Accompanying such rights is the payment of fixed fees. Watershed protection fees are being interpreted to fall under this category. Finally, the forestry sector has their own set of user fees and charges, which sometimes overlap with resource user fees that some PAMBs are implementing.
In some areas, such issues are resolved by giving the LGU greater powers within the PAMB itself. This is true in areas where the mayor or governor has a very strong hold on his/her constituents, and the PAMB, which is led by the national government, has no choice but to work within the LGU’s framework. Still, in some areas, there is an equal sharing scheme of leadership within the PAMB. This likewise translates into a substantial proportion of the revenues being given to the LGU, instead of the whole amount being deposited to the IPAF. Finally, there are also areas where the LGU is totally left out of the PAMB when the Mayor refuses to recognize the all encompassing powers of the PAMB over the PA. It thus becomes a case-to-case basis whether the inclusion of all stakeholders will ensure that the PAMB is successful in managing the PA or not. But in principle, there is still an advantage to this democratic way of building institutional mechanisms for protected area management, since programs and plans of the management board will consequently reflect the interests of the stakeholders themselves. 3.1.5 Integrated Protected Area Fund (IPAF) 3.1.5.1 Definition As mentioned earlier, IPAF was created under Republic Act 7586 otherwise known as the NIPAS Act. In particular, Sec. 16 states: “There is hereby established a trust fund to be known as Integrated Protected Areas (IPAS) Fund for purposes of financing projects of the System. The IPAS may solicit and receive donations, endowments, and grants in the form of contributions, and such endowments
Developing Pro-Poor Markets for Environmental Services in the Philippines: FINAL REPORT
Resources, Environment and Economics Center for Studies (REECS), Inc. 45
shall be exempted from income or gift taxes and all other taxes, charges or fees imposed by the Government or any political subdivision or instrumentality thereof.” It further states that: “All incomes generated from the operation of the System or management of wild flora and fauna shall accrue to the Fund and may be utilized directly by the DENR for the above purpose. These incomes shall be derived from: a. Taxes from the permitted sale and export of flora and fauna and other resources from
protected areas; b. Proceeds from lease of multiple-use areas; c. Contributions from industries and facilities directly benefiting from the protected area;
and d. Such other fees and incomes derived from the operation of the protected area.
Disbursements from the Fund shall be made solely for the protection, maintenance, administration, and management of the System, and duly approved projects endorsed by the PAMBs, in the amounts authorized by the DENR.”
In the Implementing Rules and Regulations, it is specified that “at least 75% of the revenues generated by a protected area shall be retained for the development and maintenance of that area and utilized subject to the IPAF Board guidelines … with the balance being remitted to the Central IPAF Fund.” Such guidelines contain general provisions on the approval process, which in turn are made consistent with the Manual of Operations of the DENR. 3.1.5.2 Current Flow of IPAF Disbursements Interviews were conducted with personnel from the DENR as well as from the Department of Budget and Management (DBM). Appendix C-1 contains the complete schedule of interviews conducted for this particular study component. From the interviews, the following flow of documents was derived:
Step 1: The PAMB issues a resolution requesting for their IPAF Funds to be released, based on an attached Work and Financial Plan (WFP) approved by its members. Along with the WFP are the other budgetary statements as required by DBM and DENR.
Step 2: The documents are submitted first to the respective Community Environment and Natural Resources Officer (CENRO), then to the Provincial Environment and Natural Resources Officer (PENRO) concerned.
Step 3: Upon checking whether the WFP is in line with what was agreed upon, and upon checking the budgetary statements and reconciling it with the province’s total budgetary statements, the documents are submitted to the DENR Regional Office.

Developing Pro-Poor Markets for Environmental Services in the Philippines: FINAL REPORT
Resources, Environment and Economics Center for Studies (REECS), Inc. 46
Step 4: Within the DENR Regional Office, the documents pass several offices. First, they go to the Protected Areas and Wildlife Service Division, which checks the WFP’s technical aspects and sees whether they are within the priorities and plans of the Region. They also go to the budget and accounting division, which reconciles the figures with the regional budget figures. Upon recommendation of the respective division chiefs, the documents are submitted to the Assistant Regional Director, who then recommends endorsement by the Regional Executive Director (RED). The RED then endorses the request to the Protected Areas and Wildlife Bureau of the DENR in Manila.
Step 5: At the PAWB, the request goes through two divisions: the Biodiversity Division and the Administrative Division. Both check for completeness of documents. Upon approval of both division chiefs, the request is endorsed to the Assistant Director of PAWB, who recommends the endorsement of the Director to the DENR Central Office.
Step 6: When it reaches the DENR Central Office, the request is processed by two more offices. First, it goes through the Financial and Management Service Bureau, which checks whether the attachments to the budget request are complete or not. It then forwards the request to the Office of the Assistant Secretary (Asec) for Operations, who either signs it him/herself or forwards it to the Head Executive Assistant (HEA) of the Department Secretary (Sec), for the latter’s signature. Upon signature of either the Asec, the HEA or the Sec., the documents get endorsed to the DBM.
Step 7: At the DBM, the documents are processed by the Division handling DENR requests. An analyst checks the financial attachments of the request, and verifies whether the amounts stated are accurate. The Division Chief then endorses the request to the Director, who then recommends approval by the Secretary, through the Assistant Secretary. Upon approval, the Secretary issues the Notice of Cash Allocation (NCA), and the Special Allotment Release Order (SARO). The NCA is issued as proof that the cash is indeed deposited in the bank account of the agency concerned, while the SARO is the authority of the agency to withdraw the cash for whatever purpose is stated in the WFP. Only then is the process completed.
Figure 2 contains the flowchart summarizing all the steps involved in the process of requesting releases from the IPAF.
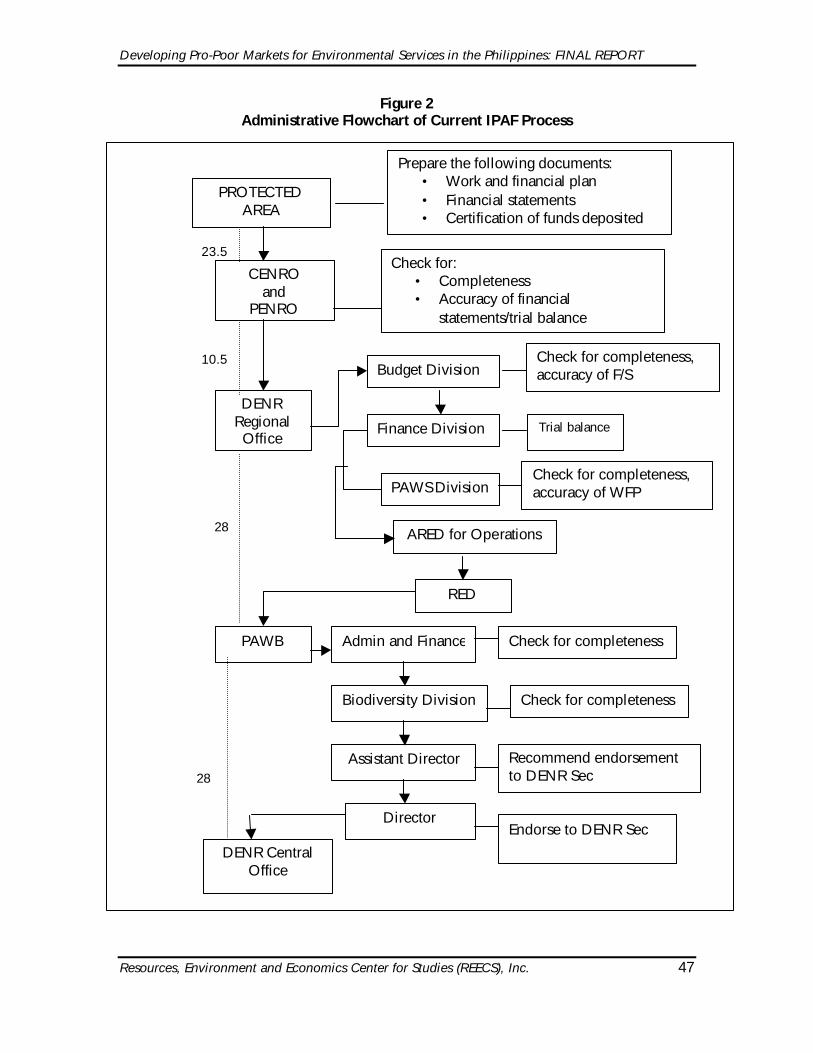
Developing Pro-Poor Markets for Environmental Services in the Philippines: FINAL REPORT
Resources, Environment and Economics Center for Studies (REECS), Inc. 47
Figure 2 Administrative Flowchart of Current IPAF Process
CENRO and
PENRO
Check for: • Completeness • Accuracy of financial
statements/trial balance
DENR Regional Office
Budget Division Check for completeness, accuracy of F/S
PROTECTED AREA
Finance Division Trial balance
PAWS DivisionCheck for completeness, accuracy of WFP
ARED for Operations
RED
PAWB Admin and Finance Check for completeness
Biodiversity Division Check for completeness
Assistant Director Recommend endorsement to DENR Sec
Director Endorse to DENR Sec
Prepare the following documents: • Work and financial plan • Financial statements • Certification of funds deposited
DENR Central Office
23.5
10.5
28
28
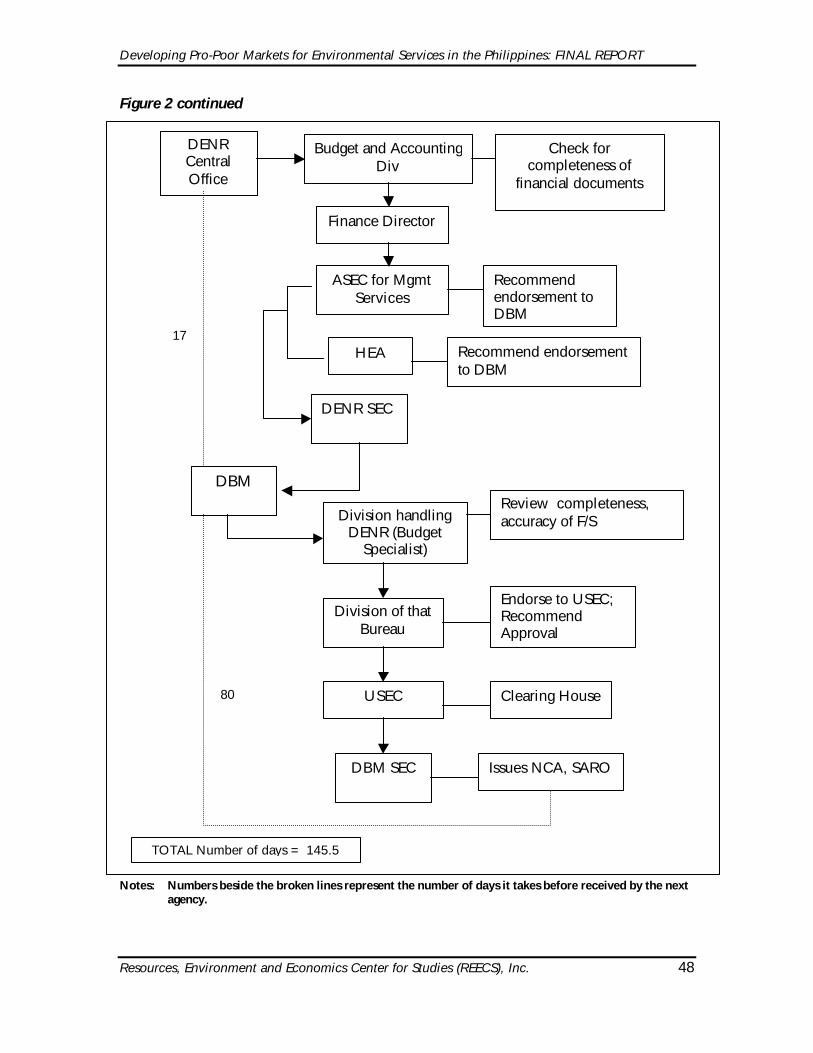
Developing Pro-Poor Markets for Environmental Services in the Philippines: FINAL REPORT
Resources, Environment and Economics Center for Studies (REECS), Inc. 48
Figure 2 continued Notes: Numbers beside the broken lines represent the number of days it takes before received by the next
agency.
DENR Central Office
Budget and Accounting Div
Check for completeness of
financial documents
Finance Director
ASEC for Mgmt Services
Recommend endorsement to DBM
HEA Recommend endorsement to DBM
DENR SEC
DBM
Division handling DENR (Budget
Specialist)
Review completeness, accuracy of F/S
Division of that Bureau
USEC
Endorse to USEC; Recommend Approval
Clearing House
DBM SEC Issues NCA, SARO
17
80
TOTAL Number of days = 145.5

Developing Pro-Poor Markets for Environmental Services in the Philippines: FINAL REPORT
Resources, Environment and Economics Center for Studies (REECS), Inc. 49
3.1.5.3 Problems in IPAF Disbursements Table 3 shows the average number of days it takes for each office to process IPAF requests. So far, there have only been nine out of 71 PAs with IPAF revenues that have made requests for IPAF releases:
a. Mt. Isarog National Park b. Manleluag Spring National Park c. El Nido Marine Reserve d. Apo Reef Natural Park e. Initao National Park f. Biak na Bato National Park g. Apo Island Protected Landscape and Seascape h. Hinulugang Taktak National Park i. Mt. Pulag National Park
Table 3 Protected Areas with IPAF Disbursements
Average Total Number of Days, Total Income, Total IPAF Disbursement and Status of NIPAS Proclamation by Protected Area
As of December 2002
Protected Area
Average Total
Number of Days
Total Income Total IPAF
Disbursement NIPAS Status
Mt. Isarog NP 48 135,024.00 85,768.00 proc Manleluag Spring NP 120 1,930,255.62 489,220.00 not yet proc El Nido Marine Reserve 196 247,536.68 120,772.00 proc Apo Reef NP 255 787,630.00 370,000.00 proc Initao NP 222 227,601.00 160,838.00 proc Biak na Bato NP 148 2,139,850.00 882,080.00 not yet proc Apo Island 165 3,213,655.00 1,251,314.00 proc Hinulugang Taktak NP Inc 5,259,821.00 2,734,257.00 proc Mt. Pulag NP 158 1,086,987.60 375,396.00 no yet proc Average 163.9
TOTAL 15,028,360.90 6,469,645.00 Source: PAWB-Biodiversity Divison Notes: inc – cannot be estimated because of insufficient information proc – proclaimed under NIPAS not yet proc – not yet proclaimed under NIPAS

Developing Pro-Poor Markets for Environmental Services in the Philippines: FINAL REPORT
Resources, Environment and Economics Center for Studies (REECS), Inc. 50
Basically, these are the PAs that have established user fees and have generated substantial amount of revenues for the use of the area’s resources. Most of these revenues are tourism-related, whereby entrance fees are charged against visitors entering the area for recreational purposes. Table 4 contains the list of PAs that have been able to raise IPAF revenues on their own.
Table 4 Protected Areas with IPAF Revenues
Area and Total Income by Region and Protected Area As of December 2002
Region Protected Area Area
(in has.) Total Income
PAWB NAPWNC 2,400.000 37,429,042.51
Hinulugang Taktak NP 3.200 5,259,821.00
CAR Mt. Pulag NP 11,550.000 1,086,987.60 1 Paoay Lake NP 340.000 307,193.75 Agoo-Damortis PLS 10,513.300 400.00 Bessang Pass Natural
Monument/Landmark 693.3166 23,416.25
Manleluag Hot Spring NP 91.700 1,930,255.62 2 Batanes PLS 213,578.000 417,976.13 Magapit PL 3,403.620 10,000.00 Peñablanca PL 4,136.000 12,840.00 Northern Sierra Madre Natural Park 359,486.000 41,120.00 Salinas Natural Monument 6,675.560 1,000.00 Dupax WFR 425.000 1,000.00 Bangan Hill NP 425.000 11,500.00 3 Mt. Arayat NP 3,715.230 73,230.00 Biak-na-Bato NP 658.850 2,139,850.00 Minalungao NP 2,018.000 6,400.00 Bataan NP 23,688.000 16,822.00 Roosevelt NP 786.040 12,000.00
4A Mt. Palay-Palay Mataas-na Gulod NP 4,000.000 15,477.00 Quezon NP 983.000 32,650.00 Taal Volcano PL 4,537.000 4,760.00
4B Naujan Lake NP 21,655.000 3,047.27 Puerto Princesa Subterranean River
Natural Park 22,202.000 2,085,503.17
Ursula Islands 20.000 10,000.00 Mt. Guiting-Guiting Natural Park 15,265.480 40,200.00 Tubbataha Reef National Marine Park 33,200.000 104,000.00 El Nido Managed Resource Protected
Area 89,134.760 247,536.68
Apo Reef Natural Park 15,792.000 787,630.00
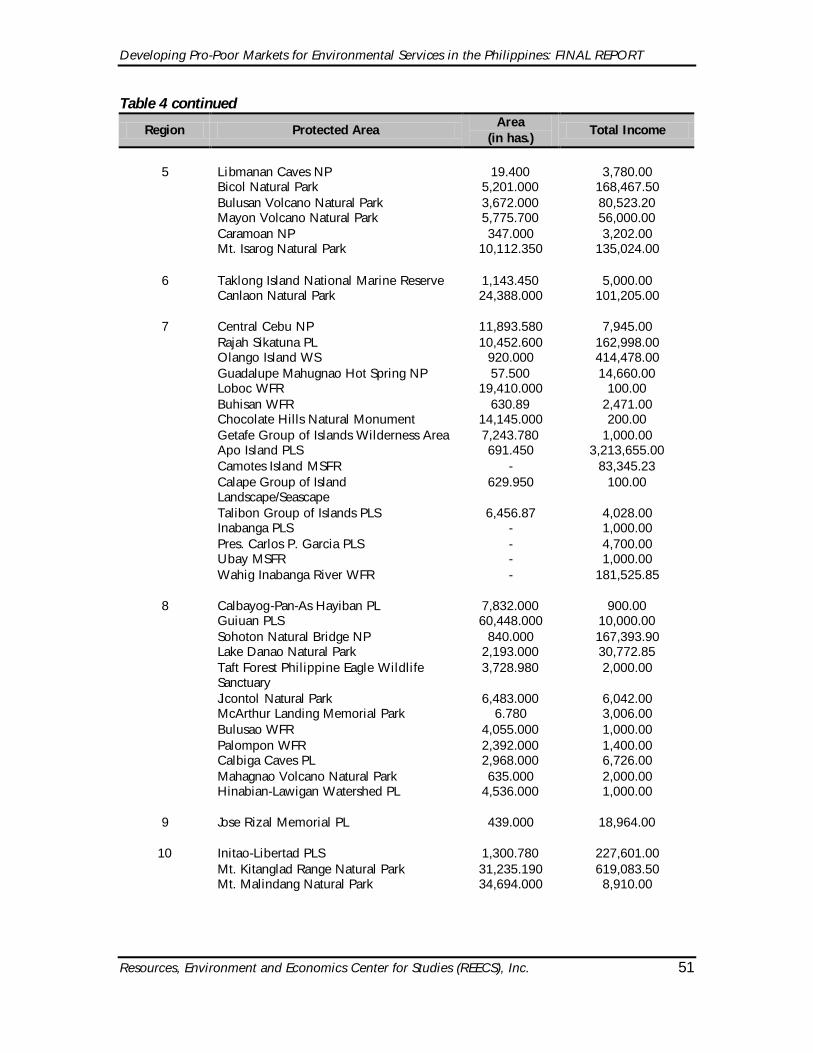
Developing Pro-Poor Markets for Environmental Services in the Philippines: FINAL REPORT
Resources, Environment and Economics Center for Studies (REECS), Inc. 51
Table 4 continued
Region Protected Area Area
(in has.) Total Income
5 Libmanan Caves NP 19.400 3,780.00 Bicol Natural Park 5,201.000 168,467.50 Bulusan Volcano Natural Park 3,672.000 80,523.20 Mayon Volcano Natural Park 5,775.700 56,000.00 Caramoan NP 347.000 3,202.00 Mt. Isarog Natural Park 10,112.350 135,024.00 6 Taklong Island National Marine Reserve 1,143.450 5,000.00 Canlaon Natural Park 24,388.000 101,205.00 7 Central Cebu NP 11,893.580 7,945.00 Rajah Sikatuna PL 10,452.600 162,998.00 Olango Island WS 920.000 414,478.00 Guadalupe Mahugnao Hot Spring NP 57.500 14,660.00 Loboc WFR 19,410.000 100.00 Buhisan WFR 630.89 2,471.00 Chocolate Hills Natural Monument 14,145.000 200.00 Getafe Group of Islands Wilderness Area 7,243.780 1,000.00 Apo Island PLS 691.450 3,213,655.00 Camotes Island MSFR - 83,345.23 Calape Group of Island
Landscape/Seascape 629.950 100.00
Talibon Group of Islands PLS 6,456.87 4,028.00 Inabanga PLS - 1,000.00 Pres. Carlos P. Garcia PLS - 4,700.00 Ubay MSFR - 1,000.00 Wahig Inabanga River WFR - 181,525.85 8 Calbayog-Pan-As Hayiban PL 7,832.000 900.00 Guiuan PLS 60,448.000 10,000.00 Sohoton Natural Bridge NP 840.000 167,393.90 Lake Danao Natural Park 2,193.000 30,772.85 Taft Forest Philippine Eagle Wildlife
Sanctuary 3,728.980 2,000.00
Jicontol Natural Park 6,483.000 6,042.00 McArthur Landing Memorial Park 6.780 3,006.00 Bulusao WFR 4,055.000 1,000.00 Palompon WFR 2,392.000 1,400.00 Calbiga Caves PL 2,968.000 6,726.00 Mahagnao Volcano Natural Park 635.000 2,000.00 Hinabian-Lawigan Watershed PL 4,536.000 1,000.00 9 Jose Rizal Memorial PL 439.000 18,964.00
10 Initao-Libertad PLS 1,300.780 227,601.00 Mt. Kitanglad Range Natural Park 31,235.190 619,083.50 Mt. Malindang Natural Park 34,694.000 8,910.00
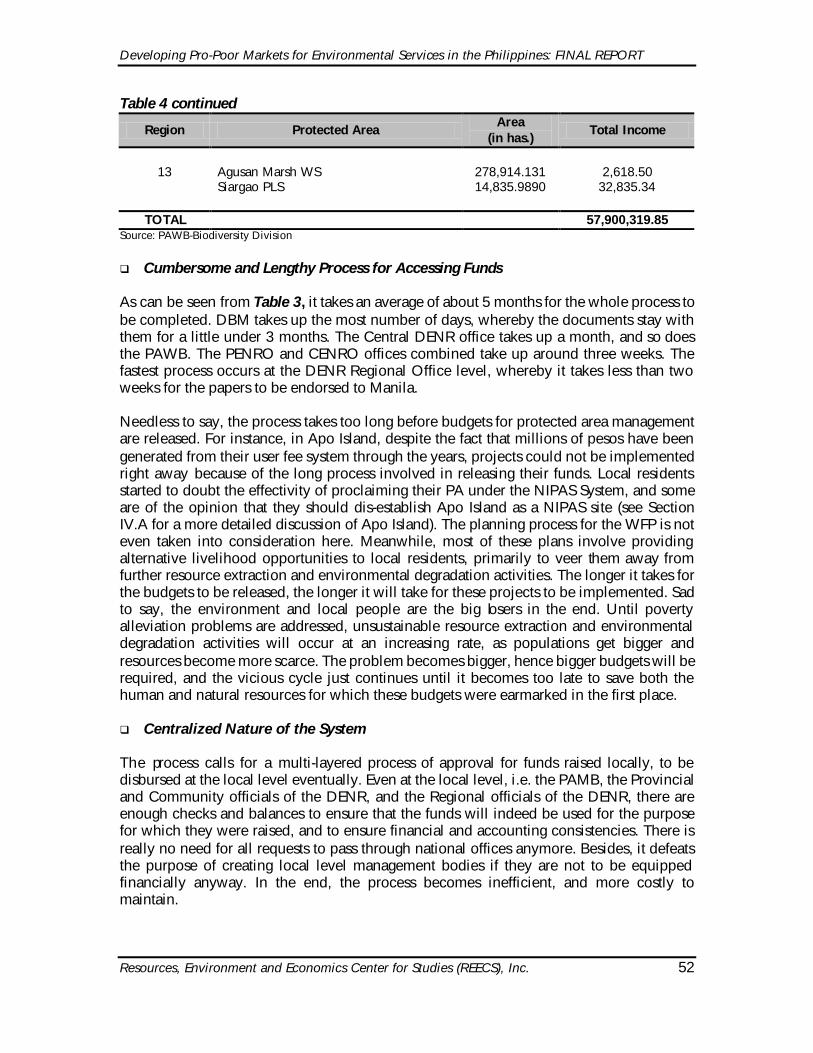
Developing Pro-Poor Markets for Environmental Services in the Philippines: FINAL REPORT
Resources, Environment and Economics Center for Studies (REECS), Inc. 52
Table 4 continued
Region Protected Area Area
(in has.) Total Income
13 Agusan Marsh WS 278,914.131 2,618.50 Siargao PLS 14,835.9890 32,835.34
TOTAL 57,900,319.85 Source: PAWB-Biodiversity Division
q Cumbersome and Lengthy Process for Accessing Funds
As can be seen from Table 3, it takes an average of about 5 months for the whole process to be completed. DBM takes up the most number of days, whereby the documents stay with them for a little under 3 months. The Central DENR office takes up a month, and so does the PAWB. The PENRO and CENRO offices combined take up around three weeks. The fastest process occurs at the DENR Regional Office level, whereby it takes less than two weeks for the papers to be endorsed to Manila.
Needless to say, the process takes too long before budgets for protected area management are released. For instance, in Apo Island, despite the fact that millions of pesos have been generated from their user fee system through the years, projects could not be implemented right away because of the long process involved in releasing their funds. Local residents started to doubt the effectivity of proclaiming their PA under the NIPAS System, and some are of the opinion that they should dis-establish Apo Island as a NIPAS site (see Section IV.A for a more detailed discussion of Apo Island). The planning process for the WFP is not even taken into consideration here. Meanwhile, most of these plans involve providing alternative livelihood opportunities to local residents, primarily to veer them away from further resource extraction and environmental degradation activities. The longer it takes for the budgets to be released, the longer it will take for these projects to be implemented. Sad to say, the environment and local people are the big losers in the end. Until poverty alleviation problems are addressed, unsustainable resource extraction and environmental degradation activities will occur at an increasing rate, as populations get bigger and resources become more scarce. The problem becomes bigger, hence bigger budgets will be required, and the vicious cycle just continues until it becomes too late to save both the human and natural resources for which these budgets were earmarked in the first place.
q Centralized Nature of the System The process calls for a multi-layered process of approval for funds raised locally, to be disbursed at the local level eventually. Even at the local level, i.e. the PAMB, the Provincial and Community officials of the DENR, and the Regional officials of the DENR, there are enough checks and balances to ensure that the funds will indeed be used for the purpose for which they were raised, and to ensure financial and accounting consistencies. There is really no need for all requests to pass through national offices anymore. Besides, it defeats the purpose of creating local level management bodies if they are not to be equipped financially anyway. In the end, the process becomes inefficient, and more costly to maintain.

Developing Pro-Poor Markets for Environmental Services in the Philippines: FINAL REPORT
Resources, Environment and Economics Center for Studies (REECS), Inc. 53
3.1.6 Potential Solutions on Issues Regarding NIPAS Act Implementation Based on the current situation and the clamor of protected areas under the NIPAS System for a more efficient process to be put in place, the following options are presented for consideration of the DENR and the DBM. Remove the DENR Central Office from the Approval Process
The first option that can be taken is to lessen the offices in Manila that the budget requests go through. Within the whole DENR system, there are more than enough checks and balances to ensure that the WFP is well within the framework for sustainable development, and that the budget requests are consistent with those of the various levels of government, i.e. from municipal, to provincial, to regional, to national. It is thus suggested that the first level to be removed would be the Central DENR Office. An interview with Dir. Erlinda Meram of the Financial and Management Service Bureau was conducted last Aug. 16, 2002. She was in fact of the opinion that such budget requests should not go through her office anymore, and that the DENR Secretary’s office should not be involved anymore as well. On the average, this can shorten the process by a month.
This step, however, can be fulfilled only upon the reversal of a Memorandum issued by the DBM last August 23, 1999, which states that all budget requests from special allotment funds should be made directly by the Secretary of the Department concerned (see Appendix D). Given that the DBM issued the Memo, it will need the DBM itself to reverse the order. Transform the Role of PAWB into a Monitoring Body An additional step could be to remove the PAWB from the approval process, and leave the DENR Regional Office to transmit the requests to DBM. However, PAWB should still be furnished copies of all requests, along with the attachments, for monitoring purposes. They could strengthen their role in the monitoring process, while delegating their endorsement function to the Regional Offices. This should not prove to be difficult, given that the Regional Offices are already involved anyway. Again, this can shorten the process by another month, on the average.
During the interview with PAWB personnel, the Chief of the Administrative Division expressed apprehension on removing the PAWB from the IPAF approval process. This is understandable, given that there is really a need for a body that can oversee the whole process in its entirety. To do so, a nationally-based office is needed. However, such an objective can be served through stricter monitoring, not necessarily by the office getting involved in the approval process. In this case, the PAWB is in the best position to act as an oversight body for the whole IPAF process. As such, it should continue its tight coordination with all protected areas under its jurisdiction. However, it should transform its functions that are geared more towards monitoring of the implementation of plans and programs, particularly those specified in the WFPs, rather than being part of the approval process. Hence, it should still be furnished copies of whatever documents are being submitted for endorsement and/or approval. And given that this option will free up time and personnel, such can be utilized for monitoring purposes.
Developing Pro-Poor Markets for Environmental Services in the Philippines: FINAL REPORT
Resources, Environment and Economics Center for Studies (REECS), Inc. 54
During the interview with the Chief of the PAWS Division of DENR Region III, the Division Chief expressed the need to lessen the involvement of Manila-based offices in the process. For one thing, they claimed they were in the best position to review WFPs, given their familiarity and their tighter coordination with the protected areas under their jurisdiction. Furthermore, the travel of documents from far-flung areas to Manila can eat up a lot of time, further delaying the process of budget releases. They, however, subscribe to the idea that PAWB should still play a major role, albeit more as a monitoring body rather than one that they need to seek approval from ex-ante. Delegate the Central DBM Functions to DBM Regional Offices Another major step that can be taken to shorten the process is to delegate the actual release of the funds to the respective DBM Regional Offices. In this case, the DENR Regional Office can go straight to the DBM Regional Office, thus shortening not only the travel time of documents but also the accounting component of the process. According to the interview conducted with DBM personnel, Central Office people are overloaded with work, thus explaining the length of time the documents take at their department. It would well be within the jurisdiction of the Central Office to delegate to their Regional Offices, given the decentralization and devolution thrusts of the Philippine government. Again, the Central Office would still be involved through monitoring schemes, but not necessarily through the approval process. This will ease up the delays in release of funds, but will not sacrifice the oversight function of the national offices through stricter monitoring activities. In doing so, the process can probably be shortened by another month or so, depending on the speed of the Regional Offices in acting on IPAF requests.
Figure 3 contains the proposed process of flow of documents and the potential decrease in the number of days for the whole process to be completed.

Developing Pro-Poor Markets for Environmental Services in the Philippines: FINAL REPORT
Resources, Environment and Economics Center for Studies (REECS), Inc. 55
Figure 3 Proposed Administrative Flowchart of IPAF Process
CENRO and
PENRO
Check for: • Completeness • Accuracy of financial
statements/trial balance
DENR Regional Office
Budget Division Check for completeness, accuracy of F/S
PROTECTED AREA
Finance Division Trial balance
PAWS DivisionCheck for completeness, accuracy of WFP
ARED for Operations
RED
Prepare the following documents: • Work and financial plan • Financial statements • Certification of funds deposited
DBM Regional Office

Developing Pro-Poor Markets for Environmental Services in the Philippines: FINAL REPORT
Resources, Environment and Economics Center for Studies (REECS), Inc. 56
Build Capacity on Negotiating The idea of a well-represented management body definitely paves the way for an efficient process of meeting the needs of environmental service providers. However, mere attendance does not ensure such an outcome. If local residents and non-government people will not be able to articulate their views and ideas, then their presence is futile. It is strongly suggested that part of the priorities of the PAMB is to increase the capacity of its members, particularly representatives of marginalized sectors, to negotiate effectively. This will ensure that the democratic process that is being introduced in PAMB membership seeps down to the substantive level of discussions and operations of the body. Rationalize Laws Affecting PA Management and Responsibilities of All Government Bodies Involved The presence of so many laws regulating the environment and natural resources has caused inefficiencies in the process of implementing the NIPAS Act. As mentioned earlier, conflicting provisions exist among the Local Government Code, the NIPAS Act, the Water Code (which contains the provision stating the National Water Resources Board as the sole agency that can issue water use rights), and the Forestry Code (which allows DENR to collect forest charges). Rationalizing all these laws through legal amendments is ideal, yet may take some time before they take effect. In the meantime, one possible solution is for PAMBs and national government agencies to come up with tentative agreements on how to delineate roles and responsibilities on a per site basis. In other words, it might be difficult to come up with specific agreements at the national level that will apply to all sites. Rather, each site, depending on the various stages of organization of the PAMBs, can come up with their own set of agreements, delineating each stakeholder’s role for all resources found within their area. For instance, in some areas where the LGU has a strong presence and is very active in protection activities, the local government head can be given a co-chairperson position in the PAMB15. A broad set of guidelines can be issued by each national government agency involved, which should be coordinated among themselves first. Create Flexibility in Determining Membership of PAMB The delineation of an area into a protected area mainly depends on the natural configuration of its resources. Geological and ecological factors come into play. Hence, it is difficult to pin down a specific number of members that can truly represent all stakeholders involved in PA management. Some areas such as Mt. Apo in Davao have demonstrated that PAMB membership can grow into as big as 250 members. But because of the sheer size, it is very difficult for them to meet regularly, further delaying discussions and agreements on pending issues. For areas such as Mt. Apo, the PAMB should be flexible enough to create smaller groups that can be given jurisdiction on smaller areas within the PA. The extent of autonomy for these smaller groups will be on a case-to-case basis, depending on the nature of the issues to be resolved, and the capacity of the groups to act accordingly.
15 The NIPAS Act specifies the DENR Regional Director as chairperson of the PAMB.
Developing Pro-Poor Markets for Environmental Services in the Philippines: FINAL REPORT
Resources, Environment and Economics Center for Studies (REECS), Inc. 57
3.1.7 Conclusion The whole concept of the IPAF is a new system, although the law had been passed ten years ago. It took time for protected areas under the system to be able to generate revenues on their own, a very much expected occurrence because of the traditional dependence on the national government for local budgets and funds. On the other hand, national government offices are still grappling with the idea of letting go of major functions to local government entities, functions that have been traditionally and solely performed at the national level. The Philippines has been undergoing birth pains with respect to devolution and decentralization for the past decade, and as expected, there were certain abuses and lack of foresight that were committed along the way. Some Departments have responded by regaining control of certain functions, while some have increased the layers in the bureaucracy for ensuring check and balance. The IPAF is no exception to this. The concept is groundbreaking for the country in a way, whereby 75% of revenues generated from protected areas shall directly go to the area’s management and protection. Experiences on IPAF requests have been very new and far too few. Only those that have actually been able to generate their own revenues have had such experiences. It can actually be inferred that such PAs are the more advanced ones at least in terms of PA management, thus one would expect them to be able to implement their programs and projects in an equally efficient manner. There lies the hope of sustaining economic development without sacrificing environmental and natural resources management. However, releases of their budgets have been bogged down by the long process and numerous signatures involved. As such, delays in implementing their WFPs have been long and drawn out. The options in this report are meant to ensure that such efficiency is not hampered by circumstances that are not under the control of the PA management bodies. It is hoped that efficiency does not get penalized in the process because of fears of unscrupulous local managers getting the better of the national government. If at all, such efficiency should even be rewarded, to serve as incentives for others to emulate. The answer lies in stricter monitoring procedures and a stronger penalty system for would-be violators and abusive PA managers. 3.2 Balian, Pangil, Laguna: A Case Study on Watershed Protection by a Community-
Based Organization 3.2.1 The Study Site16 Balian is a barangay (or village) located in the municipality of Pangil, province of Laguna. The area is approximately 90 kms. south of Manila, and Laguna is one of four provinces that are being advertised as alternative industrial centers to Manila. The municipality is located on the northeastern part of the province, with the Sierra Madre Mountain Range bordering both the east and the west. Figure 4 shows the location map of Pangil, Laguna.
16 Based on Jacinto, E. Care for Nature Group: A Case Study of a Community Organization for Watershed
Rehabilitation. 2001.

Developing Pro-Poor Markets for Environmental Services in the Philippines: FINAL REPORT
Resources, Environment and Economics Center for Studies (REECS), Inc. 58
Figure 4 Location Map of Balian, Pangil, Laguna
Source: Lingap Kalikasan.
Developing Pro-Poor Markets for Environmental Services in the Philippines: FINAL REPORT
Resources, Environment and Economics Center for Studies (REECS), Inc. 59
There are approximately 500 families living in Balian. Farming is the main source of livelihood. Farms owned through inheritance are mostly planted with fruit-bearing trees, while the smaller farms are planted mostly with rice. Labor wage is around $2 per day. Most of the area is declared as alienable and disposable, i.e. can be bought and sold. In the past, these farmlands were subdivided into small lots and were given tax declaration certificates. These in turn were used to issue land titles to the land owners. 3.2.2 Historical Background17 In 1925, long before it became fashionable for people to organize themselves for environmental issues, the people of Balian mobilized themselves to tap water from upland streams and rivers for their domestic water supply. They formed an organization called Samahan ng Bailan Para Sa Pagpapauwi ng Tubig Inumin (SBPTI), which literally means Organization of Balian for Providing Drinking Water. The organization took care of building and maintaining their crude water pipes carved out of bamboo poles which ran from an identified water source upstream, and ensured that water reached every household within its jurisdiction. It was based on the principle of self-help, and is purely voluntary in nature. All residents of the community are automatic members, and any project that concerns water is supposedly coordinated with them. Part of the upstream area surrounding Pangil and Balian was logged over in the 1960s and 1970s, and later into upland agricultural plots. The logging concession was owned by a company called Interwood, short for International Hardwood and Veneer Company. It was established in Pangil under the administration of an American named Mr. Hill. Figure 5 shows the total logging concession of Interwood.
17 Tolentino, L.L., R.F. Plopino and E.D.V. Jacinto. 2002. Creating Space for Local Forest Management in Balian,
Pangil, Laguna. Research Report Funded by Center for International Forestry Research. Department of Agricultural Education and Rural Studies. UP Los Baños, College, Laguna, Philippines.
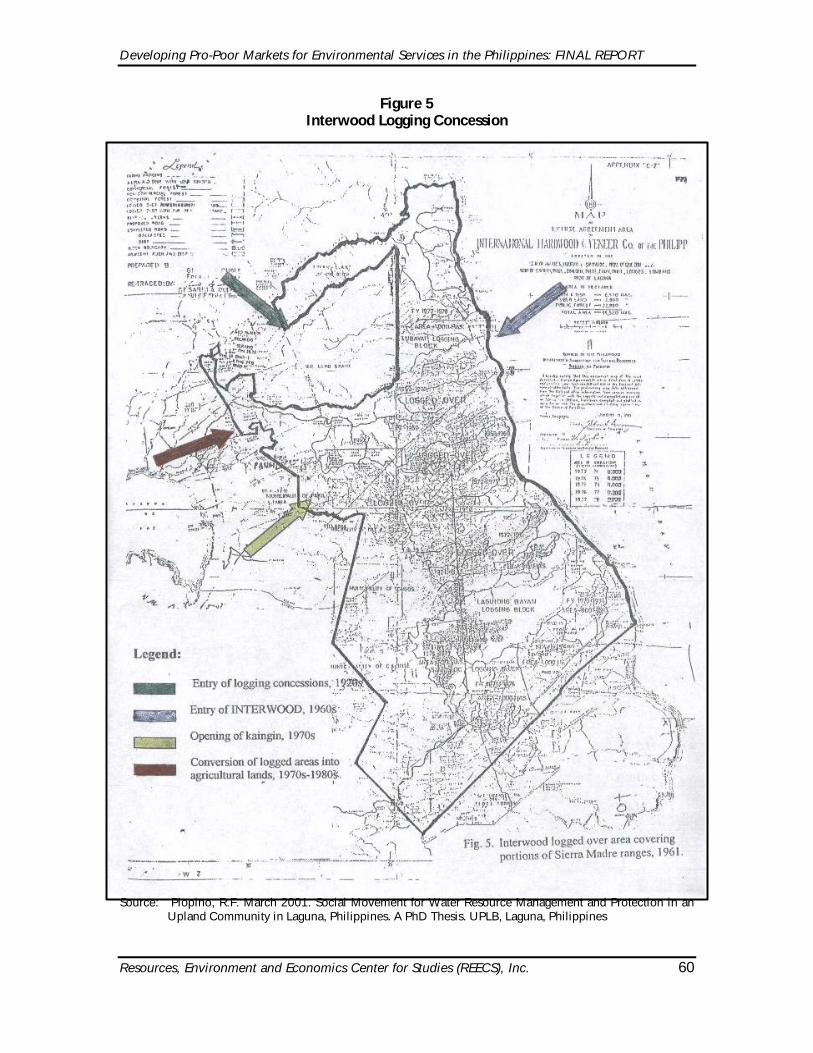
Developing Pro-Poor Markets for Environmental Services in the Philippines: FINAL REPORT
Resources, Environment and Economics Center for Studies (REECS), Inc. 60
Figure 5 Interwood Logging Concession
Source: Plopino, R.F. March 2001. Social Movement for Water Resource Management and Protection in an
Upland Community in Laguna, Philippines. A PhD Thesis. UPLB, Laguna, Philippines

Developing Pro-Poor Markets for Environmental Services in the Philippines: FINAL REPORT
Resources, Environment and Economics Center for Studies (REECS), Inc. 61
During the American occupation (the first half of the 20th century), forest exploitation was introduced in the country, and logs and lumber were continually exported until the Americans left. Up until 1975, the country’s forest regulations were based totally on the Forest Act of the US. In the 1960s, shortly after the Americans left, logging was introduced in the forests of Pangil. It was issued a Timber License Agreement (TLA) in Jan. 1961 by the Philippine government, which allowed it to cut timber in Pangil, as well as in 4 other municipalities in Laguna province, and 3 municipalities in Quezon province. The TLA should have expired in 1983, but was suspended in 1978 when Martial Law was still in place. They got a lifting of the suspension in 1985, and continued to operate in the area until their permit expired in 1986. They applied for an extension, however this did not cover Pangil anymore, rather was limited to two municipalities in Quezon province. After the logging concession denuded the forest of hardwood trees, small-scale loggers and charcoal makers continued cutting of secondary growth trees. Slash and burn farmers likewise encroached into the area through the years. Carabao grazers grew in number, contributing to soil erosion and siltation. All of these contributed to the denudation of the Balian watershed. There was nothing in the literature that suggested that the organization protested the presence of the logging concessionaire in their area. Most probably, this was because during that time, water supply was constant and water quality did not deteriorate. During the late 1980s, however, local residents started noticing water being less abundant. Whereas prior to this period water continued to flow 24 hours a day, they started noticing that water would not be available during certain times of the day, particularly during the summer months. Furthermore, during rainy seasons, the Dakil River which is located in the lower portion of Balian began to flood more often, and floodwaters were more muddy than before. Landslides started to occur, and the climate was not as cool prior to the time when the watershed started losing its trees. Finally, the waterfalls in the area was not as abundant in its water supply anymore. Thus, it was only in the late 1980s when there was a resurgence of initiative among the SBPTI members. Along with some local and national government officials, SBPTI started discussing how they could solve their dwindling water supply problem. They then took matters into their own hands and passed a resolution asking the municipal government to declare a 50-meter radius from all water sources as protected. DENR went further and suggested that they increase the boundary to a 100-meter radius around the water source. The provincial government finally declared a 100-meter radius around all water sources as protected (see Appendix E). Soon after the declaration of the protected area, the residents discovered that SBPTI had no mandate to protect the watershed. The TOR of the organization was only in the management of the water system of its residents. Upon consultations with all stakeholders involved, they decided to form an umbrella organization that could serve such a mandate. It was later called Lingap Kalikasan (LK), or Care for Nature. LK developed a conservation plan which led to reforestation activities in the area.

Developing Pro-Poor Markets for Environmental Services in the Philippines: FINAL REPORT
Resources, Environment and Economics Center for Studies (REECS), Inc. 62
3.2.3 Current Operations Protection Activities for Water Sources A major activity of the LK is to look for water sources within the watershed that could be connected to their water supply system. In addition to the existing source which was discovered way back in 1925 when SBPTI was founded, they were able to identify an additional source, which was automatically covered within the Municipal Ordinance proclaiming all water sources as protected (see Appendix E). In establishing the 100-meter radius around these sources, the LK found out that all the surrounding lot areas were privately-owned, including the areas where the water sources were located. However, these land owners did not reside in the area, and thus were considered as “absentee landlords”. Many of them hardly visited nor used their land for their own productive purposes. This posed as a problem both for the LK and the landowners, particularly in protecting these areas against environmentally damaging activities such as small-scale logging, slash and burn farming, illegal encroachment and carabao grazing. In response to these problems, the LK came up with a program that required an agreement with the land owners to establish boundaries around their lot areas by planting trees18, which could serve as communal fences. They identified the landowners and have approached some of them individually. Funds for the seedlings and monitoring activities were either provided by the LK members themselves or from donations from the local government, thus the landowners did not have to spend for the program. The boundaries further served the latter’s interests because prior to the program, there was no systematic method of delineating their land, except for what is termed as “living boundaries”, i.e. the existing trees, which were few and far between, served as boundaries. The LK-planted trees were closer to each other, and were uniformly arranged so that the boundaries were obvious. The trees were also part of an agroforestry scheme, part of the proceeds of which went to the landowners. Finally, because the LK conducted periodic monitoring activities, the boundaries were able to serve as deterrents against illegal migrants from neighboring areas. To get the upland residents to participate in the program, the trees were pruned vertically and the branches served as fuelwood for the residents and erosion control devices. The agroforestry scheme also provided alternative livelihood opportunities to the residents. For the carabao grazers, the LK was able to get their participation, including their carabaos’ and their own labor in the scheme. In exchange for these, the LK promised not to report them to the municipal government for violating an existing Ordinance preventing carabao grazing in the upland areas19.
18 The choice of trees to plant was made in consultation with agroforestry, forestry and hydrology experts
working at the University of the Philippines in Los Banos, Laguna. 19 The municipal LGU of Pangil, Laguna has an existing Ordinance declaring carabao grazing in upland areas as
illegal. This is due to the fact that most lands in the upland areas are privately owned. Furthermore, there is the implicit recognition of the environmentally damaging effects of carabao grazing such as soil erosion, because there is no exception to this Ordinance, even if private landowners agree to carabao grazing within their lands.

Developing Pro-Poor Markets for Environmental Services in the Philippines: FINAL REPORT
Resources, Environment and Economics Center for Studies (REECS), Inc. 63
Meanwhile, the municipal local government of Pangil has been very supportive of the program, mainly because the LK took care of the monitoring and enforcement component of their Ordinance, activities which the municipal LGU itself should be conducting. In fact, part of the penalty system of the LGU is to have offenders of certain crimes pay by participating in tree-planting activities of the LK. Hence, the LK turned out to be the de facto management body of the watershed of Balian. The municipal LGU has recognized this in their periodic discussions and meetings regarding the watershed, and has consistently awarded the LK annually with trophies, in recognition of their protection activities for the Balian watershed. Be that as it may, the LK is still working it out that a Municipal Resolution be passed, stating that the LK is the designated body assigned to protect the Balian watershed. This would strengthen their role as the managers of the watershed, and would give them legal teeth in conducting their programs and projects. Much work remains to be done. The LK claims they have only covered roughly 40% of the total land area surrounding their two existing water sources. They need to negotiate with the other landowners to complete their program on establishing buffer zones and reforest their watershed. To facilitate this, the LK is working hand in hand with the municipal LGU to get these landowners to sit down at the negotiating table. One of the identified landowners has even expressed his desire to change the existing land use, which is agricultural, and develop the area for industrial purposes (see Section 4.2). There is also the concern that should there be a change in government20, watershed protection might be accorded less priority by potentially unsupportive local officials in the future. At this point, the LK is only relying on its good relations with the incumbent officials, and on their track record. They have no legal mandate to serve as the managers of the watershed, which they intend to correct with the pending Resolution declaring them as the legal management body of the watershed (see above discussion). Organizational Meetings
The people of Balian recognize the importance of the watershed as a planning unit. Because the watershed is the basis of unity, they are able to tackle other downstream issues, such as soil erosion, sedimentation, flooding, irrigation, and solid waste and connect such issues to watershed management and protection. Thus, organizational meetings serve as a venue for comprehensive planning and management of the area.
Conflict resolution is done through constant dialogue and discussions among community members. Furthermore, they conduct major discussions during Holy Thursday of the Lenten Holy Week. Not only does the season set the tone for reconciliation, also community members are at rest during that day and the following day as well.
Maintenance of the Water Supply System The SBPTI continues to exist as part of the LK, with its main TOR being limited to maintaining the water supply system of Balian. Some of the bamboo pipes have been replaced with rubber pipes through the years. However, there are still portions of the water supply system that rely on bamboo pipes. Carabao grazing and increased population in the
20 Local elections occur every three years, and elected officials can only serve up to a maximum of three
consecutive terms.

Developing Pro-Poor Markets for Environmental Services in the Philippines: FINAL REPORT
Resources, Environment and Economics Center for Studies (REECS), Inc. 64
upland areas have periodically caused these pipes to break, thus affecting the water supply of residents below. In order to ensure the continuous supply of water for all its residents, SBPTI continually conducts monitoring and rehabilitation activities, the latter usually involving replacement of torn or worn-out water pipes. Furthermore, SBPTI regularly conducts cleaning activities for the intake tanks, which are located near the water source. Such activities necessarily entail raw material costs. To pay for such materials used in maintaining the system, the SBPTI now charges PhP 15 per household per month as water supply fees. Collection of fees started only in the 1990s, at a low rate of PhP 5 per household per month. The fee, however, is only to cover for the cost of the raw materials, not to account for the price of raw water per se. Still, the revenues generated are not enough to cover for all material expenses. Rather, the organization depends on donations from the municipal and barangay government units and from wealthy landowners in the area to augment the material and equipment needs for the water supply system. Labor for planting, water system repairs and maintenance is free, as members of the SBPTI maintain the water system themselves.
3.2.4 Institutional and Resource Use Conflicts
Conflict with the Barangay LGU on Managing the Water Supply System The passage of the Local Government Code of 1991 provided local governments with the power to raise revenues over all resources within its jurisdiction. Water became a point of interest, and the Barangay Council of Balian started intervening in domestic water supply provision. Projects were being implemented without consulting the local organization, and worse, some of these projects were redundant in nature. For instance, upon the initiative of the national government, a reservoir was built in exactly the same location where one already existed, courtesy of SBPTI. The new system could not be operated after construction, and the Barangay Council wanted to turn the management over to SBPTI. When the latter refused, the Barangay Council tried to take over the leadership of the organization. It failed to do so, hence the community is still relying on the old system they themselves set up. More importantly, the SBPTI has maintained control over its watershed and water supply system. And because the organization seeps deeply into the way of life of the people in the area, local governments end up deferring to the organization in the end.
Land Use Conflicts With A Private Landowner A Taiwanese company is interested in putting up a mineral water processing plant in the upland portion of Balian. The spring source is located within private land, which the LK has identified as another major source for its water supply. If the landowner decides to sell to the Taiwanese company, the LK’s activities will be greatly affected. Not only will they have wasted time and effort since they have already identified this as one of their water sources and have started work in establishing boundaries therefore. More importantly, there is the threat that the increased demand for water for industrial purposes will create negative impacts on the whole community’s water supply. To resolve this, the LK, together with the municipal LGU, have been lobbying hard to claim ownership over the rights to use the water, based on constitutional provisions on water being owned by the State. If they are able to convince the landowner that they do possess these rights and that they intend to exercise them, they are hoping that the landowner will eventually stop entertaining the idea of selling to the mineral water company. The landowner has not made any decision yet on
Developing Pro-Poor Markets for Environmental Services in the Philippines: FINAL REPORT
Resources, Environment and Economics Center for Studies (REECS), Inc. 65
whether to deal with the company or with LK. Another tact they are looking at is to buy the land from the owner, so that the LK, i.e. the whole community, can own the spring source as well. They are negotiating for a lower price, however, and the owner is still taking his time to decide on this issue as well. Should this occur, they will declare the area as a watershed sanctuary, and commercial interests will not be allowed to tap into the area.
Destructive Economic Activity: Carabao Grazing Another source of conflict is the presence of carabao grazers in the grasslands of the watershed. In searching for grassy areas, there are some instances where carabaos accidentally step on the pipelines, thereby halting the supply of water to some households. SBPTI has tried to investigate on the identity of these farmers. Unfortunately, they have discovered that these carabao owners belong to neighboring municipalities, thus would be difficult to control and talk to. The best that the organization can do is to reach out to residents living in the uplands, and training them to be more vigilant in watching out for these carabao grazers.
The LK has likewise identified carabao grazing in the uplands as a source of soil erosion, and they are constantly trying to convince the grazers they have identified not to conduct their activities in the upland areas. One disincentive for these grazers is the presence of a Municipal Ordinance declaring carabao grazing in the uplands as illegal. The LK has promised not to squeal on the identified grazers provided they stop their activities in the uplands, and that they participate in the establishment of the 100-meter radius around the water sources of Balian.
Overlapping Jurisdiction With the Laguna Lake Development Authority A fourth source of conflict is with the Laguna Lake Development Authority (LLDA) which manages the body of water located beside Pangil, along with 26 other lakeshore municipalities, 22 non-lakeshore municipalities, and 12 cities. Laguna Lake is the body of water that catches all tributaries from the provinces of Rizal and Laguna, as well as portions of Cavite, Quezon, Batangas and Metro Manila. Upon delineation of boundaries to indicate the total area of their jurisdiction, the LLDA has placed some of their landmarks right smack in the middle of ricefields, some of which are being tilled by SBPTI members. The LLDA has further drafted development plans that will affect around 66% of agricultural areas in Balian, most of whom are members of the SBPTI. Meantime, these farmers are using water coming from the watershed for irrigation purposes, through the construction of manmade canals. Water from the river system is diverted from the main canal that goes to the Lake. Every six months, these farmers are required to maintain their irrigation canals themselves. Although the identified protected areas for the water sources of Balian do not overlap with the LLDA jurisdictional area, there is still some concern among the SBPTI members because they consider these affected farmlands as part of their watershed. The organization is currently working on delineating the boundaries of their watershed and will consequently have to negotiate with LLDA on how to resolve border conflicts.
Conflicts With an Intended Hydropower Plant
The National Power Corporation (NPC) had expressed interest in putting up a dam for a hydroelectric power plant project in the area. It was supposed to tap into some of Balian’s
Developing Pro-Poor Markets for Environmental Services in the Philippines: FINAL REPORT
Resources, Environment and Economics Center for Studies (REECS), Inc. 66
water sources, and some barangays were going to be “flushed out” or flooded. This did not push through, however, because when the residents demanded that the social amelioration package be based on present and future agricultural earnings of areas to be flooded, the government decided to back out.
Armed Rebels in the Area
Another issue the LK has had to contend with is the presence of the New People’s Army (NPA), the armed component of the Communist Party of the Philippines. The NPA has been waging a revolutionary struggle in the country for the past 4 decades. Pangil, Laguna is one of the areas they are operating in. For years, they have been trying to recruit members from the LK to strengthen their membership. However, the LK refuses to make it an organizational policy to provide them members, and has always left it to the individual members to join if they wish to. Because of this, the NPA has tried to sabotage the activities of the LK, and has been convincing upland residents not to support the LK’s programs and projects. Fortunately, the LK has its track record to speak for itself, and so far, most upland residents have been supportive of its activities for the watershed.
3.2.5 Potential for Developing Markets for Watershed Protection Service
The events that have transpired through the years show that resource use conflicts in the Balian watershed have posed threats to the sustainability of the watershed. And as economic theory would put it, resource use conflict can be minimized through the play of market forces and the pricing mechanism. Although there is no “financial exchange” to speak of yet, there is a quasi-market existing, to the extent that landowners upstream have negotiated with the LK to adopt improved land management practices. In return, their land is protected from migrants and illegal economic activities. The provision of alternative livelihood schemes has likewise taken place through the agroforestry scheme of the LK, the economic benefits from which are shared between the landowners and the local residents.
There is room for this market to further develop. For one, if the private landowner with the spring source decides to lease his land to the Taiwanese mineral water company, then the value of watershed protection services could be charged by the LK to the company, once they are legally mandated to maintain and rehabilitate the watershed. The owner could likewise internalize the cost in the rent, but this should be passed on to whomever is maintaining the watershed. The LK can get into an agreement with the landowner on this issue. It is critical, though, that the community gains formal rights to the use of water in the natural spring source. This will strengthen their management of their water supply even if they fail to own the land where the spring source is located, and will legally arm them to conduct their programs and projects for their watershed.
A second potential source would be the provision of water supply to neighboring villages. The LK can actually charge watershed protection service fees along with the cost of providing water to the barangays concerned. If they are able to delineate the watershed boundaries and negotiate successfully with LLDA, they can further charge LLDA for water supply that comes from their tributaries. Should the NPC hydropower plant push through in the future, the LK can also tap them as a potential buyer of water from the Balian watershed.
Developing Pro-Poor Markets for Environmental Services in the Philippines: FINAL REPORT
Resources, Environment and Economics Center for Studies (REECS), Inc. 67
The point of including this case study is to hypothesize that markets can easily be established if there are institutional mechanisms such as the LK and the SBPTI that are not only community-based, but are very much part of the culture of the population. Property rights, in a way, have been established because of the legal mandate of the LK to maintain and rehabilitate the watershed. Meanwhile, the SBPTI is in charge of maintaining the water supply system. And because all other problems downstream are seen to be directly connected with the watershed, the LK inadvertently applies a comprehensive and integrated approach in managing the watershed. Social acceptability will potentially be high, given that there is “ownership” of the organization by the community residents themselves. The only challenge remaining is to convince the residents to “sell” such services, which may prove to be a worthwhile task. Not only will it raise money for their organization, it may even serve as an alternative livelihood scheme for slash and burn farmers that still exist in the area.
3.2.6 Lessons Learned The following points highlight the lessons learned from the continuing success of the institutional set-up of the LK and the SBPTI in protecting their watershed:
Communal Ownership of the Managing Institution
The formation of both the SBPTI and the LK was initiated by the community residents themselves. Government had nothing to do with setting them up. NGOs who have worked in the area likewise attest to the pure or unadulterated characteristic of these organizations, such that their growth was purely determined by internal dynamics, and was not forced upon them by outside influence. Thus, residents have always “owned” the organizations, and have always felt they had a major stake in the organizations’ programs and projects. Because of this sense of ownership, commitment to their activities is very high, further ensuring the success and growth of the organizations.
Use of Cultural Traditions in the Organizations’ Operations
In relation to the above, because the residents themselves were operating the organizations, it was very natural for them to use their own traditions in ensuring the smooth flow of operations. The “bayanihan” tradition is still very strong in them, wherein the concept of giving free labor to help out neighbors is done willingly and voluntarily. Hence, in planning for and implementing their watershed protection activities, it was so natural for the members to give their time and labor for free, without letting their individual opportunity costs get in the way. In a way, this can roughly be interpreted to mean that the value they attach to the watershed is higher than their individual opportunity costs. Also, the intense religiosity of Filipinos was taken advantage of. Conflict resolutions were done during Holy Week, a time when Filipinos seriously take stock of themselves and become very humble and willing to change for the better.
High Environmental Awareness of the Community
The continuing success of the LK can be rooted in the recognition of the members themselves of the watershed’s environmental services. One of the LK’s major tasks is to implement a continuing information and education campaign on the benefits of protecting
Developing Pro-Poor Markets for Environmental Services in the Philippines: FINAL REPORT
Resources, Environment and Economics Center for Studies (REECS), Inc. 68
the watershed among the residents of Balian. They have always emphasized that constant dialogues and lectures with their constituents cannot be compromised, and even the lack of funds for meetings and transportation has not deterred them from this self-imposed duty. They raise the money themselves, or sometimes request the attendees to provide counterpart funds for their transportation and food. Residents usually respond positively, because of the importance they put on ensuring constant water supply and acceptable water quality for their households and their farms.
Mobilization of Stakeholders in Implementing Protection Activities
The LK does not limit its workforce to its membership. Rather, it mobilizes other residents who are non-LK members to participate, such as the use of the carabao grazers to assist in the establishment of tree boundaries for their water sources, or the use of other residents to participate in periodic monitoring activities. They assign monitoring schedules to the various geographical sub-units within Balian. This indirectly ensures the success of such projects because these residents will have a sense of ownership of the project once they participate in it, and will think twice before letting the project fail. Even petty criminals are mobilized through the penalty system established by the LGU, whereby would-be offenders of certain crimes are required to participate in the LK’s tree planting as payment for their crimes.
Sharing of Benefits From Watershed Protection Activities
The LK recognizes the fact that in order to attract conflicting stakeholders to negotiate, they will have to provide incentives for them to do so. Thus, it is very clear in their programs that each stakeholder involved will have a share of the benefits therefrom. Landowners, farmers, upland and lowland residents alike are made aware of what benefits they can reap from the program, which are not limited to provision of water supply and improved water quality. Rather, there are direct financial benefits for those whose livelihoods are affected, and there are protection benefits for landowners whose security of land ownership are threatened.
High Credibility Rating for the LK
Because the LK members do not themselves benefit individually, they have established a good track record whereby their one and only concern is the protection of the watershed. As a consequence, they continue to enjoy the high moral ground which allows them to implement their projects with the acceptance and approval of the community. The municipal government has recognized this and has been very appreciative of the LK’s initiatives, as evidenced by the annual trophy the LGU awards to the LK for watershed protection, and its direct participation in some of LK’s activities such as negotiating with landowners in the protected areas. It is stated in numerous laws that watershed protection is government’s responsibility. Due to the initiatives of the LK, the LGU is actually relieved of some of its functions, which allows them to focus on other concerns. This has led to the smooth relations between the LK and the municipal government. There is of course the concern mentioned earlier that a change in leadership might cause watershed protection to be less of a priority, depending on the agenda of the new leadership. Nevertheless, the LK has a long history to prove itself and its objectives, and this cannot be discounted easily by any “unfriendly” official that might take over.

Developing Pro-Poor Markets for Environmental Services in the Philippines: FINAL REPORT
Resources, Environment and Economics Center for Studies (REECS), Inc. 69
Additional evidence of the LK’s successes is the fact that the neighboring barangays have been clamoring for the LK to expand their operations to cover the whole municipality. The municipal government has likewise hinted for other barangays to come up with their own organizations similar to the set-up of the LK. This further proves that the LK is indeed enjoying a high credibility rating among its residents and its neighbors.
Constant Monitoring Activities by LK and SBPTI Members
One of the main criticisms of program implementation in the Philippines is the lack of emphasis given to monitoring and evaluation activities. The LK has deviated from this trend, and has proven their worth by constantly monitoring their watershed. Even without any breakages in their pipe system, LK and SBPTI members stick to a schedule of visiting their project sites, and reporting any anomalies found therein. They are thus constantly informed of any potential or actual problem within the watershed, allowing them to troubleshoot right away and prevent the problem from getting worse.
Developing Pro-Poor Markets for Environmental Services in the Philippines: FINAL REPORT
Resources, Environment and Economics Center for Studies (REECS), Inc. 70
4. SOCIO-ECONOMIC FRAMEWORK FOR EVALUATING AND MONITORING MARKETS FOR ENVIRONMENTAL SERVICES
The characteristic of the environment and natural resources (ENR) sector in the Philippines is that most of these critical and significant areas are owned or managed by the government. As such, the emergence of markets for environmental services necessitates the government to play a major role. As discussed in Section III, protected areas are numerous, and most of them fall under the purview of the national and local governments. It is thus not surprising that many of these markets are directly created by law, through the introduction of varying economic instruments. The socio-economic framework used for evaluating markets for environmental services is hinged on the following main questions: a. What are the forms of markets that exist? What are the economic instruments used? b. Do these markets target conservation and development objectives simultaneously, or
are they exclusive to the environment? If the former is true, what mechanisms are involved to ensure this?
c. Are there actual or potential social costs involved in the creation of these markets? Or are there social benefits that may or have inadvertently arisen out of the creation of these markets?
Because of the nascent feature of markets for environmental services in the Philippines, quantitative measurement of their impacts is difficult to pursue at this point. Most economic instruments have been introduced only during the past three years, including the set-up of the institutional mechanisms for these instruments. For others that were introduced earlier, such as the second case study presented here, there has not been enough experience for socio-economic impacts to have taken place and be quantified. Analysis is thus limited to potential impacts, particularly with respect to strategies and programs for which the economic instruments were created for. In testing the framework, the study relied mainly on key informant interviews. Most of these were the main actors involved in the creation and implementation of the economic instruments, thus have a good grasp of the historical events and the issues at hand. Survey questions dealt with economic, social, legal, institutional and biophysical factors, where applicable. Economic questions focused on the economic instrument being employed, the revenues generated from the scheme, the types of programs for which the revenues were intended for, and employment and income generation potentials from both the instrument and the programs. The survey tried to establish if revenues generated were being used for social development goals, aside from trying to meet environmental objectives. Biophysical questions dealt more on the potential or realized effects of the instrument on biodiversity, albeit in a qualitative manner. Social questions attempted to see whether there were social displacements, including those relating to traditions and norms, that may have occurred due to the application of the instrument, or in the first case study, even from the general set-up of how the PA is being managed. Legal and institutional factors were more descriptive in nature, whereby questions focused on the legal environment which allowed for the instrument to be created, and the corresponding institutional set-up for its implementation.
Developing Pro-Poor Markets for Environmental Services in the Philippines: FINAL REPORT
Resources, Environment and Economics Center for Studies (REECS), Inc. 71
Two case studies are presented here. The first deals with a protected area (PA) under the NIPAS System, the Apo Island Protected Landscape and Seascape (AIPLAS), a marine sanctuary that was formerly managed by the local government, and is now under PAMB management. It is by far considered one of the most successful PAs in the country, as far as biodiversity conservation and revenue generation are concerned. Various ecological studies have cited the success in preserving the ecological balance and natural beauty of the sanctuary. Zones have been created to accommodate various economic activities, such as scuba diving and fishing. The management board collects entrance fees from scuba divers, generating a substantial amount of revenues over the years. The case study looks at whether such revenues are being ploughed back to the community, either for improving standard of living, or for ecological enhancement of the reef and its resources. The second case study looks at the Reforestation, Watershed Management, Health and/or Environment Enhancement Fund (RWMHEEF) being managed by the Department of Energy (DOE). The Fund was set up as part of the “social responsibility” mandate of the DOE, whereby communities hosting energy projects are somehow compensated. From the very name of the Fund, environmental and social objectives seem to underlie the rationale for its creation. Since the fee’s imposition in the mid-1990s, there has been no documentation on whether the funds have indeed been used for watershed rehabilitation in areas affected by energy projects. The study attempts to determine whether this scheme constitutes a market for watershed protection services, and whether an interplay between environment and development objectives exists. 4.1 Apo Island Protected Landscape and Seascape (AIPLAS) Apo Island Protected Landscape and Seascape (AIPLAS) is located in the municipality of Dauin, province of Negros Oriental. It was declared a protected area in 1994 through a Presidential Proclamation by then Pres. Fidel V. Ramos (see Appendix F ). Shortly thereafter, it was declared as a NIPAS site and a Protected Area Management Board (PAMB) was formed for managing the area (see Section III.A of this paper). 4.1.1 Description of the Study Area Apo Island lies in the middle of the Mindanao Sea, off the southeastern coast of Negros Island, Central Philippines21. The island itself is very small, being only 74 has. in size. The highest peak is 200 m. high, which is located in the northern side, while the southern side is characterized by low-lying hills. The rest of the island is generally flat to sloping. The coastline is made up of steep, rocky cliffs and five small white sand beaches. There are two small shallow lagoons with mangroves in the southeastern side. A narrow but highly diverse fringing coral reef surrounds the island. It is dominated by steep drop-offs and gradually sloping drops of 20 to 40o decline. The most extensive live corals are located in the eastern and southeastern portions of the reef, with much of its growth supported by volcanic rock boulders22.
21 Reboton, C. Apo Island, Dauin, Negros Oriental. Silliman University Marine Laboratory, Dumaguete City,
Negros Oriental. 22 Reboton, C.
Developing Pro-Poor Markets for Environmental Services in the Philippines: FINAL REPORT
Resources, Environment and Economics Center for Studies (REECS), Inc. 72
Monsoon winds affect wave action as well as fishing activities around the island23. The northeast monsoon occurs during November to March or April, which makes fishing difficult at the northeast reef, but at the same time provides ideal yet challenging conditions for scuba diving. On the other hand, the southwest monsoon during July to September or October reverses the trend, whereby fishing conditions become favorable. Scuba diving is at its low during this period because of the rainy season and occassional typhoons, making access to the island difficult. As expected, the marine sanctuary is located in the southeastern portion of the reef (see Figure 6). It extends about 93-100 m. from the shoreline to the crest at 6-7 m. deep. The slope is estimated at 50-60o at 17 m. deep (Reboton and Divinagracia, 1997; Russ and Alcala, 1996). Soft corals are found in the shallow portion, while the reef crest and slope has a high cover of live hard corals24. Table 5 contains a comparison of coral cover from 1981 – 2002.
23 Reboton, C. 24 Reboton, C.
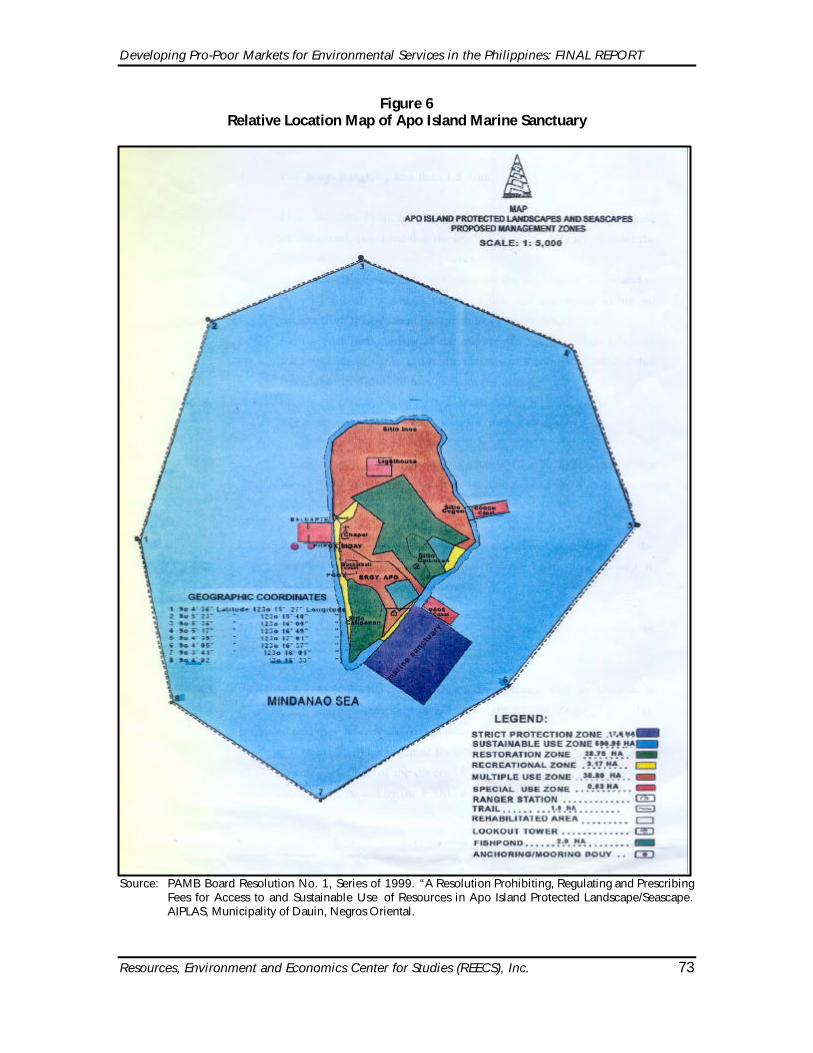
Developing Pro-Poor Markets for Environmental Services in the Philippines: FINAL REPORT
Resources, Environment and Economics Center for Studies (REECS), Inc. 73
Figure 6 Relative Location Map of Apo Island Marine Sanctuary
Source: PAMB Board Resolution No. 1, Series of 1999. “A Resolution Prohibiting, Regulating and Prescribing
Fees for Access to and Sustainable Use of Resources in Apo Island Protected Landscape/Seascape. AIPLAS, Municipality of Dauin, Negros Oriental.
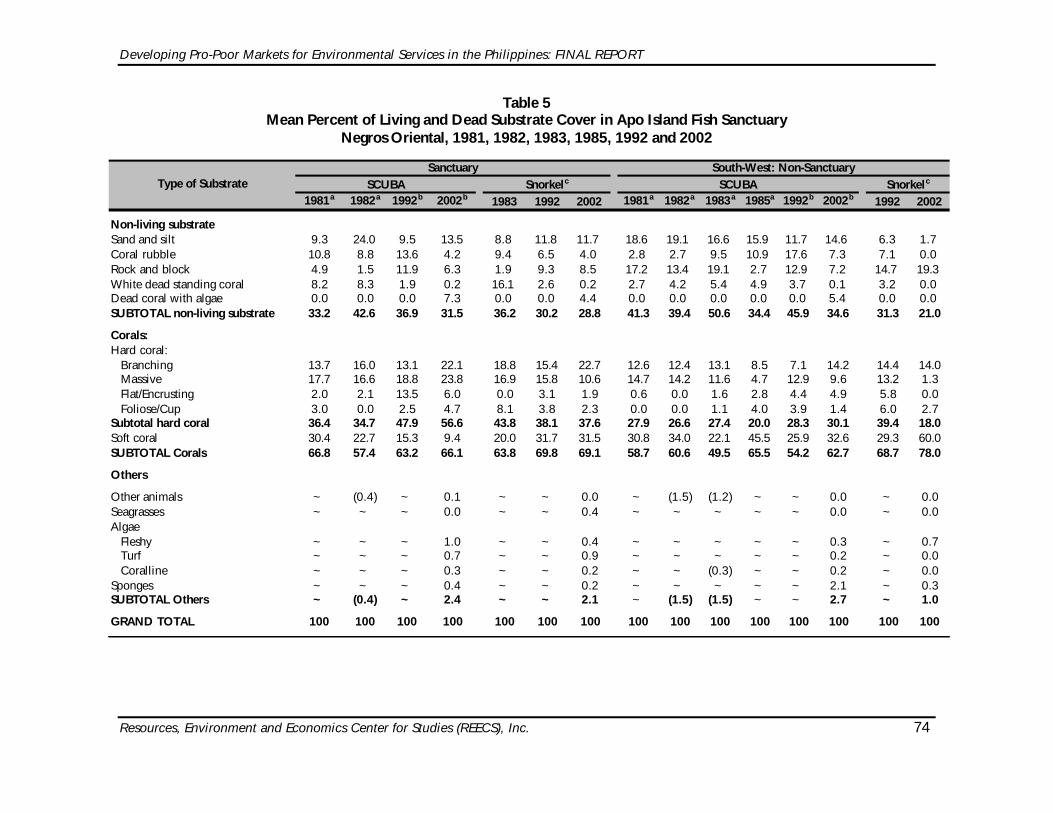
Developing Pro-Poor Markets for Environmental Services in the Philippines: FINAL REPORT
Resources, Environment and Economics Center for Studies (REECS), Inc. 74
Table 5 Mean Percent of Living and Dead Substrate Cover in Apo Island Fish Sanctuary
Negros Oriental, 1981, 1982, 1983, 1985, 1992 and 2002
1981a 1982a 1992b 2002b 1983 1992 2002 1981a 1982a 1983a 1985a 1992b 2002b 1992 2002
Non-living substrateSand and silt 9.3 24.0 9.5 13.5 8.8 11.8 11.7 18.6 19.1 16.6 15.9 11.7 14.6 6.3 1.7Coral rubble 10.8 8.8 13.6 4.2 9.4 6.5 4.0 2.8 2.7 9.5 10.9 17.6 7.3 7.1 0.0Rock and block 4.9 1.5 11.9 6.3 1.9 9.3 8.5 17.2 13.4 19.1 2.7 12.9 7.2 14.7 19.3White dead standing coral 8.2 8.3 1.9 0.2 16.1 2.6 0.2 2.7 4.2 5.4 4.9 3.7 0.1 3.2 0.0Dead coral with algae 0.0 0.0 0.0 7.3 0.0 0.0 4.4 0.0 0.0 0.0 0.0 0.0 5.4 0.0 0.0SUBTOTAL non-living substrate 33.2 42.6 36.9 31.5 36.2 30.2 28.8 41.3 39.4 50.6 34.4 45.9 34.6 31.3 21.0
Corals:Hard coral: Branching 13.7 16.0 13.1 22.1 18.8 15.4 22.7 12.6 12.4 13.1 8.5 7.1 14.2 14.4 14.0 Massive 17.7 16.6 18.8 23.8 16.9 15.8 10.6 14.7 14.2 11.6 4.7 12.9 9.6 13.2 1.3 Flat/Encrusting 2.0 2.1 13.5 6.0 0.0 3.1 1.9 0.6 0.0 1.6 2.8 4.4 4.9 5.8 0.0 Foliose/Cup 3.0 0.0 2.5 4.7 8.1 3.8 2.3 0.0 0.0 1.1 4.0 3.9 1.4 6.0 2.7Subtotal hard coral 36.4 34.7 47.9 56.6 43.8 38.1 37.6 27.9 26.6 27.4 20.0 28.3 30.1 39.4 18.0Soft coral 30.4 22.7 15.3 9.4 20.0 31.7 31.5 30.8 34.0 22.1 45.5 25.9 32.6 29.3 60.0SUBTOTAL Corals 66.8 57.4 63.2 66.1 63.8 69.8 69.1 58.7 60.6 49.5 65.5 54.2 62.7 68.7 78.0
Others
Other animals ~ (0.4) ~ 0.1 ~ ~ 0.0 ~ (1.5) (1.2) ~ ~ 0.0 ~ 0.0Seagrasses ~ ~ ~ 0.0 ~ ~ 0.4 ~ ~ ~ ~ ~ 0.0 ~ 0.0Algae Fleshy ~ ~ ~ 1.0 ~ ~ 0.4 ~ ~ ~ ~ ~ 0.3 ~ 0.7 Turf ~ ~ ~ 0.7 ~ ~ 0.9 ~ ~ ~ ~ ~ 0.2 ~ 0.0 Coralline ~ ~ ~ 0.3 ~ ~ 0.2 ~ ~ (0.3) ~ ~ 0.2 ~ 0.0Sponges ~ ~ ~ 0.4 ~ ~ 0.2 ~ ~ ~ ~ ~ 2.1 ~ 0.3SUBTOTAL Others ~ (0.4) ~ 2.4 ~ ~ 2.1 ~ (1.5) (1.5) ~ ~ 2.7 ~ 1.0
GRAND TOTAL 100 100 100 100 100 100 100 100 100 100 100 100 100 100 100
Type of Substrate SCUBA SnorkelcSanctuary
SCUBA SnorkelcSouth-West: Non-Sanctuary
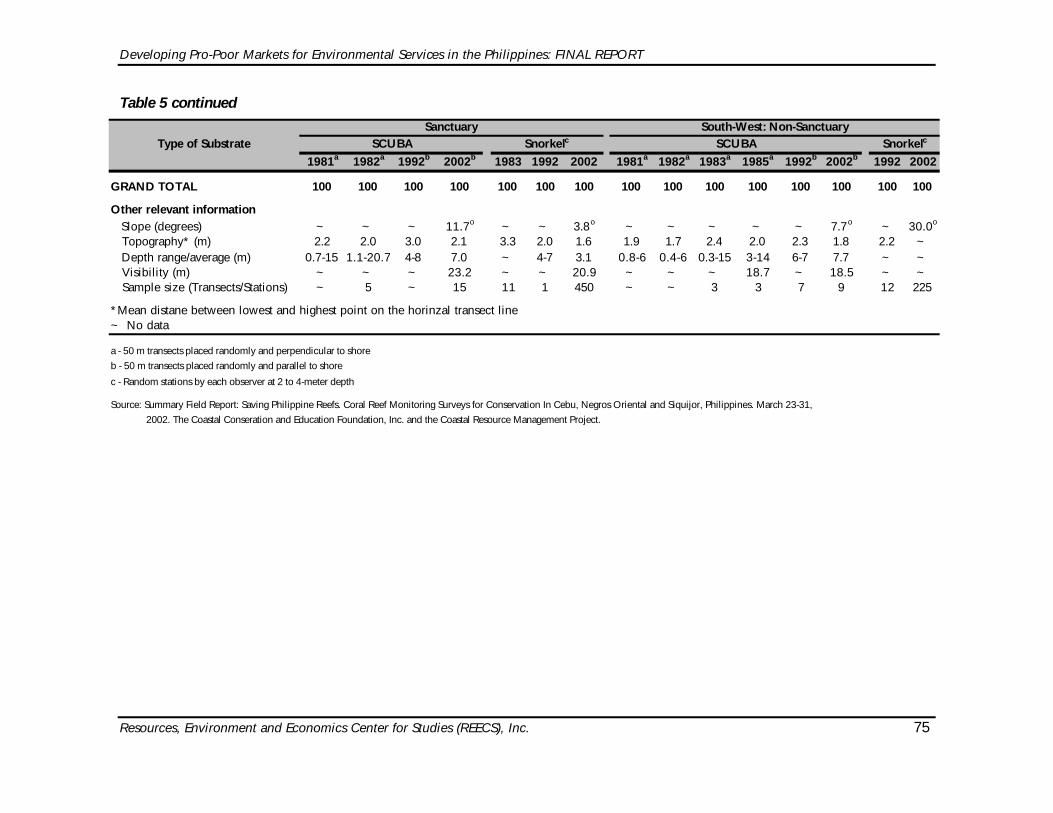
Developing Pro-Poor Markets for Environmental Services in the Philippines: FINAL REPORT
Resources, Environment and Economics Center for Studies (REECS), Inc. 75
Table 5 continued
1981a 1982a 1992b 2002b 1983 1992 2002 1981a 1982a 1983a 1985a 1992b 2002b 1992 2002
GRAND TOTAL 100 100 100 100 100 100 100 100 100 100 100 100 100 100 100
Other relevant information Slope (degrees) ~ ~ ~ 11.7o ~ ~ 3.8o ~ ~ ~ ~ ~ 7.7o ~ 30.0o
Topography* (m) 2.2 2.0 3.0 2.1 3.3 2.0 1.6 1.9 1.7 2.4 2.0 2.3 1.8 2.2 ~ Depth range/average (m) 0.7-15 1.1-20.7 4-8 7.0 ~ 4-7 3.1 0.8-6 0.4-6 0.3-15 3-14 6-7 7.7 ~ ~ Visibility (m) ~ ~ ~ 23.2 ~ ~ 20.9 ~ ~ ~ 18.7 ~ 18.5 ~ ~ Sample size (Transects/Stations) ~ 5 ~ 15 11 1 450 ~ ~ 3 3 7 9 12 225
*Mean distane between lowest and highest point on the horinzal transect line~ No data
a - 50 m transects placed randomly and perpendicular to shore
b - 50 m transects placed randomly and parallel to shore
c - Random stations by each observer at 2 to 4-meter depth
Source: Summary Field Report: Saving Philippine Reefs. Coral Reef Monitoring Surveys for Conservation In Cebu, Negros Oriental and Siquijor, Philippines. March 23-31,
2002. The Coastal Conseration and Education Foundation, Inc. and the Coastal Resource Management Project.
Type of Substrate SCUBA SnorkelcSanctuary
SCUBA SnorkelcSouth-West: Non-Sanctuary

Developing Pro-Poor Markets for Environmental Services in the Philippines: FINAL REPORT
Resources, Environment and Economics Center for Studies (REECS), Inc. 76
Various reports through the years indicate a healthy coral cover for Apo Island. In 1977, the Marine Science College of the University of the Philippines reported an excellent coral cover of 70% for Apo Island. In 1983, coral cover was down to 64.3%, but increased to 65.4% in 1995. Also, in 1981 and 1991, a leading Philippine marine scientist proclaimed in a report that 100% of Apo Island’s coral cover was in good condition. Likewise, various fish censuses conducted at different periods reveal an increase in the mean number of individuals for most types of species found in the area. Since the area was proclaimed as protected in 1982, there has been a decrease in fishing pressure in the area. A visual census study conducted by Russ and Alcala in 1996 showed strong positive correlations with mean density, mean species richness and protection, both in the reserve and non-reserve areas. 4.1.2 Economic Profile The population census25 of 2000 reveals a population of 684 or 129 households living on the island. Majority of the households depend on fishing as their primary source of income. In 1985, about 91% of households were engaged in fishing (MCDP, 1985). Fishing is done with the use of outrigger canoes or motorized pumpboats. Hook and line, gill nets and spearfishing are the methods used, with a few using fish traps and beach seines. Fishermen have revealed that since the establishment of the marine sanctuary in 1985, fish catch has increased three-fold even with the use of the same type of gear26. There is some farming and agroforestry practiced in the area. Livestock like chickens, hogs, goats and cattle were also raised. In fact, as of 1995, 95% did not own any agricultural land but 82% owned livestock and poultry (Fabro and Luchavez, 1997). Women on the other hand are engaged in mat weaving and selling, t-shirt vending, and small store enterprising.
The biggest industry on the island is tourism. Apo Island is considered as one of the prime destinations for scuba diving in the country. Its excellent coral cover and diversity of marine life serve as major attractions not only to Filipino scuba divers but to international tourists as well. As such, the diving industry is the major source of revenues of the protected area and its resources. 4.1.3 Protection Efforts Protection efforts in Apo Island began as early as 1979 when Silliman University extension workers held informal marine conservation and education programs for the local community members. Focus was given on how to ensure sustainable use of their marine resources. In 1982, an agreement was reached between the villagers, Silliman University and the Municipal Government Council on the content of the guidelines for the marine reserve. In 1984, the Marine Conservation and Development Program of the Silliman University implemented a comprehensive reserve program together with the local government and the community. This led to the formation of the Marine Management Committee (MMC), a core group composed of fisherfolk, with the assistance of the Philippine Constabulary-Integrated National Police and the Philippine Coast Guard (MCDP, 1986). The MMC collected donations for the upkeep of the marine reserve, which led to
25 Source: http:/www.census.gov.ph/census2000/index.html. Accessed on September 13, 2002. 26 Reboton, C.

Developing Pro-Poor Markets for Environmental Services in the Philippines: FINAL REPORT
Resources, Environment and Economics Center for Studies (REECS), Inc. 77
the construction of a community center in front of the marine sanctuary. During the same time, a women’s weaving group called Apo Weaving Association was formed, together with a consumers’ cooperative. The latter started with 46 members which rose to 80 members by 1997. Formal protection of Apo Island began in 1985 when the municipality of Dauin, Negros Oriental passed a resolution declaring the entire marine habitat of the island as a Municipal Reserve. On the southeast side, the area covering 11.2 has. to 250 m. offshore was declared a marine sanctuary (see Figure 6). It was further declared as a Tourist Zone by Proclamation No. 1801 and was under the administration of the Philippine Tourism Authority27. Agroforestry and farming projects were introduced to serve as alternative means of livelihood among the fisherfolk. The Municipal Council and the Bureau of Fisheries and Aquatic Resources provided various forms of support while Silliman University continued providing technical assistance. In 1994, its legal name was changed to Apo Island Protected Landscape and Seascape (AIPLAS) by Proclamation No. 438 (see Appendix F), as one of the initial components of the NIPAS Act. The Protected Area Management Board (PAMB) of AIPLAS is composed of the Department of Environment and Natural Resources (DENR), the Municipal Mayor’s office, the academe, the barangay office, and representatives from NGOs and Peoples’ Organisations (POs). The MMC was abolished, and some of its members from the community were absorbed by the PAMB. 4.1.4 Resource Use Conflicts Up until the late 70s, dynamite and muro-ami fishing used to be rampant in the area. Upon the declaration of the area as protected in the early 80s, dynamite fishing stopped. Affected reefs have regenerated since then. Muro-ami continued occasionally but eventually stopped as well. Although there was resistance by the fishing community at the onset, continuous information and education campaign (IEC) efforts by Silliman University and the local government convinced the fisherfolk to abandon destructive methods of fishing. Hence, in the beginning, the cost of protection was borne not by the affected community but by outside groups that initiated protection efforts in the area. Current threats have more to do with the increasing tourist traffic during the diving season, which starts in November or December and ends in May or June. In fact, the very first resolution of the PAMB was to regulate scuba diving by limiting the number of divers at any one point in time and by prescribing entrance fees to visitors (see Appendix G). 4.1.5 Revenues Generated To date, Apo Island is the highest income-generating protected area in the country, as far as revenues from user fees are concerned. Table 6 contains the schedule of fees currently being implemented in the area. Upon full implementation of the user fee system and in a span of four months (i.e. December 1999 to March 2000), the PAMB was able to raise half
27 Reboton, C.
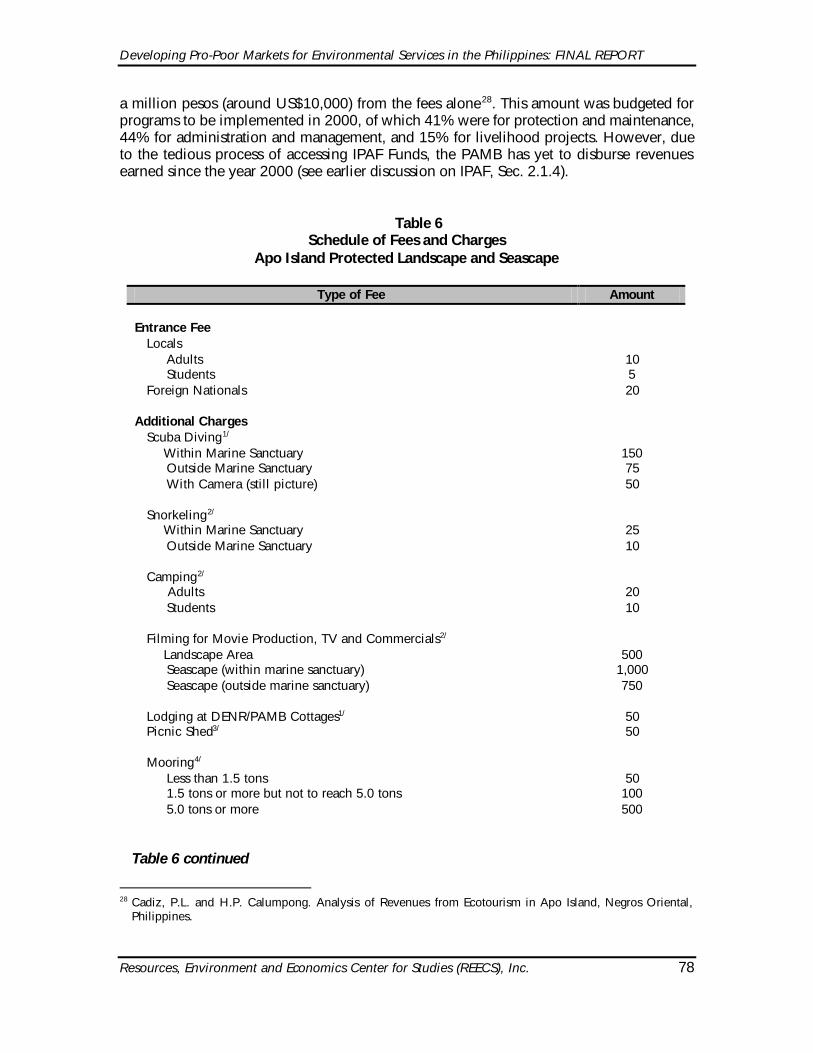
Developing Pro-Poor Markets for Environmental Services in the Philippines: FINAL REPORT
Resources, Environment and Economics Center for Studies (REECS), Inc. 78
a million pesos (around US$10,000) from the fees alone28. This amount was budgeted for programs to be implemented in 2000, of which 41% were for protection and maintenance, 44% for administration and management, and 15% for livelihood projects. However, due to the tedious process of accessing IPAF Funds, the PAMB has yet to disburse revenues earned since the year 2000 (see earlier discussion on IPAF, Sec. 2.1.4).
Table 6
Schedule of Fees and Charges Apo Island Protected Landscape and Seascape
Type of Fee Amount
Entrance Fee Locals Adults Students Foreign Nationals
10 5 20
Additional Charges Scuba Diving1/
Within Marine Sanctuary Outside Marine Sanctuary With Camera (still picture)
150 75 50
Snorkeling2/ Within Marine Sanctuary
Outside Marine Sanctuary
25 10
Camping2/ Adults
Students
20 10
Filming for Movie Production, TV and Commercials2/ Landscape Area
Seascape (within marine sanctuary) Seascape (outside marine sanctuary)
500
1,000 750
Lodging at DENR/PAMB Cottages1/ Picnic Shed3/
50 50
Mooring4/ Less than 1.5 tons 1.5 tons or more but not to reach 5.0 tons 5.0 tons or more
50
100 500
Table 6 continued
28 Cadiz, P.L. and H.P. Calumpong. Analysis of Revenues from Ecotourism in Apo Island, Negros Oriental,
Philippines.
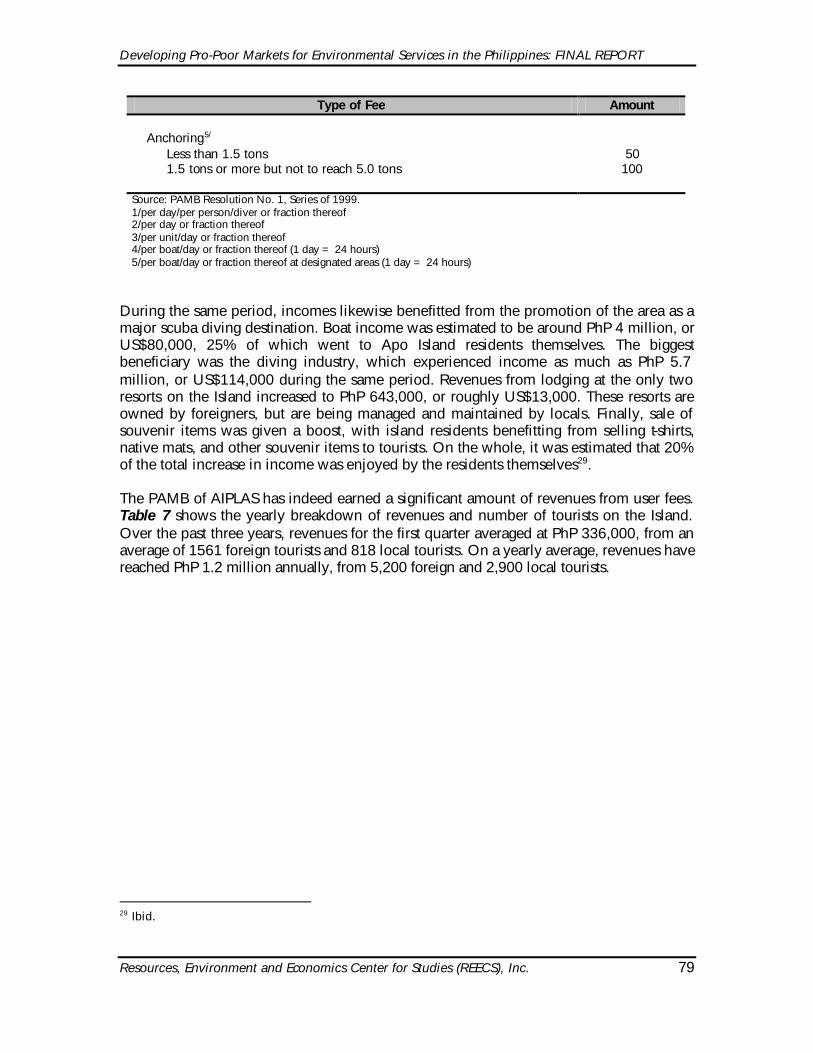
Developing Pro-Poor Markets for Environmental Services in the Philippines: FINAL REPORT
Resources, Environment and Economics Center for Studies (REECS), Inc. 79
Type of Fee Amount Anchoring5/ Less than 1.5 tons 1.5 tons or more but not to reach 5.0 tons
50
100 Source: PAMB Resolution No. 1, Series of 1999. 1/per day/per person/diver or fraction thereof 2/per day or fraction thereof 3/per unit/day or fraction thereof 4/per boat/day or fraction thereof (1 day = 24 hours) 5/per boat/day or fraction thereof at designated areas (1 day = 24 hours)
During the same period, incomes likewise benefitted from the promotion of the area as a major scuba diving destination. Boat income was estimated to be around PhP 4 million, or US$80,000, 25% of which went to Apo Island residents themselves. The biggest beneficiary was the diving industry, which experienced income as much as PhP 5.7 million, or US$114,000 during the same period. Revenues from lodging at the only two resorts on the Island increased to PhP 643,000, or roughly US$13,000. These resorts are owned by foreigners, but are being managed and maintained by locals. Finally, sale of souvenir items was given a boost, with island residents benefitting from selling t-shirts, native mats, and other souvenir items to tourists. On the whole, it was estimated that 20% of the total increase in income was enjoyed by the residents themselves29. The PAMB of AIPLAS has indeed earned a significant amount of revenues from user fees. Table 7 shows the yearly breakdown of revenues and number of tourists on the Island. Over the past three years, revenues for the first quarter averaged at PhP 336,000, from an average of 1561 foreign tourists and 818 local tourists. On a yearly average, revenues have reached PhP 1.2 million annually, from 5,200 foreign and 2,900 local tourists.
29 Ibid.
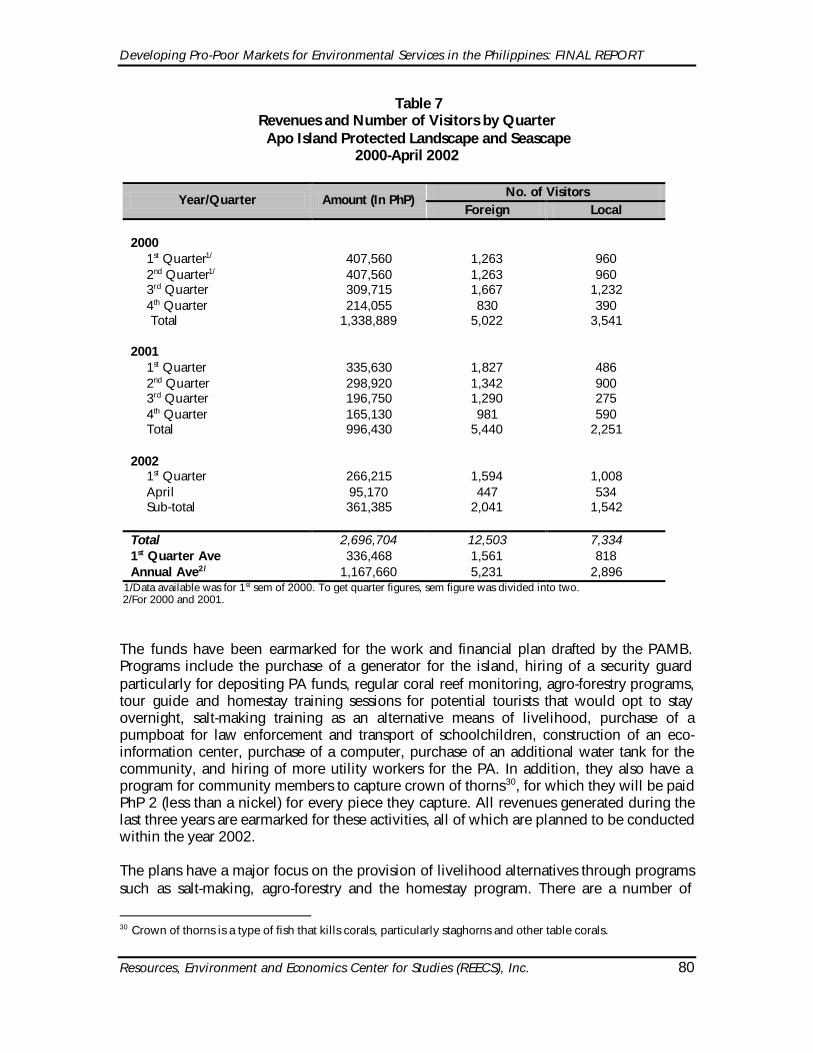
Developing Pro-Poor Markets for Environmental Services in the Philippines: FINAL REPORT
Resources, Environment and Economics Center for Studies (REECS), Inc. 80
Table 7 Revenues and Number of Visitors by Quarter Apo Island Protected Landscape and Seascape
2000-April 2002
No. of Visitors Year/Quarter Amount (In PhP)
Foreign Local 2000 1st Quarter1/ 407,560 1,263 960 2nd Quarter1/ 407,560 1,263 960 3rd Quarter 309,715 1,667 1,232 4th Quarter 214,055 830 390 Total 1,338,889 5,022 3,541 2001 1st Quarter 335,630 1,827 486 2nd Quarter 298,920 1,342 900 3rd Quarter 196,750 1,290 275 4th Quarter 165,130 981 590 Total 996,430 5,440 2,251 2002 1st Quarter 266,215 1,594 1,008 April 95,170 447 534 Sub-total 361,385 2,041 1,542 Total 2,696,704 12,503 7,334 1st Quarter Ave 336,468 1,561 818 Annual Ave2/ 1,167,660 5,231 2,896
1/Data available was for 1st sem of 2000. To get quarter figures, sem figure was divided into two. 2/For 2000 and 2001.
The funds have been earmarked for the work and financial plan drafted by the PAMB. Programs include the purchase of a generator for the island, hiring of a security guard particularly for depositing PA funds, regular coral reef monitoring, agro-forestry programs, tour guide and homestay training sessions for potential tourists that would opt to stay overnight, salt-making training as an alternative means of livelihood, purchase of a pumpboat for law enforcement and transport of schoolchildren, construction of an eco-information center, purchase of a computer, purchase of an additional water tank for the community, and hiring of more utility workers for the PA. In addition, they also have a program for community members to capture crown of thorns30, for which they will be paid PhP 2 (less than a nickel) for every piece they capture. All revenues generated during the last three years are earmarked for these activities, all of which are planned to be conducted within the year 2002. The plans have a major focus on the provision of livelihood alternatives through programs such as salt-making, agro-forestry and the homestay program. There are a number of
30 Crown of thorns is a type of fish that kills corals, particularly staghorns and other table corals.
Developing Pro-Poor Markets for Environmental Services in the Philippines: FINAL REPORT
Resources, Environment and Economics Center for Studies (REECS), Inc. 81
programs that focus on the provision of basic services such as the generator, the water tank and the pumpboat. Finally, there are direct employment opportunities that are made available to the residents, such as the hiring of utility workers and security guards. According to the PAMB members interviewed, these programs were based on what the community members themselves identified as their most basic needs, and for which they would like the revenues to be spent. 4.1.6 Key Informant Interviews – Testing the Methodology To test the methodology on assessing market impacts on poverty alleviation, key informant interviews were conducted. Five households, an NGO representative to the PAMB, a PO representative, the Mayor of Dauin, the Barangay Captain of Apo Island, the Protected Area Superintendent, and the PAMB Collection Officer were interviewed regarding the economic and ecological impacts of PA management on the Island and its residents. Appendix H contains a matrix of guide questions used, and the relevant set of respondents for each question. Meanwhile, Appendix C-1 shows the interview schedule conducted on the Island. Households were randomly selected on the island. The survey covered both male and female respondents, so as to have an adequate representation with respect to gender. Furthermore, males were usually the main income earners in the household, while females were usually homemakers. The Mayor and the PO representative were members of the former management body of the PA prior to its being declared as a NIPAS site. The NGO, Barangay Captain and the PAMB officials represented the present management body of the PA. For purposes of tallying the survey results, the PAMB Superintendent and Collection Officer were considered as only one vote. They gave exactly the same answers to the survey questions, and they represented the same office, both coming from the Department of Environment and Natural Resources (DENR) Region VII office. From the questions and survey responses, the following indicators were derived: 4.1.6.1 Institutional/Process Indicators: a. Proper consultation with, and approval sought from the community on:
1. implementation of the economic instrument (EI) 2. revenue disbursements, i.e. programs and projects 3. change in PA management from MMC to PAMB
b. Transparency with respect to:
1. hiring for employment opportunities created by the EI 2. amount of revenues collected
c. Effective enforcement of PA laws and regulations d. Fair representation of all stakeholders in the PAMB

Developing Pro-Poor Markets for Environmental Services in the Philippines: FINAL REPORT
Resources, Environment and Economics Center for Studies (REECS), Inc. 82
4.1.6.2 Impact Indicators – Economic a. employment generated b. increase in incomes c. increase in revenues for government program d. increase in the number of community development programs e. increase in the number of environmental programs f. increase in population due to in-migration g. change in local exports h. change in local imports i. increased fish catch 4.1.6.3 Impact Indicators – Social and Biophysical: a. coral reef enhancement/ increase in fish yield b. cultural traditions preserved c. conservation practices adopted Results of the survey are summarized in Table 8. As far as the process indicators are concerned, key informants seem to be dissatisfied with how PAMB is handling its operations. Households, government personnel and NGOs seem to think there is a lack of transparency in certain aspects, such as in employment opportunities created by the PA and in the decision to change PA management from being community-based to operating under the NIPAS System. For instance, the NGO representative in PAMB, who represents a women’s organization, complained of the PAMB’s seeming preference for men to be employed in law enforcement activities, while women were usually given housekeeping jobs. In effect, the men were being given more lucrative jobs than the women. Further disappointment existed in terms of having fair representation in the PAMB. Although government and non-government representatives believe the PAMB had adequate consultations with respect to how to disburse the revenues, households did not think so. There was almost a consensus, though, on having transparency in creating the economic instrument, i.e. the user fees. Understandably, those that believed otherwise were those displaced by the PAMB, i.e. the Mayor and the PO representative. For those who were not satisfied with law enforcement activities, the complaints were usually about the poor penalty system imposed on would-be violators.

Developing Pro-Poor Markets for Environmental Services in the Philippines: FINAL REPORT
Resources, Environment and Economics Center for Studies (REECS), Inc. 83
Table 8 Results of the Key Informant Interviews on Apo Island
Dauin, Negros Oriental, September 2002 Frequencies in Percent
Indicator Household
Respondents
Non-Household
Respondents1/
All Respondents
Process Indicators
Consultation/community involvement on establishment of EI
100% 60% 80%
Consultation on revenue disbursements 40% 100% 70% Transparency in employing for jobs created by
revenues 20% 40% 30%
Transparency in revenue collections 60% 60% 60% Fair representation in PAMB membership 40% 40% 40% Consultation on change of PA management 40% 20% 30% Effective enforcement of PA laws 80% 20% 50%
Economic Impact Indicators Employment generation 80% 80% 80% Higher incomes for local residents 80% 100% 90% Higher revenues for government programs 100% 100% 100% Increase in programs for community development 80% 80% 80% Increase in environmental programs 60% 60% 60% Increase in population due to in-migration 0% 0% 0% Change in local exports 0% 60% 30% Change in local imports 0% 0% 0% Increased fish catch 40% 60% 50%
Social and Biophysical Impact Indicators Coral reef enhancement/increased fish yield 100% 100% 100% Preservation of cultural traditions 100% 0% 50% Introduction of conservation practices 100% 100% 100%
OVERALL SATISFACTION WITH PA MANAGEMENT
40% 40% 40%
1/Includes the following: a. PAMB officials b. Municipal Mayor of Dauin, Negros Oriental c. NGO representative in PAMB d. PO representative not in PAMB e. Barangay Captain
On the other hand, impact indicators revealed a high level of satisfaction among the respondents. Economic indicators were mostly positive, such as increased revenues for the PA, higher incomes for people and greater employment opportunities. However, some respondents qualified that although there were greater employment opportunities, the choice of who eventually got employed was purely discretionary, and not based on a merit system. Most believed that community development was being given adequate attention, even more than environmental programs. The latter pertained more to weak enforcement of
Developing Pro-Poor Markets for Environmental Services in the Philippines: FINAL REPORT
Resources, Environment and Economics Center for Studies (REECS), Inc. 84
environmental rules. Among the community development programs the PAMB planned to undertake were the following: • Improved water supply • Provision of land and sea public transportation for residents • Scholarship programs • Livelihood training seminars • Provision of electricity • Mooring buoys • Hiring of Bantay Dagat (sea guards) • Solid waste management • Concreting of walkways • Collection of “crown of thorns” There were no negative effects with respect to population increases, and introduction of new imports to the island. As to the effects on fisherfolk, half of them seemed to think there was an increase in fishcatch, although two fishermen interviewed thought otherwise. They largely attributed this to the presence of too many divers, which scared the fish away from the fishing grounds. Nevertheless, they acknowledged that there was an increase in fish yield due to protection efforts. The presence of the PA likewise had positive effects in introducing conservation practices among the local residents in the area. There seemed to be a very high level of environmental awareness, which is to be expected given the long history of the island in protection and conservation efforts. Despite all these positive impacts of the PA on the lives of the local residents, there is still a low level of overall satisfaction with the PA management. Crucial to this is the fact that the PA was already being managed locally, and their efforts paved the way towards improvement of the area and its resources. When management was community-based, there was a sense of ownership of the PA. Incomes and revenues were lower, but most respondents preferred that set-up to the current one. When Apo Island was subsumed under the NIPAS System, the original management body was dissolved, and the PAMB was set-up in its place. The local residents and local government lost control over the management of their protected area. In a way, it can be said that the institutional development in Apo Island regressed. The ideal situation is for the residents themselves to take responsibility over ensuring protection and conservation of their natural resources. National government should step in only if there is a perceived lack of capability at the local level in doing so. But if there exists a credible and viable institutional mechanism at the local level, the most that national government should do is to assist, ensuring that the assistance is within the established management framework of the community. Despite the sincerity and successes of the PAMB, respondents did not seem to approve of the way they were handling the PA. 4.1.7 Conclusion The case of Apo Island is very unique in the sense that its institutional development for environmental management is not characteristic of how other protected areas have evolved in the country. Successful market development for environmental services, increased
Developing Pro-Poor Markets for Environmental Services in the Philippines: FINAL REPORT
Resources, Environment and Economics Center for Studies (REECS), Inc. 85
protection of natural resources, high levels of environmental awareness, and increased incomes for the people – all these suggest that environmental protection can be compatible with economic development, and the former can be successful if community development is addressed as well. This case study has demonstrated this, albeit the rudimentary methods employed in data gathering. Unfortunately, the story does not end there. “Ownership” of decisions on management is as important as economic reasons. In areas where there have been local efforts in environmental protection, such efforts should be respected. Interventions by national government, despite increasing efficiency, will not be welfare-maximizing if social costs are increased in the process. Two recommendations therefore are for the PAMB to increase its efforts in being more transparent in its operations, and for its officials to work towards greater acceptance by the community. The latter can be achieved by increasing local residents’ participation in the decision-making process and conducting their information and education campaigns on a more massive scale. 4.2 Reforestation, Watershed Management, Health and/or Environment Enhancement
Fund (RWMHEEF) of the Department of Energy 4.2.1 Definition The RWMHEEF of the Department of Energy (DOE) was first established through Republic Act No. 763831, otherwise known as the Department of Energy Act of 1992. In its Implementing Rules and Regulations (IRR), as contained in Energy Regulations (ER) 1-9432, Sec. 6 (f) entitled Reforestation, Watershed Management, Health and/or Environment Enhancement Fund, states that: “One-half of one centavo (PhP 0.005) per kilowatt hour of the total electricity sales of the energy-generating facility shall be set aside by the power producer to be used for reforestation, watershed management, health and/or environment enhancement. The power producer and the energy resource developer, to the extent of their respective contribution to the fund, shall each submit work programs for reforestation, watershed management, health and/or environment enhancement which would have to be approved by the DOE in consultation and close coordination with the DENR, the DOH, the relevant water districts, local government units, regional development councils, non-governmental organizations, and other affected parties…” The guidelines and procedures for the administration of the Fund are contained in Department Circular No. 95-11-00933 of the Department of Energy. Basically, the guidelines contain general provisions on the effectivity of the grant of financial benefits, the
31 Republic Act No. 7638 entitled An Act Creating the Department of Energy, Rationalizing the Organization
and Functions of Government Agencies Related to Energy, and for Other Purposes. 32 E.R. 1-94 entitled Rules and Regulations Implementing Sections 5 (i) of Republic Act No. 7638, Otherwise
known as the Department of Energy Act of 1992. 33 Department of Energy Circular No. 95-11-009 entitled Guidelines and Procedures for the Granting of
Financial Benefits under Energy Regulations 1-94.

Developing Pro-Poor Markets for Environmental Services in the Philippines: FINAL REPORT
Resources, Environment and Economics Center for Studies (REECS), Inc. 86
establishment of trust accounts through a Memorandum of Agreement (MOA) between DOE and the energy resource developer or power producer, the administration of the fund, and some guidelines on project implementation. Department Circular No. 2000-03-00334 of the Department of Energy amended Section 6 of ER 1-94, whereby the electrification fund this time would get 50% of one centavo for every kilowatt-hour generated, while the remaining 50% would be shared equally between the Development and Livelihood Fund and the Reforestation, Watershed Management, Health and/or Environment Enhancement Fund. Republic Act No. 9136 entitled Electric Power Industry Reform Act of 2001 (EPIRA) adopted these amendments to ER 1-94. Of particular interest is Rule 29 of the EPIRA Implementing Rules and Regulations35 which states that “one centavo per kilowatt-hour of the total electricity sales” of a generation company shall be applied as “financial benefit of the host communities of such generation facility…” (see Appendix I). This one centavo per kilowatt-hour allocation is divided into three types of funds, namely:
Location/ Type of Fund Allocation in Highly Urbanized City
Allocation in Non-highly Urbanized
City Electrification Fund (EF) 75% 50% Development and Livelihood Fund (DLF)
12.5% 25%
Reforestation, Watershed Management, Health and/or Environment Enhancement Fund (RWMHEEF)
12.5% 25%
A hierarchy of geographical areas for application of each type of fund is listed in the IRR. In general, the three types of Fund are meant to supplement the provision of basic needs in communities hosting energy projects. In reviewing what would constitute basic needs, the DOE came up with electrification, livelihood, health and environmental enhancement (which pertains more to waste disposal) as the main types of development projects that would be allowed under ER 1-94. With regard to reforestation and watershed protection, it is not clear whether these were considered as basic needs, or whether these were objectives that would primarily serve the interests of the energy projects. Interestingly, the NPC has its own list of obligations for energy-generating companies to invest in environment-related projects in their area of operations, which would answer for the sustainability of the energy project. The environment-related projects under the RWMHEEF
34 Department Circular No. 2000-03-003 entitled Further Amending the Provisions of Energy Regulations 1-94,
entitled “Rules and Regulations Implementing Section 5(i) of Republic Act No. 7638, otherwise known as the Department of Energy Act of 1992” and its Attendant Rules and Procedures.
35 Republic Act No. 9136 entitled Electric Power Industry Reform Act of 2001, Implementing Rules and
Regulations
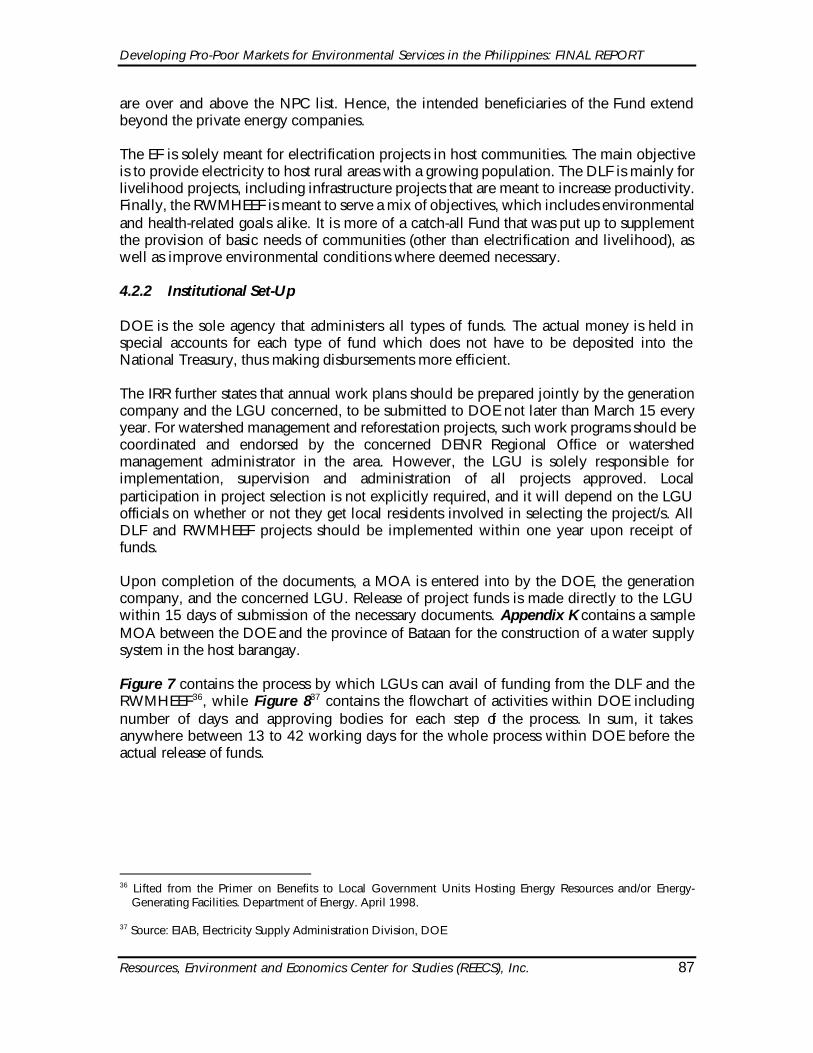
Developing Pro-Poor Markets for Environmental Services in the Philippines: FINAL REPORT
Resources, Environment and Economics Center for Studies (REECS), Inc. 87
are over and above the NPC list. Hence, the intended beneficiaries of the Fund extend beyond the private energy companies. The EF is solely meant for electrification projects in host communities. The main objective is to provide electricity to host rural areas with a growing population. The DLF is mainly for livelihood projects, including infrastructure projects that are meant to increase productivity. Finally, the RWMHEEF is meant to serve a mix of objectives, which includes environmental and health-related goals alike. It is more of a catch-all Fund that was put up to supplement the provision of basic needs of communities (other than electrification and livelihood), as well as improve environmental conditions where deemed necessary. 4.2.2 Institutional Set-Up DOE is the sole agency that administers all types of funds. The actual money is held in special accounts for each type of fund which does not have to be deposited into the National Treasury, thus making disbursements more efficient. The IRR further states that annual work plans should be prepared jointly by the generation company and the LGU concerned, to be submitted to DOE not later than March 15 every year. For watershed management and reforestation projects, such work programs should be coordinated and endorsed by the concerned DENR Regional Office or watershed management administrator in the area. However, the LGU is solely responsible for implementation, supervision and administration of all projects approved. Local participation in project selection is not explicitly required, and it will depend on the LGU officials on whether or not they get local residents involved in selecting the project/s. All DLF and RWMHEEF projects should be implemented within one year upon receipt of funds. Upon completion of the documents, a MOA is entered into by the DOE, the generation company, and the concerned LGU. Release of project funds is made directly to the LGU within 15 days of submission of the necessary documents. Appendix K contains a sample MOA between the DOE and the province of Bataan for the construction of a water supply system in the host barangay. Figure 7 contains the process by which LGUs can avail of funding from the DLF and the RWMHEEF36, while Figure 837 contains the flowchart of activities within DOE including number of days and approving bodies for each step of the process. In sum, it takes anywhere between 13 to 42 working days for the whole process within DOE before the actual release of funds.
36 Lifted from the Primer on Benefits to Local Government Units Hosting Energy Resources and/or Energy-
Generating Facilities. Department of Energy. April 1998. 37 Source: EIAB, Electricity Supply Administration Division, DOE

Developing Pro-Poor Markets for Environmental Services in the Philippines: FINAL REPORT
Resources, Environment and Economics Center for Studies (REECS), Inc. 88
Figure 7 Flowchart of Availment of Development and Livelihood Fund and Reforestation,
Watershed Management, Health and/or Environment Enhancement Fund
Source: Primer on Benefits to Local Government Units Hosting Energy Resources and/or Energy-Generating Facilities. Department of Energy. April 1998.
POWER PRODUCER
AND/OR ENERGY RESOURCE
HOST LGU
ENDORSEMENT OF PROJECT THROUGH A
SANGGUNIAN RESOLUTION
ENDORSEMENT OF PROJECTS DOE-EIAB
EVALUATION OF PROJECT
PROPOSALS
Owner/Operator of Energy Generating
Facility
ISSUANCE OF NOTICE TO PROCEED BY THE DOE
MOA BETWEEN NPC/GOCC and LGU ON PROJECT
IMPLEMENTATION
PNOC-EDC/IPP
RELEASE OF PROJECT FUNDS BY
THE DOE to the LGU OR PROJECT
IMPLEMENTOR
MOA BETWEEN DOE and LGU ON
PROJECT IMPLEMENTATION
IMPLEMENTATION
NPC/GOCC
Developing Pro-Poor Markets for Environmental Services in the Philippines: FINAL REPORT
Resources, Environment and Economics Center for Studies (REECS), Inc. 89
Figure 8 Program for Granting of Financial Benefits to Host Communities Under E.R. 1-94
As Amended
Source: Department of Energry – Energy Industry Administration Bureau. (DOE-EIAB).
Developing Pro-Poor Markets for Environmental Services in the Philippines: FINAL REPORT
Resources, Environment and Economics Center for Studies (REECS), Inc. 90
4.2.3 The Universal Charge Aside from the abovementioned fund, there is a separate charge that is mandated by law, which is called the Universal Charge, the amount of which has yet to be determined by the ERC [?]. It shall be imposed upon all end-users of electricity, including all self-generation entities. Rule 18, Section 4 (ii) of the EPIRA states that the Charge will be used partly for the rehabilitation and maintenance of watershed areas. In particular, the law specifies that PhP 0.0025 per kilowatt-hour sales shall be dedicated for such purposes. However, the DOE has yet to implement this particular portion of the law, hence no assessment can be made as to its effectiveness in promoting environmental protection. 4.2.4 Guidelines in Approving Project Proposals For projects to be eligible under the RWMHEEF, they should be classified under any of the following programs: a. Reforestation and Watershed Management, with the objective of improving either forest
cover or resource management b. Health-related projects c. Environment Enhancement Related Projects, e.g. waste disposal In prioritizing the types of projects in an area, the guidelines are specific on the ranking for areas that host either hydro and geothermal power plants. For areas with other types of power plants, the concerned LGU will decide on how to prioritize project proposals for its area. As far as the maximum amount per area is concerned, LGUs can propose projects that do not exceed the amount generated by the power plant they host. However, this is not being followed strictly, given that only 38 host communities, which is roughly 25% of total power plants in the country, have availed of the fund. Appendix K contains the full set of guidelines for RWMHEEF and DLF, as well as the list of requirements per type of allowable project under each Fund. Interviews with Mr. Gregory Paredes38, head of the Watershed Management Department of the National Power Corporation, and Mr. Noel Umali39, deputy of Mr. Paredes, revealed that the drafting of the IRR, particularly in coming up with the list of allowable projects as contained in Annex K, was done through consultations with the LGUs themselves. Mr. Noel Binag of the DOE40 added that the list of allowable projects was based on the “wish list” of local government offices41. When asked why the RWMHEEF was set up, they admitted that a huge factor being considered was the political acceptability of their energy projects by the host communities. The same response was elicited from Ms. Yolanda
38 Interview conducted on July 26, 2002 at NPC, Quezon City. 39 Interview conducted on July 10, 2002 at NPC, Quezon City. 40 Interview conducted on Jan. 29, 2003 at DOE, Fort Bonifacio, Makati City. 41 Local government units are required to come up with a priority listing of development projects for their area
every year.
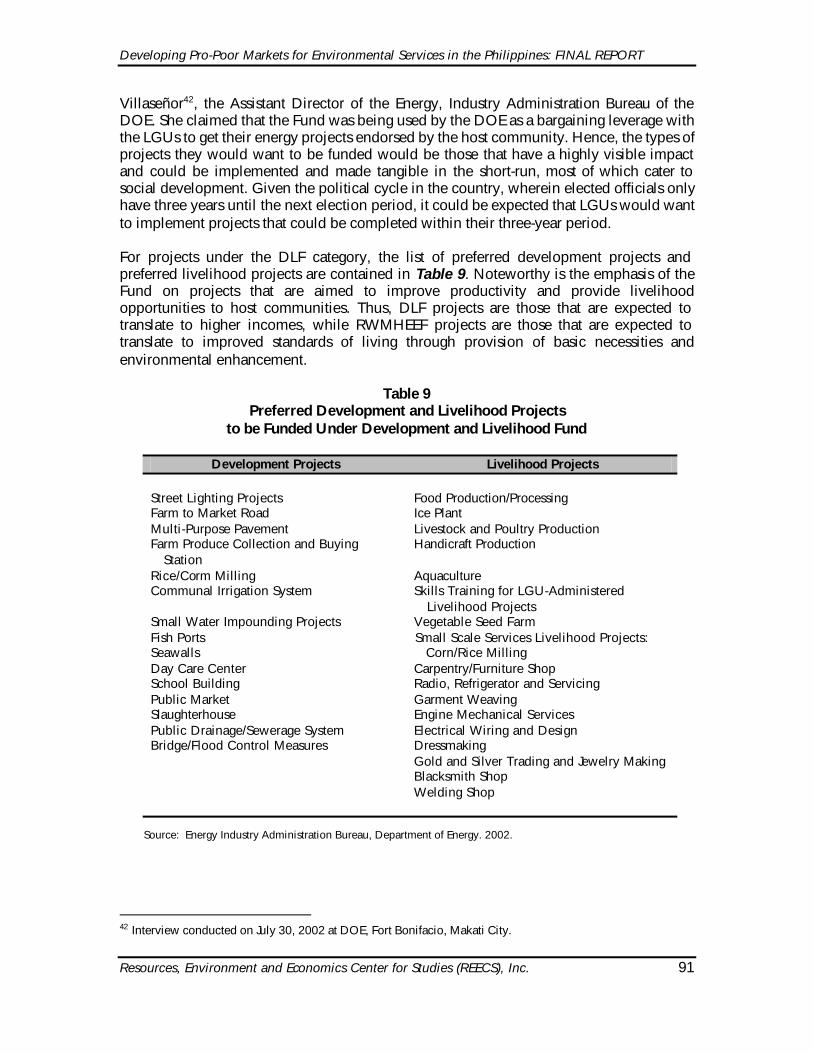
Developing Pro-Poor Markets for Environmental Services in the Philippines: FINAL REPORT
Resources, Environment and Economics Center for Studies (REECS), Inc. 91
Villaseñor42, the Assistant Director of the Energy, Industry Administration Bureau of the DOE. She claimed that the Fund was being used by the DOE as a bargaining leverage with the LGUs to get their energy projects endorsed by the host community. Hence, the types of projects they would want to be funded would be those that have a highly visible impact and could be implemented and made tangible in the short-run, most of which cater to social development. Given the political cycle in the country, wherein elected officials only have three years until the next election period, it could be expected that LGUs would want to implement projects that could be completed within their three-year period. For projects under the DLF category, the list of preferred development projects and preferred livelihood projects are contained in Table 9. Noteworthy is the emphasis of the Fund on projects that are aimed to improve productivity and provide livelihood opportunities to host communities. Thus, DLF projects are those that are expected to translate to higher incomes, while RWMHEEF projects are those that are expected to translate to improved standards of living through provision of basic necessities and environmental enhancement.
Table 9 Preferred Development and Livelihood Projects
to be Funded Under Development and Livelihood Fund
Development Projects Livelihood Projects Street Lighting Projects Food Production/Processing Farm to Market Road Ice Plant Multi-Purpose Pavement Livestock and Poultry Production Farm Produce Collection and Buying
Station Handicraft Production
Rice/Corm Milling Aquaculture Communal Irrigation System Skills Training for LGU-Administered
Livelihood Projects Small Water Impounding Projects Vegetable Seed Farm Fish Ports Small Scale Services Livelihood Projects: Seawalls Corn/Rice Milling Day Care Center Carpentry/Furniture Shop School Building Radio, Refrigerator and Servicing Public Market Garment Weaving Slaughterhouse Engine Mechanical Services Public Drainage/Sewerage System Electrical Wiring and Design Bridge/Flood Control Measures Dressmaking Gold and Silver Trading and Jewelry Making Blacksmith Shop Welding Shop
Source: Energy Industry Administration Bureau, Department of Energy. 2002.
42 Interview conducted on July 30, 2002 at DOE, Fort Bonifacio, Makati City.
Developing Pro-Poor Markets for Environmental Services in the Philippines: FINAL REPORT
Resources, Environment and Economics Center for Studies (REECS), Inc. 92
4.2.5 Funds Accrued, Funds Disbursed 4.2.5.1 Amount on Paper Table 10 contains the total accruals and disbursements made for each of the Funds handled by DOE. Funds started accruing since 1994, but disbursements started only the next year. This is to be expected, given the lead time needed for project development and approval. For the RWMHEEF, disbursements have only been 45% of the total accrued Fund. Looking at the trend, for the first three years, the Fund was hardly used for LGU projects. During three out of the most recent four years, disbursements were bigger than the accruals. LGUs are thus starting to make use of this Fund at a faster rate, absolutely and relative to the use of the other Funds. There are only 38 energy projects that have availed of the Fund, representing 38% of around 100 power plants located in the country. Nevertheless, relative to their contribution to total generating capacity, these power plants that availed of funding were generating 59% of the total generating capacity of all existing power plants in the country (see Table 11). Hence, in the overall picture, they were even contributing more to energy generation relative to the 45% of the Fund they have availed of.
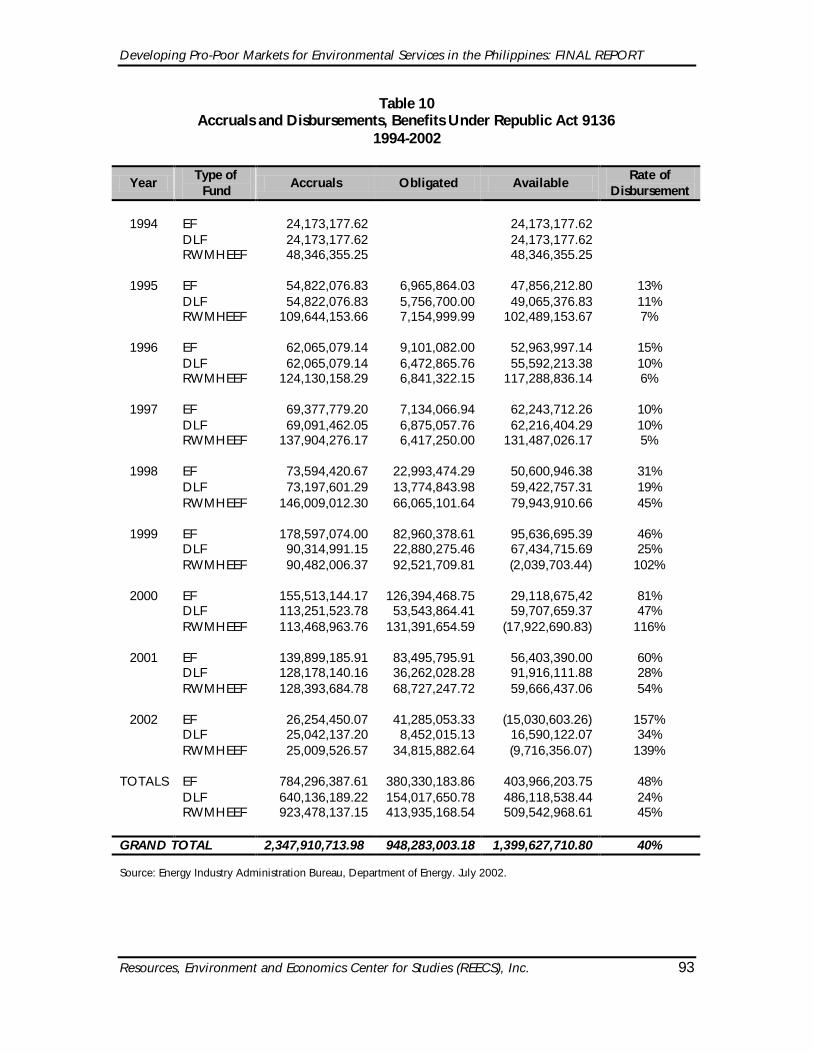
Developing Pro-Poor Markets for Environmental Services in the Philippines: FINAL REPORT
Resources, Environment and Economics Center for Studies (REECS), Inc. 93
Table 10 Accruals and Disbursements, Benefits Under Republic Act 9136
1994-2002
Year Type of
Fund Accruals Obligated Available
Rate of Disbursement
1994 EF 24,173,177.62 24,173,177.62
DLF 24,173,177.62 24,173,177.62 RWMHEEF 48,346,355.25 48,346,355.25
1995 EF 54,822,076.83 6,965,864.03 47,856,212.80 13% DLF 54,822,076.83 5,756,700.00 49,065,376.83 11% RWMHEEF 109,644,153.66 7,154,999.99 102,489,153.67 7%
1996 EF 62,065,079.14 9,101,082.00 52,963,997.14 15% DLF 62,065,079.14 6,472,865.76 55,592,213.38 10% RWMHEEF 124,130,158.29 6,841,322.15 117,288,836.14 6%
1997 EF 69,377,779.20 7,134,066.94 62,243,712.26 10% DLF 69,091,462.05 6,875,057.76 62,216,404.29 10% RWMHEEF 137,904,276.17 6,417,250.00 131,487,026.17 5%
1998 EF 73,594,420.67 22,993,474.29 50,600,946.38 31% DLF 73,197,601.29 13,774,843.98 59,422,757.31 19% RWMHEEF 146,009,012.30 66,065,101.64 79,943,910.66 45%
1999 EF 178,597,074.00 82,960,378.61 95,636,695.39 46% DLF 90,314,991.15 22,880,275.46 67,434,715.69 25% RWMHEEF 90,482,006.37 92,521,709.81 (2,039,703.44) 102%
2000 EF 155,513,144.17 126,394,468.75 29,118,675,42 81% DLF 113,251,523.78 53,543,864.41 59,707,659.37 47% RWMHEEF 113,468,963.76 131,391,654.59 (17,922,690.83) 116%
2001 EF 139,899,185.91 83,495,795.91 56,403,390.00 60% DLF 128,178,140.16 36,262,028.28 91,916,111.88 28% RWMHEEF 128,393,684.78 68,727,247.72 59,666,437.06 54%
2002 EF 26,254,450.07 41,285,053.33 (15,030,603.26) 157% DLF 25,042,137.20 8,452,015.13 16,590,122.07 34% RWMHEEF 25,009,526.57 34,815,882.64 (9,716,356.07) 139%
TOTALS EF 784,296,387.61 380,330,183.86 403,966,203.75 48% DLF 640,136,189.22 154,017,650.78 486,118,538.44 24% RWMHEEF 923,478,137.15 413,935,168.54 509,542,968.61 45%
GRAND TOTAL 2,347,910,713.98 948,283,003.18 1,399,627,710.80 40% Source: Energy Industry Administration Bureau, Department of Energy. July 2002.
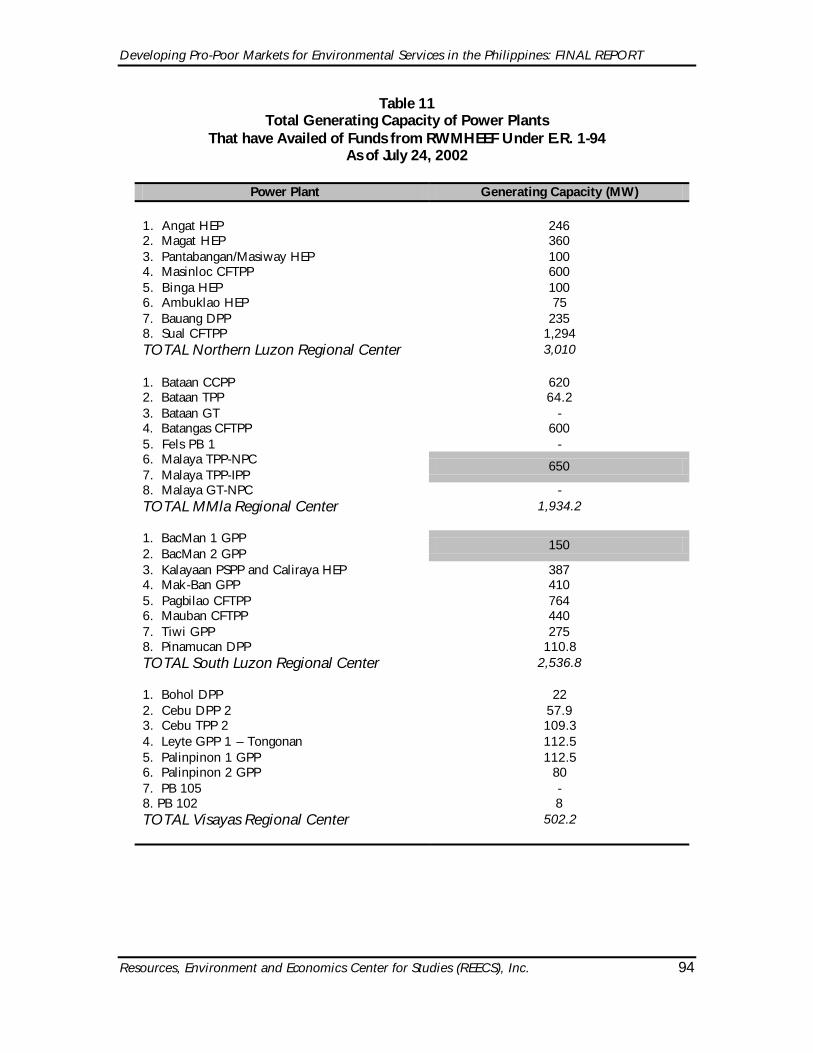
Developing Pro-Poor Markets for Environmental Services in the Philippines: FINAL REPORT
Resources, Environment and Economics Center for Studies (REECS), Inc. 94
Table 11 Total Generating Capacity of Power Plants
That have Availed of Funds from RWMHEEF Under E.R. 1-94 As of July 24, 2002
Power Plant Generating Capacity (MW)
1. Angat HEP 246 2. Magat HEP 360 3. Pantabangan/Masiway HEP 100 4. Masinloc CFTPP 600 5. Binga HEP 100 6. Ambuklao HEP 75 7. Bauang DPP 235 8. Sual CFTPP 1,294 TOTAL Northern Luzon Regional Center 3,010 1. Bataan CCPP 620 2. Bataan TPP 64.2 3. Bataan GT - 4. Batangas CFTPP 600 5. Fels PB 1 - 6. Malaya TPP-NPC 7. Malaya TPP-IPP
650
8. Malaya GT-NPC - TOTAL MMla Regional Center 1,934.2 1. BacMan 1 GPP 2. BacMan 2 GPP
150
3. Kalayaan PSPP and Caliraya HEP 387 4. Mak-Ban GPP 410 5. Pagbilao CFTPP 764 6. Mauban CFTPP 440 7. Tiwi GPP 275 8. Pinamucan DPP 110.8 TOTAL South Luzon Regional Center 2,536.8 1. Bohol DPP 22 2. Cebu DPP 2 57.9 3. Cebu TPP 2 109.3 4. Leyte GPP 1 – Tongonan 112.5 5. Palinpinon 1 GPP 112.5 6. Palinpinon 2 GPP 80 7. PB 105 - 8. PB 102 8 TOTAL Visayas Regional Center 502.2
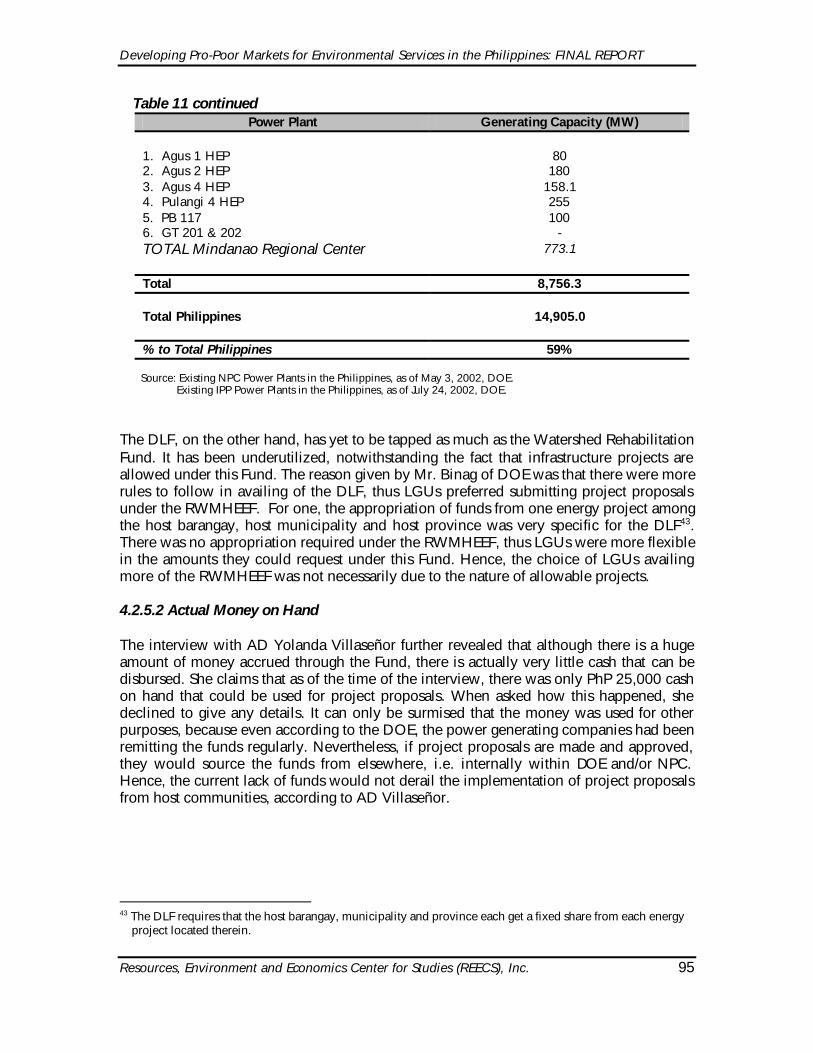
Developing Pro-Poor Markets for Environmental Services in the Philippines: FINAL REPORT
Resources, Environment and Economics Center for Studies (REECS), Inc. 95
Table 11 continued Power Plant Generating Capacity (MW)
1. Agus 1 HEP 80 2. Agus 2 HEP 180 3. Agus 4 HEP 158.1 4. Pulangi 4 HEP 255 5. PB 117 100 6. GT 201 & 202 - TOTAL Mindanao Regional Center 773.1 Total 8,756.3 Total Philippines 14,905.0 % to Total Philippines 59%
Source: Existing NPC Power Plants in the Philippines, as of May 3, 2002, DOE. Existing IPP Power Plants in the Philippines, as of July 24, 2002, DOE.
The DLF, on the other hand, has yet to be tapped as much as the Watershed Rehabilitation Fund. It has been underutilized, notwithstanding the fact that infrastructure projects are allowed under this Fund. The reason given by Mr. Binag of DOE was that there were more rules to follow in availing of the DLF, thus LGUs preferred submitting project proposals under the RWMHEEF. For one, the appropriation of funds from one energy project among the host barangay, host municipality and host province was very specific for the DLF43. There was no appropriation required under the RWMHEEF, thus LGUs were more flexible in the amounts they could request under this Fund. Hence, the choice of LGUs availing more of the RWMHEEF was not necessarily due to the nature of allowable projects. 4.2.5.2 Actual Money on Hand The interview with AD Yolanda Villaseñor further revealed that although there is a huge amount of money accrued through the Fund, there is actually very little cash that can be disbursed. She claims that as of the time of the interview, there was only PhP 25,000 cash on hand that could be used for project proposals. When asked how this happened, she declined to give any details. It can only be surmised that the money was used for other purposes, because even according to the DOE, the power generating companies had been remitting the funds regularly. Nevertheless, if project proposals are made and approved, they would source the funds from elsewhere, i.e. internally within DOE and/or NPC. Hence, the current lack of funds would not derail the implementation of project proposals from host communities, according to AD Villaseñor.
43 The DLF requires that the host barangay, municipality and province each get a fixed share from each energy
project located therein.

Developing Pro-Poor Markets for Environmental Services in the Philippines: FINAL REPORT
Resources, Environment and Economics Center for Studies (REECS), Inc. 96
4.2.6 Matrix of Approved Projects 4.2.6.1 List of Projects by Type Under the RWMHEEF Fund, there have been a total of 349 projects, with a total disbursement of PhP 413,935,169, for 38 power plants, over a period of 8.5 years. There are actually a total of around 100 power plants all over the country, but these power plants that have availed of funding are supplying 59% of total electricity generated nationwide. Out of the total, majority of the projects are found in Luzon, with Metro Manila enjoying the biggest share, in terms of number of projects and amount. This of course is more or less proportional to the number of power plants located per regional center. Probably of more interest would be the nature of the projects being implemented under this Fund. As shown in Table 12, more than half of the projects are either health-related, or water supply projects of the host communities. This is to be expected, given that most of these communities hosting energy projects are in lower class municipalities, hence have very backward infrastructure in public services. And since LGUs were involved in the formulation of guidelines for the Fund, they would expectedly be biased towards projects that reflect the more pressing needs of their constituents, most of which are more directly related to people’s everyday needs. However, what this translates to is a very low investment, i.e. 8%, in watershed rehabilitation projects in particular, and 22% for enhancement of environmental services in general. The latter would include erosion control and solid waste management projects.
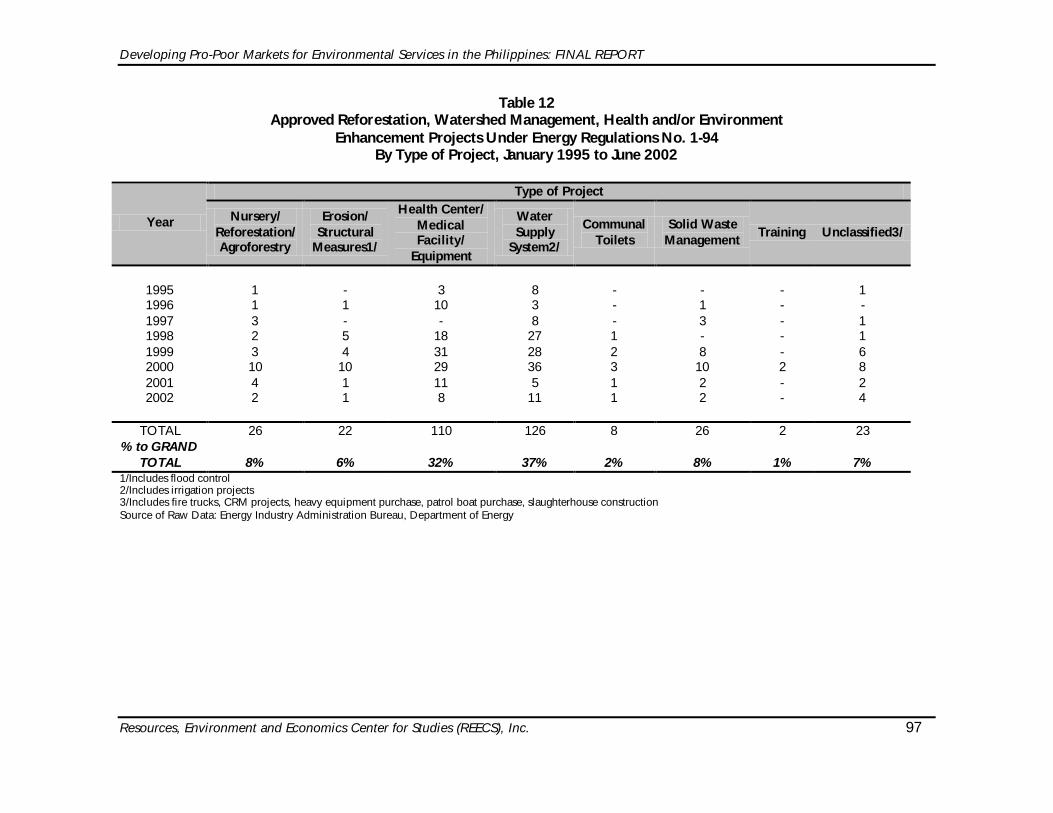
Developing Pro-Poor Markets for Environmental Services in the Philippines: FINAL REPORT
Resources, Environment and Economics Center for Studies (REECS), Inc. 97
Table 12 Approved Reforestation, Watershed Management, Health and/or Environment
Enhancement Projects Under Energy Regulations No. 1-94 By Type of Project, January 1995 to June 2002
Type of Project
Year Nursery/ Reforestation/ Agroforestry
Erosion/ Structural
Measures1/
Health Center/ Medical Facility/
Equipment
Water Supply
System2/
Communal Toilets
Solid Waste Management
Training Unclassified3/
1995 1 - 3 8 - - - 1 1996 1 1 10 3 - 1 - - 1997 3 - - 8 - 3 - 1 1998 2 5 18 27 1 - - 1 1999 3 4 31 28 2 8 - 6 2000 10 10 29 36 3 10 2 8 2001 4 1 11 5 1 2 - 2 2002 2 1 8 11 1 2 - 4
TOTAL 26 22 110 126 8 26 2 23
% to GRAND TOTAL 8% 6% 32% 37% 2% 8% 1% 7%
1/Includes flood control 2/Includes irrigation projects 3/Includes fire trucks, CRM projects, heavy equipment purchase, patrol boat purchase, slaughterhouse construction Source of Raw Data: Energy Industry Administration Bureau, Department of Energy
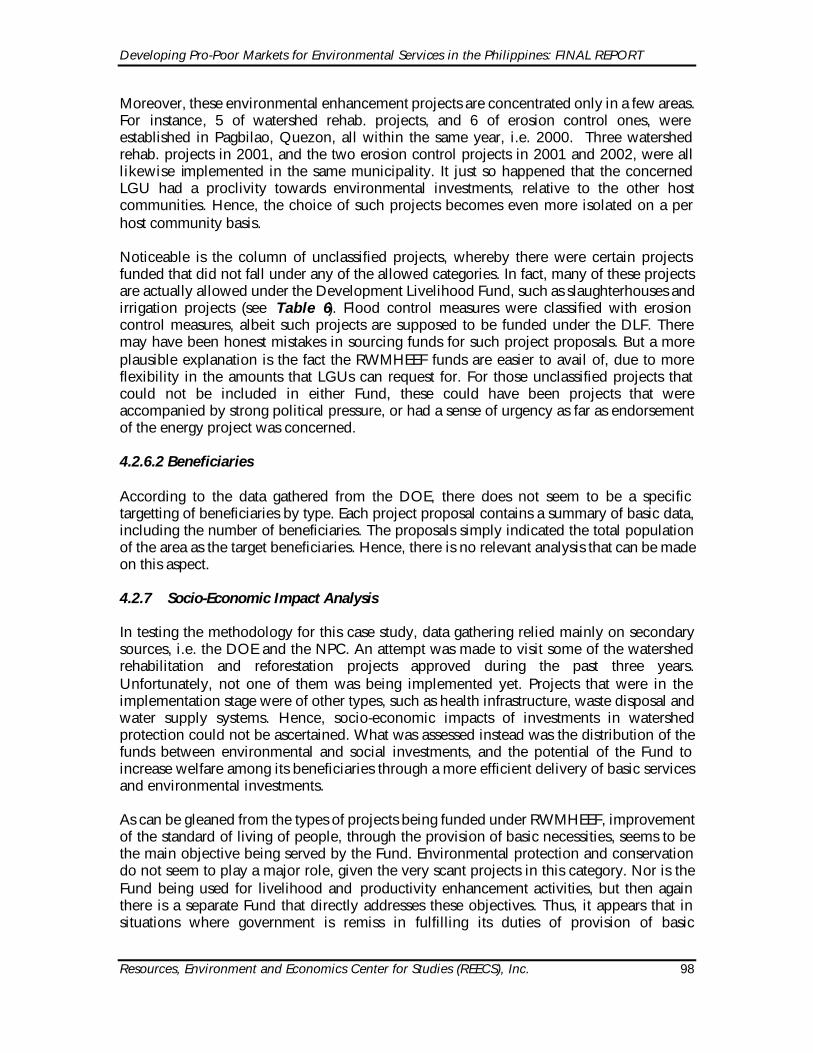
Developing Pro-Poor Markets for Environmental Services in the Philippines: FINAL REPORT
Resources, Environment and Economics Center for Studies (REECS), Inc. 98
Moreover, these environmental enhancement projects are concentrated only in a few areas. For instance, 5 of watershed rehab. projects, and 6 of erosion control ones, were established in Pagbilao, Quezon, all within the same year, i.e. 2000. Three watershed rehab. projects in 2001, and the two erosion control projects in 2001 and 2002, were all likewise implemented in the same municipality. It just so happened that the concerned LGU had a proclivity towards environmental investments, relative to the other host communities. Hence, the choice of such projects becomes even more isolated on a per host community basis. Noticeable is the column of unclassified projects, whereby there were certain projects funded that did not fall under any of the allowed categories. In fact, many of these projects are actually allowed under the Development Livelihood Fund, such as slaughterhouses and irrigation projects (see Table 6). Flood control measures were classified with erosion control measures, albeit such projects are supposed to be funded under the DLF. There may have been honest mistakes in sourcing funds for such project proposals. But a more plausible explanation is the fact the RWMHEEF funds are easier to avail of, due to more flexibility in the amounts that LGUs can request for. For those unclassified projects that could not be included in either Fund, these could have been projects that were accompanied by strong political pressure, or had a sense of urgency as far as endorsement of the energy project was concerned. 4.2.6.2 Beneficiaries According to the data gathered from the DOE, there does not seem to be a specific targetting of beneficiaries by type. Each project proposal contains a summary of basic data, including the number of beneficiaries. The proposals simply indicated the total population of the area as the target beneficiaries. Hence, there is no relevant analysis that can be made on this aspect. 4.2.7 Socio-Economic Impact Analysis In testing the methodology for this case study, data gathering relied mainly on secondary sources, i.e. the DOE and the NPC. An attempt was made to visit some of the watershed rehabilitation and reforestation projects approved during the past three years. Unfortunately, not one of them was being implemented yet. Projects that were in the implementation stage were of other types, such as health infrastructure, waste disposal and water supply systems. Hence, socio-economic impacts of investments in watershed protection could not be ascertained. What was assessed instead was the distribution of the funds between environmental and social investments, and the potential of the Fund to increase welfare among its beneficiaries through a more efficient delivery of basic services and environmental investments. As can be gleaned from the types of projects being funded under RWMHEEF, improvement of the standard of living of people, through the provision of basic necessities, seems to be the main objective being served by the Fund. Environmental protection and conservation do not seem to play a major role, given the very scant projects in this category. Nor is the Fund being used for livelihood and productivity enhancement activities, but then again there is a separate Fund that directly addresses these objectives. Thus, it appears that in situations where government is remiss in fulfilling its duties of provision of basic
Developing Pro-Poor Markets for Environmental Services in the Philippines: FINAL REPORT
Resources, Environment and Economics Center for Studies (REECS), Inc. 99
infrastructure and services, environmental conservation will not be addressed by poor communities until their basic needs are met. It is thus only logical that environmental management programs will have to integrate upliftment of the poor if they are to be successful. On the other hand, such a scheme allows for a more efficient delivery of basic services by the local governments concerned. Because the local governments themselves determined what could be funded under this mechanism, it paves the way for the most pressing needs of the host communities to be met. Furthermore, since the local government has to deal only with the DOE and the generating company, the approval and implementation process is much shorter relative to projects that source funds from the National Treasury and foreign sources. Based on interviews with DOE personnel, payments for the RWMHEEF, along with the other types of funds, are made directly to the Treasury Division of the DOE (see Figure 9). The money does not have to pass through other depository accounts of the national government. Corollary to this, disbursements are made directly from DOE to the LGU concerned, upon the opening of a special account exclusively for ER 1-94 funds.
Figure 9
Flowchart of Funds, Payment and Withdrawal for Development Livelihood Fund and Reforestation, Watershed Management, Health and/or Environment Enhancement Fund Payment for IPP-OWNED
Generation Company
Department of Energy Treasury Division
Deposited to separate Trust Account (based from a
MOA)
DLF EF RWMHEEF
P0.01/kWh as audited by Management and Audit
Division

Developing Pro-Poor Markets for Environmental Services in the Philippines: FINAL REPORT
Resources, Environment and Economics Center for Studies (REECS), Inc. 100
PAYMENT FOR NPC-OWNED
WITHDRAWAL FOR IPP-OWNED For DLF and RWMHEEF Projects For EF Projects
National Power Corporation
DLF RWMHEEF
Deposited Directly to the Trust Accounts
DOE
Special Account - LGU
Funds are remitted to the special account of the LGU
Opened by LGU exclusively for ER 1-94 Funds
DOE
Special Account – Distribution Utility (i.e. EC, MERALCO, LGU-owned
utility
Funds are remitted to the special account of the
Distribution Utility
Opened by LGU exclusively for ER 1-94 Funds

Developing Pro-Poor Markets for Environmental Services in the Philippines: FINAL REPORT
Resources, Environment and Economics Center for Studies (REECS), Inc. 101
WITHDRAWAL FOR NPC-OWNED Source: Interview with Ms. Delia Arenos, DOE-EIAB Dept. August 16, 2002. On the whole, it appears that the RWMHEEF is contributing to an increase in social welfare. It is able to address basic needs of the host communities through health and water supply projects, both of which tend to serve the majority of the population of the area concerned. One does not need to delve deeper into this subject matter, since provision of basic health and water supply services would always have qualitatively positive effects on people’s lives. Second, it allows for efficient delivery of LGU services, which could normally take longer to deliver if coursed through usual government budget allocations. Be that as it may, such results are borne out of direct investments in projects other than watershed management. The scheme has not yet been utilized in such a way that a direct connection between enhancement of environmental services, for which the fund was created partly, and addressing poverty can be established. In a situation where watershed protection projects directly compete with health-related ones at the same time, the latter will always be addressed first. As to whether this is good or bad should be assessed within the larger picture of economic development and environmental management of this country. DOE Survey44 The DOE conducted its own impact study of the implementation of the three Funds in March 2002. The objectives of the study were the following: a. determine the impact of projects funded under ER 1-94 b. determine whether the goal of uplifting communities’ living conditions have been
achieved c. determine the most effective ways of delivering the programs and services provided
under ER 1-94
44 Lifted mostly from “An Impact Evaluation of Projects Funded Under ER No. 1-94”, prepared by the EIAB,
Department of Energy, March 2002.
NPC
Special Account – Local Government Unit
Funds are remitted to the special account of the LGU
Opened by LGU exclusively for ER 1-94 Funds

Developing Pro-Poor Markets for Environmental Services in the Philippines: FINAL REPORT
Resources, Environment and Economics Center for Studies (REECS), Inc. 102
There was an attempt made to get a copy of the detailed study. Unfortunately, the interviewees did not want to release the whole report, because it lacked the signatures of the Department heads, which would have made the study official and available for the public. Instead, the executive summary was provided, the contents of which are discussed below. Five host barangays were selected as the sample of the survey. All these barangays availed of the three types of Funds, which was the basis of the selection. They were mainly 3 rd class municipalities, with above average household sizes, relying mostly on farming and fishing. Average family incomes were way below the national average, and did not go beyond the poverty threshold level. Results of the survey of 100 respondents from the five barangays showed that majority found the water system projects very helpful in providing direct access to potable water, as well as water for gardening and animal production, and reduction of water borne diseases. An overwhelming number showed great appreciation for the solid waste management projects because of the improvement in sanitation. The dumptrucks likewise served as vehicles for relocating victims during times of calamities, and for construction and repair of infrastructure projects. Hence, there were positive externalities experienced from such projects. Finally, the health centers were beneficial not only in terms of serving as a venue for curing the sick, but also as venues for improving family health care in general. In general, the RWMHEEF and DLF programs of the DOE were deemed helpful by the beneficiaries themselves in terms of providing basic needs and upliftment of their standards of living. However, the study believes that the benefits could be maximized if more people are made aware of the existence of such projects, and if government agencies were more coordinated in their efforts to spread the benefits to the widest range of beneficiaries possible. Monitoring plays an important role, and although the MOAs provide for LGUs and the NPC to undertake monitoring activities, compliance has been very poor so far. 4.2.8 Conclusion The NPC case is illustrative of how markets for watershed services are being introduced in the country, whereby the government acts as an intermediary between the buyers, in this case the energy producers, and the sellers, i.e. the communities hosting the energy projects. Unfortunately, there is still a weak link between the “payment” to the communities and watershed protection. The mechanism has been set up, but the interplay of market forces is still not as dynamic as it is hoped to be. The Fund is hardly used for watershed protection projects, rather basic needs are given much higher priority. Although this has nothing to do with the DOE’s management of the Fund, it somehow reflects how environmental objectives are not yet given priority in the use of the Fund. It is thus difficult to determine at this point if this particular economic instrument, in meeting its environmental objectives, entails economic and/or social costs to the affected communities, or if welfare is improved simultaneously with conservation. Nevertheless, there is promise for such markets to develop. Government policies are now gearing towards valuing such services and realizing these values for community benefits. In a very minimal sense, the small amount of one centavo per kwh represents what can be seen as part of a nascent value of watershed protection services, which is now being
Developing Pro-Poor Markets for Environmental Services in the Philippines: FINAL REPORT
Resources, Environment and Economics Center for Studies (REECS), Inc. 103
diverted back to the host communities. Direct environmental investments of these power producers would constitute the other portion of the value of watershed protection. Another insight drawn from this case study is the fact that environmental investments are difficult to come by unless basic social services of communities are met. The RWMHEEF illustrates this point. Although the Fund allowed for environment-related projects, most local governments chose to invest in basic services, such as provision of water supply and health-related infrastructure for their constituents. Some government personnel may perceive this as anomalous, but political reality dictates that projects that are perceived to have greater impacts on current generations will always be preferred over those for future generations, especially if they believe such projects will affect the quality of life of the communities in question. If host LGUs and communities can be convinced that investments in watershed protection and other environment-related projects can have direct and immediate impacts on livelihood, there might be a chance that such environment-related investments may increase in the future.
Developing Pro-Poor Markets for Environmental Services in the Philippines: FINAL REPORT
Resources, Environment and Economics Center for Studies (REECS), Inc. 104
5. PROPOSALS FOR FURTHER RESEARCH The Philippine case studies presented and the review of existing initiatives for MES development illustrate a certain dynamism that renders promise for achieving conservation objectives in the country. There is enough room in the existing legal and policy framework for the creation and implementation of economic instruments. Institutional mechanisms likewise exist, albeit at varying levels of efficiency. Yet much remains to be done for MES development to create a significant impact on the Philippine environmental sector. Following are recommendations for further work. With respect to the IPAF, economic valuation studies need to be replicated in other parts of the country. There are numerous protected areas listed on paper, but because of various implementation problems such as lack of financial sustainability, some markets cannot seem to take off. One case study that can be replicated is the imposition of watershed protection fees on a mineral water company benefitting from such protection, even if the company is located outside the protected area. Furthermore, although most revenue-generating PAs have only started to disburse their funds, early interventions, e.g. establishing a proper monitoring system within the PAWB-DENR, can ensure that such funds are used for programs that can serve as payments to local communities for continuous provision of environmental services. Finally, assistance can be provided in setting up some sort of a “payment scheme” for local communities, particularly in areas where revenues have been generated. The Balian case study can also be extended so that assistance is provided in securing the necessary rights over their water supply. Various forms of trading such rights can ensue, which will necessitate a benefit-cost analysis of the various options open to the community. Numerous lessons were learned from the Balian experience, which could be transferred to other areas where community-based organizations are present. Such organizations need not be currently active in watershed protection efforts, but there should be an interest in pursuing such objectives. The implementation of the DOE Fund for Watershed Rehabilitation could be expedited and designed to be more efficient. Intervention can be done on both levels, i.e. at the side of the DOE and at the local level by providing advice and technical guidance on securing their share for environmental enhancement projects. Even areas that have had environmental enhancement projects approved can be assisted in implementing their proposals. Finally, for further development of markets in watershed protection, studies on raw water pricing can be initiated45. Groundwater depletion must be addressed, one possibility being the institution of a user fee policy based on the depletion cost of groundwater, added to the cost incurred by private well owners. This can contribute to groundwater conservation. In the event that the reduction in the volume of groundwater extraction still exceeds sustainable recharge rates, it will be necessary to determine and allocate the safe yield volume among existing users. This in turn will call for the establishment of a system for
45 Proposal for raw water pricing contained in Bautista, G. and R. Tan. 2001. Watersheds and Groundwater
Depletion in the Philippines: The Cagayan de Oro Experience. Institute of Philippine Culture, Ateneo de Manila University, Quezon City, Philippines.
Developing Pro-Poor Markets for Environmental Services in the Philippines: FINAL REPORT
Resources, Environment and Economics Center for Studies (REECS), Inc. 105
monitoring and metering groundwater use and the effective enforcement of a penalty system. To pave the way for a market for groundwater rights, the extent of private rights within the public domain will have to be redefined. In the event that allocations of groundwater shares may not be enough to meet water requirements and the groundwater rights market takes time to fully develop, additional supply from surface water will have to be provided. This in turn will necessitate the estimation of the full economic cost of surface water, which will depend partly on the price of the existing groundwater technology and its depletion cost, and on the condition of the forest, headwaters, and rivers from where it comes from. If forest sources are degraded, and sedimentation levels will require treatment of surface water, rehabilitation and restoration expenditures will have to be allocated for. This will likewise need policies on river water allocation to be formulated and enforced. Both groundwater and surface water use will have to eventually be linked to natural and ecological processes. Hence, providers of such services will have to be compensated in the process by downstream users. Needless to say, all these will be possible only if management responsibilities of all government bodies involved will be rationalized and delineated accordingly.

Developing Pro-Poor Markets for Environmental Services in the Philippines: FINAL REPORT
Resources, Environment and Economics Center for Studies (REECS), Inc. 106
REFERENCES Agsaoay, E., I. Ambal, E. Araral, M.S.delos Angeles, P. Ong, J.E. Padilla and R.M.P.
Rosales. 2002. Draft DENR Administrative Order. Benefit Sharing Schemes in the Implementation of EO 247 otherwise know as “Prescribing Guidelines and Establishing a Regulatory Framework for the Prospecting of Biological and Genetic Resources, Their By-Products and Derivatives, For Scientific and Commercial Purposes, and for Other Purposes. Unpublished.
Alli, R.A. January 2000. Economic Valuation for the Protection of Maasin Watershed
Reservation in Iloilo, Philippines. A Doctor of Philosophy (PhD) Thesis. University of the Philippines Los Baños, Laguna, Philippines.
Bacudo, I. June 2000. Results of the Willingness-to-Pay Survey in El Nido-Taytay Managed
Resource Protected Area: Recommendations for the Establishment of Appropriate Entrance Fees. National Integrated Protected Areas Programme. PAWB-DENR, North Avenue, Diliman, QC.
Bautista, G. and R. Tan. 2001. Watersheds and Groundwater Depletion in the Philippines:
The Cagayan de Oro Experience. Institute of Philippine Culture, Ateneo de Manila University, Quezon City, Philippines.
Buenaventura, A.Ma.S., R.M.P. Rosales, A.C. Morales, J.A.R. Amponin and C.G.S.G Reyes.
September 2001. Estimating Development Fees for Gamefowl Farms Operating in Mt. Kanla-on Natural Park. Conservation for Priority Protected Areas Project (CPPAP) Resource User Fee Study. A Technical Report. NGO’s for Integrated Protected Areas (NIPA), Inc., Resources Environment and Economics Center for Studies (REECS), Inc., and DENR, Philippines.
Borlagdan, S.B., G.M. Bautista, S.S. Bernasor, T.M. de Quiros, M.A.M. Ramirez and L.A.
Antolihao. 2000. Six Case Studies of Community-Based Forest Resource Management in the Philippines. Institute of Philippine Culture, Ateneo De Manila University.
Briones, N.D. 1991. Estimating Erosion Costs: A Philippine Case Study in the Lower Agno
River Watershed. In: Easter, K.W. , J.A. Dizon and M.M. Hufschmidt, Eds. Watershed Resources Management: Studies from Asia and the Pacific.
Bulayog, M.S.B. June 1998. Economic Implications of Biodiversity Preservation in Mount
Pangasugan, Philippines. A Doctor of Philosophy (PhD) Paper. University of the Philippines Los Baños, Laguna, Philippines.
Cadiz, P.L. and H.P. Calumpong. 2001. Analysis of Revenues from Ecotourism in Apo
Island, Negros Oriental, Philippines. Calderon, M.M., C.A. Cruz, R.P. Cereno and F.A. Cruz. January 2000. Market-Based
Instrument for Forest Recreation and Ecotourism in the MFR. In: Francisco, H.A.,

Developing Pro-Poor Markets for Environmental Services in the Philippines: FINAL REPORT
Resources, Environment and Economics Center for Studies (REECS), Inc. 107
J.T. Dizon, and C.S. Torres, Eds. Economic Instruments for the Makiling Forest Reserve. UPLB-CFNR-CEM-REECS,Inc.-EEPSEA-UNDP, Philippines.
Castro, L.I. January 2000. An Estimation and Valuation of the Carbon Storage Function of
Angat River Watershed and Forest Area. The Philippine Environmental and Natural Resources Accounting Project (Phase IV). A Technical Paper. USAID and DENR, Philippines.
Cruz, W., H.A. Francisco and Z.Tapawan-Conway. September 1988. The On-site and
Downstream Costs of Soil Erosion: Valuation Results for Two Philippine Watersheds and Implications for Conservation Policy. Working Paper Series No. 88-11. Philippine Institute for Development Studies, the International Development Research Center and the Center for Policy and Development Studies, UPLB.
Department of Budget and Management (DBM)-Budget and Management Bureau – E.
Personal communication. San Miguel, Manila, Philippines. Department of Budget and Management (DBM0 Circular Letter No. 99-9. “Prescribed
Signatory of All Department Requests/Reports Submitted to the Department of Budget and Management.” Manila, Philippines.
Department of Energy (DOE). April 1998. Primer on Benefits to Local Government Units
Hosting Energy Resources and/or Energy-Generating Facilitites. DOE, Philippines. Department of Energy Circular No. 95-11-009. 1995. “Guidelines and Procedures for the
Granting of Financial Benefits under Energy Regulations 1-94”. DOE, Philippines. Department of Energy (DOE) Department Circular No. 2000-03-003. 2000. “Further
Amending the Provisions of Energy Regulations 1-94, entitled “Rules and Regulations Implementing Section 5(i) of Republic Act No. 7638, otherwise known as the Department of Energy Act of 1992” and its Attendant Rules and Procedures.” DOE, Philippines.
Department of Energy – Energy Industry Administration Division. (DOE-EIAB) Personal
communication. 2002.
Department of Energy – Energy Industry Administration Division (DOE-EIAB). March 2002. “An Impact Evaluation of Projects Funded Under ER No. 1-94”. Unpublished
Department of Environment and Natural Resources. Conservation of Priority Protected
Areas Project. CPPAP-PCU, NAPWNC, North Avenue, Diliman, Quezon City. DENR Administrative Order No. 13, Series of 1992. “Guidelines in the Conduct of
Census and Registration of Protected Area Occupants” DENR, Philippines. DENR Administrative Order No. 47, Series of 1993. “Revised Rates of Fees for the
Entrance to and Use of Facilities Inside Protected Areas”. DENR, Philippines.

Developing Pro-Poor Markets for Environmental Services in the Philippines: FINAL REPORT
Resources, Environment and Economics Center for Studies (REECS), Inc. 108
DENR Administrative Order No. 99-36. 1999. ”Revised Rules and Regulations Governing the Administration, Management, Development and Disposition of Forest Lands Used for Grazing Purposes.” DENR, Philippines.
DENR Administrative Order 2000-30. 2000. “Annual Government Share/Rental for
Special Use of Forestland for Energy Projects”. DENR, Philippines. DENR Administrative Order 2000-51. 2000. “Guidelines and Principles for Determining
Fees for Access to and Sustainable Use of Resources in Protected Areas”. DENR, Philippines.
DENR Administrative Order No. 2002-02. January 2002. “Establishment and
Management of Community-Based Programs in Protected Areas”. DENR, Philippines.
Energy Regulation No. 1-94. 1994. “Rules and Regulations Implementing Sections 5 (i) of
Republic Act No. 7638, Otherwise known as the Department of Energy Act of 1992”. DOE, Philippines.
Espiritu, N.O. and H.A. Francisco. January 2000. Water Consumption of Various Water
Users and Watershed Protection and Conservation Fee Based on a Cost Recovery Principle. In: Francisco, H.A., J.T. Dizon, and C.S. Torres, Eds. Economic Instruments for the Makiling Forest Reserve. UPLB-CFNR-CEM-REECS,Inc.-EEPSEA-UNDP, Philippines.
Fabro, L. and J. Luchavez. 1997. Population Characteristics: Demographic Profile and
Socio-Economic Profile of the Coastal Population. In: Calumpong, H.P., J.S. Estacion and M.V. Lepiten, eds. Status of the Coastal Resources of the Negros Learning Site. Silliman University. COE-CRM. Report Submitted to USAID, Manila, Philippines. Unpublished.
Francisco, H.A. February 2002. Environmental Service “Payments”: Experiences,
Constraints and Potential in the Philppines. Developing Mechanisms for Rewarding the Upland Poor in Asia for the Environmental Services They Provide. IFAD. Regional Inception/Planning Workshop. Puncak, Indonesia.
Francisco, H., M. delos Angeles, N. Calara, R. Bagarinao, A. Indab and M.T. de Guzman.
1997. Environmental Waste Disposal Services: General Santos City (Main Report). The Philippine Environmental and Natural Resources Accounting Project (Phase IV). A Technical Paper. USAID and DENR, Philippines.
Francisco, H., M. delos Angeles, N. Calara, R. Bagarinao, A. Indab and M.T. de Guzman.
1997. Environmental Waste Disposal Services: Sarangani Province (Main Report). The Philippine Environmental and Natural Resources Accounting Project (Phase IV). A Technical Paper. USAID and DENR, Philippines.
Francisco, H., M. delos Angeles, N. Calara, R. Bagarinao, A. Indab and M.T. de Guzman.
1997. Environmental Waste Disposal Services: South Cotabato(Main Report). The
Developing Pro-Poor Markets for Environmental Services in the Philippines: FINAL REPORT
Resources, Environment and Economics Center for Studies (REECS), Inc. 109
Philippine Environmental and Natural Resources Accounting Project (Phase IV). A Technical Paper. USAID and DENR, Philippines.
Francisco, H.A.F., M.N. Rivera, E.A. Perino, L.V. Florido, E.T. Castillo, J.B. Ebora and F.E.
Siapno. January 2000. Pricing of Grassland Resources in the Philippines: Rent, Grassland Degradation and Rehabilitation and Alternative Land Uses. The Philippine Environmental and Natural Resources Accounting Project (Phase IV). A Technical Paper. USAID and DENR, Philippines.
http:/www.census.gov.ph/census2000/index.html. Accessed on September 13, 2002. Jacinto, E. 2001. Care for Nature Group: A Case Study of a Community Organization for
Watershed Rehabilitation. Landell-Mills, N and I.T. Porras. March 2002. Silver Bullet or Fool’s Gold: A Global
Review of Markets for Forest Environmental Services and their Impacts on the Poor”. Instruments for Sustainable Private Sector Forestry Series. International Institute for Environment and Development, London.
Lasmarias, N.C., A. Casorla, N. Mendoza, M.V. Navaluna, R. Virgino, N. Zabala, T.
Legaspi, B. Nuñez, C. Reyes and K. Shih. March 2000. Framework for the Application of an Environmental User Fee System for Water Pollution Management in the Philippines. The Philippine Environmental and Natural Resources Accounting Project (Phase IV). A Technical Paper. USAID and DENR, Philippines.
Lasmarias, N.C., A.C. Casorla and W. Briones. March 2000. Analysis of Wastewater
Discharge Permit Fee for Industrial Water Pollution: The Case of Marilao River, Bulacan. The Philippine Environmental and Natural Resources Accounting Project (Phase IV). A Technical Paper. USAID and DENR, Philippines.
Lingap Kalikasan. Balian, Pangil, Laguna. Personal communication. Marine Conservation Development Program (MCDP). 1986. In: Reboton, C. nd. Apo
Island, Dauin, Negros Oriental. Silliman University Marine Laboratory, Dumaguete City, Negros Oriental.
Morales, A.C., M.E.C. Bennagen, et. al. September 1997. Value of Direct Environmental
Waste Disposal Services: 1995 Update. The Philippine Environmental and Natural Resources Accounting Project (Phase IV). A Technical Paper. USAID and DENR, Philippines.
Morales, A.C. and R.M.P. Rosales. September 2001. Estimating Resource User Fees for
Agricultural Production in Mt. Kanla-on Natural Park, Negros Island, Philippines. Conservation for Priority Protected Areas Project (CPPAP) Resource User Fee Study. A Technical Report. NGO’s for Integrated Protected Areas (NIPA), Inc., Resources Environment and Economics Center for Studies (REECS), Inc., and DENR, Philippines.
Developing Pro-Poor Markets for Environmental Services in the Philippines: FINAL REPORT
Resources, Environment and Economics Center for Studies (REECS), Inc. 110
Municipal Ordinance No. 16. 1992. “Isang Kautusang Bayan na Nauukol sa Pagtatanim/Pangangalaga ng mga Punong Kahoy sa mga Gilid ng Ilog at sa mga Lupang Kinaroroonan ng mga Deposito/Bukal ng Inuming Tubig sa Bayang ito.” Balian, Pangil, Laguna, Philippines.
National Integrated Protected Areas Programme (NIPAP). June 2000. Willingness-to-Pay
Survey, Mt. Isarog National Park (December 1998-July 1999): Recommendations for the Establishment of Appropriate Entrance Fees. PAWB-DENR, North Avenue, Diliman, Quezon City.
National Power Corporation (NPC) - Watershed Management Department. Personal
communication. 2002. Padilla, J.E., R.M.P. Rosales, T. Blastique, S.J. Cabrera, E. Corcuera, R. Buen and I.
Matubis. September 1999. Determination of Development Fees for Telecom/Broadcast Companies Operating on Mt. Kitanglad Range Natural Park. The Philippine Environmental and Natural Resources Accounting Project (Phase IV). A Technical Paper. USAID and DENR, Philippines.
Padilla, J.E., R.M.P. Rosales, T. Blastique, S.J. Cabrera, E. Corcuera, R. Buen and I.
Matubis. November 1999. Determination of Dvelopment Fees for Tourism Establishments Located in El Nido Marine Reserve. The Philippine Environmental and Natural Resources Accounting Project (Phase IV). A Technical Paper. USAID and DENR, Philippines.
Padilla, J.E., R.M.P. Rosales, T. Blastique, S.J. Cabrera, E. Corcuera and R. Buen.
December 1999. A Report on the Survey of Tourists at Mt. Pulag National Park. The Philippine Environmental and Natural Resources Accounting Project (Phase IV). A Technical Paper. USAID and DENR, Philippines.
Padilla, J.E. C. Ulep, R.M.P. Rosales, A. Meniado, T. Blastique, S.J. Cabrera, E. Corcuera
and R. Buen. January 2000. Manual for the Implementation of the Fee System Guidelines in Protected Areas. The Philippine Environmental and Natural Resources Accounting Project (Phase IV). A Technical Paper. USAID and DENR, Philippines.
PAMB-Execom Resolution No. 91, Series of 1999. “A Resolution Setting the Rate of Fees
for the Use of Land and Any Form of Improvements within the Mt. Kitanglad Protected Area.” Protected Area Management Board, Mt. Kitanglad Range Natural Park.
PAMB Board Resolution No. 1, Series of 1999. “A Resolution Prohibiting, Regulating and
Prescribing Fees for Access to and Sustainable Use of Resources in Apo Island Protected Landscape/Seascape”. Protected Area Management Board, AIPLAS, Municipality of Dauin, Negros Oriental.
Presidential Proclamation No. 438. 1994. “Declaring Apo Island and its Surrounding
Waters Situated within the Municipality of Zamboanguita, Province of Negros Oriental as Protected Landscape/Seascape.”
Developing Pro-Poor Markets for Environmental Services in the Philippines: FINAL REPORT
Resources, Environment and Economics Center for Studies (REECS), Inc. 111
Protected Areas and Wildlife Bureau (PAWB)-Biodiversity Division. Personal communication. NAPWNC, North Avenue, QC, Philippines.
Protected Areas and Wildlife Bureau (PAWB)-Finance Department. Personal
communication. NAPWNC, North Avenue, QC, Philippines. Plopino, R.F. March 2001. Social Movement for Water Resource Management and
Protection in an Upland Community in Laguna, Philippines. A Doctor of Philosophy (PhD) Thesis. University of the Philippines Los Baños, College, Laguna, Philippines.
Predo, C.D. April 1995. Estimating the Recreation and Preservation Benefits of Lake
Danao National Park. A Master of Science (M.S.) Thesis. University of the Philippines Los Baños, Laguna, Philippines.
Predo, C.D. 2002. Economic Analysis of Land-use Options. A PhD Thesis. University of
the Philippines Los Baños, College, Laguna, Philippines. Predo, C.D., N.D. Briones, H.A. Francisco and E.P. Pacardo. 1999 Non-Market Valuation
of the Benefits of Protecting Lake Danao National Park in Ormoc, Philippines. In: Journal of Environmental Science and Management. Vol.2, No.2. School of Environmental Science and Management (SESAM), UPLB, College, Laguna, Philippines.
Protected Areas and Wildlife Bureau-Biodiversity Division. December 2002. Various Raw
Data. DENR, Philippines. Quintos, M., A. Cheng, A. Lachica, C. Pablo, A. Castillo, A. Javier, G. Francisco and M.S.
delos Angeles. August 1999. Derivation of Government Share from Energy Resource Extraction Project. The Philippine Environmental and Natural Resources Accounting Project (Phase IV). A Technical Paper. USAID and DENR, Philippines.
Reboton, C. nd. Apo Island, Dauin, Negros Oriental. Silliman University Marine
Laboratory, Dumaguete City, Negros Oriental. Reboton, C. and M.F. Divinagracia, 1997. Corals. In: Calumpong, H.P., J.S. Estacion and
M.V. Lepiten, eds. Status of the Coastal Resources of the Negros Learning Site. Silliman University. COE-CRM. Report Submitted to USAID, Manila, Philippines. Unpublished.
Republic Act No. 7586. 1992. “National Integrated Protected Areas System Act of 1992”.
Philippines. Republic Act No. 9147. July 2001.”An Act Providing for the Conservation and Protection
of Wildlife Resources and their Habitats, Appropriating Funds therefore and for Other Purposes”. Philippines.

Developing Pro-Poor Markets for Environmental Services in the Philippines: FINAL REPORT
Resources, Environment and Economics Center for Studies (REECS), Inc. 112
Republic Act No. 7638. December 1992. “An Act Creating the Department of Energy, Rationalizing the Organization and Functions of Government Agencies Related to Energy, and for Other Purposes”. Philippines.
Republic Act No. 9136. 2001. “Electric Power Industry Reform Act of 2001: Implementing
Rules and Regulations”. Philippines. Reyes, C.G.S.G. February 2001. Carbon Uptake of Samar Island’s Forest/Biomass: A
Preliminary Estimation. Samar Island Biodiversity Study (SAMBIO). A Technical Paper. Resources, Environment and Economics Center for Studies (REECS), Inc. and USAID, Philippines.
Rivera, M., J. Alcalde, L. Malocloc and H.A. Francisco. March 2000. Water Resources
and Economic Instruments for Laguna Lake. The Philippine Environmental and Natural Resources Accounting Project (Phase IV). A Technical Paper. USAID and DENR, Philippines.
Rosales, R.M.P. 2001. Estimating Appropriate Entrance Fees for Divers at Mabini-Tingloy Dive Sites. Kabang Kalikasan ng Pilipinas (KKP).
Rosales, R.M.P. January 2001. Estimating Recreational Values of the Sohoton Natural
Bridge National Park. Samar Island Biodiversity Study (SAMBIO). A Technical Paper. Resources, Environment and Economics Center for Studies (REECS), Inc. and USAID, Philippines.
Rosales, R.M.P., R.T. Buen, I.F. Matubis, N.A. Zabala and M.T.I Escubio. June 2002.
Estimating Development Fees for Tourism Establishments Located at Siargao Island Protected Landscape and Seascape. In: CPPAP Resource User Fee Study Technical Reports. NGO’s for Integrated Protected Areas (NIPA), Inc., Resources Environment and Economics Center for Studies (REECS), Inc., and DENR, Philippines.
Rosales, R.M.P., R.L. Velasco, Jr., R.G. Paliza, J.R. Benito, C.V. Perez, E.T. Corcuera and
S.J.C. Tagtag. June 2002. Estimating Irrigation Fees from Farmers Drawing Water Coming from Bataan Natural Park. In: CPPAP Resource User Fee Study Technical Reports. NGO’s for Integrated Protected Areas (NIPA), Inc., Resources Environment and Economics Center for Studies (REECS), Inc., and DENR, Philippines.
Rosales, R.M.P., T. Blastique, R. Cervantes, A. Lota, T. Perez and L. Segunial. June 2002.
Estimating Resource User Fees for Agricultural Production in Mt. Apo Natural Park. In: CPPAP Resource User Fee Study Technical Reports. NGO’s for Integrated Protected Areas (NIPA), Inc., Resources Environment and Economics Center for Studies (REECS), Inc., and DENR, Philippines.
Rosales, R.M.P. January 2003. A Survey to Estimate the Recreational Value of Selected
MPAs: Moalboal-Cebu, Siquijor and Pamilacan Island-Bohol. Coastal Conservation and Education Foundation, Inc. Banilad, Cebu City, Philippines.
Rosales, R.M.P. and C.G.S.G. Reyes. September 2001. Estimating Appropriate Entrance
Fees for Scuba Divers at Apo Reef Natural Park. Conservation for Priority Protected Areas Project (CPPAP) Resource User Fee Study. A Technical Report. NGO’s for

Developing Pro-Poor Markets for Environmental Services in the Philippines: FINAL REPORT
Resources, Environment and Economics Center for Studies (REECS), Inc. 113
Integrated Protected Areas (NIPA), Inc., Resources Environment and Economics Center for Studies (REECS), Inc., and DENR, Philippines.
Rosales, R.M.P., M.S. Delos Angeles and A.Ma.S. Buenaventura. September 2001.
Estimating Development Fees for Geothermal Extraction by PNOC at Mt. Kanla-on Natural Park. Conservation for Priority Protected Areas Project (CPPAP) Resource User Fee Study. A Technical Report. NGO’s for Integrated Protected Areas (NIPA), Inc., Resources Environment and Economics Center for Studies (REECS), Inc., and DENR, Philippines.
Rosales, R.M.P., M.S. Delos Angeles and C.G.S.G. Reyes. September 2001. Estimation of
Watershed Protection Service Fees for Extraction of Spring Water Coming from Mt. Kanla-on Natural Park. Conservation for Priority Protected Areas Project (CPPAP) Resource User Fee Study. A Technical Report. NGO’s for Integrated Protected Areas (NIPA), Inc., Resources Environment and Economics Center for Studies (REECS), Inc., and DENR, Philippines.
Russ, G.R. and A.C. Alcala, 1996. Do Marine Reserves Export Adult Fish Biomass?
Evidence from Apo Island, Central Philippines. Marine Ecology Progress Series. 132: 1-9.
The Local Government Code of the Philippines. 1991. The Forestry Code of the Philippines. The Water Code of the Philippines. Tolentino, L.L., R.F. Plopino and E.D.V. Jacinto. 2002. Creating Space for Local Forest
Management in Balian, Pangil, Laguna. Research Report Funded by Center for International Forestry Research. Department of Agricultural Education and Rural Studies. UP Los Baños, College, Laguna, Philippines.
Ulep, C.B. June 2000. Visitors’ Assessment of the Recreational and Environmental
Qualities of Ninoy Aquino Park and their Willingness to Pay. A Master of Science (M.S.) Thesis. Miriam College, Loyola Heights, Quezon City.
Walters, B.B., A.M. Cadelina, A. Cardaño and E. Visitacion. 1994. Watershed Restoration and Protection in the Bais Bay Basin, Philippines. Environment and Resource Management Project (ERMP), UPLB, College, Laguna, Philippines.
White, A.T., P. Christie, J. Apurado, A. Meneses, M. Ovendan, S. Tesch and E. White.
2002. Summary Field Report: Coral Reef Monitoring in Cebu, Negros and Siquijor, Philippines, March 23-31, 2002. The Coastal Conservation and Education Foundation, Inc. and Coastal Resource Management Project, Cebu City, 126 p.