final revised paper - the cryosphere
TRANSCRIPT
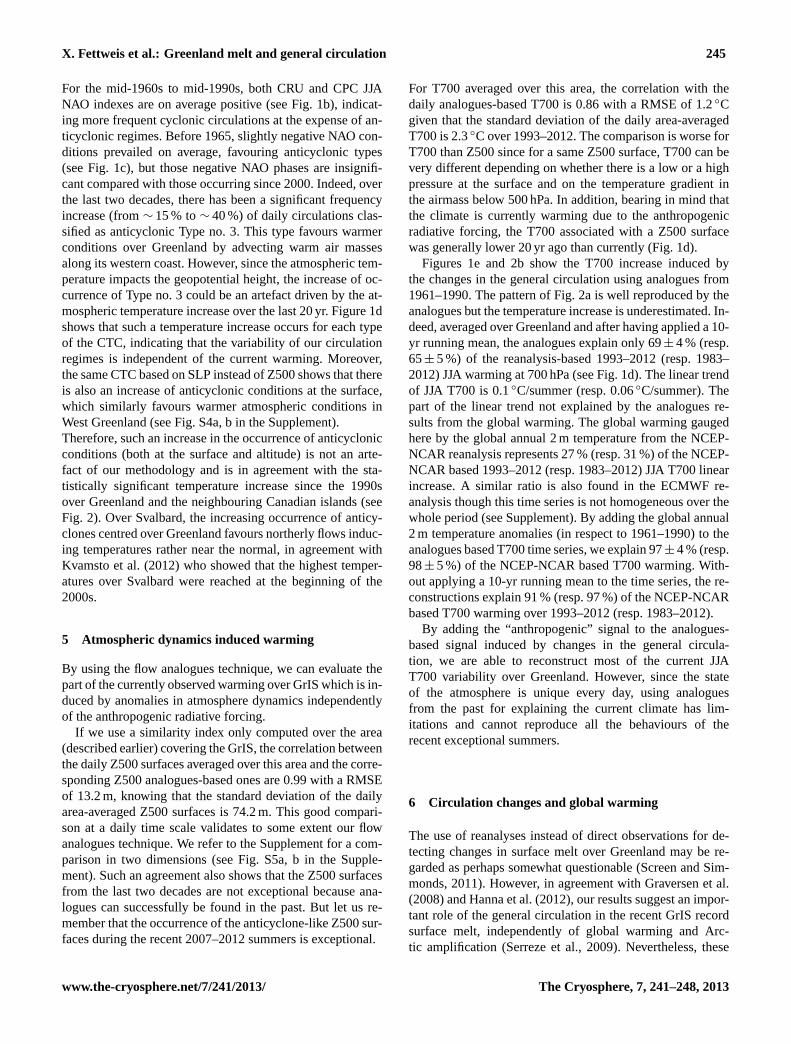
The Cryosphere, 7, 241–248, 2013www.the-cryosphere.net/7/241/2013/doi:10.5194/tc-7-241-2013© Author(s) 2013. CC Attribution 3.0 License.
EGU Journal Logos (RGB)
Advances in Geosciences
Open A
ccess
Natural Hazards and Earth System
Sciences
Open A
ccess
Annales Geophysicae
Open A
ccess
Nonlinear Processes in Geophysics
Open A
ccess
Atmospheric Chemistry
and Physics
Open A
ccess
Atmospheric Chemistry
and Physics
Open A
ccess
Discussions
Atmospheric Measurement
Techniques
Open A
ccess
Atmospheric Measurement
Techniques
Open A
ccess
Discussions
Biogeosciences
Open A
ccess
Open A
ccess
BiogeosciencesDiscussions
Climate of the Past
Open A
ccess
Open A
ccess
Climate of the Past
Discussions
Earth System Dynamics
Open A
ccess
Open A
ccess
Earth System Dynamics
Discussions
GeoscientificInstrumentation
Methods andData Systems
Open A
ccess
GeoscientificInstrumentation
Methods andData Systems
Open A
ccess
Discussions
GeoscientificModel Development
Open A
ccess
Open A
ccess
GeoscientificModel Development
Discussions
Hydrology and Earth System
Sciences
Open A
ccess
Hydrology and Earth System
SciencesO
pen Access
Discussions
Ocean Science
Open A
ccess
Open A
ccess
Ocean ScienceDiscussions
Solid Earth
Open A
ccess
Open A
ccess
Solid EarthDiscussions
The Cryosphere
Open A
ccess
Open A
ccess
The CryosphereDiscussions
Natural Hazards and Earth System
Sciences
Open A
ccess
Discussions
Brief communication“Important role of the mid-tropospheric atmospheric circulation inthe recent surface melt increase over the Greenland ice sheet”
X. Fettweis1, E. Hanna2, C. Lang1, A. Belleflamme1, M. Erpicum 1, and H. Gallee3
1Laboratory of Climatology, Department of Geography, University of Liege, n◦2 All e du 6 Aout, 4000, Liege, Belgium2Department of Geography, University of Sheffield, Winter Street, S10 2TN, Sheffield, UK3Laboratoire de Glaciologie et Geophysique de l’Environnement (LGGE), n◦54 Rue Molire, 38402, Grenoble, France
Correspondence to:X. Fettweis ([email protected])
Received: 13 July 2012 – Published in The Cryosphere Discuss.: 24 September 2012Revised: 14 January 2013 – Accepted: 15 January 2013 – Published: 7 February 2013
Abstract. Since 2007, there has been a series of surfacemelt records over the Greenland ice sheet (GrIS), continu-ing the trend towards increased melt observed since the endof the 1990s. The last two decades are characterized by anincrease of negative phases of the North Atlantic Oscilla-tion (NAO) favouring warmer and drier summers than nor-mal over GrIS. In this context, we use a circulation type clas-sification based on daily 500 hPa geopotential height to eval-uate the role of atmospheric dynamics in this surface meltacceleration for the last two decades. Due to the lack of di-rect observations, the interannual melt variability is gaugedhere by the summer (June–July–August) mean temperaturefrom reanalyses at 700 hPa over Greenland; analogous atmo-spheric circulations in the past show that∼ 70 % of the 1993–2012 warming at 700 hPa over Greenland has been driven bychanges in the atmospheric flow frequencies. Indeed, the oc-currence of anticyclones centred over the GrIS at the sur-face and at 500 hPa has doubled since the end of 1990s,which induces more frequent southerly warm air advectionalong the western Greenland coast and over the neighbour-ing Canadian Arctic Archipelago (CAA). These changes inthe NAO modes explain also why no significant warminghas been observed these last summers over Svalbard, wherenortherly atmospheric flows are twice as frequent as before.Therefore, the recent warmer summers over GrIS and CAAcannot be considered as a long-term climate warming butare more a consequence of NAO variability affecting atmo-spheric heat transport. Although no global model from theCMIP5 database projects subsequent significant changes in
NAO through this century, we cannot exclude the possibilitythat the observed NAO changes are due to global warming.
1 Introduction
Since 2007, a succession of summers with record surfacemelt rates has been observed over the Greenland ice sheet(GrIS) (Tedesco et al., 2008a,b, 2011, 2012; Rignot et al.,2011; Box et al., 2012; Hanna et al., 2012), coinciding withminimums in the Arctic sea ice cover (Serreze et al., 2007;Comiso et al., 2008). Except for 2009, the surface meltover 2007–2012 summers is unprecedented in the last 50 yrreanalysis-forced reconstructions (Van den Broeke et al.,2009; Fettweis et al., 2011b; Tedesco et al., 2011, 2012).Recent melt records agree with a trend of increased meltover the GrIS, which has been observed since the end ofthe 1990s (Mote, 2007; Fettweis et al., 2011b) and attributedto increased atmospheric greenhouse gas concentration (Fet-tweis, 2007; Hanna et al., 2008). This trend has also been ob-served in the Canadian Arctic Archipelago (CAA) where the2005–2009 melt was four times greater than the 1995–2000mean (Gardner et al., 2011; Sharp et al., 2011; Fisher et al.,2012). But, no significant warming has been observed since2004 over Svalbard located 500 km to the east of the GrIS.As a result, the increased mass loss rate observed from 1996(Bamber et al., 2005) was no longer observed after 2004,and more recent Svalbard elevation change has been closerto zero (Moholdt et al., 2010).
Published by Copernicus Publications on behalf of the European Geosciences Union.
242 X. Fettweis et al.: Greenland melt and general circulation
The 2007–2012 warming recently observed over the GrISdid not occur everywhere in the Arctic because it wasmainly driven by anomalies in the atmospheric dynamics lo-cally impacting the heat transport (Mote, 1998; Graversenet al., 2008). These general circulation anomalies come fromchanges in the North Atlantic Oscillation (NAO) variabilityas pointed out byChylek et al.(2004), Fettweis et al.(2011a),Box et al. (2012) andHanna et al.(2012). Indeed, the lastsix summers were characterized by persistent negative NAOmodes, favouring warmer and more anticyclonic (drier) con-ditions than normal over the GrIS (Box et al., 2012; Hannaet al., 2012) but, conversely, by normal conditions over Sval-bard, as we will see later.
Therefore, in this paper we evaluate the role of the atmo-spheric dynamics in the 1993–2012 melt increase over GrISand more generally of the warming of the atmosphere justover the GrIS surface (here at 700 hPa) in summer with thehelp of
– a Circulation Type Classification (CTC) that extractsthe main regimes of the mid-tropospheric general cir-culation. This allows us to show the changes in the at-mospheric dynamics explaining the recent melt recordsover the GrIS;
– a flow-analogue method that enables us to estimate thepart of the warming due to changes in atmospheric dy-namics. This estimation is achieved by reconstructingthe climate of the last 20 summers with the help of ana-logue flows (i.e. similar tropospheric patterns) whichoccurred during the 1961–1990 summers (our referenceperiod). In theory, if we assume that the more recent1993–2012 warming was solely driven by changes inatmospheric circulation, an equivalent warming shouldbe reconstructed by replacing the current daily climatewith that taken from the dates of analogous flows in thepast.
2 The last two decades over Greenland in a longer-termperspective
As shown in Fig.1a, the June–July–August (JJA) meltwaterproduction over the GrIS has been increasing since 1995 andis without precedent in 1998, 2003, 2007, 2008, and 2010–2012 compared with the last 50 yr. Over the last 20 yr (1993–2012), the amount of melt has doubled compared with 1961–1990. Results from the regional climate model MAR (Fet-tweis et al., 2011b) forced by ERA-40 (1958–1978,Uppalaet al., 2005) and ERA-INTERIM (1979–2012,Dee et al.,2011) reanalyses from the European Centre for MediumRange Weather Forecasts (ECMWF) are used here becauseno observations of meltwater production are available at thescale of the whole ice sheet. Only the melt extent can bederived from satellite (Fettweis et al., 2011b; Hanna et al.,2012) but, while melt extent and meltwater production are
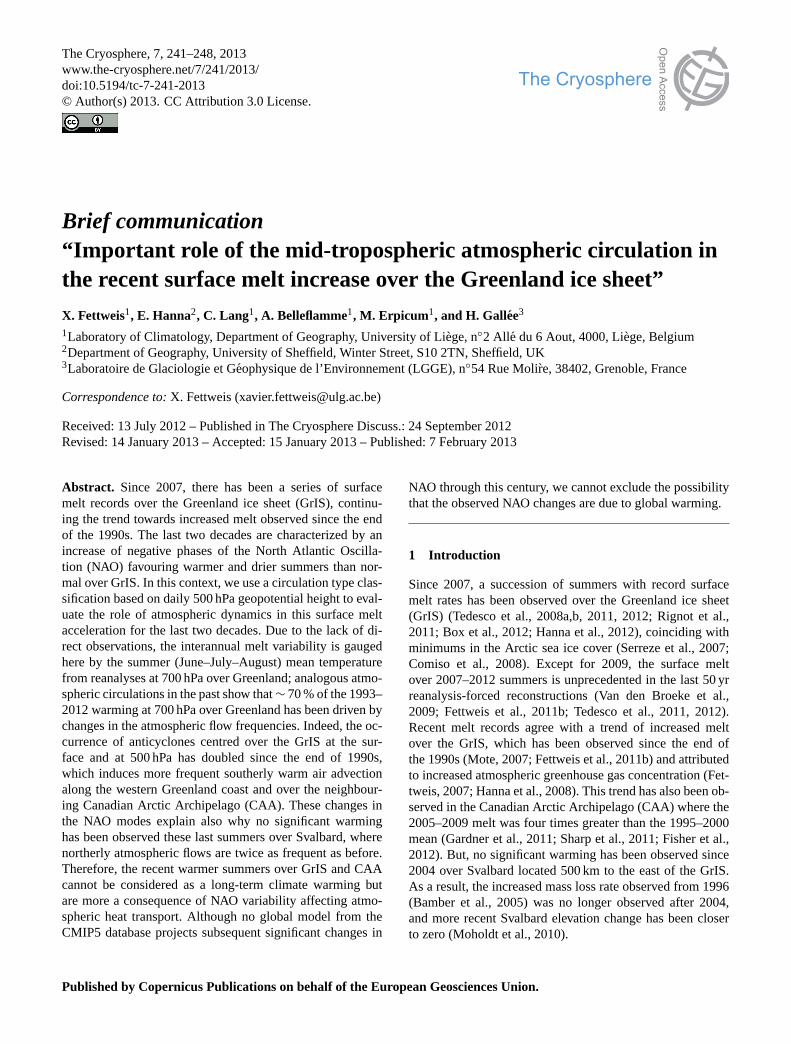
Fig. 1. (a) Normalised time series of the annual GrIS meltamount simulated by MAR (in red) and of the JJA T700 aver-aged over the area covering Greenland (20◦ W ≤ longitude≤ 70◦ Wand 60◦ N ≤ latitude≤ 85◦ N) from the NCEP-NCAR reanalysis (inblack). The smoothed lines show the 10-yr running mean of the timeseries.(b) Normalised time series of the JJA Z500 averaged overthe area covering Greenland (in blue), of the JJA SLP (in green),of the Z500 based NAO index (in red) from the Climate PredictionCenter (CPC) of the National Oceanic and Atmospheric Adminis-tration (NOAA) and of the SLP-based NAO index (in orange) fromthe Climate Research Unit (CRU). Here the sign of the NAO in-dexes time series has been changed to be consistent with the othertime series.(c) Evolution (in percentage) of the number of occur-rences of each circulation class shown in Fig.3 for each summerfrom 1958 to 2012. A 10-yr running mean is applied here.(d) Timeseries in◦C of the JJA T700 averaged over the area covering Green-land (in black) and of the T700 averaged over the days contained ineach type of the CTC. Only 10-yr running means are shown here.The same figure using a 3-yr running mean is provided in the Sup-plement. Anomalies are relative to the 1961–1990 baseline period.(e) Time series in◦C of the JJA T700 averaged over the area cov-ering Greenland (in black), of the analogues-based T700 (in blue)and of the analogues-based T700 plus the anomaly of the globalannual NCEP-NCAR 2-m-temperature (in red) compared with the1961–1990 mean.
The Cryosphere, 7, 241–248, 2013 www.the-cryosphere.net/7/241/2013/
X. Fettweis et al.: Greenland melt and general circulation 243
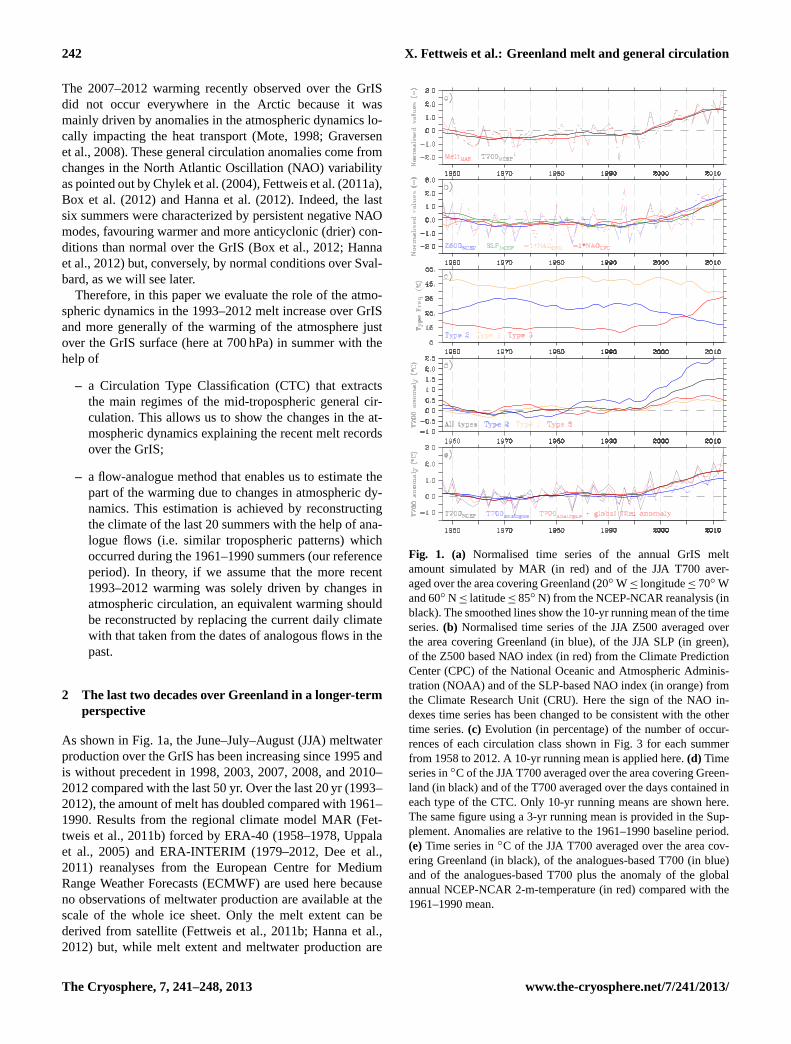
Fig. 2. (a) The JJA T700 changes over 1993–2012 based on a linear regression using the NCEP-NCAR reanalysis. The areas where thechanges are two times above the 1961–1990 JJA T700 standard deviation are hatched.(b) The same as(a) but derived using the NCEP-NCAR-based T700 analogues.
highly correlated (Fettweis et al., 2006), melt extent cannotbe used as a direct proxy of meltwater production. Indeed, forthe same melt extent, the amount of meltwater can be verydifferent and depends on the presence and extent of bare icezones (which have a lower albedo and higher melt rate thanmelting snow) in the melt area. The ability of MAR to simu-late the melt extent has been shown inFettweis et al.(2011b).
Apart from being affected by the surface albedo or theinertia of the snowpack, the melt amount is driven by theatmospheric temperature and, therefore, the temperature at700 hPa (T700) is an excellent proxy for explaining themelt variability. Indeed, the MAR-based meltwater produc-tion variability is highly correlated (correlation coefficient of0.93) with JJA T700 from the Reanalysis version 1 (Kalnayet al., 1996) of the National Centers for Environmental Pre-diction (NCEP) and the National Center for AtmosphericResearch (NCAR) averaged over an area covering the GrIS(20◦ W ≤ longitude≤ 70◦ W and 60◦ N ≤ latitude≤ 85◦ N).Let us remember that MAR is forced by the ECMWF reanal-ysis. The correlations are lower (< 0.9) for NCEP-NCARtemperatures taken at lower vertical levels than 700 hPa.Knowing that the temperature in the free atmosphere dependsdirectly on the atmospheric dynamics, we will discuss here-after the recent warming at 700 hPa over Greenland insteadof the surface melt increase itself (see Fig.1a).
In parallel with enhanced melt since the end of the 1990s,we observe an increase of the JJA geopotential height at500 hPa (Z500) and the JJA sea level pressure (SLP) overthe GrIS due to the increased occurrence of negative NAOphases in recent summers (see Fig.1b). This means that theatmospheric dynamics in summer is currently more anticy-clonic (both at the surface and at 500 hPa) over GrIS than
20 yr ago. This configuration tends to favour warm air advec-tion over the west side of the GrIS due to weaker Icelandiclows (Fig.2a), as found byHanna et al.(2012). Indeed, mostof the significant temperature increase has occurred along thewestern coast of Greenland and over the CAA. Along theeastern coast, over the adjacent part of the North AtlanticOcean and over Svalbard, the temperature changes are notstatistically significant (Fig.2a). This regional disparity ofwarming agrees with trends from climate station records pre-sented byHanna et al.(2012).
The Z500, T700, SLP used here come from the NCEP-NCAR reanalysis over 1958–2012. To check the sensitivityof our results to the choice of a particular dataset, we pro-duced similar figures to Figs.2 and 3 but this time basedon the ECMWF ERA-40 (1958–1978) and ERA-INTERIM(1979–2012) reanalyses – see Supplement – although it isnoted that the ECMWF-based time series (composed of twodifferent reanalyses) is not homogeneous. In summer for ex-ample, T700 over GrIS is lower in ERA-40 than in ERA-INTERIM over the common period (1979–2001) (Fettweiset al., 2012). Such discrepancies impact the analogue-basedreconstruction because ERA-40 based T700 is used to recon-struct the current ERA-INTERIM based T700.
3 Methodology
3.1 Circulation type classification
The automatic CTC method used here is adapted from theapproach ofLund (1963), i.e. our CTC characterises eachpair of days by a similarity index based on the daily Z500and uses it afterwards to group days with similar circulations
www.the-cryosphere.net/7/241/2013/ The Cryosphere, 7, 241–248, 2013
244 X. Fettweis et al.: Greenland melt and general circulation
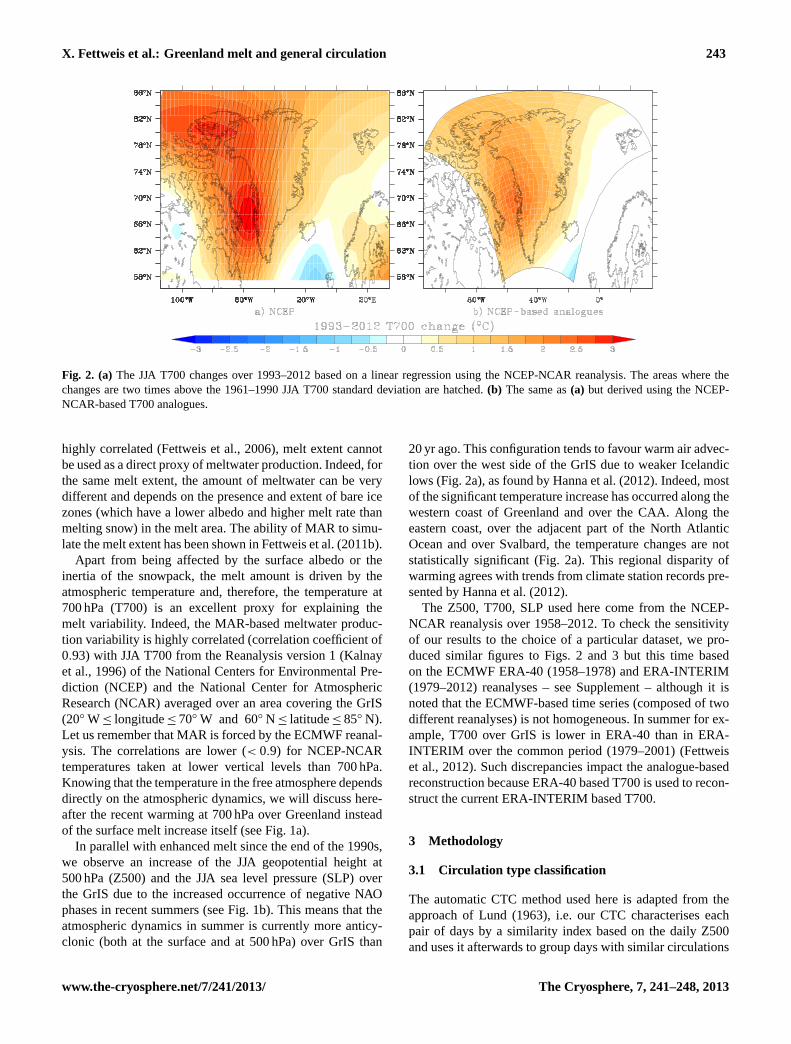
Fig. 3. (Top) The Z500 average over the days categorized intothe 3 classes minus the JJA Z500 average over the whole period1958–2012. The solid lines (Z500> 5500 m) and the dashed lines(Z500≥ 5500 m) denote the Z500 type-average. For each circula-tion type, the proportion of days contained in that class comparedto the 5060 days of the 1958–2012 JJA months is indicated in brack-ets. (Below) The lower panels show much the same but for T700.The daily mean NAO index from CPC when the considered circu-lation type occurs is listed. Both Z500 and T700 fields come herefrom the NCEP-NCAR reanalysis.
(Philipp et al., 2010). In the original classification ofLund(1963), the correlation between the SLP surfaces is used toevaluate the similarity between two days. Here, in view of theGrIS topography, it is better to use the Z500 surfaces (the icesheet top reaches an altitude above that of the 700 hPa pres-sure plane). The correlation-based index treats two parallelbut distant Z500 surfaces as similar because they have thesame pattern. However, if the Z500 surfaces are at differentheights, this means that the temperature of the tropospherebelow 500 hPa is different. Therefore, these two Z500 sur-faces will not have the same impact on the surface melt andthen, they cannot be considered as similar in our case. Henceour similarity index is as well a function of the euclideandistance between the two Z500 surfaces, which gives moreweight to the height of the Z500 surfaces in our CTC.Fet-tweis et al.(2011a) showed that the melt variability over theGrIS is driven more by the height of the Z500 surfaces thantheir pattern. We refer toFettweis et al.(2011a) for more de-tails about our CTC and the choice of our index. The onlydifference withFettweis et al.(2011a) is the domain whichhas been enlarged here to include Svalbard and Ellesmere is-lands. In addition, the number of circulation types allowed inour CTC (fixed to eight inFettweis et al., 2011a) is here set
to three, to distinguish only neutral (i.e. close to the climato-logical mean), cyclonic and anticyclonic regimes.
3.2 Flow analogues
The flow-analogue method, used here for estimating the JJAtemperature anomalies at 700 hPa induced by the general cir-culation, is similar to that ofVautard and Yiou(2009), i.e. foreach JJA day of the 1958–2012 period, flow analogues are se-lected in a 30-day window centred on this given day but notin the same year. This means that the analogues of the 1st ofJuly 1958 are looked for between the 16 June and the 15 Julyfrom other summers than 1958. As for the CTC, our similar-ity index (defined in the previous section) is used to selectthe most similar Z500 surfaces to a given day. Its value ischosen to have analogues in at least ten different summersto avoid an abnormal summer being “described” by anotherabnormal summer. Thereby, the analogues properly repre-sent the average climate corresponding to a Z500 surface fora given date. With this aim, it is clear that the flow-analoguemethod cannot represent exceptional climate anomalies. Inaddition, since the aim is to estimate the impact of the atmo-spheric dynamics on the last 20 yr melt variability over theGrIS, analogues are only taken from the 1961–1990 sum-mers. The daily analogue T700 is then defined as the medianof daily T700 from the analogue days. As shown in Table S1of the Supplement, our results are not significantly affectedby the different parameters fixed in our methodology (i.e.using analogues in at least 5 or 15 summers instead of 10;20-day or 40-day window instead of 30-day window; meaninstead of the median of the analogue T700; daily anoma-lies instead of raw values; analogues taken in the 1958–2012summers instead of 1961–1990). The uncertainties given inour analogues-based results were derived using the differentconfigurations listed above.
4 Changes in atmospheric dynamics
The three main atmospheric circulation regimes extracted byour CTC are shown in Fig.3 as Z500 anomalies with respectto the JJA Z500 mean. As Z500 depends on the atmospherictemperature below 500 hPa, the pattern of the correspondingT700 anomalies in each circulation type is obviously cor-related to the Z500 one while, as we will show later, T700does not drive our CTC. The main circulation types foundby our automatic CTC are a type (no. 1) close to the JJAclimatology induced by neutral NAO conditions; a cyclonictype (no. 2) induced by positive NAO conditions, and an an-ticyclonic type (no. 3) gauged by negative NAO phases. Onaverage over the period 1958–2012, Type no. 1 occurs 50 %of the JJA time, while only 20 % of JJA daily circulations at500 hPa are classified as anticyclonic (Type no. 3).
The Cryosphere, 7, 241–248, 2013 www.the-cryosphere.net/7/241/2013/
X. Fettweis et al.: Greenland melt and general circulation 245
For the mid-1960s to mid-1990s, both CRU and CPC JJANAO indexes are on average positive (see Fig.1b), indicat-ing more frequent cyclonic circulations at the expense of an-ticyclonic regimes. Before 1965, slightly negative NAO con-ditions prevailed on average, favouring anticyclonic types(see Fig.1c), but those negative NAO phases are insignifi-cant compared with those occurring since 2000. Indeed, overthe last two decades, there has been a significant frequencyincrease (from∼ 15 % to∼ 40 %) of daily circulations clas-sified as anticyclonic Type no. 3. This type favours warmerconditions over Greenland by advecting warm air massesalong its western coast. However, since the atmospheric tem-perature impacts the geopotential height, the increase of oc-currence of Type no. 3 could be an artefact driven by the at-mospheric temperature increase over the last 20 yr. Figure1dshows that such a temperature increase occurs for each typeof the CTC, indicating that the variability of our circulationregimes is independent of the current warming. Moreover,the same CTC based on SLP instead of Z500 shows that thereis also an increase of anticyclonic conditions at the surface,which similarly favours warmer atmospheric conditions inWest Greenland (see Fig. S4a, b in the Supplement).Therefore, such an increase in the occurrence of anticyclonicconditions (both at the surface and altitude) is not an arte-fact of our methodology and is in agreement with the sta-tistically significant temperature increase since the 1990sover Greenland and the neighbouring Canadian islands (seeFig. 2). Over Svalbard, the increasing occurrence of anticy-clones centred over Greenland favours northerly flows induc-ing temperatures rather near the normal, in agreement withKvamsto et al.(2012) who showed that the highest temper-atures over Svalbard were reached at the beginning of the2000s.
5 Atmospheric dynamics induced warming
By using the flow analogues technique, we can evaluate thepart of the currently observed warming over GrIS which is in-duced by anomalies in atmosphere dynamics independentlyof the anthropogenic radiative forcing.
If we use a similarity index only computed over the area(described earlier) covering the GrIS, the correlation betweenthe daily Z500 surfaces averaged over this area and the corre-sponding Z500 analogues-based ones are 0.99 with a RMSEof 13.2 m, knowing that the standard deviation of the dailyarea-averaged Z500 surfaces is 74.2 m. This good compari-son at a daily time scale validates to some extent our flowanalogues technique. We refer to the Supplement for a com-parison in two dimensions (see Fig. S5a, b in the Supple-ment). Such an agreement also shows that the Z500 surfacesfrom the last two decades are not exceptional because ana-logues can successfully be found in the past. But let us re-member that the occurrence of the anticyclone-like Z500 sur-faces during the recent 2007–2012 summers is exceptional.
For T700 averaged over this area, the correlation with thedaily analogues-based T700 is 0.86 with a RMSE of 1.2◦Cgiven that the standard deviation of the daily area-averagedT700 is 2.3◦C over 1993–2012. The comparison is worse forT700 than Z500 since for a same Z500 surface, T700 can bevery different depending on whether there is a low or a highpressure at the surface and on the temperature gradient inthe airmass below 500 hPa. In addition, bearing in mind thatthe climate is currently warming due to the anthropogenicradiative forcing, the T700 associated with a Z500 surfacewas generally lower 20 yr ago than currently (Fig.1d).
Figures1e and2b show the T700 increase induced bythe changes in the general circulation using analogues from1961–1990. The pattern of Fig.2a is well reproduced by theanalogues but the temperature increase is underestimated. In-deed, averaged over Greenland and after having applied a 10-yr running mean, the analogues explain only 69± 4 % (resp.65± 5 %) of the reanalysis-based 1993–2012 (resp. 1983–2012) JJA warming at 700 hPa (see Fig.1d). The linear trendof JJA T700 is 0.1◦C/summer (resp. 0.06◦C/summer). Thepart of the linear trend not explained by the analogues re-sults from the global warming. The global warming gaugedhere by the global annual 2 m temperature from the NCEP-NCAR reanalysis represents 27 % (resp. 31 %) of the NCEP-NCAR based 1993–2012 (resp. 1983–2012) JJA T700 linearincrease. A similar ratio is also found in the ECMWF re-analysis though this time series is not homogeneous over thewhole period (see Supplement). By adding the global annual2 m temperature anomalies (in respect to 1961–1990) to theanalogues based T700 time series, we explain 97± 4 % (resp.98± 5 %) of the NCEP-NCAR based T700 warming. With-out applying a 10-yr running mean to the time series, the re-constructions explain 91 % (resp. 97 %) of the NCEP-NCARbased T700 warming over 1993–2012 (resp. 1983–2012).
By adding the “anthropogenic” signal to the analogues-based signal induced by changes in the general circula-tion, we are able to reconstruct most of the current JJAT700 variability over Greenland. However, since the stateof the atmosphere is unique every day, using analoguesfrom the past for explaining the current climate has lim-itations and cannot reproduce all the behaviours of therecent exceptional summers.
6 Circulation changes and global warming
The use of reanalyses instead of direct observations for de-tecting changes in surface melt over Greenland may be re-garded as perhaps somewhat questionable (Screen and Sim-monds, 2011). However, in agreement withGraversen et al.(2008) andHanna et al.(2012), our results suggest an impor-tant role of the general circulation in the recent GrIS recordsurface melt, independently of global warming and Arc-tic amplification (Serreze et al., 2009). Nevertheless, these
www.the-cryosphere.net/7/241/2013/ The Cryosphere, 7, 241–248, 2013
246 X. Fettweis et al.: Greenland melt and general circulation
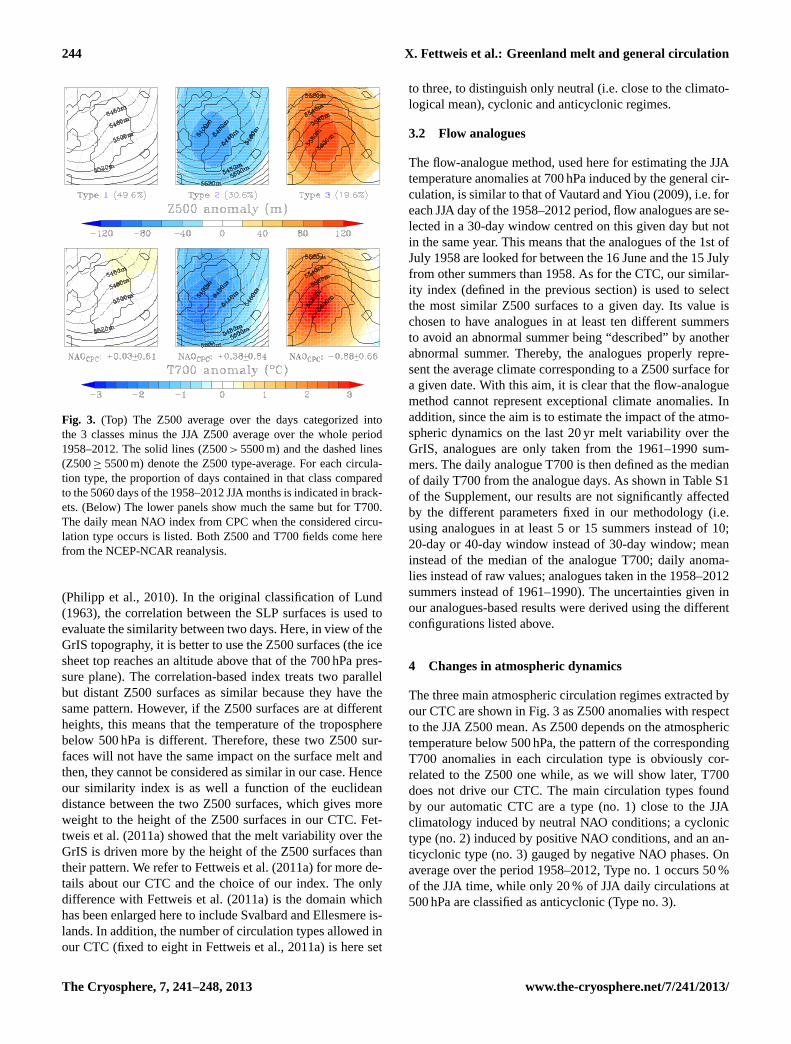
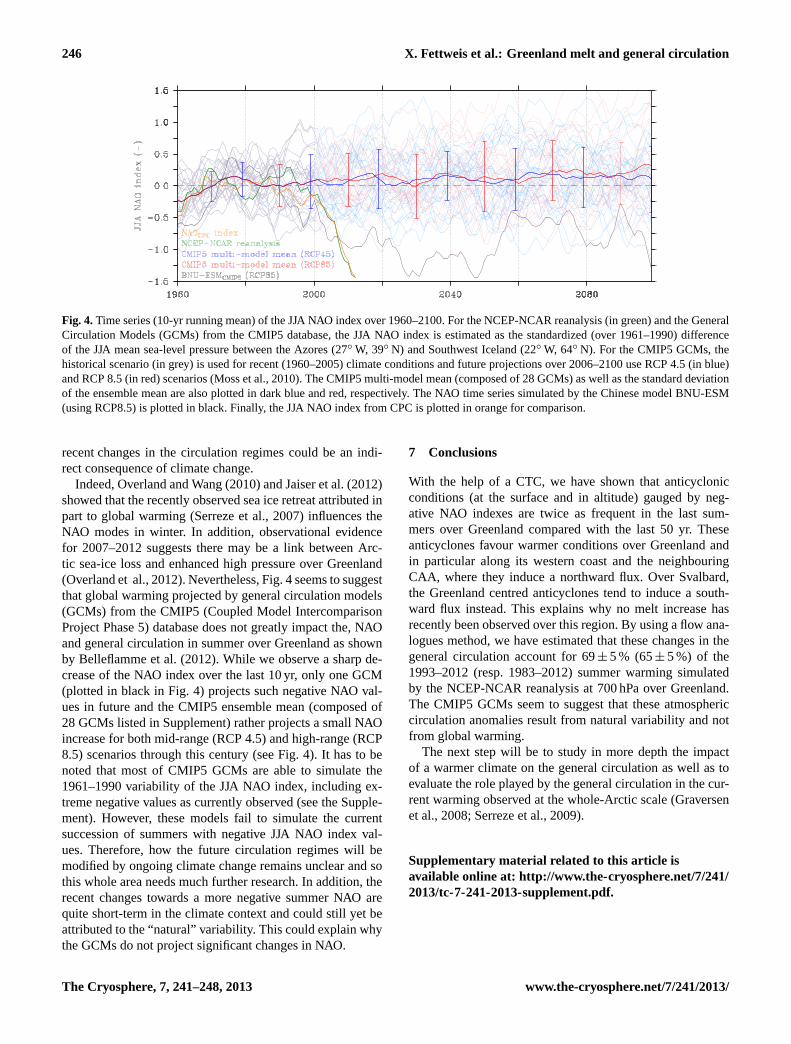
Fig. 4.Time series (10-yr running mean) of the JJA NAO index over 1960–2100. For the NCEP-NCAR reanalysis (in green) and the GeneralCirculation Models (GCMs) from the CMIP5 database, the JJA NAO index is estimated as the standardized (over 1961–1990) differenceof the JJA mean sea-level pressure between the Azores (27◦ W, 39◦ N) and Southwest Iceland (22◦ W, 64◦ N). For the CMIP5 GCMs, thehistorical scenario (in grey) is used for recent (1960–2005) climate conditions and future projections over 2006–2100 use RCP 4.5 (in blue)and RCP 8.5 (in red) scenarios (Moss et al., 2010). The CMIP5 multi-model mean (composed of 28 GCMs) as well as the standard deviationof the ensemble mean are also plotted in dark blue and red, respectively. The NAO time series simulated by the Chinese model BNU-ESM(using RCP8.5) is plotted in black. Finally, the JJA NAO index from CPC is plotted in orange for comparison.
recent changes in the circulation regimes could be an indi-rect consequence of climate change.
Indeed,Overland and Wang(2010) andJaiser et al.(2012)showed that the recently observed sea ice retreat attributed inpart to global warming (Serreze et al., 2007) influences theNAO modes in winter. In addition, observational evidencefor 2007–2012 suggests there may be a link between Arc-tic sea-ice loss and enhanced high pressure over Greenland(Overland et al., 2012). Nevertheless, Fig.4seems to suggestthat global warming projected by general circulation models(GCMs) from the CMIP5 (Coupled Model IntercomparisonProject Phase 5) database does not greatly impact the, NAOand general circulation in summer over Greenland as shownby Belleflamme et al.(2012). While we observe a sharp de-crease of the NAO index over the last 10 yr, only one GCM(plotted in black in Fig.4) projects such negative NAO val-ues in future and the CMIP5 ensemble mean (composed of28 GCMs listed in Supplement) rather projects a small NAOincrease for both mid-range (RCP 4.5) and high-range (RCP8.5) scenarios through this century (see Fig.4). It has to benoted that most of CMIP5 GCMs are able to simulate the1961–1990 variability of the JJA NAO index, including ex-treme negative values as currently observed (see the Supple-ment). However, these models fail to simulate the currentsuccession of summers with negative JJA NAO index val-ues. Therefore, how the future circulation regimes will bemodified by ongoing climate change remains unclear and sothis whole area needs much further research. In addition, therecent changes towards a more negative summer NAO arequite short-term in the climate context and could still yet beattributed to the “natural” variability. This could explain whythe GCMs do not project significant changes in NAO.
7 Conclusions
With the help of a CTC, we have shown that anticyclonicconditions (at the surface and in altitude) gauged by neg-ative NAO indexes are twice as frequent in the last sum-mers over Greenland compared with the last 50 yr. Theseanticyclones favour warmer conditions over Greenland andin particular along its western coast and the neighbouringCAA, where they induce a northward flux. Over Svalbard,the Greenland centred anticyclones tend to induce a south-ward flux instead. This explains why no melt increase hasrecently been observed over this region. By using a flow ana-logues method, we have estimated that these changes in thegeneral circulation account for 69± 5 % (65± 5 %) of the1993–2012 (resp. 1983–2012) summer warming simulatedby the NCEP-NCAR reanalysis at 700 hPa over Greenland.The CMIP5 GCMs seem to suggest that these atmosphericcirculation anomalies result from natural variability and notfrom global warming.
The next step will be to study in more depth the impactof a warmer climate on the general circulation as well as toevaluate the role played by the general circulation in the cur-rent warming observed at the whole-Arctic scale (Graversenet al., 2008; Serreze et al., 2009).
Supplementary material related to this article isavailable online at:http://www.the-cryosphere.net/7/241/2013/tc-7-241-2013-supplement.pdf.
The Cryosphere, 7, 241–248, 2013 www.the-cryosphere.net/7/241/2013/
X. Fettweis et al.: Greenland melt and general circulation 247
Acknowledgements.Xavier Fettweis is a postdoctoral researcherof the Belgian National Fund for Scientific Research and thiswork was partly funded by the ANR CEPS “Green Greenland”project. We thank the European Centre for Medium-RangeWeather Forecasts (ECMWF) for the ERA-40/ERA-INTERIMreanalysis (http://www.ecmwf.int), the NOAA/OAR/ESRL PSD(Boulder, Colorado, US) for the NCEP/NCAR Reanalysis(http://www.esrl.noaa.gov/psd/), the NOAA Climate Predic-tion Center for its NAO index (http://www.cpc.ncep.noaa.gov/)and the Climate Research Unit (CRU) for its NAO index(http://www.cru.uea.ac.uk/). For their roles in producing, co-ordinating, and making available the CMIP5 model output(http://cmip-pcmdi.llnl.gov/cmip5/), we acknowledge the climatemodelling groups (listed in Supplement), the World ClimateResearch Programme’s (WCRP) Working Group on CoupledModelling (WGCM), and the Global Organization for EarthSystem Science Portals (GO-ESSP). Finally, we thank Jan Lenaertsand Nicole-Jeanne Schlegel for their very useful and constructivereviews which greatly improved our paper.
Edited by: E. Larour
References
Bamber, J. L., Krabill, W., Raper, V., Dowdeswell, J. A., and Oer-lemans, J.: Elevation changes measured on Svalbard glaciers andice caps from airborne laser data, Ann. Glaciol., 42, 202–208,2005.
Belleflamme, A., Fettweis, X., Lang, C., and Erpicum, M.: Cur-rent and future atmospheric circulation at 500 hPa over Green-land simulated by the CMIP3 and CMIP5 global models, Clim.Dynam.,doi:10.1007/s00382-012-1538-2, 2012.
Box, J. E., Fettweis, X., Stroeve, J. C., Tedesco, M., Hall, D. K.,and Steffen, K.: Greenland ice sheet albedo feedback: thermo-dynamics and atmospheric drivers, The Cryosphere, 6, 821–839,doi:10.5194/tc-6-821-2012, 2012.
Chylek, P., Box, J., and Lesins, G.: Global warming andthe Greenland ice sheet, Clim. Change, 63, 201–221,doi:10.1023/B:CLIM.0000018509.74228.03, 2004.
Comiso, C., Parkinson, C. L., Gerttsen, R., and Stock, L.: Acceler-ated decline in the Arctic sea ice cover, Geophys. Res. Lett., 35,01703,doi:10.1029/2007GL031972, 2008.
Dee, D. P., Uppala, S. M., Simmons, A. J., Berrisford, P., Poli,P., Kobayashi, S., Andrae, U., Balmaseda, M. A., Balsamo, G.,Bauer, P., Bechtold, P., Beljaars, A. C. M., van de Berg, L., Bid-lot, J., Bormann, N., Delsol, C., Dragani, R., Fuentes, M., Geer,A. J., Haimberger, L., Healy, S. B., Hersbach, H., Holm, E. V.,Isaksen, L., Kallberg, P.; Kohler, M., Matricardi, M., McNally,A. P., Monge-Sanz, B. M., Morcrette, J.-J., Park, B.-K., Peubey,C., de Rosnay, P., Tavolato, C., Thepaut, J.-N., and Vitart, F.:The ERA-Interim reanalysis: configuration and performance ofthe data assimilation system, Quart. J. R. Meteorol. Soc., 137,553–597, 2011.
Fettweis, X.: Reconstruction of the 1979–2006 Greenland ice sheetsurface mass balance using the regional climate model MAR,The Cryosphere, 1, 21–40,doi:10.5194/tc-1-21-2007, 2007.
Fettweis, X., Gallee, H., Lefebre, L. and van Ypersele, J.-P.: The1988–2003 Greenland ice sheet melt extent by passive mi-
crowave satellite data and a regional climate model, Clim. Dy-nam., 27, 531–541,doi:10.1007/s00382-006-0150-8, 2006.
Fettweis, X., Mabille, G., Erpicum, M., Nicolay, S., and van denBroeke, M.: The 1958–2009 Greenland ice sheet surface meltand the mid-tropospheric atmospheric circulation, Clim. Dy-nam., 36, 139–159,doi:10.1007/s00382-010-0772-8, 2011a.
Fettweis, X., Tedesco, M., van den Broeke, M., and Ettema, J.:Melting trends over the Greenland ice sheet (1958–2009) fromspaceborne microwave data and regional climate models, TheCryosphere, 5, 359–375,doi:10.5194/tc-5-359-2011, 2011b.
Fettweis, X., Franco, B., Tedesco, M., van Angelen, J. H., Lenaerts,J. T. M., van den Broeke, M. R., and Galle, H.: EstimatingGreenland ice sheet surface mass balance contribution to fu-ture sea level rise using the regional atmospheric climate modelMAR, The Cryosphere Discuss., 6, 3101–3147,doi:10.5194/tcd-6-3101-2012, 2012.
Fisher, D., Zheng, J., Burgess, D., Zdanowicz, C., Kinnard, C.,Sharp, M., and Bourgeois, J.: Recent melt rates of Canadianarctic ice caps are the highest in four millennia, Global Planet.Change, 84–85, 3–7,doi:10.1016/j.gloplacha.2011.06.005,2012.
Gardner, A. S., Moholdt, G., Wouters, B., Wolken, G. J.,Burgess, D. O., Sharp, M. J., Cogley, J. G., Braun, C., andLabine, C.: Sharply increased mass loss from glaciers and icecaps in the Canadian Arctic Archipelago, Nature, 473, 357–360,doi:10.1038/nature10089, 2011.
Graversen, R. G., Mauritsen, T., Tjernstrom, M., Kallen, E., andSvensson, G.: Vertical structure of recent Arctic warming, Na-ture, 451, 7174, 53–56,doi:10.1038/nature06502, 2008.
Hanna, E., Huybrechts, P., Steffen, K., Cappelen, J., Huff, R., Shu-man, C., Irvine-Fynn, T., Wise, S., and Griffiths, M.: Increasedrunoff from melt from the Greenland ice sheet: a response toglobal warming, J. Climate, 21, 331–341, 2008.
Hanna, E., Jones, J. M., Cappelen, J., Mernild, S. H., Wood, L.,Steffen, K., and Huybrechts, P.: The influence of North At-lantic atmospheric and oceanic forcing effects on 1900–2010Greenland summer climate and ice melt/runoff, Int. J. Climatol.,doi:10.1002/joc.3475, 2012a.
Hanna, E., Mernild, S. H., Cappelen, J., and Steffen, K.: Re-cent warming in Greenland in a long-term instrumental (1881–2012) climatic context: I. Evaluation of surface air tempera-ture records, Environ. Res. Lett., 7, 045404,doi:10.1088/1748-9326/7/4/045404, 2012b.
Jaiser, R., Dethloff, K., Handorf, D., Rinke, A., and Co-hen, J.: Impact of sea ice cover changes on the NorthernHemisphere atmospheric winter circulation, Tellus, 64, 11595,doi:10.3402/tellusa.v64i0.11595, 2012.
Kalnay, E., Kanamitsu, M., Kistler, R., Collins, W., Deaven, D.,Gandin, L., Iredell, M., Saha, S., White, G., Woollen, J., Zhu, Y.,Leetmaa, A., Reynolds, B., Chelliah, M., Ebisuzaki, W., Hig-gins, W., Janowiak, J., Mo, K., Ropelewski, C., Wang, J.,Jenne, R., and Joseph, D.: The NCEP/NCAR 40 year reanaly-sis project, B. Am. Meteorol. Soc., 77, 437–471, 1996.
Kvamsto, N. G., Steinskog, D. J., Stephenson, D. B., andTjostheim, D. B.: Estimation of trends in extreme melt-season duration at Svalbard, Int. J. Climatol., 32, 2227–2239,doi:10.1002/joc.3395, 2012.
Lund, I. A.: Map-pattern typeification by statistical methods. J.Appl Meterol., 2, 56–65, 1963.
www.the-cryosphere.net/7/241/2013/ The Cryosphere, 7, 241–248, 2013
248 X. Fettweis et al.: Greenland melt and general circulation
Moholdt, G., Nuth, C., Hagen, J. O., and Kohler, J.: Recentelevation changes of Svalbard glaciers derived from ICE-Sat laser altimetry, Remote Sens. Environ., 114, 2756–2767,doi:10.1016/j.rse.2010.06.008, 2010.
Moss, R. H., Edmonds, J. A., Hibbard, K., Manning, M.,Rose, S. K., van Vuuren, D. P., Carter, T. R., Emori, S.,Kainuma, M., Kram, T., Meehl, G., Mitchell, J., Nakicenovic, N.,Riahi, K., Smith, S., Stouffer, R. J., Thomson, A., Weyant, J.,and Wilbanks, T.: The next generation of scenarios for climatechange research and assessment, Nature, 463, 747–756, 2010.
Mote, T. L.: Mid-tropospheric Circulation and surface melt on theGreenland ice sheet, Part 1, Int. J. Climatol., 18, 111–130, 1998.
Mote, T. L.: Greenland surface melt trends 1973–2007: evidenceof a large increase in 2007, Geophys. Res. Lett., 34, L22507,doi:10.1029/2007GL031976, 2007.
Overland, J. E. and Wang, M.: Large-scale atmospheric circulationchanges are associated with the recent loss of Arctic sea ice, Tel-lus A, 62, 1–9,doi:10.1111/j.1600-0870.2009.00421.x, 2010.
Overland, J. E., Francis, J., Hanna, E., and Wang, M.: The recentshift in early summer arctic atmospheric circulation, Geophys.Res. Lett., 39, L19804,doi:10.1029/2012GL053268, 2012.
Philipp, A., Bartholy, J., Beck, C., Erpicum, M., Esteban, P., Fet-tweis, X., Huth, R., James, P., Jourdain, S., Kreienkamp, F.,Krennert, T., Lykoudis, S., Michalides, S., Pianko, K.,Post, P., RassillaAlvarez, D., Schiemann, R., Spekat, A., andTymvios, F. S.: COST733CAT – a database of weather and cir-culation type classifications, Phys. Chem. Earth, 35, 360–373,2010.
Rignot, E. I., Velicogna, van den Broeke, M. R., Monaghan, A., andLenaerts, J.: Acceleration of the contribution of the Greenlandand Antarctic ice sheets to sea level rise, Geophys. Res. Lett., 38,05503,doi:10.1029/2011GL046583, 2011.
Screen, J. and Simmonds, I.: Erroneous Arctic temperature trends inthe ERA-40 reanalysis: a closer look, J. Climate, 24, 2620–2627,doi:10.1175/2010JCLI4054.1, 2011.
Serreze, M., Holland, M., and Stroeve, J.: Perspectives on theArctic’s shrinking sea-ice cover, Science, 315, 1533–1536,doi:10.1126/science.1139426, 2007.
Serreze, M. C., Barrett, A. P., Stroeve, J. C., Kindig, D. N., and Hol-land, M. M.: The emergence of surface-based Arctic amplifica-tion, The Cryosphere, 3, 11–19,doi:10.5194/tc-3-11-2009, 2009.
Sharp, M., Burgess, D. O., Cogley, J. G., Ecclestone, M., Labine, C.,and Wolken, G. J: Extreme melt on Canada’s Arctic icecaps in the 21th century, Geophys. Res. Lett., 38, 11501,doi:10.1029/2011GL047381, 2011.
Tedesco, M., Serreze, M., and Fettweis, X.: Diagnosing the extremesurface melt event over southwestern Greenland in 2007, TheCryosphere, 2, 159–166,doi:10.5194/tc-2-159-2008, 2008a.
Tedesco, M., Fettweis, X., van den Broeke, M. R., van deWal, R. S. W., and Smeets, C. J. P. P.: Extreme snowmelt inNorthern Greenland during summer 2008, Eos Trans. AGU, 89,391–391,doi:10.1029/2008EO410004, 2008b.
Tedesco, M., Fettweis, X., van den Broeke, M., van de Wal, R.,Smeets, P., van de Berg, W. J., Serreze, M., and Box, J.: The roleof albedo and accumulation in the 2010 melting record in Green-land, Environ. Res. Lett., 6, 014005, 1–6,doi:10.1088/1748-9326/6/1/014005, 2011.
Tedesco, M., Fettweis, X., Mote, T., Wahr, J., Alexander, P., Box, J.,and Wouters, B.: Evidence and analysis of 2012 Greenlandrecords from spaceborne observations, a regional climate modeland reanalysis data, The Cryosphere Discuss., 6, 4939–4976,doi:10.5194/tcd-6-4939-2012, 2012.
Uppala, S. M., Kallberg, P. W., Simmons, A. J., Andrae, U., daCosta Bechtold, V., Fiorino, M., Gibson, J. K., Haseler, J., Her-nandez, A., Kelly, G. A., Li, X., Onogi, K., Saarinen, S., Sokka,N., Allan, R. P., Andersson, E., Arpe, K., Balmaseda, M. A.,Beljaars, A. C. M., van de Berg, L., Bidlot, J., Bormann, N.,Caires, S., Chevallier, F., Dethof, A., Dragosavac, M., Fisher, M.,Fuentes, M., Hagemann, S., Holm, E., Hoskins, B. J., Isaksen, L.,Janssen, P. A. E. M., Jenne, R., McNally, A.P., Mahfouf, J.-F.,Morcrette, J.-J., Rayner, N. A., Saunders, R. W., Simon, P., Sterl,A., Trenberth, K. E., Untch, A., Vasiljevic, D., Viterbo, P., andWoollen, J.: The ECMWF re-analysis, Q. J. Roy. Meteor. Soc.,131, 2961–3012,doi:10.1256/qj.04.176, 2005.
Van den Broeke, M. R., Bamber, J., Ettema, J., Rignot, E.,Schrama, E., van de Berg, W. J., van Meijgaard, E., Velicogna, I.,and Wouters, B.: Partitioning recent Greenland mass loss, Sci-ence, 326, 984–986, 2009.
Vautard, R. and P. Yiou: Control of recent European surface climatechange by atmospheric flow, Geophys. Res. Lett., 36, 22702,doi:10.1029/2009GL040480, 2009.
The Cryosphere, 7, 241–248, 2013 www.the-cryosphere.net/7/241/2013/