final scientific/technical report - energy.gov · final scientific/technical report submitted to...
TRANSCRIPT

Final Renewable Energy Feasibility Report to National Renewable Energy Laboratory Page 1
Final Scientific/Technical Report Submitted to the US Department of Energy, Golden Field Office, September, 2006 DOE Award Number DE-FG36-04GO14020 Name of Recipient: Kenaitze Indian Tribe, IRA, Kenai, Alaska Project Director: Brenda Trefon, Tribal Environmental Program Director Team Members: Rita Smagge, Connie Wirz, Executive Directors Brian Hirsch, Deerstone Consulting, Technical Assistance David Mogar, Specialty Electric, Technical Assistance Mia Devine, Alaska Energy Authority, Technical Assistance Cliff Dolchok, AEA Engineering Assistant, Kenaitze Tribal Member
Title:
Kenaitze Indian Tribe Wind and Solar Feasibility Study The information and data in this report is for the purposes of this DOE grant award, and are not authorized for other distribution or duplication in any form without consent of the Kenaitze Indian tribe, IRA.

Final Renewable Energy Feasibility Report to National Renewable Energy Laboratory Page 2
Executive Summary
The Kenaitze Indian Tribe completed this Renewable Energy Resource Development Feasibility Study in June, 2006. The study focused on wind and solar energy resources for the tribe, for future tribal operations and housing, and the possibility of energy development for sale to local energy providers. With the assistance of several technical advisors, including engineers and electricians, we collected wind and solar data at a 30-meter meteorological tower constructed on tribal land from January of 2004, until June, 2006. Our wind resource summary showed this site had a poor rating for wind power. We were surprised by that, as is usually “feels windy” in our area. The solar study showed somewhat better results; we had more solar energy available than other areas in Alaska, but not a high amount compared to the rest of the world. The benefits of this project to our community were, however, outstanding. This project gave us an opportunity to demonstrate the possibilities of local renewable energy resources. We had access to technical advisors for long term planning and education about renewable energy specific to our area. The project also increased the awareness of renewable energy resources in our community, as several energy meetings were held, educational demonstrations were done with tribal families and the Headstart students and staff, and we produced a short video on why the tribe wanted to do this project, and many people became involved in the process of this wind and solar energy feasibility study.

Final Renewable Energy Feasibility Report to National Renewable Energy Laboratory Page 3
Part I Project Activities, Summary, and Lessons
Learned
Project Overview and Accomplishments
The Kenaitze Indian Tribe, IRA is a federally recognized Indian Tribe located in Kenai, Alaska, with a service area which includes the Central Kenai Peninsula, with a population base of 29,728. The Tribe has 1,231 members, and serves 3,500 Native American and Alaska Natives. The purpose of this study was to determine the feasibility of developing wind and solar energy resources for tribal operations and future tribal housing, education and dissemination of this information to our community, and to examine energy development for sale to local energy providers. The project began with determining a site to construct a 30-meter meteorological tower for collecting the data. After the site was chosen, data was collected over approximately 18 months. We received help from the Alaska Energy Authority for lending of a tower, as well as technical assistance for a detailed Wind Resource Assessment Report. We also hired a consultant with Deerstone Consulting for the Feasibility Study Report which includes details on the original hypothesis, methodology, and assessment of project results and possibilities for Tribal renewable energy plans in the future. These reports and data summaries are included as attachments to this Final Report/Summary. OBJECTIVES, ACCOMPLISHMENTS, and CHALLENGES ALONG THE WAY: The study began with nine primary objectives: 1. To assess the available wind energy resources on Tribal land. 2. To assess solar energy resources on Tribal land. 3. To characterize and quantify thermal end electrical loads for Tribal facilities/homes. 4. To assess the feasibility of energy export to local utilities. 5. To identify appropriate renewable energy technologies to meet Tribal needs. 6. To develop and analyze cost estimates and long term economic benefits for renewable energy technologies (economic analysis). 7. To complete an environmental assessment of the technologies chosen by the Tribe. 8. To assess the direct and indirect benefits of selected renewable energy technologies including social and cultural benefits. 9. To develop an implementation plan including preliminary system designs, staff training plans, long term operational and maintenance plans, and business planning. In retrospect, it seems plain to see these objectives were over reaching for a one-year project, funded on less than $50,000, but at the time we were optimistic and felt all these objectives could

Final Renewable Energy Feasibility Report to National Renewable Energy Laboratory Page 4
be reached. Due to unforeseen circumstances, such as severe weather which left part of the anenometor out of service until the tower could be lowered in the spring of 2004, repaired, and re-installed – we extended this project over a longer period to be able to collect twelve months of good date to see the year-round wind and solar resources. After extending the project period, we were able to accomplish the objectives as appropriate to the amount of time and funding we received. Objective 1: Accomplished. We were able to collect the data and complete an assessment, but the results showed we had a poor wind resource at the chosen site. Choosing the site was a challenge in itself. After several tours of possible sites, and researching maps and aerial photos of tribal lands, we chose a site near out main office. This seemed logical, as it was close to the local electric provider’s inter-tie, and would be accessible as a power source for our administrative offices and greenhouses. The original site we wanted, was a bluff and beach site along Cook Inlet. We learned the wind here was “swirling” and not a steady source of directional wind. We also could not construct a 30-meter tower near eagle nesting or feeding areas along the inlet. The chosen site also needed various permits from Fish and Wildlife Service, and the FAA, as we were located near the airport. The tower itself was also difficult to transport and construct, requiring several trucks, winches, other people, earth anchors, and combating the weather. Objective 2: Accomplished. We had the same difficulties in constructing the tower at an appropriate site, but we were able to complete a solar resource assessment. In brief, the solar power was stronger than some other areas in Alaska, but not strong on a global scale. For example, the Kenaitze Solar Chart (Feasibility report), shows that we can expect 60% of the rated out-put of the solar panels at this site. If we had a 75 watt solar panel, we would only get 60% of that power, or 45 watts. Additional details of the assessment are included in the following “feasibility” report. Objective 3: We did have an electrician quantify thermal and electrical loads for the Tribe’s main office building at 255 Ames Road, in Kenai, Alaska. An assessment of homes is unrealistic for the amount of time and funding we had available. We did have information available to families at a Tribal Energy Meeting in 2004, for ways they can reduce electrical loads at home and easy ways to conserve energy in their homes. This information was also made available at several other meetings in our community. Objective 4: We did assess the feasibility of exporting energy, but found the wind and solar sources are not cost effective or sufficient to export. There remains the possibility of harnessing tidal power, which needs additional research. Objective 5: We did identify appropriate renewable energy technologies for the Tribe, but learned it was not the wind power we were expecting to use. We learned about tidal energy and further research is needed to begin any future plans to use this type of energy here. Solar energy can be used for small scale power at some of the Tribe’s seasonal (summer) facilities, such as the K’Beq heritage site, and the Salamatof Tribe’s Spirit Lake camp buildings, which do not have any electricity. Some ideas are using solar panels for emergency power, lights, and back-up power such as a generator. Objective6: The economic analysis was brief, due to the lack of sufficient wind power. Cost estimates are included in Part II of this report, the “Feasibility Report.”

Final Renewable Energy Feasibility Report to National Renewable Energy Laboratory Page 5
Objective 7: An environmental assessment was not necessary, and should not have been listed as an objective in this work plan. A brief environmental assessment of the wind tower site was done and presented to the US Fish and Wildlife office, and concerned only the possibility of eagle nesting in the area, which is not a concern at that tower site, which is mostly tundra with a large pre-existing gravel pad, some small black spruce and cottonwood trees, and not eagle nesting habitat. Objective 8: “Assessing the benefits” of renewable energy on a social or cultural scale would entail a large study with human subjects, not appropriate to this grant or project. We did, however, hold several meetings with Tribal Council, family members, and elders, to discuss the importance of renewable energy resources. The feelings were unanimously positive in learning more about renewable energy, and even educating people about ways Kenaitze Dena’ina Indians conserved energy and resources in traditional ways. We used additional grant funding to hold a Alaska Native Science camp in 2005, and environmental education day camps in 2004, 2005, and 2006 to reach young people to teach them about traditional conservation and resource use, and plans for resource conservation and management in the future. We also produced a short DVD/video about how our Tribe is working to learn about renewable energy and return to basic on respecting our resources. Objective 9: Operational, maintenance plans and business planning were based on the assumption that we would have a wind source of energy to work into a business plan. This was not the case, however, we did accomplish the “Feasibility Report” which gives suggestions for future planning, and realistic goals. Additional activities: Although not listed as objectives in the original plan, attending the Tribal Renewable Energy Conference in Colorado was useful. We also presented a DVD/video of our plans for renewable energy at the 2004 conference, and a Powerpoint presentation of the study and goals at the 2005 conference. We also held a Tribal renewable Energy meeting and workshop in 2004. Results from this study and education about our plans for using renewable energy were shared with our Tribal Council, staff, Headstart school, and other meetings in our community. LESSONS LEARNED As mentioned before, site selection for raising the meteorological tower presented some technical difficulties. The tower needed several permits before being able to be raised, and the size of the tower required a large working area, earth anchors, and trucks, winches, and several people on-hand. We had problems with the tower and a storm, so the tower had to be lowered, parts repaired, and re-raised. This caused us to lose several months of data, and due to ice conditions and heavy snowfall, we could not repair the tower until spring, so the grant was extended to allow an additional year for new data. The main problem we had with the wind source is that it never blows longer than 12 hours in any steady direction or strength. This is a result of being inland, away from the coastal wind. The other problem in Kenai, is that much of the coastal area is a bluff, which causes local turbulence. Getting out into the water, would improve the wind power substantially.

Final Renewable Energy Feasibility Report to National Renewable Energy Laboratory Page 6
We did not have any problems with birds or other wildlife from the tower. We learned that the snow reflected solar power and gave us better results in the winter than we had expected, as we have very short daylight hours here during the winter. The solar sensor on the tower was flat, and does not track with the sun’s direction or angle. A solar panel able to track, may have better results. This would be a worthwhile experiment. The best lesson learned is that a feasibility study is worth the effort. We expected different results, and learned that our best bet for renewable energy may not be wind or solar power, but study of tidal energy may be the next step. We did learn we can use solar panels for some benefit, but not enough to run on solar alone.
Conclusions and Recommendations
The results of our feasibility study are summarized in this report, as listed with our accomplishments for each of the study objectives. In conclusion, we learned the wind power was a poor source for energy at our location, and not cost-effective. The solar power is about 60% efficient, which is enough to off-set electrical costs or find a power source for a remote location, however, may not be cost-effective as an energy source for re-sale to the local energy provider. The recommendations also include further research for developing tidal energy. We are located in an area with strong tides, and this may be e better renewable energy source than wind for our community. Details of these recommendations and business plan are available in Part II of this report, the “Feasibility Report”.

Final Renewable Energy Feasibility Report to National Renewable Energy Laboratory Page 7
Part II Renewable Energy Feasibility Report
The Kenaitze Indian Tribe (KIT) contracted with Brian Hirsch, Ph.D., of Deerstone Consulting to assist with implementation of the project, and to write this Feasibility Report. David Mogar of Specialty Electric was subcontracted and also assisted with project implementation and this report. The primary focus of the study was to examine the feasibility of commercial-scale wind energy to be sold back to the railbelt utility grid that serves the majority of Alaska’s population extending from the southern Kenai Peninsula up to Fairbanks. Such energy sales could provide economic development and revenue generating opportunities for the Tribe. The secondary focus of the study was to examine the Tribe’s energy use to determine energy saving opportunities and small-scale use of renewable energy for residential or Tribal applications.
Wind Resource Monitoring
KIT Environmental Director Brenda Trefon, along with project consultants Brian Hirsch and David Mogar, met with the Tribal Council in August 2004 to discuss issues such as land ownership, Tribal goals for the project, and possible siting options and constraints. A suitable site on Tribal land (near the Tribe’s offices on Ames Rd.) was eventually selected for wind monitoring. This site was selected for several reasons, including its proximity to Cook Inlet and possible strong and energetic winds, nearby power lines to receive wind generated electricity if the site was feasible for commercial production, Tribal ownership, ease of construction with the gravel pad, and proximity to the Tribal office for monitoring and safety of the monitoring tower and equipment. A community meeting was held in the fall of 2004 to introduce the project and renewable energy concepts in general to the Kenaitze community. Brenda Trefon and Brian Hirsch attended the meeting along with over twenty community members. A DOE-NREL video on Tribal wind development in the lower 48 United States was shown to highlight some successes and possibilities, though it was made very clear that at this early stage, it was unknown if the Tribe had adequate wind resources to consider a commercial scale energy project, and that this was the primary purpose of the study. Alaska Energy Authority (AEA) provided a wind monitoring tower through AEA’s Anemometer Loan Program. In total two anemometers (wind speed measuring devices) were installed on the tower, one at 100 feet elevation and one at 75 feet elevation. Anemometers are typically installed at different heights to measure the wind shear, which is the change in wind speed with respect to elevation. Generally, wind speed increases with elevation as there is less to interfere with the wind higher above the ground. In this case, the wind shear was measured over a 25 foot span (between 75 and 100 feet above the ground). This value can be used to estimate wind speed at higher elevations that would be more typical of commercial-scale wind energy production, which often occurs with wind turbines atop 250 foot tall towers.
Final Renewable Energy Feasibility Report to National Renewable Energy Laboratory Page 8
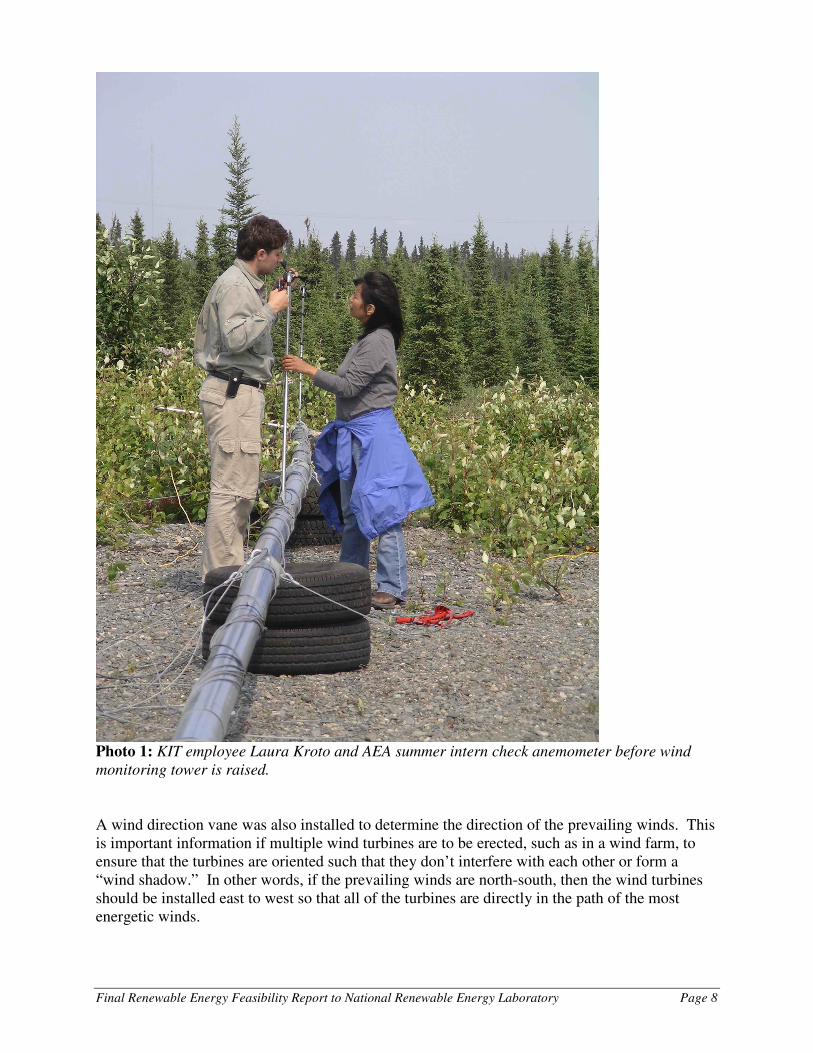
Photo 1: KIT employee Laura Kroto and AEA summer intern check anemometer before wind
monitoring tower is raised.
A wind direction vane was also installed to determine the direction of the prevailing winds. This is important information if multiple wind turbines are to be erected, such as in a wind farm, to ensure that the turbines are oriented such that they don’t interfere with each other or form a “wind shadow.” In other words, if the prevailing winds are north-south, then the wind turbines should be installed east to west so that all of the turbines are directly in the path of the most energetic winds.

Final Renewable Energy Feasibility Report to National Renewable Energy Laboratory Page 9
A temperature sensor was also included with the wind monitoring tower package. When the air is colder, it is also denser, and thus “thicker,” which results in more mass and energy to spin a turbine at the same wind speed. Thus, more energy is produced from a 15 mile per hour wind at 0 degrees Fahrenheit than from a 15 mile per hour wind at 45 degrees Fahrenheit. In other words, wind at the same wind speed generally produces more energy in the winter than in the summer, which is a good fit with typical energy demand in Alaska, since more energy for heating and electricity is used in winter than in summer. By measuring wind speed, wind shear, wind direction, and air temperature at a particular site, it is possible to determine the energy production potential of that site. That was the goal of this portion of the project.
Photo 2: This is the wind monitoring tower loaned by Alaska Energy Authority to KIT to
measure wind energy production potential. Note the bird deterrent devices hanging from the guy
wires that were used to minimize bird collisions. The temperature sensor is the small device at
the very bottom of the picture just to the right of the tower.

Final Renewable Energy Feasibility Report to National Renewable Energy Laboratory Page 10
The wind monitoring tower was first installed in November, 2004. Because of icing and other equipment malfunctions, the tower was taken down, some equipment was repaired and checked for accuracy, and the tower was raised again in March, 2005. At this time KIT added a pyronometer to measure solar input at the site to determine the available solar resource for heating and making electricity from the sun. The results of the wind study are discussed in the next section and in Appendix 1 of this report. The results of the pyronometer data collection effort are also discussed below.
Tribal Electrical Use
In August 2005, an electrical use analysis was conducted of the KIT Tribal office complex, including the main office building, the Housing Department building, and the greenhouse facilities. Monthly electric bills for the previous year were also assessed. A detailed report was generated from that analysis and provided to the Tribe at that time. The primary highlights included:
� The main administrative building uses the most power, by far, of all the separate facilities.
� On average, the greenhouse facility has experienced a 300% increase in electric power use over the first seven months of 2005, as compared to the entire year of 2004. This includes the month of July, 2005, in which the greenhouse did not consume any power.
� The Housing facility has consumed roughly the same amount of total electricity as the greenhouse over the last 2.5 years, but energy use for the Housing facility has grown consistently and regularly over this time period, from an average of 557 kiloWatt-hours/month (kWh/month) for all of 2003, to 967 kWh/month for the first seven months of 2005.
� It appears the greenhouse is consuming a great deal of power that is not being used. For example, a continuous (24 hours a day, 7 days a week) 400 watt load from the heat tape connected to the water heater and supply pipe was observed in the summer. Eliminating this and other loads in the greenhouse could save significant energy and money.
� The most apparent and cost effective means of saving electricity for the main Administration building, which is by far the main electric consuming facility in the area, is through improved lighting.
� Aggregate electricity use within the Tribal complex of buildings that are serviced by the five meter loops is increasing significantly on a monthly average basis.
Along with wind power and solar electric production, this feasibility study also briefly considers other technologies such as solar thermal applications (using the heat from the sun to make hot water or heat buildings) and tidal energy. These technologies and research findings are discussed below.

Final Renewable Energy Feasibility Report to National Renewable Energy Laboratory Page 11
Project Results
Wind Energy
The wind monitoring tower collected wind data for about one and a half years (from November, 2004 through June, 2006). Alaska Energy Authority conducted detailed data analysis on the information collected through the NRG Systems anemometers and data logger. That analysis is included as an Appendix to this report. The analysis revealed that the site had an 8.4 miles per hour average annual wind speed at 30 meters (approximately 100 feet) above the ground. This is considered a poor wind resource and not of commercial quality. Wind energy resource is rated by class from 1 (the lowest value) to 7 (the highest value). The KIT location investigated here would be considered a class 1 site, and is surrounded by class 1 and 2 sites. Typically, class 4 sites or higher are considered good candidates for commercial scale wind development. The wind shear was calculated to be .36, which is a higher than average value. This means that a taller tower could result in much more energy production, however, the low average wind speed would still result in a poor quality wind site for commercial energy sales. Large wind turbines are typically considered utility or commercial scale and are rated at one megawatt (1MW, or one million watts) or higher and generally sit atop 250 foot towers. Installation costs in the lower 48 for such turbines are generally one dollar per watt, which means a one megawatt turbine would cost one million dollars1. Such a turbine in a class 4 or higher wind site could result in energy production costs of less than 5 cents per kilowatt-hour (kWh), which could justify commercial development. At 5 cents/kWh, large scale wind energy is now among the cheapest sources of electricity generation. Such a large scale wind turbine has not yet been constructed in Alaska and production costs are thus uncertain, though there is currently some discussion about constructing such large scale turbines close to Anchorage. For comparison, Homer Electric Association (HEA) recently raised its retail price for electricity to approximately 14 cents per kWh. In other words, large scale wind energy at 5 cents/kWh could be highly cost competitive with electricity generated by HEA. Smaller wind turbines are generally divided into village and residential scale models and, on a dollar-per-kWh basis, are much more expensive than large scale turbines. Village scale turbines range from 50 to 250 kilowatts (50,000 to 250,000 watts), while residential turbines range from 0.5 kilowatts to 20 kilowatts, (500 watts to 20,000 watts). For comparison, a 500 watt wind turbine, one of the smallest on the market, would light five 100 watt lightbulbs when it was running at its peak, while a one MW turbine would light ten thousand 100 watt lighbulbs. Because of the low wind speed at this examined site, a detailed economic analysis was not conducted. Wind energy production costs are highly variable and dependent on the actual
1 A “watt” is a measure of electrical power. One kilowatt (kW) equals one thousand watts. One megawatt (MW)
equals one million watts. To better understand these values, one kW of power would light ten 100 watt light bulbs. A kilowatt-hour is a measure of electrical energy, and equals the use of one kilowatt of power for one hour.

Final Renewable Energy Feasibility Report to National Renewable Energy Laboratory Page 12
turbine and wind regime, but in general, there is no wind turbine that would be economically feasible at this site in comparison to purchasing power from HEA. For a more detailed analysis of the wind data collected at the KIT site, refer to the Appendix to this report. Although the main goal of this project was to determine if utility scale wind energy production could be feasible for KIT, there were also broader goals to save energy and money and to consider other renewable technologies. The electrical end use study discussed above was aimed at identifying energy and cost saving opportunities that could be performed at low or no cost to KIT. There appear to be several measures that can be implemented to achieve this goal, including reducing the heating loads at the greenhouse at least during the summer if not all year, and changing to high efficiency lights in the main office building. This was discussed in detail in a previous report and in summary above.
Other Renewable Energy Technologies
Photovoltaics
Other than wind power, perhaps the most familiar renewable energy technology is solar electric energy, commonly known as “solar panels” or “photovoltaics.” Such photovoltaic, or PV panels, convert light from the sun directly into electricity with no moving parts. A typical PV system includes PV panels, some sort of mounting structure either on the roof of a building or on a pole sticking out of the ground, an inverter to change the electricity back and forth between direct current and alternating current as needed, either a battery bank or an interconnection with the utility grid, and of course wiring and electrical safety equipment. When designing a PV system for a particular application, there are various technology options and physical realities to consider. For example, solar panels produce more electricity if they are directly facing the sun. Pole-mounted tracking systems, much like satellite dishes, have been created that allow the solar panels to move and follow the sun, thus maximizing energy production at any given time. (See Photo 3 below.) Because the sun changes its position in the sky so drastically over the course of a year in high latitude locations such as Alaska, such tracking systems can significantly increase annual energy production as compared to a fixed roof-mount system with the same amount of solar panels. In other locations in Alaska, from Homer to Chickaloon Village to Venetie to Arctic Village, these tracking systems have been shown to double annual energy production compared to fixed arrays.

Final Renewable Energy Feasibility Report to National Renewable Energy Laboratory Page 13
Photo 3: This photo shows four pole-mounted solar tracking systems each holding twelve PV
panels, often called an “array.” Note how all four PV arrays are facing the same direction with
shadows directly behind the arrays. This is because the tracking system places the PV panels
directly into the sun, thus maximizing energy production. At another time of the day, all of the
PV arrays would be facing another direction.
While tracking systems increase energy production, they are also more expensive to purchase and require some additional maintenance. These trade-offs must be taken into consideration when designing a system to best meet specific needs and capacities. Another important design consideration is a “grid-tied” versus a battery storage system. Where available, the least expensive and most efficient PV systems are “grid-tied,” i.e., the PV system is directly connected to the utility’s power grid, generally through a building’s utility service panel or meter loop. This avoids the cost, inefficiencies, and additional maintenance requirements associated with battery storage, but does not provide back-up power in case of a utility grid outage. As well, in remote sites where the utility grid does not reach, such “grid-tied” systems are simply unavailable, and batteries are generally the only feasible option in those cases. For KIT, a typical grid-tied tracking system such as those shown above would have a production capacity of approximately 2.5 kW and cost approximately $30,000 including some installation costs. The same 2.5 kW grid-tied system without a pole-mount tracker would cost approximately $5,000 less and produce approximately half as much power. Battery storage on such a system would add approximately another $7-10,000 to the total cost depending on the type and size of battery bank. The following table provides very rough cost estimates for a typical 2.5 kW PV system for all possible combinations of tracking versus fixed-mount and battery storage versus grid-tied options.

Final Renewable Energy Feasibility Report to National Renewable Energy Laboratory Page 14
2.5 kW PV System Cost Estimate Table: Cost Estimates are provided for all four options;
battery storage costs assume a high quality 1,000 amp-hour 48 volt system with containment
Storage and tracking Options Pole Mounted Tracker Fixed Roof Mount
Battery Storage $40,000 $35,000 Grid-tied with no batteries $30,000 $25,000 As discussed briefly above, a pyronometer was installed at the site to give an estimate of the solar resource, similar to the installed anemometers that give an estimate of the wind resource. A pyronometer is a device that measures “solar insolation,” or solar input to a fixed location. This solar insolation is then converted, usually to Watts/square meter, to determine the intensity of the sun and it’s ability to produce electricity. It should also be noted that PV panels perform better, i.e., produce more electricity, when they are colder. In other words, with the exact same pyronometer reading solar panels will produce more electricity when it is cold outside as compared to when it is warm. So a bright cold day in the month of March, for example, when there is still snow on the ground to reflect even more sunlight, can produce more energy at any given moment than a warm July day. Of course the dark months of November through January produce almost no solar electric energy in Alaska, but the other nine months of the year can produce significant amounts, especially with a tracking system. Because the pyronometer is stationary, the solar insolation values are not necessarily very accurate when predicting PV energy output with a tracking system, however, the pyronometer does give a sense of the solar resource, especially in comparison to other locations. The following table displays approximately six months (from March 29, 2005 – September 20, 2005) of solar insolation data collected by the pyronometer installed on the wind monitoring tower at the KIT site. This time frame covers the bulk of the solar energy production “season” though, as stated above, there is another almost month-and-a-half on each side of this chart in which solar energy could still be used to produce electricity. The average for the time frame displayed here is about 500 watts per square meter. For Alaska this is not a bad site, but globally this is considered a poor solar resource.

Final Renewable Energy Feasibility Report to National Renewable Energy Laboratory Page 15
Kenaitze Solar
0
200
400
600
800
1000
1200
1400
3/2
9/2
00
54
/5/2
00
54
/12
/20
05
4/1
9/2
00
54
/26
/20
05
5/3
/20
05
5/1
0/2
00
55
/17
/20
05
5/2
4/2
00
55
/31
/20
05
6/7
/20
05
6/1
4/2
00
56
/21
/20
05
6/2
8/2
00
57
/5/2
00
57
/12
/20
05
7/1
9/2
00
57
/26
/20
05
8/2
/20
05
8/9
/20
05
8/1
6/2
00
58
/23
/20
05
8/3
0/2
00
59
/6/2
00
59
/13
/20
05
9/2
0/2
00
5
Dates
W/s
qm
Series1

Final Renewable Energy Feasibility Report to National Renewable Energy Laboratory Page 16
Solar Thermal
Using solar thermal technologies could also reduce energy consumption in the KIT buildings2. Specifically, solar collectors on the roofs of buildings (see Photo 4 below) could be used to transfer heat from the sun for use in buildings, thus reducing fuel used to heat water and/or the building space. Currently in KIT buildings, water is being heated by natural gas. With solar thermal collectors, the water would be heated, at least partially, by the sun, and then if additional heat was still required, natural gas could be used. In other words, a solar thermal system could be used to supplement the existing natural gas system so that natural gas was used much less than it is now for water heating.
Photo 4: This photograph shows one type of solar thermal collectors installed on a roof
of a building. These collectors transfer light and heat from the sun into the building, thus
reducing natural gas (or other fuel) consumption for water and/or space heating.
Solar thermal collectors such as those pictured here can be used to not only supplement water heaters, but also to heat building space. In fact, such solar thermal collectors for heating building space, when using “solar hydronics,” may have the quickest return on investment capital of all the renewable energy alternatives discussed here. Using solar hydronics to assist a boiler hydronic-based heating system could turn the oil or gas burner off for several hours per day. Typical cold winter weather is clear and solar gain can be significant. This could save fuel and wear and tear on the boiler burner equipment. The solar system can be a fully automatic thermostatically controlled loop that ties into the standard boiler system. When designing a solar thermal system, there are many factors to consider—in fact, there are more factors to consider with solar thermal than with solar electric. Some of the more important issues with solar thermal are the size of the system, the type of collectors and
2 Solar energy from the sun can be converted into electric energy, such as with “photovoltaic” solar panels, or into heat, or thermal energy. Solar thermal technology captures heat from the sun and directs that heat into buildings and/or water to reduce heating loads.

Final Renewable Energy Feasibility Report to National Renewable Energy Laboratory Page 17
heat transfer media and methods, storage tanks, heat delivery systems, and integration with other heat sources. While this appears complicated, many of these issues must be addressed when dealing with conventional water and space heating already, thus solar thermal applications may be viewed as simply adding a reliable secondary system that can actually became the main system and reduce the conventional heating system to a back-up or supplement for most of the year. The following chart uses data from Anchorage to compare performance of three different solar thermal systems that vary by the amount of collectors (10, 20, or 30 tubes). The chart shows the amount of heat (in BTUs) and number of gallons of water per day that can be raised 60 degrees (Fahrenheit) based on the varying amount of solar thermal collector tubes. These numbers do not provide a complete picture because of the other components that are required for a complete system, but they do show how effective solar thermal collectors can be over the course of a year. Thermomax Solar Thermal Collectors’ Annual Performance, Anchorage, Alaska
In reading the above chart, for example, in the month of October, 10 Thermomax solar collector tubes will provide 5,000 BTU’s per day and raise 10 gallons of water by 60 degrees; 20 collector tubes will provide 10,000 BTU’s daily and raise 20 gallons of water by 60 degrees; and 30 collector tubes will provide 15,000 BTU’s daily and raise 30 gallons of water by 60 degrees. A typical solar thermal collection system for a standard house could cost from $6 - $10,000, though as much as 30-40% of this cost would be incurred anyway for

Final Renewable Energy Feasibility Report to National Renewable Energy Laboratory Page 18
conventional space and/or water heating if this was incorporated into the original design and construction of the building’s heating systems. If this is a retrofit, then the 30-40% estimate is reduced substantially and the solar thermal system is much more of a significant extra cost.
Biomass and Biofuels
For the purpose of this feasibility study, biomass and biofuels are wood, brush, and agricultural waste that can be burned directly or converted into other forms, such as liquid fuels like ethanol or methanol, or even gasified, and then used to generate electricity and/or heat and/or transportation fuels. Spurred on by federal tax incentives and large agricultural interests, across the lower 48 there is significant and growing activity in this area of energy development. Even in Alaska, where we have short but intense growing seasons, there is increasing interest among Tribes, Native corporations, and other land holders to better use waste wood that is a byproduct of logging operations or simply sprawling development and land clearing. Similar to some of the other technologies discussed here, there are numerous trade-offs and options to consider when investigating biomass and biofuels, but perhaps the most important in this case is the scale of the operation. Biomass/biofuel production requires a fairly precise project size to stay profitable and not over-harvest the resource base or result in an inefficient production process and expensive capital lying idle for large periods of time. Especially with the growing season constraints in Alaska, rarely would it be feasible (except perhaps in southeast Alaska where large trees grow fairly rapidly) to harvest trees for a dedicated biomass operation. However, as a byproduct of some other activity, such as land clearing for power line maintenance or bark beetle removal, situations could arise in which biomass/biofuel production could be feasible. To the extent that KIT does not own large tracts of land, but could possibly partner with the village corporation or other large land holding entities, development of biomass/biofuels operations could merit further investigation. Such activities however, if not handled properly, could have substantial environmental impacts and cause controversy among local people if the land being harvested impacts subsistence or other activities.
Tidal Energy
Tidal energy has significant potential to become a viable option for large scale renewable, base load electricity generation. However it is currently considered an experimental and immature technology compared to wind, PV, and solar thermal applications. Similar to the other technologies discussed above, there are several possibilities and options when using tidal power to generate electricity. Different tidal technologies are highly site specific: some take advantage of tidal currents to directly or indirectly spin a turbine; others take advantage of jagged shorelines to capture incoming tides and make a temporary dam and use conventional hydropower technologies; still others exploit the rising the dropping water levels to generate power.

Final Renewable Energy Feasibility Report to National Renewable Energy Laboratory Page 19
With regard to tidal power, Kenaitze has some significant advantages over many other areas. The channel between the Kenai forelands has some of the strongest tidal currents anywhere in the world. Add that and the aging oil rigs in the same location and there is great potential for a demonstration project with substantially reduced up-front construction costs. This could be a good use of these expensive-to-remove structures, which the oil companies are required to do once the rigs stop producing. The idea here would be to use underwater turbines affixed to the oil platforms and have the almost constant tidal currents in this area spin the turbines to generate electricity. The image below shows a stylized drawing of this concept.
Image: A concept of how tidal power could be used to generate electricity in Cook Inlet
from the oil platforms currently in use. Such turbines could also be placed on hydraulic
lifts so they could be easily raised out of the water for maintenance. Collisions with fish
and other marine life could be a concern.
There are also other options to extract energy from tidal streams that could be well suited for Kenaitze and have less environmental impact. One example of a new technology that is stimulating interest at the present time is the Stingray. This technology consists of a parallel linkage that holds large hydroplanes. The angle of these hydroplanes to the flow of the tide is varied causing them to move up and down. This motion is used to extend and detract a cylinder, which produces high-pressure oil that drives a hydraulic motor that in turn drives an electric generator.

Final Renewable Energy Feasibility Report to National Renewable Energy Laboratory Page 20
An image showing this technology concept is displayed below. This technology has been developed in the United Kingdom and is receiving both government and corporate research and development funds. It has advantages of less moving parts, potentially less environmental impact, and ease of maintenance because the generator can be located above the water. Currently this is a highly experimental technology but shows much promise for large scale electricity generation. Energy production costs are unknown at this time.
Image: A stylized concept of the Stingray, an experimental tidal energy technology that
is now under development in the UK.
Conclusion and Recommendations Though the wind monitoring study revealed that the selected site does not have commercial-scale wind resources for energy production, much was learned from this study and several possibilities exist for improving energy efficiency and even implementing small-scale renewable energy. Regarding wind power, the wind shear coefficient at the studied site was notably high, revealing a significant increase in wind speed with elevation above ground. If KIT is still interested in pursuing wind energy, our recommendation would be to find a site closer to Cook Inlet that is more subject to coastal winds, and expect that it will be necessary to reach high elevations to access more energetic winds. In general, however, it would appear that wind is not a very good renewable energy resource for the immediate area and at this stage not worthy of additional pursuit by KIT unless there is a unique niche

Final Renewable Energy Feasibility Report to National Renewable Energy Laboratory Page 21
such as a coastal location or a site high up on a ridge and more exposed to energetic winds. In terms of large scale commercial production of wind energy, this does not appear to be a feasible option for KIT, at least at the site investigated. On a smaller scale, energy efficiency opportunities, as well as solar electric and solar thermal applications may be feasible, especially with at least partial grant support. A solar energy demonstration project that uses solar thermal collectors to transfer heat into the greenhouse, especially into the plant beds, could provide multiple benefits, including improved greenhouse production, reduced energy use for the greenhouse, and innovative but proven technology with educational value to Tribal members, especially children. Such a project could also help to re-vitalize the greenhouse, provide healthy food to Tribal members, and facilitate increased focus on the greenhouse, thus reducing energy inefficiencies such as those described above. This also has appeal as a grant-funded project (see next section). Solar electric PV panel installations for selected buildings can also provide benefits to the building residents and the Tribe in general. Though such systems are expensive for initial costs, Tribal facilities are often eligible for grant support and ongoing maintenance costs are minimal. If batteries are used, PV systems can also provide critical back-up and additional reliability in the case of grid outages, for example at the main Tribal office building or for another mission-critical facility such as a health clinic. A related strategy could include incorporating PV systems on all new Tribal construction, for instance, and developing a Tribal energy services company to install and maintain renewable energy systems for Tribal members and even non-Tribal members, on a fee-for-service basis, in the area. Some Tribes in the lower 48 are using this type of economic development strategy to diversify their revenue streams and reduce dependence on gaming. Such a development would not only help Tribal members who received the PV systems on their new homes, but could also provide jobs and skills development in an emerging industry. The most cost-effective energy-related activities in the short term are the pursuit of energy efficiency savings such as improved lighting, reducing heating loads, and improved insulation. All new Tribal facilities should incorporate energy efficiency measures wherever possible since retro-fitting is almost always more expensive than designing for efficiency in the first place. To the degree that KIT wants to pursue large-scale renewable energy economic development opportunities, probably the best avenue in the long term is tidal power development. Considering the current state of the technology, this is not a short-term prospect, but offers tremendous potential. Tides are regular and predictable, and water is much denser than air, thus providing significantly more energy than wind. While tidal power is highly site-specific, KIT is favorably situated to take advantage of future technology developments in this area specifically because KIT is in a very favorable location for exploiting tidal energy. This favorable location certainly includes the high tides in Cook Inlet, but also importantly includes the fact that Nikiski is quite close to KIT lands and Nikiski already supports significant energy infrastructure, including industrial-scale access to Homer Electric Association’s power grid and, by extension, the

Final Renewable Energy Feasibility Report to National Renewable Energy Laboratory Page 22
entire rail belt utility grid. If KIT were to conduct another feasibility study with the exact same primary goal as this study, our recommendation here would be to focus on the development of tidal power. Not only is there a high degree of interest and research on this in the UK and other parts of Europe, but at least one private company, Oceana Energy, Inc., has filed permits for tidal development in various parts of Cook Inlet with the Federal Energy Regulatory Commission, the federal body that oversees such projects. This is a rapidly emerging field with tremendous potential, and KIT has a unique resource and could benefit substantially from technology improvements in tidal power development.
For More Information and Possible Project Funding
The following websites can provide additional information about the various technologies discussed above and/or possible funding opportunities for everything from feasibility studies to technology research and development. US Department of Energy, Energy Efficiency and Renewable Energy: www.eere.energy.gov National Renewable Energy Laboratory: www.nrel.gov US Department of Agriculture, Energy Division: www.usda.gov Administration for Native Americans (Social and Economic Development Strategies Program grants for renewable energy): www.acf.hhs.gov/programs/ana/ Alaska Energy Authority: www.aidea.org/aea/index.html Home Power Magazine: www.homepower.com Alternate Energy Technologies (solar thermal collectors): www.aetsolar.com Susitna Energy Systems (Anchorage-based renewable energy supplier): www.susitnaenergy.com Radiantec Inc (solar hot water system supplier): www.radiantec.com Blue Energy, Inc. (tidal energy developer): www.bluenergy.com Wavegen (ocean wave energy develop): www.wavegen.co.uk Marine Development Associates, Inc. (tidal and related ocean energy): www.marinedevelopmentinc.com/ocean_energy.htm Solar Energy International (renewable energy skills and training): www.solarenergy.org