final survey report january 2012 - crcog.net6ad7e2dc-ece4-41cd... · the survey contained 43...
TRANSCRIPT

C R C
P S
Final Survey Report January 2012

Centre Region Comprehensive Plan Survey
TABLE OF CONTENTS
INTRODUCTION ............................................................................................................................................. 1
EXECUTIVE SUMMARY .................................................................................................................................. 2
Key Implications for the Comprehensive Plan Update .................................................................... 5
Survey Background .......................................................................................................................... 7
COMPLETE SURVEY RESULTS ........................................................................................................................ 9
Attitudes about Land Use and Development .................................................................................. 9
Attitudes about Housing ................................................................................................................ 20
Attitudes about Community Services and Facilities ...................................................................... 23
Attitudes about Transportation ..................................................................................................... 30
Attitudes about the Environment .................................................................................................. 37
Attitudes about the Centre Region Economy ................................................................................ 39
Attitudes about Local Government and Resident Communication ............................................... 42
WRITE‐IN RESPONSES FOR QUESTIONS WHICH INCLUDED “OTHER” ........................................................ 43
APPENDIX A: RANDOM SAMPLE SURVEY – QUESTIONNAIRE AND RESULTS
APPENDIX B: DROP‐IN SAMPLE SURVEY RESULTS
APPENDIX C: RANDOM SAMPLE AND DROP‐IN SAMPLE COMBINED RESULTS
APPENDIX D: WEIGHTED RANDOM SAMPLE RESULTS
APPENDIX E: SURVEY METHODOLOGY
Survey Instrument Development
Survey Sample Selection
Survey Administration and Survey Response
Data Entry, Data Weighting and Data Analysis
APPENDIX F: 1986 SURVEY QUESTIONNAIRE AND RESULTS
APPENDIX G: COMMUNICATION AND NOTIFICATION
Centre Daily Times Insert
Pre‐notification Postcard
First Reminder Letter
Centre Daily Times Article
Second Reminder Letter
Project Schedule

Centre Region Comprehensive Plan Survey
Final Survey Report | January 2012 Page 1 of 68
INTRODUCTION
A thorough understanding of citizen attitudes toward growth and development provides a strong
foundation upon which to build regional policy for the Centre Region Comprehensive Plan. The Centre
Regional Planning Agency (CRPA) conducted this survey in the summer of 2011 in conjunction with an
update to the Centre Region Comprehensive Plan. The survey serves as a key public participation
component of the Comprehensive Plan Update. Elected officials and staff chose the resident survey as
a cost effective method to ask for resident opinions regarding a number of issues in the Centre Region
to inform the preparation of the Comprehensive Plan Update. The survey contained 43 questions
regarding land use and development, housing, community services and facilities, transportation, the
environment, economic development, and government and resident communication.
This report summarizes statistically valid data that accurately reflects the opinions of the respondents
regarding various issues facing the Centre Region. The CRPA used a random sample specifically to
provide an equal chance of selecting any member of the population for the survey. Residents who
received a survey determined for themselves if they would complete the survey or not.
This report is organized in three primary sections, the Executive Summary, Complete Survey Results,
and Appendices.
Executive Summary
The Executive Summary includes the major findings of the survey results in a concise format. Major
findings capture resident opinions based on broad topical areas (i.e. land use, housing, and
transportation). The CRPA has presented responses in this manner to be consistent with the sequence
of questions in the survey questionnaire and so that individuals can quickly develop a clear picture of
the survey results within each topical area of the survey. The major findings provide a brief narrative
summarizing the results and provide a partial list of responses to individual questions to support the
conclusions. Individuals may consult the appendices to review the specific responses to all survey
questions and to examine results by individual municipality.
The Executive Summary also includes key implications for the Comprehensive Plan Update and a
narrative describing the survey process. Key implications expand upon the major findings and identify
how resident opinions in each topical area help build the foundation for goals, objectives, and policies
in the Comprehensive Plan Update. The key implications are not all inclusive.
Complete Survey Results
The second section of the report provides all survey results, including detailed graphs of results and
brief narratives for most questions. This section also includes the write in responses for questions that
included “Other (Please specify)” as an option.

Centre Region Comprehensive Plan Survey
Final Survey Report | January 2012 Page 2 of 68
Appendices
The last section of the report contains Appendices, with results in tabular format for the Centre Region
and for the individual municipalities. Individual appendices also contain the survey methodology, a
demographic profile of survey respondents, comparison to the 1986 survey questions, and a summary
of the process used to solicit public participation for the survey.
EXECUTIVE SUMMARY
The CRPA prepared major findings for regional results in the following areas:
Land use and development
Housing
Community services and facilities
Transportation
The environment
Economic development
Government and resident communication
Land Use and Development
These questions were included in the survey to understand if there are potential gaps between resident
opinions and specific goals, objectives, and polices related to land use and development as identified
in the Comprehensive Plan. Respondents overwhelmingly reaffirmed that existing Comprehensive Plan
goals are relevant and should continue to be a part of the Comprehensive Plan Update. Respondents
indicated substantial support for maintaining a cooperative relationship with Penn State, preserving
prime farmland, directing future growth to areas inside the Regional Growth Boundary/Sewer Service
Area (RGB/SSA) and preserving low density community character outside the RGB/SSA.
Respondents identified their highest priority land use issues as preservation of natural resources
(air, water, soil, forests, etc.), preservation of farming, and preservation of established neighborhoods.
Residents supported use of regulations and local financial resources to preserve natural resources,
historic resources, and farming.
Respondents generally appear satisfied with the mix of land uses in the Centre Region. In fact, most
respondents did not support the need for additional commercial uses in their neighborhoods.
About 66 percent of the respondents would like to see a low to moderate increase in population
over the next 30 years.
About 72 percent of the respondents support using the Regional Growth Boundary as a tool
to manage growth in the Centre Region.
Less than 50 percent of the respondents believe the economic needs of the Centre Region
should be the driving force that determines what type of development takes place.
Centre Region Comprehensive Plan Survey
Final Survey Report | January 2012 Page 3 of 68
Over 85 percent of the respondents agree or strongly agree that municipalities should use
regulations to preserve natural resources.
About 86 percent of the respondents considered preservation of natural resources (air, water,
soil, forests, etc.) the most important land use issue in the Centre Region.
Housing
Survey respondents indicated their support for a variety of housing opportunities to meet the needs of
all existing and future residents. In particular, the survey asked residents to rank housing characteristics
by order of importance, from the most important to fifth most important. About 69 percent of the
residents surveyed identified affordable rental or for‐sale housing as one of their top three housing
priorities. There was also support among survey respondents for owner‐occupied housing, with
61 percent indicating this as one of their top three priorities. The survey results suggest that the Centre
Region currently offers an adequate mix of housing types. About 37 percent of respondents indicated
that this is one of their top three priorities.
Nearly 72 percent of those surveyed indicated that an overall housing goal should include a wide
variety of housing to satisfy the needs of current and future residents.
Just over 69 percent of respondents identified the need for affordable rental and for‐sale
housing as one of their three top priorities.
When asked how important it is to increase various types of housing, 78 percent of the residents
surveyed rated an increase in the amount of single‐family detached housing in the Centre
Region as one of their top three issues.
Just 29 percent of the respondents felt there was enough rental housing available in their price
range.
About 44 percent of the respondents felt there were enough single‐family homes available in
their price range.
Community Services and Facilities
Centre Region residents continue to give high ratings to public services and facilities provided in the
region. Survey respondents rated the quality of services provided on a scale of one to five, with one
being very dissatisfied and five being very satisfied. Generally, rankings for community services and
facilities were well above four, indicating 80 to 90 percent of the respondents were very satisfied or
satisfied with services.
Public safety services had a very high level of satisfaction in the region. Over 90 percent of
the respondents were satisfied or very satisfied with police service, fire service and ambulance
service in the region. Nearly 80 percent of respondents were satisfied or very satisfied with
emergency health care service in the region.
Public water and sewer services also rated highly, with about 80 percent of the respondents
indicating they were satisfied or very satisfied with these services.

Centre Region Comprehensive Plan Survey
Final Survey Report | January 2012 Page 4 of 68
About 85 percent of the respondents were satisfied or very satisfied with the regional recycling
program. The survey also asked about composting. Over 40 percent of the respondents
selected uncertain/undecided regarding composting programs in the region.
Transportation
The survey asked about several aspects of transportation within the region and surrounding area. The
primary purpose of travel on weekdays for 65 percent of respondents is for work, with 21 percent of
respondents indicating that their primary travel purpose is for shopping. About 85 percent of the
respondents use a private vehicle to for their primary travel purpose during the weekday. Other results
include:
Over 82 percent of the respondents work in the Borough of State College, Ferguson Township
or College Township.
More than 65 percent of respondents indicated the importance of maintaining good pavement
quality on roadways, and good bridge conditions
Over 54 percent of the respondents would like to see more sidewalks and bike lanes along
roadways in the region, and 56 percent favored adding more off‐street bikeways.
Nearly 46 percent of respondents would like to see more passenger air service at University
Park Airport.
About 42 percent of respondents would like to see access to high speed rail in the region.
The Environment
Protection of the natural environment was highly valued by respondents to the survey. Not surprisingly,
respondents overwhelming support protection of drinking water quality, protection of water resources,
and air quality protection throughout the Centre Region. Protection and access to open space such
as forests, State Game Lands and natural areas were supported by respondents. Similarly, respondents
also strongly support restricting development near Spring Creek and its tributaries to protect that
important natural resource.
Approximately 51 percent of respondents identify “maintaining a low level of environmental
pollution” their most important objective to guide future growth and development in the Centre
Region.
Over 75 percent of the respondents agree that municipalities should use regulation and local
tax resources to preserve natural resources.
More than 70 percent of respondents rank protection of groundwater and surface water
resources as the highest priority natural and environmental issue.
Economic Development
There were several economic development‐related questions on the survey. Respondents strongly
favored retaining existing businesses over attracting new businesses or expanding existing businesses.
Centre Region Comprehensive Plan Survey
Final Survey Report | January 2012 Page 5 of 68
Assuring that infrastructure is built and maintained to serve existing businesses was important to
respondents. Likewise, respondents support “buy local” programs, particularly in the agricultural sector.
Respondents would also like to see job creation in the high tech area and they support natural and
cultural resource‐based tourism programs for hiking, biking, birding and the arts.
Almost 57 percent of respondents indicated their highest economic priority was to retain
existing businesses in the Centre Region.
Just over 40 percent of respondents indicated that municipalities should use incentives such
as infrastructure improvements and providing tax abatements or reductions to keep businesses
or attract new businesses.
Government and Resident Communication
The survey asked respondents to select the three ways they would prefer to receive information
regarding community meetings, issues or events. Most respondents prefer to receive information
via a municipal newsletter or in the newspaper.
Over 50 percent of respondents prefer to receive information via municipal newsletters or
the Centre Daily Times.
More than 30 percent of respondents prefer to receive information via inserts in utility bills
or refuse bills by mail, via e‐mail or by reading municipal or COG webpages on their own.
About 12 percent of respondents would like to receive information via social media like
Facebook, Twitter or blogs.
KEY IMPLICATIONS FOR THE COMPREHENSIVE PLAN UPDATE
What do the survey results mean for the Comprehensive Plan Update?
Continue a balanced approach to growth and development in the region.
Respondents strongly favored a balanced approach to growth and development in the region.
The CRPA defines a balanced approach as an inclusive process that engages diverse opinions. A
balanced approach also allows an impartial evaluation to reach consensus on competing interests
and goals. The current decision‐making structure in the region reinforces a balanced approach
and will continue in the goals and policies of the Comprehensive Plan Update.
Improve and reinforce non‐vehicular access to open spaces and recreational areas
The geographic proximity and physical connections between residential areas, parks, open spaces
and natural areas have value for residents in the region. This conclusion reinforces several long‐
standing land use, transportation and infrastructure practices and decisions in the region, and
indicates the importance of planning for growth and development as a system and not a series of
inter‐dependent actions. Goals and policies in the Comprehensive Plan should strengthen the non‐

Centre Region Comprehensive Plan Survey
Final Survey Report | January 2012 Page 6 of 68
vehicular connections from existing residential areas to existing parks, new parks, recreational areas
and the natural areas that are part of the region.
Respondents want long‐term policies that protect how the region looks today
Respondents indicated very strong support for policies that contain growth inside the regional
growth boundary, preserve prime farmland for agricultural uses, plan for efficient use of
infrastructure, and protect natural, cultural and historic resources in the region. Respondents also
indicated they felt there was too much retail development in the region and were not supportive
of adding to the inventory of retail businesses in the region. Likewise, there was mediocre support
for economic development activities to provide incentives to new or existing businesses in the
region. Comprehensive Plan goals and policies should continue to implement the regional growth
boundary/sewer service area and protect rural resources, particularly farming.
Residents are highly satisfied with public services and facilities in the region
Respondents overwhelming indicated they were satisfied or very satisfied with the quality of public
services and facilities in the region. This indicates that public services and facilities are well run and
effectively meet the needs of the region. Comprehensive Plan goals and policies should continue to
support efficient use of these resources as the region continues to grow and as individual provides
such as water authorities and the UAJA deal with changes in the federal and state regulatory
environment. The implementation of the regional growth boundary/sewer service areas may also
contribute to efficiency in the infrastructure system.
Local solutions to transportation and traffic issues are important
The survey responses indicated that residents rely on private vehicles for their primary trips on
typical weekdays, work and shopping. Reliance on private vehicles is anticipated to continue in
the future. Residents’ preferred roadway improvements focus on maintaining the existing system
and making other small‐scale improvements. Given fiscal constraints and the desire to minimize
impacts to the community, officials should focus on maintaining good quality roadway pavement
and bridges, adding travel and turning lanes to existing roads, and upgrading traffic signals.
The Comprehensive Plan’s goals, objectives and policies for land use and transportation should
focus on maximizing use of the existing roadway system. The Comprehensive Plan will form the
foundation for using municipal capital improvement programs and the Centre County Metropolitan
Planning Organization’s Long Range Transportation Plan (LRTP) and short‐range Transportation
Improvement Program (TIP) to make investments in roadways.
Although only a small percentage of residents currently use public transit, as the population ages,
fuel costs increase, and the desire to limit impacts to environmental and community features grows,
public transit’s mode share is anticipated to increase. Local officials can use land use policy and
fiscal commitments to facilitate demand for public transit, and to provide capacity to accommodate
Centre Region Comprehensive Plan Survey
Final Survey Report | January 2012 Page 7 of 68
increased demand. Residents indicated which strategies should be implemented to increase use
of public transit, which will guide detailed plans to upgrade public transit infrastructure and expand
service.
Residents gave strong support for constructing more sidewalks and bikepaths, and making
connections between existing pedestrian and bicycle facilities. Goals, objectives, and policies in the
Comprehensive Plan will reflect the high priority given to making improvements to the pedestrian
and bicycle system, using tools such as the municipal Official Map, CIPs, and the CCMPO’s
Transportation Enhancements Program.
The desire to have a wide range of travel mode choices available to residents was also reflected in
the priority given to increasing passenger air service at University Park Airport, and to providing
access to high speed passenger rail service.
Overall, the survey results indicate that local solutions to transportation and traffic issues are
important, including maintaining and improving the existing transportation system, and broadening
the modes of travel available to residents.
Single‐family housing that is affordable to residents is important
As an overall goal, the survey results indicate strong support for a wide variety of housing options
to satisfy the needs of existing and future residents. There was strong support for increasing the
supply of single family housing. A majority of respondents identified housing within walking
distance of work, shopping and transit service as a high priority. Residents appear to be satisfied
that there is an adequate supply of apartments and mobile homes in the Centre Region. Over two
thirds of the respondents indicated that affordable rental and for‐sale housing is a high priority. A
third of respondents feel there is a need for more affordable rental housing in the Centre Region,
yet respondents are fairly evenly divided regarding the availability of affordable for‐sale housing.
The Comprehensive Plan's goals and objectives for housing should focus on the efficient use of land
and energy in future housing developments to broaden the availability and affordability of housing
in the Centre Region. National trends toward smaller homes on smaller lots within walking distance
to daily services and transit should be considered where appropriate to meet demands for
affordable single‐family housing. Though the survey did not point to a deficiency in affordable
rental housing in the Centre Region, further study may be warranted as part of the on‐going
Comprehensive Planning process to determine whether this is a complete picture.
SURVEY BACKGROUND
Conducting the Survey
Development of the survey questionnaire started in May 2011 using a previous survey from 1986 as a
starting point for some questions. The CRPA also contracted with IntelliQ Research and Strategy of State
College with assist with developing the survey instrument. Other agencies participating in questionnaire

Centre Region Comprehensive Plan Survey
Final Survey Report | January 2012 Page 8 of 68
development were the Borough of State College Planning Department and Ferguson Township Planning
Department. The COG Transportation and Land Use Committee and the Centre Regional Planning
Commission (CRPC) provided oversight for the survey. The TLU Committee and the CRPC approved the
final survey questions at a joint meeting in June of 2011.
All addresses in the Centre Region were eligible to participate in the survey. From the universe of
approximately 39,000 addresses, a random sample of 2,000 received the survey. Potential recipients
first learned about the survey through a flyer in the Centre Daily Times previewing the survey about two
weeks prior to mailing. The CRPA then sent pre‐notification post cards to the 2,000 randomly selected
addresses about one week prior to mailing surveys. Each address then received a survey with a cover
letter explaining how to complete the paper survey or an online version of the survey. The recipients
could return the paper survey to IntelliQ by mailing the survey back in a pre‐paid envelope. Recipients
could also complete the survey online using a unique code mailed with the survey. The CRPA mailed
two reminder mailings to all 2,000 randomly selected addresses.
Members of both the COG TLU Committee and the CRPC felt that all residents of the region should have
the opportunity to participate in the survey. The CRPA offered a “drop‐in” survey on the CRPA webpage
that was open to anyone who would like to participate. This option was advertised on the webpage
in municipal and COG meetings. Results from the “drop‐in” survey generally were fairly consistent with
the results of the random sample at the regional level. The CRPA reported the results of the drop‐in
survey separately to maintain the validity of the random sample. This report however, does provide the
results from the random sample, the drop‐in sample and a combination of both the samples.
Respondents
Approximately 23 percent of the recipients in the region, or 461 people responded to the random
sample survey. Another 150 people completed the “drop‐in survey. Appendix “G” provides
characteristics of respondents to the random sample survey.

Centre Region Comprehensive Plan Survey
Final Survey Report | January 2012 Page 9 of 68
COMPLETE SURVEY RESULTS
The report focuses on the survey results at the regional level. This report contains results for the
random sample survey contained in Appendix “A”. The random sample in Appendix “A” also includes
the results by individual municipality. The report does not evaluate the results for individual
municipalities. The results for the drop‐in sample, the combined random sample/drop‐in sample
and the weighted sample are included in separate appendices.
“Uncertain/Undecided” Responses and Rounding
Several questions in the survey allowed respondents to answer “uncertain/undecided.” The full set
of responses in the individual appendices show the proportion of respondents selecting the
“uncertain/undecided” reply. The analysis presented in the body of the report does not include
“uncertain/undecided” responses in most instances. In other words, the tables and graphs in the body
of the report show only responses from respondents who had an opinion about the question or item
unless there were a substantial number of respondents who selected “uncertain/undecided.”
Respondents could also select multiple responses for some questions. In this type of question, the
total may exceed 100 percent in tables where this occurs. When a table, graph or chart for a question
that only permitted a single response does not total to exactly 100 percent, it is due to the customary
practice of rounding percentages to the nearest whole number.
The graphs in this section of the report provide visual depictions of the results for each survey question.
The CRPA also provides brief statements summarizing the results of each question or group of questions
where applicable.
ATTITUDES ABOUT LAND USE AND DEVELOPMENT (Questions 1 through 7)
Question 1: Objectives to Guide Future Growth and Development in the Centre Region
Respondents were asked to select the three most important objectives which should be used to guide
future growth and development in the Centre Region from a list of nine objectives. The top response to
this question seems to indicate that respondents highly value the connectivity and accessibility between
the neighborhoods where they live and the open spaces and recreational opportunities in the Centre
Region. The second highest response reveals strong support for environmental protection and
sustainability in the Centre Region. The third highest response indicates an awareness and sensitivity
to neighborhood protection. As the Centre Region grows potential conflicts between existing
neighborhoods and new development near the neighborhoods may continue.

Centre Region Comprehensive Plan Survey
Final Survey Report | January 2012 Page 10 of 68
* Write‐in responses to “Other” can be found on Page 43.
Question 2: Rate of Population Growth
Question 2 asked survey recipients to identify the rate of growth they would prefer in the Centre Region
over the next 30 years. Approximately 31 percent of the respondents preferred a low rate of population
growth (an additional population of 6,000 people over the next 30 years) and 35 percent preferred a
moderate rate of population growth (an additional 18,000 people over the next 30 years). This rate of
growth is similar to historic growth rates in the Centre Region. Recent population forecasts prepared
by the CRPA indicate that the Centre Region could grow by as much as 22,000 people over the next 30
years.
4%
15%
17%
18%
23%
23%
24%
31%
37%
51%
56%
0% 10% 20% 30% 40% 50% 60% 70%
Other
Increasing education opportunities for all age groups
Maintaining and enhancing the visual appearanceof buildings and landscaping
Expanding the variety and availabilityof retail goods and services
Building and maintaining livable neighborhoods
Attracting business
Improving personal security and public safety
Protecting neighborhoods from encroachmentby non‐residential land uses
Encouraging a sustainable region
Maintaining a low level of environmental pollution
Having access to open space (parks, green belts,wooded land) near residential areas
Percent Selected in Top Three MOST Important
1. MOST IMPORTANT OBJECTIVES which could be used to guide future growth and development in the Centre Region.

Centre Region Comprehensive Plan Survey
Final Survey Report | January 2012 Page 11 of 68
Question 3: Goal Validation
One purpose of this survey was to measure the relevance of ten goals initially articulated in the
2000 Centre Region Comprehensive Plan. In comprehensive planning, it often takes multiple years
to accomplish goals and in some cases the goals become ingrained in the values and character of the
community. The CRPA wanted to understand if survey respondents believed the region as a whole
was properly addressing goals over the past ten years and to determine if those goals were still valid.
This question asked respondents to indicate if a goal was “still relevant”, “no longer relevant” or
“don’t know/not sure”. Goals that are determined to be relevant should be included in the 2010
comprehensive plan update and where appropriate, new objectives and policies should be included
to continue implementing the goals.
Relationship between the Centre Region and Penn State University
Respondents continue to value a cooperative relationship with Penn State University and the
municipalities in the Centre Region. More than 85 percent of respondents indicated that
maintaining a cooperative relationship between the municipalities and the University “to ensure
future growth at the University benefits the community” is still relevant. The influence of
students, faculty and staff will continue to impact neighborhoods, the economy and quality of
life in the region.
Regional Growth Boundary (RGB)
The RGB remains a popular growth management tool among the survey respondents. Nearly
72 percent of the respondents indicated that the Centre Region should direct the majority
of future growth into the RGB to efficiently provide public utilities, services, and transit to new
14%
15%
35%
31%
5%
0% 5% 10% 15% 20% 25% 30% 35% 40%
It doesn't matter to me
No increase in population
Low rate of population growth(An additional 6,000 residents)
Moderate rate of population growth(An additional 18,000 residents)
High rate of population growth(An additional 32,000 residents)
Percent of Responses
2. During the next 30 years what rate of population growth would you prefer for the Centre Region?

Centre Region Comprehensive Plan Survey
Final Survey Report | January 2012 Page 12 of 68
development. About 66 percent of the respondents also indicated that the Centre Region
should preserve and enhance the low‐density community character in the rural areas located
outside the RGB.
Preservation of Farming
About 83 percent of the survey respondents rate preserving prime farmland for agricultural use
a goal that is still relevant in the Centre Region. The results indicate some uncertainty regarding
the use of financial resources to accomplish this goal. About 39 percent of the respondents
agreed or strongly agreed that municipalities should use local tax resources to preserve prime
farmland. About 31 percent of respondents disagreed or strongly disagreed that municipalities
should use local tax resources for farmland preservation. About 30 percent are uncertain or
undecided. Over 70 percent of the respondents however, agreed or strongly agreed that
municipalities should use regulations such as zoning or private conservation easements to
preserve prime farmland.
Integrated Planning for Land Use, Transportation, and Public Services and Facilities
Integrating land use planning, transportation planning, and provision of public services and
facilities remains relevant in the Centre Region. About 84 percent of the respondents indicated
this was still a relevant goal. Nearly 82 percent of the respondents agreed that coordinating
land development activity with necessary public facilities and services in a cost effective manner
is also relevant. These activities have been the foundation of regional planning for decades and
respondent opinions reaffirm this.

Centre Region Comprehensive Plan Survey
Final Survey Report | January 2012 Page 13 of 68
66%
68%
72%
72%
82%
83%
84%
86%
91%
0% 10% 20% 30% 40% 50% 60% 70% 80% 90% 100%
Preserve and enhance the low‐density communitycharacter in the rural areas located outside of the
Regional Growth Boundary.
Obtain additional parkland and open‐space areas,and provide a broad range of recreational
opportunities.
Direct the majority of future growth to areas withinthe Regional Growth Boundary so that new
development can be efficiently served by publicutilities, services, and transit.
Provide a variety of housing opportunities to satisfythe needs of all existing and future residents of the
Centre Region.
Coordinate land development activity withnecessary public facilities and services in a cost‐
effective manner.
Preserve prime farmland for agricultural use.
Coordinate land development activity with thetransportation system for the safe, efficient, andconvenient movement of people and goods.
Maintain a cooperative relationship between theCentre Region municipalities and Penn StateUniversity to ensure that future growth at the
University benefits the community.
Balance community growth while protecting andenhancing the Centre Region's environmental,
historic, and cultural resources.
Percent Selected as "Still Relevant"
3. RELEVANT GOALS. Please select the answer that best corresponds to your current opinion regarding each of the goals.

Centre Region Comprehensive Plan Survey
Final Survey Report | January 2012 Page 14 of 68
Question 4: To what extent do you agree or disagree with the following statements?
1%
3%
44%
46%
‐20% ‐10% 0% 10% 20% 30% 40% 50% 60%
4.1 The Centre Region should have an overall plan that directs future growth and development to appropriate locations.
Strongly Agree
Agree
Disagree
Strongly Disagree
5%
14%
34%
12%
‐20% ‐10% 0% 10% 20% 30% 40% 50% 60%
4.2 I would like municipal officials to have a stronger role in controlling new development in the area.
Strongly Agree
Agree
Disagree
Strongly Disagree
36%
41%
10%
5%
‐60% ‐50% ‐40% ‐30% ‐20% ‐10% 0% 10% 20%
4.3 Individuals and developers should be free to develop land without a lot of controls and restrictions by municipalities.
Strongly Agree
Agree
Disagree
Strongly Disagree

Centre Region Comprehensive Plan Survey
Final Survey Report | January 2012 Page 15 of 68
7%
24%
35%
12%
‐30% ‐20% ‐10% 0% 10% 20% 30% 40% 50%
4.4 The economic needs of the area should be the driving force that determines what type of development takes place in the Centre Region.
Strongly Agree
Agree
Disagree
Strongly Disagree
Strongly Agree
Agree
Disagree
Strongly Disagree
5%
20%
39%
8%
‐30% ‐20% ‐10% 0% 10% 20% 30% 40% 50%
4.5 Municipalities should use local tax resources to protect historic landmarks and buildings.
Strongly Agree
Agree
Disagree
Strongly Disagree
2%
11%
57%
12%
‐20% ‐10% 0% 10% 20% 30% 40% 50% 60%
4.6 Municipalities should protect historic landmarks and buildings through regulations and law.
Strongly Agree
Agree
Disagree
Strongly Disagree

Centre Region Comprehensive Plan Survey
Final Survey Report | January 2012 Page 16 of 68
3%
7%
46%
30%
‐20% ‐10% 0% 10% 20% 30% 40% 50% 60%
4.7 Municipalities should use local tax resources to preserve natural resources (air, water, soil, forests, etc.)
Strongly Agree
Agree
Disagree
Strongly Disagree
2%
4%
51%
35%
‐20% ‐10% 0% 10% 20% 30% 40% 50% 60%
4.8 Municipalities should use regulations, such as zoning or private conservation easements, to preserve natural resources (air, water, soil, forests, etc.)
Strongly Agree
Agree
Disagree
Strongly Disagree
6%
26%
26%
13%
‐30% ‐20% ‐10% 0% 10% 20% 30% 40% 50%
4.9 Municipalities should use local tax resources to preserve farming.
Strongly Agree
Agree
Disagree
Strongly Disagree
Centre Region Comprehensive Plan Survey
Final Survey Report | January 2012 Page 17 of 68
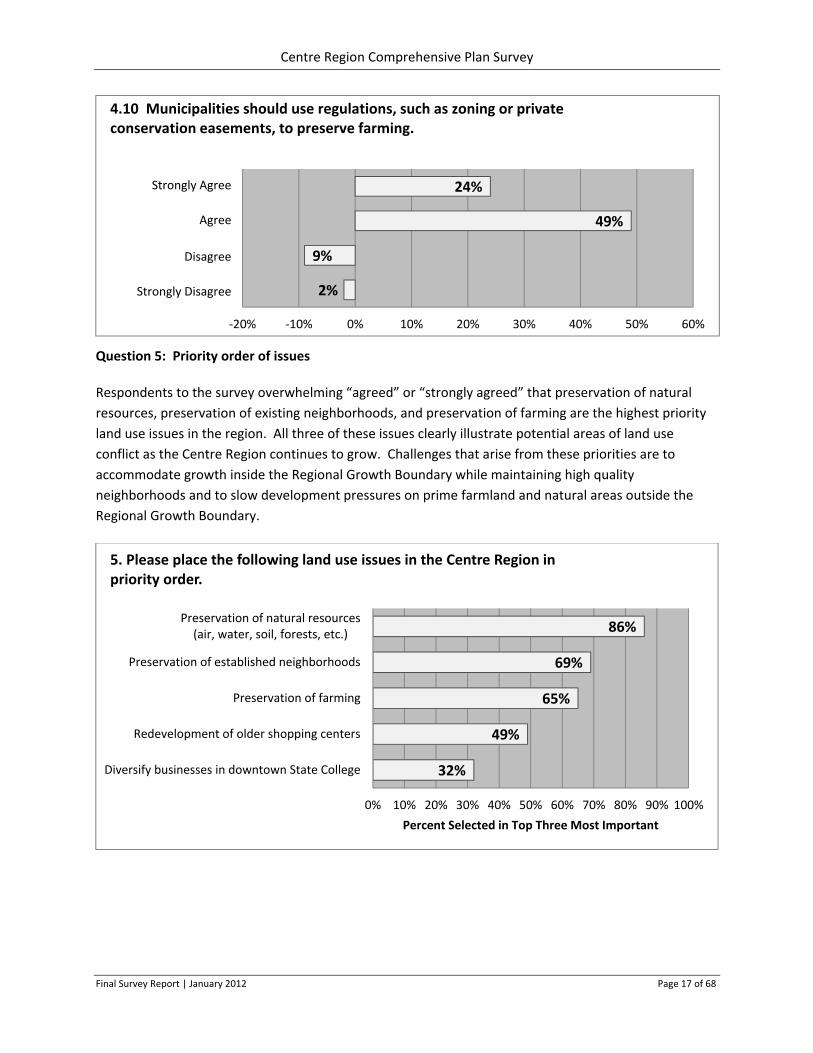
Question 5: Priority order of issues
Respondents to the survey overwhelming “agreed” or “strongly agreed” that preservation of natural
resources, preservation of existing neighborhoods, and preservation of farming are the highest priority
land use issues in the region. All three of these issues clearly illustrate potential areas of land use
conflict as the Centre Region continues to grow. Challenges that arise from these priorities are to
accommodate growth inside the Regional Growth Boundary while maintaining high quality
neighborhoods and to slow development pressures on prime farmland and natural areas outside the
Regional Growth Boundary.
2%
9%
49%
24%
‐20% ‐10% 0% 10% 20% 30% 40% 50% 60%
4.10 Municipalities should use regulations, such as zoning or private conservation easements, to preserve farming.
Strongly Agree
Agree
Disagree
Strongly Disagree
32%
49%
65%
69%
86%
0% 10% 20% 30% 40% 50% 60% 70% 80% 90% 100%
Diversify businesses in downtown State College
Redevelopment of older shopping centers
Preservation of farming
Preservation of established neighborhoods
Preservation of natural resources(air, water, soil, forests, etc.)
Percent Selected in Top Three Most Important
5. Please place the following land use issues in the Centre Region in priority order.

Centre Region Comprehensive Plan Survey
Final Survey Report | January 2012 Page 18 of 68
Question 6: Regional Land Uses
* Write‐in responses to “Other” can be found on Page 43.
9%
12%
17%
18%
24%
25%
30%
35%
0% 5% 10% 15% 20% 25% 30% 35% 40%
Other
Grocery store or shopping center
Regional shopping mall
Industrial areas
Specialty stores and boutiques
Neighborhood based convenience uses (dry cleaner,tax service, barber shop, drug store)
Mixed use areas (i.e. residential, commercial, office)
No additional commercial uses needed
Percent "Yes"
6. Do you feel the Centre Region needs more of the following types of land uses (Check all that apply)?

Centre Region Comprehensive Plan Survey
Final Survey Report | January 2012 Page 19 of 68
Question 7: Neighborhood Land Uses
* Write‐in responses to “Other” can be found on Page 44.
8%
3%
5%
9%
10%
11%
17%
58%
0% 10% 20% 30% 40% 50% 60%
Other
Industrial areas
Regional shopping mall
Specialty stores and boutiques
Mixed use areas(residential, commercial, office)
Grocery store or shopping center
Neighborhood based convenience uses (drycleaner, tax service, barber shop, drug store)
No additional commercial uses needed
Percent "Yes"
7. Do you feel your neighborhood needs more of the following types of land uses (Check all that apply)?

Centre Region Comprehensive Plan Survey
Final Survey Report | January 2012 Page 20 of 68
ATTITUDES ABOUT HOUSING (Questions 8 through 12)
Residents were asked how important it is to increase various housing types in the Centre Region. A
majority of respondents supported an increase in single‐family homes in the Centre Region, with
54 percent ranking this housing type as most important. Senior housing for resident aged 55+ was
supported by one in five residents surveyed. Most respondents did not identify a need for more housing
types such as condominiums/townhomes, apartments (whether in complexes or in single‐family homes),
duplexes and mobile homes. Each of these housing types received less than 10 percent of the responses
for most important.
Question 8: Housing Characteristics
* Write‐in responses to “Other” can be found on Page 46.
6%
37%
61%
62%
66%
69%
0% 10% 20% 30% 40% 50% 60% 70% 80%
Other
Better mix of housing types (single‐familydetached, townhouse, duplex, apartment)
Owner‐occupied housing
Housing that is clustered together topreserve farms and natural areas
Housing located within walking distanceof work, shopping, or bus service
Affordable rental or for‐sale housing
Percent Selected in Top Three MOST Important
8. How important is it to provide more of the following housing characteristics in the Centre Region?

Centre Region Comprehensive Plan Survey
Final Survey Report | January 2012 Page 21 of 68
Question 9: Housing Types
Question 10: Housing Costs
The survey asked residents to comment on the cost of housing relative to their gross household income.
Homeowners were asked (in accordance with the guidelines offered by the U.S. Department of Housing
and Urban Development) whether the cost for principal and interest, homeowner's insurance, and
property taxes exceeded 30 percent of their household income. Renters were asked whether their
rent and utility costs exceeded 30 percent of their income. While a majority of the residents responding
indicated that their housing costs (rental or homeowner) did not exceed the 30 percent household
income threshold, 41 percent of the respondents indicated that their housing costs take more than
30 percent of their household income.
6%
28%
29%
40%
57%
62%
78%
0% 10% 20% 30% 40% 50% 60% 70% 80%
Mobile homes
Apartment buildings/complexes
Apartments in single‐family homes
Duplexes
Senior housing (55+)
Condiminiums or townhouses
Single‐family detached homes
Percent Selected in Top Three Most Important
9. How important is it to increase each of the following housing types in the Centre Region?

Centre Region Comprehensive Plan Survey
Final Survey Report | January 2012 Page 22 of 68
Question 11: Availability of Rental Housing
The survey also asked respondents whether they felt there was enough rental housing available in their
price range, and whether there were enough homes for sale in their price range.
The responses to the question of available rental housing were fairly evenly split among those who felt
there was enough, those who felt there was not enough, and those who were not sure. These results
will require additional cross tabulation to determine whether those who felt they were unable to
answer the question are homeowners who have little experience in the rental market in the Centre
Region.
4%
55%
41%
0% 10% 20% 30% 40% 50% 60%
Don't Know
No
Yes
Percent of Responses
10. Do you spend more than 30% of your household income on housing costs (Housing costs include principal, interest, insurance and taxes for homeowners; rent and utilities for renters)?
34%
37%
29%
0% 5% 10% 15% 20% 25% 30% 35% 40%
Don't Know
No
Yes
Percent of Responses
11. Do you feel there is enough rental housing available in your price range in the Centre Region?
Centre Region Comprehensive Plan Survey
Final Survey Report | January 2012 Page 23 of 68
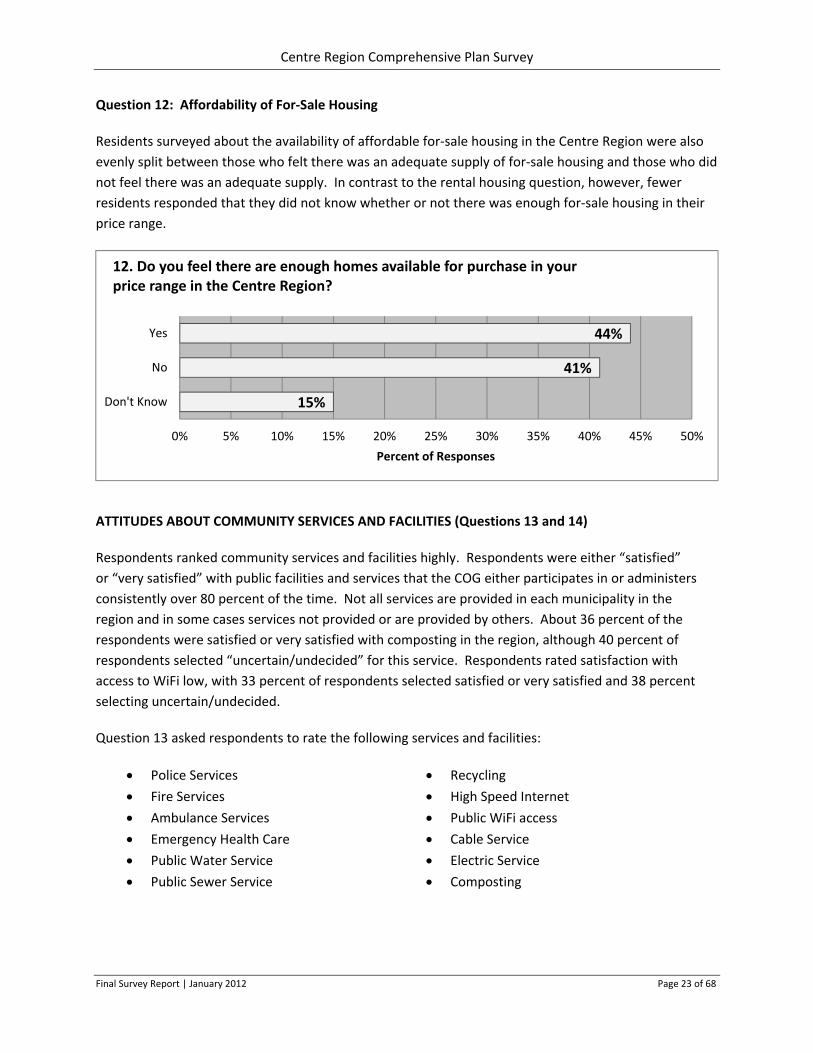
Question 12: Affordability of For‐Sale Housing
Residents surveyed about the availability of affordable for‐sale housing in the Centre Region were also
evenly split between those who felt there was an adequate supply of for‐sale housing and those who did
not feel there was an adequate supply. In contrast to the rental housing question, however, fewer
residents responded that they did not know whether or not there was enough for‐sale housing in their
price range.
ATTITUDES ABOUT COMMUNITY SERVICES AND FACILITIES (Questions 13 and 14)
Respondents ranked community services and facilities highly. Respondents were either “satisfied”
or “very satisfied” with public facilities and services that the COG either participates in or administers
consistently over 80 percent of the time. Not all services are provided in each municipality in the
region and in some cases services not provided or are provided by others. About 36 percent of the
respondents were satisfied or very satisfied with composting in the region, although 40 percent of
respondents selected “uncertain/undecided” for this service. Respondents rated satisfaction with
access to WiFi low, with 33 percent of respondents selected satisfied or very satisfied and 38 percent
selecting uncertain/undecided.
Question 13 asked respondents to rate the following services and facilities:
Police Services
Fire Services
Ambulance Services
Emergency Health Care
Public Water Service
Public Sewer Service
Recycling
High Speed Internet
Public WiFi access
Cable Service
Electric Service
Composting
15%
41%
44%
0% 5% 10% 15% 20% 25% 30% 35% 40% 45% 50%
Don't Know
No
Yes
Percent of Responses
12. Do you feel there are enough homes available for purchase in your price range in the Centre Region?

Centre Region Comprehensive Plan Survey
Final Survey Report | January 2012 Page 24 of 68
0%
2%
5%
48%
40%
‐20% ‐10% 0% 10% 20% 30% 40% 50% 60%
Percent of Responses
13.1 Are you satisfied with Police Services in the Centre Region?
Very Satisfied
Satisfied
Dissatisfied
Very Dissatisfied
Not Available
0%
0%
1%
43%
45%
‐20% ‐10% 0% 10% 20% 30% 40% 50% 60%
Percent of Responses
13.2 Are you satisfied with Fire Services in the Centre Region?
Very Satisfied
Satisfied
Dissatisfied
Very Dissatisfied
Not Available

Centre Region Comprehensive Plan Survey
Final Survey Report | January 2012 Page 25 of 68
1%
0%
1%
45%
41%
‐20% ‐10% 0% 10% 20% 30% 40% 50% 60%
Percent of Responses
13.3 Are you satisfied with Ambulance Services in the Centre Region?
Very Satisfied
Satisfied
Dissatisfied
Very Dissatisfied
Not Available
Very Satisfied
Satisfied
Dissatisfied
Very Dissatisfied
Not Available
1%
1%
8%
45%
33%
‐20% ‐10% 0% 10% 20% 30% 40% 50% 60%
Percent of Responses
13.4 Are you satisfied with Emergency Health Care in the Centre Region?
Very Satisfied
Satisfied
Dissatisfied
Very Dissatisfied
Not Available

Centre Region Comprehensive Plan Survey
Final Survey Report | January 2012 Page 26 of 68
5%
1%
3%
47%
37%
‐20% ‐10% 0% 10% 20% 30% 40% 50% 60%
Percent of Responses
13.5 Are you satisfied with Public Water Service in the Centre Region?
Very Satisfied
Satisfied
Dissatisfied
Very Dissatisfied
Not Available
8%
1%
2%
47%
35%
‐20% ‐10% 0% 10% 20% 30% 40% 50% 60%
Percent of Responses
13.6 Are you satisfied with Public Sewer Service in the Centre Region?
Very Satisfied
Satisfied
Dissatisfied
Very Dissatisfied
Not Available

Centre Region Comprehensive Plan Survey
Final Survey Report | January 2012 Page 27 of 68
0%
3%
9%
48%
34%
‐20% ‐10% 0% 10% 20% 30% 40% 50% 60%
Percent of Responses
13.7 Are you satisfied with Recycling in the Centre Region?
Very Satisfied
Satisfied
Dissatisfied
Very Dissatisfied
Not Available
2%
5%
14%
48%
19%
‐20% ‐10% 0% 10% 20% 30% 40% 50% 60%
Percent of Responses
13.8 Are you satisfied with High Speed Internet Service in the Centre Region?
Very Satisfied
Satisfied
Dissatisfied
Very Dissatisfied
Not Available

Centre Region Comprehensive Plan Survey
Final Survey Report | January 2012 Page 28 of 68
8%
4%
18%
24%
8%
‐20% ‐10% 0% 10% 20% 30% 40% 50% 60%
Percent of Responses
13.9 Are you satisfied with Public WiFi Access in the Centre Region?
Very Satisfied
Satisfied
Dissatisfied
Very Dissatisfied
Not Available
2%
11%
20%
41%
13%
‐30% ‐20% ‐10% 0% 10% 20% 30% 40% 50%
Percent of Responses
13.10 Are you satisfied with Cable Service in the Centre Region?
Very Satisfied
Satisfied
Dissatisfied
Very Dissatisfied
Not Available

Centre Region Comprehensive Plan Survey
Final Survey Report | January 2012 Page 29 of 68
14. What public services, not listed in Question 13, do you want?
Question 14 required a write‐in response. The most frequent responses are listed below. The
numbers in parentheses indicate like responses. In addition, 12 respondents indicated that no
additional services are necessary. See page 48 for a complete listing of responses.
Expanded recycling options, particularly plastics (22)
Composting, including food waste (15)
Expanded public transportation service (9)
More cable and internet service options (8)
Increased network of bike and pedestrian paths (6)
Expanded natural gas service to residential neighborhoods (5)
Fiber optic communications/FiOS (5)
2%
7%
57%
25%
‐20% ‐10% 0% 10% 20% 30% 40% 50% 60%
Percent of Responses
13.11 Are you satisfied with Electric Service in the Centre Region?
Very Satisfied
Satisfied
Dissatisfied
Very Dissatisfied
9%
4%
11%
24%
12%
‐20% ‐10% 0% 10% 20% 30% 40% 50% 60%
Percent of Responses
13.12 Are you satisfied with Composting in the Centre Region?
Very Satisfied
Satisfied
Dissatisfied
Very Dissatisfied
Not Available

Centre Region Comprehensive Plan Survey
Final Survey Report | January 2012 Page 30 of 68
Public Wi‐Fi (4)
Bikeshare (4)
More frequent yard waste/brush pickup (4)
Community education (4)
More community garden plots (3)
Recycling centers for lightbulbs and batteries (3)
ATTITUDES ABOUT TRANSPORTATION (Questions 15 through 24)
Survey recipients were asked several questions about what mode of transportation they use, and about
improvements that should be made to the transportation system in the region.
Sixty‐five percent of respondents indicated that their primary travel purpose on a typical weekday
(Monday‐Friday) was for work, and about 21 percent indicated that the primary purpose was for
shopping.
About 85 percent indicated that the main mode of travel for their primary trip was a private vehicle
(auto/truck/minivan, etc.). Public transportation and walking each represented about five percent of
the mode of travel, and three percent of respondents used a bicycle.
* Write‐in responses to “Other” can be found on Page 53.
2%
3%
4%
5%
21%
65%
0% 10% 20% 30% 40% 50% 60% 70%
Other
Medical Appointment
Recreation
School
Shopping
Work
Percent of Responses
15. In a typical week (Monday‐Friday) what is the primary purpose of your travel?

Centre Region Comprehensive Plan Survey
Final Survey Report | January 2012 Page 31 of 68
Almost 20 percent of respondents indicated that they used public transportation from at least
several times per month to on a daily basis. Of the various types of public transit available, CATABus
was utilized by over 70 percent of the transit users, and the CATARide and Centre County Office of
Transportation paratransit systems were used by about three percent of the respondents.
0%
1%
1%
3%
5%
5%
85%
0% 10% 20% 30% 40% 50% 60% 70% 80% 90%
Taxi
Carpool/vanpool
Motorcycle/scooter
Bicycle
Public transportation
Walk
Automobile/truck/minivan/etc.
Percent of Responses
16. What is the main mode of travel for your primary trip?
3%
6%
10%
36%
45%
0% 5% 10% 15% 20% 25% 30% 35% 40% 45% 50%
Daily
Frequently (several times a week)
Occasionally (several times a month)
Rarely (few times a year)
Never
Percent of Responses
17. How frequently do you use public transportation?

Centre Region Comprehensive Plan Survey
Final Survey Report | January 2012 Page 32 of 68
* Write‐in responses to “Other” can be found on Page 53.
Residents were asked to indicate the five most important factors that would encourage them to use
public transportation. Providing more direct bus routes between home and destination, and increasing
the frequency of departures from bus stops were two factors listed by about 85 percent of the
respondents. Expanded hours of operation was a factor listed by 73 percent of the respondents.
* Write‐in responses to “Other” can be found on Page 53.
3%
1%
2%
23%
71%
0% 10% 20% 30% 40% 50% 60% 70% 80%
Other
CATARide
Centre County Office ofTransportation Services van/bus
Campus Loop/Link
CATABus
Percent of Responses
18. Which type of public transportation do you use the most?
26%
44%
53%
67%
68%
73%
84%
85%
0% 10% 20% 30% 40% 50% 60% 70% 80% 90%
Other
Service to my neighborhood
A bus stop closer to my home
Reduced cost of bus fare or bus pass
A bus stop closer to my destination
Expanded hours of operation
Increased frequency of departuresfrom bus stops
More direct bus route betweenmy home and destination
Percent Selected in Top Five Responses
19. Which of the following factors would encourage you to use public transportation more frequently?
Centre Region Comprehensive Plan Survey
Final Survey Report | January 2012 Page 33 of 68
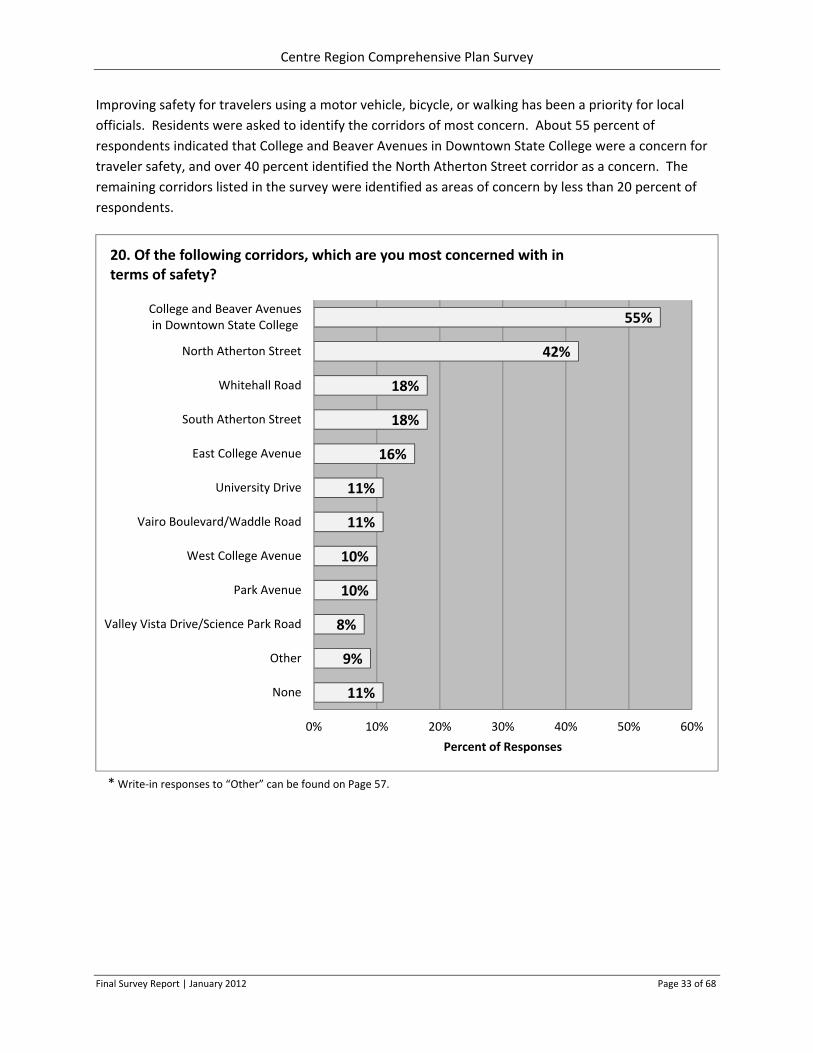
Improving safety for travelers using a motor vehicle, bicycle, or walking has been a priority for local
officials. Residents were asked to identify the corridors of most concern. About 55 percent of
respondents indicated that College and Beaver Avenues in Downtown State College were a concern for
traveler safety, and over 40 percent identified the North Atherton Street corridor as a concern. The
remaining corridors listed in the survey were identified as areas of concern by less than 20 percent of
respondents.
* Write‐in responses to “Other” can be found on Page 57.
11%
9%
8%
10%
10%
11%
11%
16%
18%
18%
42%
55%
0% 10% 20% 30% 40% 50% 60%
None
Other
Valley Vista Drive/Science Park Road
Park Avenue
West College Avenue
Vairo Boulevard/Waddle Road
University Drive
East College Avenue
South Atherton Street
Whitehall Road
North Atherton Street
College and Beaver Avenuesin Downtown State College
Percent of Responses
20. Of the following corridors, which are you most concerned with in terms of safety?

Centre Region Comprehensive Plan Survey
Final Survey Report | January 2012 Page 34 of 68
Regarding the top three priorities for roadway improvements, over 65 percent of respondents indicated
that focusing on maintaining good pavement quality and bridge conditions was important. About 54
percent indicated that adding sidewalks and bike lanes along roadways was important.
* Write‐in responses to “Other” can be found on Page 58.
9%
4%
11%
13%
14%
39%
41%
54%
66%
0% 10% 20% 30% 40% 50% 60% 70%
Other
Add more traffic lights
Add street lighting in major roadway corridors
Implement traffic calming measures
Add street lighting in highway interchange areas
Make existing traffic signals more efficient
Widen existing roads in other congested areas
Add sidewalks and bike lanes along roadways
Focus on maintaining good pavement qualityand bridge conditions
Percent of Responses
21. What roadway improvements should be made in the Centre Region?

Centre Region Comprehensive Plan Survey
Final Survey Report | January 2012 Page 35 of 68
For improvements to bicycle and pedestrian facilities, 56 percent of respondents listed adding more
off‐street bikeways and providing connections between existing sidewalks, trails, and bikeways as being
important. About 54 percent indicated that more connections should be provided between existing
sidewalks, trails and bikeways.
* Write‐in responses to “Other” can be found on Page 60.
8%
14%
34%
38%
41%
54%
56%
0% 10% 20% 30% 40% 50% 60%
Other
Make crosswalks more visible
Add more facilities that reduce conflictsbetween pedestrians and vehicles
Expand the system of sidewalksand pedestrian trails
Add more bike lanes on roads
Provide connections between existingsidewalks, trails, and bikeways
Add more off‐street bikeways
Percent of Responses
22. What improvements in bicycle or pedestrian facilities should be made in the Centre Region?

Centre Region Comprehensive Plan Survey
Final Survey Report | January 2012 Page 36 of 68
On the topic of improving access to the region, the results indicated that 50 percent of respondents
support making major highway improvements to connect the region with Route 322 at Seven
Mountains. More passenger air service at University Park Airport was listed by 46 percent of the
respondents as being important, and high speed rail service was listed by 42 percent as a priority.
* Write‐in responses to “Other” can be found on Page 61.
4%
13%
21%
22%
29%
42%
46%
50%
0% 10% 20% 30% 40% 50% 60%
Other
A new Centre Region Bus Terminal
More intercity bus service
Roadway access to I‐80 via Route 322West of Port Matilda
New interchange between I‐99 and I‐80at the Exit 161 Bellefonte Interchange
High speed rail service
More passenger air service atthe University Park Airport
Major highway improvements to connect the Regionwith the four lane section of Rte 322 at Seven Mts
Percent of Responses
23. What improvements should be made to enhance transportation access to the Centre Region?
12%
23%
65%
0% 10% 20% 30% 40% 50% 60% 70%
Don’t know
Yes
No
Percent of Responses
24. Do you spend more than 15% of your household income on transportation costs? (Costs include monthly vehicle loan payments, insurance, vehicle registration, vehicle maintenance and repairs; bus fare, bus pass, taxi fare, etc.)

Centre Region Comprehensive Plan Survey
Final Survey Report | January 2012 Page 37 of 68
ATTITUDES ABOUT THE ENVIRONMENT (questions 25 thorough 27 and related questions)
Environmental issues continued to be important with respondents to the survey. Having access to open
space, maintaining a low level of environmental pollution, and encouraging sustainability throughout
the Centre Region were most frequently rated as the most important objectives to guide future growth
and development in the Centre Region. A total of 86 percent of the respondents “agreed” or “strongly
agreed” with the statement that municipalities should use land use regulations to preserve natural
resources.
* Write‐in responses to “Other” can be found on Page 62.
2%
11%
12%
22%
25%
28%
55%
68%
76%
0% 10% 20% 30% 40% 50% 60% 70% 80%
Other
Increase energy efficiency in municipalbuildings and vehicles
Use of renewable energy sources in municipalbuildings and vehicles
Access to forest, game lands, and natural areas
Refuse management and recycling programs
Open space
Air quality
Quality and quantity of water resources(streams, rivers, wetlands)
Protect drinking water quality
Percent Selected in Top Three Responses
25. Please place the following natural and environmental issues in priority order.

Centre Region Comprehensive Plan Survey
Final Survey Report | January 2012 Page 38 of 68
Several questions specifially addressed Spring Creek. Over 40 percent of the respondents had used
Spring Creek Park in the preceding year for some type of recreational activity. Also, 80 percent of the
respondents indicated that municipalities should restrict development near Spring Creek to protect or
improve the quality of Spring Creek.
* Write‐in responses to “Other” can be found on Page 64.
58%
4%
5%
10%
37%
0% 10% 20% 30% 40% 50% 60% 70%
I have not used Spring Creek
Other
Canoe, Kayak
Fishing
General Passive Recreation
Percent of Responses
26. In the past 12 months have you used Spring Creek for any of the following activities?
20%
58%
62%
80%
0% 10% 20% 30% 40% 50% 60% 70% 80% 90%
Increase access to Spring Creek andits tributaries
Increase vegetative buffers near Spring Creekand its tributaries
Educate the public about specific issuesrelated to Spring Creek and its tributaries
Restrict development near Spring Creek andits tributaries
Percent of Responses
27. Which of the following items do you feel the municipalities should engage in to protect or improve the quality of Spring Creek and its tributaries?

Centre Region Comprehensive Plan Survey
Final Survey Report | January 2012 Page 39 of 68
ATTITUDES ABOUT THE CENTRE REGION ECONOMY (questions 28 through 31)
Economic development priorities
The survey asked several questions regarding opinions on economic development priorities and issues.
Respondents ranked “retaining existing businesses”, “attracting new businesses” or “expanding existing
businesses” in priority order. Over 83 percent of the respondents ranked “retaining existing businesses
in the Centre Region” as their first or second highest priority. Over 60 percent ranked “attracting new
businesses” as their first or second priority.
6%
37%
57%
0% 10% 20% 30% 40% 50% 60%
Expanding existing businesses in the Centre Region
Attracting new businesses to the Centre Region
Retaining existing businesses in the Centre Region
Percent of Responses
28. Please place the following economic issues in priority order. What is the HIGHEST priority?

Centre Region Comprehensive Plan Survey
Final Survey Report | January 2012 Page 40 of 68
Incentives
About 40 percent of respondents supported incentives consisting of funding construction of
infrastructure such as streets and water or sewer lines and tax abatements or reductions to keep
existing businesses or attract new businesses to the Centre Region. One in four respondents did
not support offering any incentives.
* Write‐in responses to “Other” can be found on Page 65.
5%
25%
34%
41%
43%
0% 5% 10% 15% 20% 25% 30% 35% 40% 45% 50%
Other
Incentives should not be offered
Reducing development review and permitting fees.
Tax abatements or reductions
Funding construction infrastructure such as streets,water or sewer lines.
Percent of Responses
29. Should municipalities offer any of the following incentives to keep existing business or attract new business?
Centre Region Comprehensive Plan Survey
Final Survey Report | January 2012 Page 41 of 68
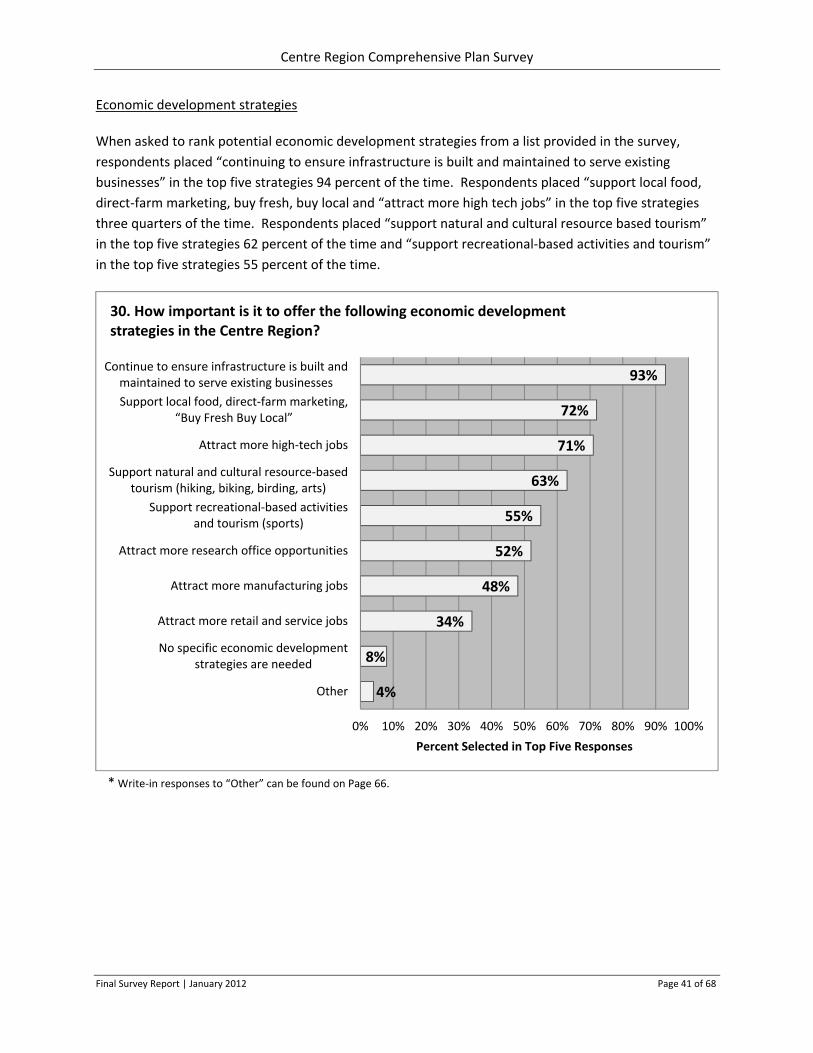
Economic development strategies
When asked to rank potential economic development strategies from a list provided in the survey,
respondents placed “continuing to ensure infrastructure is built and maintained to serve existing
businesses” in the top five strategies 94 percent of the time. Respondents placed “support local food,
direct‐farm marketing, buy fresh, buy local and “attract more high tech jobs” in the top five strategies
three quarters of the time. Respondents placed “support natural and cultural resource based tourism”
in the top five strategies 62 percent of the time and “support recreational‐based activities and tourism”
in the top five strategies 55 percent of the time.
* Write‐in responses to “Other” can be found on Page 66.
4%
8%
34%
48%
52%
55%
63%
71%
72%
93%
0% 10% 20% 30% 40% 50% 60% 70% 80% 90% 100%
Other
No specific economic developmentstrategies are needed
Attract more retail and service jobs
Attract more manufacturing jobs
Attract more research office opportunities
Support recreational‐based activitiesand tourism (sports)
Support natural and cultural resource‐basedtourism (hiking, biking, birding, arts)
Attract more high‐tech jobs
Support local food, direct‐farm marketing, “Buy Fresh Buy Local”
Continue to ensure infrastructure is built andmaintained to serve existing businesses
Percent Selected in Top Five Responses
30. How important is it to offer the following economic development strategies in the Centre Region?
Centre Region Comprehensive Plan Survey
Final Survey Report | January 2012 Page 42 of 68
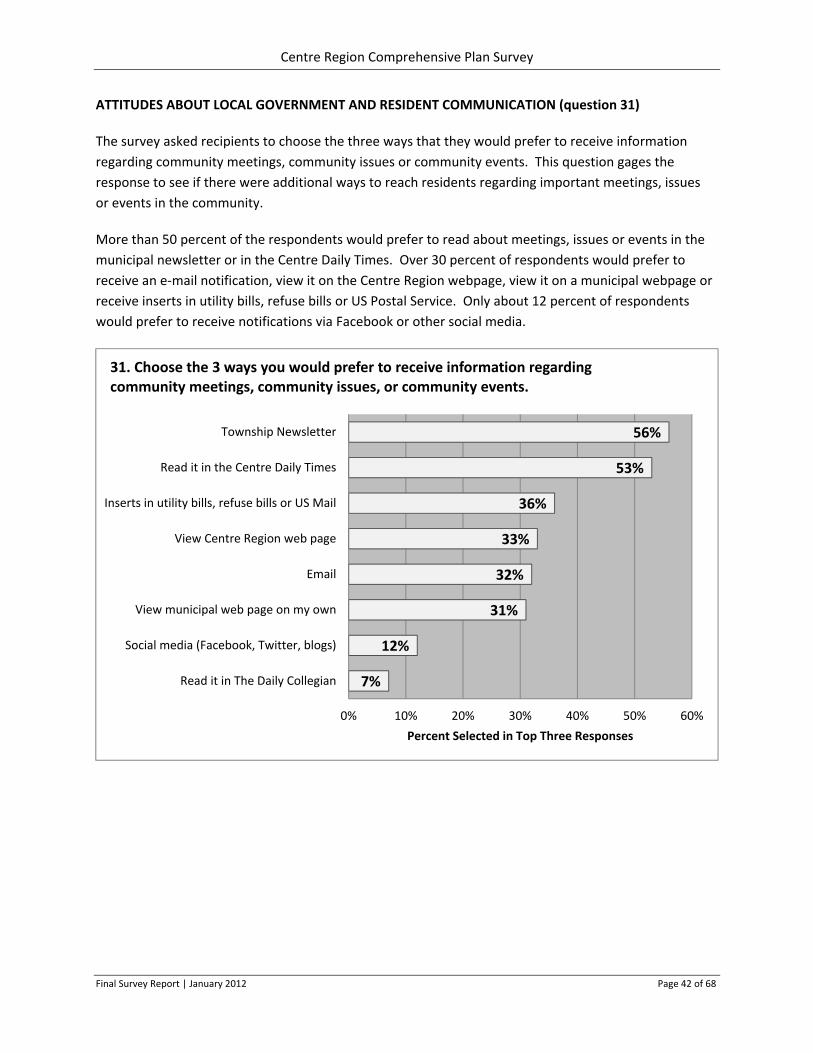
ATTITUDES ABOUT LOCAL GOVERNMENT AND RESIDENT COMMUNICATION (question 31)
The survey asked recipients to choose the three ways that they would prefer to receive information
regarding community meetings, community issues or community events. This question gages the
response to see if there were additional ways to reach residents regarding important meetings, issues
or events in the community.
More than 50 percent of the respondents would prefer to read about meetings, issues or events in the
municipal newsletter or in the Centre Daily Times. Over 30 percent of respondents would prefer to
receive an e‐mail notification, view it on the Centre Region webpage, view it on a municipal webpage or
receive inserts in utility bills, refuse bills or US Postal Service. Only about 12 percent of respondents
would prefer to receive notifications via Facebook or other social media.
7%
12%
31%
32%
33%
36%
53%
56%
0% 10% 20% 30% 40% 50% 60%
Read it in The Daily Collegian
Social media (Facebook, Twitter, blogs)
View municipal web page on my own
View Centre Region web page
Inserts in utility bills, refuse bills or US Mail
Read it in the Centre Daily Times
Township Newsletter
Percent Selected in Top Three Responses
31. Choose the 3 ways you would prefer to receive information regarding community meetings, community issues, or community events.

Centre Region Comprehensive Plan Survey
Final Survey Report | January 2012 Page 43 of 68
WRITE‐IN RESPONSES FOR QUESTIONS WHICH INCLUDED “OTHER”
1. MOST IMPORTANT OBJECTIVES which could be used to guide future growth and development in
the Centre Region.
Attracting manufacturing jobs
Balance growth vs. infrastructure
Diversify economy and getting a medical school
Less code restrictions.
More rent‐to‐buy homes. Real estate is very expensive.
Preventing loss of farmland to residential/commercial use.
Preventing PSU from buying land!
Stop all development
6. Do you feel the Centre Region needs more of the following types of land uses?
Should be market driven
Gas stations around the hospital/Park Avenue area
More restaurants, especially in parts of town without any
Unless needed to provide jobs
I'm satisfied
Maximize commercial enterprise
Green spaces
Apartment buildings for students and non‐students
More local small businesses; no more chain stores
Use what is already here
Fewer banks
Urban farms and community gardens
More rent‐to‐buy homes
Biking trails and dedicated bike lanes
Community/family recreational center where people can play games, or cards – example YMCA
Fewer large box stores and more individual small business in all areas
More diversity in hardware stores
Dress and shoe store for senior adults
Nothing to be done – a lot is needed
Make the Centre Region pedestrian friendly throughout – continue all sidewalks and mark
walking lanes in the shopping centers
More community gardens
Gas stations
Convenience stores
Churches
Social environment like Dave and Busters
Centre Region Comprehensive Plan Survey
Final Survey Report | January 2012 Page 44 of 68
Diverse restaurants instead of 30 Asians and American
Use buildings now empty instead of building more shopping centers
Revitalize Hills Plaza
Farmland and natural resource preservation
Stem flight of businesses from the central region
Use currently empty buildings, that is the green way
Use existing empty stores (Circuit City, Hills Plaza, or Northland Center)
Green space
Better restaurant options
Big name stores like Babies R Us, Old Navy, etc.
Downtown hardware and grocery
Live music and nighttime locales for non‐student adults
Disc Golf Courses
Places where teens can go and hang out
Non‐chain restaurants
Planning for land use needs to be based on what's a safe and healthy environment for children,
including child‐friendly commercial design
Open space, woods, etc.
Non‐commercial public congregation space
Outdoor activities like mountain biking, hiking, skiing, etc.
More businesses focused on eco‐friendly options
Outdoor park
Bikeshare
Redevelop Parkway Medical Center to provide neighborhood‐based grocery and services
No, we have enough
Neighborhood developments
More freedom for landowners to choose what they do based on their current inclinations and
on current needs based on the invisible hand of the market
The landowners need to be free to supply what people want today, not what someone in COG
thinks people will want 10 years from now
Government should stay out of determining land use
Dog parks
More locally owned restaurants would be nice
7. Do you feel your neighborhood needs more of the following types of land uses?
Unique offices INNOBLUE
Should be market driven
Pine Grove Mills/PA Furnace could use some restaurants, convenience stores, etc.
Restaurants
Unless needed to provide jobs
Centre Region Comprehensive Plan Survey
Final Survey Report | January 2012 Page 45 of 68
No more apartments
More bike paths
Urban farms and community gardens
Small grocery store
No more banks or hotels
Gas stations
Local hardware store
Expansion of high tech companies
Social outlet like a meeting place
Renew empty store near Ollie’s
Fill empty store in the Hills Plaza
Reuse in Hills Plaza
Stores in the empty space at Hills Plaza
Restaurants
Decent car wash
Maintenance of trees, shrubs, etc.
Parks/recreational areas
Raves
I want the rental market to expand. Allow for private sector to take advantage of PSU growth.
Slow the PSU building of housing units and allow private citizens to recoup, through rentals to
students, their investments into the region. Loosen permitting for neighborhood rentals.
Parks
Take the former Ames store and bring in a large outlet store such as Homegoods
Neighborhoods need to be focused on building community and quality of life
The unique layouts and designs of neighborhoods are being overlooked based on the desire to
build more houses in a smaller area. The real estate and housing market is still suffering
tremendously. We don't need to attract a larger population and cause even more foreclosures.
Maintain the neighborhoods, houses, and families here now. The stronger we make them now,
the better we can build in the future.
Open space, woods, etc.
Access to bike trials
Non‐commercial public congregation space
Outdoor activities: mountain biking, hiking, skiing, etc.
Park/green space
Not banks
Zoning should be friendlier to small home based enterprises
Community garden
Public square for social opportunities
Bikeshare
Redevelop Parkway Medical Center to provide neighborhood‐based grocery and services

Centre Region Comprehensive Plan Survey
Final Survey Report | January 2012 Page 46 of 68
No, we have enough
Whatever is needed at the time the landowner wants to change the use of the land
More freedom for individuals so everything isn't so much alike
Government should stay out of determining land use
Dog parks
More locally owned restaurants
More recreational areas
8. How important is it to provide more of the following housing characteristics in the Centre Region?
Ranked 1 (Most Important):
Let people do what THEY want
Less housing
Let the market decide what types of housing to have within zoning codes
55 and over – assisted living combination housing
More builder friendly government
Tax money should not be used for affordable housing
Make downtown less of a ghetto
More student housing at PSU
Not denser housing
Zombie‐ready fortresses
To not overdevelop in existing neighborhoods and drive out valuable members of our
community just to bring in higher volume but lower quality.
None
Centre Region does not provide housing, individuals should provide it based on what the
owners, buyers or sellers consider important.
Let housing types change as people’s needs change. When mortgages aren't available we need
more rentals, but as the financial situation stabilizes we'll need more owner‐occupied housing.
Eliminate zoning and codes. Let the market decide. Government only drives up the cost.
We do not need more housing in the Centre Region
Ranked 2:
Why not stack them up instead of spreading out
1+ acre lots with owner occupied housing
More bike routes. Lemont is cut off by bridges on Branch Road; Branch is very dangerous.
To provide housing that encourages risk taking entrepreneurs to move here with the intent of
long term residence and consistent positive contribution
I don't think we need more housing
No changes or additions in housing needed
Preservation of land
Housing within public transportation system

Centre Region Comprehensive Plan Survey
Final Survey Report | January 2012 Page 47 of 68
None
Government needs to get out of the business of making these kinds of value judgments
The market should decide this
Less control
Allow people to change the use of their property based on changes in regional circumstances
Eliminate zoning and codes. Allow the market to decide. Government only drives up the cost.
Stop developing the whole town
Wheel chair accessible, routine units housing
Need more high rises in different areas with businesses, street level apartments
Ranked 3:
Communal housing; Green zoning
Smaller houses that are energy efficient
Require landlords to maintain their property
Sustainable and eco friendly
No changes or additions needed
Housing that is not crowded
Outlaw leaf blowers
Energy efficient smaller homes
We have enough housing
The market should decide this
Much less draconian control
More freedom for individuals to change their homes without having to come begging
government for permission
Eliminate zoning and codes. Let the market decide. Government only drives up the cost.
S&A homes are turning town into 2030's slum
Ranked 4:
Sustainable housing, zero energy houses or condos
No changes/additions needed
Mixed‐use, integrated small enterprise/residences
Do not mix housing types
Pet friendly housing
Not important
Keep student housing away from existing family neighborhoods
Get over your control fetish
Less government control. Fewer permits and inspections. More freedom to do things our way.
Not allowing the State College homebuilder market to be dominated by one builder (S&A)
Please preserve Circleville Farms – it's a jewel to all residents in Ferguson

Centre Region Comprehensive Plan Survey
Final Survey Report | January 2012 Page 48 of 68
Ranked 5 (Least Important):
Sidewalks in neighborhoods and connected walkways and bike paths
Less student housing; stricter rules on student housing
Management company to control unruly parties and behavior
No more housing
Make sure farms are able to stay farms
Mixed use small enterprise and residential housing
Less rental housing
Rentals restricted to non‐student housing
Energy efficient housing
Housing within the regional growth boundary
Houses that have true architectural style and not just builder designed housing
Student housing that is as far away as possible from existing family neighborhoods
Green built housing
Real open development
Lower costs of building so that we don't have to rely on the same handful of architects,
engineers; Developers are making everything so identical it looks like something out of a bad
sci‐fi movie
Housing for senior citizens
14. What public services, not listed in Question 13, do you want (Please list no more than 3)?
Stay away from new hires – we are broke; more adult education on an “as you go" basis – must
support itself; help local businesses survive with an ombudsman
Public recreation center
Get rid of composting and recycling; nothing new or more
More street lights – especially in township
Composting (food)
Better cell phone service; Fairbrook has no signal
No more services are needed.
Possibly more flights offered from SCE
Closer fire hydrants to my residence
Maintenance of library funding
Free parking for seniors over 75 years of age; no taxes for seniors (over 75 yrs. old) or veterans;
more on‐street parking
Free Public Wi‐Fi, Google Internet
Expansion of recycling to include more
Pick up yard waste – provide containers to do so
Harris Township should pick up brush more than twice a year
FIOS
Better, less expensive bus system

Centre Region Comprehensive Plan Survey
Final Survey Report | January 2012 Page 49 of 68
Education; less drinking among PSU student population; more industry/more employment
Improved medical facilities
Composting
More gas lines
The ability to have more than one electric, gas, and water company to choose from
Recreation, education, trees
More bike paths
Better television services; sewer fee for amount of water you use
Have composting in the townships in addition to the Borough
Neighborhood scale, renewable energy electric power plants
Bike paths
Real estate is expensive – more rent‐to‐buy homes; tutors to teach special needs kids
Composting; more recycling options (plastics)
Better Business Bureau to monitor services provided by handymen
I wish we could recycle MORE plastics here (yogurt containers, etc.); composting details are too
limited in terms of brush that can be placed at curbside, although I do understand it may not be
feasible to do more garden brush (I don't mean vegetables)
Affordable, quality healthcare and general physicians; Mt. Nittany isn't good (general physicals
also not good quality); reasonably affordable communication provider (cable, internet, phone)
Sidewalks regularly available and constantly maintained; bike paths
None
Expand public mass transit
More CATA bus service
More bike paths
Curbside recycling of batteries
Lower cost sewer service (The rate is one of the highest in PA)
More public transportation
Public rides; more jobs; more daycare
Recycling to accept all plastic and paper; service to collect compostable between wastes;
localize collection stations for unused pharmaceutical, paints
None. You already have your hand in my pocket too deep.
More recycling of all plastics
Mandatory recycling
Recycling of vegetable waste; recycling of yogurt/margarine containers
I think fire service should be tax payer funded
Public competitions
None. Don’t spend any more money
Improve recycling for everything; improve recycling drop off points; composting for (private)
residence
Parks and recreation services

Centre Region Comprehensive Plan Survey
Final Survey Report | January 2012 Page 50 of 68
5 deposit return on glass and plastic bottles
Standard trash/brush/junk removal between townships
Expanded recycling services, more plastics etc.; earlier morning bus service
Composting Harris Township
Free street parking; police corruption investigators; water fountains and/or water bottle fill
stations
Choice of trash collection
PSU to be most accountable to Centre Region for student damage and behavior, not residents
and business
Expanded public transportation (a bigger and faster CATA)
No more taxes for public services
Composting in College Heights (collection)
Nothing. Why should government take care of our every want and need?
Help making choices to find reusable energy providers
More recycling downtown
Public transportation
Public wireless internet expanded to all borough areas
Better dog waste enforcement in parks; routine police presence in parks; better synchronization
of lights on Beaver and Atherton Avenues
Consolidate refuse recycle in community area would be convenient; stop and eliminate would
be a personal plus
None given budgetary restraints
Less services; more personal freedom and responsibility
Community center; I miss Webster’s, where people would gather to talk, read etc. It was a great
public service on Allen Street.
Additional bicycle paths
With regard to recycling, we seem to recycle only the bare minimum relative to other parts of
the country. I'd love to see the Centre Region support more extensive recycling efforts.
Yard debris pickup (tree limbs, etc.)
FIOS service
FIOS to the home
More cable and internet service options
Recycling centers for the more uncommon household items: light bulbs, batteries, etc.
Halfmoon Township is not part of the CRPR discounted programs. We also use DISH for TV
because of dislike of Comcast which is more expensive. There is also no composting in
Halfmoon, which I guess is due to residents being able to provide for themselves.
Waste disposal; recycling for paint cans, batteries, etc.
Police transparency
More natural gas service to housing
Recycling – we have seen recycling trucks dumping their stuff in regular dumpsters

Centre Region Comprehensive Plan Survey
Final Survey Report | January 2012 Page 51 of 68
More community garden access
Resident usage fee for Center Parks and Recreation for Halfmoon Township residents
Although recycling service is provided, it is far from adequate. Many more items could be
picked up and recycled (particularly plastics, foils, etc.)
Gas service
Composting in wider availability
More frequent leaf & debris removal/; better street signage
More options for recycling plastic
Better recycling pick up across the board, meaning a wider range of taken recyclables from
home and business pickup.
In town bike sharing program such as this: http://www.bikepottstown.com/
Better connection of bike paths to outlying areas such as Kaywood and Willowbrook
More electric providers – West Penn has a monopoly. I do not care for their business practices,
but I have no other option but to go through them. Even if I choose another electric supplier, I
am still billed through West Penn.
Natural gas lines for private residences
I value the public library and all its programs; I am grateful for public transportation
Available public garden plot; better use of Wal‐Mart for recycling (incl. mercury light bulbs) and
information dissemination related to the community; public parks that aren't baseball fields
I'd like more competition for high speed internet – I feel like I'm severely limited in my choices.
Bike lanes; hire seniors or homebound individuals or stay‐at‐home parents to guard streets for
kids walking to and from school and all kids within 1 mile of their school can walk, therefore
reducing busing emissions and helping obesity rates
More animal shelters with good facilities, space; and more animal control wardens
Animal control
Greater recycling: composting opportunities and awareness
More cable and internet options beyond Comcast
Consolidation of services at the county level to save duplication and redundancy
More dog parks
Better public transportation
None – save money
Composting
Library
Free public Wi‐Fi in all outdoor spaces
Transportation
I would like to see food waste composting expanded; Community Education facilities
Year‐round recreational facility with pool
Small business counseling service and tax advice
Bikeshare
Shut down Allen Street for a public park

Centre Region Comprehensive Plan Survey
Final Survey Report | January 2012 Page 52 of 68
Bikeshare
Bikeshare
Pickup at the curb more kinds of containers for recycling – examples are yogurt cups, plastic
food containers, etc.
Enforcement of air quality standards and other environmental standards
Metro service in the future
Car and/or bike share service, although that could be privately run
Municipal police services – Halfmoon residents rely on the state police and depending on their
work load, their response time can be slow
DSL internet connection
Disposal of hazardous materials
Consolidated local police, fire and emergency services
More recycling items
None
More frequent busing
Halfmoon Township needs public sewer service
More public services mean higher taxes, and I want less taxes
Bus service expanded
Bike and walking paths which connect to commercial areas
More recycling options than what is now available
Other cable choice; fiber optic
Recycling/composting of food waste; public green space in vicinity of Beaver Canyon; increased
network of bike and pedestrian paths
Right now, I want FIOS! But 8 years down the road, that may not be the most desirable type of
internet service. I want local governments to get out of the business of granting monopolies to
these kind of service providers, so that we can let demand and competition determine what’s
available (fire, police, and ambulance excepted)
Community Bike Rental; municipal owned Cable Service; public gardens
I want local government to get out of the way of those who want to provide 21st century
services (fiber optic internet to homes) and let them compete with individuals for our business.
Maybe we would get a decent service around here not just Comcast, or Verizon DSL
Curbside recycling needs to be stopped. It’s too costly and adds to air pollution with a vehicle
stopping and starting every 200 feet; more people would benefit with community drop off
containers, reduced cost.
Recycling of all plastics
Public Wi‐Fi; composting
More dog parks
Park‐ride service to/from Boalsburg
More economical water, sewer, and especially trash & recycling service/fees; do NOT mandate
composting – we can manage that without your help.

Centre Region Comprehensive Plan Survey
Final Survey Report | January 2012 Page 53 of 68
Expansion of access to natural gas lines for residential heating
Snow removal and winter road maintenance in State College Borough is poor compared to
Ferguson Township
Expanded recycling program
Paid processional fire services instead of all volunteer; competitive municipal waste disposal
(choice in service providers); pay as you throw (PAYT) payment structure of municipal waste
disposal rather than monthly bills that hinder conservation.
Public transportation; snow removal services
Public transportation, buses
15. In a typical week (Monday‐Friday) what is the primary purpose of your travel?
Volunteering/Helping others (4)
Living
Retired
Social visiting
Church
Whatever I need to do
Kids (4)
Vocational rehabilitation center. Opportunity for centre clubhouse
Errands (2)
Checking things out
Dining
18. If you use public transportation, which do you use the most?
Taxi (9)
Planes/city subways
19. Which of the following factors would encourage you to use public transportation more?
Ranked 1 (Most Important):
Maintenance of sidewalks
Can you find a way for public transportation to be self‐supporting and an effective use of my
time? Then I would consider it.
More friendly people
Loss of driving license
Maybe if I lost my job and couldn't afford a car
Safer bicycle routes
Child safety seats on buses
None – I need my car for work
Remove bus service from my neighborhood
7 days a week

Centre Region Comprehensive Plan Survey
Final Survey Report | January 2012 Page 54 of 68
Nothing, I don't need it; I mostly walk. I might use it for special events, such as the Beer Festival,
etc.
I work at home so no transportation is needed
Sunday service
I won't use public transportation
Public transportation is just like riding the school bus, which was hell. As a citizen I'm free to
come and go as I please by whatever means I choose, and that's the way it should be. I'm tired
of my tax dollars going for nearly empty buses (or when they are full, subsidizing Penn State
students living off campus)
CATA doesn’t service where I need to go
If it was possible to have expanded service that would allow me to get to work on time, I would
ride the bus
More service on loop during summer
Bikeshare
On‐time arrivals and departures
Grocery store focused shuttles that permit grocery bags
It's not for me
I think Centre Ride is a great service to seniors
Not having to stand
Bus service is wonderful – hauling things on the bus is a problem.
Actually, I enjoy walking
No desire at this time to use Public Transportation.
I would have to stop being selfish
Would not use public transportation
Won't ever use it
Children below the age of 16 should be exempted from paying bus fare
I don't travel enough to need it
More frequent service to outlying areas
N/A, I go from job to job in the afternoons. I need a vehicle or else I couldn't work both jobs
No option – I commute from Williamsport
Friendly, safe drivers
Increased flexibility with the Ride for 5 program
My job requires that I travel all over the state, so I can't use public transportation
Too many stops for me with my children
Will not use – I prefer my vehicle as most cost effective
I have no need for public transportation
I would not use it
Reduce all the empty buses running around
CATA is now efficient
Very high price of gas

Centre Region Comprehensive Plan Survey
Final Survey Report | January 2012 Page 55 of 68
Traffic gridlock
Education
Keep running the white loop over the summer
No need for public transportation
Do not want to take the bus
Inability to drive
Not needed for me and where I live
I don't want to ride the bus
No more free rides for PSU students
No need to use this time
It is good now
Will not use
We are satisfied with current services
CATA W bus doesn't run on Sundays
Would most likely never use
I don’t like buses
I walk to town
A bus should stop at all stops not just their individual route
Better incentives like Ride for $5 and higher gas taxes
Ranked 2:
Nothing
Not desirable to me
Easier multiple bike carrier on bus
If public transportation provided the flexibility and comfort people want (like our cars do)
Route 322 Business
Able to access any bus and Route from the CATA depot
Change in work needs
We don't need public transportation
Route 550 Bike Lane
CATA is terrific
I enjoy walking
If you put a bus stop at the end of my driveway I wouldn't use it
More direct route from my home to work
Would not use it
Worthless bus route elimination
Intersection of South Pugh and Ellen Avenue
A bus stop for the blue loop near the lion statue
No need for public transportation
Anywhere there are cops

Centre Region Comprehensive Plan Survey
Final Survey Report | January 2012 Page 56 of 68
Student free buses
Expanded summer hours
Ranked 3:
If the drivers could stop if they see you running for the bus
You need to provide more choices than just those that encourage expansion of CATA and the
subsidies to it, because we DON'T all agree with doing that
None of these, service is adequate
More convenient stops and times
Expanded hours during PSU breaks
Create bike way loop(s) on existing roads, e.g. adequate shoulders on connected roads
These are not significant factors
I enjoy walking
Would not use it
Less public control
LESS bus stops
Better decorations on the sides of the bus
Being aware that the service is available and simple to use; is a phone application for my phone
Ranked 4:
It's all about the same
Still nothing
Ability to set my own schedule
All 4 above are fine as is
None of these, service is adequate
Personal time available
These are not significant factors
I enjoy walking
Higher parking fees
None
Would not use it
I just need to make the effort
Empty buses
More frequent long‐distance service (e.g. to Bellefonte)
NONE
Ranked 5 (Least Important):
Nothing
None apply
Nothing
All 4 above are fine as is

Centre Region Comprehensive Plan Survey
Final Survey Report | January 2012 Page 57 of 68
None of these, service is adequate
Increased gas prices
I have all this already
I enjoy walking
Bus to Altoona
Would not use it
Make the transit system sustain itself
Ease of use‐‐maps showing routes
Restart service in my neighborhood
The rest of these are not ordered
Do you really expect us to keep doing this
NONE
Lateness
20. Of the following corridors, which are you most concerned with in terms of safety?
Halfmoon Township
Route 550
They are ok now as is
Route 322 East
Blue Course
Bicycle traffic on Whitehall and Tadpole Roads
Blue Course Drive
Potters Mills Route 322
Fox Hollow – gravel in bike lane
Aaron Drive area
Branch Road
Anywhere there are cops
Route 550 Bike Lane
All poorly lit residential areas
Gerald Street
Speed is bad in Patton Township
Fox Hollow Road and Toftrees Avenue
Business Route 322
Warner Avenue, Oak hill intersection
Anything poorly
Blue Course Drive
Campus alleys
No left arrows on University to South Atherton, Route 45 West
Bicycles holding up traffic
North Oak and Sylvan school crossing
Centre Region Comprehensive Plan Survey
Final Survey Report | January 2012 Page 58 of 68
All equally
Waupelani Drive
Intersection of West College and Route 45
Calder Way
Parkplace
Frat Row
Stormstown
East Branch Road between College Avenue and Atherton Street
Intersection of South Pugh Street and Ellen Avenue – poor visibility
Circleville Road near Park Hills
Speeding in residential neighborhoods
West Aaron Drive
Waddle Road Exit off Route 322 West (I‐99S)
Alley between College and Beaver Avenues
Traffic flow on Meeks Lane
Warner Boulevard
Route 550
The corridor that is used to borrow money (sell bonds) in a vain attempt by government to
provide perfect safety to everyone
Colonnade parking lot
Route 322 at Potters Mills – Too many people have died there; find a way to make the bikers use
all those bike trails we paid for instead of riding in the middle of the roads and creating hazards
Route 322 to and from Boalsburg
Calder Alley (Way) after 11 PM is non‐stop drunk people picking fights with every passerby
College Avenue & Atherton Street
21. What roadway improvements should be made in the Centre Region?
None
none
Increase speed limit on West Whitehall from UniMart to the intersection at Fairbrook and
Tadpole Road
Lower curbs and make them rounder – It's like a wall on the side of the road
In town at all lights add red “stop for pedestrian crossing sequence"
Construct Eastern Inner Loop
Left hand arrows at all intersections
Reduce parking and road options to make driving inconvenient
Create bike way loop(s) on existing roads, e.g. adequate shoulders on connected roads
Snow removal at bus stops; more time to cross North Atherton Street, especially from Clinton
Avenue and Blue Course Drive
I love the rain garden concept – would love to capture some of Gerald Street runoff into my yard

Centre Region Comprehensive Plan Survey
Final Survey Report | January 2012 Page 59 of 68
Nothing
Something to slow down traffic
Fewer traffic lights replaced by roundabout or routine
Bike lanes on roadways
Stop people from running red lights by fining them
Lights on the Blue Course Drive
I'm tired of always seeing improvements made to our roads. I wish better quality roads would
be constructed from the start.
Make bike lanes smoother
Waddle Road
More police presence
More turning arrows at intersection
West Whitehall Road needs a sidewalk from YMCA to South Atherton
Complete the Outer Loop
Take steps to get people out of their cars and into more sustainable modes of transportation
Reduce the number of traffic lights
Restrict bicyclist from using roads without bike lanes – Fox Hill Road for example
The left turn light on Burrows Street and East College should be put back
Make duration of yellow lights longer
Add sidewalks & bike paths AWAY from the roads, not within the roadway
Sidewalks and bike lanes
Study the Waddle Road exit off 322 West
Better DUI checkpoints
Add mirrors to intersections on College Avenue that don't have a traffic light to make turning
onto College Avenue easier
Bike lanes, especially around schools
Repave Easterly Parkway
Bike lane on Route 550
More frequent line painting
Outlaw loud annoying music blaring from cars
The most important project is making Route 322 a 4‐lane highway from State College to Potters
Mills.
Use traffic circles instead of lights to keep the cars moving
Make certain that traffic lights sense smaller vehicles such as motorcycles
Better control of bikes on high traffic rural roads
Absolutely do NOT add more traffic lights – the number of lights in this town is getting out of
control. Also, the new left turn lights that turn to a red light (not allowing you to turn left even if
there are no cars coming the other way) are non‐essential. I haven't found a single person yet
that understands the logic of those lights

Centre Region Comprehensive Plan Survey
Final Survey Report | January 2012 Page 60 of 68
Cut back the spending, especially when it’s “free money” from state or federal grants, because it
isn’t free! Our taxes pay for those too. Opt out of grant programs that come with ‘strings.’
No more bike trails until the bikers stay on the existing ones; no more pedestrian islands when
they just stand further out in the streets anyway; no more stupid traffic circles; no more social
engineering like traffic calming and stupidly designed parking lots
Widen roads to allow bikes – bike lanes are not efficient
Keep bicycles off the streets
Synchronize traffic lights on major corridors
Reduce the number of traffic/signals lights
Making a left turn from Valley Vista onto Circleville is so dangerous without a turning arrow light
Increase speed limits on I‐99 to 65 mph
Less traffic lights
Encourage traffic circles rather than traffic lights
22. What improvements in bicycle or pedestrian facilities should be made in the Centre Region?
None
None
Fine for now – leave it alone
Enforce bicycle traffic infractions
Eliminate use of stop for pedestrians in crosswalk signs in the middle of the roadway
Keep them off the roads
None
Clear bike lanes of gravel
Anything and everything
Offer municipal bike shops and bike maintenance services
Consider moving obstacles blocking North Atherton and Blue Course Drive crossing areas
Drivers turn into Atherton and ignore pedestrians
NONE
We don’t need any of those
Longer stop lights from crossing
Parking facilities
Keep bikes on paths when available and off the street
There's enough already – town is already bike/ped friendly
Enforce cross walk areas – especially downtown
Money to educate all parties: pedestrians, cyclists, and motorists
More covered bike racks
Too many bikes on Whitehall Road
Leave it alone
Good the way it is
Mandate bicycle licenses for biking and traffic skills

Centre Region Comprehensive Plan Survey
Final Survey Report | January 2012 Page 61 of 68
Improve the pedestrian signaling system downtown. Cars are given the green light to turn while
pedestrians are given the walk signal. Both think it's safe to go, neither are prepared to yield.
This is dangerous. The signals should not be concurrent; they should be consecutive, as they are
in large cities
Slow the traffic on Westerly Parkway at the High School
Force bikes on the road to follow ALL traffic laws. Bikes are not cars. If they cannot drive the
speed limit and do not have turn signals they should not be on the road. Also, mid block
crosswalks are stupid. The police should be out watching for people not crossing the street
properly.
Enforce existing laws
Add more off‐street bikeways
Continue rail‐trail through and beyond Toftrees
Bike lane on Route 550
None
Increase pedestrian, cyclist, and motorist education programs
Force bikers to actually use bikeways
Clear markings for crosswalks and for vehicles to stop
Realize that bike lanes are not feasible on all roads
Stop spending money on these boondoggles! They are nice‐looking bells and whistles that
provide little function to the vast majority of residents and taxpayers
Enforce bike safety rules
Enforcement by police when bikes ride the wrong way on the road, run stop signs and red lights
(right in front of police cars), ride 4 or 5 abreast on Oak Hall Road or Route 550
Widen the roads and enforce the laws
More ticketing of bicycle violations – an example would be running red lights
Leave it alone and focus on the road and bridge repairs! Bike lanes next to bike paths in the
borough especially, are nonsense
User fee for bicycles/license
Cameras on historically bad intersections and citations for pedestrians who walk in front of cars
Enforce pedestrian right of way in crosswalks
Enforce NO bike riding on sidewalks or riding wrong way on roads
23. What improvements should be made to enhance transportation access to the Centre Region?
None
Bus service to airport
Local bus routes from townships to town
Air service to Harrisburg and/or Baltimore
May have too much – run through traffic on I‐99 is very disruptive to nature
More bus service to major airports: Philadelphia, Pittsburgh, and Harrisburg
None – save tax payers money

Centre Region Comprehensive Plan Survey
Final Survey Report | January 2012 Page 62 of 68
Promote better railway travel; secure alarms
Air service to Pittsburgh or anywhere except Philly
None – we have enough people
Any rail service would be a great benefit
None
Regional rail service: Bellefonte‐Altoona‐State College‐Harrisburg‐Williamsport
Enforce existing laws
Routes 80 and 322 connection – this needs a super creative solution to avoid screwing up the
landscape
Replace 2 lanes with 4 lanes from Seven Mountains to Route 322 Bypass
Bus or rail to Altoona
None needed
Normal rail service on the scale of say, Budapest would be a good start
Connect Route 322 at Potters Mills with I‐80 but not through State College – go over Centre Hall
Mountain
Bikeshare
Route 322 extension (4 lane) to Route 80 from Potters Mill
None
Nothing
The Centre Region is very accessible and government doesn’t have the money to spend on
things like this.
No more bus routes, no more terminals, no more applying for grant money for this stuff – we
are deep in debt as a country and shouldn't be spending a single dime on stuff like this
None, too costly
More direct route to airport from I‐99
Megabus has helped area tremendously
More daily Amtrak trains at lower fares, and cheap easy access to Lewistown station
No more road improvements are needed
There needs to be a roadway to bypass the village of Pine Grove Mills for those travelers
heading south on Route 26
25. Please place the following natural and environmental issues in priority order.
Ranked 1 (Most Important):
An environment in which individuals are free, and don't have government coming after their
property, or coming after them for building a deck, putting in a lawn shed, and aren't taxing
them endlessly because they foolishly made an improvement to their home – no more
government trying to control trees, drainage ditches, or springtime puddles.
Using actual cost analysis before stupid spending for non return eco projects
Breathing the air of Freedom; preserving our natural rights to choose our own path; protecting
our right to choose what to do on our private property; moving away from the flaky

Centre Region Comprehensive Plan Survey
Final Survey Report | January 2012 Page 63 of 68
interpretation of the PA State Constitution (right to clean air and water) that has been twisted
and perverted into a reason for government and certain non‐governmental organizations to
seize control of what rightly belongs to individuals – control of our lives!
Hard to choose when all are equally important
Developers not destroying roadways and homes with unreasonable lot preparation. An example
is the buildup on North Atherton Street creating excessive runoff and hence flooding with
officials looking the other way
Increased energy efficiency in all buildings and vehicles region‐wide
More Dog Parks
Noise (truck) pollution
Protect Spring Creek Canyon
Protecting our area from Gas Drilling
Reduction of Noise from area highways like I‐99, I‐80, and Route 322
Renewal energy does not save the dollars
Ranked 2:
Protecting the natural yearning to be free, unfettering individuals and businesses with the
freedom to produce
No opinion
Please quit the environmental projects that have NO real return, other than only spending
Allowing the natural ebb and flow of nature to choose their own path, instead of trying to force
nature into the vision some planner or biologist has for it. A changing environment is normal,
not a sign that a human has interfered.
Don't you dare allow fracking here
Ranked 3:
Fostering an environment of entrepreneurship and creativity rather than burdening those who
want to produce with so much regulation that they give up and decide not to participate in the
business community
No opinion
Increased use of renewable energy in ALL buildings
Quit pushing eco policies with little real impact
Expand recycling for more items; eliminate curbside collection and move to drop off centers
Organic urban agriculture infrastructure
Renewable energy that is not natural gas
Ranked 4:
Reducing the environment of excessive intrusion by non‐governmental organizations who are
sucking up our tax dollars to take away our freedom
Increased energy efficiency of ALL buildings
Poor usage of township vehicles

Centre Region Comprehensive Plan Survey
Final Survey Report | January 2012 Page 64 of 68
PRIVACY
Worry that bad decisions will raise taxes badly
Ranked 5:
Freedom to protect my own environment in the best way I know how rather than relying on the
'professional opinion' of someone who doesn't even know that brown trout aren't native, and
that trees grow back pretty fast if you just don't mow
no opinion
truth in regard to environmental issues, not lies
26. Spring Creek is classified as a high quality cold water fishery and is nationally recognized for its
wild brown trout population. It is the most significant waterway that runs through the Centre
Region due to its limestone spring‐fed tributaries and is an important natural resource. In the
past 12 months have you used Spring Creek for any of the following?
Family reunion, Spring Creek Park
Love watching it
Psychological support (ecological mindfulness group meetings)
Walking along the creek
Hiking and mushroom hunting along the creek and biking
Educational field trips
Running, hiking, walking
Park
Friends live nearby
Feeding ducks
Hiking Fisherman’s Paradise Trail
Own property on spring creek
Birding, walking
Picnics
Playing in the shallow water
Social gathering
I participated in the Annual Watershed Clean Up Day and cleaned headwaters of Spring Creek
Swimming
Wading
Viewing. Hard to believe someone managed to classify it as high quality cold water fishery even
as it's posted that the waters are too polluted to eat the fish. I'm sure my tax dollars paid for
both opinions. It's probably all about some social engineering goal anyway. No more programs,
no more restrictions, no more hiding the creek from site with buffers, no more forcing people to
provide access from their private property.
Swimming

Centre Region Comprehensive Plan Survey
Final Survey Report | January 2012 Page 65 of 68
29. Should municipalities offer any of the following incentives to keep existing business or attract new
business?
Reduce code enforcement. Powers CRCE cost business 10's of millions of unneeded expenses.
None
Municipal subsidies for downtown real estate when used by local proprietors for low‐
carbon/low‐consumption/local food business
Reasonable rents
Incentives given for businesses to use existing structures (Hills, Circuit city, etc.) before new
building permits are issued
Reduce taxes for all
Zoning is out of control; taxes are out of control
Perhaps promote area through ads
Incentives to repurpose existing but vacant and underutilized commercial areas
Ranking these should vary with the proposed project
Depend on a case by case basis
No need to attract new businesses – if existing aren't content they should move on
Must be responsible and cost‐effective
Assistance to new business; help with staffing/employment; financial aid for employee benefits
like health care costs
Tax incentives to reduce fees while maintaining high development standards
Abandon Codes
Incentives for business facade remodeling
Regulations are destroying our economy; taxes on businesses are too high to feasibly compete
at any international level.
Not sure how we compare to other areas
Increased awareness of services available for aiding new and existing small businesses
More creative approaches related to improving workforce satisfaction with community
Suggest new businesses; recycle old vacant buildings instead of demolishing & building a new
Graduated tax abatement based on impact minimization. Businesses willing to re‐use existing
space, and do it with low impact/renewable, etc., should be encouraged, whereas building yet
another strip mall/big box/office park should be strongly discouraged.
Public‐private partnerships that encourage sustainable businesses including revolving loan funds
Free desert
Attraction for facilities already in place, rather than building new
I'm not sure
Municipalities and COG should reduce the regulatory burden, reduce the requirements for
parking, landscaping, facility size (things that businesses are best suited to determine), and end
the practice of deciding what businesses are acceptable – let the market decide. Bad business
choices should result in failure of the business, not in a negotiating session with planners.

Centre Region Comprehensive Plan Survey
Final Survey Report | January 2012 Page 66 of 68
Tax dollars should not be used to encourage OR discourage businesses from locating here;
businesses should do their own research, fund their own costs, and pay their own taxes
Eliminate code enforcement, zoning, and regulations – these kill the economy
The main incentive should be what the area as a whole can provide without the need for
taxpayer subsidized (i.e. KOZ type) incentives.
Funding comprehensive Wi‐Fi coverage of the Centre Region
Communicate the benefits of our highly educated community
30. How important is it to offer the following economic development strategies in the Centre Region?
Ranked 1 (Most Important):
Utilize existing vacant commercial space for business
Nightlife activities for non‐student adults
Create a vision of a better quality of life in the community that integrates ALL of the above
Improve the quality of life to attract/retain knowledgeable workers (see recent Knight
Foundation report)
Government should not be in the business of picking winners and losers, not the elected officials
and not the paid staff
Local government strategy should be limited to keeping the peace and maintaining the roads
More Dog Parks
Ranked 2:
Attract better doctors and health professionals
Support neighborhood‐scale renewable energy infrastructure
Inform citizens as to the insolvent and detrimental problem of healthcare and social security;
most young people that will be affected by it don't know anything about it. The majority of
people fighting to keep it are seniors, not the generation that will suffer.
Reduce the tax burden – stop spending money on programs like those listed above.
After maintaining the peace and the roads, let individual groups get together and provide
special things they want like forests to play in, Frisbee golf, etc. If there are enough people who
want those things, they'll be able to raise the money privately without taxing all of us for it.
Ranked 3:
Auto racing facilities
Support proprietors of skilled crafts‐based businesses
All 6 above are unimportant
Again, keep an eye open for economic development that makes sense in an increasingly energy
and natural resource constrained marketplace; more small trades/crafts/goods on small scales
No more grants or special treatment for any of the listed items, as most of them turn out to be
scams benefitting some individual or group rather than all of us anyway

Centre Region Comprehensive Plan Survey
Final Survey Report | January 2012 Page 67 of 68
Ranked 4:
All 6 above are unimportant
Promote the widening of Rte. 322 E from Boalsburg to Seven Mountains
Ranked 5 (Least Important):
Financial support to community‐supported organizations like Interfaith mission, United Way,
and legal services
All 6 above are unimportant
Less football, more science. Football is seasonal money.
Provide educational/training to develop workforce
Think about NOT choking businesses to death
36. Which category best describes your occupation?
Researcher
Communication
EMS
Retired
Government
Operations
Weis Store
Research Assistant/Student
Post. Researcher
Veterinary Medical
Farmer
Technology
Industry Consultant
Financial Planner
Medical
Graduate Student
Graduate Student
Clergy
Paraprofessional
Graduate Student
Doctoral Student
Graduate Student
Research Assistant
Child Caregiver
Research Assistant
Retail Supervisor
Accounting

Centre Region Comprehensive Plan Survey
Final Survey Report | January 2012 Page 68 of 68
Financial Services
Musician
Graphic Design/Staff Assistant
Freelance Writer
Contractor
Miscellaneous Comments
Question 2 – But not Penn State students. Already too many students ruining downtown
shopping and parking.
Disapprove of many of the townhome regulations – No way to enforce the rules.
Please take a look at Ashville, NC – they're doing some things right there. Seems like the Centre
Region could do similar things. Thanks.
Question 23 – It's insane that there is no train service in State College. It should be a major stop.
Question 29 – It’s case by case. The first three can be effective or inefficient.
State College is looking run down and poor. With so many trees taken out, it is stark, hot, and
barren and it lacks character – just bars and cheap shops with no charm or warmth.
Thank you for the opportunity for input
There is a problem I see that should be addressed: Businesses should maintain their frontage;
shrubbery, parking areas (weeds). Martin Street area is guilty.
These are hard questions and it takes a lot longer than 20 minutes
This survey was very non‐specific and needlessly confusing. It was also irrelevant and at some
points the questions felt leading. The real survey question would be “How do I feel the CRPA is
connecting with my needs?" and just leave it blank. Seriously.

Centre Region Comprehensive Plan Survey
Appendix A – Random Sample Survey Centre Regional Planning Agency | January 2012
APPENDIX A
RANDOM SAMPLE SURVEY QUESTIONNAIRE AND RESULTS
BACKGROUND
The CRPA sent the random sample survey to 2,000 randomly selected addresses in the six municipalities
in the Centre Region in the summer of 2011. The results of the random sample survey are the basis for
the analysis in this report and the opinions that form some of the policies in the Comprehensive Plan.
The purpose of the random sample survey results are:
To collect resident attitudes and opinions
To obtain statistically valid results
To understand key issues and topics
To be cost effective method to obtain feedback
READING THE RESULTS
The results for all responses are included in the column labeled “Random Sample”. This column is
the sum of all municipal results and is the data used in the analysis for this report. Results for individual
municipalities are included in the columns to the right of the “Random Sample” column.
Statistically Significant Response Rates: The consultant performed cross tabulations by
municipality to determine if there was a statistically significant difference in response rates
by municipality for individual questions. For example, for question 1 on page 3, the response
“Improving personal security and public safety” was statistically higher in College, Ferguson,
Harris and Patton Townships than it was in Halfmoon Township. The response in State College
Borough was statistically higher than the response rate in Halfmoon and Ferguson Townships.
The “upper case letters” below the response rate refer to the individual municipalities and
are associated with the response immediately above the “upper case letters.” All results
indicate significant at the 95% level, meaning if the same question were asked of all members
of the municipality, 95% would answer the same. See the example on page 3.
Questions that require a variety of choices be ranked (most important, second most important,
third most important, etc.): There are a number of questions in the survey that require a
respondent to rank a variety of choices, most important, second most important, third most
important, etc. Question 25 on page 50 is an example of this type of question. These questions
may be reported two ways. The first way of reporting the question indicates the percentage
of respondents selecting the choices as most important, second most important, third most
important, etc. When the columns are totaled vertically, they will add to 100%. For example,
on question 25 on page 50, 7% of respondents ranked “air quality” as the most important issue,
while 3.4% ranked “refuse management and recycling programs” as the most important issue.

Centre Region Comprehensive Plan Survey
Appendix A – Random Sample Survey Centre Regional Planning Agency | January 2012
Another way of reporting these questions is to sum the percentage of respondents ranking an issue in
the top five. For example, 92% of all respondents rank “protect drinking water quality” in the top five
environmental issues from all potential choices. This reporting is completed by summing the percentage
of respondents who ranked the issue as most important (41.1%), plus second most important (19.6%),
plus third most important (15.0%), plus fourth most important (8.8%), plus fifth most important (7.2%),
the sum of which equals 92%.

Envision Centre Region A community survey for the Centre Region Comprehensive Plan
Centre Regional Planning Agency | July 2011 Page 1 of 10
We would like to know what your opinion is regarding each item presented below. Please read each item and decide how you feel about it. The survey is fairly comprehensive, covering many topics related to life in the Centre Region, particularly those which relate to the comprehensive planning process. These include:
Land use and development Transportation Housing The environment The economy Communication between residents and government
This survey will take approximately 20 minutes to complete. It is being conducted for residents living in the Centre Region, which includes College, Ferguson, Halfmoon, Harris and Patton Townships and the Borough of State College. The boundary of the Centre Region is also the same as the State College Area School District (SCASD). Attitudes about Land Use and Development in the Centre Region 1. The following is a list of objectives which could be used to guide future growth and development in the Centre Region.
Please read the list of ten items and decide which are most important and least important to you. Place the letter M next to the three objectives that are most important to you. Place the letter L next to the three objectives that are least important to you.
Maintaining a low level of environmental pollution
Having access to open space (parks, green belts, wooded land) near residential areas
Expanding the variety and availability of retail goods and services
Improving personal security and public safety
Attracting business
Maintaining and enhancing the visual appearance of buildings and landscaping
Increasing education opportunities for all age groups
Protecting neighborhoods from encroachment by non‐residential land uses
Building and maintaining livable neighborhoods
Encouraging a sustainable region
Other (Please specify) ______________________________________________
2. The current population of the Centre Region is approximately 92,000 persons. During the next 30 years what
rate of population growth would you prefer for the Centre Region? Please check the population number which corresponds to your preference. (Check only one.)
High rate of population growth (An additional 32,000 residents)
Moderate rate of population growth (An additional 18,000 residents)
Low rate of population growth (An additional 6,000 residents)
No increase in population
It doesn’t matter to me.

Envision Centre Region A community survey for the Centre Region Comprehensive Plan
Centre Regional Planning Agency | July 2011 Page 2 of 10
3. Nine broad goals have been used to guide regional growth and development in the Centre Region since 2000. Please fill in the circle that best corresponds to your current opinion regarding each of the goals.
REVALIDATION OF 2000 CENTRE REGION COMPREHENSIVE PLAN GOALS
Comprehensive Plan Goal
Is the goal…?
Still Relevant
No Longer Relevant
Don’t Know/ Not Sure
Balance community growth while protecting and enhancing the Centre Region's environmental, historic, and cultural resources.
Direct the majority of future growth to areas within the Regional Growth Boundary so that new development can be efficiently served by public utilities, services, and transit.
Preserve and enhance the low‐density community character in the rural areas located outside of the Regional Growth Boundary.
Preserve prime farmland for agricultural use.
Coordinate land development activity with the transportation system for the safe, efficient, and convenient movement of people and goods.
Coordinate land development activity with necessary public facilities and services in a cost‐effective manner.
Obtain additional parkland and open‐space areas, and provide a broad range of recreational opportunities.
Provide a variety of housing opportunities to satisfy the needs of all existing and future residents of the Centre Region.
Maintain a cooperative relationship between the Centre Region municipalities and Penn State University to ensure that future growth at the University benefits the community.
4. To what extent do you agree or disagree with the following statements?
Strongly Agree
Agree Uncertain/ Undecided
Disagree Strongly Disagree
The Centre Region should have an overall plan that directs future growth and development to appropriate locations.
I would like municipal officials to have a stronger role in controlling new development in the area.
Individuals and developers should be free to develop land without a lot of controls and restrictions by municipalities.
The economic needs of the area should be the driving force that determines what type of development takes place in the Centre Region.
Municipalities should use local tax resources to protect historic landmarks and buildings.
Municipalities should protect historic landmarks and buildings through regulations and law.
Municipalities should use local tax resources to preserve natural resources (air, water, soil, forests, etc.).
Municipalities should use regulations, such as zoning or private conservation easements, to preserve natural resources (air, water, soil, forests, etc.).
Municipalities should use local tax resources to preserve farming.
Municipalities should use regulations, such as zoning or private conservation easements, to preserve farming.
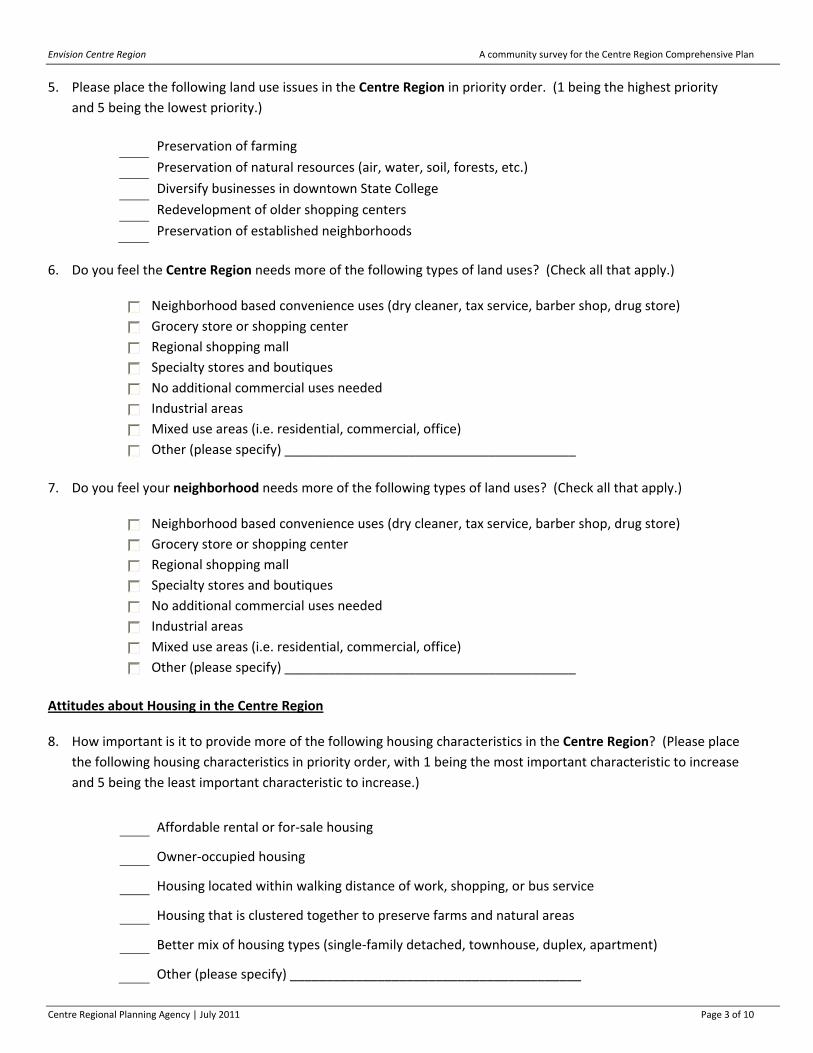
Envision Centre Region A community survey for the Centre Region Comprehensive Plan
Centre Regional Planning Agency | July 2011 Page 3 of 10
5. Please place the following land use issues in the Centre Region in priority order. (1 being the highest priority
and 5 being the lowest priority.)
Preservation of farming
Preservation of natural resources (air, water, soil, forests, etc.)
Diversify businesses in downtown State College
Redevelopment of older shopping centers
Preservation of established neighborhoods
6. Do you feel the Centre Region needs more of the following types of land uses? (Check all that apply.)
Neighborhood based convenience uses (dry cleaner, tax service, barber shop, drug store)
Grocery store or shopping center
Regional shopping mall
Specialty stores and boutiques
No additional commercial uses needed
Industrial areas
Mixed use areas (i.e. residential, commercial, office)
Other (please specify) ________________________________________
7. Do you feel your neighborhood needs more of the following types of land uses? (Check all that apply.)
Neighborhood based convenience uses (dry cleaner, tax service, barber shop, drug store)
Grocery store or shopping center
Regional shopping mall
Specialty stores and boutiques
No additional commercial uses needed
Industrial areas
Mixed use areas (i.e. residential, commercial, office)
Other (please specify) ________________________________________
Attitudes about Housing in the Centre Region 8. How important is it to provide more of the following housing characteristics in the Centre Region? (Please place
the following housing characteristics in priority order, with 1 being the most important characteristic to increase
and 5 being the least important characteristic to increase.)
Affordable rental or for‐sale housing
Owner‐occupied housing
Housing located within walking distance of work, shopping, or bus service
Housing that is clustered together to preserve farms and natural areas
Better mix of housing types (single‐family detached, townhouse, duplex, apartment)
Other (please specify) ________________________________________
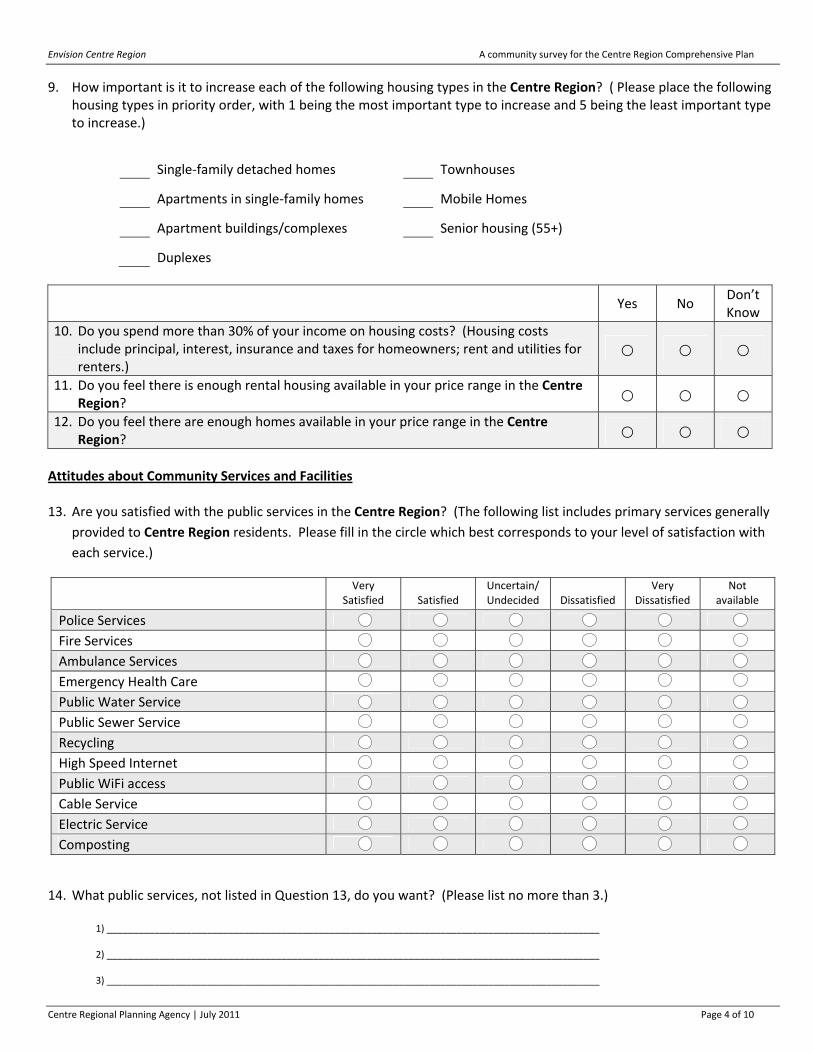
Envision Centre Region A community survey for the Centre Region Comprehensive Plan
Centre Regional Planning Agency | July 2011 Page 4 of 10
9. How important is it to increase each of the following housing types in the Centre Region? ( Please place the following housing types in priority order, with 1 being the most important type to increase and 5 being the least important type to increase.)
Single‐family detached homes Townhouses
Apartments in single‐family homes Mobile Homes
Apartment buildings/complexes Senior housing (55+)
Duplexes
Yes No
Don’t Know
10. Do you spend more than 30% of your income on housing costs? (Housing costs include principal, interest, insurance and taxes for homeowners; rent and utilities for renters.)
⃝ ⃝ ⃝
11. Do you feel there is enough rental housing available in your price range in the Centre Region?
⃝ ⃝ ⃝
12. Do you feel there are enough homes available in your price range in the Centre Region?
⃝ ⃝ ⃝
Attitudes about Community Services and Facilities 13. Are you satisfied with the public services in the Centre Region? (The following list includes primary services generally
provided to Centre Region residents. Please fill in the circle which best corresponds to your level of satisfaction with
each service.)
Very
Satisfied
Satisfied Uncertain/ Undecided
Dissatisfied
Very Dissatisfied
Not available
Police Services
Fire Services
Ambulance Services
Emergency Health Care
Public Water Service
Public Sewer Service
Recycling
High Speed Internet
Public WiFi access
Cable Service
Electric Service
Composting
14. What public services, not listed in Question 13, do you want? (Please list no more than 3.) 1) _____________________________________________________________________________________________ 2) _____________________________________________________________________________________________ 3) _____________________________________________________________________________________________
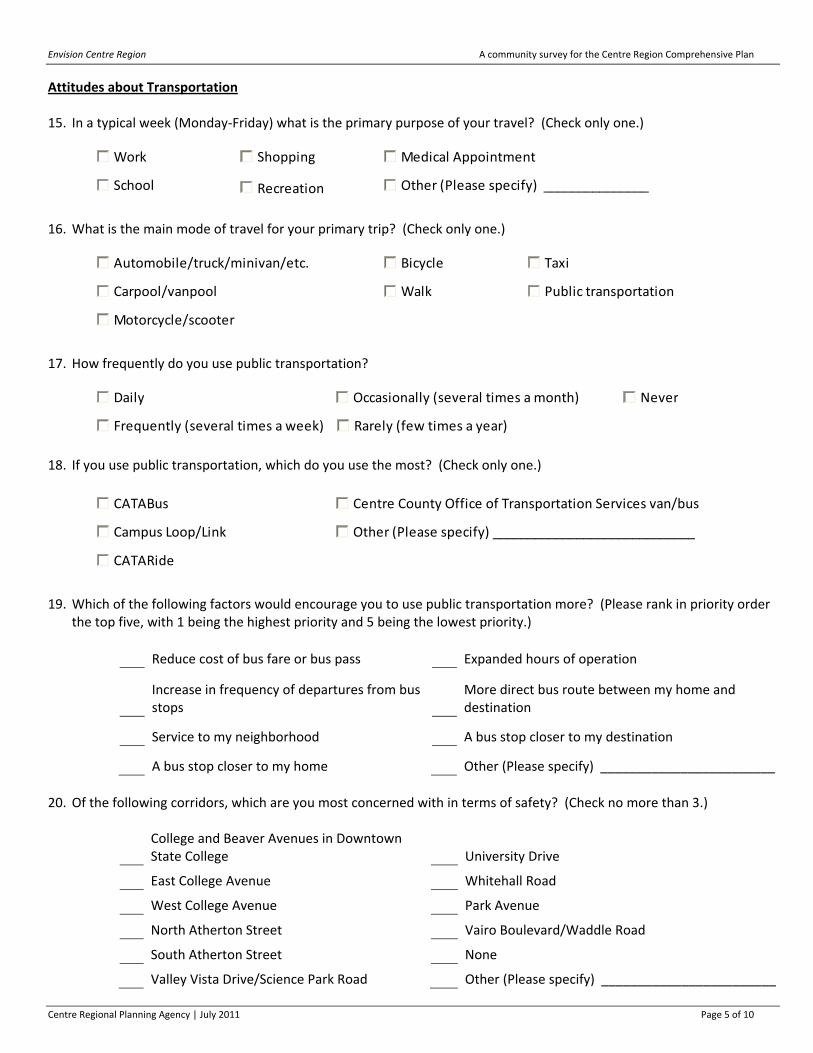
Envision Centre Region A community survey for the Centre Region Comprehensive Plan
Centre Regional Planning Agency | July 2011 Page 5 of 10
Attitudes about Transportation 15. In a typical week (Monday‐Friday) what is the primary purpose of your travel? (Check only one.)
Work Shopping
Medical Appointment
School Recreation
Other (Please specify) _______________
16. What is the main mode of travel for your primary trip? (Check only one.)
Automobile/truck/minivan/etc.
Bicycle Taxi
Carpool/vanpool
Walk Public transportation
Motorcycle/scooter
17. How frequently do you use public transportation?
Daily
Occasionally (several times a month)
Never
Frequently (several times a week) Rarely (few times a year)
18. If you use public transportation, which do you use the most? (Check only one.)
CATABus
Centre County Office of Transportation Services van/bus
Campus Loop/Link
Other (Please specify) _____________________________
CATARide
19. Which of the following factors would encourage you to use public transportation more? (Please rank in priority order
the top five, with 1 being the highest priority and 5 being the lowest priority.)
Reduce cost of bus fare or bus pass Expanded hours of operation
Increase in frequency of departures from bus stops
More direct bus route between my home and destination
Service to my neighborhood A bus stop closer to my destination
A bus stop closer to my home Other (Please specify) ________________________
20. Of the following corridors, which are you most concerned with in terms of safety? (Check no more than 3.)
College and Beaver Avenues in Downtown State College
University Drive
East College Avenue Whitehall Road
West College Avenue Park Avenue
North Atherton Street Vairo Boulevard/Waddle Road
South Atherton Street None
Valley Vista Drive/Science Park Road Other (Please specify) ________________________
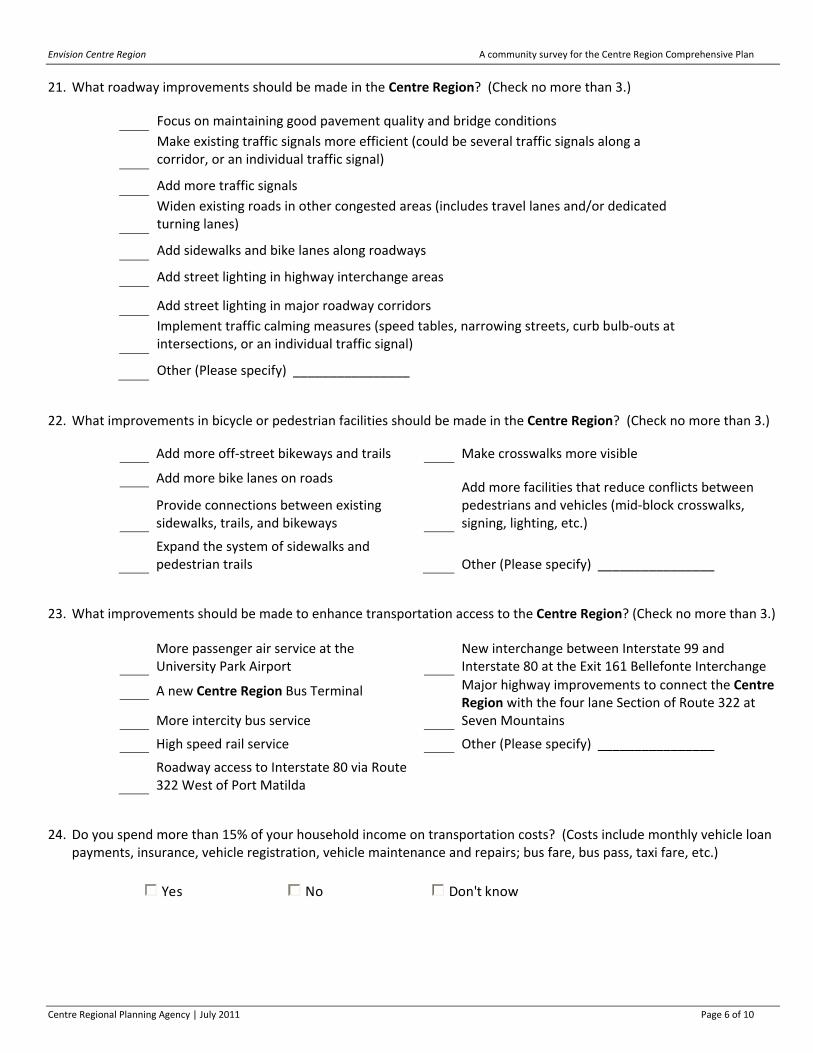
Envision Centre Region A community survey for the Centre Region Comprehensive Plan
Centre Regional Planning Agency | July 2011 Page 6 of 10
21. What roadway improvements should be made in the Centre Region? (Check no more than 3.)
Focus on maintaining good pavement quality and bridge conditions
Make existing traffic signals more efficient (could be several traffic signals along a corridor, or an individual traffic signal)
Add more traffic signals
Widen existing roads in other congested areas (includes travel lanes and/or dedicated turning lanes)
Add sidewalks and bike lanes along roadways
Add street lighting in highway interchange areas
Add street lighting in major roadway corridors
Implement traffic calming measures (speed tables, narrowing streets, curb bulb‐outs at intersections, or an individual traffic signal)
Other (Please specify) ________________
22. What improvements in bicycle or pedestrian facilities should be made in the Centre Region? (Check no more than 3.)
Add more off‐street bikeways and trails Make crosswalks more visible
Add more bike lanes on roads
Add more facilities that reduce conflicts between pedestrians and vehicles (mid‐block crosswalks, signing, lighting, etc.)
Provide connections between existing sidewalks, trails, and bikeways
Expand the system of sidewalks and pedestrian trails Other (Please specify) ________________
23. What improvements should be made to enhance transportation access to the Centre Region? (Check no more than 3.)
More passenger air service at the University Park Airport
New interchange between Interstate 99 and Interstate 80 at the Exit 161 Bellefonte Interchange
A new Centre Region Bus Terminal
Major highway improvements to connect the Centre Region with the four lane Section of Route 322 at Seven Mountains More intercity bus service
High speed rail service Other (Please specify) ________________
Roadway access to Interstate 80 via Route 322 West of Port Matilda
24. Do you spend more than 15% of your household income on transportation costs? (Costs include monthly vehicle loan payments, insurance, vehicle registration, vehicle maintenance and repairs; bus fare, bus pass, taxi fare, etc.)
Yes No Don't know
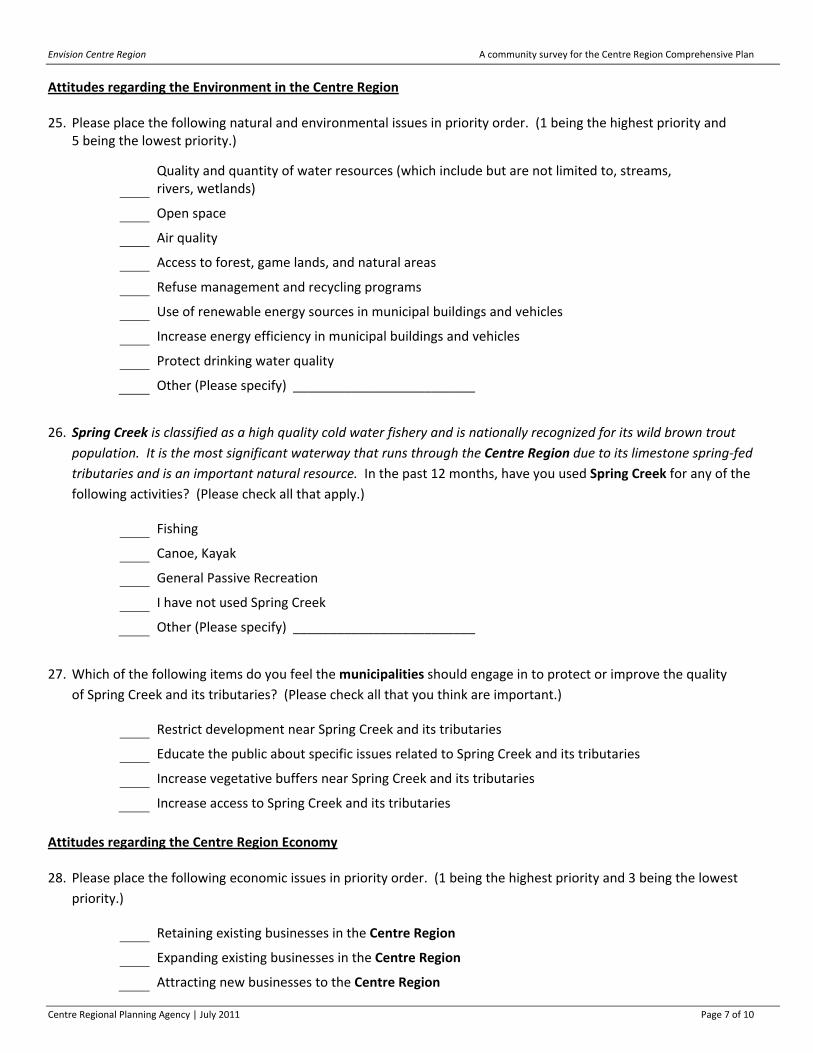
Envision Centre Region A community survey for the Centre Region Comprehensive Plan
Centre Regional Planning Agency | July 2011 Page 7 of 10
Attitudes regarding the Environment in the Centre Region 25. Please place the following natural and environmental issues in priority order. (1 being the highest priority and
5 being the lowest priority.)
Quality and quantity of water resources (which include but are not limited to, streams, rivers, wetlands)
Open space
Air quality
Access to forest, game lands, and natural areas
Refuse management and recycling programs
Use of renewable energy sources in municipal buildings and vehicles
Increase energy efficiency in municipal buildings and vehicles
Protect drinking water quality
Other (Please specify) _________________________
26. Spring Creek is classified as a high quality cold water fishery and is nationally recognized for its wild brown trout
population. It is the most significant waterway that runs through the Centre Region due to its limestone spring‐fed
tributaries and is an important natural resource. In the past 12 months, have you used Spring Creek for any of the
following activities? (Please check all that apply.)
Fishing
Canoe, Kayak
General Passive Recreation
I have not used Spring Creek
Other (Please specify) _________________________
27. Which of the following items do you feel the municipalities should engage in to protect or improve the quality
of Spring Creek and its tributaries? (Please check all that you think are important.)
Restrict development near Spring Creek and its tributaries
Educate the public about specific issues related to Spring Creek and its tributaries
Increase vegetative buffers near Spring Creek and its tributaries
Increase access to Spring Creek and its tributaries
Attitudes regarding the Centre Region Economy 28. Please place the following economic issues in priority order. (1 being the highest priority and 3 being the lowest
priority.)
Retaining existing businesses in the Centre Region
Expanding existing businesses in the Centre Region
Attracting new businesses to the Centre Region

Envision Centre Region A community survey for the Centre Region Comprehensive Plan
Centre Regional Planning Agency | July 2011 Page 8 of 10
29. Should municipalities offer any of the following incentives to keep existing businesses or attract new businesses? (Check all that you feel should be used.)
Tax abatements or reductions
Reducing development review and permitting fees
Funding construction of infrastructure such as streets, water or sewer lines
Incentives should not be offered
Other (Please specify) _________________
30. How important is it to offer the following economic development strategies in the Centre Region? ( Please rank
the following strategies, with 1 being the highest priority and 5 being the lowest priority. If you believe economic development strategies are not needed check the first item.)
No specific economic development strategies are needed
Support natural and cultural resource‐based tourism (hiking, biking, birding, arts)
Support recreational‐based activities and tourism (sports)
Support local food, direct‐farm marketing, “Buy Fresh Buy Local”
Attract more high‐tech jobs
Attract more manufacturing jobs
Attract more research office opportunities
Continue to ensure infrastructure is built and maintained to serve existing businesses
Attract more retail and service jobs
Other (Please specify) _____________
Attitudes about Local Government and Resident Communication 31. Choose the 3 ways you would prefer to receive information regarding community meetings, community issues,
or community events. (Please check only 3.)
View municipal web page
View Centre Region web page
Inserts in utility bills, refuse bills or US Mail
Read it in the Centre Daily Times
Read it in The Daily Collegian
Social media (Facebook, Twitter, blogs)
Township Newsletter
Envision Centre Region A community survey for the Centre Region Comprehensive Plan
Centre Regional Planning Agency | July 2011 Page 9 of 10
Demographic Information 32. Please check the municipality where you currently live.
College Township
Ferguson Township
Halfmoon Township
Harris Township
Patton Township
Borough of State College
33. Please check the total number of years you have lived in any of the six municipalities in the previous question.
1 year or less
6 to 10 years
16 to 20 years
2 to 5 years
11 to 15 years
Over 20 years
34. Are you employed? (If No, skip to question 37.)
Yes No 35. If you are employed, please check the municipality in which your job is located.
Bellefonte Borough Halfmoon Township State College Borough
Benner Township Harris Township Another municipality in Centre County
College Township Patton Township Another municipality outside Centre County
Ferguson Township Spring Township
36. Which category best describes your occupation?
Educator Manager or business owner
Skilled worker
Professional Salesperson
Other (Please specify) _______________
Clerical worker Service worker
37. Is anyone in your household a full‐time or part‐time student at Penn State University’s – University Park Campus?
Yes No
38. Please check the box that most closely describes the type of housing unit you live in. (Please check only 1.)
A detached single family home
A duplex
An apartment in an apartment complex
Townhouse
An apartment in a single family home
A mobile home
Group quarters (dorm, sorority/ fraternity house, nursing home)
Other

Envision Centre Region A community survey for the Centre Region Comprehensive Plan
Centre Regional Planning Agency | July 2011 Page 10 of 10
39. Do you rent or own your residence?
Rent
Own
40. About how much was the gross income for your household in 2010? (Include all persons in the household
for which a tax return was filed.)
Less than $10,000
$35,000 to $49,999
$150,000 to $199,999
$10,000 to $14,999
$50,000 to $74,999
$200,000 or more
$15,000 to $24,999
$75,000 to $99,999
$25,000 to $34,999
$100,000 to $149,999
41. My age group is
18 ‐ 24
35 ‐ 44
60 ‐ 64
25 ‐ 34
45 ‐ 59
65 +
42. What is the highest level of education you have completed?
0‐11 years, no diploma
Associate Degree
Master's Degree
High school graduate
Bachelor's Degree
Doctorate Degree
Some college, no degree
43. What is your gender?
Male
Female

2011 Centre Region Community Survey Results - Random Sample
Random sample weighted by relative municipality population
Random
Sample Random
Sample Random
Sample Random
Sample Random
Sample Random
Sample Random
Sample College
Township Ferguson Township
Halfmoon Township
Harris Township
Patton Township
Boro State College
(B) (Q) (R) (S) (T) (U) (V)
TOTAL ANSWERING 461 78 128 23 42 85 100Mail 63.3% 67.9% 63.3% 56.5% 64.3% 52.9% 71.0%
A U G JUWeb Sample 36.7% 32.1% 36.7% 43.5% 35.7% 47.1% 29.0%
A G QVWeb Drop-in - - - - - - -
Comparison Groups: ABCD/EFGHIJ/KLMNOP/QRSTUV/WXYZA2B2/EKQW/FLRX/GMSY/HNTZ/IOUA2/JPVB2Independent T-Test for Means (equal variances), Independent Z-Test for PercentagesUpper case letters indicate significance at the 95% level.
ModeRandom sample weighted by relative municipality population
Random
Sample Random
Sample Random
Sample Random
Sample Random
Sample Random
Sample Random
Sample College
Township Ferguson Township
Halfmoon Township
Harris Township
Patton Township
Boro State College
(B) (Q) (R) (S) (T) (U) (V)
TOTAL ANSWERING 461 78 128 23 42 85 100Random Sample 100.0% 100.0% 100.0% 100.0% 100.0% 100.0% 100.0%
A E F G H I JDrop-Ins - - - - - - -
Comparison Groups: ABCD/EFGHIJ/KLMNOP/QRSTUV/WXYZA2B2/EKQW/FLRX/GMSY/HNTZ/IOUA2/JPVB2Independent T-Test for Means (equal variances), Independent Z-Test for PercentagesUpper case letters indicate significance at the 95% level.
Page 1

2011 Centre Region Community Survey Results - Random Sample
Attitudes about Land Use and Development in the Centre Region
Random sample weighted by relative municipality population
Random
Sample Random
Sample Random
Sample Random
Sample Random
Sample Random
Sample Random
Sample College
Township Ferguson Township
Halfmoon Township
Harris Township
Patton Township
Boro State College
(B) (Q) (R) (S) (T) (U) (V)
TOTAL ANSWERING 448 74 125 22 41 83 99Having access to open space (parks, green belts, wooded land) near residential areas
55.6% 45.9% 55.2% 45.5% 58.5% 67.5% 54.5%
QMaintaining a low level of environmental pollution 51.1% 54.1% 49.6% 63.6% 51.2% 48.2% 50.5%Encouraging a sustainable region 37.3% 40.5% 33.6% 36.4% 24.4% 39.8% 41.4%
TProtecting neighborhoods from encroachment by non-residential land uses
30.6% 33.8% 35.2% 27.3% 34.1% 20.5% 31.3%
UBuilding and maintaining livable neighborhoods 23.2% 23.0% 20.8% 22.7% 29.3% 25.3% 23.2%
Attracting business 23.2% 28.4% 28.8% 22.7% 22.0% 19.3% 16.2%V
Improving personal security and public safety 23.9% 20.3% 26.4% 22.7% 24.4% 24.1% 23.2%B2
Expanding the variety and availability of retail goods and services
17.9% 16.2% 21.6% 22.7% 14.6% 15.7% 15.2%
Maintaining and enhancing the visual appearance of buildings and landscaping
17.4% 20.3% 14.4% 9.1% 19.5% 21.7% 17.2%
Increasing education opportunities for all age groups 15.4% 14.9% 12.8% 27.3% 17.1% 16.9% 14.1%
Other 4.0% 2.7% 3.2% - 4.9% 1.2% 9.1%U
Comparison Groups: ABCD/EFGHIJ/KLMNOP/QRSTUV/WXYZA2B2/EKQW/FLRX/GMSY/HNTZ/IOUA2/JPVB2Independent T-Test for Means (equal variances), Independent Z-Test for PercentagesUpper case letters indicate significance at the 95% level.
1. MOST IMPORTANT OBJECTIVES which could be used to guide future growth and development in the Centre Region. (Percent selected in top three most important)
Page 2

2011 Centre Region Community Survey Results - Random Sample
Random sample weighted by relative municipality population
Random
Sample Random
Sample Random
Sample Random
Sample Random
Sample Random
Sample Random
Sample College
Township Ferguson Township
Halfmoon Township
Harris Township
Patton Township
Boro State College
(B) (Q) (R) (S) (T) (U) (V)
TOTAL ANSWERING 427 68 117 22 40 79 97Expanding the variety and availability of retail goods and services
62.1% 60.3% 63.2% 72.7% 55.0% 67.1% 59.8%
Attracting business 40.7% 32.4% 43.6% 31.8% 32.5% 43.0% 47.4%Q
Increasing education opportunities for all age groups 39.6% 38.2% 43.6% 31.8% 40.0% 45.6% 33.0%
Maintaining and enhancing the visual appearance of buildings and landscaping
32.6% 30.9% 35.0% 50.0% 37.5% 27.8% 28.9%
Improving personal security and public safety 26.2% 26.5% 20.5% 4.5% 27.5% 30.4% 33.0%S S S S RS
Protecting neighborhoods from encroachment by non-residential land uses
23.2% 14.7% 26.5% 18.2% 15.0% 29.1% 24.7%
Q QBuilding and maintaining livable neighborhoods 18.7% 25.0% 18.8% 22.7% 20.0% 13.9% 17.5%
B2Encouraging a sustainable region 16.9% 22.1% 12.8% 13.6% 25.0% 12.7% 18.6%Having access to open space (parks, green belts, wooded land) near residential areas
13.8% 17.6% 12.0% 22.7% 17.5% 10.1% 11.3%
Maintaining a low level of environmental pollution 11.9% 14.7% 6.8% 18.2% 17.5% 11.4% 13.4%Other 7.5% 4.4% 10.3% 13.6% 5.0% 6.3% 5.2%
Comparison Groups: ABCD/EFGHIJ/KLMNOP/QRSTUV/WXYZA2B2/EKQW/FLRX/GMSY/HNTZ/IOUA2/JPVB2Independent T-Test for Means (equal variances), Independent Z-Test for PercentagesUpper case letters indicate significance at the 95% level.
1. LEAST IMPORTANT OBJECTIVES which could be used to guide future growth and development in the Centre Region. (Percent selected as one of three least important)
Page 3

2011 Centre Region Community Survey Results - Random Sample
Random sample weighted by relative municipality population
Random
Sample Random
Sample Random
Sample Random
Sample Random
Sample Random
Sample Random
Sample College
Township Ferguson Township
Halfmoon Township
Harris Township
Patton Township
Boro State College
(B) (Q) (R) (S) (T) (U) (V)
TOTAL ANSWERING 454 74 128 22 41 85 99High rate of population growth (An additional 32,000 residents)
4.6% 8.1% 3.1% 9.1% 2.4% 8.2% 1.0%
V VModerate rate of population growth (An additional 18,000 residents)
31.3% 28.4% 34.4% 31.8% 39.0% 28.2% 28.3%
Low rate of population growth (An additional 6,000 residents)
35.2% 25.7% 42.2% 31.8% 39.0% 32.9% 35.4%
QNo increase in population 15.4% 20.3% 10.9% 13.6% 12.2% 16.5% 18.2%
It doesn't matter to me 13.4% 17.6% 9.4% 13.6% 7.3% 14.1% 17.2%
Comparison Groups: ABCD/EFGHIJ/KLMNOP/QRSTUV/WXYZA2B2/EKQW/FLRX/GMSY/HNTZ/IOUA2/JPVB2Independent T-Test for Means (equal variances), Independent Z-Test for PercentagesUpper case letters indicate significance at the 95% level.
2. During the next 30 years what rate of population growth would you prefer for the Centre Region? Please check the population number which corresponds to your preference (Check only one).
Page 4

2011 Centre Region Community Survey Results - Random Sample
3. RELEVANT GOALS. Please select which best corresponds to your current opinion regarding each of the goals. (Percent selected as "still relevant")Random sample weighted by relative municipality population
Random
Sample Random
Sample Random
Sample Random
Sample Random
Sample Random
Sample Random
Sample College
Township Ferguson Township
Halfmoon Township
Harris Township
Patton Township
Boro State College
(B) (Q) (R) (S) (T) (U) (V)
TOTAL ANSWERING 458 78 125 23 42 85 100Balance community growth while protecting and enhancing the Centre Region's environmental, historic, and cultural resources.
90.8% 88.5% 90.4% 87.0% 92.9% 92.9% 93.0%
Maintain a cooperative relationship between the Centre Region municipalities and Penn State University to ensure that future growth at the University benefits the community.
85.8% 82.1% 83.2% 65.2% 85.7% 91.8% 91.0%
S SPreserve prime farmland for agricultural use. 82.5% 76.9% 84.8% 78.3% 85.7% 80.0% 86.0%Coordinate land development activity with the transportation system for the safe, efficient, and convenient movement of people and goods.
84.1% 76.9% 82.4% 82.6% 78.6% 91.8% 88.0%
A2QRCoordinate land development activity with necessary public facilities and services in a cost-effective manner.
81.9% 75.6% 82.4% 73.9% 88.1% 82.4% 85.0%
Direct the majority of future growth to areas within the Regional Growth Boundary so that new development can be efficiently served by public utilities, services, and transit.
71.6% 71.8% 69.6% 65.2% 78.6% 69.4% 75.0%
Provide a variety of housing opportunities to satisfy the needs of all existing and future residents of the Centre Region.
71.6% 62.8% 67.2% 69.6% 71.4% 77.6% 79.0%
Q QRObtain additional parkland and open-space areas, and provide a broad range of recreational opportunities.
68.1% 55.1% 66.4% 56.5% 69.0% 76.5% 76.0%
Q QPreserve and enhance the low-density community character in the rural areas located outside of the Regional Growth Boundary.
66.4% 62.8% 63.2% 87.0% 78.6% 61.2% 67.0%
QRUV RUComparison Groups: ABCD/EFGHIJ/KLMNOP/QRSTUV/WXYZA2B2/EKQW/FLRX/GMSY/HNTZ/IOUA2/JPVB2Independent T-Test for Means (equal variances), Independent Z-Test for PercentagesUpper case letters indicate significance at the 95% level.
Page 5

2011 Centre Region Community Survey Results - Random Sample
Random sample weighted by relative municipality population
Random
Sample Random
Sample Random
Sample Random
Sample Random
Sample Random
Sample Random
Sample College
Township Ferguson Township
Halfmoon Township
Harris Township
Patton Township
Boro State College
(B) (Q) (R) (S) (T) (U) (V)
TOTAL ANSWERING 458 78 125 23 42 85 100Obtain additional parkland and open-space areas, and provide a broad range of recreational opportunities.
19.9% 29.5% 17.6% 34.8% 26.2% 11.8% 16.0%
WUV YUProvide a variety of housing opportunities to satisfy the needs of all existing and future residents of the Centre Region.
16.8% 16.7% 19.2% 21.7% 23.8% 11.8% 15.0%
Preserve and enhance the low-density community character in the rural areas located outside of the Regional Growth Boundary.
16.6% 17.9% 16.0% 8.7% 14.3% 18.8% 18.0%
XDirect the majority of future growth to areas within the Regional Growth Boundary so that new development can be efficiently served by public utilities, services, and transit.
9.0% 10.3% 7.2% 21.7% 11.9% 8.2% 7.0%
Preserve prime farmland for agricultural use. 7.4% 6.4% 8.0% 13.0% 7.1% 11.8% 3.0%V
Coordinate land development activity with necessary public facilities and services in a cost-effective manner.
6.8% 9.0% 4.8% 17.4% 9.5% 5.9% 5.0%
Coordinate land development activity with the transportation system for the safe, efficient, and convenient movement of people and goods.
6.6% 9.0% 6.4% 4.3% 14.3% 3.5% 5.0%
Maintain a cooperative relationship between the Centre Region municipalities and Penn State University to ensure that future growth at the University benefits the community.
7.0% 7.7% 8.0% 17.4% 7.1% 4.7% 5.0%
Balance community growth while protecting and enhancing the Centre Region's environmental, historic, and cultural resources.
3.7% 3.8% 3.2% 13.0% 2.4% 1.2% 4.0%
Comparison Groups: ABCD/EFGHIJ/KLMNOP/QRSTUV/WXYZA2B2/EKQW/FLRX/GMSY/HNTZ/IOUA2/JPVB2Independent T-Test for Means (equal variances), Independent Z-Test for PercentagesUpper case letters indicate significance at the 95% level.
3. NO LONGER RELEVANT GOALS. Please select which best corresponds to your current opinion regarding each of the goals. (Percent selected as "no longer relevant")
Page 6

2011 Centre Region Community Survey Results - Random Sample
3. Please select which best corresponds to your current opinion regarding the following goal.Balance community growth while protecting and enhancing the Centre Region's environmental, historic, and cultural resources.Random sample weighted by relative municipality population
Random
Sample Random
Sample Random
Sample Random
Sample Random
Sample Random
Sample Random
Sample College
Township Ferguson Township
Halfmoon Township
Harris Township
Patton Township
Boro State College
(B) (Q) (R) (S) (T) (U) (V)
TOTAL ANSWERING 458 78 125 23 42 85 100Still Relevant 90.8% 88.5% 90.4% 87.0% 92.9% 92.9% 93.0%No Longer Relevant 3.7% 3.8% 3.2% 13.0% 2.4% 1.2% 4.0%Don’t Know/Not Sure 5.0% 6.4% 5.6% - 4.8% 5.9% 3.0%Comparison Groups: ABCD/EFGHIJ/KLMNOP/QRSTUV/WXYZA2B2/EKQW/FLRX/GMSY/HNTZ/IOUA2/JPVB2Independent T-Test for Means (equal variances), Independent Z-Test for PercentagesUpper case letters indicate significance at the 95% level.
3. Please select which best corresponds to your current opinion regarding the following goal.Direct the majority of future growth to areas within the Regional Growth Boundary so that new development can be efficiently served by public utilities, services, and transit.Random sample weighted by relative municipality population
Random
Sample Random
Sample Random
Sample Random
Sample Random
Sample Random
Sample Random
Sample College
Township Ferguson Township
Halfmoon Township
Harris Township
Patton Township
Boro State College
(B) (Q) (R) (S) (T) (U) (V)
TOTAL ANSWERING 458 78 125 23 42 85 100Still Relevant 71.6% 71.8% 69.6% 65.2% 78.6% 69.4% 75.0%No Longer Relevant 9.0% 10.3% 7.2% 21.7% 11.9% 8.2% 7.0%Don’t Know/Not Sure 17.7% 16.7% 19.2% 13.0% 9.5% 21.2% 17.0%Comparison Groups: ABCD/EFGHIJ/KLMNOP/QRSTUV/WXYZA2B2/EKQW/FLRX/GMSY/HNTZ/IOUA2/JPVB2Independent T-Test for Means (equal variances), Independent Z-Test for PercentagesUpper case letters indicate significance at the 95% level.
Page 7
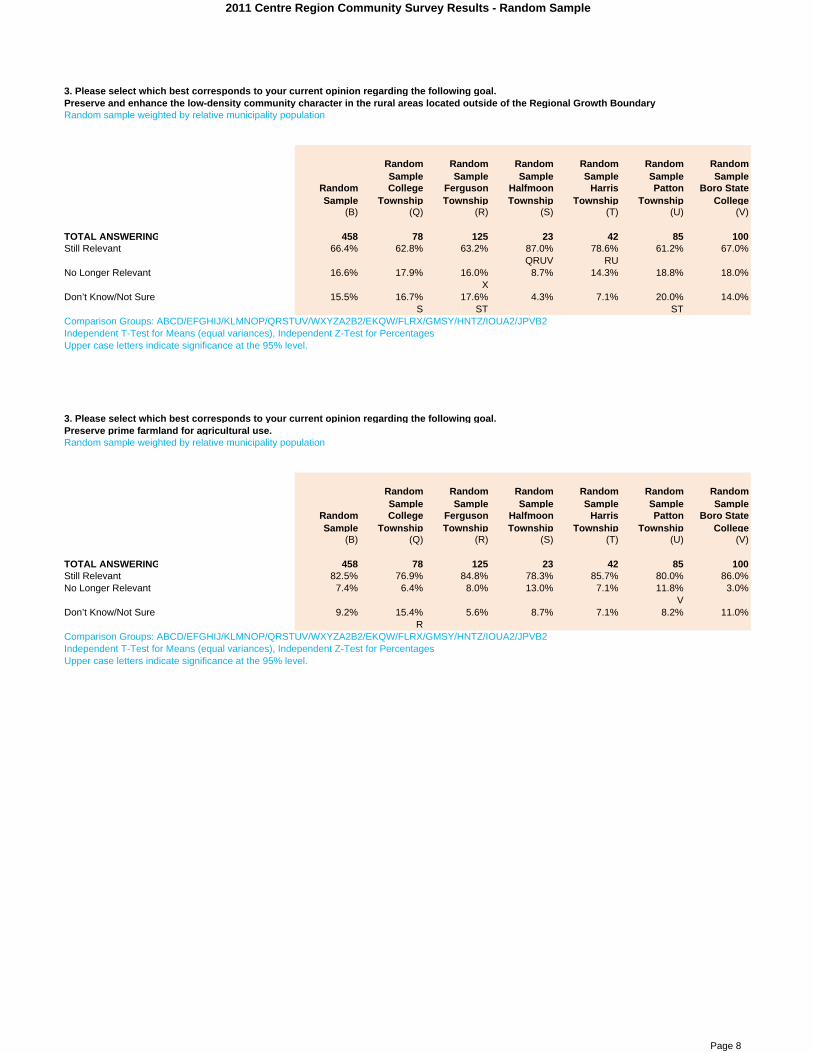
2011 Centre Region Community Survey Results - Random Sample
3. Please select which best corresponds to your current opinion regarding the following goal.Preserve and enhance the low-density community character in the rural areas located outside of the Regional Growth Boundary.Random sample weighted by relative municipality population
Random
Sample Random
Sample Random
Sample Random
Sample Random
Sample Random
Sample Random
Sample College
Township Ferguson Township
Halfmoon Township
Harris Township
Patton Township
Boro State College
(B) (Q) (R) (S) (T) (U) (V)
TOTAL ANSWERING 458 78 125 23 42 85 100Still Relevant 66.4% 62.8% 63.2% 87.0% 78.6% 61.2% 67.0%
QRUV RUNo Longer Relevant 16.6% 17.9% 16.0% 8.7% 14.3% 18.8% 18.0%
XDon’t Know/Not Sure 15.5% 16.7% 17.6% 4.3% 7.1% 20.0% 14.0%
S ST STComparison Groups: ABCD/EFGHIJ/KLMNOP/QRSTUV/WXYZA2B2/EKQW/FLRX/GMSY/HNTZ/IOUA2/JPVB2Independent T-Test for Means (equal variances), Independent Z-Test for PercentagesUpper case letters indicate significance at the 95% level.
3. Please select which best corresponds to your current opinion regarding the following goal.Preserve prime farmland for agricultural use.Random sample weighted by relative municipality population
Random
Sample Random
Sample Random
Sample Random
Sample Random
Sample Random
Sample Random
Sample College
Township Ferguson Township
Halfmoon Township
Harris Township
Patton Township
Boro State College
(B) (Q) (R) (S) (T) (U) (V)
TOTAL ANSWERING 458 78 125 23 42 85 100Still Relevant 82.5% 76.9% 84.8% 78.3% 85.7% 80.0% 86.0%No Longer Relevant 7.4% 6.4% 8.0% 13.0% 7.1% 11.8% 3.0%
VDon’t Know/Not Sure 9.2% 15.4% 5.6% 8.7% 7.1% 8.2% 11.0%
RComparison Groups: ABCD/EFGHIJ/KLMNOP/QRSTUV/WXYZA2B2/EKQW/FLRX/GMSY/HNTZ/IOUA2/JPVB2Independent T-Test for Means (equal variances), Independent Z-Test for PercentagesUpper case letters indicate significance at the 95% level.
Page 8

2011 Centre Region Community Survey Results - Random Sample
3. Please select which best corresponds to your current opinion regarding the following goal.Coordinate land development activity with the transportation system for the safe, efficient, and convenient movement of people and goodsRandom sample weighted by relative municipality population
Random
Sample Random
Sample Random
Sample Random
Sample Random
Sample Random
Sample Random
Sample College
Township Ferguson Township
Halfmoon Township
Harris Township
Patton Township
Boro State College
(B) (Q) (R) (S) (T) (U) (V)
TOTAL ANSWERING 458 78 125 23 42 85 100Still Relevant 84.1% 76.9% 82.4% 82.6% 78.6% 91.8% 88.0%
A2QRNo Longer Relevant 6.6% 9.0% 6.4% 4.3% 14.3% 3.5% 5.0%
Don’t Know/Not Sure 7.4% 10.3% 7.2% 13.0% 7.1% 4.7% 6.0%
Comparison Groups: ABCD/EFGHIJ/KLMNOP/QRSTUV/WXYZA2B2/EKQW/FLRX/GMSY/HNTZ/IOUA2/JPVB2Independent T-Test for Means (equal variances), Independent Z-Test for PercentagesUpper case letters indicate significance at the 95% level.
3. Please select which best corresponds to your current opinion regarding the following goal.Coordinate land development activity with necessary public facilities and services in a cost-effective manner.Random sample weighted by relative municipality population
Random
Sample Random
Sample Random
Sample Random
Sample Random
Sample Random
Sample Random
Sample College
Township Ferguson Township
Halfmoon Township
Harris Township
Patton Township
Boro State College
(B) (Q) (R) (S) (T) (U) (V)
TOTAL ANSWERING 458 78 125 23 42 85 100Still Relevant 81.9% 75.6% 82.4% 73.9% 88.1% 82.4% 85.0%
No Longer Relevant 6.8% 9.0% 4.8% 17.4% 9.5% 5.9% 5.0%
Don’t Know/Not Sure 8.7% 11.5% 8.8% 8.7% 2.4% 9.4% 8.0%T
Comparison Groups: ABCD/EFGHIJ/KLMNOP/QRSTUV/WXYZA2B2/EKQW/FLRX/GMSY/HNTZ/IOUA2/JPVB2Independent T-Test for Means (equal variances), Independent Z-Test for PercentagesUpper case letters indicate significance at the 95% level.
3. Please select which best corresponds to your current opinion regarding the following goal.Obtain additional parkland and open-space areas, and provide a broad range of recreational opportunities.Random sample weighted by relative municipality population
Random
Sample Random
Sample Random
Sample Random
Sample Random
Sample Random
Sample Random
Sample College
Township Ferguson Township
Halfmoon Township
Harris Township
Patton Township
Boro State College
(B) (Q) (R) (S) (T) (U) (V)
TOTAL ANSWERING 458 78 125 23 42 85 100Still Relevant 68.1% 55.1% 66.4% 56.5% 69.0% 76.5% 76.0%
Q QNo Longer Relevant 19.9% 29.5% 17.6% 34.8% 26.2% 11.8% 16.0%
WUV YUDon’t Know/Not Sure 10.0% 10.3% 12.8% 8.7% 4.8% 10.6% 8.0%Comparison Groups: ABCD/EFGHIJ/KLMNOP/QRSTUV/WXYZA2B2/EKQW/FLRX/GMSY/HNTZ/IOUA2/JPVB2Independent T-Test for Means (equal variances), Independent Z-Test for PercentagesUpper case letters indicate significance at the 95% level.
Page 9

2011 Centre Region Community Survey Results - Random Sample
3. Please select which best corresponds to your current opinion regarding the following goal.Provide a variety of housing opportunities to satisfy the needs of all existing and future residents of the Centre RegionRandom sample weighted by relative municipality population
Random
Sample Random
Sample Random
Sample Random
Sample Random
Sample Random
Sample Random
Sample College
Township Ferguson Township
Halfmoon Township
Harris Township
Patton Township
Boro State College
(B) (Q) (R) (S) (T) (U) (V)
TOTAL ANSWERING 458 78 125 23 42 85 100Still Relevant 71.6% 62.8% 67.2% 69.6% 71.4% 77.6% 79.0%
Q QRNo Longer Relevant 16.8% 16.7% 19.2% 21.7% 23.8% 11.8% 15.0%Don’t Know/Not Sure 9.6% 15.4% 10.4% 8.7% 4.8% 10.6% 5.0%
TVComparison Groups: ABCD/EFGHIJ/KLMNOP/QRSTUV/WXYZA2B2/EKQW/FLRX/GMSY/HNTZ/IOUA2/JPVB2Independent T-Test for Means (equal variances), Independent Z-Test for PercentagesUpper case letters indicate significance at the 95% level.
3. Please select which best corresponds to your current opinion regarding the following goal.Maintain a cooperative relationship between the Centre Region municipalities and Penn State University to ensure that future growth at the University benefits the community.Random sample weighted by relative municipality population
Random
Sample Random
Sample Random
Sample Random
Sample Random
Sample Random
Sample Random
Sample College
Township Ferguson Township
Halfmoon Township
Harris Township
Patton Township
Boro State College
(B) (Q) (R) (S) (T) (U) (V)
TOTAL ANSWERING 458 78 125 23 42 85 100Still Relevant 85.8% 82.1% 83.2% 65.2% 85.7% 91.8% 91.0%
S SNo Longer Relevant 7.0% 7.7% 8.0% 17.4% 7.1% 4.7% 5.0%Don’t Know/Not Sure 5.5% 6.4% 5.6% 13.0% 7.1% 3.5% 4.0%Comparison Groups: ABCD/EFGHIJ/KLMNOP/QRSTUV/WXYZA2B2/EKQW/FLRX/GMSY/HNTZ/IOUA2/JPVB2Independent T-Test for Means (equal variances), Independent Z-Test for PercentagesUpper case letters indicate significance at the 95% level.
Page 10
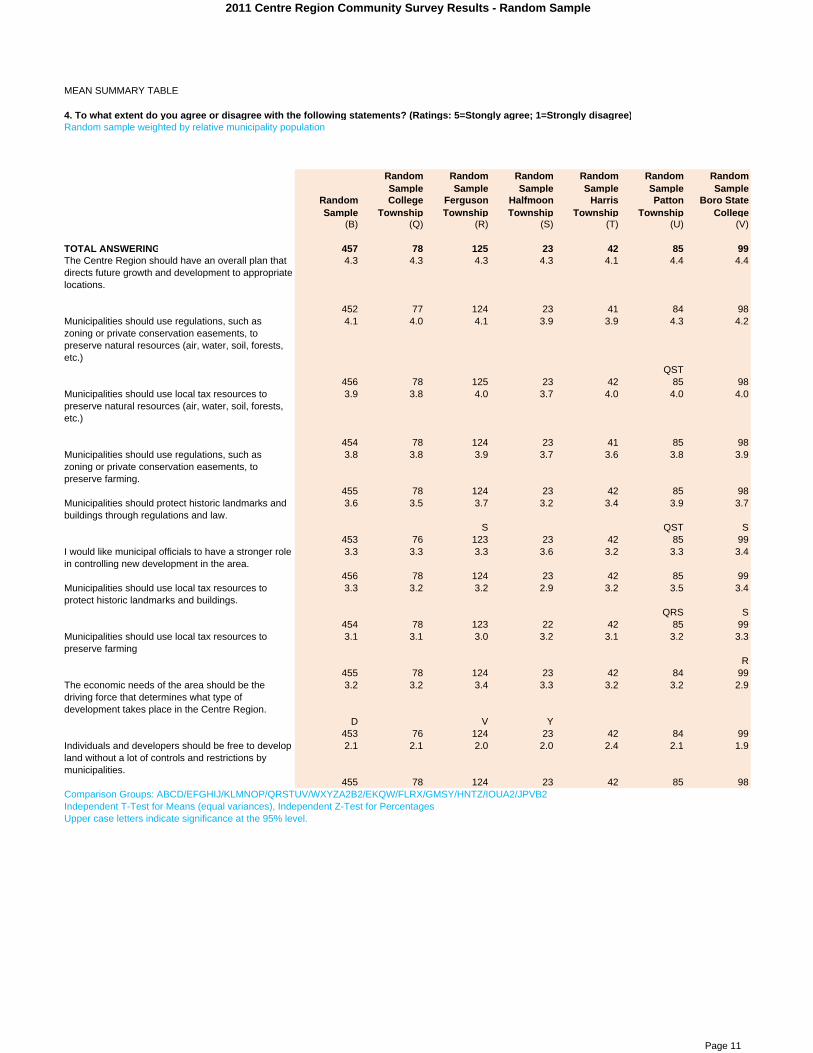
2011 Centre Region Community Survey Results - Random Sample
MEAN SUMMARY TABLE
4. To what extent do you agree or disagree with the following statements? (Ratings: 5=Stongly agree; 1=Strongly disagree)Random sample weighted by relative municipality population
Random
Sample Random
Sample Random
Sample Random
Sample Random
Sample Random
Sample Random
Sample College
Township Ferguson Township
Halfmoon Township
Harris Township
Patton Township
Boro State College
(B) (Q) (R) (S) (T) (U) (V)
TOTAL ANSWERING 457 78 125 23 42 85 99The Centre Region should have an overall plan that directs future growth and development to appropriate locations.
4.3 4.3 4.3 4.3 4.1 4.4 4.4
452 77 124 23 41 84 98Municipalities should use regulations, such as zoning or private conservation easements, to preserve natural resources (air, water, soil, forests, etc.)
4.1 4.0 4.1 3.9 3.9 4.3 4.2
QST456 78 125 23 42 85 98
Municipalities should use local tax resources to preserve natural resources (air, water, soil, forests, etc.)
3.9 3.8 4.0 3.7 4.0 4.0 4.0
454 78 124 23 41 85 98Municipalities should use regulations, such as zoning or private conservation easements, to preserve farming.
3.8 3.8 3.9 3.7 3.6 3.8 3.9
455 78 124 23 42 85 98Municipalities should protect historic landmarks and buildings through regulations and law.
3.6 3.5 3.7 3.2 3.4 3.9 3.7
S QST S453 76 123 23 42 85 99
I would like municipal officials to have a stronger role in controlling new development in the area.
3.3 3.3 3.3 3.6 3.2 3.3 3.4
456 78 124 23 42 85 99Municipalities should use local tax resources to protect historic landmarks and buildings.
3.3 3.2 3.2 2.9 3.2 3.5 3.4
QRS S454 78 123 22 42 85 99
Municipalities should use local tax resources to preserve farming
3.1 3.1 3.0 3.2 3.1 3.2 3.3
R455 78 124 23 42 84 99
The economic needs of the area should be the driving force that determines what type of development takes place in the Centre Region.
3.2 3.2 3.4 3.3 3.2 3.2 2.9
D V Y453 76 124 23 42 84 99
Individuals and developers should be free to develop land without a lot of controls and restrictions by municipalities.
2.1 2.1 2.0 2.0 2.4 2.1 1.9
455 78 124 23 42 85 98Comparison Groups: ABCD/EFGHIJ/KLMNOP/QRSTUV/WXYZA2B2/EKQW/FLRX/GMSY/HNTZ/IOUA2/JPVB2Independent T-Test for Means (equal variances), Independent Z-Test for PercentagesUpper case letters indicate significance at the 95% level.
Page 11

2011 Centre Region Community Survey Results - Random Sample
4. To what extent do you agree or disagree with the following statement?The Centre Region should have an overall plan that directs future growth and development to appropriate locations.Random sample weighted by relative municipality population
Random
Sample Random
Sample Random
Sample Random
Sample Random
Sample Random
Sample Random
Sample College
Township Ferguson Township
Halfmoon Township
Harris Township
Patton Township
Boro State College
(B) (Q) (R) (S) (T) (U) (V)
TOTAL ANSWERING 452 77 124 23 41 84 98Strongly Agree 46.2% 40.3% 50.0% 47.8% 43.9% 45.2% 49.0%Agree 44.2% 46.8% 41.1% 39.1% 39.0% 51.2% 42.9%
WUncertain/Undecided 5.8% 11.7% 3.2% 8.7% 7.3% 2.4% 5.1%
RUDisagree 2.7% 1.3% 4.8% - 4.9% 1.2% 2.0%
Strongly Disagree 1.1% - 0.8% 4.3% 4.9% - 1.0%MEAN 4.3 4.3 4.3 4.3 4.1 4.4 4.4
Comparison Groups: ABCD/EFGHIJ/KLMNOP/QRSTUV/WXYZA2B2/EKQW/FLRX/GMSY/HNTZ/IOUA2/JPVB2Independent T-Test for Means (equal variances), Independent Z-Test for PercentagesUpper case letters indicate significance at the 95% level.
4. To what extent do you agree or disagree with the following statement?I would like municipal officials to have a stronger role in controlling new development in the area.Random sample weighted by relative municipality population
Random
Sample Random
Sample Random
Sample Random
Sample Random
Sample Random
Sample Random
Sample College
Township Ferguson Township
Halfmoon Township
Harris Township
Patton Township
Boro State College
(B) (Q) (R) (S) (T) (U) (V)
TOTAL ANSWERING 456 78 124 23 42 85 99Strongly Agree 12.3% 14.1% 9.7% 21.7% 11.9% 7.1% 17.2%
UAgree 33.8% 34.6% 34.7% 39.1% 33.3% 37.6% 28.3%Uncertain/Undecided 34.6% 28.2% 35.5% 26.1% 31.0% 38.8% 36.4%
D XDisagree 14.5% 17.9% 15.3% 4.3% 14.3% 14.1% 14.1%
S SStrongly Disagree 4.8% 5.1% 4.8% 8.7% 9.5% 2.4% 4.0%MEAN 3.3 3.3 3.3 3.6 3.2 3.3 3.4Comparison Groups: ABCD/EFGHIJ/KLMNOP/QRSTUV/WXYZA2B2/EKQW/FLRX/GMSY/HNTZ/IOUA2/JPVB2Independent T-Test for Means (equal variances), Independent Z-Test for PercentagesUpper case letters indicate significance at the 95% level.
Page 12

2011 Centre Region Community Survey Results - Random Sample
4. To what extent do you agree or disagree with the following statement?Individuals and developers should be free to develop land without a lot of controls and restrictions by municipalities.Random sample weighted by relative municipality population
Random
Sample Random
Sample Random
Sample Random
Sample Random
Sample Random
Sample Random
Sample College
Township Ferguson Township
Halfmoon Township
Harris Township
Patton Township
Boro State College
(B) (Q) (R) (S) (T) (U) (V)
TOTAL ANSWERING 455 78 124 23 42 85 98Strongly Agree 4.6% 2.6% 4.8% 4.3% 14.3% - 5.1%
QAgree 9.9% 15.4% 8.1% 8.7% 9.5% 10.6% 8.2%Uncertain/Undecided 8.1% 5.1% 9.7% 4.3% 4.8% 15.3% 5.1%
QTVDisagree 41.3% 41.0% 38.7% 47.8% 40.5% 47.1% 38.8%
D XStrongly Disagree 36.0% 35.9% 38.7% 34.8% 31.0% 27.1% 42.9%
UMEAN 2.1 2.1 2.0 2.0 2.4 2.1 1.9Comparison Groups: ABCD/EFGHIJ/KLMNOP/QRSTUV/WXYZA2B2/EKQW/FLRX/GMSY/HNTZ/IOUA2/JPVB2Independent T-Test for Means (equal variances), Independent Z-Test for PercentagesUpper case letters indicate significance at the 95% level.
4. To what extent do you agree or disagree with the following statement?
Random sample weighted by relative municipality population
Random
Sample Random
Sample Random
Sample Random
Sample Random
Sample Random
Sample Random
Sample College
Township Ferguson Township
Halfmoon Township
Harris Township
Patton Township
Boro State College
(B) (Q) (R) (S) (T) (U) (V)
TOTAL ANSWERING 453 76 124 23 42 84 99Strongly Agree 12.1% 15.8% 17.7% 17.4% 7.1% 11.9% 4.0%
V XTVAgree 35.1% 31.6% 36.3% 30.4% 40.5% 36.9% 33.3%
Uncertain/Undecided 22.1% 23.7% 19.4% 26.1% 28.6% 19.0% 23.2%Disagree 23.4% 18.4% 21.0% 21.7% 14.3% 26.2% 32.3%
QTStrongly Disagree 7.3% 10.5% 5.6% 4.3% 9.5% 6.0% 7.1%MEAN 3.2 3.2 3.4 3.3 3.2 3.2 2.9
D V YComparison Groups: ABCD/EFGHIJ/KLMNOP/QRSTUV/WXYZA2B2/EKQW/FLRX/GMSY/HNTZ/IOUA2/JPVB2Independent T-Test for Means (equal variances), Independent Z-Test for PercentagesUpper case letters indicate significance at the 95% level.
The economic needs of the area should be the driving force that determines what type of development takes place in the Centre Region.
Page 13

2011 Centre Region Community Survey Results - Random Sample
4. To what extent do you agree or disagree with the following statement?Municipalities should use local tax resources to protect historic landmarks and buildings.Random sample weighted by relative municipality population
Random
Sample Random
Sample Random
Sample Random
Sample Random
Sample Random
Sample Random
Sample College
Township Ferguson Township
Halfmoon Township
Harris Township
Patton Township
Boro State College
(B) (Q) (R) (S) (T) (U) (V)
TOTAL ANSWERING 454 78 123 22 42 85 99Strongly Agree 7.7% 5.1% 6.5% 9.1% 9.5% 9.4% 9.1%
Agree 39.6% 37.2% 37.4% 13.6% 38.1% 44.7% 45.5%S S S S B2S
Uncertain/Undecided 28.0% 32.1% 29.3% 36.4% 23.8% 29.4% 23.2%Disagree 19.8% 19.2% 22.0% 36.4% 16.7% 15.3% 18.2%
D X YStrongly Disagree 4.8% 6.4% 4.9% 4.5% 11.9% 1.2% 4.0%
UMEAN 3.3 3.2 3.2 2.9 3.2 3.5 3.4
QRS SComparison Groups: ABCD/EFGHIJ/KLMNOP/QRSTUV/WXYZA2B2/EKQW/FLRX/GMSY/HNTZ/IOUA2/JPVB2Independent T-Test for Means (equal variances), Independent Z-Test for PercentagesUpper case letters indicate significance at the 95% level.
4. To what extent do you agree or disagree with the following statement? Municipalities should protect historic landmarks and buildings through regulations and law.Random sample weighted by relative municipality population
Random
Sample Random
Sample Random
Sample Random
Sample Random
Sample Random
Sample Random
Sample College
Township Ferguson Township
Halfmoon Township
Harris Township
Patton Township
Boro State College
(B) (Q) (R) (S) (T) (U) (V)
TOTAL ANSWERING 453 76 123 23 42 85 99Strongly Agree 11.5% 9.2% 12.2% 8.7% 9.5% 12.9% 12.1%
Agree 56.7% 51.3% 60.2% 30.4% 45.2% 68.2% 58.6%S A2QST S
Uncertain/Undecided 18.1% 26.3% 14.6% 34.8% 26.2% 10.6% 15.2%U U U
Disagree 11.3% 7.9% 11.4% 21.7% 11.9% 8.2% 13.1%Y B2
Strongly Disagree 2.4% 5.3% 1.6% 4.3% 7.1% - 1.0%MEAN 3.6 3.5 3.7 3.2 3.4 3.9 3.7
S QST SComparison Groups: ABCD/EFGHIJ/KLMNOP/QRSTUV/WXYZA2B2/EKQW/FLRX/GMSY/HNTZ/IOUA2/JPVB2Independent T-Test for Means (equal variances), Independent Z-Test for PercentagesUpper case letters indicate significance at the 95% level.
Page 14

2011 Centre Region Community Survey Results - Random Sample
4. To what extent do you agree or disagree with the following statement?Municipalities should use local tax resources to preserve natural resources (air, water, soil, forests, etc.)Random sample weighted by relative municipality population
Random
Sample Random
Sample Random
Sample Random
Sample Random
Sample Random
Sample Random
Sample College
Township Ferguson Township
Halfmoon Township
Harris Township
Patton Township
Boro State College
(B) (Q) (R) (S) (T) (U) (V)
TOTAL ANSWERING 454 78 124 23 41 85 98Strongly Agree 29.7% 23.1% 25.8% 26.1% 36.6% 34.1% 34.7%Agree 46.5% 47.4% 51.6% 39.1% 43.9% 43.5% 42.9%Uncertain/Undecided 14.5% 16.7% 17.7% 13.0% 9.8% 16.5% 10.2%Disagree 6.6% 7.7% 4.0% 17.4% 4.9% 4.7% 9.2%Strongly Disagree 2.6% 5.1% 0.8% 4.3% 4.9% 1.2% 3.1%MEAN 3.9 3.8 4.0 3.7 4.0 4.0 4.0
Comparison Groups: ABCD/EFGHIJ/KLMNOP/QRSTUV/WXYZA2B2/EKQW/FLRX/GMSY/HNTZ/IOUA2/JPVB2Independent T-Test for Means (equal variances), Independent Z-Test for PercentagesUpper case letters indicate significance at the 95% level.
4. To what extent do you agree or disagree with the following statement?Municipalities should use regulations, such as zoning or private conservation easements, to preserve natural resources (air, water, soil, forests, etc.)Random sample weighted by relative municipality population
Random
Sample Random
Sample Random
Sample Random
Sample Random
Sample Random
Sample Random
Sample College
Township Ferguson Township
Halfmoon Township
Harris Township
Patton Township
Boro State College
(B) (Q) (R) (S) (T) (U) (V)
TOTAL ANSWERING 456 78 125 23 42 85 98Strongly Agree 34.6% 28.2% 31.2% 21.7% 31.0% 45.9% 39.8%
QRSAgree 51.5% 55.1% 54.4% 60.9% 45.2% 43.5% 51.0%
DUncertain/Undecided 7.7% 11.5% 8.8% 8.7% 9.5% 7.1% 3.1%
VDisagree 3.9% 2.6% 4.8% 4.3% 9.5% 3.5% 2.0%Strongly Disagree 2.2% 2.6% 0.8% 4.3% 4.8% - 4.1%MEAN 4.1 4.0 4.1 3.9 3.9 4.3 4.2
QSTComparison Groups: ABCD/EFGHIJ/KLMNOP/QRSTUV/WXYZA2B2/EKQW/FLRX/GMSY/HNTZ/IOUA2/JPVB2Independent T-Test for Means (equal variances), Independent Z-Test for PercentagesUpper case letters indicate significance at the 95% level.
Page 15

2011 Centre Region Community Survey Results - Random Sample
4. To what extent do you agree or disagree with the following statement?Municipalities should use local tax resources to preserve farmingRandom sample weighted by relative municipality population
Random
Sample Random
Sample Random
Sample Random
Sample Random
Sample Random
Sample Random
Sample College
Township Ferguson Township
Halfmoon Township
Harris Township
Patton Township
Boro State College
(B) (Q) (R) (S) (T) (U) (V)
TOTAL ANSWERING 455 78 124 23 42 84 99Strongly Agree 13.0% 14.1% 9.7% 13.0% 16.7% 8.3% 17.2%Agree 25.9% 20.5% 23.4% 30.4% 26.2% 33.3% 26.3%
Uncertain/Undecided 29.7% 30.8% 29.8% 30.4% 21.4% 31.0% 32.3%A2
Disagree 25.7% 25.6% 32.3% 17.4% 23.8% 22.6% 22.2%D X
Strongly Disagree 5.7% 9.0% 4.8% 8.7% 11.9% 4.8% 2.0%V
MEAN 3.1 3.1 3.0 3.2 3.1 3.2 3.3R
Comparison Groups: ABCD/EFGHIJ/KLMNOP/QRSTUV/WXYZA2B2/EKQW/FLRX/GMSY/HNTZ/IOUA2/JPVB2Independent T-Test for Means (equal variances), Independent Z-Test for PercentagesUpper case letters indicate significance at the 95% level.
4. To what extent do you agree or disagree with the following statement?Municipalities should use regulations, such as zoning or private conservation easements, to preserve farming.Random sample weighted by relative municipality population
Random
Sample Random
Sample Random
Sample Random
Sample Random
Sample Random
Sample Random
Sample College
Township Ferguson Township
Halfmoon Township
Harris Township
Patton Township
Boro State College
(B) (Q) (R) (S) (T) (U) (V)
TOTAL ANSWERING 455 78 124 23 42 85 98Strongly Agree 23.7% 17.9% 25.8% 13.0% 23.8% 21.2% 29.6%
SAgree 49.0% 53.8% 51.6% 65.2% 40.5% 48.2% 41.8%
D TV A2Uncertain/Undecided 15.8% 19.2% 9.7% 8.7% 16.7% 20.0% 19.4%
A2R RDisagree 8.8% 9.0% 9.7% 4.3% 11.9% 8.2% 8.2%Strongly Disagree 2.6% - 3.2% 8.7% 7.1% 2.4% 1.0%MEAN 3.8 3.8 3.9 3.7 3.6 3.8 3.9Comparison Groups: ABCD/EFGHIJ/KLMNOP/QRSTUV/WXYZA2B2/EKQW/FLRX/GMSY/HNTZ/IOUA2/JPVB2Independent T-Test for Means (equal variances), Independent Z-Test for PercentagesUpper case letters indicate significance at the 95% level.
Page 16

2011 Centre Region Community Survey Results - Random Sample
5. Please place the following land use issues in the Centre Region in priority order. First, what is the MOST important priority?Random sample weighted by relative municipality population
Random
Sample Random
Sample Random
Sample Random
Sample Random
Sample Random
Sample Random
Sample College
Township Ferguson Township
Halfmoon Township
Harris Township
Patton Township
Boro State College
(B) (Q) (R) (S) (T) (U) (V)
TOTAL ANSWERING 455 78 125 23 42 84 98Preservation of natural resources (air, water, soil, forests, etc.)
56.0% 47.4% 52.0% 56.5% 61.9% 70.2% 52.0%
QRVPreservation of farming 13.8% 16.7% 16.8% 34.8% 9.5% 8.3% 10.2%
TUVPreservation of established neighborhoods. 12.5% 11.5% 15.2% 4.3% 9.5% 7.1% 17.3%
S SURedevelopment of older shopping centers. 9.9% 17.9% 8.0% - 11.9% 9.5% 8.2%
RDiversify businesses in downtown State College. 7.7% 6.4% 8.0% 4.3% 7.1% 4.8% 12.2%Comparison Groups: ABCD/EFGHIJ/KLMNOP/QRSTUV/WXYZA2B2/EKQW/FLRX/GMSY/HNTZ/IOUA2/JPVB2Independent T-Test for Means (equal variances), Independent Z-Test for PercentagesUpper case letters indicate significance at the 95% level.
5. Of the remaining factors, what do you think is the next (second) most important land use issue?Random sample weighted by relative municipality population
Random
Sample Random
Sample Random
Sample Random
Sample Random
Sample Random
Sample Random
Sample College
Township Ferguson Township
Halfmoon Township
Harris Township
Patton Township
Boro State College
(B) (Q) (R) (S) (T) (U) (V)
TOTAL ANSWERING 453 78 124 23 41 84 98Preservation of farming 27.4% 23.1% 29.8% 21.7% 36.6% 28.6% 23.5%
Preservation of established neighborhoods. 30.0% 30.8% 27.4% 13.0% 26.8% 31.0% 37.8%D WS S S
Preservation of natural resources (air, water, soil, forests, etc.)
17.9% 19.2% 19.4% 30.4% 12.2% 15.5% 17.3%
Redevelopment of older shopping centers. 14.8% 11.5% 16.1% 21.7% 14.6% 16.7% 12.2%Diversify businesses in downtown State College. 9.9% 15.4% 7.3% 13.0% 9.8% 8.3% 9.2%
Comparison Groups: ABCD/EFGHIJ/KLMNOP/QRSTUV/WXYZA2B2/EKQW/FLRX/GMSY/HNTZ/IOUA2/JPVB2Independent T-Test for Means (equal variances), Independent Z-Test for PercentagesUpper case letters indicate significance at the 95% level.
Page 17

2011 Centre Region Community Survey Results - Random Sample
5. What is the next (third) most important land use issue?Random sample weighted by relative municipality population
Random
Sample Random
Sample Random
Sample Random
Sample Random
Sample Random
Sample Random
Sample College
Township Ferguson Township
Halfmoon Township
Harris Township
Patton Township
Boro State College
(B) (Q) (R) (S) (T) (U) (V)
TOTAL ANSWERING 449 77 123 23 40 84 97Preservation of established neighborhoods. 26.3% 29.9% 24.4% 39.1% 27.5% 29.8% 20.6%
A2Redevelopment of older shopping centers. 24.1% 28.6% 17.9% 26.1% 25.0% 25.0% 23.7%
Preservation of farming 23.4% 18.2% 26.0% 26.1% 25.0% 25.0% 22.7%Diversify businesses in downtown State College. 14.0% 11.7% 13.8% - 5.0% 16.7% 21.6%
T TPreservation of natural resources (air, water, soil, forests, etc.)
12.2% 11.7% 17.9% 8.7% 17.5% 3.6% 11.3%
U U UComparison Groups: ABCD/EFGHIJ/KLMNOP/QRSTUV/WXYZA2B2/EKQW/FLRX/GMSY/HNTZ/IOUA2/JPVB2Independent T-Test for Means (equal variances), Independent Z-Test for PercentagesUpper case letters indicate significance at the 95% level.
5. And, what is the next (fourth) most important land use issue?Random sample weighted by relative municipality population
Random
Sample Random
Sample Random
Sample Random
Sample Random
Sample Random
Sample Random
Sample College
Township Ferguson Township
Halfmoon Township
Harris Township
Patton Township
Boro State College
(B) (Q) (R) (S) (T) (U) (V)
TOTAL ANSWERING 447 77 121 23 40 84 97Redevelopment of older shopping centers. 25.3% 24.7% 30.6% 43.5% 25.0% 19.0% 21.6%
UDiversify businesses in downtown State College. 23.9% 22.1% 21.5% 21.7% 22.5% 28.6% 26.8%Preservation of established neighborhoods. 21.7% 20.8% 22.3% 30.4% 27.5% 25.0% 13.4%
VPreservation of farming 19.7% 19.5% 15.7% 4.3% 17.5% 19.0% 27.8%
S S S RSPreservation of natural resources (air, water, soil, forests, etc.)
9.4% 13.0% 9.9% - 7.5% 8.3% 10.3%
DComparison Groups: ABCD/EFGHIJ/KLMNOP/QRSTUV/WXYZA2B2/EKQW/FLRX/GMSY/HNTZ/IOUA2/JPVB2Independent T-Test for Means (equal variances), Independent Z-Test for PercentagesUpper case letters indicate significance at the 95% level.
Page 18

2011 Centre Region Community Survey Results - Random Sample
5. LEAST important land use issue:Random sample weighted by relative municipality population
Random
Sample Random
Sample Random
Sample Random
Sample Random
Sample Random
Sample Random
Sample College
Township Ferguson Township
Halfmoon Township
Harris Township
Patton Township
Boro State College
(B) (Q) (R) (S) (T) (U) (V)
TOTAL ANSWERING 447 77 121 23 40 84 97Diversify businesses in downtown State College. 44.1% 44.2% 48.8% 60.9% 55.0% 41.7% 29.9%
V V VRedevelopment of older shopping centers. 25.7% 16.9% 27.3% 8.7% 22.5% 29.8% 34.0%
XS QS QSPreservation of farming 16.6% 23.4% 12.4% 13.0% 15.0% 19.0% 16.5%
Preservation of established neighborhoods. 9.4% 6.5% 10.7% 13.0% 7.5% 7.1% 11.3%Preservation of natural resources (air, water, soil, forests, etc.)
4.3% 9.1% 0.8% 4.3% - 2.4% 8.2%
R RComparison Groups: ABCD/EFGHIJ/KLMNOP/QRSTUV/WXYZA2B2/EKQW/FLRX/GMSY/HNTZ/IOUA2/JPVB2Independent T-Test for Means (equal variances), Independent Z-Test for PercentagesUpper case letters indicate significance at the 95% level.
Page 19
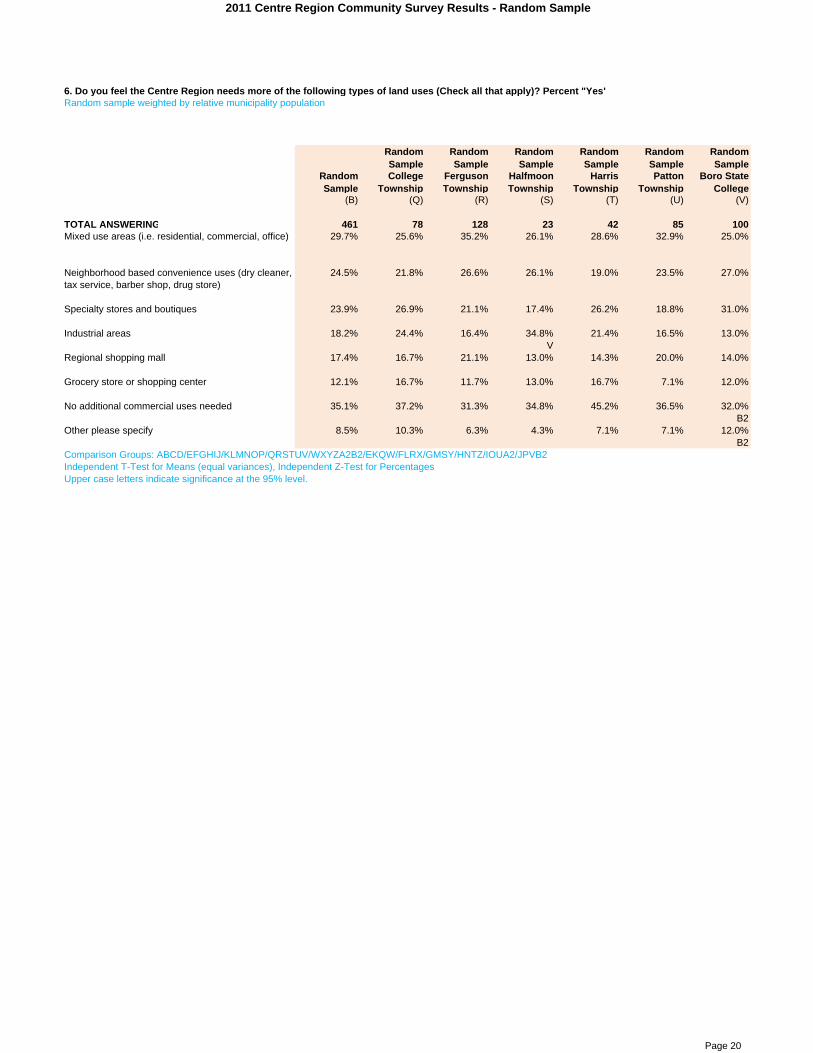
2011 Centre Region Community Survey Results - Random Sample
6. Do you feel the Centre Region needs more of the following types of land uses (Check all that apply)? Percent "Yes"Random sample weighted by relative municipality population
Random
Sample Random
Sample Random
Sample Random
Sample Random
Sample Random
Sample Random
Sample College
Township Ferguson Township
Halfmoon Township
Harris Township
Patton Township
Boro State College
(B) (Q) (R) (S) (T) (U) (V)
TOTAL ANSWERING 461 78 128 23 42 85 100Mixed use areas (i.e. residential, commercial, office) 29.7% 25.6% 35.2% 26.1% 28.6% 32.9% 25.0%
Neighborhood based convenience uses (dry cleaner, tax service, barber shop, drug store)
24.5% 21.8% 26.6% 26.1% 19.0% 23.5% 27.0%
Specialty stores and boutiques 23.9% 26.9% 21.1% 17.4% 26.2% 18.8% 31.0%
Industrial areas 18.2% 24.4% 16.4% 34.8% 21.4% 16.5% 13.0%V
Regional shopping mall 17.4% 16.7% 21.1% 13.0% 14.3% 20.0% 14.0%
Grocery store or shopping center 12.1% 16.7% 11.7% 13.0% 16.7% 7.1% 12.0%
No additional commercial uses needed 35.1% 37.2% 31.3% 34.8% 45.2% 36.5% 32.0%B2
Other please specify 8.5% 10.3% 6.3% 4.3% 7.1% 7.1% 12.0%B2
Comparison Groups: ABCD/EFGHIJ/KLMNOP/QRSTUV/WXYZA2B2/EKQW/FLRX/GMSY/HNTZ/IOUA2/JPVB2Independent T-Test for Means (equal variances), Independent Z-Test for PercentagesUpper case letters indicate significance at the 95% level.
Page 20
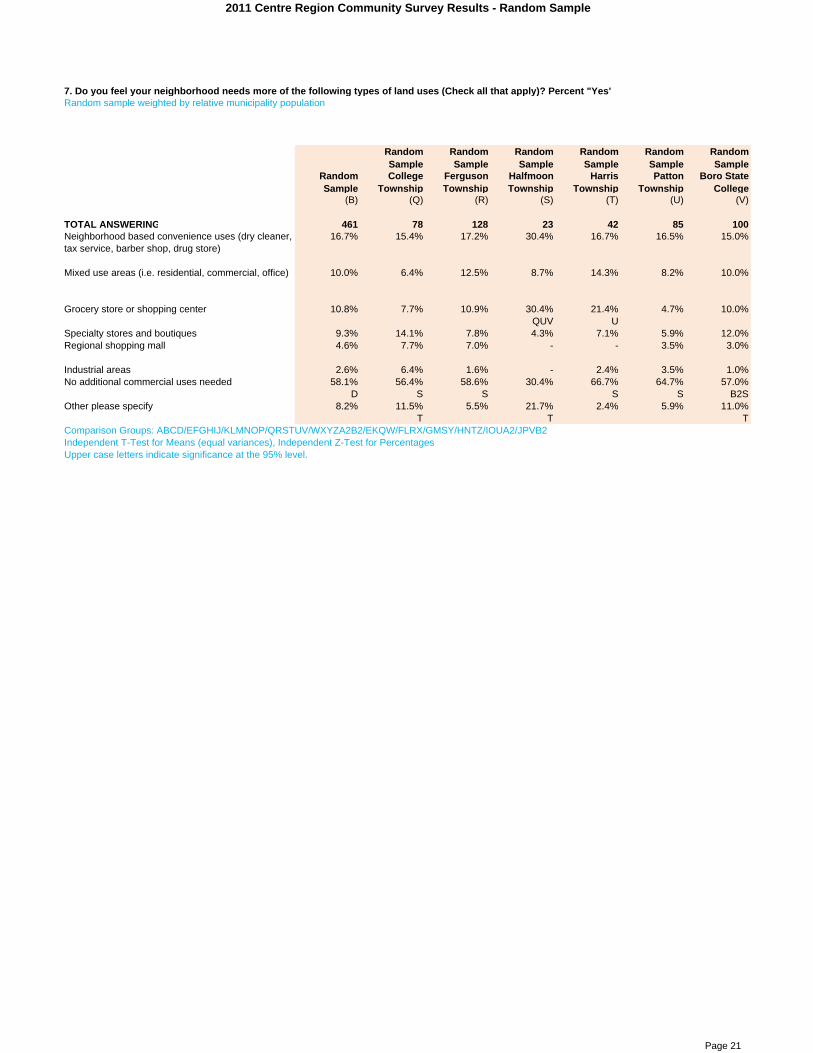
2011 Centre Region Community Survey Results - Random Sample
7. Do you feel your neighborhood needs more of the following types of land uses (Check all that apply)? Percent "Yes"Random sample weighted by relative municipality population
Random
Sample Random
Sample Random
Sample Random
Sample Random
Sample Random
Sample Random
Sample College
Township Ferguson Township
Halfmoon Township
Harris Township
Patton Township
Boro State College
(B) (Q) (R) (S) (T) (U) (V)
TOTAL ANSWERING 461 78 128 23 42 85 100Neighborhood based convenience uses (dry cleaner, tax service, barber shop, drug store)
16.7% 15.4% 17.2% 30.4% 16.7% 16.5% 15.0%
Mixed use areas (i.e. residential, commercial, office) 10.0% 6.4% 12.5% 8.7% 14.3% 8.2% 10.0%
Grocery store or shopping center 10.8% 7.7% 10.9% 30.4% 21.4% 4.7% 10.0%QUV U
Specialty stores and boutiques 9.3% 14.1% 7.8% 4.3% 7.1% 5.9% 12.0%Regional shopping mall 4.6% 7.7% 7.0% - - 3.5% 3.0%
Industrial areas 2.6% 6.4% 1.6% - 2.4% 3.5% 1.0%No additional commercial uses needed 58.1% 56.4% 58.6% 30.4% 66.7% 64.7% 57.0%
D S S S S B2SOther please specify 8.2% 11.5% 5.5% 21.7% 2.4% 5.9% 11.0%
T T TComparison Groups: ABCD/EFGHIJ/KLMNOP/QRSTUV/WXYZA2B2/EKQW/FLRX/GMSY/HNTZ/IOUA2/JPVB2Independent T-Test for Means (equal variances), Independent Z-Test for PercentagesUpper case letters indicate significance at the 95% level.
Page 21

2011 Centre Region Community Survey Results - Random Sample
Attitudes about Housing in the Centre Region
8. How important is it to provide more of the following housing characteristics in the Centre Region? Which is MOST important?Random sample weighted by relative municipality population
Random
Sample Random
Sample Random
Sample Random
Sample Random
Sample Random
Sample Random
Sample College
Township Ferguson Township
Halfmoon Township
Harris Township
Patton Township
Boro State College
(B) (Q) (R) (S) (T) (U) (V)
TOTAL ANSWERING 448 75 123 23 41 84 98Affordable rental or for-sale housing 32.4% 29.3% 35.8% 34.8% 26.8% 34.5% 29.6%
Owner-occupied housing 28.3% 38.7% 26.0% 17.4% 39.0% 17.9% 31.6%WSU SU B2U
Housing that is clustered together to preserve farms and natural areas
16.7% 12.0% 21.1% 21.7% 19.5% 16.7% 11.2%
VHousing located within walking distance of work, shopping, or bus service
15.0% 10.7% 10.6% 4.3% 9.8% 26.2% 19.4%
A2QRST SBetter mix of housing types (single-family detached, townhouse, duplex, apartment)
4.9% 5.3% 4.9% 13.0% 4.9% 3.6% 4.1%
Other (please specify) 2.7% 4.0% 1.6% 8.7% - 1.2% 4.1%Comparison Groups: ABCD/EFGHIJ/KLMNOP/QRSTUV/WXYZA2B2/EKQW/FLRX/GMSY/HNTZ/IOUA2/JPVB2Independent T-Test for Means (equal variances), Independent Z-Test for PercentagesUpper case letters indicate significance at the 95% level.
8. How important is it to provide more of the following housing characteristics in the Centre Region? What's next (second) most important?Random sample weighted by relative municipality population
Random
Sample Random
Sample Random
Sample Random
Sample Random
Sample Random
Sample Random
Sample College
Township Ferguson Township
Halfmoon Township
Harris Township
Patton Township
Boro State College
(B) (Q) (R) (S) (T) (U) (V)
TOTAL ANSWERING 434 70 122 22 40 81 96Housing located within walking distance of work, shopping, or bus service
26.0% 27.1% 24.6% 18.2% 27.5% 25.9% 29.2%
Affordable rental or for-sale housing 20.7% 22.9% 23.8% 22.7% 10.0% 13.6% 24.0%T T
Housing that is clustered together to preserve farms and natural areas
19.4% 14.3% 20.5% 18.2% 17.5% 23.5% 19.8%
A2Owner-occupied housing 18.7% 12.9% 19.7% 27.3% 17.5% 22.2% 16.7%
YBetter mix of housing types (single-family detached, townhouse, duplex, apartment)
13.1% 15.7% 11.5% 9.1% 25.0% 13.6% 9.4%
VOther (please specify) 2.1% 7.1% - 4.5% 2.5% 1.2% 1.0%
Comparison Groups: ABCD/EFGHIJ/KLMNOP/QRSTUV/WXYZA2B2/EKQW/FLRX/GMSY/HNTZ/IOUA2/JPVB2Independent T-Test for Means (equal variances), Independent Z-Test for PercentagesUpper case letters indicate significance at the 95% level.
Page 22

2011 Centre Region Community Survey Results - Random Sample
8. How important is it to provide more of the following housing characteristics in the Centre Region? What's next (third) most important?Random sample weighted by relative municipality population
Random
Sample Random
Sample Random
Sample Random
Sample Random
Sample Random
Sample Random
Sample College
Township Ferguson Township
Halfmoon Township
Harris Township
Patton Township
Boro State College
(B) (Q) (R) (S) (T) (U) (V)
TOTAL ANSWERING 425 65 120 21 40 81 95Housing located within walking distance of work, shopping, or bus service
24.7% 29.2% 25.0% 23.8% 15.0% 24.7% 26.3%
Housing that is clustered together to preserve farms and natural areas
25.4% 24.6% 22.5% 23.8% 40.0% 23.5% 26.3%
D RBetter mix of housing types (single-family detached, townhouse, duplex, apartment)
18.8% 10.8% 27.5% 4.8% 15.0% 18.5% 17.9%
QS S SAffordable rental or for-sale housing 15.5% 15.4% 12.5% 14.3% 20.0% 17.3% 16.8%Owner-occupied housing 14.1% 16.9% 11.7% 33.3% 10.0% 13.6% 11.6%
RTVOther (please specify) 1.4% 3.1% 0.8% - - 2.5% 1.1%
Comparison Groups: ABCD/EFGHIJ/KLMNOP/QRSTUV/WXYZA2B2/EKQW/FLRX/GMSY/HNTZ/IOUA2/JPVB2Independent T-Test for Means (equal variances), Independent Z-Test for PercentagesUpper case letters indicate significance at the 95% level.
8. How important is it to provide more of the following housing characteristics in the Centre Region? What's next (fourth) most important?Random sample weighted by relative municipality population
Random
Sample Random
Sample Random
Sample Random
Sample Random
Sample Random
Sample Random
Sample College
Township Ferguson Township
Halfmoon Township
Harris Township
Patton Township
Boro State College
(B) (Q) (R) (S) (T) (U) (V)
TOTAL ANSWERING 416 64 117 21 39 80 92Better mix of housing types (single-family detached, townhouse, duplex, apartment)
25.7% 34.4% 18.8% 38.1% 25.6% 25.0% 25.0%
R A2Housing located within walking distance of work, shopping, or bus service
19.2% 20.3% 19.7% 19.0% 30.8% 16.3% 16.3%
Housing that is clustered together to preserve farms and natural areas
21.2% 26.6% 23.9% 19.0% 12.8% 16.3% 21.7%
Owner-occupied housing 16.8% 7.8% 21.4% 9.5% 10.3% 21.3% 18.5%XQ Q Q
Affordable rental or for-sale housing 16.3% 9.4% 16.2% 14.3% 17.9% 20.0% 18.5%Other (please specify) 0.7% 1.6% - - 2.6% 1.3% -
Comparison Groups: ABCD/EFGHIJ/KLMNOP/QRSTUV/WXYZA2B2/EKQW/FLRX/GMSY/HNTZ/IOUA2/JPVB2Independent T-Test for Means (equal variances), Independent Z-Test for PercentagesUpper case letters indicate significance at the 95% level.
Page 23
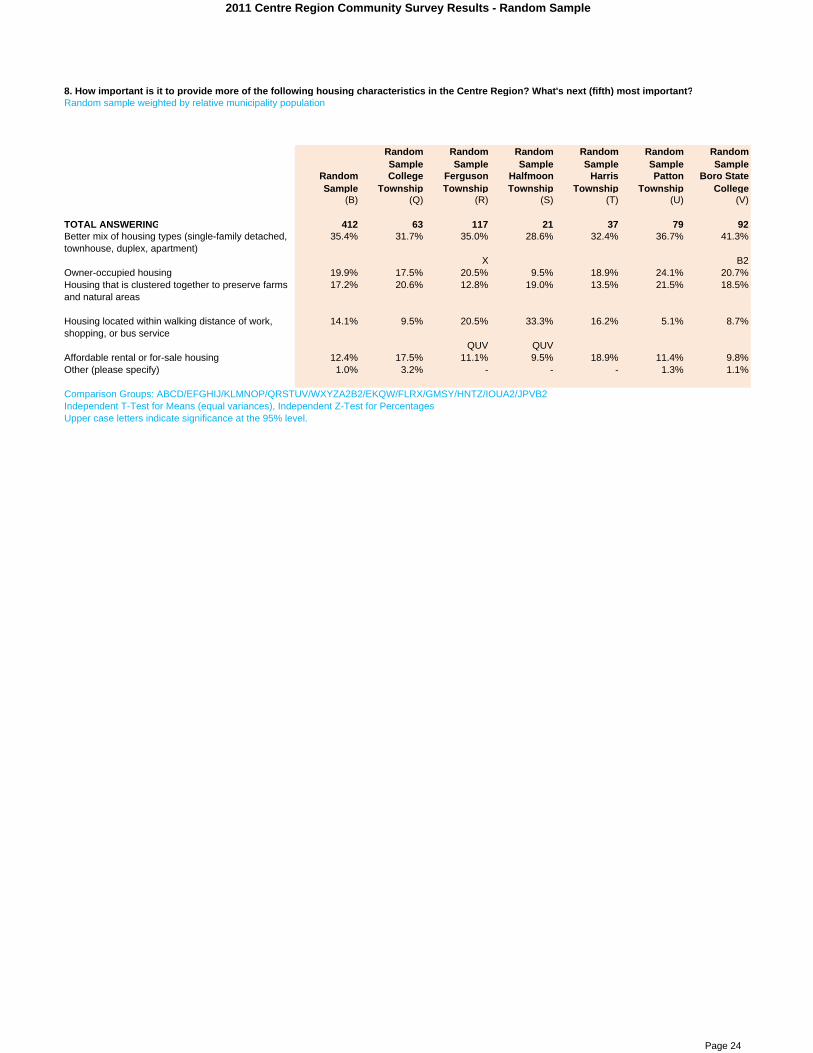
2011 Centre Region Community Survey Results - Random Sample
8. How important is it to provide more of the following housing characteristics in the Centre Region? What's next (fifth) most important?Random sample weighted by relative municipality population
Random
Sample Random
Sample Random
Sample Random
Sample Random
Sample Random
Sample Random
Sample College
Township Ferguson Township
Halfmoon Township
Harris Township
Patton Township
Boro State College
(B) (Q) (R) (S) (T) (U) (V)
TOTAL ANSWERING 412 63 117 21 37 79 92Better mix of housing types (single-family detached, townhouse, duplex, apartment)
35.4% 31.7% 35.0% 28.6% 32.4% 36.7% 41.3%
X B2Owner-occupied housing 19.9% 17.5% 20.5% 9.5% 18.9% 24.1% 20.7%Housing that is clustered together to preserve farms and natural areas
17.2% 20.6% 12.8% 19.0% 13.5% 21.5% 18.5%
Housing located within walking distance of work, shopping, or bus service
14.1% 9.5% 20.5% 33.3% 16.2% 5.1% 8.7%
QUV QUVAffordable rental or for-sale housing 12.4% 17.5% 11.1% 9.5% 18.9% 11.4% 9.8%Other (please specify) 1.0% 3.2% - - - 1.3% 1.1%
Comparison Groups: ABCD/EFGHIJ/KLMNOP/QRSTUV/WXYZA2B2/EKQW/FLRX/GMSY/HNTZ/IOUA2/JPVB2Independent T-Test for Means (equal variances), Independent Z-Test for PercentagesUpper case letters indicate significance at the 95% level.
Page 24

2011 Centre Region Community Survey Results - Random Sample
9. How important is it to increase each of the following housing types in the Centre Region? First, which is MOST important?Random sample weighted by relative municipality population
Random
Sample Random
Sample Random
Sample Random
Sample Random
Sample Random
Sample Random
Sample College
Township Ferguson Township
Halfmoon Township
Harris Township
Patton Township
Boro State College
(B) (Q) (R) (S) (T) (U) (V)
TOTAL ANSWERING 419 67 120 21 41 76 91Single-family detached homes 54.4% 53.7% 53.3% 57.1% 78.0% 56.6% 44.0%
QRUVSenior housing (55+) 20.0% 23.9% 21.7% 28.6% 12.2% 18.4% 18.7%
Condiminiums or townhouses 7.6% 4.5% 8.3% 4.8% 7.3% 9.2% 7.7%Apartment buildings/complexes 8.6% 9.0% 7.5% - 2.4% 5.3% 16.5%
RTUApartments in single-family homes 5.3% 3.0% 5.0% - - 5.3% 11.0%
QDuplexes 2.9% 4.5% 3.3% 4.8% - 2.6% 2.2%Mobile homes 1.2% 1.5% 0.8% 4.8% - 2.6% -Comparison Groups: ABCD/EFGHIJ/KLMNOP/QRSTUV/WXYZA2B2/EKQW/FLRX/GMSY/HNTZ/IOUA2/JPVB2Independent T-Test for Means (equal variances), Independent Z-Test for PercentagesUpper case letters indicate significance at the 95% level.
9. How important is it to increase each of the following housing types in the Centre Region? Of those remaining, which would you say is the second most important?Random sample weighted by relative municipality population
Random
Sample Random
Sample Random
Sample Random
Sample Random
Sample Random
Sample Random
Sample College
Township Ferguson Township
Halfmoon Township
Harris Township
Patton Township
Boro State College
(B) (Q) (R) (S) (T) (U) (V)
TOTAL ANSWERING 406 60 119 20 40 73 91Condiminiums or townhouses 29.3% 35.0% 26.9% 5.0% 37.5% 30.1% 30.8%
D S S ZS S B2SSenior housing (55+) 19.7% 20.0% 21.0% 25.0% 15.0% 23.3% 15.4%Single-family detached homes 14.3% 11.7% 16.0% 15.0% 2.5% 15.1% 18.7%
T T TDuplexes 12.6% 11.7% 11.8% 25.0% 12.5% 8.2% 15.4%
Apartments in single-family homes 12.8% 11.7% 14.3% 20.0% 20.0% 9.6% 9.9%Apartment buildings/complexes 8.9% 6.7% 8.4% 5.0% 10.0% 11.0% 7.7%Mobile homes 2.5% 3.3% 1.7% 5.0% 2.5% 2.7% 2.2%Comparison Groups: ABCD/EFGHIJ/KLMNOP/QRSTUV/WXYZA2B2/EKQW/FLRX/GMSY/HNTZ/IOUA2/JPVB2Independent T-Test for Means (equal variances), Independent Z-Test for PercentagesUpper case letters indicate significance at the 95% level.
Page 25

2011 Centre Region Community Survey Results - Random Sample
9. How important is it to increase each of the following housing types in the Centre Region? Which would you say is the next (third) most important?Random sample weighted by relative municipality population
Random
Sample Random
Sample Random
Sample Random
Sample Random
Sample Random
Sample Random
Sample College
Township Ferguson Township
Halfmoon Township
Harris Township
Patton Township
Boro State College
(B) (Q) (R) (S) (T) (U) (V)
TOTAL ANSWERING 394 57 119 20 38 70 87Condiminiums or townhouses 25.1% 31.6% 22.7% 40.0% 26.3% 20.0% 25.3%Duplexes 24.4% 26.3% 25.2% 5.0% 18.4% 24.3% 29.9%
S S S SSenior housing (55+) 17.0% 12.3% 16.8% 25.0% 23.7% 21.4% 11.5%Apartments in single-family homes 10.7% 10.5% 10.1% 5.0% 13.2% 8.6% 12.6%
Apartment buildings/complexes 10.9% 10.5% 9.2% 10.0% 13.2% 14.3% 10.3%Single-family detached homes 9.4% 5.3% 12.6% 10.0% 2.6% 11.4% 8.0%
TMobile homes 2.5% 3.5% 3.4% 5.0% 2.6% - 2.3%Comparison Groups: ABCD/EFGHIJ/KLMNOP/QRSTUV/WXYZA2B2/EKQW/FLRX/GMSY/HNTZ/IOUA2/JPVB2Independent T-Test for Means (equal variances), Independent Z-Test for PercentagesUpper case letters indicate significance at the 95% level.
9. How important is it to increase each of the following housing types in the Centre Region? Which would you say is the next (fourth) most important?Random sample weighted by relative municipality population
Random
Sample Random
Sample Random
Sample Random
Sample Random
Sample Random
Sample Random
Sample College
Township Ferguson Township
Halfmoon Township
Harris Township
Patton Township
Boro State College
(B) (Q) (R) (S) (T) (U) (V)
TOTAL ANSWERING 388 54 118 20 38 70 85Duplexes 22.4% 25.9% 20.3% 20.0% 21.1% 25.7% 21.2%Condiminiums or townhouses 19.8% 13.0% 19.5% 30.0% 26.3% 22.9% 17.6%
Apartment buildings/complexes 18.6% 20.4% 22.9% 15.0% 21.1% 15.7% 14.1%
Apartments in single-family homes 17.5% 13.0% 22.0% 10.0% 13.2% 17.1% 17.6%X
Senior housing (55+) 8.5% 13.0% 6.8% 10.0% 5.3% 10.0% 8.2%Single-family detached homes 8.2% 9.3% 6.8% - 2.6% 7.1% 14.1%
TMobile homes 4.9% 5.6% 1.7% 15.0% 10.5% 1.4% 7.1%
Comparison Groups: ABCD/EFGHIJ/KLMNOP/QRSTUV/WXYZA2B2/EKQW/FLRX/GMSY/HNTZ/IOUA2/JPVB2Independent T-Test for Means (equal variances), Independent Z-Test for PercentagesUpper case letters indicate significance at the 95% level.
Page 26

2011 Centre Region Community Survey Results - Random Sample
9. How important is it to increase each of the following housing types in the Centre Region? Which would you say is the next (fifth) most important?Random sample weighted by relative municipality population
Random
Sample Random
Sample Random
Sample Random
Sample Random
Sample Random
Sample Random
Sample College
Township Ferguson Township
Halfmoon Township
Harris Township
Patton Township
Boro State College
(B) (Q) (R) (S) (T) (U) (V)
TOTAL ANSWERING 382 53 117 20 37 67 85Apartment buildings/complexes 20.9% 11.3% 21.4% 35.0% 24.3% 23.9% 20.0%
QApartments in single-family homes 19.9% 17.0% 15.4% 20.0% 21.6% 29.9% 20.0%
RDuplexes 18.6% 15.1% 21.4% 15.0% 32.4% 14.9% 14.1%
UV B2Mobile homes 16.0% 28.3% 15.4% 5.0% 8.1% 13.4% 17.6%
STU SSenior housing (55+) 10.2% 11.3% 12.8% - 8.1% 4.5% 14.1%
U UCondiminiums or townhouses 9.4% 5.7% 11.1% 15.0% - 11.9% 8.2%Single-family detached homes 5.0% 11.3% 2.6% 10.0% 5.4% 1.5% 5.9%
UComparison Groups: ABCD/EFGHIJ/KLMNOP/QRSTUV/WXYZA2B2/EKQW/FLRX/GMSY/HNTZ/IOUA2/JPVB2Independent T-Test for Means (equal variances), Independent Z-Test for PercentagesUpper case letters indicate significance at the 95% level.
Page 27
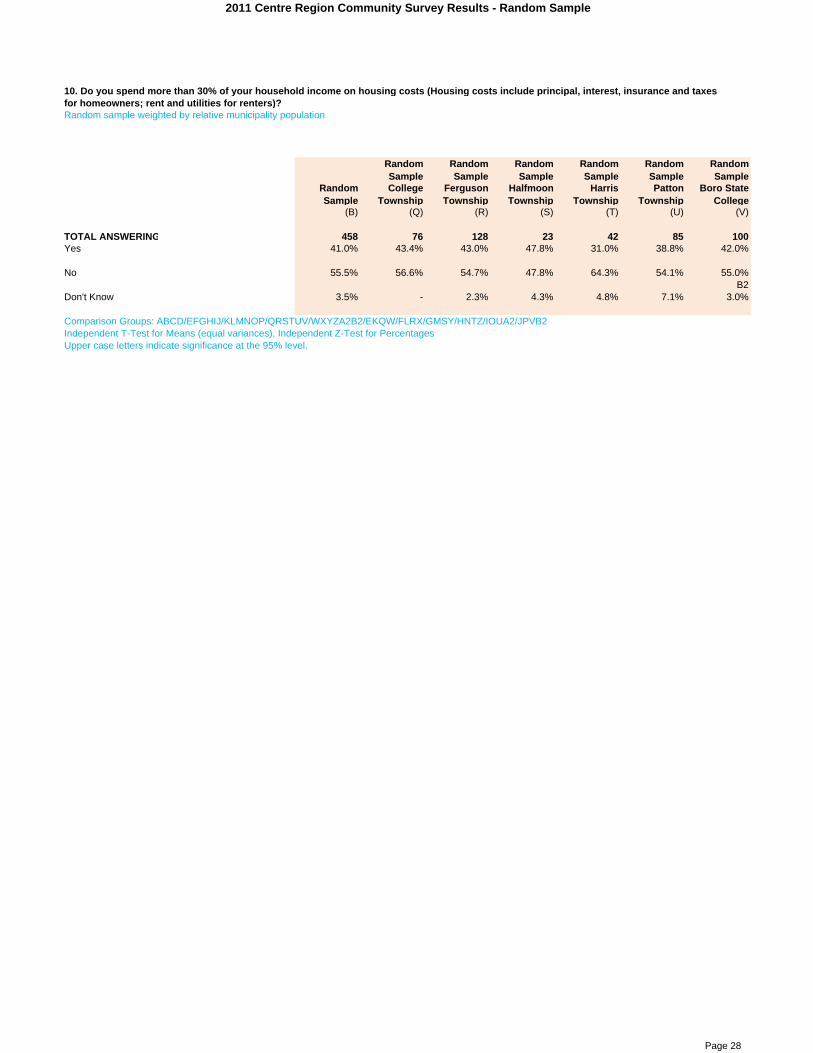
2011 Centre Region Community Survey Results - Random Sample
10. Do you spend more than 30% of your household income on housing costs (Housing costs include principal, interest, insurance and taxes for homeowners; rent and utilities for renters)?Random sample weighted by relative municipality population
Random
Sample Random
Sample Random
Sample Random
Sample Random
Sample Random
Sample Random
Sample College
Township Ferguson Township
Halfmoon Township
Harris Township
Patton Township
Boro State College
(B) (Q) (R) (S) (T) (U) (V)
TOTAL ANSWERING 458 76 128 23 42 85 100Yes 41.0% 43.4% 43.0% 47.8% 31.0% 38.8% 42.0%
No 55.5% 56.6% 54.7% 47.8% 64.3% 54.1% 55.0%B2
Don't Know 3.5% - 2.3% 4.3% 4.8% 7.1% 3.0%
Comparison Groups: ABCD/EFGHIJ/KLMNOP/QRSTUV/WXYZA2B2/EKQW/FLRX/GMSY/HNTZ/IOUA2/JPVB2Independent T-Test for Means (equal variances), Independent Z-Test for PercentagesUpper case letters indicate significance at the 95% level.
Page 28

2011 Centre Region Community Survey Results - Random Sample
11. Do you feel there is enough rental housing available in your price range in the Centre Region?Random sample weighted by relative municipality population
Random
Sample Random
Sample Random
Sample Random
Sample Random
Sample Random
Sample Random
Sample College
Township Ferguson Township
Halfmoon Township
Harris Township
Patton Township
Boro State College
(B) (Q) (R) (S) (T) (U) (V)
TOTAL ANSWERING 454 75 126 23 42 85 100Yes 29.5% 29.3% 29.4% 13.0% 31.0% 34.1% 30.0%
S S SNo 36.8% 37.3% 40.5% 34.8% 38.1% 31.8% 35.0%
Don't Know 33.7% 33.3% 30.2% 52.2% 31.0% 34.1% 35.0%R A2 B2
Comparison Groups: ABCD/EFGHIJ/KLMNOP/QRSTUV/WXYZA2B2/EKQW/FLRX/GMSY/HNTZ/IOUA2/JPVB2Independent T-Test for Means (equal variances), Independent Z-Test for PercentagesUpper case letters indicate significance at the 95% level.
Page 29

2011 Centre Region Community Survey Results - Random Sample
12. Do you feel there are enough homes available for purchase in your price range in the Centre Region?Random sample weighted by relative municipality population
Random
Sample Random
Sample Random
Sample Random
Sample Random
Sample Random
Sample Random
Sample College
Township Ferguson Township
Halfmoon Township
Harris Township
Patton Township
Boro State College
(B) (Q) (R) (S) (T) (U) (V)
TOTAL ANSWERING 454 75 127 23 42 85 99Yes 44.5% 41.3% 51.2% 52.2% 45.2% 42.4% 38.4%
B2No 40.5% 50.7% 37.8% 30.4% 40.5% 38.8% 39.4%
Don't Know 15.0% 8.0% 11.0% 17.4% 14.3% 18.8% 22.2%Q QR
Comparison Groups: ABCD/EFGHIJ/KLMNOP/QRSTUV/WXYZA2B2/EKQW/FLRX/GMSY/HNTZ/IOUA2/JPVB2Independent T-Test for Means (equal variances), Independent Z-Test for PercentagesUpper case letters indicate significance at the 95% level.
Page 30

2011 Centre Region Community Survey Results - Random Sample
Attitudes about Community Services and Facilities
MEAN SUMMARY TABLE
13. Are you satisfied with the public services in the Centre Region? (Ratings: 5=Very Satisfied; 1=Very Dissatisfied)Random sample weighted by relative municipality population
Random
Sample Random
Sample Random
Sample Random
Sample Random
Sample Random
Sample Random
Sample College
Township Ferguson Township
Halfmoon Township
Harris Township
Patton Township
Boro State College
(B) (Q) (R) (S) (T) (U) (V)
TOTAL ANSWERING 459 77 128 23 42 85 100Fire Services 4.3 4.3 4.3 4.0 4.5 4.3 4.4
D S S455 76 126 23 42 84 100
Ambulance Service 4.3 4.3 4.3 4.0 4.3 4.2 4.3D S
455 76 127 23 42 83 100Public Sewer Service 4.2 4.2 4.3 3.4 4.4 4.2 4.4
D WS S S S S415 73 109 13 38 79 99
Public Water Service 4.2 4.2 4.2 4.0 4.4 4.2 4.3W
435 74 118 19 40 80 100Police Services 4.2 4.3 4.3 3.6 4.2 4.2 4.2
S S S S S454 76 127 23 42 84 98
Recycling 4.0 4.0 4.0 4.0 4.1 4.0 4.1W
456 77 127 22 42 85 99Emergency Health Care 4.0 4.0 4.0 3.7 4.0 4.0 4.1
D A2452 75 125 23 42 84 99
Electric Service 4.0 4.0 4.0 4.1 3.7 3.8 4.1D W Y B2T
456 75 127 23 42 85 100High Speed Internet 3.6 3.4 3.7 3.9 3.6 3.5 3.7
440 72 121 22 41 85 95Composting 3.3 3.4 3.3 3.3 3.1 3.1 3.6
D WU RTU411 70 112 18 36 82 89
Cable Service 3.2 3.2 3.2 3.3 3.3 3.1 3.4D B2
445 76 122 21 42 84 96Public WiFi access 3.2 3.1 3.3 3.3 3.2 3.0 3.1
D X414 68 113 19 38 79 93
Comparison Groups: ABCD/EFGHIJ/KLMNOP/QRSTUV/WXYZA2B2/EKQW/FLRX/GMSY/HNTZ/IOUA2/JPVB2Independent T-Test for Means (equal variances), Independent Z-Test for PercentagesUpper case letters indicate significance at the 95% level.
Page 31
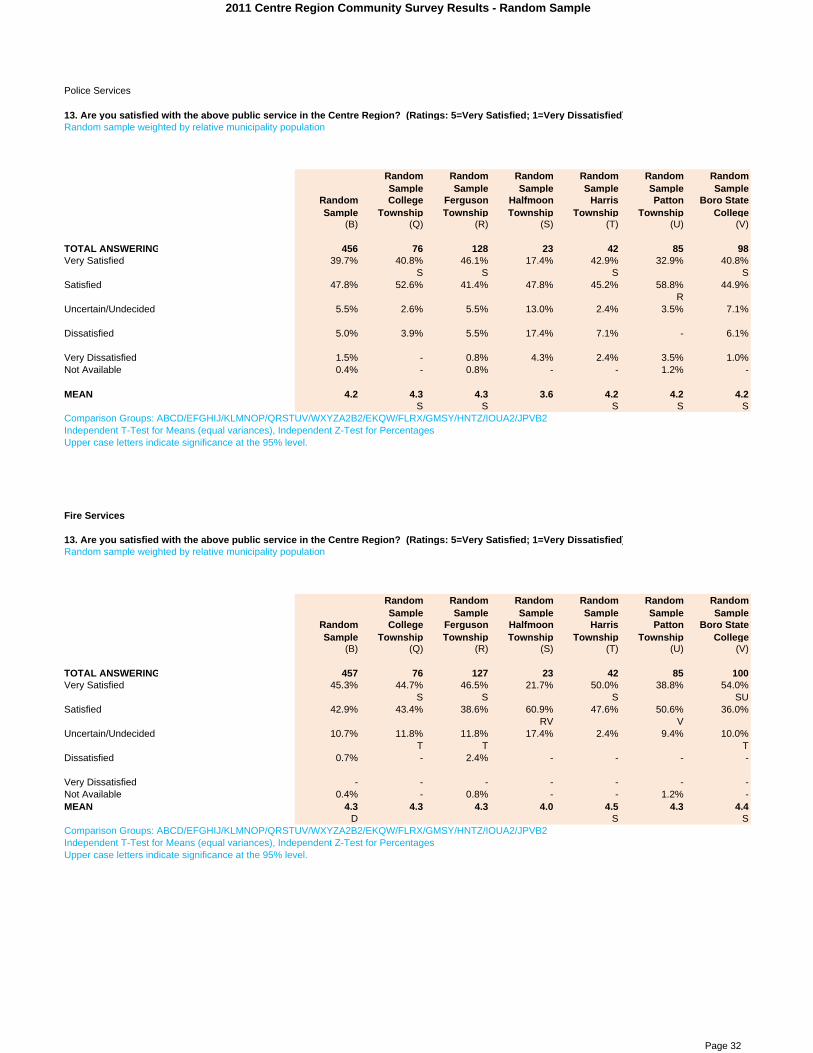
2011 Centre Region Community Survey Results - Random Sample
Police Services
13. Are you satisfied with the above public service in the Centre Region? (Ratings: 5=Very Satisfied; 1=Very Dissatisfied)Random sample weighted by relative municipality population
Random
Sample Random
Sample Random
Sample Random
Sample Random
Sample Random
Sample Random
Sample College
Township Ferguson Township
Halfmoon Township
Harris Township
Patton Township
Boro State College
(B) (Q) (R) (S) (T) (U) (V)
TOTAL ANSWERING 456 76 128 23 42 85 98Very Satisfied 39.7% 40.8% 46.1% 17.4% 42.9% 32.9% 40.8%
S S S SSatisfied 47.8% 52.6% 41.4% 47.8% 45.2% 58.8% 44.9%
RUncertain/Undecided 5.5% 2.6% 5.5% 13.0% 2.4% 3.5% 7.1%
Dissatisfied 5.0% 3.9% 5.5% 17.4% 7.1% - 6.1%
Very Dissatisfied 1.5% - 0.8% 4.3% 2.4% 3.5% 1.0%Not Available 0.4% - 0.8% - - 1.2% -
MEAN 4.2 4.3 4.3 3.6 4.2 4.2 4.2S S S S S
Comparison Groups: ABCD/EFGHIJ/KLMNOP/QRSTUV/WXYZA2B2/EKQW/FLRX/GMSY/HNTZ/IOUA2/JPVB2Independent T-Test for Means (equal variances), Independent Z-Test for PercentagesUpper case letters indicate significance at the 95% level.
Fire Services
13. Are you satisfied with the above public service in the Centre Region? (Ratings: 5=Very Satisfied; 1=Very Dissatisfied)Random sample weighted by relative municipality population
Random
Sample Random
Sample Random
Sample Random
Sample Random
Sample Random
Sample Random
Sample College
Township Ferguson Township
Halfmoon Township
Harris Township
Patton Township
Boro State College
(B) (Q) (R) (S) (T) (U) (V)
TOTAL ANSWERING 457 76 127 23 42 85 100Very Satisfied 45.3% 44.7% 46.5% 21.7% 50.0% 38.8% 54.0%
S S S SUSatisfied 42.9% 43.4% 38.6% 60.9% 47.6% 50.6% 36.0%
RV VUncertain/Undecided 10.7% 11.8% 11.8% 17.4% 2.4% 9.4% 10.0%
T T TDissatisfied 0.7% - 2.4% - - - -
Very Dissatisfied - - - - - - -Not Available 0.4% - 0.8% - - 1.2% -MEAN 4.3 4.3 4.3 4.0 4.5 4.3 4.4
D S SComparison Groups: ABCD/EFGHIJ/KLMNOP/QRSTUV/WXYZA2B2/EKQW/FLRX/GMSY/HNTZ/IOUA2/JPVB2Independent T-Test for Means (equal variances), Independent Z-Test for PercentagesUpper case letters indicate significance at the 95% level.
Page 32

2011 Centre Region Community Survey Results - Random Sample
Ambulance Service
13. Are you satisfied with the above public service in the Centre Region? (Ratings: 5=Very Satisfied; 1=Very Dissatisfied)Random sample weighted by relative municipality population
Random
Sample Random
Sample Random
Sample Random
Sample Random
Sample Random
Sample Random
Sample College
Township Ferguson Township
Halfmoon Township
Harris Township
Patton Township
Boro State College
(B) (Q) (R) (S) (T) (U) (V)
TOTAL ANSWERING 458 76 128 23 42 85 100Very Satisfied 41.0% 42.1% 41.4% 21.7% 42.9% 36.5% 48.0%
S S SSatisfied 45.6% 50.0% 43.0% 60.9% 50.0% 48.2% 38.0%
VUncertain/Undecided 11.8% 7.9% 14.1% 17.4% 4.8% 11.8% 13.0%
TDissatisfied 0.9% - 0.8% - 2.4% 1.2% 1.0%Very Dissatisfied - - - - - - -Not Available 0.7% - 0.8% - - 2.4% -MEAN 4.3 4.3 4.3 4.0 4.3 4.2 4.3
D SComparison Groups: ABCD/EFGHIJ/KLMNOP/QRSTUV/WXYZA2B2/EKQW/FLRX/GMSY/HNTZ/IOUA2/JPVB2Independent T-Test for Means (equal variances), Independent Z-Test for PercentagesUpper case letters indicate significance at the 95% level.
Emergency Health Care
13. Are you satisfied with the above public service in the Centre Region? (Ratings: 5=Very Satisfied; 1=Very Dissatisfied)Random sample weighted by relative municipality population
Random
Sample Random
Sample Random
Sample Random
Sample Random
Sample Random
Sample Random
Sample College
Township Ferguson Township
Halfmoon Township
Harris Township
Patton Township
Boro State College
(B) (Q) (R) (S) (T) (U) (V)
TOTAL ANSWERING 457 76 127 23 42 85 100Very Satisfied 32.6% 30.3% 36.2% 17.4% 33.3% 30.6% 36.0%
D S SSatisfied 44.9% 47.4% 40.2% 56.5% 47.6% 47.1% 42.0%
Uncertain/Undecided 12.5% 13.2% 13.4% 8.7% 7.1% 11.8% 15.0%
Dissatisfied 7.7% 7.9% 7.1% 17.4% 7.1% 7.1% 6.0%Very Dissatisfied 1.3% - 1.6% - 4.8% 2.4% -Not Available 1.1% 1.3% 1.6% - - 1.2% 1.0%MEAN 4.0 4.0 4.0 3.7 4.0 4.0 4.1
D A2Comparison Groups: ABCD/EFGHIJ/KLMNOP/QRSTUV/WXYZA2B2/EKQW/FLRX/GMSY/HNTZ/IOUA2/JPVB2Independent T-Test for Means (equal variances), Independent Z-Test for PercentagesUpper case letters indicate significance at the 95% level.
Page 33
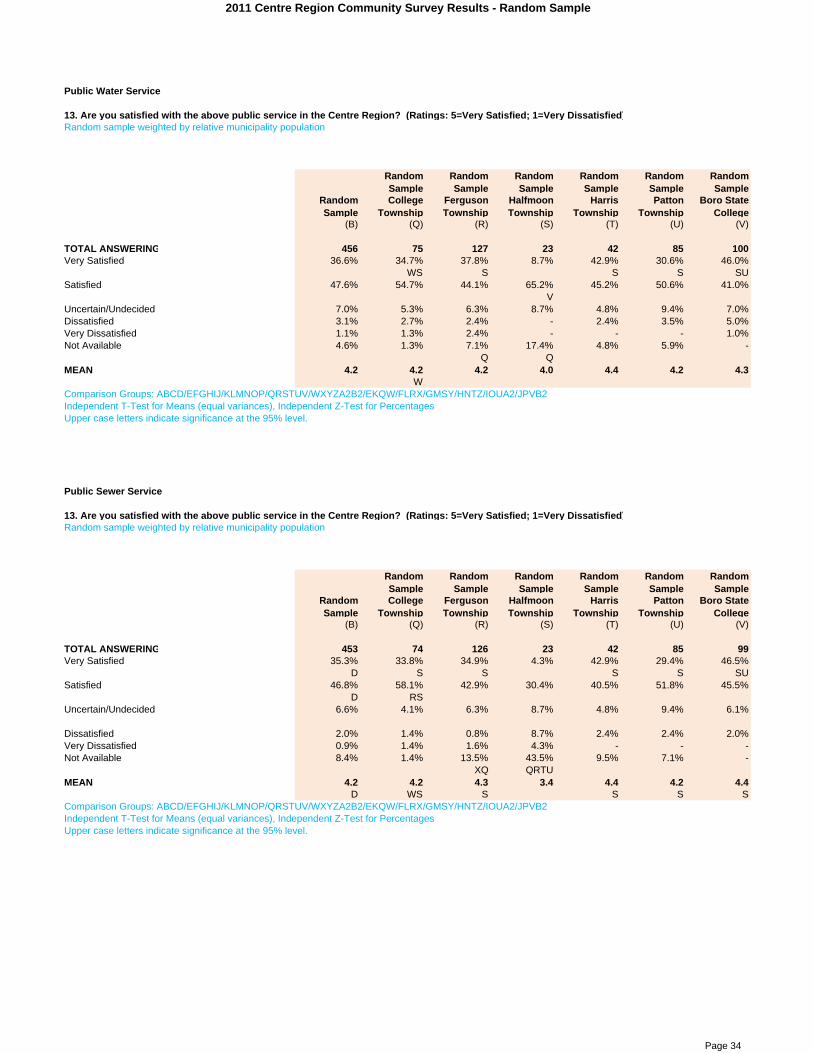
2011 Centre Region Community Survey Results - Random Sample
Public Water Service
13. Are you satisfied with the above public service in the Centre Region? (Ratings: 5=Very Satisfied; 1=Very Dissatisfied)Random sample weighted by relative municipality population
Random
Sample Random
Sample Random
Sample Random
Sample Random
Sample Random
Sample Random
Sample College
Township Ferguson Township
Halfmoon Township
Harris Township
Patton Township
Boro State College
(B) (Q) (R) (S) (T) (U) (V)
TOTAL ANSWERING 456 75 127 23 42 85 100Very Satisfied 36.6% 34.7% 37.8% 8.7% 42.9% 30.6% 46.0%
WS S S S SUSatisfied 47.6% 54.7% 44.1% 65.2% 45.2% 50.6% 41.0%
VUncertain/Undecided 7.0% 5.3% 6.3% 8.7% 4.8% 9.4% 7.0%Dissatisfied 3.1% 2.7% 2.4% - 2.4% 3.5% 5.0%Very Dissatisfied 1.1% 1.3% 2.4% - - - 1.0%Not Available 4.6% 1.3% 7.1% 17.4% 4.8% 5.9% -
Q QMEAN 4.2 4.2 4.2 4.0 4.4 4.2 4.3
WComparison Groups: ABCD/EFGHIJ/KLMNOP/QRSTUV/WXYZA2B2/EKQW/FLRX/GMSY/HNTZ/IOUA2/JPVB2Independent T-Test for Means (equal variances), Independent Z-Test for PercentagesUpper case letters indicate significance at the 95% level.
Public Sewer Service
13. Are you satisfied with the above public service in the Centre Region? (Ratings: 5=Very Satisfied; 1=Very Dissatisfied)Random sample weighted by relative municipality population
Random
Sample Random
Sample Random
Sample Random
Sample Random
Sample Random
Sample Random
Sample College
Township Ferguson Township
Halfmoon Township
Harris Township
Patton Township
Boro State College
(B) (Q) (R) (S) (T) (U) (V)
TOTAL ANSWERING 453 74 126 23 42 85 99Very Satisfied 35.3% 33.8% 34.9% 4.3% 42.9% 29.4% 46.5%
D S S S S SUSatisfied 46.8% 58.1% 42.9% 30.4% 40.5% 51.8% 45.5%
D RSUncertain/Undecided 6.6% 4.1% 6.3% 8.7% 4.8% 9.4% 6.1%
Dissatisfied 2.0% 1.4% 0.8% 8.7% 2.4% 2.4% 2.0%Very Dissatisfied 0.9% 1.4% 1.6% 4.3% - - -Not Available 8.4% 1.4% 13.5% 43.5% 9.5% 7.1% -
XQ QRTUMEAN 4.2 4.2 4.3 3.4 4.4 4.2 4.4
D WS S S S SComparison Groups: ABCD/EFGHIJ/KLMNOP/QRSTUV/WXYZA2B2/EKQW/FLRX/GMSY/HNTZ/IOUA2/JPVB2Independent T-Test for Means (equal variances), Independent Z-Test for PercentagesUpper case letters indicate significance at the 95% level.
Page 34

2011 Centre Region Community Survey Results - Random Sample
Recycling
13. Are you satisfied with the above public service in the Centre Region? (Ratings: 5=Very Satisfied; 1=Very Dissatisfied)Random sample weighted by relative municipality population
Random
Sample Random
Sample Random
Sample Random
Sample Random
Sample Random
Sample Random
Sample College
Township Ferguson Township
Halfmoon Township
Harris Township
Patton Township
Boro State College
(B) (Q) (R) (S) (T) (U) (V)
TOTAL ANSWERING 458 77 128 23 42 85 99Very Satisfied 33.6% 28.6% 33.6% 21.7% 38.1% 36.5% 37.4%
Satisfied 48.3% 58.4% 44.5% 60.9% 47.6% 43.5% 47.5%
Uncertain/Undecided 5.9% 5.2% 9.4% 8.7% 4.8% 3.5% 3.0%V
Dissatisfied 8.5% 1.3% 8.6% 4.3% 9.5% 14.1% 8.1%Q Q Q
Very Dissatisfied 3.3% 6.5% 3.1% - - 2.4% 4.0%Not Available 0.4% - 0.8% 4.3% - - -MEAN 4.0 4.0 4.0 4.0 4.1 4.0 4.1
WComparison Groups: ABCD/EFGHIJ/KLMNOP/QRSTUV/WXYZA2B2/EKQW/FLRX/GMSY/HNTZ/IOUA2/JPVB2Independent T-Test for Means (equal variances), Independent Z-Test for PercentagesUpper case letters indicate significance at the 95% level.
High Speed Internet
13. Are you satisfied with the above public service in the Centre Region? (Ratings: 5=Very Satisfied; 1=Very Dissatisfied)Random sample weighted by relative municipality population
Random
Sample Random
Sample Random
Sample Random
Sample Random
Sample Random
Sample Random
Sample College
Township Ferguson Township
Halfmoon Township
Harris Township
Patton Township
Boro State College
(B) (Q) (R) (S) (T) (U) (V)
TOTAL ANSWERING 449 74 125 22 42 85 97Very Satisfied 18.5% 17.6% 24.0% 13.6% 19.0% 10.6% 19.6%
XUSatisfied 48.1% 40.5% 44.8% 72.7% 45.2% 56.5% 46.4%
QRTV QUncertain/Undecided 12.0% 12.2% 9.6% 4.5% 14.3% 11.8% 15.5%Dissatisfied 14.5% 17.6% 15.2% 4.5% 14.3% 16.5% 12.4%
S SVery Dissatisfied 4.9% 9.5% 3.2% 4.5% 4.8% 4.7% 4.1%Not Available 2.0% 2.7% 3.2% - 2.4% - 2.1%MEAN 3.6 3.4 3.7 3.9 3.6 3.5 3.7Comparison Groups: ABCD/EFGHIJ/KLMNOP/QRSTUV/WXYZA2B2/EKQW/FLRX/GMSY/HNTZ/IOUA2/JPVB2Independent T-Test for Means (equal variances), Independent Z-Test for PercentagesUpper case letters indicate significance at the 95% level.
Page 35

2011 Centre Region Community Survey Results - Random Sample
Public WiFi access
13. Are you satisfied with the above public service in the Centre Region? (Ratings: 5=Very Satisfied; 1=Very Dissatisfied)Random sample weighted by relative municipality population
Random
Sample Random
Sample Random
Sample Random
Sample Random
Sample Random
Sample Random
Sample College
Township Ferguson Township
Halfmoon Township
Harris Township
Patton Township
Boro State College
(B) (Q) (R) (S) (T) (U) (V)
TOTAL ANSWERING 448 73 125 23 42 85 96Very Satisfied 8.0% 11.0% 12.0% 4.3% 2.4% 4.7% 7.3%
T TUSatisfied 24.6% 21.9% 22.4% 21.7% 31.0% 23.5% 28.1%Uncertain/Undecided 37.7% 34.2% 37.6% 47.8% 40.5% 38.8% 36.5%
D A2Dissatisfied 17.9% 19.2% 16.0% 8.7% 11.9% 21.2% 19.8%Very Dissatisfied 4.2% 6.8% 2.4% - 4.8% 4.7% 5.2%
Not Available 7.6% 6.8% 9.6% 17.4% 9.5% 7.1% 3.1%V
MEAN 3.2 3.1 3.3 3.3 3.2 3.0 3.1D X
Comparison Groups: ABCD/EFGHIJ/KLMNOP/QRSTUV/WXYZA2B2/EKQW/FLRX/GMSY/HNTZ/IOUA2/JPVB2Independent T-Test for Means (equal variances), Independent Z-Test for PercentagesUpper case letters indicate significance at the 95% level.
Cable Service
13. Are you satisfied with the above public service in the Centre Region? (Ratings: 5=Very Satisfied; 1=Very Dissatisfied)Random sample weighted by relative municipality population
Random
Sample Random
Sample Random
Sample Random
Sample Random
Sample Random
Sample Random
Sample College
Township Ferguson Township
Halfmoon Township
Harris Township
Patton Township
Boro State College
(B) (Q) (R) (S) (T) (U) (V)
TOTAL ANSWERING 453 76 126 23 42 85 97Very Satisfied 12.8% 17.1% 15.9% 8.7% 7.1% 5.9% 14.4%
D U XUSatisfied 41.3% 38.2% 34.1% 47.8% 52.4% 47.1% 42.3%
RUncertain/Undecided 12.8% 9.2% 11.1% 8.7% 11.9% 14.1% 18.6%
Dissatisfied 20.3% 18.4% 26.2% 13.0% 16.7% 18.8% 17.5%Very Dissatisfied 11.0% 17.1% 9.5% 13.0% 11.9% 12.9% 6.2%
VNot Available 1.8% - 3.2% 8.7% - 1.2% 1.0%
MEAN 3.2 3.2 3.2 3.3 3.3 3.1 3.4D B2
Comparison Groups: ABCD/EFGHIJ/KLMNOP/QRSTUV/WXYZA2B2/EKQW/FLRX/GMSY/HNTZ/IOUA2/JPVB2Independent T-Test for Means (equal variances), Independent Z-Test for PercentagesUpper case letters indicate significance at the 95% level.
Page 36

2011 Centre Region Community Survey Results - Random Sample
Electric Service
13. Are you satisfied with the above public service in the Centre Region? (Ratings: 5=Very Satisfied; 1=Very Dissatisfied)Random sample weighted by relative municipality population
Random
Sample Random
Sample Random
Sample Random
Sample Random
Sample Random
Sample Random
Sample College
Township Ferguson Township
Halfmoon Township
Harris Township
Patton Township
Boro State College
(B) (Q) (R) (S) (T) (U) (V)
TOTAL ANSWERING 456 75 127 23 42 85 100Very Satisfied 25.4% 25.3% 29.9% 13.0% 14.3% 23.5% 29.0%
D ST B2TSatisfied 56.8% 57.3% 52.8% 82.6% 59.5% 56.5% 55.0%
QRTUVUncertain/Undecided 8.8% 12.0% 7.9% 4.3% 11.9% 4.7% 10.0%
Dissatisfied 7.0% 4.0% 7.9% - 9.5% 11.8% 5.0%Very Dissatisfied 2.0% 1.3% 1.6% - 4.8% 3.5% 1.0%MEAN 4.0 4.0 4.0 4.1 3.7 3.8 4.1
D W Y B2TComparison Groups: ABCD/EFGHIJ/KLMNOP/QRSTUV/WXYZA2B2/EKQW/FLRX/GMSY/HNTZ/IOUA2/JPVB2Independent T-Test for Means (equal variances), Independent Z-Test for PercentagesUpper case letters indicate significance at the 95% level.
Composting
13. Are you satisfied with the above public service in the Centre Region? (Ratings: 5=Very Satisfied; 1=Very Dissatisfied)Random sample weighted by relative municipality population
Random
Sample Random
Sample Random
Sample Random
Sample Random
Sample Random
Sample Random
Sample College
Township Ferguson Township
Halfmoon Township
Harris Township
Patton Township
Boro State College
(B) (Q) (R) (S) (T) (U) (V)
TOTAL ANSWERING 451 74 124 23 42 85 99Very Satisfied 11.8% 10.8% 12.9% 8.7% 7.1% 5.9% 19.2%
TUSatisfied 24.2% 29.7% 20.2% 17.4% 23.8% 21.2% 28.3%Uncertain/Undecided 40.1% 41.9% 39.5% 43.5% 33.3% 52.9% 30.3%
D Y A2TVDissatisfied 10.9% 10.8% 12.9% 8.7% 14.3% 8.2% 10.1%
Very Dissatisfied 4.2% 1.4% 4.8% - 7.1% 8.2% 2.0%Q
Not Available 8.9% 5.4% 9.7% 21.7% 14.3% 3.5% 10.1%U
MEAN 3.3 3.4 3.3 3.3 3.1 3.1 3.6D WU RTU
Comparison Groups: ABCD/EFGHIJ/KLMNOP/QRSTUV/WXYZA2B2/EKQW/FLRX/GMSY/HNTZ/IOUA2/JPVB2Independent T-Test for Means (equal variances), Independent Z-Test for PercentagesUpper case letters indicate significance at the 95% level.
14. This question required a write-in response.
Page 37
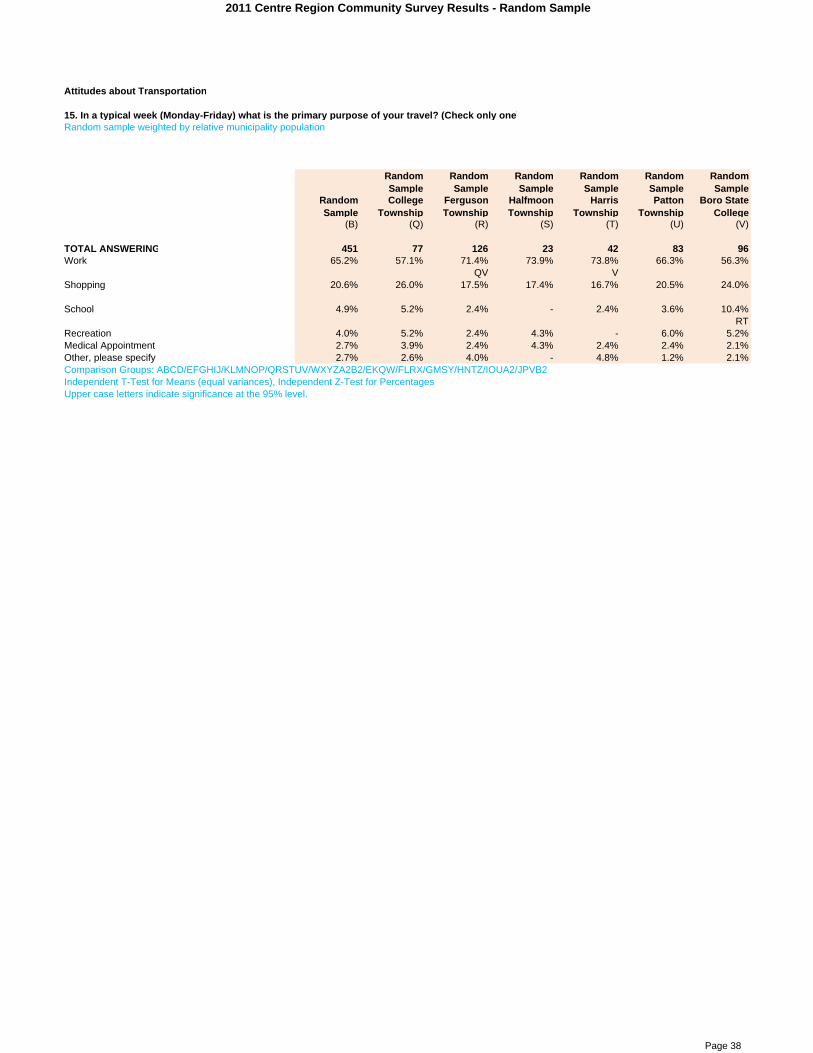
2011 Centre Region Community Survey Results - Random Sample
Attitudes about Transportation
15. In a typical week (Monday-Friday) what is the primary purpose of your travel? (Check only one)Random sample weighted by relative municipality population
Random
Sample Random
Sample Random
Sample Random
Sample Random
Sample Random
Sample Random
Sample College
Township Ferguson Township
Halfmoon Township
Harris Township
Patton Township
Boro State College
(B) (Q) (R) (S) (T) (U) (V)
TOTAL ANSWERING 451 77 126 23 42 83 96Work 65.2% 57.1% 71.4% 73.9% 73.8% 66.3% 56.3%
QV VShopping 20.6% 26.0% 17.5% 17.4% 16.7% 20.5% 24.0%
School 4.9% 5.2% 2.4% - 2.4% 3.6% 10.4%RT
Recreation 4.0% 5.2% 2.4% 4.3% - 6.0% 5.2%Medical Appointment 2.7% 3.9% 2.4% 4.3% 2.4% 2.4% 2.1%Other, please specify 2.7% 2.6% 4.0% - 4.8% 1.2% 2.1%Comparison Groups: ABCD/EFGHIJ/KLMNOP/QRSTUV/WXYZA2B2/EKQW/FLRX/GMSY/HNTZ/IOUA2/JPVB2Independent T-Test for Means (equal variances), Independent Z-Test for PercentagesUpper case letters indicate significance at the 95% level.
Page 38

2011 Centre Region Community Survey Results - Random Sample
16. What is the main mode of travel for your primary trip? (Check only one)Random sample weighted by relative municipality population
Random
Sample Random
Sample Random
Sample Random
Sample Random
Sample Random
Sample Random
Sample College
Township Ferguson Township
Halfmoon Township
Harris Township
Patton Township
Boro State College
(B) (Q) (R) (S) (T) (U) (V)
TOTAL ANSWERING 453 78 127 22 42 82 98Automobile/truck/minivan/etc. 84.8% 85.9% 89.8% 100.0% 97.6% 93.9% 61.2%
V V GYQRUV QRV VPublic transportation 5.5% 6.4% 3.1% - - 6.1% 10.2%
RWalk 5.1% 3.8% 2.4% - - - 17.3%
QRBicycle 2.9% 2.6% 0.8% - 2.4% - 9.2%
RCarpool/vanpool 0.9% 1.3% 2.4% - - - -Motorcycle/scooter 0.7% - 1.6% - - - 1.0%Taxi 0.2% - - - - - 1.0%Comparison Groups: ABCD/EFGHIJ/KLMNOP/QRSTUV/WXYZA2B2/EKQW/FLRX/GMSY/HNTZ/IOUA2/JPVB2Independent T-Test for Means (equal variances), Independent Z-Test for PercentagesUpper case letters indicate significance at the 95% level.
Page 39

2011 Centre Region Community Survey Results - Random Sample
17. How frequently do you use public transportation? (Check only one)Random sample weighted by relative municipality population
Random
Sample Random
Sample Random
Sample Random
Sample Random
Sample Random
Sample Random
Sample College
Township Ferguson Township
Halfmoon Township
Harris Township
Patton Township
Boro State College
(B) (Q) (R) (S) (T) (U) (V)
TOTAL ANSWERING 458 78 127 23 42 85 99Daily 3.5% 3.8% 1.6% - - 4.7% 7.1%
RFrequently (several times a week) 6.1% 7.7% 2.4% 4.3% - 7.1% 11.1%
ROccasionally (several times a month) 10.0% 7.7% 7.9% 4.3% 4.8% 12.9% 16.2%
STRarely (few times a year) 35.8% 32.1% 38.6% 34.8% 31.0% 35.3% 37.4%
Never 44.5% 48.7% 49.6% 56.5% 64.3% 40.0% 28.3%V V V UV
Comparison Groups: ABCD/EFGHIJ/KLMNOP/QRSTUV/WXYZA2B2/EKQW/FLRX/GMSY/HNTZ/IOUA2/JPVB2Independent T-Test for Means (equal variances), Independent Z-Test for PercentagesUpper case letters indicate significance at the 95% level.
Page 40

2011 Centre Region Community Survey Results - Random Sample
18. Which do you use the most? (Check only one)Random sample weighted by relative municipality population
Random
Sample Random
Sample Random
Sample Random
Sample Random
Sample Random
Sample Random
Sample College
Township Ferguson Township
Halfmoon Township
Harris Township
Patton Township
Boro State College
(B) (Q) (R) (S) (T) (U) (V)
TOTAL ANSWERING 242 38 61 9 13 51 68CATABus 70.7% 71.1% 68.9% 77.8% 84.6% 84.3% 60.3%
V A2RVCampus Loop/Link 23.1% 13.2% 23.0% 22.2% 15.4% 13.7% 35.3%
QUCentre County Office of Transportation Services van/bus
1.7% 5.3% 1.6% - - - 1.5%
CATARide 1.2% 2.6% 1.6% - - - 1.5%Other, please specify 3.3% 7.9% 4.9% - - 2.0% 1.5%Comparison Groups: ABCD/EFGHIJ/KLMNOP/QRSTUV/WXYZA2B2/EKQW/FLRX/GMSY/HNTZ/IOUA2/JPVB2Independent T-Test for Means (equal variances), Independent Z-Test for PercentagesUpper case letters indicate significance at the 95% level.
Page 41

2011 Centre Region Community Survey Results - Random Sample
19. Which of the following factors would encourage you to use public transportation more frequently? First, which is MOST important?Random sample weighted by relative municipality population
Random
Sample Random
Sample Random
Sample Random
Sample Random
Sample Random
Sample Random
Sample College
Township Ferguson Township
Halfmoon Township
Harris Township
Patton Township
Boro State College
(B) (Q) (R) (S) (T) (U) (V)
TOTAL ANSWERING 404 66 109 22 39 77 87Increase in frequency of departures from bus stops 23.5% 9.1% 21.1% 27.3% 33.3% 32.5% 24.1%
Q ZQ Q QMore direct bus route between my home and destination
17.1% 12.1% 15.6% 22.7% 25.6% 16.9% 17.2%
A bus stop closer to my home 12.6% 25.8% 13.8% 9.1% 5.1% 6.5% 10.3%STUV X
Service to my neighborhood 11.9% 25.8% 11.9% 4.5% 17.9% 6.5% 5.7%RSUV
Reduce cost of bus fare or bus pass 11.1% 10.6% 9.2% 13.6% 10.3% 7.8% 16.1%Expanded hours of operation 8.2% 4.5% 11.0% 4.5% - 13.0% 8.0%A bus stop closer to my destination 3.7% 3.0% 6.4% - 2.6% 2.6% 3.4%Other, please specify 11.9% 9.1% 11.0% 18.2% 5.1% 14.3% 14.9%
Comparison Groups: ABCD/EFGHIJ/KLMNOP/QRSTUV/WXYZA2B2/EKQW/FLRX/GMSY/HNTZ/IOUA2/JPVB2Independent T-Test for Means (equal variances), Independent Z-Test for PercentagesUpper case letters indicate significance at the 95% level.
19. Of those remaining, what would be the next (second) most desirable factor that would encourage you to use public transportation more?Random sample weighted by relative municipality population
Random
Sample Random
Sample Random
Sample Random
Sample Random
Sample Random
Sample Random
Sample College
Township Ferguson Township
Halfmoon Township
Harris Township
Patton Township
Boro State College
(B) (Q) (R) (S) (T) (U) (V)
TOTAL ANSWERING 340 56 90 17 37 64 73Increase in frequency of departures from bus stops 23.2% 16.1% 24.4% 17.6% 13.5% 26.6% 31.5%
QTMore direct bus route between my home and destination
18.5% 16.1% 22.2% 5.9% 13.5% 21.9% 17.8%
S SExpanded hours of operation 14.7% 7.1% 11.1% 23.5% 18.9% 17.2% 19.2%
QA bus stop closer to my destination 10.9% 14.3% 8.9% 17.6% 16.2% 7.8% 8.2%Reduce cost of bus fare or bus pass 9.7% 10.7% 11.1% 5.9% 5.4% 10.9% 9.6%A bus stop closer to my home 10.6% 21.4% 12.2% 5.9% 16.2% 4.7% 4.1%
D SUVService to my neighborhood 9.1% 10.7% 8.9% 23.5% 8.1% 4.7% 8.2%Other, please specify 3.2% 3.6% 1.1% - 8.1% 6.3% 1.4%
Comparison Groups: ABCD/EFGHIJ/KLMNOP/QRSTUV/WXYZA2B2/EKQW/FLRX/GMSY/HNTZ/IOUA2/JPVB2Independent T-Test for Means (equal variances), Independent Z-Test for PercentagesUpper case letters indicate significance at the 95% level.
Page 42

2011 Centre Region Community Survey Results - Random Sample
19. What would be the next (third) most desirable factor to encourage you to use public transportation more often?Random sample weighted by relative municipality population
Random
Sample Random
Sample Random
Sample Random
Sample Random
Sample Random
Sample Random
Sample College
Township Ferguson Township
Halfmoon Township
Harris Township
Patton Township
Boro State College
(B) (Q) (R) (S) (T) (U) (V)
TOTAL ANSWERING 308 51 83 15 33 60 63More direct bus route between my home and destination
19.8% 17.6% 21.7% 26.7% 18.2% 23.3% 15.9%
Increase in frequency of departures from bus stops 16.9% 21.6% 20.5% 6.7% 12.1% 8.3% 19.0%
UExpanded hours of operation 15.3% 15.7% 10.8% 6.7% 27.3% 11.7% 20.6%
SReduce cost of bus fare or bus pass 14.0% 11.8% 8.4% 6.7% 15.2% 21.7% 15.9%
D RA bus stop closer to my destination 12.3% 11.8% 14.5% 13.3% 9.1% 15.0% 9.5%A bus stop closer to my home 9.7% 7.8% 9.6% 20.0% 12.1% 8.3% 9.5%Service to my neighborhood 8.8% 9.8% 13.3% 13.3% 3.0% 5.0% 7.9%
TOther, please specify 3.2% 3.9% 1.2% 6.7% 3.0% 6.7% 1.6%
Comparison Groups: ABCD/EFGHIJ/KLMNOP/QRSTUV/WXYZA2B2/EKQW/FLRX/GMSY/HNTZ/IOUA2/JPVB2Independent T-Test for Means (equal variances), Independent Z-Test for PercentagesUpper case letters indicate significance at the 95% level.
19. And what would be the next (fourth) most desirable factor to encourage you to use public transportation more often?Random sample weighted by relative municipality population
Random
Sample Random
Sample Random
Sample Random
Sample Random
Sample Random
Sample Random
Sample College
Township Ferguson Township
Halfmoon Township
Harris Township
Patton Township
Boro State College
(B) (Q) (R) (S) (T) (U) (V)
TOTAL ANSWERING 278 47 75 14 31 55 53A bus stop closer to my destination 18.7% 10.6% 21.3% 21.4% 22.6% 25.5% 13.2%
QExpanded hours of operation 18.7% 25.5% 17.3% 7.1% 9.7% 18.2% 20.8%
SMore direct bus route between my home and destination
19.8% 23.4% 16.0% - 32.3% 18.2% 22.6%
Reduce cost of bus fare or bus pass 12.9% 6.4% 17.3% 21.4% 9.7% 9.1% 17.0%Increase in frequency of departures from bus stops 12.9% 19.1% 9.3% 28.6% 12.9% 10.9% 11.3%
A bus stop closer to my home 9.0% 8.5% 10.7% 21.4% 3.2% 5.5% 11.3%Service to my neighborhood 5.0% 4.3% 6.7% - 6.5% 5.5% 3.8%Other, please specify 2.9% 2.1% 1.3% - 3.2% 7.3% -
Comparison Groups: ABCD/EFGHIJ/KLMNOP/QRSTUV/WXYZA2B2/EKQW/FLRX/GMSY/HNTZ/IOUA2/JPVB2Independent T-Test for Means (equal variances), Independent Z-Test for PercentagesUpper case letters indicate significance at the 95% level.
Page 43
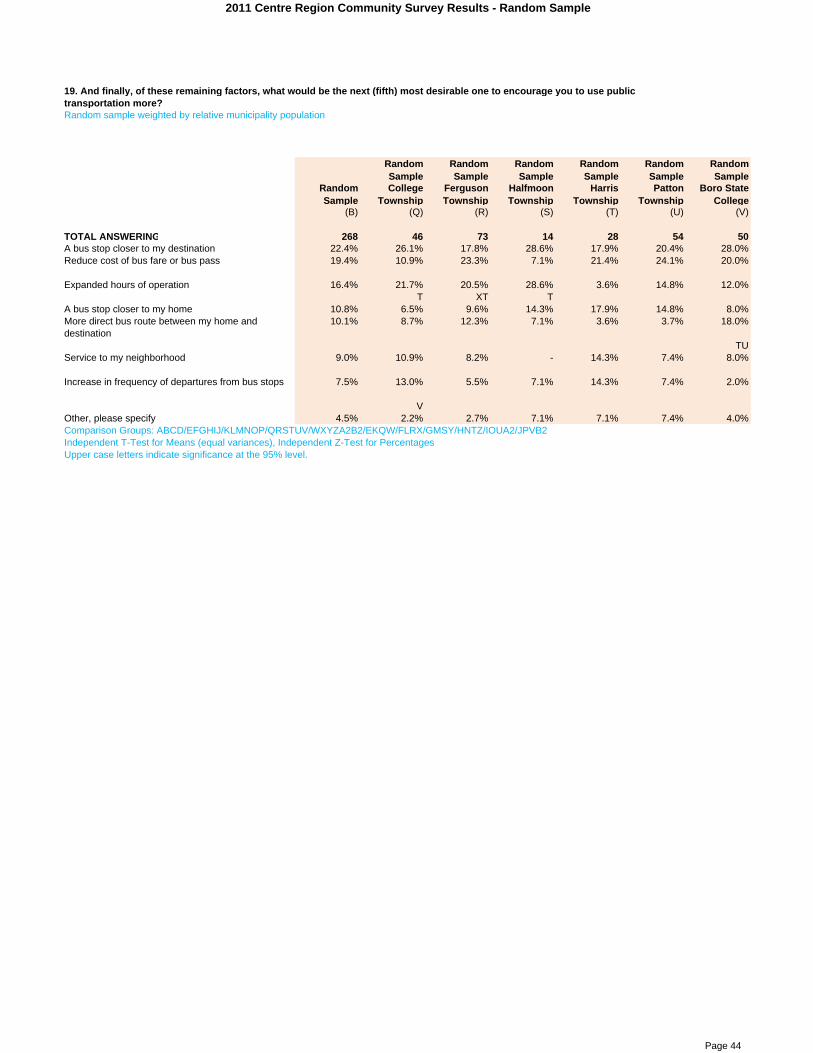
2011 Centre Region Community Survey Results - Random Sample
19. And finally, of these remaining factors, what would be the next (fifth) most desirable one to encourage you to use public transportation more?Random sample weighted by relative municipality population
Random
Sample Random
Sample Random
Sample Random
Sample Random
Sample Random
Sample Random
Sample College
Township Ferguson Township
Halfmoon Township
Harris Township
Patton Township
Boro State College
(B) (Q) (R) (S) (T) (U) (V)
TOTAL ANSWERING 268 46 73 14 28 54 50A bus stop closer to my destination 22.4% 26.1% 17.8% 28.6% 17.9% 20.4% 28.0%Reduce cost of bus fare or bus pass 19.4% 10.9% 23.3% 7.1% 21.4% 24.1% 20.0%
Expanded hours of operation 16.4% 21.7% 20.5% 28.6% 3.6% 14.8% 12.0%T XT T
A bus stop closer to my home 10.8% 6.5% 9.6% 14.3% 17.9% 14.8% 8.0%More direct bus route between my home and destination
10.1% 8.7% 12.3% 7.1% 3.6% 3.7% 18.0%
TUService to my neighborhood 9.0% 10.9% 8.2% - 14.3% 7.4% 8.0%
Increase in frequency of departures from bus stops 7.5% 13.0% 5.5% 7.1% 14.3% 7.4% 2.0%
VOther, please specify 4.5% 2.2% 2.7% 7.1% 7.1% 7.4% 4.0%Comparison Groups: ABCD/EFGHIJ/KLMNOP/QRSTUV/WXYZA2B2/EKQW/FLRX/GMSY/HNTZ/IOUA2/JPVB2Independent T-Test for Means (equal variances), Independent Z-Test for PercentagesUpper case letters indicate significance at the 95% level.
Page 44

2011 Centre Region Community Survey Results - Random Sample
20. Of the following corridors, which are you most concerned with in terms of safety (Check no more than 3)? Percent selectedRandom sample weighted by relative municipality population
Random
Sample Random
Sample Random
Sample Random
Sample Random
Sample Random
Sample Random
Sample College
Township Ferguson Township
Halfmoon Township
Harris Township
Patton Township
Boro State College
(B) (Q) (R) (S) (T) (U) (V)
TOTAL ANSWERING 451 78 126 23 41 83 97College and Beaver Avenues in Downtown State College
55.2% 50.0% 53.2% 43.5% 43.9% 62.7% 63.9%
T TNorth Atherton Street 42.4% 37.2% 45.2% 43.5% 41.5% 51.8% 36.1%
VSouth Atherton Street 18.2% 24.4% 16.7% 13.0% 24.4% 15.7% 16.5%Whitehall Road 18.2% 19.2% 31.0% 17.4% 9.8% 4.8% 15.5%
U TUV UEast College Avenue 16.0% 25.6% 10.3% 4.3% 22.0% 14.5% 17.5%
D RS S B2SVairo Boulevard/Waddle Road 10.6% 6.4% 9.5% 21.7% 4.9% 16.9% 8.2%
QTPark Avenue 9.8% 11.5% 5.6% 8.7% 12.2% 13.3% 10.3%
University Drive 11.1% 21.8% 9.5% 4.3% 14.6% 3.6% 11.3%D RSU U
West College Avenue 9.8% 7.7% 11.9% 4.3% 12.2% 6.0% 12.4%B2
Valley Vista Drive/Science Park Road 8.2% 1.3% 12.7% 13.0% 2.4% 13.3% 5.2%QTV QT
Other, please specify 8.6% 7.7% 6.3% 21.7% 7.3% 12.0% 7.2%Y
None 11.3% 11.5% 7.9% 4.3% 19.5% 9.6% 15.5%S S
Comparison Groups: ABCD/EFGHIJ/KLMNOP/QRSTUV/WXYZA2B2/EKQW/FLRX/GMSY/HNTZ/IOUA2/JPVB2Independent T-Test for Means (equal variances), Independent Z-Test for PercentagesUpper case letters indicate significance at the 95% level.
Page 45

2011 Centre Region Community Survey Results - Random Sample
21. What roadway improvements should be made in the Centre Region (Check no more than 3)? Percent selectedRandom sample weighted by relative municipality population
Random
Sample Random
Sample Random
Sample Random
Sample Random
Sample Random
Sample Random
Sample College
Township Ferguson Township
Halfmoon Township
Harris Township
Patton Township
Boro State College
(B) (Q) (R) (S) (T) (U) (V)
TOTAL ANSWERING 450 76 122 23 42 83 100Focus on maintaining good pavement quality and bridge conditions
65.8% 65.8% 70.5% 78.3% 61.9% 61.4% 63.0%
D B2Add sidewalks and bike lanes along roadways 54.2% 53.9% 53.3% 43.5% 45.2% 62.7% 55.0%Widen existing roads in other congested areas (includes travel lanes and/or dedicated turning lanes)
40.7% 36.8% 45.9% 47.8% 42.9% 36.1% 39.0%
WMake existing traffic signals more efficient (could be several traffic signals along a corridor, or an individual traffic signal)
39.1% 38.2% 32.8% 34.8% 40.5% 45.8% 41.0%
Implement traffic calming measures (speed tables, narrowing streets, curb bulb-outs at intersections, or an individual traffic signal)
13.3% 14.5% 10.7% - 16.7% 12.0% 19.0%
Add street lighting in highway interchange areas 13.6% 17.1% 13.9% 17.4% 9.5% 12.0% 13.0%Add street lighting in major roadway corridors 10.9% 14.5% 13.1% 4.3% 7.1% 14.5% 6.0%
Add more traffic lights 4.0% 3.9% 6.6% - 7.1% 1.2% 3.0%U
Other, please specify 8.9% 9.2% 6.6% 17.4% 4.8% 10.8% 9.0%Comparison Groups: ABCD/EFGHIJ/KLMNOP/QRSTUV/WXYZA2B2/EKQW/FLRX/GMSY/HNTZ/IOUA2/JPVB2Independent T-Test for Means (equal variances), Independent Z-Test for PercentagesUpper case letters indicate significance at the 95% level.
Page 46

2011 Centre Region Community Survey Results - Random Sample
22. What improvements in bicycle or pedestrian facilities should be made in the Centre Region (Check no more than 3)? Percent selectedRandom sample weighted by relative municipality population
Random
Sample Random
Sample Random
Sample Random
Sample Random
Sample Random
Sample Random
Sample College
Township Ferguson Township
Halfmoon Township
Harris Township
Patton Township
Boro State College
(B) (Q) (R) (S) (T) (U) (V)
TOTAL ANSWERING 431 73 115 20 41 81 97Add more off-street bikeways 56.4% 47.9% 60.0% 50.0% 58.5% 59.3% 55.7%Provide connections between existing sidewalks, trails, and bikeways
54.3% 50.7% 62.6% 35.0% 48.8% 63.0% 47.4%
SV A2SVAdd more bike lanes on roads 41.3% 43.8% 44.3% 45.0% 36.6% 42.0% 37.1%Expand the system of sidewalks and pedestrian trails
37.6% 31.5% 38.3% 35.0% 31.7% 40.7% 41.2%
Add more facilities that reduce conflicts between pedestrians and vehicles (mid-block crosswalks, signing, lighting, etc.)
34.1% 28.8% 33.0% 35.0% 22.0% 33.3% 44.3%
QTMake crosswalks more visible 13.9% 20.5% 11.3% 25.0% 22.0% 11.1% 9.3%
V YOther, please specify 8.1% 9.6% 6.1% 15.0% 4.9% 7.4% 10.3%Comparison Groups: ABCD/EFGHIJ/KLMNOP/QRSTUV/WXYZA2B2/EKQW/FLRX/GMSY/HNTZ/IOUA2/JPVB2Independent T-Test for Means (equal variances), Independent Z-Test for PercentagesUpper case letters indicate significance at the 95% level.
Page 47

2011 Centre Region Community Survey Results - Random Sample
23. What improvements should be made to enhance transportation access to the Centre Region (Check no more than 3)? Percent selectedRandom sample weighted by relative municipality population
Random
Sample Random
Sample Random
Sample Random
Sample Random
Sample Random
Sample Random
Sample College
Township Ferguson Township
Halfmoon Township
Harris Township
Patton Township
Boro State College
(B) (Q) (R) (S) (T) (U) (V)
TOTAL ANSWERING 438 75 121 21 40 81 96Major highway improvements to connect the Region with the four lane Section of Route 322 at Seven Mountains
50.2% 44.0% 59.5% 76.2% 72.5% 44.4% 34.4%
QUV YQUV ZQUVMore passenger air service at the University Park Airport
45.7% 42.7% 47.1% 38.1% 47.5% 51.9% 40.6%
High speed rail service 42.0% 32.0% 38.0% 23.8% 17.5% 49.4% 61.5%T A2QST QRST
New interchange between Interstate 99 and Interstate 80 at the Exit 161 Bellefonte Interchange
29.2% 36.0% 35.5% 33.3% 37.5% 24.7% 16.7%
V V VMore intercity bus service 20.8% 21.3% 14.9% 9.5% 15.0% 23.5% 29.2%
RSRoadway access to Interstate 80 via Route 322 West of Port Matilda
22.4% 21.3% 29.8% 28.6% 15.0% 23.5% 15.6%
TVA new Centre Region Bus Terminal 12.6% 13.3% 11.6% 14.3% 2.5% 13.6% 16.7%
T T T TOther, please specify 4.1% 5.3% 3.3% 9.5% 5.0% 4.9% 2.1%
Comparison Groups: ABCD/EFGHIJ/KLMNOP/QRSTUV/WXYZA2B2/EKQW/FLRX/GMSY/HNTZ/IOUA2/JPVB2Independent T-Test for Means (equal variances), Independent Z-Test for PercentagesUpper case letters indicate significance at the 95% level.
Page 48

2011 Centre Region Community Survey Results - Random Sample
Random sample weighted by relative municipality population
Random
Sample Random
Sample Random
Sample Random
Sample Random
Sample Random
Sample Random
Sample College
Township Ferguson Township
Halfmoon Township
Harris Township
Patton Township
Boro State College
(B) (Q) (R) (S) (T) (U) (V)
TOTAL ANSWERING 455 78 125 23 42 84 99Yes 23.3% 21.8% 25.6% 17.4% 33.3% 31.0% 13.1%
V V A2VNo 64.8% 64.1% 63.2% 65.2% 61.9% 58.3% 73.7%
UDon’t know 11.9% 14.1% 11.2% 17.4% 4.8% 10.7% 13.1%Comparison Groups: ABCD/EFGHIJ/KLMNOP/QRSTUV/WXYZA2B2/EKQW/FLRX/GMSY/HNTZ/IOUA2/JPVB2Independent T-Test for Means (equal variances), Independent Z-Test for PercentagesUpper case letters indicate significance at the 95% level.
24. Do you spend more than 15% of your household income on transportation costs? (Costs include monthly vehicle loan payments, insurance, vehicle registration, vehicle maintenance and repairs; bus fare, bus pass, taxi fare, etc.)
Page 49
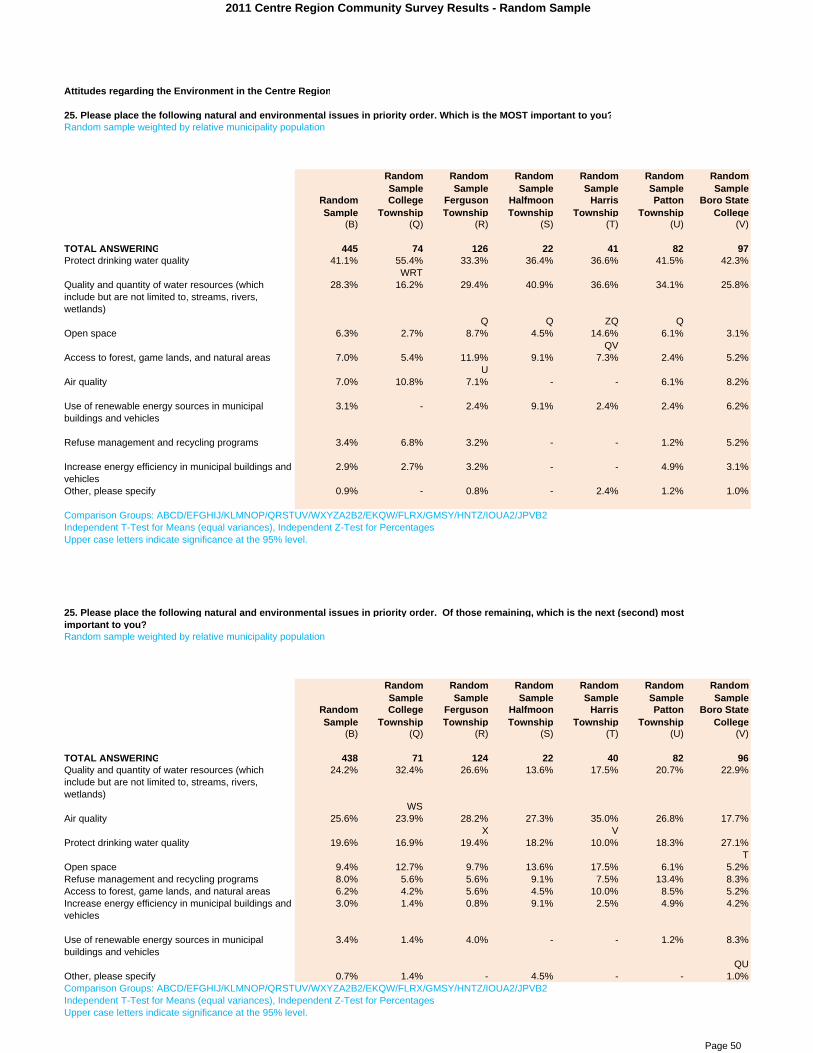
2011 Centre Region Community Survey Results - Random Sample
Attitudes regarding the Environment in the Centre Region
25. Please place the following natural and environmental issues in priority order. Which is the MOST important to you?Random sample weighted by relative municipality population
Random
Sample Random
Sample Random
Sample Random
Sample Random
Sample Random
Sample Random
Sample College
Township Ferguson Township
Halfmoon Township
Harris Township
Patton Township
Boro State College
(B) (Q) (R) (S) (T) (U) (V)
TOTAL ANSWERING 445 74 126 22 41 82 97Protect drinking water quality 41.1% 55.4% 33.3% 36.4% 36.6% 41.5% 42.3%
WRTQuality and quantity of water resources (which include but are not limited to, streams, rivers, wetlands)
28.3% 16.2% 29.4% 40.9% 36.6% 34.1% 25.8%
Q Q ZQ QOpen space 6.3% 2.7% 8.7% 4.5% 14.6% 6.1% 3.1%
QVAccess to forest, game lands, and natural areas 7.0% 5.4% 11.9% 9.1% 7.3% 2.4% 5.2%
UAir quality 7.0% 10.8% 7.1% - - 6.1% 8.2%
Use of renewable energy sources in municipal buildings and vehicles
3.1% - 2.4% 9.1% 2.4% 2.4% 6.2%
Refuse management and recycling programs 3.4% 6.8% 3.2% - - 1.2% 5.2%
Increase energy efficiency in municipal buildings and vehicles
2.9% 2.7% 3.2% - - 4.9% 3.1%
Other, please specify 0.9% - 0.8% - 2.4% 1.2% 1.0%
Comparison Groups: ABCD/EFGHIJ/KLMNOP/QRSTUV/WXYZA2B2/EKQW/FLRX/GMSY/HNTZ/IOUA2/JPVB2Independent T-Test for Means (equal variances), Independent Z-Test for PercentagesUpper case letters indicate significance at the 95% level.
25. Please place the following natural and environmental issues in priority order. Of those remaining, which is the next (second) most important to you?Random sample weighted by relative municipality population
Random
Sample Random
Sample Random
Sample Random
Sample Random
Sample Random
Sample Random
Sample College
Township Ferguson Township
Halfmoon Township
Harris Township
Patton Township
Boro State College
(B) (Q) (R) (S) (T) (U) (V)
TOTAL ANSWERING 438 71 124 22 40 82 96Quality and quantity of water resources (which include but are not limited to, streams, rivers, wetlands)
24.2% 32.4% 26.6% 13.6% 17.5% 20.7% 22.9%
WSAir quality 25.6% 23.9% 28.2% 27.3% 35.0% 26.8% 17.7%
X VProtect drinking water quality 19.6% 16.9% 19.4% 18.2% 10.0% 18.3% 27.1%
TOpen space 9.4% 12.7% 9.7% 13.6% 17.5% 6.1% 5.2%Refuse management and recycling programs 8.0% 5.6% 5.6% 9.1% 7.5% 13.4% 8.3%Access to forest, game lands, and natural areas 6.2% 4.2% 5.6% 4.5% 10.0% 8.5% 5.2%Increase energy efficiency in municipal buildings and vehicles
3.0% 1.4% 0.8% 9.1% 2.5% 4.9% 4.2%
Use of renewable energy sources in municipal buildings and vehicles
3.4% 1.4% 4.0% - - 1.2% 8.3%
QUOther, please specify 0.7% 1.4% - 4.5% - - 1.0%Comparison Groups: ABCD/EFGHIJ/KLMNOP/QRSTUV/WXYZA2B2/EKQW/FLRX/GMSY/HNTZ/IOUA2/JPVB2Independent T-Test for Means (equal variances), Independent Z-Test for PercentagesUpper case letters indicate significance at the 95% level.
Page 50

2011 Centre Region Community Survey Results - Random Sample
Page 51

2011 Centre Region Community Survey Results - Random Sample
25. Please place the following natural and environmental issues in priority order. Which is the next (third) most important to you of these?Random sample weighted by relative municipality population
Random
Sample Random
Sample Random
Sample Random
Sample Random
Sample Random
Sample Random
Sample College
Township Ferguson Township
Halfmoon Township
Harris Township
Patton Township
Boro State College
(B) (Q) (R) (S) (T) (U) (V)
TOTAL ANSWERING 428 68 123 21 38 81 94Air quality 22.9% 19.1% 23.6% 28.6% 18.4% 22.2% 25.5%
A2Quality and quantity of water resources (which include but are not limited to, streams, rivers, wetlands)
15.9% 17.6% 13.0% 14.3% 18.4% 16.0% 16.0%
Protect drinking water quality 15.0% 10.3% 15.4% 33.3% 18.4% 17.3% 10.6%YQV
Refuse management and recycling programs 13.8% 14.7% 14.6% 4.8% 13.2% 12.3% 16.0%X
Open space 12.4% 13.2% 13.8% - 5.3% 18.5% 10.6%X T
Access to forest, game lands, and natural areas 8.6% 5.9% 5.7% 19.0% 21.1% 7.4% 8.5%QR
Increase energy efficiency in municipal buildings and vehicles
5.4% 7.4% 6.5% - 2.6% 3.7% 6.4%
Use of renewable energy sources in municipal buildings and vehicles
5.6% 10.3% 7.3% - 2.6% 2.5% 5.3%
Other, please specify 0.5% 1.5% - - - - 1.1%Comparison Groups: ABCD/EFGHIJ/KLMNOP/QRSTUV/WXYZA2B2/EKQW/FLRX/GMSY/HNTZ/IOUA2/JPVB2Independent T-Test for Means (equal variances), Independent Z-Test for PercentagesUpper case letters indicate significance at the 95% level.
25. Please place the following natural and environmental issues in priority order. Of those now remaining, which is the next (fourth) most important to you?Random sample weighted by relative municipality population
Random
Sample Random
Sample Random
Sample Random
Sample Random
Sample Random
Sample Random
Sample College
Township Ferguson Township
Halfmoon Township
Harris Township
Patton Township
Boro State College
(B) (Q) (R) (S) (T) (U) (V)
TOTAL ANSWERING 400 64 113 21 35 78 86Air quality 14.0% 12.5% 12.4% 19.0% 11.4% 16.7% 15.1%
Open space 12.5% 14.1% 10.6% 14.3% 8.6% 9.0% 18.6%
Refuse management and recycling programs 13.8% 9.4% 10.6% 28.6% 14.3% 15.4% 16.3%Access to forest, game lands, and natural areas 13.3% 7.8% 18.6% 4.8% 5.7% 21.8% 7.0%
QSTV QSTVUse of renewable energy sources in municipal buildings and vehicles
13.8% 15.6% 11.5% 4.8% 34.3% 11.5% 10.5%
ZQRSUVQuality and quantity of water resources (which include but are not limited to, streams, rivers, wetlands)
12.5% 12.5% 14.2% 4.8% 8.6% 12.8% 14.0%
Increase energy efficiency in municipal buildings and vehicles
11.0% 14.1% 8.0% 9.5% 14.3% 6.4% 15.1%
Protect drinking water quality 8.8% 12.5% 13.3% 14.3% 2.9% 6.4% 3.5%V TV
Other, please specify 0.5% 1.6% 0.9% - - - -Comparison Groups: ABCD/EFGHIJ/KLMNOP/QRSTUV/WXYZA2B2/EKQW/FLRX/GMSY/HNTZ/IOUA2/JPVB2Independent T-Test for Means (equal variances), Independent Z-Test for PercentagesUpper case letters indicate significance at the 95% level.
Page 52

2011 Centre Region Community Survey Results - Random Sample
25. Please place the following natural and environmental issues in priority order. And finally, of these, which is the next (fifth) most important to you?Random sample weighted by relative municipality population
Random
Sample Random
Sample Random
Sample Random
Sample Random
Sample Random
Sample Random
Sample College
Township Ferguson Township
Halfmoon Township
Harris Township
Patton Township
Boro State College
(B) (Q) (R) (S) (T) (U) (V)
TOTAL ANSWERING 390 64 109 21 35 77 81Refuse management and recycling programs 18.2% 18.8% 18.3% 19.0% 11.4% 16.9% 21.0%
Access to forest, game lands, and natural areas 15.6% 18.8% 17.4% 14.3% 11.4% 15.6% 13.6%Open space 14.1% 15.6% 18.3% 14.3% 5.7% 14.3% 11.1%
TIncrease energy efficiency in municipal buildings and vehicles
13.3% 10.9% 11.0% 14.3% 17.1% 14.3% 14.8%
Air quality 12.1% 17.2% 11.9% 9.5% 11.4% 10.4% 11.1%Use of renewable energy sources in municipal buildings and vehicles
12.6% 7.8% 10.1% 19.0% 11.4% 15.6% 14.8%
Protect drinking water quality 7.2% 1.6% 9.2% - 22.9% 6.5% 4.9%Q QUV
Quality and quantity of water resources (which include but are not limited to, streams, rivers, wetlands)
6.4% 6.3% 3.7% 9.5% 8.6% 6.5% 8.6%
Other, please specify 0.5% 3.1% - - - - -Comparison Groups: ABCD/EFGHIJ/KLMNOP/QRSTUV/WXYZA2B2/EKQW/FLRX/GMSY/HNTZ/IOUA2/JPVB2Independent T-Test for Means (equal variances), Independent Z-Test for PercentagesUpper case letters indicate significance at the 95% level.
Page 53

2011 Centre Region Community Survey Results - Random Sample
26. In the past 12 months have you used Spring Creek for any of the following activities (Please check all that apply)?Random sample weighted by relative municipality population
Random
Sample Random
Sample Random
Sample Random
Sample Random
Sample Random
Sample Random
Sample College
Township Ferguson Township
Halfmoon Township
Harris Township
Patton Township
Boro State College
(B) (Q) (R) (S) (T) (U) (V)
TOTAL ANSWERING 452 78 126 23 41 83 97I have not used Spring Creek 57.7% 50.0% 61.9% 69.6% 56.1% 57.8% 55.7%
General Passive Recreation 36.7% 47.4% 31.0% 21.7% 34.1% 39.8% 38.1%RS
Fishing 10.0% 17.9% 8.7% 21.7% 9.8% 7.2% 5.2%UV
Canoe, Kayak 4.6% 5.1% 4.8% - 14.6% 2.4% 3.1%UV
Other, please specify 4.0% 3.8% 3.2% - 4.9% 2.4% 7.2%Comparison Groups: ABCD/EFGHIJ/KLMNOP/QRSTUV/WXYZA2B2/EKQW/FLRX/GMSY/HNTZ/IOUA2/JPVB2Independent T-Test for Means (equal variances), Independent Z-Test for PercentagesUpper case letters indicate significance at the 95% level.
Page 54

2011 Centre Region Community Survey Results - Random Sample
27. Which of the following items do you feel the municipalities should engage in to protect or improve the quality of Spring Creek and its tributaries (Please check all that you think are important)?Random sample weighted by relative municipality population
Random
Sample Random
Sample Random
Sample Random
Sample Random
Sample Random
Sample Random
Sample College
Township Ferguson Township
Halfmoon Township
Harris Township
Patton Township
Boro State College
(B) (Q) (R) (S) (T) (U) (V)
TOTAL ANSWERING 411 71 113 20 38 76 90Restrict development near Spring Creek and its tributaries
79.8% 70.4% 84.1% 80.0% 73.7% 77.6% 85.6%
Q B2QEducate the public about specific issues related to Spring Creek and its tributaries
61.6% 66.2% 54.9% 55.0% 57.9% 65.8% 66.7%
D B2Increase vegetative buffers near Spring Creek and its tributaries
58.2% 56.3% 52.2% 70.0% 63.2% 64.5% 56.7%
Increase access to Spring Creek and its tributaries 19.7% 23.9% 17.7% 15.0% 23.7% 23.7% 15.6%
D A2Comparison Groups: ABCD/EFGHIJ/KLMNOP/QRSTUV/WXYZA2B2/EKQW/FLRX/GMSY/HNTZ/IOUA2/JPVB2Independent T-Test for Means (equal variances), Independent Z-Test for PercentagesUpper case letters indicate significance at the 95% level.
Page 55

2011 Centre Region Community Survey Results - Random Sample
Attitudes regarding the Centre Region Economy
28. Please place the following economic issues in priority order. What is the HIGHEST priority?Random sample weighted by relative municipality population
Random
Sample Random
Sample Random
Sample Random
Sample Random
Sample Random
Sample Random
Sample College
Township Ferguson Township
Halfmoon Township
Harris Township
Patton Township
Boro State College
(B) (Q) (R) (S) (T) (U) (V)
TOTAL ANSWERING 447 75 123 23 42 82 99Retaining existing businesses in the Centre Region 56.6% 57.3% 61.0% 73.9% 47.6% 51.2% 53.5%
TUAttracting new businesses to the Centre Region 37.6% 36.0% 31.7% 26.1% 50.0% 42.7% 40.4%
RSExpanding existing businesses in the Centre Region 5.8% 6.7% 7.3% - 2.4% 6.1% 6.1%
Comparison Groups: ABCD/EFGHIJ/KLMNOP/QRSTUV/WXYZA2B2/EKQW/FLRX/GMSY/HNTZ/IOUA2/JPVB2Independent T-Test for Means (equal variances), Independent Z-Test for PercentagesUpper case letters indicate significance at the 95% level.
28. What is the next (second) highest priority economic issue?Random sample weighted by relative municipality population
Random
Sample Random
Sample Random
Sample Random
Sample Random
Sample Random
Sample Random
Sample College
Township Ferguson Township
Halfmoon Township
Harris Township
Patton Township
Boro State College
(B) (Q) (R) (S) (T) (U) (V)
TOTAL ANSWERING 435 74 120 23 41 78 96Expanding existing businesses in the Centre Region 41.8% 43.2% 40.0% 47.8% 41.5% 38.5% 44.8%
Attracting new businesses to the Centre Region 31.7% 29.7% 31.7% 39.1% 26.8% 32.1% 32.3%W
Retaining existing businesses in the Centre Region 26.4% 27.0% 28.3% 13.0% 31.7% 29.5% 22.9%
Comparison Groups: ABCD/EFGHIJ/KLMNOP/QRSTUV/WXYZA2B2/EKQW/FLRX/GMSY/HNTZ/IOUA2/JPVB2Independent T-Test for Means (equal variances), Independent Z-Test for PercentagesUpper case letters indicate significance at the 95% level.
Page 56

2011 Centre Region Community Survey Results - Random Sample
28. LOWEST (third) priority economic issueRandom sample weighted by relative municipality population
Random
Sample Random
Sample Random
Sample Random
Sample Random
Sample Random
Sample Random
Sample College
Township Ferguson Township
Halfmoon Township
Harris Township
Patton Township
Boro State College
(B) (Q) (R) (S) (T) (U) (V)
TOTAL ANSWERING 435 74 120 23 41 78 96Expanding existing businesses in the Centre Region 52.2% 50.0% 52.5% 52.2% 56.1% 55.1% 49.0%
YAttracting new businesses to the Centre Region 30.6% 33.8% 35.8% 34.8% 22.0% 24.4% 29.2%
Retaining existing businesses in the Centre Region 17.2% 16.2% 11.7% 13.0% 22.0% 20.5% 21.9%
RComparison Groups: ABCD/EFGHIJ/KLMNOP/QRSTUV/WXYZA2B2/EKQW/FLRX/GMSY/HNTZ/IOUA2/JPVB2Independent T-Test for Means (equal variances), Independent Z-Test for PercentagesUpper case letters indicate significance at the 95% level.
Page 57

2011 Centre Region Community Survey Results - Random Sample
29. Should municipalities offer any of the following incentives to keep existing business or attract new business (Check all that you feel should be used)?Random sample weighted by relative municipality population
Random
Sample Random
Sample Random
Sample Random
Sample Random
Sample Random
Sample Random
Sample College
Township Ferguson Township
Halfmoon Township
Harris Township
Patton Township
Boro State College
(B) (Q) (R) (S) (T) (U) (V)
TOTAL ANSWERING 432 73 124 21 39 81 92Funding construction infrastructure such as streets, water or sewer lines.
43.3% 46.6% 43.5% 38.1% 51.3% 45.7% 35.9%
D XTax abatements or reductions 41.0% 46.6% 41.1% 47.6% 48.7% 40.7% 31.5%
V X ZReducing development review and permitting fees. 33.8% 31.5% 37.9% 28.6% 35.9% 30.9% 32.6%
Incentives should not be offered 25.0% 20.5% 25.8% 28.6% 25.6% 23.5% 28.3%
Other, please specify 5.1% 8.2% 4.0% 9.5% 5.1% 2.5% 5.4%Comparison Groups: ABCD/EFGHIJ/KLMNOP/QRSTUV/WXYZA2B2/EKQW/FLRX/GMSY/HNTZ/IOUA2/JPVB2Independent T-Test for Means (equal variances), Independent Z-Test for PercentagesUpper case letters indicate significance at the 95% level.
Page 58

2011 Centre Region Community Survey Results - Random Sample
30. How important is it to offer the following economic development strategies in the Centre Region? First, which strategy is the MOST important?Random sample weighted by relative municipality population
Random
Sample Random
Sample Random
Sample Random
Sample Random
Sample Random
Sample Random
Sample College
Township Ferguson Township
Halfmoon Township
Harris Township
Patton Township
Boro State College
(B) (Q) (R) (S) (T) (U) (V)
TOTAL ANSWERING 438 74 123 22 41 84 92Support local food, direct-farm marketing, “Buy Fresh Buy Local”
26.7% 25.7% 25.2% 22.7% 41.5% 25.0% 25.0%
Attract more high-tech jobs 20.5% 21.6% 21.1% 27.3% 12.2% 20.2% 21.7%
Support natural and cultural resource-based tourism (hiking, biking, birding, arts)
14.2% 10.8% 13.0% 4.5% 14.6% 17.9% 17.4%
S SContinue to ensure infrastructure is built and maintained to serve existing businesses
11.9% 12.2% 13.0% 4.5% 9.8% 8.3% 15.2%
Attract more manufacturing jobs 8.0% 8.1% 8.1% 13.6% 9.8% 10.7% 3.3%
Attract more research office opportunities 4.3% 2.7% 4.9% 4.5% 2.4% 3.6% 6.5%D
Support recreational-based activities and tourism (sports)
4.1% 5.4% 4.1% 4.5% 2.4% 3.6% 4.3%
DAttract more retail and service jobs 1.8% 1.4% 2.4% 4.5% 2.4% 2.4% -Other, please specify 0.7% - 0.8% - - 1.2% 1.1%No specific economic development strategies are needed
7.8% 12.2% 7.3% 13.6% 4.9% 7.1% 5.4%
Comparison Groups: ABCD/EFGHIJ/KLMNOP/QRSTUV/WXYZA2B2/EKQW/FLRX/GMSY/HNTZ/IOUA2/JPVB2Independent T-Test for Means (equal variances), Independent Z-Test for PercentagesUpper case letters indicate significance at the 95% level.
30. How important is it to offer the following economic development strategies in the Centre Region? Of the remaining options, which is next (second) most important?Random sample weighted by relative municipality population
Random
Sample Random
Sample Random
Sample Random
Sample Random
Sample Random
Sample Random
Sample College
Township Ferguson Township
Halfmoon Township
Harris Township
Patton Township
Boro State College
(B) (Q) (R) (S) (T) (U) (V)
TOTAL ANSWERING 396 63 111 19 38 77 86Support natural and cultural resource-based tourism (hiking, biking, birding, arts)
15.4% 17.5% 13.5% 5.3% 7.9% 15.6% 22.1%
STAttract more high-tech jobs 14.4% 11.1% 10.8% 21.1% 7.9% 19.5% 17.4%Continue to ensure infrastructure is built and maintained to serve existing businesses
13.9% 17.5% 14.4% 15.8% 13.2% 13.0% 11.6%
Support local food, direct-farm marketing, “Buy Fresh Buy Local”
14.6% 12.7% 14.4% 15.8% 13.2% 13.0% 17.4%
Attract more manufacturing jobs 14.9% 20.6% 15.3% 15.8% 21.1% 11.7% 10.5%D
Attract more research office opportunities 11.1% 6.3% 14.4% 5.3% 21.1% 7.8% 10.5%Q
Support recreational-based activities and tourism (sports)
11.4% 7.9% 11.7% 15.8% 13.2% 15.6% 8.1%
Attract more retail and service jobs 3.5% 3.2% 5.4% 5.3% 2.6% 3.9% 1.2%Other, please specify 0.8% 3.2% - - - - 1.2%Comparison Groups: ABCD/EFGHIJ/KLMNOP/QRSTUV/WXYZA2B2/EKQW/FLRX/GMSY/HNTZ/IOUA2/JPVB2Independent T-Test for Means (equal variances), Independent Z-Test for PercentagesUpper case letters indicate significance at the 95% level.
Page 59

2011 Centre Region Community Survey Results - Random Sample
30. How important is it to offer the following economic development strategies in the Centre Region? Which initiative is next (third) most important?Random sample weighted by relative municipality population
Random
Sample Random
Sample Random
Sample Random
Sample Random
Sample Random
Sample Random
Sample College
Township Ferguson Township
Halfmoon Township
Harris Township
Patton Township
Boro State College
(B) (Q) (R) (S) (T) (U) (V)
TOTAL ANSWERING 381 59 109 19 38 75 79Continue to ensure infrastructure is built and maintained to serve existing businesses
22.0% 13.6% 22.0% 36.8% 21.1% 24.0% 22.8%
Support local food, direct-farm marketing, “Buy Fresh Buy Local”
13.1% 8.5% 18.3% 15.8% 5.3% 10.7% 15.2%
TSupport recreational-based activities and tourism (sports)
12.1% 11.9% 10.1% 5.3% 5.3% 14.7% 17.7%
TSupport natural and cultural resource-based tourism (hiking, biking, birding, arts)
12.1% 8.5% 14.7% 21.1% 18.4% 8.0% 10.1%
Attract more research office opportunities 11.8% 13.6% 9.2% 10.5% 5.3% 14.7% 13.9%
Attract more high-tech jobs 13.4% 23.7% 10.1% 5.3% 31.6% 10.7% 6.3%D RSUV RSUV
Attract more manufacturing jobs 9.7% 15.3% 9.2% 5.3% 10.5% 9.3% 7.6%Attract more retail and service jobs 5.0% 5.1% 6.4% - 2.6% 6.7% 3.8%Other, please specify 0.8% - - - - 1.3% 2.5%Comparison Groups: ABCD/EFGHIJ/KLMNOP/QRSTUV/WXYZA2B2/EKQW/FLRX/GMSY/HNTZ/IOUA2/JPVB2Independent T-Test for Means (equal variances), Independent Z-Test for PercentagesUpper case letters indicate significance at the 95% level.
30. How important is it to offer the following economic development strategies in the Centre Region? Which is next (fourth) most important?Random sample weighted by relative municipality population
Random
Sample Random
Sample Random
Sample Random
Sample Random
Sample Random
Sample Random
Sample College
Township Ferguson Township
Halfmoon Township
Harris Township
Patton Township
Boro State College
(B) (Q) (R) (S) (T) (U) (V)
TOTAL ANSWERING 353 54 99 18 37 72 71Continue to ensure infrastructure is built and maintained to serve existing businesses
24.1% 27.8% 24.2% 22.2% 21.6% 27.8% 18.3%
Attract more research office opportunities 13.3% 14.8% 9.1% 22.2% 13.5% 12.5% 16.9%Support natural and cultural resource-based tourism (hiking, biking, birding, arts)
12.2% 9.3% 14.1% 16.7% 10.8% 11.1% 12.7%
Support recreational-based activities and tourism (sports)
11.9% 11.1% 16.2% 11.1% 8.1% 5.6% 15.5%
UAttract more high-tech jobs 10.8% 9.3% 12.1% - 13.5% 11.1% 11.3%Support local food, direct-farm marketing, “Buy Fresh Buy Local”
10.5% 9.3% 6.1% 16.7% 16.2% 12.5% 11.3%
Attract more retail and service jobs 10.5% 9.3% 13.1% - 16.2% 9.7% 8.5%
Attract more manufacturing jobs 6.5% 9.3% 5.1% 11.1% - 8.3% 5.6%Other, please specify 0.3% - - - - 1.4% -Comparison Groups: ABCD/EFGHIJ/KLMNOP/QRSTUV/WXYZA2B2/EKQW/FLRX/GMSY/HNTZ/IOUA2/JPVB2Independent T-Test for Means (equal variances), Independent Z-Test for PercentagesUpper case letters indicate significance at the 95% level.
Page 60

2011 Centre Region Community Survey Results - Random Sample
30. How important is it to offer the following economic development strategies in the Centre Region? Which is next (fifth) most important?Random sample weighted by relative municipality population
Random
Sample Random
Sample Random
Sample Random
Sample Random
Sample Random
Sample Random
Sample College
Township Ferguson Township
Halfmoon Township
Harris Township
Patton Township
Boro State College
(B) (Q) (R) (S) (T) (U) (V)
TOTAL ANSWERING 325 51 94 17 32 65 64Continue to ensure infrastructure is built and maintained to serve existing businesses
21.5% 13.7% 30.9% 29.4% 21.9% 16.9% 15.6%
QUVSupport recreational-based activities and tourism (sports)
15.7% 15.7% 14.9% 17.6% 21.9% 20.0% 9.4%
DAttract more research office opportunities 11.1% 15.7% 10.6% 5.9% 6.3% 9.2% 14.1%Attract more retail and service jobs 13.2% 15.7% 13.8% 11.8% 12.5% 13.8% 10.9%Attract more high-tech jobs 12.0% 7.8% 8.5% 5.9% 12.5% 12.3% 21.9%
B2QRSSupport natural and cultural resource-based tourism (hiking, biking, birding, arts)
8.9% 5.9% 5.3% 17.6% 12.5% 7.7% 12.5%
Support local food, direct-farm marketing, “Buy Fresh Buy Local”
7.4% 13.7% 8.5% - 3.1% 6.2% 6.3%
Attract more manufacturing jobs 8.9% 11.8% 6.4% 11.8% 9.4% 12.3% 6.3%Other, please specify 1.2% - 1.1% - - 1.5% 3.1%Comparison Groups: ABCD/EFGHIJ/KLMNOP/QRSTUV/WXYZA2B2/EKQW/FLRX/GMSY/HNTZ/IOUA2/JPVB2Independent T-Test for Means (equal variances), Independent Z-Test for PercentagesUpper case letters indicate significance at the 95% level.
Page 61

2011 Centre Region Community Survey Results - Random Sample
Attitudes about Local Government and Resident Communication
Random sample weighted by relative municipality population
Random
Sample Random
Sample Random
Sample Random
Sample Random
Sample Random
Sample Random
Sample College
Township Ferguson Township
Halfmoon Township
Harris Township
Patton Township
Boro State College
(B) (Q) (R) (S) (T) (U) (V)
TOTAL ANSWERING 456 77 128 23 42 85 99Township Newsletter 56.4% 61.0% 67.2% 65.2% 81.0% 55.3% 27.3%
V V V QUV VRead it in the Centre Daily Times 52.6% 53.2% 53.9% 60.9% 54.8% 50.6% 50.5%
Email 32.2% 27.3% 28.9% 26.1% 21.4% 38.8% 40.4%T T
Inserts in utility bills, refuse bills or US Mail 36.2% 42.9% 38.3% 21.7% 33.3% 32.9% 35.4%D S B2
View Centre Region web page 33.1% 33.8% 28.1% 21.7% 28.6% 42.4% 35.4%RS
View municipal web page on my own 31.4% 31.2% 27.3% 39.1% 23.8% 30.6% 38.4%Social media (Facebook, Twitter, blogs) 12.3% 13.0% 9.4% 8.7% 4.8% 18.8% 14.1%
TRead it in The Daily Collegian 7.5% 2.6% 4.7% 4.3% 14.3% 3.5% 16.2%
Q QRSUComparison Groups: ABCD/EFGHIJ/KLMNOP/QRSTUV/WXYZA2B2/EKQW/FLRX/GMSY/HNTZ/IOUA2/JPVB2Independent T-Test for Means (equal variances), Independent Z-Test for PercentagesUpper case letters indicate significance at the 95% level.
31. Choose the 3 ways you would prefer to receive information regarding community meetings, community issues, or community events (Please check only 3).
Page 62

2011 Centre Region Community Survey Results - Random Sample
Demographic Information
32. Demographic Information Please select the municipality where you currently live.Random sample weighted by relative municipality population
Random
Sample Random
Sample Random
Sample Random
Sample Random
Sample Random
Sample Random
Sample College
Township Ferguson Township
Halfmoon Township
Harris Township
Patton Township
Boro State College
(B) (Q) (R) (S) (T) (U) (V)
TOTAL ANSWERING 461 78 128 23 42 85 100Ferguson Township 27.8% - 100.0% - - - -
DBorough of State College 21.7% - - - - - 100.0%
Patton Township 18.4% - - - - 100.0% -D
College Township 16.9% 100.0% - - - - -D
Halfmoon Township 5.0% - - 100.0% - - -
Harris Township 9.1% - - - 100.0% - -Other 5 - - - - - -
1.1%Comparison Groups: ABCD/EFGHIJ/KLMNOP/QRSTUV/WXYZA2B2/EKQW/FLRX/GMSY/HNTZ/IOUA2/JPVB2Independent T-Test for Means (equal variances), Independent Z-Test for PercentagesUpper case letters indicate significance at the 95% level.
33. Please select the number of years you have lived in any of the six municipalities in the previous questionRandom sample weighted by relative municipality population
Random
Sample Random
Sample Random
Sample Random
Sample Random
Sample Random
Sample Random
Sample College
Township Ferguson Township
Halfmoon Township
Harris Township
Patton Township
Boro State College
(B) (Q) (R) (S) (T) (U) (V)
TOTAL ANSWERING 457 77 128 23 42 85 1001 year or less 3.5% 1.3% 3.1% - 2.4% 3.5% 6.0%
2 to 5 years 17.9% 11.7% 21.9% 4.3% 4.8% 25.9% 20.0%QST QST ST
6 to 10 years 14.4% 16.9% 12.5% 13.0% 4.8% 21.2% 13.0%T T
11 to 15 years 11.6% 11.7% 13.3% 17.4% 14.3% 9.4% 9.0%
16 to 20 years 8.8% 6.5% 10.2% 13.0% 7.1% 9.4% 8.0%Over 20 years 43.8% 51.9% 39.1% 52.2% 66.7% 30.6% 44.0%
U RUVComparison Groups: ABCD/EFGHIJ/KLMNOP/QRSTUV/WXYZA2B2/EKQW/FLRX/GMSY/HNTZ/IOUA2/JPVB2Independent T-Test for Means (equal variances), Independent Z-Test for PercentagesUpper case letters indicate significance at the 95% level.
Page 63
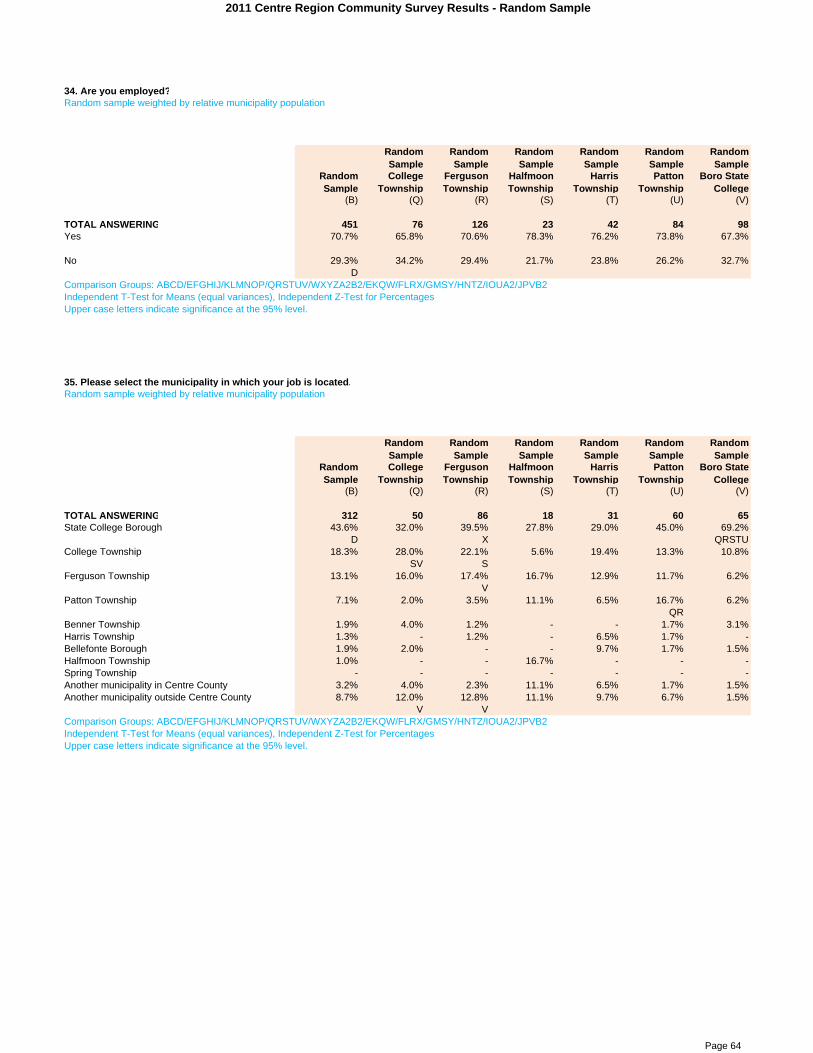
2011 Centre Region Community Survey Results - Random Sample
34. Are you employed?Random sample weighted by relative municipality population
Random
Sample Random
Sample Random
Sample Random
Sample Random
Sample Random
Sample Random
Sample College
Township Ferguson Township
Halfmoon Township
Harris Township
Patton Township
Boro State College
(B) (Q) (R) (S) (T) (U) (V)
TOTAL ANSWERING 451 76 126 23 42 84 98Yes 70.7% 65.8% 70.6% 78.3% 76.2% 73.8% 67.3%
No 29.3% 34.2% 29.4% 21.7% 23.8% 26.2% 32.7%D
Comparison Groups: ABCD/EFGHIJ/KLMNOP/QRSTUV/WXYZA2B2/EKQW/FLRX/GMSY/HNTZ/IOUA2/JPVB2Independent T-Test for Means (equal variances), Independent Z-Test for PercentagesUpper case letters indicate significance at the 95% level.
35. Please select the municipality in which your job is located.Random sample weighted by relative municipality population
Random
Sample Random
Sample Random
Sample Random
Sample Random
Sample Random
Sample Random
Sample College
Township Ferguson Township
Halfmoon Township
Harris Township
Patton Township
Boro State College
(B) (Q) (R) (S) (T) (U) (V)
TOTAL ANSWERING 312 50 86 18 31 60 65State College Borough 43.6% 32.0% 39.5% 27.8% 29.0% 45.0% 69.2%
D X QRSTUCollege Township 18.3% 28.0% 22.1% 5.6% 19.4% 13.3% 10.8%
SV SFerguson Township 13.1% 16.0% 17.4% 16.7% 12.9% 11.7% 6.2%
VPatton Township 7.1% 2.0% 3.5% 11.1% 6.5% 16.7% 6.2%
QRBenner Township 1.9% 4.0% 1.2% - - 1.7% 3.1%Harris Township 1.3% - 1.2% - 6.5% 1.7% -Bellefonte Borough 1.9% 2.0% - - 9.7% 1.7% 1.5%Halfmoon Township 1.0% - - 16.7% - - -Spring Township - - - - - - -Another municipality in Centre County 3.2% 4.0% 2.3% 11.1% 6.5% 1.7% 1.5%Another municipality outside Centre County 8.7% 12.0% 12.8% 11.1% 9.7% 6.7% 1.5%
V VComparison Groups: ABCD/EFGHIJ/KLMNOP/QRSTUV/WXYZA2B2/EKQW/FLRX/GMSY/HNTZ/IOUA2/JPVB2Independent T-Test for Means (equal variances), Independent Z-Test for PercentagesUpper case letters indicate significance at the 95% level.
Page 64
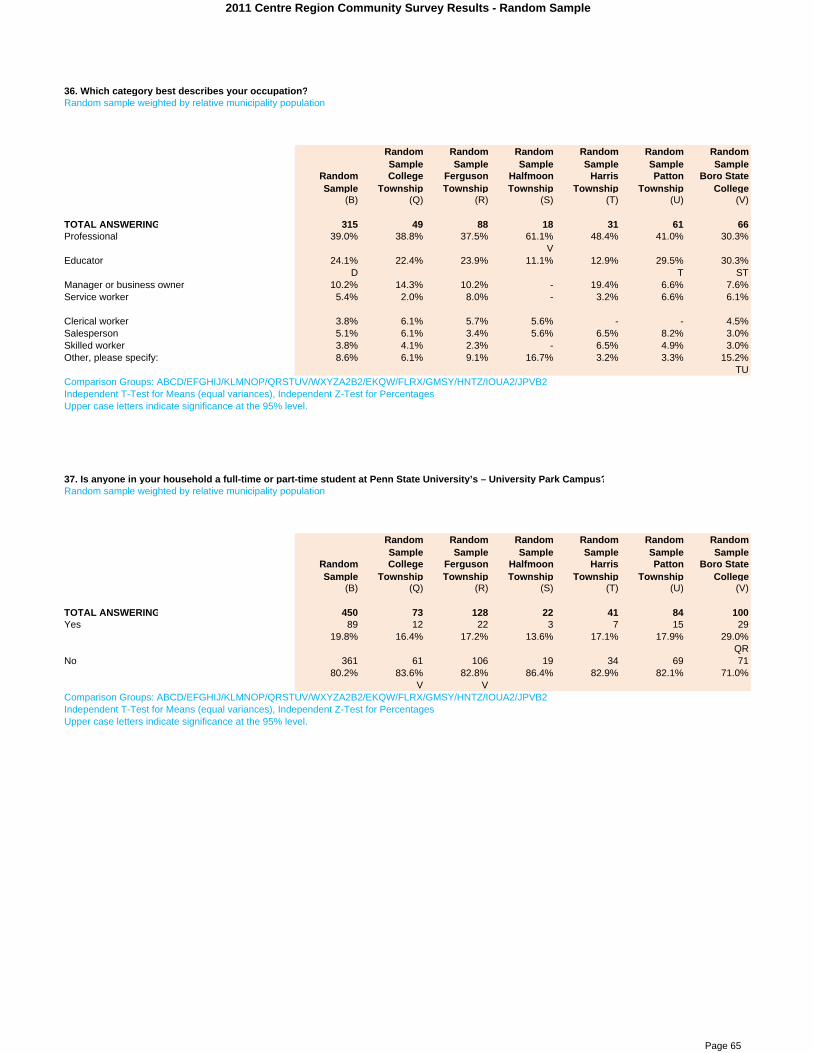
2011 Centre Region Community Survey Results - Random Sample
36. Which category best describes your occupation?Random sample weighted by relative municipality population
Random
Sample Random
Sample Random
Sample Random
Sample Random
Sample Random
Sample Random
Sample College
Township Ferguson Township
Halfmoon Township
Harris Township
Patton Township
Boro State College
(B) (Q) (R) (S) (T) (U) (V)
TOTAL ANSWERING 315 49 88 18 31 61 66Professional 39.0% 38.8% 37.5% 61.1% 48.4% 41.0% 30.3%
VEducator 24.1% 22.4% 23.9% 11.1% 12.9% 29.5% 30.3%
D T STManager or business owner 10.2% 14.3% 10.2% - 19.4% 6.6% 7.6%Service worker 5.4% 2.0% 8.0% - 3.2% 6.6% 6.1%
Clerical worker 3.8% 6.1% 5.7% 5.6% - - 4.5%Salesperson 5.1% 6.1% 3.4% 5.6% 6.5% 8.2% 3.0%Skilled worker 3.8% 4.1% 2.3% - 6.5% 4.9% 3.0%Other, please specify: 8.6% 6.1% 9.1% 16.7% 3.2% 3.3% 15.2%
TUComparison Groups: ABCD/EFGHIJ/KLMNOP/QRSTUV/WXYZA2B2/EKQW/FLRX/GMSY/HNTZ/IOUA2/JPVB2Independent T-Test for Means (equal variances), Independent Z-Test for PercentagesUpper case letters indicate significance at the 95% level.
37. Is anyone in your household a full-time or part-time student at Penn State University’s – University Park Campus?Random sample weighted by relative municipality population
Random
Sample Random
Sample Random
Sample Random
Sample Random
Sample Random
Sample Random
Sample College
Township Ferguson Township
Halfmoon Township
Harris Township
Patton Township
Boro State College
(B) (Q) (R) (S) (T) (U) (V)
TOTAL ANSWERING 450 73 128 22 41 84 100Yes 89 12 22 3 7 15 29
19.8% 16.4% 17.2% 13.6% 17.1% 17.9% 29.0%QR
No 361 61 106 19 34 69 7180.2% 83.6% 82.8% 86.4% 82.9% 82.1% 71.0%
V VComparison Groups: ABCD/EFGHIJ/KLMNOP/QRSTUV/WXYZA2B2/EKQW/FLRX/GMSY/HNTZ/IOUA2/JPVB2Independent T-Test for Means (equal variances), Independent Z-Test for PercentagesUpper case letters indicate significance at the 95% level.
Page 65

2011 Centre Region Community Survey Results - Random Sample
38. Please check the one box that most closely describes the type of housing unit you live in.Random sample weighted by relative municipality population
Random
Sample Random
Sample Random
Sample Random
Sample Random
Sample Random
Sample Random
Sample College
Township Ferguson Township
Halfmoon Township
Harris Township
Patton Township
Boro State College
(B) (Q) (R) (S) (T) (U) (V)
TOTAL ANSWERING 457 77 128 23 42 85 100A detached single family home 72.0% 72.7% 76.6% 100.0% 88.1% 61.2% 61.0%
UV QRTUV QUVTownhouse 10.1% 9.1% 10.2% - 2.4% 20.0% 8.0%
T QTVAn apartment in an apartment complex 9.6% 5.2% 4.7% - 2.4% 15.3% 20.0%
QRT QRTA duplex 3.5% 2.6% 5.5% - 2.4% 2.4% 4.0%An apartment in a single family home 1.8% 2.6% - - - - 6.0%
A mobile home 0.4% - - - 2.4% 1.2% -Other 2.6% 7.8% 3.1% - 2.4% - 1.0%
VComparison Groups: ABCD/EFGHIJ/KLMNOP/QRSTUV/WXYZA2B2/EKQW/FLRX/GMSY/HNTZ/IOUA2/JPVB2Independent T-Test for Means (equal variances), Independent Z-Test for PercentagesUpper case letters indicate significance at the 95% level.
39. Do you rent or own your residence?Random sample weighted by relative municipality population
Random
Sample Random
Sample Random
Sample Random
Sample Random
Sample Random
Sample Random
Sample College
Township Ferguson Township
Halfmoon Township
Harris Township
Patton Township
Boro State College
(B) (Q) (R) (S) (T) (U) (V)
TOTAL ANSWERING 456 76 126 23 42 85 100Rent 21.9% 15.8% 15.9% - 16.7% 27.1% 37.0%
QRTOwn 78.1% 84.2% 84.1% 100.0% 83.3% 72.9% 63.0%
V V QRTUV VComparison Groups: ABCD/EFGHIJ/KLMNOP/QRSTUV/WXYZA2B2/EKQW/FLRX/GMSY/HNTZ/IOUA2/JPVB2Independent T-Test for Means (equal variances), Independent Z-Test for PercentagesUpper case letters indicate significance at the 95% level.
Page 66

2011 Centre Region Community Survey Results - Random Sample
Random sample weighted by relative municipality population
Random
Sample Random
Sample Random
Sample Random
Sample Random
Sample Random
Sample Random
Sample College
Township Ferguson Township
Halfmoon Township
Harris Township
Patton Township
Boro State College
(B) (Q) (R) (S) (T) (U) (V)
TOTAL ANSWERING 426 71 116 20 39 81 95Less than $10,000 2.3% 4.2% - - - - 7.4%$10,000 to $14,999 2.3% 2.8% 0.9% - 5.1% 2.5% 2.1%$15,000 to $24,999 5.4% 2.8% 5.2% - 2.6% 7.4% 7.4%$25,000 to $34,999 8.0% 7.0% 7.8% 5.0% 5.1% 4.9% 13.7%
U$35,000 to $49,999 10.8% 15.5% 10.3% 10.0% 5.1% 8.6% 12.6%
$50,000 to $74,999 19.5% 15.5% 20.7% 25.0% 15.4% 25.9% 16.8%
$75,000 to $99,999 17.6% 16.9% 17.2% 25.0% 28.2% 16.0% 13.7%$100,000 to $149,999 21.1% 18.3% 25.0% 35.0% 23.1% 17.3% 18.9%
$150,000 to $199,999 6.6% 9.9% 6.0% - 5.1% 7.4% 6.3%$200,000 or more 6.3% 7.0% 6.9% - 10.3% 9.9% 1.1%
V VComparison Groups: ABCD/EFGHIJ/KLMNOP/QRSTUV/WXYZA2B2/EKQW/FLRX/GMSY/HNTZ/IOUA2/JPVB2Independent T-Test for Means (equal variances), Independent Z-Test for PercentagesUpper case letters indicate significance at the 95% level.
41. My age group is...Random sample weighted by relative municipality population
Random
Sample Random
Sample Random
Sample Random
Sample Random
Sample Random
Sample Random
Sample College
Township Ferguson Township
Halfmoon Township
Harris Township
Patton Township
Boro State College
(B) (Q) (R) (S) (T) (U) (V)
TOTAL ANSWERING 451 77 125 23 40 82 10018 - 24 4.9% 2.6% 0.8% - - 8.5% 11.0%
R QR25 - 34 13.3% 6.5% 11.2% - 15.0% 18.3% 19.0%
Q Q35 - 44 12.4% 13.0% 16.0% 13.0% 5.0% 14.6% 9.0%
T45 - 59 33.0% 27.3% 36.0% 43.5% 47.5% 29.3% 28.0%
ZQV60 - 64 12.6% 20.8% 10.4% 17.4% 12.5% 12.2% 9.0%
V65 + 23.7% 29.9% 25.6% 26.1% 20.0% 17.1% 24.0%
DComparison Groups: ABCD/EFGHIJ/KLMNOP/QRSTUV/WXYZA2B2/EKQW/FLRX/GMSY/HNTZ/IOUA2/JPVB2Independent T-Test for Means (equal variances), Independent Z-Test for PercentagesUpper case letters indicate significance at the 95% level.
40. About how much was the gross income for your household in 2010? (Include all persons in the household for which a tax return was filed)
Page 67

2011 Centre Region Community Survey Results - Random Sample
42. What is the highest level of education you have completed?Random sample weighted by relative municipality population
Random
Sample Random
Sample Random
Sample Random
Sample Random
Sample Random
Sample Random
Sample College
Township Ferguson Township
Halfmoon Township
Harris Township
Patton Township
Boro State College
(B) (Q) (R) (S) (T) (U) (V)
TOTAL ANSWERING 451 77 124 23 42 83 980-11 years, no diploma - - - - - - -High school graduate 6.9% 7.8% 5.6% 21.7% 11.9% 3.6% 5.1%
USome college, no degree 10.6% 19.5% 11.3% 17.4% 9.5% 7.2% 5.1%
UVAssociate Degree 6.2% 7.8% 7.3% 4.3% 7.1% 2.4% 5.1%
Bachelor's Degree 33.0% 33.8% 29.0% 34.8% 38.1% 33.7% 35.7%Master's Degree 24.8% 14.3% 25.8% 17.4% 14.3% 34.9% 29.6%
Q QT QTDoctorate Degree 18.4% 16.9% 21.0% 4.3% 19.0% 18.1% 19.4%
D S XS S S SComparison Groups: ABCD/EFGHIJ/KLMNOP/QRSTUV/WXYZA2B2/EKQW/FLRX/GMSY/HNTZ/IOUA2/JPVB2Independent T-Test for Means (equal variances), Independent Z-Test for PercentagesUpper case letters indicate significance at the 95% level.
43. What is your gender?Random sample weighted by relative municipality population
Random
Sample Random
Sample Random
Sample Random
Sample Random
Sample Random
Sample Random
Sample College
Township Ferguson Township
Halfmoon Township
Harris Township
Patton Township
Boro State College
(B) (Q) (R) (S) (T) (U) (V)
TOTAL ANSWERING 451 77 126 23 42 79 100Male 56.8% 49.4% 57.1% 65.2% 71.4% 59.5% 52.0%
Y QVFemale 43.2% 50.6% 42.9% 34.8% 28.6% 40.5% 48.0%
T TComparison Groups: ABCD/EFGHIJ/KLMNOP/QRSTUV/WXYZA2B2/EKQW/FLRX/GMSY/HNTZ/IOUA2/JPVB2Independent T-Test for Means (equal variances), Independent Z-Test for PercentagesUpper case letters indicate significance at the 95% level.
Page 68

Centre Region Comprehensive Plan Survey
Appendix B ‐ Drop‐in Sample Survey Centre Regional Planning Agency | January 2012
APPENDIX B
DROP‐IN SAMPLE SURVEY RESULTS
BACKGROUND
The “drop‐in” sample survey refers to an open access survey posted on the CRPA webpage that was
available during the duration of the sampling period. This report does not use the drop‐in survey
sample in the final analysis of survey results. The drop‐in survey did, however, accomplish several
objectives:
The drop‐in survey broadened public participation by allowing any resident in the Centre
Region with access to a computer to participate in the survey process. A total of 150 individuals
completed the drop‐in survey.
The drop‐in survey allowed the consultant to aggregate the results of the random sample and
drop‐in sample results into a combined summary (see Appendix C). The combined survey
results and random sample survey results produced similar responses on nearly every question
in the survey.
READING THE RESULTS
See APPENDIX A for instructions on reading the results.

2011 Centre Region Community Survey Results - Drop-Ins
Random sample weighted by relative municipality population
Drop-
Ins Drop-
Ins Drop-
Ins Drop-
Ins Drop-
Ins Drop-
Ins Drop-Ins College
Township Ferguson Township
Halfmoon Township
Harris Township
Patton Township
Boro State College
(D) (W) (X) (Y) (Z) (A2) (B2)
TOTAL ANSWERING 150 11 26 44 13 17 33Mail - - - - - - -
Web Sample - - - - - - -
Web Drop-in 100.0% 100.0% 100.0% 100.0% 100.0% 100.0% 100.0%A E F G H I J
Comparison Groups: ABCD/EFGHIJ/KLMNOP/QRSTUV/WXYZA2B2/EKQW/FLRX/GMSY/HNTZ/IOUA2/JPVB2Independent T-Test for Means (equal variances), Independent Z-Test for PercentagesUpper case letters indicate significance at the 95% level.
ModeRandom sample weighted by relative municipality population
Drop-
Ins Drop-
Ins Drop-
Ins Drop-
Ins Drop-
Ins Drop-
Ins Drop-Ins College
Township Ferguson Township
Halfmoon Township
Harris Township
Patton Township
Boro State College
(D) (W) (X) (Y) (Z) (A2) (B2)
TOTAL ANSWERING 150 11 26 44 13 17 33Random Sample - - - - - - -
Drop-Ins 100.0% 100.0% 100.0% 100.0% 100.0% 100.0% 100.0%A E F G H I J
Comparison Groups: ABCD/EFGHIJ/KLMNOP/QRSTUV/WXYZA2B2/EKQW/FLRX/GMSY/HNTZ/IOUA2/JPVB2Independent T-Test for Means (equal variances), Independent Z-Test for PercentagesUpper case letters indicate significance at the 95% level.
Page 1

2011 Centre Region Community Survey Results - Drop-Ins
Attitudes about Land Use and Development in the Centre Region
Random sample weighted by relative municipality population
Drop-
Ins Drop-
Ins Drop-
Ins Drop-
Ins Drop-
Ins Drop-
Ins Drop-Ins College
Township Ferguson Township
Halfmoon Township
Harris Township
Patton Township
Boro State College
(D) (W) (X) (Y) (Z) (A2) (B2)
TOTAL ANSWERING 145 11 26 44 13 17 33Having access to open space (parks, green belts, wooded land) near residential areas
57.2% 54.5% 50.0% 68.2% 53.8% 47.1% 54.5%
Maintaining a low level of environmental pollution 44.1% 45.5% 46.2% 50.0% 61.5% 35.3% 33.3%Encouraging a sustainable region 49.0% 36.4% 50.0% 56.8% 53.8% 29.4% 51.5%
BC A2Protecting neighborhoods from encroachment by non-residential land uses
31.0% 27.3% 42.3% 29.5% 23.1% 29.4% 30.3%
Building and maintaining livable neighborhoods 31.0% 18.2% 26.9% 22.7% 30.8% 29.4% 48.5%JPVWY
Attracting business 22.8% 27.3% 15.4% 13.6% 30.8% 41.2% 27.3%Y
Improving personal security and public safety 17.2% 9.1% 30.8% 20.5% 15.4% 17.6% 6.1%B2
Expanding the variety and availability of retail goods and services
15.9% 27.3% 15.4% 6.8% 7.7% 23.5% 24.2%
YMaintaining and enhancing the visual appearance of buildings and landscaping
14.5% 9.1% 11.5% 15.9% 7.7% 11.8% 21.2%
Increasing education opportunities for all age groups 9.7% 36.4% 3.8% 9.1% 7.7% 17.6% -
XOther 7.6% 9.1% 7.7% 6.8% 7.7% 17.6% 3.0%
Comparison Groups: ABCD/EFGHIJ/KLMNOP/QRSTUV/WXYZA2B2/EKQW/FLRX/GMSY/HNTZ/IOUA2/JPVB2Independent T-Test for Means (equal variances), Independent Z-Test for PercentagesUpper case letters indicate significance at the 95% level.
1. MOST IMPORTANT OBJECTIVES which could be used to guide future growth and development in the Centre Region. (Percent selected in top three most important)
Page 2

2011 Centre Region Community Survey Results - Drop-Ins
Random sample weighted by relative municipality population
Drop-
Ins Drop-
Ins Drop-
Ins Drop-
Ins Drop-
Ins Drop-
Ins Drop-Ins College
Township Ferguson Township
Halfmoon Township
Harris Township
Patton Township
Boro State College
(D) (W) (X) (Y) (Z) (A2) (B2)
TOTAL ANSWERING 143 10 26 44 12 17 33Expanding the variety and availability of retail goods and services
61.5% 60.0% 61.5% 72.7% 66.7% 58.8% 45.5%
B2Attracting business 49.7% 30.0% 57.7% 63.6% 58.3% 29.4% 36.4%
MSWA2B2Increasing education opportunities for all age groups 35.7% 40.0% 30.8% 27.3% 25.0% 29.4% 57.6%
PVXYZA2Maintaining and enhancing the visual appearance of buildings and landscaping
30.1% 30.0% 23.1% 27.3% 50.0% 41.2% 27.3%
Improving personal security and public safety 28.0% 10.0% 19.2% 20.5% 25.0% 41.2% 45.5%MS W WXY
Protecting neighborhoods from encroachment by non-residential land uses
25.9% 50.0% 23.1% 20.5% 25.0% 11.8% 36.4%
KQA2 A2Building and maintaining livable neighborhoods 18.9% 30.0% 19.2% 25.0% 16.7% 29.4% 3.0%
B2 B2Encouraging a sustainable region 13.3% 20.0% 11.5% 9.1% 8.3% 23.5% 15.2%Having access to open space (parks, green belts, wooded land) near residential areas
9.1% 10.0% 15.4% 6.8% 8.3% 11.8% 6.1%
Maintaining a low level of environmental pollution 13.3% 10.0% 23.1% 9.1% - 11.8% 15.2%Other 14.7% 10.0% 15.4% 18.2% 16.7% 11.8% 12.1%
BCComparison Groups: ABCD/EFGHIJ/KLMNOP/QRSTUV/WXYZA2B2/EKQW/FLRX/GMSY/HNTZ/IOUA2/JPVB2Independent T-Test for Means (equal variances), Independent Z-Test for PercentagesUpper case letters indicate significance at the 95% level.
1. LEAST IMPORTANT OBJECTIVES which could be used to guide future growth and development in the Centre Region. (Percent selected as one of three least important)
Page 3

2011 Centre Region Community Survey Results - Drop-Ins
Random sample weighted by relative municipality population
Drop-
Ins Drop-
Ins Drop-
Ins Drop-
Ins Drop-
Ins Drop-
Ins Drop-Ins College
Township Ferguson Township
Halfmoon Township
Harris Township
Patton Township
Boro State College
(D) (W) (X) (Y) (Z) (A2) (B2)
TOTAL ANSWERING 145 11 26 44 13 17 33High rate of population growth (An additional 32,000 residents)
7.6% - 3.8% 2.3% 7.7% 5.9% 21.2%
JPVXYModerate rate of population growth (An additional 18,000 residents)
27.6% 36.4% 30.8% 15.9% 15.4% 58.8% 27.3%
IOUYZB2Low rate of population growth (An additional 6,000 residents)
37.2% 36.4% 34.6% 56.8% 23.1% 23.5% 24.2%
MSZA2B2No increase in population 16.6% 9.1% 19.2% 13.6% 53.8% - 15.2%
HNTWXYB2It doesn't matter to me 11.0% 18.2% 11.5% 11.4% - 11.8% 12.1%
Comparison Groups: ABCD/EFGHIJ/KLMNOP/QRSTUV/WXYZA2B2/EKQW/FLRX/GMSY/HNTZ/IOUA2/JPVB2Independent T-Test for Means (equal variances), Independent Z-Test for PercentagesUpper case letters indicate significance at the 95% level.
2. During the next 30 years what rate of population growth would you prefer for the Centre Region? Please check the population number which corresponds to your preference (Check only one).
Page 4

2011 Centre Region Community Survey Results - Drop-Ins
Random sample weighted by relative municipality population
Drop-
Ins Drop-
Ins Drop-
Ins Drop-
Ins Drop-
Ins Drop-
Ins Drop-Ins College
Township Ferguson Township
Halfmoon Township
Harris Township
Patton Township
Boro State College
(D) (W) (X) (Y) (Z) (A2) (B2)
TOTAL ANSWERING 145 11 26 44 13 17 33Balance community growth while protecting and enhancing the Centre Region's environmental, historic, and cultural resources.
86.2% 90.9% 88.5% 90.9% 84.6% 82.4% 78.8%
Maintain a cooperative relationship between the Centre Region municipalities and Penn State University to ensure that future growth at the University benefits the community.
84.1% 54.5% 84.6% 90.9% 84.6% 82.4% 84.8%
MSWPreserve prime farmland for agricultural use. 86.2% 72.7% 84.6% 88.6% 84.6% 88.2% 87.9%Coordinate land development activity with the transportation system for the safe, efficient, and convenient movement of people and goods.
80.0% 54.5% 76.9% 81.8% 84.6% 64.7% 93.9%
WA2Coordinate land development activity with necessary public facilities and services in a cost-effective manner.
77.9% 63.6% 80.8% 77.3% 84.6% 58.8% 87.9%
A2Direct the majority of future growth to areas within the Regional Growth Boundary so that new development can be efficiently served by public utilities, services, and transit.
71.0% 63.6% 73.1% 75.0% 61.5% 76.5% 66.7%
Provide a variety of housing opportunities to satisfy the needs of all existing and future residents of the Centre Region.
70.3% 63.6% 80.8% 63.6% 46.2% 70.6% 81.8%
Z ZObtain additional parkland and open-space areas, and provide a broad range of recreational opportunities.
71.7% 81.8% 69.2% 81.8% 69.2% 64.7% 60.6%
KQ MSB2Preserve and enhance the low-density community character in the rural areas located outside of the Regional Growth Boundary.
75.2% 72.7% 76.9% 86.4% 84.6% 58.8% 63.6%
BC A2B2Comparison Groups: ABCD/EFGHIJ/KLMNOP/QRSTUV/WXYZA2B2/EKQW/FLRX/GMSY/HNTZ/IOUA2/JPVB2Independent T-Test for Means (equal variances), Independent Z-Test for PercentagesUpper case letters indicate significance at the 95% level.
3. RELEVANT GOALS. Please select which best corresponds to your current opinion regarding each of the goals. (Percent selected as "still relevant")
Page 5

2011 Centre Region Community Survey Results - Drop-Ins
Random sample weighted by relative municipality population
Drop-
Ins Drop-
Ins Drop-
Ins Drop-
Ins Drop-
Ins Drop-
Ins Drop-Ins College
Township Ferguson Township
Halfmoon Township
Harris Township
Patton Township
Boro State College
(D) (W) (X) (Y) (Z) (A2) (B2)
TOTAL ANSWERING 145 11 26 44 13 17 33Obtain additional parkland and open-space areas, and provide a broad range of recreational opportunities.
20.0% 9.1% 26.9% 9.1% 15.4% 29.4% 30.3%
YProvide a variety of housing opportunities to satisfy the needs of all existing and future residents of the Centre Region.
20.0% 18.2% 15.4% 25.0% 30.8% 23.5% 12.1%
Preserve and enhance the low-density community character in the rural areas located outside of the Regional Growth Boundary.
12.4% 9.1% 3.8% 11.4% 7.7% 23.5% 18.2%
Direct the majority of future growth to areas within the Regional Growth Boundary so that new development can be efficiently served by public utilities, services, and transit.
14.5% 9.1% 11.5% 13.6% 15.4% 23.5% 15.2%
Preserve prime farmland for agricultural use. 8.3% 9.1% 7.7% 6.8% 15.4% 11.8% 6.1%
Coordinate land development activity with necessary public facilities and services in a cost-effective manner.
10.3% 9.1% 15.4% 6.8% 7.7% 29.4% 3.0%
OUB2Coordinate land development activity with the transportation system for the safe, efficient, and convenient movement of people and goods.
10.3% 18.2% 3.8% 9.1% 15.4% 29.4% 3.0%
OUXB2Maintain a cooperative relationship between the Centre Region municipalities and Penn State University to ensure that future growth at the University benefits the community.
8.3% 27.3% 7.7% 6.8% - 17.6% 3.0%
Balance community growth while protecting and enhancing the Centre Region's environmental, historic, and cultural resources.
7.6% - 7.7% 6.8% 7.7% 17.6% 6.1%
Comparison Groups: ABCD/EFGHIJ/KLMNOP/QRSTUV/WXYZA2B2/EKQW/FLRX/GMSY/HNTZ/IOUA2/JPVB2Independent T-Test for Means (equal variances), Independent Z-Test for PercentagesUpper case letters indicate significance at the 95% level.
3. NO LONGER RELEVANT GOALS. Please select which best corresponds to your current opinion regarding each of the goals. (Percent selected as "no longer relevant")
Page 6

2011 Centre Region Community Survey Results - Drop-Ins
3. Please select which best corresponds to your current opinion regarding the following goal.Balance community growth while protecting and enhancing the Centre Region's environmental, historic, and cultural resources.Random sample weighted by relative municipality population
Drop-
Ins Drop-
Ins Drop-
Ins Drop-
Ins Drop-
Ins Drop-
Ins Drop-Ins College
Township Ferguson Township
Halfmoon Township
Harris Township
Patton Township
Boro State College
(D) (W) (X) (Y) (Z) (A2) (B2)
TOTAL ANSWERING 145 11 26 44 13 17 33Still Relevant 86.2% 90.9% 88.5% 90.9% 84.6% 82.4% 78.8%No Longer Relevant 7.6% - 7.7% 6.8% 7.7% 17.6% 6.1%Don’t Know/Not Sure 4.8% 9.1% 3.8% 2.3% 7.7% - 9.1%Comparison Groups: ABCD/EFGHIJ/KLMNOP/QRSTUV/WXYZA2B2/EKQW/FLRX/GMSY/HNTZ/IOUA2/JPVB2Independent T-Test for Means (equal variances), Independent Z-Test for PercentagesUpper case letters indicate significance at the 95% level.
3. Please select which best corresponds to your current opinion regarding the following goal.
Random sample weighted by relative municipality population
Drop-
Ins Drop-
Ins Drop-
Ins Drop-
Ins Drop-
Ins Drop-
Ins Drop-Ins College
Township Ferguson Township
Halfmoon Township
Harris Township
Patton Township
Boro State College
(D) (W) (X) (Y) (Z) (A2) (B2)
TOTAL ANSWERING 145 11 26 44 13 17 33Still Relevant 71.0% 63.6% 73.1% 75.0% 61.5% 76.5% 66.7%No Longer Relevant 14.5% 9.1% 11.5% 13.6% 15.4% 23.5% 15.2%Don’t Know/Not Sure 14.5% 27.3% 15.4% 11.4% 23.1% - 18.2%Comparison Groups: ABCD/EFGHIJ/KLMNOP/QRSTUV/WXYZA2B2/EKQW/FLRX/GMSY/HNTZ/IOUA2/JPVB2Independent T-Test for Means (equal variances), Independent Z-Test for PercentagesUpper case letters indicate significance at the 95% level.
Direct the majority of future growth to areas within the Regional Growth Boundary so that new development can be efficiently served by public utilities, services, and transit.
Page 7

2011 Centre Region Community Survey Results - Drop-Ins
3. Please select which best corresponds to your current opinion regarding the following goal.
Random sample weighted by relative municipality population
Drop-
Ins Drop-
Ins Drop-
Ins Drop-
Ins Drop-
Ins Drop-
Ins Drop-Ins College
Township Ferguson Township
Halfmoon Township
Harris Township
Patton Township
Boro State College
(D) (W) (X) (Y) (Z) (A2) (B2)
TOTAL ANSWERING 145 11 26 44 13 17 33Still Relevant 75.2% 72.7% 76.9% 86.4% 84.6% 58.8% 63.6%
BC A2B2No Longer Relevant 12.4% 9.1% 3.8% 11.4% 7.7% 23.5% 18.2%
Don’t Know/Not Sure 10.3% 18.2% 19.2% 2.3% 7.7% 17.6% 9.1%Y
Comparison Groups: ABCD/EFGHIJ/KLMNOP/QRSTUV/WXYZA2B2/EKQW/FLRX/GMSY/HNTZ/IOUA2/JPVB2Independent T-Test for Means (equal variances), Independent Z-Test for PercentagesUpper case letters indicate significance at the 95% level.
3. Please select which best corresponds to your current opinion regarding the following goal.Preserve prime farmland for agricultural use.Random sample weighted by relative municipality population
Drop-
Ins Drop-
Ins Drop-
Ins Drop-
Ins Drop-
Ins Drop-
Ins Drop-Ins College
Township Ferguson Township
Halfmoon Township
Harris Township
Patton Township
Boro State College
(D) (W) (X) (Y) (Z) (A2) (B2)
TOTAL ANSWERING 145 11 26 44 13 17 33Still Relevant 86.2% 72.7% 84.6% 88.6% 84.6% 88.2% 87.9%No Longer Relevant 8.3% 9.1% 7.7% 6.8% 15.4% 11.8% 6.1%
Don’t Know/Not Sure 5.5% 18.2% 7.7% 4.5% - - 6.1%
Comparison Groups: ABCD/EFGHIJ/KLMNOP/QRSTUV/WXYZA2B2/EKQW/FLRX/GMSY/HNTZ/IOUA2/JPVB2Independent T-Test for Means (equal variances), Independent Z-Test for PercentagesUpper case letters indicate significance at the 95% level.
Preserve and enhance the low-density community character in the rural areas located outside of the Regional Growth Boundary.
Page 8

2011 Centre Region Community Survey Results - Drop-Ins
3. Please select which best corresponds to your current opinion regarding the following goal.
Random sample weighted by relative municipality population
Drop-
Ins Drop-
Ins Drop-
Ins Drop-
Ins Drop-
Ins Drop-
Ins Drop-Ins College
Township Ferguson Township
Halfmoon Township
Harris Township
Patton Township
Boro State College
(D) (W) (X) (Y) (Z) (A2) (B2)
TOTAL ANSWERING 145 11 26 44 13 17 33Still Relevant 80.0% 54.5% 76.9% 81.8% 84.6% 64.7% 93.9%
WA2No Longer Relevant 10.3% 18.2% 3.8% 9.1% 15.4% 29.4% 3.0%
OUXB2Don’t Know/Not Sure 9.0% 27.3% 19.2% 9.1% - 5.9% -
Comparison Groups: ABCD/EFGHIJ/KLMNOP/QRSTUV/WXYZA2B2/EKQW/FLRX/GMSY/HNTZ/IOUA2/JPVB2Independent T-Test for Means (equal variances), Independent Z-Test for PercentagesUpper case letters indicate significance at the 95% level.
3. Please select which best corresponds to your current opinion regarding the following goal.Coordinate land development activity with necessary public facilities and services in a cost-effective manner.Random sample weighted by relative municipality population
Drop-
Ins Drop-
Ins Drop-
Ins Drop-
Ins Drop-
Ins Drop-
Ins Drop-Ins College
Township Ferguson Township
Halfmoon Township
Harris Township
Patton Township
Boro State College
(D) (W) (X) (Y) (Z) (A2) (B2)
TOTAL ANSWERING 145 11 26 44 13 17 33Still Relevant 77.9% 63.6% 80.8% 77.3% 84.6% 58.8% 87.9%
A2No Longer Relevant 10.3% 9.1% 15.4% 6.8% 7.7% 29.4% 3.0%
OUB2Don’t Know/Not Sure 11.0% 18.2% 3.8% 15.9% 7.7% 11.8% 9.1%
Comparison Groups: ABCD/EFGHIJ/KLMNOP/QRSTUV/WXYZA2B2/EKQW/FLRX/GMSY/HNTZ/IOUA2/JPVB2Independent T-Test for Means (equal variances), Independent Z-Test for PercentagesUpper case letters indicate significance at the 95% level.
Coordinate land development activity with the transportation system for the safe, efficient, and convenient movement of people and goods.
Page 9
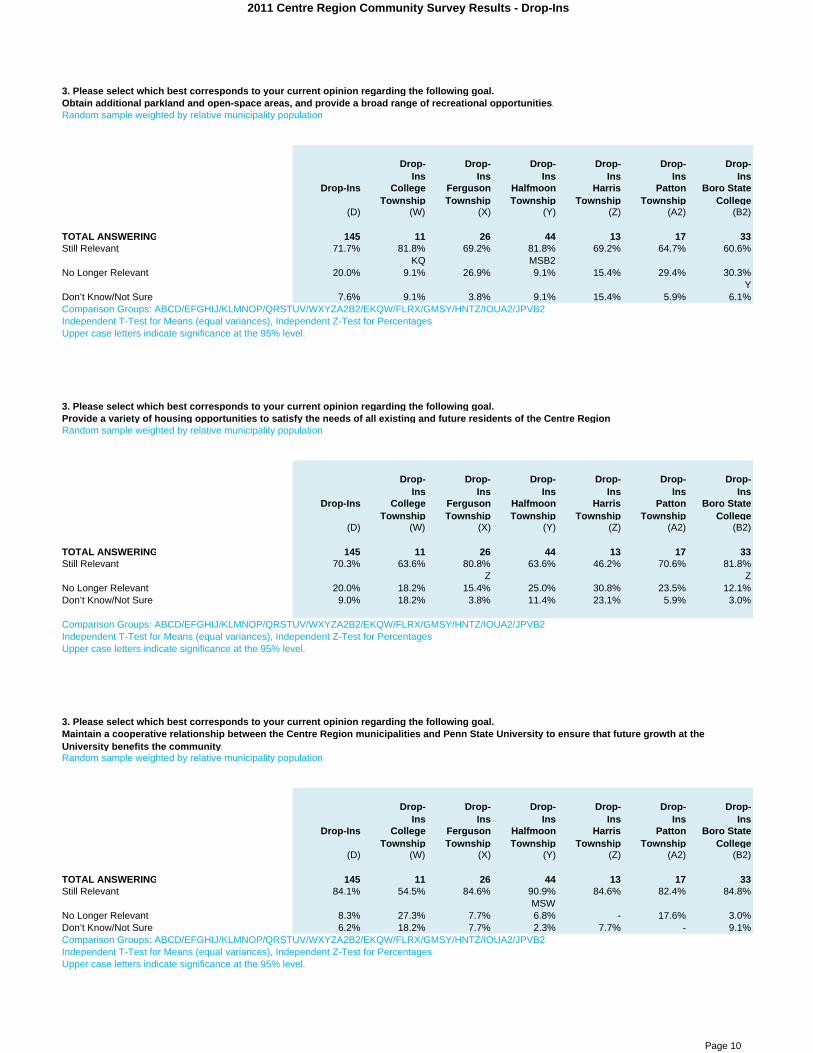
2011 Centre Region Community Survey Results - Drop-Ins
3. Please select which best corresponds to your current opinion regarding the following goal.Obtain additional parkland and open-space areas, and provide a broad range of recreational opportunities.Random sample weighted by relative municipality population
Drop-
Ins Drop-
Ins Drop-
Ins Drop-
Ins Drop-
Ins Drop-
Ins Drop-Ins College
Township Ferguson Township
Halfmoon Township
Harris Township
Patton Township
Boro State College
(D) (W) (X) (Y) (Z) (A2) (B2)
TOTAL ANSWERING 145 11 26 44 13 17 33Still Relevant 71.7% 81.8% 69.2% 81.8% 69.2% 64.7% 60.6%
KQ MSB2No Longer Relevant 20.0% 9.1% 26.9% 9.1% 15.4% 29.4% 30.3%
YDon’t Know/Not Sure 7.6% 9.1% 3.8% 9.1% 15.4% 5.9% 6.1%Comparison Groups: ABCD/EFGHIJ/KLMNOP/QRSTUV/WXYZA2B2/EKQW/FLRX/GMSY/HNTZ/IOUA2/JPVB2Independent T-Test for Means (equal variances), Independent Z-Test for PercentagesUpper case letters indicate significance at the 95% level.
3. Please select which best corresponds to your current opinion regarding the following goal.Provide a variety of housing opportunities to satisfy the needs of all existing and future residents of the Centre RegionRandom sample weighted by relative municipality population
Drop-
Ins Drop-
Ins Drop-
Ins Drop-
Ins Drop-
Ins Drop-
Ins Drop-Ins College
Township Ferguson Township
Halfmoon Township
Harris Township
Patton Township
Boro State College
(D) (W) (X) (Y) (Z) (A2) (B2)
TOTAL ANSWERING 145 11 26 44 13 17 33Still Relevant 70.3% 63.6% 80.8% 63.6% 46.2% 70.6% 81.8%
Z ZNo Longer Relevant 20.0% 18.2% 15.4% 25.0% 30.8% 23.5% 12.1%Don’t Know/Not Sure 9.0% 18.2% 3.8% 11.4% 23.1% 5.9% 3.0%
Comparison Groups: ABCD/EFGHIJ/KLMNOP/QRSTUV/WXYZA2B2/EKQW/FLRX/GMSY/HNTZ/IOUA2/JPVB2Independent T-Test for Means (equal variances), Independent Z-Test for PercentagesUpper case letters indicate significance at the 95% level.
3. Please select which best corresponds to your current opinion regarding the following goal.
Random sample weighted by relative municipality population
Drop-
Ins Drop-
Ins Drop-
Ins Drop-
Ins Drop-
Ins Drop-
Ins Drop-Ins College
Township Ferguson Township
Halfmoon Township
Harris Township
Patton Township
Boro State College
(D) (W) (X) (Y) (Z) (A2) (B2)
TOTAL ANSWERING 145 11 26 44 13 17 33Still Relevant 84.1% 54.5% 84.6% 90.9% 84.6% 82.4% 84.8%
MSWNo Longer Relevant 8.3% 27.3% 7.7% 6.8% - 17.6% 3.0%Don’t Know/Not Sure 6.2% 18.2% 7.7% 2.3% 7.7% - 9.1%Comparison Groups: ABCD/EFGHIJ/KLMNOP/QRSTUV/WXYZA2B2/EKQW/FLRX/GMSY/HNTZ/IOUA2/JPVB2Independent T-Test for Means (equal variances), Independent Z-Test for PercentagesUpper case letters indicate significance at the 95% level.
Maintain a cooperative relationship between the Centre Region municipalities and Penn State University to ensure that future growth at the University benefits the community.
Page 10

2011 Centre Region Community Survey Results - Drop-Ins
MEAN SUMMARY TABLE
4. To what extent do you agree or disagree with the following statements? (Ratings: 5=Stongly agree; 1=Strongly disagree)Random sample weighted by relative municipality population
Drop-
Ins Drop-
Ins Drop-
Ins Drop-
Ins Drop-
Ins Drop-
Ins Drop-Ins College
Township Ferguson Township
Halfmoon Township
Harris Township
Patton Township
Boro State College
(D) (W) (X) (Y) (Z) (A2) (B2)
TOTAL ANSWERING 144 11 26 43 13 17 33The Centre Region should have an overall plan that directs future growth and development to appropriate locations.
4.3 4.5 4.2 4.3 4.1 4.1 4.5
143 11 26 43 13 17 32Municipalities should use regulations, such as zoning or private conservation easements, to preserve natural resources (air, water, soil, forests, etc.)
4.1 3.7 4.3 4.0 4.3 3.9 4.3
144 11 26 43 13 17 33Municipalities should use local tax resources to preserve natural resources (air, water, soil, forests, etc.)
3.9 4.0 4.1 3.7 4.2 3.7 4.1
143 11 26 42 13 17 33Municipalities should use regulations, such as zoning or private conservation easements, to preserve farming.
4.0 3.7 4.0 3.9 4.2 4.1 3.9
144 11 26 43 13 17 33Municipalities should protect historic landmarks and buildings through regulations and law.
3.7 3.6 3.6 3.7 3.5 3.6 3.9
MS143 11 26 43 13 17 32
I would like municipal officials to have a stronger role in controlling new development in the area.
3.4 3.0 3.3 3.4 3.7 3.4 3.4
143 11 26 43 13 16 33Municipalities should use local tax resources to protect historic landmarks and buildings.
3.5 3.7 3.5 3.4 3.8 3.1 3.3
B MS144 11 26 43 13 17 33
Municipalities should use local tax resources to preserve farming
3.4 3.5 3.4 3.3 3.8 3.1 3.3
B144 11 26 43 13 17 33
The economic needs of the area should be the driving force that determines what type of development takes place in the Centre Region.
2.9 3.5 3.0 2.5 2.6 3.3 3.1
Y Y Y142 11 25 43 13 16 33
Individuals and developers should be free to develop land without a lot of controls and restrictions by municipalities.
2.0 2.4 2.2 1.8 1.8 2.1 2.2
143 11 26 42 13 17 33Comparison Groups: ABCD/EFGHIJ/KLMNOP/QRSTUV/WXYZA2B2/EKQW/FLRX/GMSY/HNTZ/IOUA2/JPVB2Independent T-Test for Means (equal variances), Independent Z-Test for PercentagesUpper case letters indicate significance at the 95% level.
Page 11

2011 Centre Region Community Survey Results - Drop-Ins
4. To what extent do you agree or disagree with the following statement?The Centre Region should have an overall plan that directs future growth and development to appropriate locations.Random sample weighted by relative municipality population
Drop-
Ins Drop-
Ins Drop-
Ins Drop-
Ins Drop-
Ins Drop-
Ins Drop-Ins College
Township Ferguson Township
Halfmoon Township
Harris Township
Patton Township
Boro State College
(D) (W) (X) (Y) (Z) (A2) (B2)
TOTAL ANSWERING 143 11 26 43 13 17 32Strongly Agree 51.7% 63.6% 42.3% 55.8% 46.2% 47.1% 53.1%Agree 35.7% 18.2% 38.5% 30.2% 38.5% 41.2% 43.8%
Uncertain/Undecided 6.3% 18.2% 11.5% 7.0% - - 3.1%
Disagree 3.5% - 7.7% 4.7% 7.7% - -
Strongly Disagree 2.8% - - 2.3% 7.7% 11.8% -MEAN 4.3 4.5 4.2 4.3 4.1 4.1 4.5
Comparison Groups: ABCD/EFGHIJ/KLMNOP/QRSTUV/WXYZA2B2/EKQW/FLRX/GMSY/HNTZ/IOUA2/JPVB2Independent T-Test for Means (equal variances), Independent Z-Test for PercentagesUpper case letters indicate significance at the 95% level.
4. To what extent do you agree or disagree with the following statement?I would like municipal officials to have a stronger role in controlling new development in the area.Random sample weighted by relative municipality population
Drop-
Ins Drop-
Ins Drop-
Ins Drop-
Ins Drop-
Ins Drop-
Ins Drop-Ins College
Township Ferguson Township
Halfmoon Township
Harris Township
Patton Township
Boro State College
(D) (W) (X) (Y) (Z) (A2) (B2)
TOTAL ANSWERING 143 11 26 43 13 16 33Strongly Agree 20.3% 9.1% 26.9% 11.6% 30.8% 25.0% 21.2%
BAgree 30.8% 27.3% 26.9% 39.5% 46.2% 18.8% 24.2%Uncertain/Undecided 25.9% 36.4% 11.5% 30.2% - 37.5% 33.3%
X XDisagree 14.7% 9.1% 23.1% 14.0% 7.7% 12.5% 15.2%
Strongly Disagree 8.4% 18.2% 11.5% 4.7% 15.4% 6.3% 6.1%MEAN 3.4 3.0 3.3 3.4 3.7 3.4 3.4Comparison Groups: ABCD/EFGHIJ/KLMNOP/QRSTUV/WXYZA2B2/EKQW/FLRX/GMSY/HNTZ/IOUA2/JPVB2Independent T-Test for Means (equal variances), Independent Z-Test for PercentagesUpper case letters indicate significance at the 95% level.
Page 12

2011 Centre Region Community Survey Results - Drop-Ins
4. To what extent do you agree or disagree with the following statement?Individuals and developers should be free to develop land without a lot of controls and restrictions by municipalities.Random sample weighted by relative municipality population
Drop-
Ins Drop-
Ins Drop-
Ins Drop-
Ins Drop-
Ins Drop-
Ins Drop-Ins College
Township Ferguson Township
Halfmoon Township
Harris Township
Patton Township
Boro State College
(D) (W) (X) (Y) (Z) (A2) (B2)
TOTAL ANSWERING 143 11 26 42 13 17 33Strongly Agree 3.5% - 3.8% 2.4% 7.7% - 6.1%
Agree 11.9% 9.1% 19.2% 7.1% 7.7% 17.6% 12.1%Uncertain/Undecided 10.5% 36.4% 15.4% 2.4% - 11.8% 12.1%
KQYDisagree 31.5% 36.4% 11.5% 42.9% 23.1% 35.3% 30.3%
XStrongly Disagree 42.7% 18.2% 50.0% 45.2% 61.5% 35.3% 39.4%
W NTWMEAN 2.0 2.4 2.2 1.8 1.8 2.1 2.2Comparison Groups: ABCD/EFGHIJ/KLMNOP/QRSTUV/WXYZA2B2/EKQW/FLRX/GMSY/HNTZ/IOUA2/JPVB2Independent T-Test for Means (equal variances), Independent Z-Test for PercentagesUpper case letters indicate significance at the 95% level.
4. To what extent do you agree or disagree with the following statement?The economic needs of the area should be the driving force that determines what type of development takes place in the Centre Region.Random sample weighted by relative municipality population
Drop-
Ins Drop-
Ins Drop-
Ins Drop-
Ins Drop-
Ins Drop-
Ins Drop-Ins College
Township Ferguson Township
Halfmoon Township
Harris Township
Patton Township
Boro State College
(D) (W) (X) (Y) (Z) (A2) (B2)
TOTAL ANSWERING 142 11 25 43 13 16 33Strongly Agree 10.6% 18.2% 4.0% 4.7% 7.7% 12.5% 18.2%
PVAgree 26.8% 45.5% 32.0% 16.3% 23.1% 43.8% 24.2%
YUncertain/Undecided 18.3% 9.1% 28.0% 14.0% 15.4% 12.5% 24.2%Disagree 33.8% 18.2% 28.0% 58.1% 30.8% 25.0% 18.2%
B MSWXA2B2Strongly Disagree 10.6% 9.1% 8.0% 7.0% 23.1% 6.3% 15.2%MEAN 2.9 3.5 3.0 2.5 2.6 3.3 3.1
Y Y YComparison Groups: ABCD/EFGHIJ/KLMNOP/QRSTUV/WXYZA2B2/EKQW/FLRX/GMSY/HNTZ/IOUA2/JPVB2Independent T-Test for Means (equal variances), Independent Z-Test for PercentagesUpper case letters indicate significance at the 95% level.
Page 13

2011 Centre Region Community Survey Results - Drop-Ins
4. To what extent do you agree or disagree with the following statement?Municipalities should use local tax resources to protect historic landmarks and buildings.Random sample weighted by relative municipality population
Drop-
Ins Drop-
Ins Drop-
Ins Drop-
Ins Drop-
Ins Drop-
Ins Drop-Ins College
Township Ferguson Township
Halfmoon Township
Harris Township
Patton Township
Boro State College
(D) (W) (X) (Y) (Z) (A2) (B2)
TOTAL ANSWERING 144 11 26 43 13 17 33Strongly Agree 15.3% - 19.2% 7.0% 30.8% 11.8% 21.2%
BCAgree 38.2% 72.7% 34.6% 48.8% 38.5% 35.3% 18.2%
EKQXA2B2 MSB2Uncertain/Undecided 28.5% 27.3% 30.8% 30.2% 15.4% 17.6% 36.4%Disagree 12.5% - 7.7% 7.0% 15.4% 23.5% 21.2%
Strongly Disagree 5.6% - 7.7% 7.0% - 11.8% 3.0%
MEAN 3.5 3.7 3.5 3.4 3.8 3.1 3.3B MS
Comparison Groups: ABCD/EFGHIJ/KLMNOP/QRSTUV/WXYZA2B2/EKQW/FLRX/GMSY/HNTZ/IOUA2/JPVB2Independent T-Test for Means (equal variances), Independent Z-Test for PercentagesUpper case letters indicate significance at the 95% level.
4. To what extent do you agree or disagree with the following statement? Municipalities should protect historic landmarks and buildings through regulations and law.Random sample weighted by relative municipality population
Drop-
Ins Drop-
Ins Drop-
Ins Drop-
Ins Drop-
Ins Drop-
Ins Drop-Ins College
Township Ferguson Township
Halfmoon Township
Harris Township
Patton Township
Boro State College
(D) (W) (X) (Y) (Z) (A2) (B2)
TOTAL ANSWERING 143 11 26 43 13 17 32Strongly Agree 16.1% - 15.4% 7.0% 23.1% 35.3% 21.9%
YAgree 52.4% 72.7% 42.3% 65.1% 30.8% 29.4% 56.3%
ZA2 MSZA2Uncertain/Undecided 20.3% 18.2% 30.8% 23.3% 23.1% 5.9% 15.6%
A2 A2Disagree 8.4% 9.1% 11.5% 2.3% 23.1% 17.6% 3.1%
Strongly Disagree 2.8% - - 2.3% - 11.8% 3.1%MEAN 3.7 3.6 3.6 3.7 3.5 3.6 3.9
MSComparison Groups: ABCD/EFGHIJ/KLMNOP/QRSTUV/WXYZA2B2/EKQW/FLRX/GMSY/HNTZ/IOUA2/JPVB2Independent T-Test for Means (equal variances), Independent Z-Test for PercentagesUpper case letters indicate significance at the 95% level.
Page 14

2011 Centre Region Community Survey Results - Drop-Ins
4. To what extent do you agree or disagree with the following statement?Municipalities should use local tax resources to preserve natural resources (air, water, soil, forests, etc.)Random sample weighted by relative municipality population
Drop-
Ins Drop-
Ins Drop-
Ins Drop-
Ins Drop-
Ins Drop-
Ins Drop-Ins College
Township Ferguson Township
Halfmoon Township
Harris Township
Patton Township
Boro State College
(D) (W) (X) (Y) (Z) (A2) (B2)
TOTAL ANSWERING 143 11 26 42 13 17 33Strongly Agree 33.6% 36.4% 34.6% 26.2% 46.2% 35.3% 33.3%Agree 42.7% 36.4% 50.0% 42.9% 38.5% 29.4% 48.5%Uncertain/Undecided 13.3% 18.2% 11.5% 14.3% 7.7% 17.6% 12.1%Disagree 5.6% 9.1% - 7.1% 7.7% 5.9% 6.1%Strongly Disagree 4.9% - 3.8% 9.5% - 11.8% -MEAN 3.9 4.0 4.1 3.7 4.2 3.7 4.1
Comparison Groups: ABCD/EFGHIJ/KLMNOP/QRSTUV/WXYZA2B2/EKQW/FLRX/GMSY/HNTZ/IOUA2/JPVB2Independent T-Test for Means (equal variances), Independent Z-Test for PercentagesUpper case letters indicate significance at the 95% level.
4. To what extent do you agree or disagree with the following statement?
Random sample weighted by relative municipality population
Drop-
Ins Drop-
Ins Drop-
Ins Drop-
Ins Drop-
Ins Drop-
Ins Drop-Ins College
Township Ferguson Township
Halfmoon Township
Harris Township
Patton Township
Boro State College
(D) (W) (X) (Y) (Z) (A2) (B2)
TOTAL ANSWERING 144 11 26 43 13 17 33Strongly Agree 44.4% 27.3% 42.3% 37.2% 61.5% 47.1% 51.5%
B NTAgree 36.8% 27.3% 46.2% 41.9% 23.1% 35.3% 33.3%
Uncertain/Undecided 9.0% 36.4% 7.7% 7.0% 7.7% - 9.1%
Disagree 4.9% 9.1% 3.8% 7.0% - - 6.1%Strongly Disagree 4.9% - - 7.0% 7.7% 17.6% -MEAN 4.1 3.7 4.3 4.0 4.3 3.9 4.3
Comparison Groups: ABCD/EFGHIJ/KLMNOP/QRSTUV/WXYZA2B2/EKQW/FLRX/GMSY/HNTZ/IOUA2/JPVB2Independent T-Test for Means (equal variances), Independent Z-Test for PercentagesUpper case letters indicate significance at the 95% level.
Municipalities should use regulations, such as zoning or private conservation easements, to preserve natural resources (air, water, soil, forests, etc.)
Page 15

2011 Centre Region Community Survey Results - Drop-Ins
4. To what extent do you agree or disagree with the following statement?Municipalities should use local tax resources to preserve farmingRandom sample weighted by relative municipality population
Drop-
Ins Drop-
Ins Drop-
Ins Drop-
Ins Drop-
Ins Drop-
Ins Drop-Ins College
Township Ferguson Township
Halfmoon Township
Harris Township
Patton Township
Boro State College
(D) (W) (X) (Y) (Z) (A2) (B2)
TOTAL ANSWERING 144 11 26 43 13 17 33Strongly Agree 20.1% 18.2% 26.9% 11.6% 38.5% 23.5% 15.2%Agree 29.9% 27.3% 26.9% 39.5% 30.8% 23.5% 24.2%
Uncertain/Undecided 25.0% 36.4% 19.2% 25.6% 15.4% 11.8% 36.4%A2
Disagree 17.4% 18.2% 15.4% 16.3% 7.7% 23.5% 21.2%
Strongly Disagree 7.6% - 11.5% 7.0% 7.7% 17.6% 3.0%
MEAN 3.4 3.5 3.4 3.3 3.8 3.1 3.3B
Comparison Groups: ABCD/EFGHIJ/KLMNOP/QRSTUV/WXYZA2B2/EKQW/FLRX/GMSY/HNTZ/IOUA2/JPVB2Independent T-Test for Means (equal variances), Independent Z-Test for PercentagesUpper case letters indicate significance at the 95% level.
4. To what extent do you agree or disagree with the following statement?Municipalities should use regulations, such as zoning or private conservation easements, to preserve farming.Random sample weighted by relative municipality population
Drop-
Ins Drop-
Ins Drop-
Ins Drop-
Ins Drop-
Ins Drop-
Ins Drop-Ins College
Township Ferguson Township
Halfmoon Township
Harris Township
Patton Township
Boro State College
(D) (W) (X) (Y) (Z) (A2) (B2)
TOTAL ANSWERING 144 11 26 43 13 17 33Strongly Agree 34.7% 18.2% 34.6% 32.6% 46.2% 58.8% 24.2%
BC IOUWB2Agree 38.9% 45.5% 38.5% 41.9% 38.5% 17.6% 45.5%
A2 A2Uncertain/Undecided 18.1% 27.3% 19.2% 16.3% 7.7% 5.9% 27.3%
A2Disagree 4.9% 9.1% 7.7% 4.7% - 5.9% 3.0%Strongly Disagree 3.5% - - 4.7% 7.7% 11.8% -MEAN 4.0 3.7 4.0 3.9 4.2 4.1 3.9Comparison Groups: ABCD/EFGHIJ/KLMNOP/QRSTUV/WXYZA2B2/EKQW/FLRX/GMSY/HNTZ/IOUA2/JPVB2Independent T-Test for Means (equal variances), Independent Z-Test for PercentagesUpper case letters indicate significance at the 95% level.
Page 16

2011 Centre Region Community Survey Results - Drop-Ins
5. Please place the following land use issues in the Centre Region in priority order. First, what is the MOST important priority?Random sample weighted by relative municipality population
Drop-
Ins Drop-
Ins Drop-
Ins Drop-
Ins Drop-
Ins Drop-
Ins Drop-Ins College
Township Ferguson Township
Halfmoon Township
Harris Township
Patton Township
Boro State College
(D) (W) (X) (Y) (Z) (A2) (B2)
TOTAL ANSWERING 145 11 26 44 13 17 33Preservation of natural resources (air, water, soil, forests, etc.)
54.5% 63.6% 53.8% 68.2% 69.2% 47.1% 33.3%
B2 B2Preservation of farming 13.8% - 23.1% 20.5% 7.7% - 9.1%
Preservation of established neighborhoods. 11.0% 18.2% 11.5% 4.5% - 23.5% 15.2%
Redevelopment of older shopping centers. 12.4% 18.2% 7.7% 2.3% 7.7% 5.9% 33.3%JPVXYZA2
Diversify businesses in downtown State College. 8.3% - 3.8% 4.5% 15.4% 23.5% 9.1%Comparison Groups: ABCD/EFGHIJ/KLMNOP/QRSTUV/WXYZA2B2/EKQW/FLRX/GMSY/HNTZ/IOUA2/JPVB2Independent T-Test for Means (equal variances), Independent Z-Test for PercentagesUpper case letters indicate significance at the 95% level.
5. Of the remaining factors, what do you think is the next (second) most important land use issue?Random sample weighted by relative municipality population
Drop-
Ins Drop-
Ins Drop-
Ins Drop-
Ins Drop-
Ins Drop-
Ins Drop-Ins College
Township Ferguson Township
Halfmoon Township
Harris Township
Patton Township
Boro State College
(D) (W) (X) (Y) (Z) (A2) (B2)
TOTAL ANSWERING 143 11 26 44 13 15 33Preservation of farming 38.5% 27.3% 23.1% 52.3% 46.2% 80.0% 15.2%
BC MSXB2 B2 IOUWXYZB2Preservation of established neighborhoods. 19.6% 9.1% 23.1% 20.5% 38.5% - 21.2%
Preservation of natural resources (air, water, soil, forests, etc.)
17.5% 9.1% 26.9% 18.2% - 6.7% 21.2%
Redevelopment of older shopping centers. 15.4% 27.3% 19.2% 6.8% 15.4% 13.3% 21.2%Diversify businesses in downtown State College. 9.1% 27.3% 7.7% 2.3% - - 21.2%
YComparison Groups: ABCD/EFGHIJ/KLMNOP/QRSTUV/WXYZA2B2/EKQW/FLRX/GMSY/HNTZ/IOUA2/JPVB2Independent T-Test for Means (equal variances), Independent Z-Test for PercentagesUpper case letters indicate significance at the 95% level.
Page 17

2011 Centre Region Community Survey Results - Drop-Ins
5. What is the next (third) most important land use issue?Random sample weighted by relative municipality population
Drop-
Ins Drop-
Ins Drop-
Ins Drop-
Ins Drop-
Ins Drop-
Ins Drop-Ins College
Township Ferguson Township
Halfmoon Township
Harris Township
Patton Township
Boro State College
(D) (W) (X) (Y) (Z) (A2) (B2)
TOTAL ANSWERING 142 11 26 44 13 15 33Preservation of established neighborhoods. 27.5% 45.5% 11.5% 43.2% 38.5% 6.7% 18.2%
XA2 XA2B2 A2Redevelopment of older shopping centers. 23.2% 18.2% 46.2% 20.5% 23.1% 46.7% -
FLRYPreservation of farming 16.2% 9.1% 19.2% 11.4% 23.1% - 27.3%Diversify businesses in downtown State College. 15.5% 9.1% 11.5% 13.6% 7.7% 13.3% 27.3%
Preservation of natural resources (air, water, soil, forests, etc.)
17.6% 18.2% 11.5% 11.4% 7.7% 33.3% 27.3%
IOUComparison Groups: ABCD/EFGHIJ/KLMNOP/QRSTUV/WXYZA2B2/EKQW/FLRX/GMSY/HNTZ/IOUA2/JPVB2Independent T-Test for Means (equal variances), Independent Z-Test for PercentagesUpper case letters indicate significance at the 95% level.
5. And, what is the next (fourth) most important land use issue?Random sample weighted by relative municipality population
Drop-
Ins Drop-
Ins Drop-
Ins Drop-
Ins Drop-
Ins Drop-
Ins Drop-Ins College
Township Ferguson Township
Halfmoon Township
Harris Township
Patton Township
Boro State College
(D) (W) (X) (Y) (Z) (A2) (B2)
TOTAL ANSWERING 142 11 26 44 13 15 33Redevelopment of older shopping centers. 27.5% 18.2% 19.2% 45.5% 30.8% 20.0% 15.2%
WXA2B2Diversify businesses in downtown State College. 25.4% 18.2% 23.1% 27.3% 38.5% 20.0% 24.2%Preservation of established neighborhoods. 28.2% 18.2% 46.2% 20.5% 15.4% 46.7% 24.2%
LRYZPreservation of farming 14.8% 45.5% 7.7% 6.8% - 6.7% 30.3%
XYA2 XYA2Preservation of natural resources (air, water, soil, forests, etc.)
4.2% - 3.8% - 15.4% 6.7% 6.1%
Comparison Groups: ABCD/EFGHIJ/KLMNOP/QRSTUV/WXYZA2B2/EKQW/FLRX/GMSY/HNTZ/IOUA2/JPVB2Independent T-Test for Means (equal variances), Independent Z-Test for PercentagesUpper case letters indicate significance at the 95% level.
Page 18

2011 Centre Region Community Survey Results - Drop-Ins
5. LEAST important land use issue:Random sample weighted by relative municipality population
Drop-
Ins Drop-
Ins Drop-
Ins Drop-
Ins Drop-
Ins Drop-
Ins Drop-Ins College
Township Ferguson Township
Halfmoon Township
Harris Township
Patton Township
Boro State College
(D) (W) (X) (Y) (Z) (A2) (B2)
TOTAL ANSWERING 142 11 26 44 13 15 33Diversify businesses in downtown State College. 43.0% 45.5% 53.8% 52.3% 38.5% 53.3% 18.2%
B2 B2 B2Redevelopment of older shopping centers. 21.1% 18.2% 7.7% 25.0% 23.1% 13.3% 30.3%
X XPreservation of farming 16.9% 18.2% 26.9% 9.1% 23.1% 13.3% 18.2%
Preservation of established neighborhoods. 13.4% 9.1% 7.7% 11.4% 7.7% 20.0% 21.2%Preservation of natural resources (air, water, soil, forests, etc.)
5.6% 9.1% 3.8% 2.3% 7.7% - 12.1%
Comparison Groups: ABCD/EFGHIJ/KLMNOP/QRSTUV/WXYZA2B2/EKQW/FLRX/GMSY/HNTZ/IOUA2/JPVB2Independent T-Test for Means (equal variances), Independent Z-Test for PercentagesUpper case letters indicate significance at the 95% level.
Page 19
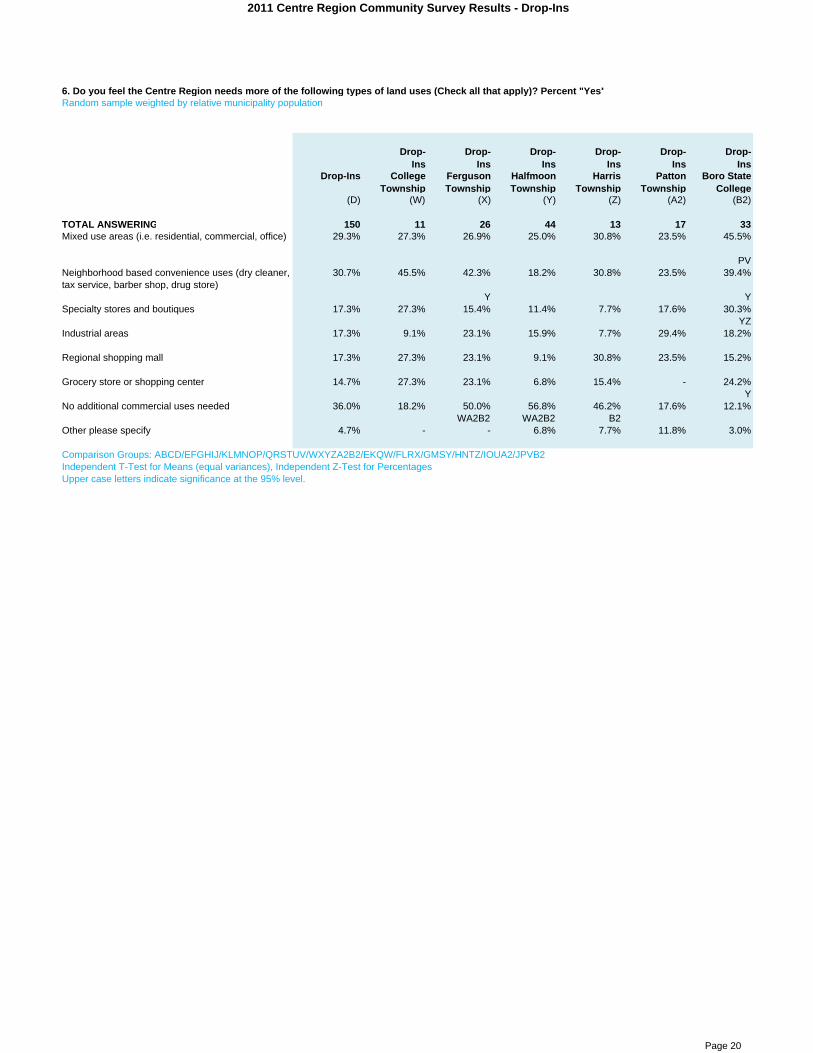
2011 Centre Region Community Survey Results - Drop-Ins
6. Do you feel the Centre Region needs more of the following types of land uses (Check all that apply)? Percent "Yes"Random sample weighted by relative municipality population
Drop-
Ins Drop-
Ins Drop-
Ins Drop-
Ins Drop-
Ins Drop-
Ins Drop-Ins College
Township Ferguson Township
Halfmoon Township
Harris Township
Patton Township
Boro State College
(D) (W) (X) (Y) (Z) (A2) (B2)
TOTAL ANSWERING 150 11 26 44 13 17 33Mixed use areas (i.e. residential, commercial, office) 29.3% 27.3% 26.9% 25.0% 30.8% 23.5% 45.5%
PVNeighborhood based convenience uses (dry cleaner, tax service, barber shop, drug store)
30.7% 45.5% 42.3% 18.2% 30.8% 23.5% 39.4%
Y YSpecialty stores and boutiques 17.3% 27.3% 15.4% 11.4% 7.7% 17.6% 30.3%
YZIndustrial areas 17.3% 9.1% 23.1% 15.9% 7.7% 29.4% 18.2%
Regional shopping mall 17.3% 27.3% 23.1% 9.1% 30.8% 23.5% 15.2%
Grocery store or shopping center 14.7% 27.3% 23.1% 6.8% 15.4% - 24.2%Y
No additional commercial uses needed 36.0% 18.2% 50.0% 56.8% 46.2% 17.6% 12.1%WA2B2 WA2B2 B2
Other please specify 4.7% - - 6.8% 7.7% 11.8% 3.0%
Comparison Groups: ABCD/EFGHIJ/KLMNOP/QRSTUV/WXYZA2B2/EKQW/FLRX/GMSY/HNTZ/IOUA2/JPVB2Independent T-Test for Means (equal variances), Independent Z-Test for PercentagesUpper case letters indicate significance at the 95% level.
Page 20

2011 Centre Region Community Survey Results - Drop-Ins
7. Do you feel your neighborhood needs more of the following types of land uses (Check all that apply)? Percent "Yes"Random sample weighted by relative municipality population
Drop-
Ins Drop-
Ins Drop-
Ins Drop-
Ins Drop-
Ins Drop-
Ins Drop-Ins College
Township Ferguson Township
Halfmoon Township
Harris Township
Patton Township
Boro State College
(D) (W) (X) (Y) (Z) (A2) (B2)
TOTAL ANSWERING 150 11 26 44 13 17 33Neighborhood based convenience uses (dry cleaner, tax service, barber shop, drug store)
30.7% 27.3% 30.8% 22.7% 30.8% 41.2% 42.4%
ABC OU JPVMixed use areas (i.e. residential, commercial, office) 20.7% 27.3% 11.5% 11.4% 30.8% 11.8% 42.4%
ABC JPVXYA2Grocery store or shopping center 12.7% 18.2% 11.5% 11.4% 15.4% 5.9% 18.2%
Specialty stores and boutiques 14.0% 18.2% 7.7% 9.1% 23.1% 17.6% 21.2%Regional shopping mall 5.3% 9.1% 7.7% 2.3% 7.7% 11.8% 3.0%
Industrial areas 2.0% - - 2.3% - 11.8% -No additional commercial uses needed 46.7% 45.5% 50.0% 65.9% 38.5% 47.1% 30.3%
MSB2Other please specify 8.0% 9.1% 3.8% 6.8% 23.1% 11.8% 6.1%
Comparison Groups: ABCD/EFGHIJ/KLMNOP/QRSTUV/WXYZA2B2/EKQW/FLRX/GMSY/HNTZ/IOUA2/JPVB2Independent T-Test for Means (equal variances), Independent Z-Test for PercentagesUpper case letters indicate significance at the 95% level.
Page 21

2011 Centre Region Community Survey Results - Drop-Ins
Attitudes about Housing in the Centre Region
Random sample weighted by relative municipality population
Drop-
Ins Drop-
Ins Drop-
Ins Drop-
Ins Drop-
Ins Drop-
Ins Drop-Ins College
Township Ferguson Township
Halfmoon Township
Harris Township
Patton Township
Boro State College
(D) (W) (X) (Y) (Z) (A2) (B2)
TOTAL ANSWERING 145 11 26 44 13 17 33Affordable rental or for-sale housing 28.3% 36.4% 30.8% 25.0% 7.7% 29.4% 36.4%
Z ZOwner-occupied housing 24.1% 9.1% 30.8% 27.3% 38.5% 17.6% 15.2%
Housing that is clustered together to preserve farms and natural areas
22.8% 18.2% 15.4% 31.8% 15.4% 29.4% 18.2%
Housing located within walking distance of work, shopping, or bus service
15.9% 18.2% 11.5% 11.4% 38.5% 5.9% 21.2%
NTA2Better mix of housing types (single-family detached, townhouse, duplex, apartment)
5.5% 18.2% 7.7% - - 5.9% 9.1%
Other (please specify) 3.4% - 3.8% 4.5% - 11.8% -Comparison Groups: ABCD/EFGHIJ/KLMNOP/QRSTUV/WXYZA2B2/EKQW/FLRX/GMSY/HNTZ/IOUA2/JPVB2Independent T-Test for Means (equal variances), Independent Z-Test for PercentagesUpper case letters indicate significance at the 95% level.
Random sample weighted by relative municipality population
Drop-
Ins Drop-
Ins Drop-
Ins Drop-
Ins Drop-
Ins Drop-
Ins Drop-Ins College
Township Ferguson Township
Halfmoon Township
Harris Township
Patton Township
Boro State College
(D) (W) (X) (Y) (Z) (A2) (B2)
TOTAL ANSWERING 145 11 26 44 13 17 33Housing located within walking distance of work, shopping, or bus service
23.4% 18.2% 30.8% 27.3% 15.4% 11.8% 24.2%
Affordable rental or for-sale housing 21.4% 27.3% 11.5% 22.7% 15.4% 41.2% 18.2%OUX
Housing that is clustered together to preserve farms and natural areas
22.1% 9.1% 23.1% 25.0% 38.5% 5.9% 21.2%
A2 A2Owner-occupied housing 17.2% 36.4% 23.1% 2.3% 7.7% 17.6% 30.3%
Y Y YZBetter mix of housing types (single-family detached, townhouse, duplex, apartment)
9.7% 9.1% 3.8% 18.2% - 11.8% 6.1%
XOther (please specify) 6.2% - 7.7% 4.5% 23.1% 11.8% -
CComparison Groups: ABCD/EFGHIJ/KLMNOP/QRSTUV/WXYZA2B2/EKQW/FLRX/GMSY/HNTZ/IOUA2/JPVB2Independent T-Test for Means (equal variances), Independent Z-Test for PercentagesUpper case letters indicate significance at the 95% level.
8. How important is it to provide more of the following housing characteristics in the Centre Region? Which is MOST important?
8. How important is it to provide more of the following housing characteristics in the Centre Region? What's next (second) most important?
Page 22

2011 Centre Region Community Survey Results - Drop-Ins
Random sample weighted by relative municipality population
Drop-
Ins Drop-
Ins Drop-
Ins Drop-
Ins Drop-
Ins Drop-
Ins Drop-Ins College
Township Ferguson Township
Halfmoon Township
Harris Township
Patton Township
Boro State College
(D) (W) (X) (Y) (Z) (A2) (B2)
TOTAL ANSWERING 143 10 26 44 13 16 33Housing located within walking distance of work, shopping, or bus service
21.7% 20.0% 23.1% 15.9% 7.7% 31.3% 30.3%
ZHousing that is clustered together to preserve farms and natural areas
15.4% 20.0% 11.5% 18.2% 15.4% 18.8% 12.1%
Better mix of housing types (single-family detached, townhouse, duplex, apartment)
20.3% 10.0% 26.9% 15.9% 23.1% 25.0% 21.2%
Affordable rental or for-sale housing 18.2% 30.0% 15.4% 20.5% 15.4% 6.3% 18.2%Owner-occupied housing 18.2% 10.0% 11.5% 25.0% 30.8% 12.5% 15.2%
Other (please specify) 6.3% 10.0% 11.5% 4.5% 7.7% 6.3% 3.0%BC
Comparison Groups: ABCD/EFGHIJ/KLMNOP/QRSTUV/WXYZA2B2/EKQW/FLRX/GMSY/HNTZ/IOUA2/JPVB2Independent T-Test for Means (equal variances), Independent Z-Test for PercentagesUpper case letters indicate significance at the 95% level.
8. How important is it to provide more of the following housing characteristics in the Centre Region? What's next (fourth) most important?Random sample weighted by relative municipality population
Drop-
Ins Drop-
Ins Drop-
Ins Drop-
Ins Drop-
Ins Drop-
Ins Drop-Ins College
Township Ferguson Township
Halfmoon Township
Harris Township
Patton Township
Boro State College
(D) (W) (X) (Y) (Z) (A2) (B2)
TOTAL ANSWERING 140 9 26 43 13 16 32Better mix of housing types (single-family detached, townhouse, duplex, apartment)
23.6% 22.2% 23.1% 23.3% - 6.3% 40.6%
A2Housing located within walking distance of work, shopping, or bus service
24.3% 22.2% 11.5% 30.2% 30.8% 31.3% 21.9%
XHousing that is clustered together to preserve farms and natural areas
17.9% 22.2% 15.4% 20.9% 23.1% 18.8% 12.5%
Owner-occupied housing 15.7% 22.2% 7.7% 16.3% 15.4% 31.3% 12.5%
Affordable rental or for-sale housing 12.1% 11.1% 23.1% 9.3% 15.4% 6.3% 9.4%Other (please specify) 6.4% - 19.2% - 15.4% 6.3% 3.1%
ABC FComparison Groups: ABCD/EFGHIJ/KLMNOP/QRSTUV/WXYZA2B2/EKQW/FLRX/GMSY/HNTZ/IOUA2/JPVB2Independent T-Test for Means (equal variances), Independent Z-Test for PercentagesUpper case letters indicate significance at the 95% level.
8. How important is it to provide more of the following housing characteristics in the Centre Region? What's next (third) most important?
Page 23

2011 Centre Region Community Survey Results - Drop-Ins
8. How important is it to provide more of the following housing characteristics in the Centre Region? What's next (fifth) most important?Random sample weighted by relative municipality population
Drop-
Ins Drop-
Ins Drop-
Ins Drop-
Ins Drop-
Ins Drop-
Ins Drop-Ins College
Township Ferguson Township
Halfmoon Township
Harris Township
Patton Township
Boro State College
(D) (W) (X) (Y) (Z) (A2) (B2)
TOTAL ANSWERING 135 9 25 42 12 16 31Better mix of housing types (single-family detached, townhouse, duplex, apartment)
33.3% 33.3% 16.0% 42.9% 58.3% 43.8% 19.4%
XB2 XB2Owner-occupied housing 20.0% 33.3% 20.0% 19.0% 8.3% 12.5% 25.8%Housing that is clustered together to preserve farms and natural areas
14.1% 22.2% 20.0% - - 18.8% 29.0%
Housing located within walking distance of work, shopping, or bus service
10.4% 11.1% 16.0% 14.3% - 12.5% 3.2%
Affordable rental or for-sale housing 12.6% - 4.0% 16.7% 25.0% 6.3% 16.1%Other (please specify) 9.6% - 24.0% 7.1% 8.3% 6.3% 6.5%
ABC FComparison Groups: ABCD/EFGHIJ/KLMNOP/QRSTUV/WXYZA2B2/EKQW/FLRX/GMSY/HNTZ/IOUA2/JPVB2Independent T-Test for Means (equal variances), Independent Z-Test for PercentagesUpper case letters indicate significance at the 95% level.
Page 24

2011 Centre Region Community Survey Results - Drop-Ins
9. How important is it to increase each of the following housing types in the Centre Region? First, which is MOST important?Random sample weighted by relative municipality population
Drop-
Ins Drop-
Ins Drop-
Ins Drop-
Ins Drop-
Ins Drop-
Ins Drop-Ins College
Township Ferguson Township
Halfmoon Township
Harris Township
Patton Township
Boro State College
(D) (W) (X) (Y) (Z) (A2) (B2)
TOTAL ANSWERING 135 11 23 41 12 14 33Single-family detached homes 53.3% 63.6% 47.8% 56.1% 50.0% 64.3% 45.5%
Senior housing (55+) 17.8% 9.1% 30.4% 22.0% 16.7% 14.3% 9.1%B2
Condiminiums or townhouses 11.9% 18.2% 8.7% 9.8% 8.3% 14.3% 15.2%Apartment buildings/complexes 5.2% 9.1% 4.3% 4.9% 8.3% - 6.1%
Apartments in single-family homes 5.2% - - 2.4% - 7.1% 15.2%
Duplexes 3.7% - - 2.4% 8.3% - 9.1%Mobile homes 3.0% - 8.7% 2.4% 8.3% - -Comparison Groups: ABCD/EFGHIJ/KLMNOP/QRSTUV/WXYZA2B2/EKQW/FLRX/GMSY/HNTZ/IOUA2/JPVB2Independent T-Test for Means (equal variances), Independent Z-Test for PercentagesUpper case letters indicate significance at the 95% level.
Random sample weighted by relative municipality population
Drop-
Ins Drop-
Ins Drop-
Ins Drop-
Ins Drop-
Ins Drop-
Ins Drop-Ins College
Township Ferguson Township
Halfmoon Township
Harris Township
Patton Township
Boro State College
(D) (W) (X) (Y) (Z) (A2) (B2)
TOTAL ANSWERING 134 10 23 41 12 14 33Condiminiums or townhouses 19.4% 20.0% 21.7% 26.8% 8.3% 21.4% 9.1%
MSB2Senior housing (55+) 20.9% 20.0% 17.4% 24.4% 25.0% 28.6% 15.2%Single-family detached homes 19.4% 10.0% 26.1% 17.1% 25.0% 21.4% 18.2%
Duplexes 17.2% 10.0% 13.0% 14.6% 16.7% 14.3% 27.3%
Apartments in single-family homes 9.7% 10.0% 13.0% 7.3% 16.7% 7.1% 9.1%Apartment buildings/complexes 11.2% 10.0% 8.7% 7.3% 8.3% 7.1% 21.2%Mobile homes 2.2% 20.0% - 2.4% - - -Comparison Groups: ABCD/EFGHIJ/KLMNOP/QRSTUV/WXYZA2B2/EKQW/FLRX/GMSY/HNTZ/IOUA2/JPVB2Independent T-Test for Means (equal variances), Independent Z-Test for PercentagesUpper case letters indicate significance at the 95% level.
9. How important is it to increase each of the following housing types in the Centre Region? Of those remaining, which would you say is the second most important?
Page 25

2011 Centre Region Community Survey Results - Drop-Ins
Random sample weighted by relative municipality population
Drop-
Ins Drop-
Ins Drop-
Ins Drop-
Ins Drop-
Ins Drop-
Ins Drop-Ins College
Township Ferguson Township
Halfmoon Township
Harris Township
Patton Township
Boro State College
(D) (W) (X) (Y) (Z) (A2) (B2)
TOTAL ANSWERING 134 10 23 41 12 14 33Condiminiums or townhouses 26.1% 30.0% 17.4% 26.8% 16.7% 42.9% 27.3%Duplexes 26.1% 20.0% 34.8% 26.8% 8.3% 28.6% 27.3%
Z MSSenior housing (55+) 11.2% - 13.0% 9.8% 16.7% 7.1% 12.1%Apartments in single-family homes 19.4% 20.0% 17.4% 17.1% 41.7% 7.1% 21.2%
BC A2Apartment buildings/complexes 9.0% 10.0% 4.3% 9.8% 8.3% 7.1% 12.1%Single-family detached homes 5.2% 20.0% 8.7% 4.9% 8.3% - -
Mobile homes 3.0% - 4.3% 4.9% - 7.1% -Comparison Groups: ABCD/EFGHIJ/KLMNOP/QRSTUV/WXYZA2B2/EKQW/FLRX/GMSY/HNTZ/IOUA2/JPVB2Independent T-Test for Means (equal variances), Independent Z-Test for PercentagesUpper case letters indicate significance at the 95% level.
Random sample weighted by relative municipality population
Drop-
Ins Drop-
Ins Drop-
Ins Drop-
Ins Drop-
Ins Drop-
Ins Drop-Ins College
Township Ferguson Township
Halfmoon Township
Harris Township
Patton Township
Boro State College
(D) (W) (X) (Y) (Z) (A2) (B2)
TOTAL ANSWERING 134 10 23 41 12 14 33Duplexes 25.4% 40.0% 21.7% 26.8% 16.7% 21.4% 27.3%Condiminiums or townhouses 20.9% 10.0% 30.4% 12.2% 50.0% 21.4% 18.2%
WYB2Apartment buildings/complexes 20.9% 40.0% 30.4% 24.4% - 7.1% 18.2%
A2Apartments in single-family homes 13.4% 10.0% 4.3% 17.1% 25.0% 14.3% 9.1%
Senior housing (55+) 9.0% - 13.0% 7.3% 8.3% 21.4% 6.1%Single-family detached homes 7.5% - - 9.8% - 7.1% 15.2%
Mobile homes 3.0% - - 2.4% - 7.1% 6.1%
Comparison Groups: ABCD/EFGHIJ/KLMNOP/QRSTUV/WXYZA2B2/EKQW/FLRX/GMSY/HNTZ/IOUA2/JPVB2Independent T-Test for Means (equal variances), Independent Z-Test for PercentagesUpper case letters indicate significance at the 95% level.
9. How important is it to increase each of the following housing types in the Centre Region? Which would you say is the next (third) most important?
9. How important is it to increase each of the following housing types in the Centre Region? Which would you say is the next (fourth) most important?
Page 26

2011 Centre Region Community Survey Results - Drop-Ins
Random sample weighted by relative municipality population
Drop-
Ins Drop-
Ins Drop-
Ins Drop-
Ins Drop-
Ins Drop-
Ins Drop-Ins College
Township Ferguson Township
Halfmoon Township
Harris Township
Patton Township
Boro State College
(D) (W) (X) (Y) (Z) (A2) (B2)
TOTAL ANSWERING 130 9 23 41 11 13 33Apartment buildings/complexes 22.3% 11.1% 17.4% 24.4% 9.1% 61.5% 15.2%
IOUWXYZB2Apartments in single-family homes 17.7% 22.2% 21.7% 26.8% - - 15.2%
Duplexes 13.1% 11.1% 13.0% 9.8% 45.5% 23.1% 3.0%YB2
Mobile homes 10.0% - 8.7% 9.8% 18.2% 7.7% 12.1%
Senior housing (55+) 16.2% 33.3% 17.4% 14.6% - - 24.2%
Condiminiums or townhouses 11.5% 11.1% 13.0% 9.8% 18.2% - 15.2%Single-family detached homes 9.2% 11.1% 8.7% 4.9% 9.1% 7.7% 15.2%
Comparison Groups: ABCD/EFGHIJ/KLMNOP/QRSTUV/WXYZA2B2/EKQW/FLRX/GMSY/HNTZ/IOUA2/JPVB2Independent T-Test for Means (equal variances), Independent Z-Test for PercentagesUpper case letters indicate significance at the 95% level.
9. How important is it to increase each of the following housing types in the Centre Region? Which would you say is the next (fifth) most important?
Page 27

2011 Centre Region Community Survey Results - Drop-Ins
Random sample weighted by relative municipality population
Drop-
Ins Drop-
Ins Drop-
Ins Drop-
Ins Drop-
Ins Drop-
Ins Drop-Ins College
Township Ferguson Township
Halfmoon Township
Harris Township
Patton Township
Boro State College
(D) (W) (X) (Y) (Z) (A2) (B2)
TOTAL ANSWERING 144 11 26 44 13 17 32Yes 39.6% 54.5% 26.9% 38.6% 23.1% 29.4% 59.4%
XZA2No 52.1% 36.4% 57.7% 52.3% 69.2% 70.6% 34.4%
B2 B2Don't Know 8.3% 9.1% 15.4% 9.1% 7.7% - 6.3%
BCComparison Groups: ABCD/EFGHIJ/KLMNOP/QRSTUV/WXYZA2B2/EKQW/FLRX/GMSY/HNTZ/IOUA2/JPVB2Independent T-Test for Means (equal variances), Independent Z-Test for PercentagesUpper case letters indicate significance at the 95% level.
10. Do you spend more than 30% of your household income on housing costs (Housing costs include principal, interest, insurance and taxes for homeowners; rent and utilities for renters)?
Page 28

2011 Centre Region Community Survey Results - Drop-Ins
11. Do you feel there is enough rental housing available in your price range in the Centre Region?Random sample weighted by relative municipality population
Drop-
Ins Drop-
Ins Drop-
Ins Drop-
Ins Drop-
Ins Drop-
Ins Drop-Ins College
Township Ferguson Township
Halfmoon Township
Harris Township
Patton Township
Boro State College
(D) (W) (X) (Y) (Z) (A2) (B2)
TOTAL ANSWERING 145 11 26 44 13 17 33Yes 29.0% 27.3% 19.2% 27.3% 53.8% 35.3% 24.2%
XNo 44.1% 45.5% 46.2% 29.5% 30.8% 52.9% 63.6%
JPVYZDon't Know 26.9% 27.3% 34.6% 43.2% 15.4% 11.8% 12.1%
B2 ZA2B2Comparison Groups: ABCD/EFGHIJ/KLMNOP/QRSTUV/WXYZA2B2/EKQW/FLRX/GMSY/HNTZ/IOUA2/JPVB2Independent T-Test for Means (equal variances), Independent Z-Test for PercentagesUpper case letters indicate significance at the 95% level.
Page 29

2011 Centre Region Community Survey Results - Drop-Ins
12. Do you feel there are enough homes available for purchase in your price range in the Centre Region?Random sample weighted by relative municipality population
Drop-
Ins Drop-
Ins Drop-
Ins Drop-
Ins Drop-
Ins Drop-
Ins Drop-Ins College
Township Ferguson Township
Halfmoon Township
Harris Township
Patton Township
Boro State College
(D) (W) (X) (Y) (Z) (A2) (B2)
TOTAL ANSWERING 144 11 26 43 13 17 33Yes 38.2% 27.3% 38.5% 44.2% 61.5% 41.2% 21.2%
B2 B2No 46.5% 54.5% 46.2% 37.2% 38.5% 41.2% 63.6%
PVYDon't Know 15.3% 18.2% 15.4% 18.6% - 17.6% 15.2%
Comparison Groups: ABCD/EFGHIJ/KLMNOP/QRSTUV/WXYZA2B2/EKQW/FLRX/GMSY/HNTZ/IOUA2/JPVB2Independent T-Test for Means (equal variances), Independent Z-Test for PercentagesUpper case letters indicate significance at the 95% level.
Page 30

2011 Centre Region Community Survey Results - Drop-Ins
Attitudes about Community Services and Facilities
MEAN SUMMARY TABLE
13. Are you satisfied with the public services in the Centre Region? (Ratings: 5=Very Satisfied; 1=Very Dissatisfied)Random sample weighted by relative municipality population
Drop-
Ins Drop-
Ins Drop-
Ins Drop-
Ins Drop-
Ins Drop-
Ins Drop-Ins College
Township Ferguson Township
Halfmoon Township
Harris Township
Patton Township
Boro State College
(D) (W) (X) (Y) (Z) (A2) (B2)
TOTAL ANSWERING 145 11 26 44 13 17 33Fire Services 4.2 4.3 4.4 3.7 4.2 4.2 4.5
Y Y141 11 25 44 13 17 30
Ambulance Service 4.1 4.2 4.2 3.8 4.2 3.9 4.3Y
142 11 26 44 13 16 31Public Sewer Service 4.0 3.6 4.3 3.4 4.3 3.8 4.3
Y Y WY109 11 25 17 10 13 32
Public Water Service 4.1 3.6 4.3 4.0 3.9 4.3 4.3
124 11 26 29 11 15 31Police Services 4.0 4.3 4.0 3.8 4.1 4.2 4.2
139 11 26 39 13 17 32Recycling 3.9 3.3 4.0 3.7 4.4 3.5 4.2
WY WY141 11 26 43 11 17 32
Emergency Health Care 3.8 3.6 3.8 3.7 3.9 3.4 3.9
143 11 25 44 13 17 32Electric Service 3.8 3.4 3.9 3.7 4.1 3.9 3.6
145 11 26 44 13 17 33High Speed Internet 3.4 3.3 3.3 3.5 3.7 3.1 3.6
141 11 26 42 12 16 33Composting 3.1 2.7 3.2 2.9 3.0 2.9 3.4
119 10 24 29 11 14 30Cable Service 2.9 2.7 2.7 2.9 3.1 2.7 2.9
134 11 24 39 12 15 32Public WiFi access 2.9 2.7 2.7 3.1 2.7 3.1 2.8
127 10 26 35 11 14 30Comparison Groups: ABCD/EFGHIJ/KLMNOP/QRSTUV/WXYZA2B2/EKQW/FLRX/GMSY/HNTZ/IOUA2/JPVB2Independent T-Test for Means (equal variances), Independent Z-Test for PercentagesUpper case letters indicate significance at the 95% level.
Page 31
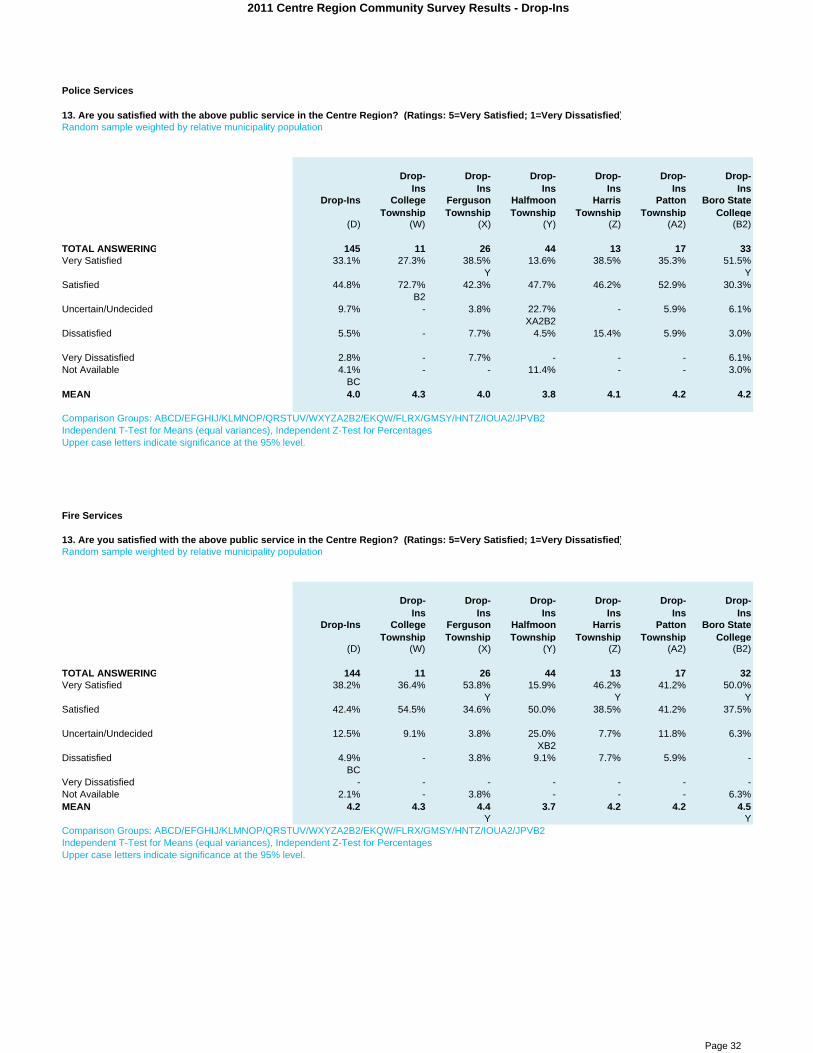
2011 Centre Region Community Survey Results - Drop-Ins
Police Services
13. Are you satisfied with the above public service in the Centre Region? (Ratings: 5=Very Satisfied; 1=Very Dissatisfied)Random sample weighted by relative municipality population
Drop-
Ins Drop-
Ins Drop-
Ins Drop-
Ins Drop-
Ins Drop-
Ins Drop-Ins College
Township Ferguson Township
Halfmoon Township
Harris Township
Patton Township
Boro State College
(D) (W) (X) (Y) (Z) (A2) (B2)
TOTAL ANSWERING 145 11 26 44 13 17 33Very Satisfied 33.1% 27.3% 38.5% 13.6% 38.5% 35.3% 51.5%
Y YSatisfied 44.8% 72.7% 42.3% 47.7% 46.2% 52.9% 30.3%
B2Uncertain/Undecided 9.7% - 3.8% 22.7% - 5.9% 6.1%
XA2B2Dissatisfied 5.5% - 7.7% 4.5% 15.4% 5.9% 3.0%
Very Dissatisfied 2.8% - 7.7% - - - 6.1%Not Available 4.1% - - 11.4% - - 3.0%
BCMEAN 4.0 4.3 4.0 3.8 4.1 4.2 4.2
Comparison Groups: ABCD/EFGHIJ/KLMNOP/QRSTUV/WXYZA2B2/EKQW/FLRX/GMSY/HNTZ/IOUA2/JPVB2Independent T-Test for Means (equal variances), Independent Z-Test for PercentagesUpper case letters indicate significance at the 95% level.
Fire Services
13. Are you satisfied with the above public service in the Centre Region? (Ratings: 5=Very Satisfied; 1=Very Dissatisfied)Random sample weighted by relative municipality population
Drop-
Ins Drop-
Ins Drop-
Ins Drop-
Ins Drop-
Ins Drop-
Ins Drop-Ins College
Township Ferguson Township
Halfmoon Township
Harris Township
Patton Township
Boro State College
(D) (W) (X) (Y) (Z) (A2) (B2)
TOTAL ANSWERING 144 11 26 44 13 17 32Very Satisfied 38.2% 36.4% 53.8% 15.9% 46.2% 41.2% 50.0%
Y Y YSatisfied 42.4% 54.5% 34.6% 50.0% 38.5% 41.2% 37.5%
Uncertain/Undecided 12.5% 9.1% 3.8% 25.0% 7.7% 11.8% 6.3%XB2
Dissatisfied 4.9% - 3.8% 9.1% 7.7% 5.9% -BC
Very Dissatisfied - - - - - - -Not Available 2.1% - 3.8% - - - 6.3%MEAN 4.2 4.3 4.4 3.7 4.2 4.2 4.5
Y YComparison Groups: ABCD/EFGHIJ/KLMNOP/QRSTUV/WXYZA2B2/EKQW/FLRX/GMSY/HNTZ/IOUA2/JPVB2Independent T-Test for Means (equal variances), Independent Z-Test for PercentagesUpper case letters indicate significance at the 95% level.
Page 32

2011 Centre Region Community Survey Results - Drop-Ins
Ambulance Service
13. Are you satisfied with the above public service in the Centre Region? (Ratings: 5=Very Satisfied; 1=Very Dissatisfied)Random sample weighted by relative municipality population
Drop-
Ins Drop-
Ins Drop-
Ins Drop-
Ins Drop-
Ins Drop-
Ins Drop-Ins College
Township Ferguson Township
Halfmoon Township
Harris Township
Patton Township
Boro State College
(D) (W) (X) (Y) (Z) (A2) (B2)
TOTAL ANSWERING 144 11 26 44 13 16 33Very Satisfied 34.0% 36.4% 50.0% 18.2% 38.5% 31.3% 39.4%
Y YSatisfied 41.7% 45.5% 26.9% 52.3% 38.5% 31.3% 45.5%
XUncertain/Undecided 19.4% 18.2% 15.4% 25.0% 23.1% 31.3% 9.1%
BCDissatisfied 3.5% - 7.7% 4.5% - 6.3% -Very Dissatisfied - - - - - - -Not Available 1.4% - - - - - 6.1%MEAN 4.1 4.2 4.2 3.8 4.2 3.9 4.3
YComparison Groups: ABCD/EFGHIJ/KLMNOP/QRSTUV/WXYZA2B2/EKQW/FLRX/GMSY/HNTZ/IOUA2/JPVB2Independent T-Test for Means (equal variances), Independent Z-Test for PercentagesUpper case letters indicate significance at the 95% level.
Emergency Health Care
13. Are you satisfied with the above public service in the Centre Region? (Ratings: 5=Very Satisfied; 1=Very Dissatisfied)Random sample weighted by relative municipality population
Drop-
Ins Drop-
Ins Drop-
Ins Drop-
Ins Drop-
Ins Drop-
Ins Drop-Ins College
Township Ferguson Township
Halfmoon Township
Harris Township
Patton Township
Boro State College
(D) (W) (X) (Y) (Z) (A2) (B2)
TOTAL ANSWERING 145 11 26 44 13 17 33Very Satisfied 22.1% 18.2% 30.8% 9.1% 30.8% 17.6% 30.3%
Y YSatisfied 46.2% 45.5% 38.5% 63.6% 38.5% 29.4% 42.4%
XA2Uncertain/Undecided 18.6% 18.2% 7.7% 18.2% 23.1% 35.3% 18.2%
XDissatisfied 8.3% 18.2% 11.5% 9.1% 7.7% 11.8% -Very Dissatisfied 3.4% - 7.7% - - 5.9% 6.1%Not Available 1.4% - 3.8% - - - 3.0%MEAN 3.8 3.6 3.8 3.7 3.9 3.4 3.9
Comparison Groups: ABCD/EFGHIJ/KLMNOP/QRSTUV/WXYZA2B2/EKQW/FLRX/GMSY/HNTZ/IOUA2/JPVB2Independent T-Test for Means (equal variances), Independent Z-Test for PercentagesUpper case letters indicate significance at the 95% level.
Page 33

2011 Centre Region Community Survey Results - Drop-Ins
Public Water Service
13. Are you satisfied with the above public service in the Centre Region? (Ratings: 5=Very Satisfied; 1=Very Dissatisfied)Random sample weighted by relative municipality population
Drop-
Ins Drop-
Ins Drop-
Ins Drop-
Ins Drop-
Ins Drop-
Ins Drop-Ins College
Township Ferguson Township
Halfmoon Township
Harris Township
Patton Township
Boro State College
(D) (W) (X) (Y) (Z) (A2) (B2)
TOTAL ANSWERING 143 11 26 43 13 17 32Very Satisfied 30.8% 9.1% 46.2% 11.6% 30.8% 35.3% 46.9%
WY WYSatisfied 44.8% 63.6% 46.2% 48.8% 38.5% 47.1% 34.4%
Uncertain/Undecided 5.6% 18.2% 3.8% 4.7% - - 9.4%Dissatisfied 3.5% - - 2.3% 7.7% 5.9% 6.3%Very Dissatisfied 2.1% 9.1% 3.8% - 7.7% - -Not Available 13.3% - - 32.6% 15.4% 11.8% 3.1%
ABC A2B2MEAN 4.1 3.6 4.3 4.0 3.9 4.3 4.3
Comparison Groups: ABCD/EFGHIJ/KLMNOP/QRSTUV/WXYZA2B2/EKQW/FLRX/GMSY/HNTZ/IOUA2/JPVB2Independent T-Test for Means (equal variances), Independent Z-Test for PercentagesUpper case letters indicate significance at the 95% level.
Public Sewer Service
13. Are you satisfied with the above public service in the Centre Region? (Ratings: 5=Very Satisfied; 1=Very Dissatisfied)Random sample weighted by relative municipality population
Drop-
Ins Drop-
Ins Drop-
Ins Drop-
Ins Drop-
Ins Drop-
Ins Drop-Ins College
Township Ferguson Township
Halfmoon Township
Harris Township
Patton Township
Boro State College
(D) (W) (X) (Y) (Z) (A2) (B2)
TOTAL ANSWERING 144 11 26 43 13 17 33Very Satisfied 26.4% 18.2% 42.3% - 30.8% 23.5% 48.5%
WSatisfied 33.3% 54.5% 46.2% 18.6% 38.5% 35.3% 33.3%
Y YUncertain/Undecided 9.7% - 3.8% 16.3% 7.7% 5.9% 12.1%
Dissatisfied 4.2% 27.3% - 4.7% - - 3.0%Very Dissatisfied 2.1% - 3.8% - - 11.8% -Not Available 24.3% - 3.8% 60.5% 23.1% 23.5% 3.0%
ABC XZA2B2MEAN 4.0 3.6 4.3 3.4 4.3 3.8 4.3
Y Y WYComparison Groups: ABCD/EFGHIJ/KLMNOP/QRSTUV/WXYZA2B2/EKQW/FLRX/GMSY/HNTZ/IOUA2/JPVB2Independent T-Test for Means (equal variances), Independent Z-Test for PercentagesUpper case letters indicate significance at the 95% level.
Page 34

2011 Centre Region Community Survey Results - Drop-Ins
Recycling
13. Are you satisfied with the above public service in the Centre Region? (Ratings: 5=Very Satisfied; 1=Very Dissatisfied)Random sample weighted by relative municipality population
Drop-
Ins Drop-
Ins Drop-
Ins Drop-
Ins Drop-
Ins Drop-
Ins Drop-Ins College
Township Ferguson Township
Halfmoon Township
Harris Township
Patton Township
Boro State College
(D) (W) (X) (Y) (Z) (A2) (B2)
TOTAL ANSWERING 142 11 26 43 12 17 32Very Satisfied 28.2% 9.1% 38.5% 16.3% 41.7% 17.6% 40.6%
WY WYSatisfied 47.9% 45.5% 38.5% 58.1% 41.7% 52.9% 43.8%
Uncertain/Undecided 6.3% 9.1% 7.7% 4.7% 8.3% - 9.4%
Dissatisfied 14.1% 36.4% 11.5% 18.6% - 23.5% 3.1%EKQB2 B2
Very Dissatisfied 2.8% - 3.8% 2.3% - 5.9% 3.1%Not Available 0.7% - - - 8.3% - -MEAN 3.9 3.3 4.0 3.7 4.4 3.5 4.2
WY WYComparison Groups: ABCD/EFGHIJ/KLMNOP/QRSTUV/WXYZA2B2/EKQW/FLRX/GMSY/HNTZ/IOUA2/JPVB2Independent T-Test for Means (equal variances), Independent Z-Test for PercentagesUpper case letters indicate significance at the 95% level.
High Speed Internet
13. Are you satisfied with the above public service in the Centre Region? (Ratings: 5=Very Satisfied; 1=Very Dissatisfied)Random sample weighted by relative municipality population
Drop-
Ins Drop-
Ins Drop-
Ins Drop-
Ins Drop-
Ins Drop-
Ins Drop-Ins College
Township Ferguson Township
Halfmoon Township
Harris Township
Patton Township
Boro State College
(D) (W) (X) (Y) (Z) (A2) (B2)
TOTAL ANSWERING 145 11 26 44 13 17 33Very Satisfied 13.8% 18.2% 3.8% 11.4% 30.8% 5.9% 18.2%
XSatisfied 47.6% 36.4% 57.7% 52.3% 30.8% 47.1% 45.5%
Uncertain/Undecided 13.1% 9.1% 11.5% 11.4% 7.7% 11.8% 21.2%Dissatisfied 13.8% 27.3% 15.4% 13.6% 15.4% 11.8% 9.1%
Very Dissatisfied 9.0% 9.1% 11.5% 6.8% 7.7% 17.6% 6.1%Not Available 2.8% - - 4.5% 7.7% 5.9% -MEAN 3.4 3.3 3.3 3.5 3.7 3.1 3.6Comparison Groups: ABCD/EFGHIJ/KLMNOP/QRSTUV/WXYZA2B2/EKQW/FLRX/GMSY/HNTZ/IOUA2/JPVB2Independent T-Test for Means (equal variances), Independent Z-Test for PercentagesUpper case letters indicate significance at the 95% level.
Page 35

2011 Centre Region Community Survey Results - Drop-Ins
Public WiFi access
13. Are you satisfied with the above public service in the Centre Region? (Ratings: 5=Very Satisfied; 1=Very Dissatisfied)Random sample weighted by relative municipality population
Drop-
Ins Drop-
Ins Drop-
Ins Drop-
Ins Drop-
Ins Drop-
Ins Drop-Ins College
Township Ferguson Township
Halfmoon Township
Harris Township
Patton Township
Boro State College
(D) (W) (X) (Y) (Z) (A2) (B2)
TOTAL ANSWERING 143 11 26 44 12 17 32Very Satisfied 4.9% - - - 8.3% 17.6% 6.3%
Satisfied 26.6% 18.2% 26.9% 34.1% 25.0% 23.5% 21.9%Uncertain/Undecided 25.9% 36.4% 30.8% 25.0% 16.7% 17.6% 28.1%
Dissatisfied 18.2% 27.3% 26.9% 15.9% 16.7% - 21.9%Very Dissatisfied 13.3% 9.1% 15.4% 4.5% 25.0% 23.5% 15.6%
ABCNot Available 11.2% 9.1% - 20.5% 8.3% 17.6% 6.3%
MEAN 2.9 2.7 2.7 3.1 2.7 3.1 2.8
Comparison Groups: ABCD/EFGHIJ/KLMNOP/QRSTUV/WXYZA2B2/EKQW/FLRX/GMSY/HNTZ/IOUA2/JPVB2Independent T-Test for Means (equal variances), Independent Z-Test for PercentagesUpper case letters indicate significance at the 95% level.
Cable Service
13. Are you satisfied with the above public service in the Centre Region? (Ratings: 5=Very Satisfied; 1=Very Dissatisfied)Random sample weighted by relative municipality population
Drop-
Ins Drop-
Ins Drop-
Ins Drop-
Ins Drop-
Ins Drop-
Ins Drop-Ins College
Township Ferguson Township
Halfmoon Township
Harris Township
Patton Township
Boro State College
(D) (W) (X) (Y) (Z) (A2) (B2)
TOTAL ANSWERING 145 11 26 44 13 17 33Very Satisfied 6.9% 9.1% 3.8% 4.5% 15.4% 5.9% 6.1%
Satisfied 33.8% 36.4% 38.5% 34.1% 30.8% 29.4% 33.3%
Uncertain/Undecided 9.7% - 3.8% 13.6% 7.7% 5.9% 15.2%
Dissatisfied 24.1% 27.3% 19.2% 22.7% 23.1% 29.4% 27.3%Very Dissatisfied 17.9% 27.3% 26.9% 13.6% 15.4% 17.6% 15.2%
BCNot Available 7.6% - 7.7% 11.4% 7.7% 11.8% 3.0%
BCMEAN 2.9 2.7 2.7 2.9 3.1 2.7 2.9
Comparison Groups: ABCD/EFGHIJ/KLMNOP/QRSTUV/WXYZA2B2/EKQW/FLRX/GMSY/HNTZ/IOUA2/JPVB2Independent T-Test for Means (equal variances), Independent Z-Test for PercentagesUpper case letters indicate significance at the 95% level.
Page 36

2011 Centre Region Community Survey Results - Drop-Ins
Electric Service
13. Are you satisfied with the above public service in the Centre Region? (Ratings: 5=Very Satisfied; 1=Very Dissatisfied)Random sample weighted by relative municipality population
Drop-
Ins Drop-
Ins Drop-
Ins Drop-
Ins Drop-
Ins Drop-
Ins Drop-Ins College
Township Ferguson Township
Halfmoon Township
Harris Township
Patton Township
Boro State College
(D) (W) (X) (Y) (Z) (A2) (B2)
TOTAL ANSWERING 145 11 26 44 13 17 33Very Satisfied 14.5% 18.2% 15.4% 6.8% 15.4% 29.4% 12.1%
Satisfied 60.0% 45.5% 65.4% 70.5% 76.9% 41.2% 51.5%A2 A2
Uncertain/Undecided 16.6% - 15.4% 13.6% 7.7% 23.5% 27.3%BC PV
Dissatisfied 6.2% 27.3% 3.8% 6.8% - - 6.1%Very Dissatisfied 2.8% 9.1% - 2.3% - 5.9% 3.0%MEAN 3.8 3.4 3.9 3.7 4.1 3.9 3.6
Comparison Groups: ABCD/EFGHIJ/KLMNOP/QRSTUV/WXYZA2B2/EKQW/FLRX/GMSY/HNTZ/IOUA2/JPVB2Independent T-Test for Means (equal variances), Independent Z-Test for PercentagesUpper case letters indicate significance at the 95% level.
Composting
13. Are you satisfied with the above public service in the Centre Region? (Ratings: 5=Very Satisfied; 1=Very Dissatisfied)Random sample weighted by relative municipality population
Drop-
Ins Drop-
Ins Drop-
Ins Drop-
Ins Drop-
Ins Drop-
Ins Drop-Ins College
Township Ferguson Township
Halfmoon Township
Harris Township
Patton Township
Boro State College
(D) (W) (X) (Y) (Z) (A2) (B2)
TOTAL ANSWERING 144 11 26 43 13 17 33Very Satisfied 9.0% - 11.5% 2.3% - 11.8% 18.2%
YSatisfied 25.0% 18.2% 30.8% 20.9% 30.8% 17.6% 30.3%Uncertain/Undecided 20.8% 36.4% 23.1% 16.3% 30.8% 17.6% 18.2%
Dissatisfied 19.4% 27.3% 19.2% 20.9% 15.4% 23.5% 15.2%BC
Very Dissatisfied 8.3% 9.1% 7.7% 7.0% 7.7% 11.8% 9.1%
Not Available 17.4% 9.1% 7.7% 32.6% 15.4% 17.6% 9.1%BC WXB2
MEAN 3.1 2.7 3.2 2.9 3.0 2.9 3.4
Comparison Groups: ABCD/EFGHIJ/KLMNOP/QRSTUV/WXYZA2B2/EKQW/FLRX/GMSY/HNTZ/IOUA2/JPVB2Independent T-Test for Means (equal variances), Independent Z-Test for PercentagesUpper case letters indicate significance at the 95% level.
14. This question required a write-in response.
Page 37

2011 Centre Region Community Survey Results - Drop-Ins
Attitudes about Transportation
15. In a typical week (Monday-Friday) what is the primary purpose of your travel? (Check only one)Random sample weighted by relative municipality population
Drop-
Ins Drop-
Ins Drop-
Ins Drop-
Ins Drop-
Ins Drop-
Ins Drop-Ins College
Township Ferguson Township
Halfmoon Township
Harris Township
Patton Township
Boro State College
(D) (W) (X) (Y) (Z) (A2) (B2)
TOTAL ANSWERING 144 11 25 44 13 17 33Work 71.5% 63.6% 64.0% 84.1% 61.5% 70.6% 69.7%
Shopping 16.7% 9.1% 28.0% 9.1% 23.1% 23.5% 12.1%
School 3.5% 9.1% 4.0% - - - 9.1%
Recreation 3.5% 9.1% - 4.5% 15.4% - -Medical Appointment 0.7% - - - - - 3.0%Other, please specify 4.2% 9.1% 4.0% 2.3% - 5.9% 6.1%Comparison Groups: ABCD/EFGHIJ/KLMNOP/QRSTUV/WXYZA2B2/EKQW/FLRX/GMSY/HNTZ/IOUA2/JPVB2Independent T-Test for Means (equal variances), Independent Z-Test for PercentagesUpper case letters indicate significance at the 95% level.
Page 38

2011 Centre Region Community Survey Results - Drop-Ins
16. What is the main mode of travel for your primary trip? (Check only one)Random sample weighted by relative municipality population
Drop-
Ins Drop-
Ins Drop-
Ins Drop-
Ins Drop-
Ins Drop-
Ins Drop-Ins College
Township Ferguson Township
Halfmoon Township
Harris Township
Patton Township
Boro State College
(D) (W) (X) (Y) (Z) (A2) (B2)
TOTAL ANSWERING 143 11 24 44 13 17 33Automobile/truck/minivan/etc. 82.5% 81.8% 87.5% 90.9% 84.6% 94.1% 60.6%
B2 B2 B2Public transportation 4.9% - - 6.8% 15.4% - 6.1%
Walk 4.9% 9.1% - - - 5.9% 15.2%
Bicycle 6.3% 9.1% 8.3% - - - 18.2%
Carpool/vanpool 0.7% - - 2.3% - - -Motorcycle/scooter 0.7% - 4.2% - - - -Taxi - - - - - - -Comparison Groups: ABCD/EFGHIJ/KLMNOP/QRSTUV/WXYZA2B2/EKQW/FLRX/GMSY/HNTZ/IOUA2/JPVB2Independent T-Test for Means (equal variances), Independent Z-Test for PercentagesUpper case letters indicate significance at the 95% level.
Page 39

2011 Centre Region Community Survey Results - Drop-Ins
17. How frequently do you use public transportation? (Check only one)Random sample weighted by relative municipality population
Drop-
Ins Drop-
Ins Drop-
Ins Drop-
Ins Drop-
Ins Drop-
Ins Drop-Ins College
Township Ferguson Township
Halfmoon Township
Harris Township
Patton Township
Boro State College
(D) (W) (X) (Y) (Z) (A2) (B2)
TOTAL ANSWERING 145 11 26 44 13 17 33Daily 2.8% 9.1% 3.8% 2.3% - - 3.0%
Frequently (several times a week) 6.2% 9.1% 3.8% 4.5% 15.4% - 9.1%
Occasionally (several times a month) 9.0% 9.1% 7.7% 6.8% 7.7% 5.9% 15.2%
Rarely (few times a year) 34.5% 18.2% 42.3% 20.5% 38.5% 23.5% 57.6%PVWYA2
Never 47.6% 54.5% 42.3% 65.9% 38.5% 70.6% 15.2%B2 B2 XB2 IOUB2
Comparison Groups: ABCD/EFGHIJ/KLMNOP/QRSTUV/WXYZA2B2/EKQW/FLRX/GMSY/HNTZ/IOUA2/JPVB2Independent T-Test for Means (equal variances), Independent Z-Test for PercentagesUpper case letters indicate significance at the 95% level.
Page 40

2011 Centre Region Community Survey Results - Drop-Ins
18. Which do you use the most? (Check only one)Random sample weighted by relative municipality population
Drop-
Ins Drop-
Ins Drop-
Ins Drop-
Ins Drop-
Ins Drop-
Ins Drop-Ins College
Township Ferguson Township
Halfmoon Township
Harris Township
Patton Township
Boro State College
(D) (W) (X) (Y) (Z) (A2) (B2)
TOTAL ANSWERING 72 5 14 14 7 4 28CATABus 73.6% 80.0% 78.6% 78.6% 100.0% 25.0% 67.9%
A2 A2 A2B2Campus Loop/Link 16.7% 20.0% 7.1% 21.4% - 25.0% 21.4%
Centre County Office of Transportation Services van/bus
- - - - - - -
CATARide - - - - - - -Other, please specify 9.7% - 14.3% - - 50.0% 10.7%Comparison Groups: ABCD/EFGHIJ/KLMNOP/QRSTUV/WXYZA2B2/EKQW/FLRX/GMSY/HNTZ/IOUA2/JPVB2Independent T-Test for Means (equal variances), Independent Z-Test for PercentagesUpper case letters indicate significance at the 95% level.
Page 41

2011 Centre Region Community Survey Results - Drop-Ins
19. Which of the following factors would encourage you to use public transportation more frequently? First, which is MOST important?Random sample weighted by relative municipality population
Drop-
Ins Drop-
Ins Drop-
Ins Drop-
Ins Drop-
Ins Drop-
Ins Drop-Ins College
Township Ferguson Township
Halfmoon Township
Harris Township
Patton Township
Boro State College
(D) (W) (X) (Y) (Z) (A2) (B2)
TOTAL ANSWERING 141 10 26 43 12 16 33Increase in frequency of departures from bus stops 17.0% 20.0% 11.5% 25.6% 8.3% - 18.2%
More direct bus route between my home and destination
23.4% 30.0% 23.1% 25.6% 25.0% 31.3% 15.2%
A bus stop closer to my home 11.3% 20.0% 3.8% 9.3% 25.0% 12.5% 12.1%
Service to my neighborhood 7.8% - 15.4% 2.3% 25.0% 6.3% 6.1%
Reduce cost of bus fare or bus pass 8.5% 20.0% 11.5% 7.0% - 12.5% 6.1%Expanded hours of operation 7.8% 10.0% 3.8% 11.6% - - 12.1%A bus stop closer to my destination 2.1% - 3.8% - - 12.5% -Other, please specify 22.0% - 26.9% 18.6% 16.7% 25.0% 30.3%
ABCComparison Groups: ABCD/EFGHIJ/KLMNOP/QRSTUV/WXYZA2B2/EKQW/FLRX/GMSY/HNTZ/IOUA2/JPVB2Independent T-Test for Means (equal variances), Independent Z-Test for PercentagesUpper case letters indicate significance at the 95% level.
19. Of those remaining, what would be the next (second) most desirable factor that would encourage you to use public transportation more?Random sample weighted by relative municipality population
Drop-
Ins Drop-
Ins Drop-
Ins Drop-
Ins Drop-
Ins Drop-
Ins Drop-Ins College
Township Ferguson Township
Halfmoon Township
Harris Township
Patton Township
Boro State College
(D) (W) (X) (Y) (Z) (A2) (B2)
TOTAL ANSWERING 133 10 24 41 12 14 31Increase in frequency of departures from bus stops 23.3% 10.0% 20.8% 26.8% 8.3% 35.7% 25.8%
More direct bus route between my home and destination
15.8% 20.0% 8.3% 22.0% 8.3% 7.1% 19.4%
Expanded hours of operation 15.8% 20.0% 12.5% 17.1% 8.3% 7.1% 22.6%
A bus stop closer to my destination 11.3% 20.0% 12.5% 14.6% 8.3% 7.1% 6.5%Reduce cost of bus fare or bus pass 11.3% 20.0% 12.5% 7.3% 8.3% - 16.1%A bus stop closer to my home 5.3% - 12.5% - 25.0% 7.1% -
Service to my neighborhood 6.0% 10.0% 8.3% - 25.0% 7.1% 3.2%Other, please specify 11.3% - 12.5% 12.2% 8.3% 28.6% 6.5%
ABCComparison Groups: ABCD/EFGHIJ/KLMNOP/QRSTUV/WXYZA2B2/EKQW/FLRX/GMSY/HNTZ/IOUA2/JPVB2Independent T-Test for Means (equal variances), Independent Z-Test for PercentagesUpper case letters indicate significance at the 95% level.
Page 42

2011 Centre Region Community Survey Results - Drop-Ins
19. What would be the next (third) most desirable factor to encourage you to use public transportation more often?Random sample weighted by relative municipality population
Drop-
Ins Drop-
Ins Drop-
Ins Drop-
Ins Drop-
Ins Drop-
Ins Drop-Ins College
Township Ferguson Township
Halfmoon Township
Harris Township
Patton Township
Boro State College
(D) (W) (X) (Y) (Z) (A2) (B2)
TOTAL ANSWERING 128 9 24 38 12 13 31More direct bus route between my home and destination
18.8% 22.2% 20.8% 18.4% 16.7% 15.4% 16.1%
Increase in frequency of departures from bus stops 21.9% 44.4% 25.0% 18.4% 33.3% 7.7% 19.4%
A2Expanded hours of operation 22.7% - 16.7% 34.2% 25.0% 23.1% 19.4%
MSReduce cost of bus fare or bus pass 7.0% - 16.7% 2.6% - 15.4% 6.5%
A bus stop closer to my destination 10.2% 11.1% 4.2% 10.5% 16.7% 15.4% 9.7%A bus stop closer to my home 5.5% 11.1% 8.3% 5.3% - 7.7% 3.2%Service to my neighborhood 5.5% 11.1% - 5.3% - 7.7% 9.7%
Other, please specify 8.6% - 8.3% 5.3% 8.3% 7.7% 16.1%BC PV
Comparison Groups: ABCD/EFGHIJ/KLMNOP/QRSTUV/WXYZA2B2/EKQW/FLRX/GMSY/HNTZ/IOUA2/JPVB2Independent T-Test for Means (equal variances), Independent Z-Test for PercentagesUpper case letters indicate significance at the 95% level.
19. And what would be the next (fourth) most desirable factor to encourage you to use public transportation more often?Random sample weighted by relative municipality population
Drop-
Ins Drop-
Ins Drop-
Ins Drop-
Ins Drop-
Ins Drop-
Ins Drop-Ins College
Township Ferguson Township
Halfmoon Township
Harris Township
Patton Township
Boro State College
(D) (W) (X) (Y) (Z) (A2) (B2)
TOTAL ANSWERING 117 8 21 36 12 12 27A bus stop closer to my destination 20.5% 25.0% 23.8% 22.2% - 8.3% 25.9%
Expanded hours of operation 17.9% 12.5% 38.1% 13.9% 16.7% 25.0% 7.4%YB2
More direct bus route between my home and destination
12.8% 25.0% 4.8% 5.6% 16.7% 25.0% 18.5%
Reduce cost of bus fare or bus pass 13.7% 12.5% 9.5% 11.1% 25.0% 8.3% 18.5%Increase in frequency of departures from bus stops 12.8% 25.0% 9.5% 11.1% 16.7% 16.7% 11.1%
A bus stop closer to my home 6.8% - - 11.1% 8.3% - 11.1%Service to my neighborhood 6.0% - - 16.7% - 8.3% -Other, please specify 9.4% - 14.3% 8.3% 16.7% 8.3% 7.4%
BCComparison Groups: ABCD/EFGHIJ/KLMNOP/QRSTUV/WXYZA2B2/EKQW/FLRX/GMSY/HNTZ/IOUA2/JPVB2Independent T-Test for Means (equal variances), Independent Z-Test for PercentagesUpper case letters indicate significance at the 95% level.
Page 43

2011 Centre Region Community Survey Results - Drop-Ins
19. And finally, of these remaining factors, what would be the next (fifth) most desirable one to encourage you to use public transportation more?Random sample weighted by relative municipality population
Drop-
Ins Drop-
Ins Drop-
Ins Drop-
Ins Drop-
Ins Drop-
Ins Drop-Ins College
Township Ferguson Township
Halfmoon Township
Harris Township
Patton Township
Boro State College
(D) (W) (X) (Y) (Z) (A2) (B2)
TOTAL ANSWERING 111 8 21 35 10 10 26A bus stop closer to my destination 20.7% 12.5% 14.3% 22.9% 30.0% 10.0% 26.9%Reduce cost of bus fare or bus pass 17.1% - 14.3% 22.9% 20.0% 40.0% 7.7%
B2Expanded hours of operation 12.6% 25.0% 4.8% 8.6% 10.0% 10.0% 19.2%
A bus stop closer to my home 17.1% 12.5% 14.3% 20.0% 10.0% 20.0% 19.2%More direct bus route between my home and destination
9.0% - 14.3% 8.6% 10.0% - 11.5%
Service to my neighborhood 7.2% 50.0% 4.8% 5.7% - - 3.8%KQXYB2
Increase in frequency of departures from bus stops 7.2% - 14.3% 2.9% 10.0% 20.0% 3.8%
Other, please specify 9.0% - 19.0% 8.6% 10.0% - 7.7%Comparison Groups: ABCD/EFGHIJ/KLMNOP/QRSTUV/WXYZA2B2/EKQW/FLRX/GMSY/HNTZ/IOUA2/JPVB2Independent T-Test for Means (equal variances), Independent Z-Test for PercentagesUpper case letters indicate significance at the 95% level.
Page 44

2011 Centre Region Community Survey Results - Drop-Ins
20. Of the following corridors, which are you most concerned with in terms of safety (Check no more than 3)? Percent selectedRandom sample weighted by relative municipality population
Drop-
Ins Drop-
Ins Drop-
Ins Drop-
Ins Drop-
Ins Drop-
Ins Drop-Ins College
Township Ferguson Township
Halfmoon Township
Harris Township
Patton Township
Boro State College
(D) (W) (X) (Y) (Z) (A2) (B2)
TOTAL ANSWERING 144 11 26 43 13 17 33College and Beaver Avenues in Downtown State College
59.0% 63.6% 50.0% 65.1% 61.5% 52.9% 57.6%
North Atherton Street 54.2% 54.5% 61.5% 51.2% 61.5% 41.2% 54.5%BC
South Atherton Street 17.4% - 19.2% 14.0% 30.8% 11.8% 24.2%Whitehall Road 13.9% - 38.5% 9.3% 7.7% - 15.2%
YZB2East College Avenue 8.3% 9.1% 15.4% 2.3% 15.4% 11.8% 6.1%
Vairo Boulevard/Waddle Road 11.1% 27.3% 7.7% 9.3% - 17.6% 12.1%
Park Avenue 12.5% 9.1% - 16.3% 7.7% 11.8% 21.2%
University Drive 5.6% - 3.8% 2.3% - 5.9% 15.2%
West College Avenue 7.6% - 34.6% - - 5.9% 3.0%LRA2B2
Valley Vista Drive/Science Park Road 11.1% - 11.5% 18.6% - 11.8% 6.1%
Other, please specify 6.3% - 3.8% 2.3% 15.4% 17.6% 6.1%
None 13.2% 27.3% 3.8% 18.6% 15.4% 5.9% 12.1%X
Comparison Groups: ABCD/EFGHIJ/KLMNOP/QRSTUV/WXYZA2B2/EKQW/FLRX/GMSY/HNTZ/IOUA2/JPVB2Independent T-Test for Means (equal variances), Independent Z-Test for PercentagesUpper case letters indicate significance at the 95% level.
Page 45

2011 Centre Region Community Survey Results - Drop-Ins
21. What roadway improvements should be made in the Centre Region (Check no more than 3)? Percent selectedRandom sample weighted by relative municipality population
Drop-
Ins Drop-
Ins Drop-
Ins Drop-
Ins Drop-
Ins Drop-
Ins Drop-Ins College
Township Ferguson Township
Halfmoon Township
Harris Township
Patton Township
Boro State College
(D) (W) (X) (Y) (Z) (A2) (B2)
TOTAL ANSWERING 145 11 26 44 13 17 33Focus on maintaining good pavement quality and bridge conditions
48.3% 36.4% 50.0% 59.1% 38.5% 52.9% 39.4%
Add sidewalks and bike lanes along roadways 57.9% 72.7% 61.5% 56.8% 46.2% 47.1% 63.6%Widen existing roads in other congested areas (includes travel lanes and/or dedicated turning lanes)
38.6% 9.1% 34.6% 40.9% 30.8% 64.7% 36.4%
W W OUWXZB2 WMake existing traffic signals more efficient (could be several traffic signals along a corridor, or an individual traffic signal)
40.7% 27.3% 30.8% 52.3% 30.8% 35.3% 42.4%
Implement traffic calming measures (speed tables, narrowing streets, curb bulb-outs at intersections, or an individual traffic signal)
18.6% 18.2% 11.5% 13.6% 30.8% - 36.4%
XYAdd street lighting in highway interchange areas 13.8% 9.1% 15.4% 11.4% 15.4% 11.8% 15.2%Add street lighting in major roadway corridors 16.6% 18.2% 26.9% 11.4% 15.4% 23.5% 12.1%
Add more traffic lights 2.1% - 7.7% - 7.7% - -
Other, please specify 11.0% - 7.7% 6.8% 23.1% 17.6% 15.2%Comparison Groups: ABCD/EFGHIJ/KLMNOP/QRSTUV/WXYZA2B2/EKQW/FLRX/GMSY/HNTZ/IOUA2/JPVB2Independent T-Test for Means (equal variances), Independent Z-Test for PercentagesUpper case letters indicate significance at the 95% level.
Page 46

2011 Centre Region Community Survey Results - Drop-Ins
22. What improvements in bicycle or pedestrian facilities should be made in the Centre Region (Check no more than 3)? Percent selectedRandom sample weighted by relative municipality population
Drop-
Ins Drop-
Ins Drop-
Ins Drop-
Ins Drop-
Ins Drop-
Ins Drop-Ins College
Township Ferguson Township
Halfmoon Township
Harris Township
Patton Township
Boro State College
(D) (W) (X) (Y) (Z) (A2) (B2)
TOTAL ANSWERING 143 11 26 43 12 17 33Add more off-street bikeways 64.3% 72.7% 65.4% 72.1% 50.0% 52.9% 63.6%Provide connections between existing sidewalks, trails, and bikeways
49.7% 45.5% 53.8% 46.5% 41.7% 35.3% 60.6%
Add more bike lanes on roads 41.3% 45.5% 42.3% 39.5% 25.0% 47.1% 45.5%Expand the system of sidewalks and pedestrian trails
37.8% 45.5% 30.8% 39.5% 33.3% 52.9% 30.3%
Add more facilities that reduce conflicts between pedestrians and vehicles (mid-block crosswalks, signing, lighting, etc.)
35.0% 18.2% 30.8% 37.2% 33.3% 23.5% 48.5%
WMake crosswalks more visible 9.8% 9.1% 19.2% 4.7% 8.3% - 12.1%
Other, please specify 9.8% - 7.7% 7.0% 16.7% 17.6% 12.1%Comparison Groups: ABCD/EFGHIJ/KLMNOP/QRSTUV/WXYZA2B2/EKQW/FLRX/GMSY/HNTZ/IOUA2/JPVB2Independent T-Test for Means (equal variances), Independent Z-Test for PercentagesUpper case letters indicate significance at the 95% level.
Page 47
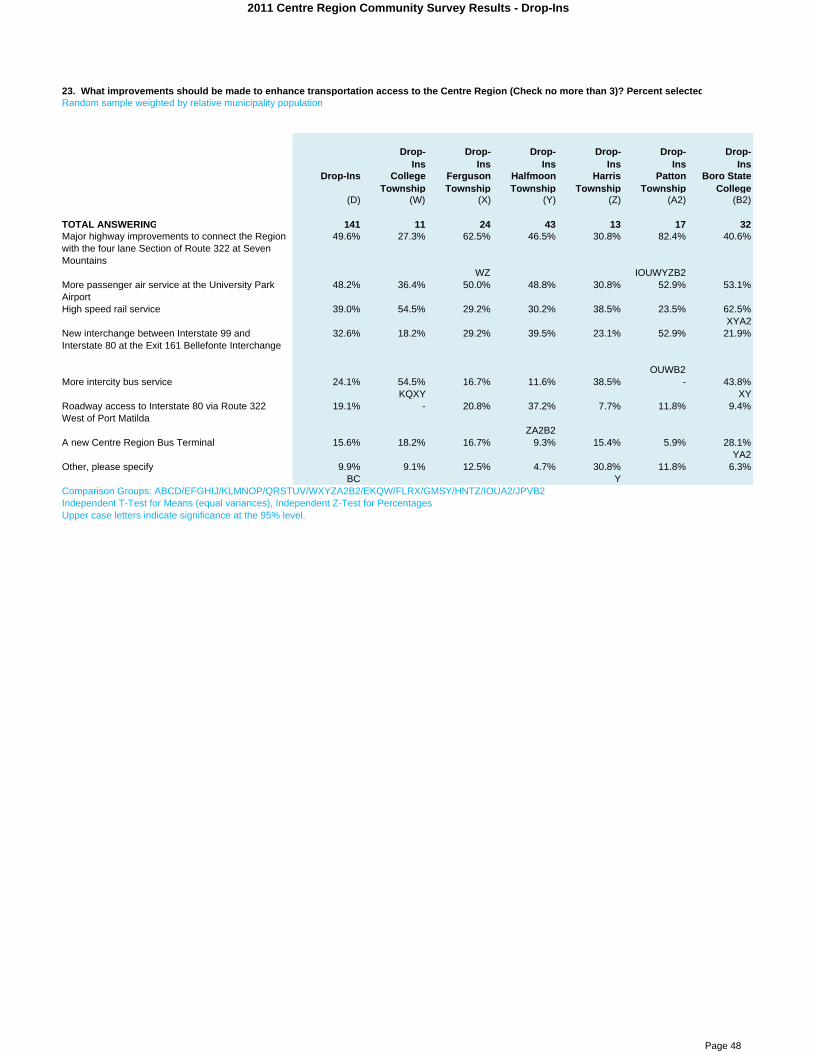
2011 Centre Region Community Survey Results - Drop-Ins
23. What improvements should be made to enhance transportation access to the Centre Region (Check no more than 3)? Percent selectedRandom sample weighted by relative municipality population
Drop-
Ins Drop-
Ins Drop-
Ins Drop-
Ins Drop-
Ins Drop-
Ins Drop-Ins College
Township Ferguson Township
Halfmoon Township
Harris Township
Patton Township
Boro State College
(D) (W) (X) (Y) (Z) (A2) (B2)
TOTAL ANSWERING 141 11 24 43 13 17 32Major highway improvements to connect the Region with the four lane Section of Route 322 at Seven Mountains
49.6% 27.3% 62.5% 46.5% 30.8% 82.4% 40.6%
WZ IOUWYZB2More passenger air service at the University Park Airport
48.2% 36.4% 50.0% 48.8% 30.8% 52.9% 53.1%
High speed rail service 39.0% 54.5% 29.2% 30.2% 38.5% 23.5% 62.5%XYA2
New interchange between Interstate 99 and Interstate 80 at the Exit 161 Bellefonte Interchange
32.6% 18.2% 29.2% 39.5% 23.1% 52.9% 21.9%
OUWB2More intercity bus service 24.1% 54.5% 16.7% 11.6% 38.5% - 43.8%
KQXY XYRoadway access to Interstate 80 via Route 322 West of Port Matilda
19.1% - 20.8% 37.2% 7.7% 11.8% 9.4%
ZA2B2A new Centre Region Bus Terminal 15.6% 18.2% 16.7% 9.3% 15.4% 5.9% 28.1%
YA2Other, please specify 9.9% 9.1% 12.5% 4.7% 30.8% 11.8% 6.3%
BC YComparison Groups: ABCD/EFGHIJ/KLMNOP/QRSTUV/WXYZA2B2/EKQW/FLRX/GMSY/HNTZ/IOUA2/JPVB2Independent T-Test for Means (equal variances), Independent Z-Test for PercentagesUpper case letters indicate significance at the 95% level.
Page 48

2011 Centre Region Community Survey Results - Drop-Ins
Random sample weighted by relative municipality population
Drop-
Ins Drop-
Ins Drop-
Ins Drop-
Ins Drop-
Ins Drop-
Ins Drop-Ins College
Township Ferguson Township
Halfmoon Township
Harris Township
Patton Township
Boro State College
(D) (W) (X) (Y) (Z) (A2) (B2)
TOTAL ANSWERING 145 11 26 44 13 17 33Yes 29.7% 27.3% 30.8% 40.9% 38.5% 11.8% 21.2%
MSA2No 58.6% 72.7% 53.8% 45.5% 53.8% 70.6% 69.7%
YDon’t know 11.7% - 15.4% 13.6% 7.7% 17.6% 9.1%Comparison Groups: ABCD/EFGHIJ/KLMNOP/QRSTUV/WXYZA2B2/EKQW/FLRX/GMSY/HNTZ/IOUA2/JPVB2Independent T-Test for Means (equal variances), Independent Z-Test for PercentagesUpper case letters indicate significance at the 95% level.
24. Do you spend more than 15% of your household income on transportation costs? (Costs include monthly vehicle loan payments, insurance, vehicle registration, vehicle maintenance and repairs; bus fare, bus pass, taxi fare, etc.)
Page 49

2011 Centre Region Community Survey Results - Drop-Ins
Attitudes regarding the Environment in the Centre Region
25. Please place the following natural and environmental issues in priority order. Which is the MOST important to you?Random sample weighted by relative municipality population
Drop-
Ins Drop-
Ins Drop-
Ins Drop-
Ins Drop-
Ins Drop-
Ins Drop-Ins College
Township Ferguson Township
Halfmoon Township
Harris Township
Patton Township
Boro State College
(D) (W) (X) (Y) (Z) (A2) (B2)
TOTAL ANSWERING 145 11 26 44 13 17 33Protect drinking water quality 33.1% 9.1% 34.6% 40.9% 23.1% 35.3% 33.3%
W W WQuality and quantity of water resources (which include but are not limited to, streams, rivers, wetlands)
21.4% 36.4% 23.1% 18.2% 7.7% 17.6% 24.2%
Open space 11.7% 9.1% 19.2% 15.9% 7.7% 5.9% 6.1%C
Access to forest, game lands, and natural areas 9.7% 36.4% 3.8% 9.1% 7.7% 11.8% 6.1%KQXB2
Air quality 5.5% 9.1% - - 38.5% 11.8% -H
Use of renewable energy sources in municipal buildings and vehicles
6.2% - 3.8% 6.8% 7.7% - 12.1%
Refuse management and recycling programs 3.4% - 7.7% - - - 9.1%
Increase energy efficiency in municipal buildings and vehicles
3.4% - 3.8% 4.5% - - 6.1%
Other, please specify 5.5% - 3.8% 4.5% 7.7% 17.6% 3.0%BC
Comparison Groups: ABCD/EFGHIJ/KLMNOP/QRSTUV/WXYZA2B2/EKQW/FLRX/GMSY/HNTZ/IOUA2/JPVB2Independent T-Test for Means (equal variances), Independent Z-Test for PercentagesUpper case letters indicate significance at the 95% level.
Random sample weighted by relative municipality population
Drop-
Ins Drop-
Ins Drop-
Ins Drop-
Ins Drop-
Ins Drop-
Ins Drop-Ins College
Township Ferguson Township
Halfmoon Township
Harris Township
Patton Township
Boro State College
(D) (W) (X) (Y) (Z) (A2) (B2)
TOTAL ANSWERING 145 11 26 44 13 17 33Quality and quantity of water resources (which include but are not limited to, streams, rivers, wetlands)
27.6% 9.1% 30.8% 38.6% 30.8% 23.5% 18.2%
MSWB2Air quality 18.6% 9.1% 11.5% 18.2% 23.1% 17.6% 27.3%
Protect drinking water quality 17.2% 9.1% 19.2% 15.9% 15.4% 17.6% 21.2%
Open space 9.7% 27.3% 3.8% 9.1% 7.7% 5.9% 9.1%Refuse management and recycling programs 9.0% - 19.2% 6.8% 7.7% 5.9% 9.1%Access to forest, game lands, and natural areas 5.5% 9.1% 3.8% 2.3% 15.4% 17.6% -Increase energy efficiency in municipal buildings and vehicles
6.9% 18.2% 3.8% 6.8% - - 12.1%
Use of renewable energy sources in municipal buildings and vehicles
3.4% 18.2% 3.8% 2.3% - - 3.0%
Other, please specify 2.1% - 3.8% - - 11.8% -Comparison Groups: ABCD/EFGHIJ/KLMNOP/QRSTUV/WXYZA2B2/EKQW/FLRX/GMSY/HNTZ/IOUA2/JPVB2Independent T-Test for Means (equal variances), Independent Z-Test for PercentagesUpper case letters indicate significance at the 95% level.
25. Please place the following natural and environmental issues in priority order. Of those remaining, which is the next (second) most important to you?
Page 50

2011 Centre Region Community Survey Results - Drop-Ins
Page 51
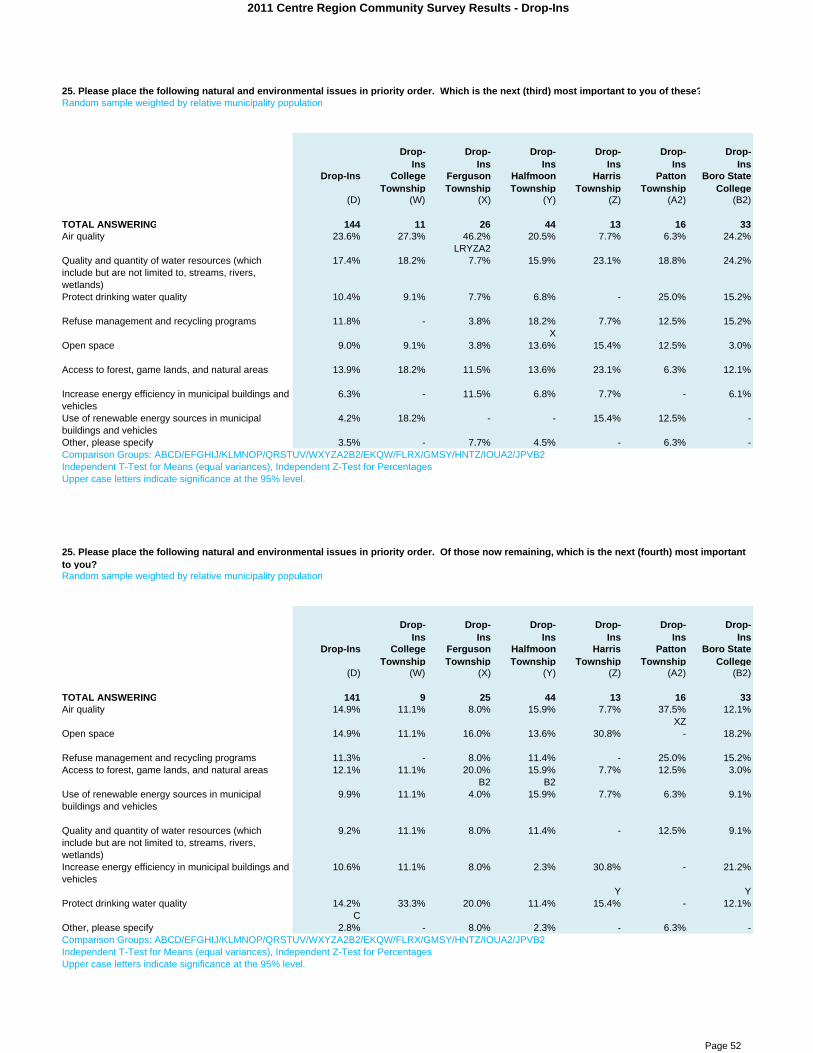
2011 Centre Region Community Survey Results - Drop-Ins
25. Please place the following natural and environmental issues in priority order. Which is the next (third) most important to you of these?Random sample weighted by relative municipality population
Drop-
Ins Drop-
Ins Drop-
Ins Drop-
Ins Drop-
Ins Drop-
Ins Drop-Ins College
Township Ferguson Township
Halfmoon Township
Harris Township
Patton Township
Boro State College
(D) (W) (X) (Y) (Z) (A2) (B2)
TOTAL ANSWERING 144 11 26 44 13 16 33Air quality 23.6% 27.3% 46.2% 20.5% 7.7% 6.3% 24.2%
LRYZA2Quality and quantity of water resources (which include but are not limited to, streams, rivers, wetlands)
17.4% 18.2% 7.7% 15.9% 23.1% 18.8% 24.2%
Protect drinking water quality 10.4% 9.1% 7.7% 6.8% - 25.0% 15.2%
Refuse management and recycling programs 11.8% - 3.8% 18.2% 7.7% 12.5% 15.2%X
Open space 9.0% 9.1% 3.8% 13.6% 15.4% 12.5% 3.0%
Access to forest, game lands, and natural areas 13.9% 18.2% 11.5% 13.6% 23.1% 6.3% 12.1%
Increase energy efficiency in municipal buildings and vehicles
6.3% - 11.5% 6.8% 7.7% - 6.1%
Use of renewable energy sources in municipal buildings and vehicles
4.2% 18.2% - - 15.4% 12.5% -
Other, please specify 3.5% - 7.7% 4.5% - 6.3% -Comparison Groups: ABCD/EFGHIJ/KLMNOP/QRSTUV/WXYZA2B2/EKQW/FLRX/GMSY/HNTZ/IOUA2/JPVB2Independent T-Test for Means (equal variances), Independent Z-Test for PercentagesUpper case letters indicate significance at the 95% level.
Random sample weighted by relative municipality population
Drop-
Ins Drop-
Ins Drop-
Ins Drop-
Ins Drop-
Ins Drop-
Ins Drop-Ins College
Township Ferguson Township
Halfmoon Township
Harris Township
Patton Township
Boro State College
(D) (W) (X) (Y) (Z) (A2) (B2)
TOTAL ANSWERING 141 9 25 44 13 16 33Air quality 14.9% 11.1% 8.0% 15.9% 7.7% 37.5% 12.1%
XZOpen space 14.9% 11.1% 16.0% 13.6% 30.8% - 18.2%
Refuse management and recycling programs 11.3% - 8.0% 11.4% - 25.0% 15.2%Access to forest, game lands, and natural areas 12.1% 11.1% 20.0% 15.9% 7.7% 12.5% 3.0%
B2 B2Use of renewable energy sources in municipal buildings and vehicles
9.9% 11.1% 4.0% 15.9% 7.7% 6.3% 9.1%
Quality and quantity of water resources (which include but are not limited to, streams, rivers, wetlands)
9.2% 11.1% 8.0% 11.4% - 12.5% 9.1%
Increase energy efficiency in municipal buildings and vehicles
10.6% 11.1% 8.0% 2.3% 30.8% - 21.2%
Y YProtect drinking water quality 14.2% 33.3% 20.0% 11.4% 15.4% - 12.1%
COther, please specify 2.8% - 8.0% 2.3% - 6.3% -Comparison Groups: ABCD/EFGHIJ/KLMNOP/QRSTUV/WXYZA2B2/EKQW/FLRX/GMSY/HNTZ/IOUA2/JPVB2Independent T-Test for Means (equal variances), Independent Z-Test for PercentagesUpper case letters indicate significance at the 95% level.
25. Please place the following natural and environmental issues in priority order. Of those now remaining, which is the next (fourth) most important to you?
Page 52

2011 Centre Region Community Survey Results - Drop-Ins
Random sample weighted by relative municipality population
Drop-
Ins Drop-
Ins Drop-
Ins Drop-
Ins Drop-
Ins Drop-
Ins Drop-Ins College
Township Ferguson Township
Halfmoon Township
Harris Township
Patton Township
Boro State College
(D) (W) (X) (Y) (Z) (A2) (B2)
TOTAL ANSWERING 139 9 25 42 13 16 33Refuse management and recycling programs 19.4% 22.2% 24.0% 9.5% 46.2% 25.0% 15.2%
NTYB2Access to forest, game lands, and natural areas 12.9% 11.1% 16.0% 11.9% 15.4% 6.3% 15.2%Open space 10.8% - 16.0% 9.5% - 25.0% 9.1%
Increase energy efficiency in municipal buildings and vehicles
11.5% 22.2% - 16.7% - 18.8% 12.1%
Air quality 14.4% 22.2% 16.0% 19.0% - 6.3% 12.1%Use of renewable energy sources in municipal buildings and vehicles
8.6% - 16.0% 4.8% 7.7% - 15.2%
Protect drinking water quality 10.1% 11.1% 4.0% 14.3% 15.4% 6.3% 9.1%
Quality and quantity of water resources (which include but are not limited to, streams, rivers, wetlands)
11.5% 11.1% 8.0% 14.3% 15.4% 6.3% 12.1%
Other, please specify 0.7% - - - - 6.3% -Comparison Groups: ABCD/EFGHIJ/KLMNOP/QRSTUV/WXYZA2B2/EKQW/FLRX/GMSY/HNTZ/IOUA2/JPVB2Independent T-Test for Means (equal variances), Independent Z-Test for PercentagesUpper case letters indicate significance at the 95% level.
25. Please place the following natural and environmental issues in priority order. And finally, of these, which is the next (fifth) most important to you?
Page 53
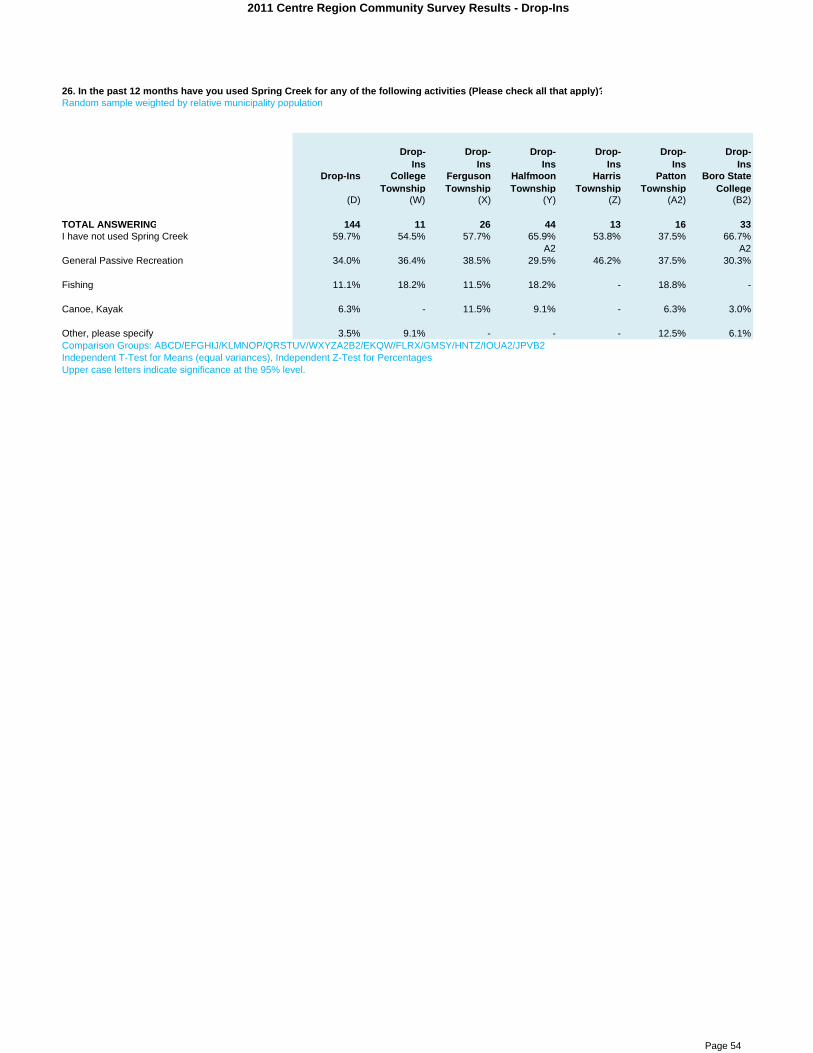
2011 Centre Region Community Survey Results - Drop-Ins
26. In the past 12 months have you used Spring Creek for any of the following activities (Please check all that apply)?Random sample weighted by relative municipality population
Drop-
Ins Drop-
Ins Drop-
Ins Drop-
Ins Drop-
Ins Drop-
Ins Drop-Ins College
Township Ferguson Township
Halfmoon Township
Harris Township
Patton Township
Boro State College
(D) (W) (X) (Y) (Z) (A2) (B2)
TOTAL ANSWERING 144 11 26 44 13 16 33I have not used Spring Creek 59.7% 54.5% 57.7% 65.9% 53.8% 37.5% 66.7%
A2 A2General Passive Recreation 34.0% 36.4% 38.5% 29.5% 46.2% 37.5% 30.3%
Fishing 11.1% 18.2% 11.5% 18.2% - 18.8% -
Canoe, Kayak 6.3% - 11.5% 9.1% - 6.3% 3.0%
Other, please specify 3.5% 9.1% - - - 12.5% 6.1%Comparison Groups: ABCD/EFGHIJ/KLMNOP/QRSTUV/WXYZA2B2/EKQW/FLRX/GMSY/HNTZ/IOUA2/JPVB2Independent T-Test for Means (equal variances), Independent Z-Test for PercentagesUpper case letters indicate significance at the 95% level.
Page 54
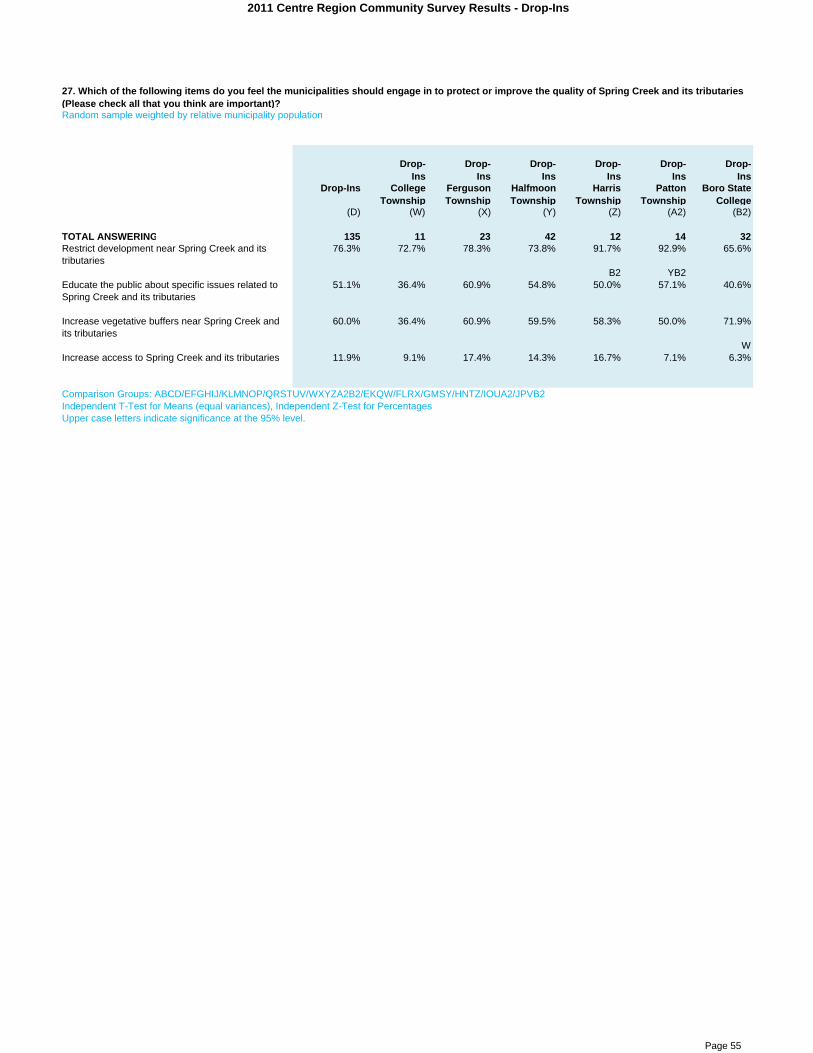
2011 Centre Region Community Survey Results - Drop-Ins
Random sample weighted by relative municipality population
Drop-
Ins Drop-
Ins Drop-
Ins Drop-
Ins Drop-
Ins Drop-
Ins Drop-Ins College
Township Ferguson Township
Halfmoon Township
Harris Township
Patton Township
Boro State College
(D) (W) (X) (Y) (Z) (A2) (B2)
TOTAL ANSWERING 135 11 23 42 12 14 32Restrict development near Spring Creek and its tributaries
76.3% 72.7% 78.3% 73.8% 91.7% 92.9% 65.6%
B2 YB2Educate the public about specific issues related to Spring Creek and its tributaries
51.1% 36.4% 60.9% 54.8% 50.0% 57.1% 40.6%
Increase vegetative buffers near Spring Creek and its tributaries
60.0% 36.4% 60.9% 59.5% 58.3% 50.0% 71.9%
WIncrease access to Spring Creek and its tributaries 11.9% 9.1% 17.4% 14.3% 16.7% 7.1% 6.3%
Comparison Groups: ABCD/EFGHIJ/KLMNOP/QRSTUV/WXYZA2B2/EKQW/FLRX/GMSY/HNTZ/IOUA2/JPVB2Independent T-Test for Means (equal variances), Independent Z-Test for PercentagesUpper case letters indicate significance at the 95% level.
27. Which of the following items do you feel the municipalities should engage in to protect or improve the quality of Spring Creek and its tributaries (Please check all that you think are important)?
Page 55

2011 Centre Region Community Survey Results - Drop-Ins
Attitudes regarding the Centre Region Economy
28. Please place the following economic issues in priority order. What is the HIGHEST priority?Random sample weighted by relative municipality population
Drop-
Ins Drop-
Ins Drop-
Ins Drop-
Ins Drop-
Ins Drop-
Ins Drop-Ins College
Township Ferguson Township
Halfmoon Township
Harris Township
Patton Township
Boro State College
(D) (W) (X) (Y) (Z) (A2) (B2)
TOTAL ANSWERING 142 11 26 42 13 16 33Retaining existing businesses in the Centre Region 54.9% 36.4% 57.7% 61.9% 61.5% 50.0% 48.5%
Attracting new businesses to the Centre Region 34.5% 63.6% 30.8% 23.8% 38.5% 31.3% 42.4%Y
Expanding existing businesses in the Centre Region 10.6% - 11.5% 14.3% - 18.8% 9.1%
Comparison Groups: ABCD/EFGHIJ/KLMNOP/QRSTUV/WXYZA2B2/EKQW/FLRX/GMSY/HNTZ/IOUA2/JPVB2Independent T-Test for Means (equal variances), Independent Z-Test for PercentagesUpper case letters indicate significance at the 95% level.
28. What is the next (second) highest priority economic issue?Random sample weighted by relative municipality population
Drop-
Ins Drop-
Ins Drop-
Ins Drop-
Ins Drop-
Ins Drop-
Ins Drop-Ins College
Township Ferguson Township
Halfmoon Township
Harris Township
Patton Township
Boro State College
(D) (W) (X) (Y) (Z) (A2) (B2)
TOTAL ANSWERING 141 11 26 41 13 16 33Expanding existing businesses in the Centre Region 44.7% 45.5% 38.5% 58.5% 46.2% 25.0% 42.4%
A2Attracting new businesses to the Centre Region 29.1% 9.1% 34.6% 22.0% 23.1% 43.8% 33.3%
W W WRetaining existing businesses in the Centre Region 26.2% 45.5% 26.9% 19.5% 30.8% 31.3% 24.2%
Comparison Groups: ABCD/EFGHIJ/KLMNOP/QRSTUV/WXYZA2B2/EKQW/FLRX/GMSY/HNTZ/IOUA2/JPVB2Independent T-Test for Means (equal variances), Independent Z-Test for PercentagesUpper case letters indicate significance at the 95% level.
Page 56

2011 Centre Region Community Survey Results - Drop-Ins
28. LOWEST (third) priority economic issueRandom sample weighted by relative municipality population
Drop-
Ins Drop-
Ins Drop-
Ins Drop-
Ins Drop-
Ins Drop-
Ins Drop-Ins College
Township Ferguson Township
Halfmoon Township
Harris Township
Patton Township
Boro State College
(D) (W) (X) (Y) (Z) (A2) (B2)
TOTAL ANSWERING 141 11 26 41 13 16 33Expanding existing businesses in the Centre Region 44.7% 54.5% 50.0% 26.8% 53.8% 56.3% 48.5%
YAttracting new businesses to the Centre Region 36.2% 27.3% 34.6% 53.7% 38.5% 25.0% 24.2%
A2B2Retaining existing businesses in the Centre Region 19.1% 18.2% 15.4% 19.5% 7.7% 18.8% 27.3%
Comparison Groups: ABCD/EFGHIJ/KLMNOP/QRSTUV/WXYZA2B2/EKQW/FLRX/GMSY/HNTZ/IOUA2/JPVB2Independent T-Test for Means (equal variances), Independent Z-Test for PercentagesUpper case letters indicate significance at the 95% level.
Page 57

2011 Centre Region Community Survey Results - Drop-Ins
Random sample weighted by relative municipality population
Drop-
Ins Drop-
Ins Drop-
Ins Drop-
Ins Drop-
Ins Drop-
Ins Drop-Ins College
Township Ferguson Township
Halfmoon Township
Harris Township
Patton Township
Boro State College
(D) (W) (X) (Y) (Z) (A2) (B2)
TOTAL ANSWERING 143 11 25 43 13 17 33Funding construction infrastructure such as streets, water or sewer lines.
30.8% 36.4% 24.0% 18.6% 30.8% 41.2% 42.4%
YTax abatements or reductions 34.3% 63.6% 20.0% 37.2% 15.4% 41.2% 33.3%
XZReducing development review and permitting fees. 26.6% 18.2% 28.0% 32.6% 30.8% 29.4% 18.2%
Incentives should not be offered 36.4% 18.2% 48.0% 44.2% 46.2% 17.6% 30.3%BC LRA2 A2
Other, please specify 8.4% - 4.0% 7.0% 7.7% 17.6% 12.1%Comparison Groups: ABCD/EFGHIJ/KLMNOP/QRSTUV/WXYZA2B2/EKQW/FLRX/GMSY/HNTZ/IOUA2/JPVB2Independent T-Test for Means (equal variances), Independent Z-Test for PercentagesUpper case letters indicate significance at the 95% level.
29. Should municipalities offer any of the following incentives to keep existing business or attract new business (Check all that you feel should be used)?
Page 58

2011 Centre Region Community Survey Results - Drop-Ins
30. How important is it to offer the following economic development strategies in the Centre Region? First, which strategy is the MOST important?Random sample weighted by relative municipality population
Drop-
Ins Drop-
Ins Drop-
Ins Drop-
Ins Drop-
Ins Drop-
Ins Drop-Ins College
Township Ferguson Township
Halfmoon Township
Harris Township
Patton Township
Boro State College
(D) (W) (X) (Y) (Z) (A2) (B2)
TOTAL ANSWERING 144 10 26 44 13 17 33Support local food, direct-farm marketing, “Buy Fresh Buy Local”
27.1% 50.0% 11.5% 36.4% 30.8% 11.8% 24.2%
XA2 XA2Attract more high-tech jobs 29.2% 40.0% 38.5% 11.4% 15.4% 29.4% 48.5%
B Y JPVYZSupport natural and cultural resource-based tourism (hiking, biking, birding, arts)
13.2% - 11.5% 18.2% 23.1% 11.8% 9.1%
Continue to ensure infrastructure is built and maintained to serve existing businesses
12.5% - 19.2% 13.6% 7.7% 17.6% 9.1%
Attract more manufacturing jobs 5.6% 10.0% 15.4% 2.3% - 11.8% -
Attract more research office opportunities 1.4% - - 4.5% - - -
Support recreational-based activities and tourism (sports)
1.4% - - 2.3% 7.7% - -
Attract more retail and service jobs 2.1% - - 4.5% - - 3.0%Other, please specify 2.8% - - - 15.4% 11.8% -No specific economic development strategies are needed
4.9% - 3.8% 6.8% - 5.9% 6.1%
Comparison Groups: ABCD/EFGHIJ/KLMNOP/QRSTUV/WXYZA2B2/EKQW/FLRX/GMSY/HNTZ/IOUA2/JPVB2Independent T-Test for Means (equal variances), Independent Z-Test for PercentagesUpper case letters indicate significance at the 95% level.
Random sample weighted by relative municipality population
Drop-
Ins Drop-
Ins Drop-
Ins Drop-
Ins Drop-
Ins Drop-
Ins Drop-Ins College
Township Ferguson Township
Halfmoon Township
Harris Township
Patton Township
Boro State College
(D) (W) (X) (Y) (Z) (A2) (B2)
TOTAL ANSWERING 136 10 24 41 13 16 31Support natural and cultural resource-based tourism (hiking, biking, birding, arts)
19.9% 20.0% 12.5% 24.4% 38.5% - 22.6%
MS NTAttract more high-tech jobs 18.4% 20.0% 20.8% 17.1% 15.4% 25.0% 12.9%Continue to ensure infrastructure is built and maintained to serve existing businesses
17.6% 10.0% 29.2% 24.4% 7.7% 12.5% 9.7%
Support local food, direct-farm marketing, “Buy Fresh Buy Local”
13.2% 10.0% 16.7% 9.8% 7.7% 31.3% 9.7%
Attract more manufacturing jobs 7.4% 10.0% - 2.4% 7.7% 12.5% 16.1%
Attract more research office opportunities 12.5% 20.0% 16.7% 12.2% - 6.3% 16.1%
Support recreational-based activities and tourism (sports)
8.1% - 4.2% 9.8% 23.1% - 9.7%
Attract more retail and service jobs 1.5% 10.0% - - - - 3.2%Other, please specify 1.5% - - - - 12.5% -Comparison Groups: ABCD/EFGHIJ/KLMNOP/QRSTUV/WXYZA2B2/EKQW/FLRX/GMSY/HNTZ/IOUA2/JPVB2Independent T-Test for Means (equal variances), Independent Z-Test for PercentagesUpper case letters indicate significance at the 95% level.
30. How important is it to offer the following economic development strategies in the Centre Region? Of the remaining options, which is next (second) most important?
Page 59

2011 Centre Region Community Survey Results - Drop-Ins
Random sample weighted by relative municipality population
Drop-
Ins Drop-
Ins Drop-
Ins Drop-
Ins Drop-
Ins Drop-
Ins Drop-Ins College
Township Ferguson Township
Halfmoon Township
Harris Township
Patton Township
Boro State College
(D) (W) (X) (Y) (Z) (A2) (B2)
TOTAL ANSWERING 133 10 24 39 13 15 31Continue to ensure infrastructure is built and maintained to serve existing businesses
25.6% 20.0% 29.2% 17.9% 30.8% 20.0% 32.3%
Support local food, direct-farm marketing, “Buy Fresh Buy Local”
13.5% 10.0% 16.7% 10.3% 23.1% 6.7% 16.1%
Support recreational-based activities and tourism (sports)
13.5% 30.0% 8.3% 17.9% 15.4% 13.3% 6.5%
Support natural and cultural resource-based tourism (hiking, biking, birding, arts)
11.3% 10.0% 8.3% 10.3% 7.7% 6.7% 19.4%
Attract more research office opportunities 11.3% 20.0% 4.2% 12.8% - 33.3% 6.5%XB2
Attract more high-tech jobs 6.0% - 8.3% 10.3% - 6.7% 3.2%
Attract more manufacturing jobs 12.8% - 20.8% 17.9% 15.4% 6.7% 6.5%Attract more retail and service jobs 4.5% 10.0% 4.2% 2.6% - - 9.7%Other, please specify 1.5% - - - 7.7% 6.7% -Comparison Groups: ABCD/EFGHIJ/KLMNOP/QRSTUV/WXYZA2B2/EKQW/FLRX/GMSY/HNTZ/IOUA2/JPVB2Independent T-Test for Means (equal variances), Independent Z-Test for PercentagesUpper case letters indicate significance at the 95% level.
30. How important is it to offer the following economic development strategies in the Centre Region? Which is next (fourth) most important?Random sample weighted by relative municipality population
Drop-
Ins Drop-
Ins Drop-
Ins Drop-
Ins Drop-
Ins Drop-
Ins Drop-Ins College
Township Ferguson Township
Halfmoon Township
Harris Township
Patton Township
Boro State College
(D) (W) (X) (Y) (Z) (A2) (B2)
TOTAL ANSWERING 128 9 24 37 12 14 31Continue to ensure infrastructure is built and maintained to serve existing businesses
32.8% 44.4% 33.3% 45.9% 41.7% 28.6% 12.9%
C B2Attract more research office opportunities 13.3% 11.1% 16.7% 10.8% - - 25.8%Support natural and cultural resource-based tourism (hiking, biking, birding, arts)
10.9% 11.1% 20.8% 5.4% 8.3% 14.3% 6.5%
Support recreational-based activities and tourism (sports)
9.4% - 8.3% 8.1% 25.0% 14.3% 6.5%
Attract more high-tech jobs 11.7% 22.2% 4.2% 10.8% 8.3% 14.3% 16.1%Support local food, direct-farm marketing, “Buy Fresh Buy Local”
10.2% - 12.5% 10.8% 8.3% 7.1% 12.9%
Attract more retail and service jobs 5.5% 11.1% - 2.7% 8.3% 7.1% 9.7%
Attract more manufacturing jobs 5.5% - - 5.4% - 14.3% 9.7%Other, please specify 0.8% - 4.2% - - - -Comparison Groups: ABCD/EFGHIJ/KLMNOP/QRSTUV/WXYZA2B2/EKQW/FLRX/GMSY/HNTZ/IOUA2/JPVB2Independent T-Test for Means (equal variances), Independent Z-Test for PercentagesUpper case letters indicate significance at the 95% level.
30. How important is it to offer the following economic development strategies in the Centre Region? Which initiative is next (third) most important?
Page 60

2011 Centre Region Community Survey Results - Drop-Ins
30. How important is it to offer the following economic development strategies in the Centre Region? Which is next (fifth) most important?Random sample weighted by relative municipality population
Drop-
Ins Drop-
Ins Drop-
Ins Drop-
Ins Drop-
Ins Drop-
Ins Drop-Ins College
Township Ferguson Township
Halfmoon Township
Harris Township
Patton Township
Boro State College
(D) (W) (X) (Y) (Z) (A2) (B2)
TOTAL ANSWERING 124 9 23 36 12 13 30Continue to ensure infrastructure is built and maintained to serve existing businesses
37.9% 55.6% 43.5% 41.7% 16.7% 38.5% 33.3%
ABC EKQZSupport recreational-based activities and tourism (sports)
7.3% - 13.0% - 8.3% 15.4% 10.0%
Attract more research office opportunities 14.5% - 13.0% 19.4% 33.3% - 13.3%Attract more retail and service jobs 8.9% 11.1% - 11.1% - - 20.0%Attract more high-tech jobs 7.3% - 8.7% 13.9% 8.3% - 3.3%
Support natural and cultural resource-based tourism (hiking, biking, birding, arts)
6.5% 11.1% 8.7% - 8.3% 23.1% 3.3%
Support local food, direct-farm marketing, “Buy Fresh Buy Local”
10.5% 22.2% 4.3% 11.1% 25.0% 7.7% 6.7%
Attract more manufacturing jobs 4.8% - - 2.8% - 15.4% 6.7%Other, please specify 2.4% - 8.7% - - - 3.3%Comparison Groups: ABCD/EFGHIJ/KLMNOP/QRSTUV/WXYZA2B2/EKQW/FLRX/GMSY/HNTZ/IOUA2/JPVB2Independent T-Test for Means (equal variances), Independent Z-Test for PercentagesUpper case letters indicate significance at the 95% level.
Page 61
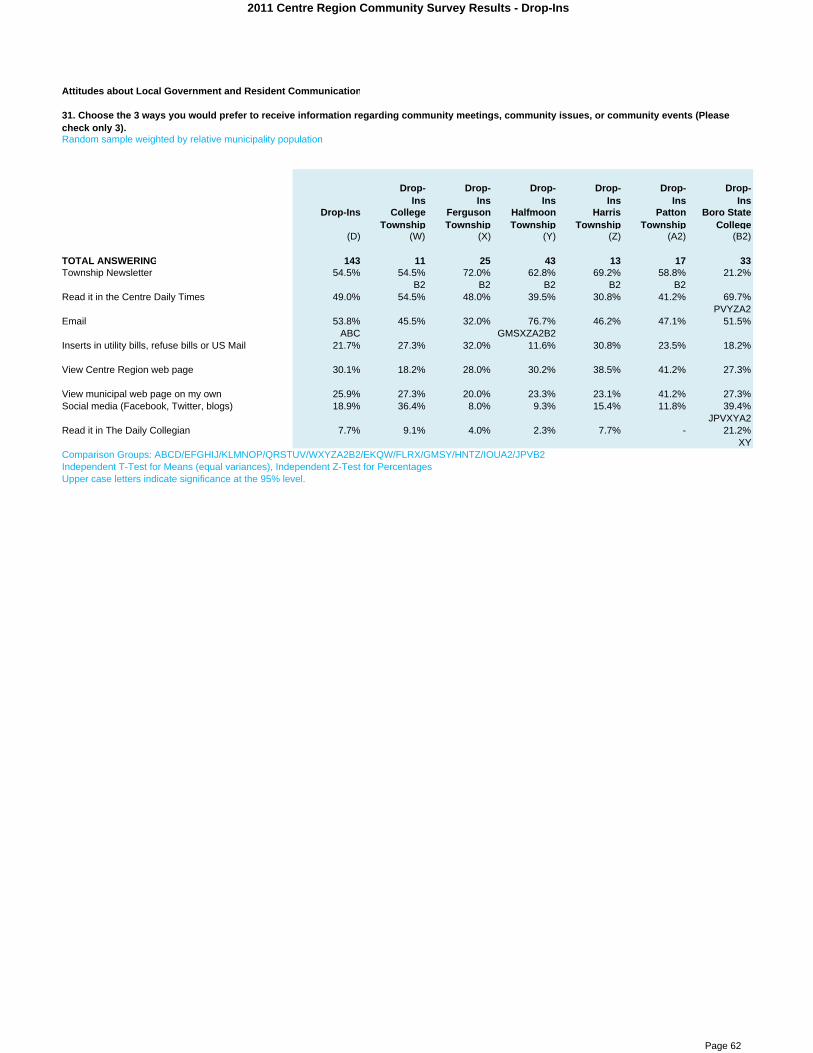
2011 Centre Region Community Survey Results - Drop-Ins
Attitudes about Local Government and Resident Communication
Random sample weighted by relative municipality population
Drop-
Ins Drop-
Ins Drop-
Ins Drop-
Ins Drop-
Ins Drop-
Ins Drop-Ins College
Township Ferguson Township
Halfmoon Township
Harris Township
Patton Township
Boro State College
(D) (W) (X) (Y) (Z) (A2) (B2)
TOTAL ANSWERING 143 11 25 43 13 17 33Township Newsletter 54.5% 54.5% 72.0% 62.8% 69.2% 58.8% 21.2%
B2 B2 B2 B2 B2Read it in the Centre Daily Times 49.0% 54.5% 48.0% 39.5% 30.8% 41.2% 69.7%
PVYZA2Email 53.8% 45.5% 32.0% 76.7% 46.2% 47.1% 51.5%
ABC GMSXZA2B2Inserts in utility bills, refuse bills or US Mail 21.7% 27.3% 32.0% 11.6% 30.8% 23.5% 18.2%
View Centre Region web page 30.1% 18.2% 28.0% 30.2% 38.5% 41.2% 27.3%
View municipal web page on my own 25.9% 27.3% 20.0% 23.3% 23.1% 41.2% 27.3%Social media (Facebook, Twitter, blogs) 18.9% 36.4% 8.0% 9.3% 15.4% 11.8% 39.4%
JPVXYA2Read it in The Daily Collegian 7.7% 9.1% 4.0% 2.3% 7.7% - 21.2%
XYComparison Groups: ABCD/EFGHIJ/KLMNOP/QRSTUV/WXYZA2B2/EKQW/FLRX/GMSY/HNTZ/IOUA2/JPVB2Independent T-Test for Means (equal variances), Independent Z-Test for PercentagesUpper case letters indicate significance at the 95% level.
31. Choose the 3 ways you would prefer to receive information regarding community meetings, community issues, or community events (Please check only 3).
Page 62

2011 Centre Region Community Survey Results - Drop-Ins
Demographic Information
32. Demographic Information Please select the municipality where you currently live.Random sample weighted by relative municipality population
Drop-
Ins Drop-
Ins Drop-
Ins Drop-
Ins Drop-
Ins Drop-
Ins Drop-Ins College
Township Ferguson Township
Halfmoon Township
Harris Township
Patton Township
Boro State College
(D) (W) (X) (Y) (Z) (A2) (B2)
TOTAL ANSWERING 150 11 26 44 13 17 33Ferguson Township 17.3% - 100.0% - - - -
Borough of State College 22.0% - - - - - 100.0%
Patton Township 11.3% - - - - 100.0% -
College Township 7.3% 100.0% - - - - -
Halfmoon Township 29.3% - - 100.0% - - -ABC
Harris Township 8.7% - - - 100.0% - -Other 6 - - - - - -
4.0%Comparison Groups: ABCD/EFGHIJ/KLMNOP/QRSTUV/WXYZA2B2/EKQW/FLRX/GMSY/HNTZ/IOUA2/JPVB2Independent T-Test for Means (equal variances), Independent Z-Test for PercentagesUpper case letters indicate significance at the 95% level.
33. Please select the number of years you have lived in any of the six municipalities in the previous questionRandom sample weighted by relative municipality population
Drop-
Ins Drop-
Ins Drop-
Ins Drop-
Ins Drop-
Ins Drop-
Ins Drop-Ins College
Township Ferguson Township
Halfmoon Township
Harris Township
Patton Township
Boro State College
(D) (W) (X) (Y) (Z) (A2) (B2)
TOTAL ANSWERING 143 11 26 44 13 17 321 year or less 2.8% - - - 15.4% - 6.3%
2 to 5 years 13.3% 27.3% 11.5% 9.1% 15.4% 11.8% 15.6%
6 to 10 years 22.4% 27.3% 15.4% 18.2% 15.4% 35.3% 28.1%BC
11 to 15 years 14.7% - 15.4% 25.0% - 23.5% 6.3%B2
16 to 20 years 11.9% 18.2% 11.5% 15.9% 7.7% 5.9% 9.4%Over 20 years 35.0% 27.3% 46.2% 31.8% 46.2% 23.5% 34.4%
Comparison Groups: ABCD/EFGHIJ/KLMNOP/QRSTUV/WXYZA2B2/EKQW/FLRX/GMSY/HNTZ/IOUA2/JPVB2Independent T-Test for Means (equal variances), Independent Z-Test for PercentagesUpper case letters indicate significance at the 95% level.
Page 63

2011 Centre Region Community Survey Results - Drop-Ins
34. Are you employed?Random sample weighted by relative municipality population
Drop-
Ins Drop-
Ins Drop-
Ins Drop-
Ins Drop-
Ins Drop-
Ins Drop-Ins College
Township Ferguson Township
Halfmoon Township
Harris Township
Patton Township
Boro State College
(D) (W) (X) (Y) (Z) (A2) (B2)
TOTAL ANSWERING 144 11 26 44 13 17 33Yes 79.2% 72.7% 80.8% 88.6% 69.2% 70.6% 75.8%
BCNo 20.8% 27.3% 19.2% 11.4% 30.8% 29.4% 24.2%
Comparison Groups: ABCD/EFGHIJ/KLMNOP/QRSTUV/WXYZA2B2/EKQW/FLRX/GMSY/HNTZ/IOUA2/JPVB2Independent T-Test for Means (equal variances), Independent Z-Test for PercentagesUpper case letters indicate significance at the 95% level.
35. Please select the municipality in which your job is located.Random sample weighted by relative municipality population
Drop-
Ins Drop-
Ins Drop-
Ins Drop-
Ins Drop-
Ins Drop-
Ins Drop-Ins College
Township Ferguson Township
Halfmoon Township
Harris Township
Patton Township
Boro State College
(D) (W) (X) (Y) (Z) (A2) (B2)
TOTAL ANSWERING 114 8 21 39 9 12 25State College Borough 33.3% 25.0% 14.3% 38.5% 22.2% - 64.0%
X WXYZCollege Township 12.3% 50.0% - 12.8% - 8.3% 16.0%
YA2Ferguson Township 23.7% 12.5% 57.1% 10.3% 11.1% 58.3% 8.0%
BC FLRWYZB2 IOUWYZB2Patton Township 4.4% 12.5% 4.8% 2.6% - 16.7% -
Benner Township 1.8% - - 2.6% - - 4.0%Harris Township 3.5% - 4.8% 2.6% 22.2% - -Bellefonte Borough 0.9% - - - 11.1% - -Halfmoon Township 3.5% - - 10.3% - - -Spring Township 0.9% - - - - 8.3% -Another municipality in Centre County 1.8% - - 2.6% - - 4.0%Another municipality outside Centre County 14.0% - 19.0% 17.9% 33.3% 8.3% 4.0%
Comparison Groups: ABCD/EFGHIJ/KLMNOP/QRSTUV/WXYZA2B2/EKQW/FLRX/GMSY/HNTZ/IOUA2/JPVB2Independent T-Test for Means (equal variances), Independent Z-Test for PercentagesUpper case letters indicate significance at the 95% level.
Page 64

2011 Centre Region Community Survey Results - Drop-Ins
36. Which category best describes your occupation?Random sample weighted by relative municipality population
Drop-
Ins Drop-
Ins Drop-
Ins Drop-
Ins Drop-
Ins Drop-
Ins Drop-Ins College
Township Ferguson Township
Halfmoon Township
Harris Township
Patton Township
Boro State College
(D) (W) (X) (Y) (Z) (A2) (B2)
TOTAL ANSWERING 113 8 20 39 9 12 25Professional 48.7% 37.5% 70.0% 48.7% 55.6% 50.0% 32.0%
C FLRB2Educator 14.2% - 10.0% 17.9% 22.2% - 20.0%
Manager or business owner 15.0% 25.0% 10.0% 12.8% 11.1% 16.7% 20.0%Service worker 4.4% - - - 11.1% - 16.0%
Clerical worker 5.3% 12.5% - 7.7% - 8.3% 4.0%Salesperson 1.8% - 5.0% - - 8.3% -Skilled worker 5.3% 25.0% - 2.6% - 16.7% 4.0%Other, please specify: 5.3% - 5.0% 10.3% - - 4.0%
Comparison Groups: ABCD/EFGHIJ/KLMNOP/QRSTUV/WXYZA2B2/EKQW/FLRX/GMSY/HNTZ/IOUA2/JPVB2Independent T-Test for Means (equal variances), Independent Z-Test for PercentagesUpper case letters indicate significance at the 95% level.
37. Is anyone in your household a full-time or part-time student at Penn State University’s – University Park Campus?Random sample weighted by relative municipality population
Drop-
Ins Drop-
Ins Drop-
Ins Drop-
Ins Drop-
Ins Drop-
Ins Drop-Ins College
Township Ferguson Township
Halfmoon Township
Harris Township
Patton Township
Boro State College
(D) (W) (X) (Y) (Z) (A2) (B2)
TOTAL ANSWERING 141 11 25 44 13 16 31Yes 26 3 6 8 1 1 7
18.4% 27.3% 24.0% 18.2% 7.7% 6.3% 22.6%
No 115 8 19 36 12 15 2481.6% 72.7% 76.0% 81.8% 92.3% 93.8% 77.4%
Comparison Groups: ABCD/EFGHIJ/KLMNOP/QRSTUV/WXYZA2B2/EKQW/FLRX/GMSY/HNTZ/IOUA2/JPVB2Independent T-Test for Means (equal variances), Independent Z-Test for PercentagesUpper case letters indicate significance at the 95% level.
Page 65

2011 Centre Region Community Survey Results - Drop-Ins
38. Please check the one box that most closely describes the type of housing unit you live in.Random sample weighted by relative municipality population
Drop-
Ins Drop-
Ins Drop-
Ins Drop-
Ins Drop-
Ins Drop-
Ins Drop-Ins College
Township Ferguson Township
Halfmoon Township
Harris Township
Patton Township
Boro State College
(D) (W) (X) (Y) (Z) (A2) (B2)
TOTAL ANSWERING 145 11 26 44 13 17 33A detached single family home 75.9% 54.5% 84.6% 93.2% 76.9% 76.5% 51.5%
B2 WB2Townhouse 9.0% 9.1% 3.8% - 23.1% 17.6% 15.2%
An apartment in an apartment complex 9.7% 27.3% 3.8% 2.3% - 5.9% 24.2%XY
A duplex 2.1% 9.1% 3.8% - - - 3.0%An apartment in a single family home 0.7% - - - - - 3.0%
A mobile home 2.1% - 3.8% 4.5% - - -Other 0.7% - - - - - 3.0%
Comparison Groups: ABCD/EFGHIJ/KLMNOP/QRSTUV/WXYZA2B2/EKQW/FLRX/GMSY/HNTZ/IOUA2/JPVB2Independent T-Test for Means (equal variances), Independent Z-Test for PercentagesUpper case letters indicate significance at the 95% level.
39. Do you rent or own your residence?Random sample weighted by relative municipality population
Drop-
Ins Drop-
Ins Drop-
Ins Drop-
Ins Drop-
Ins Drop-
Ins Drop-Ins College
Township Ferguson Township
Halfmoon Township
Harris Township
Patton Township
Boro State College
(D) (W) (X) (Y) (Z) (A2) (B2)
TOTAL ANSWERING 145 11 26 44 13 17 33Rent 17.2% 36.4% 11.5% 4.5% 7.7% 11.8% 39.4%
Y XYZA2Own 82.8% 63.6% 88.5% 95.5% 92.3% 88.2% 60.6%
C B2 WB2 B2 B2Comparison Groups: ABCD/EFGHIJ/KLMNOP/QRSTUV/WXYZA2B2/EKQW/FLRX/GMSY/HNTZ/IOUA2/JPVB2Independent T-Test for Means (equal variances), Independent Z-Test for PercentagesUpper case letters indicate significance at the 95% level.
Page 66

2011 Centre Region Community Survey Results - Drop-Ins
40. About how much was the gross income for your household in 2010? (Include all persons in the household for which a tax return was filed)Random sample weighted by relative municipality population
Drop-
Ins Drop-
Ins Drop-
Ins Drop-
Ins Drop-
Ins Drop-
Ins Drop-Ins College
Township Ferguson Township
Halfmoon Township
Harris Township
Patton Township
Boro State College
(D) (W) (X) (Y) (Z) (A2) (B2)
TOTAL ANSWERING 136 10 25 42 13 15 31Less than $10,000 2.2% 10.0% - - - - 6.5%$10,000 to $14,999 1.5% 10.0% - - 7.7% - -$15,000 to $24,999 3.7% 10.0% 4.0% - - - 9.7%$25,000 to $34,999 6.6% - - 2.4% 7.7% - 22.6%
Y$35,000 to $49,999 7.4% 20.0% 16.0% 4.8% - - 6.5%
$50,000 to $74,999 17.6% - 28.0% 11.9% - 40.0% 19.4%Y
$75,000 to $99,999 17.6% 20.0% 12.0% 19.0% 23.1% 26.7% 12.9%$100,000 to $149,999 30.9% 10.0% 36.0% 47.6% 30.8% 20.0% 16.1%
BC WA2B2$150,000 to $199,999 6.6% - 4.0% 11.9% 7.7% 6.7% 3.2%$200,000 or more 5.9% 20.0% - 2.4% 23.1% 6.7% 3.2%
Comparison Groups: ABCD/EFGHIJ/KLMNOP/QRSTUV/WXYZA2B2/EKQW/FLRX/GMSY/HNTZ/IOUA2/JPVB2Independent T-Test for Means (equal variances), Independent Z-Test for PercentagesUpper case letters indicate significance at the 95% level.
41. My age group is...Random sample weighted by relative municipality population
Drop-
Ins Drop-
Ins Drop-
Ins Drop-
Ins Drop-
Ins Drop-
Ins Drop-Ins College
Township Ferguson Township
Halfmoon Township
Harris Township
Patton Township
Boro State College
(D) (W) (X) (Y) (Z) (A2) (B2)
TOTAL ANSWERING 140 10 25 43 13 16 3218 - 24 3.6% 20.0% 4.0% - - - 6.3%
25 - 34 16.4% 20.0% 20.0% 4.7% - 6.3% 40.6%PVYA2
35 - 44 20.0% - 8.0% 27.9% 30.8% 37.5% 12.5%BC X X
45 - 59 39.3% 60.0% 44.0% 55.8% 15.4% 37.5% 18.8%KQZB2 ZB2 ZB2
60 - 64 7.9% - 8.0% 4.7% 23.1% 6.3% 9.4%
65 + 12.9% - 16.0% 7.0% 30.8% 12.5% 12.5%
Comparison Groups: ABCD/EFGHIJ/KLMNOP/QRSTUV/WXYZA2B2/EKQW/FLRX/GMSY/HNTZ/IOUA2/JPVB2Independent T-Test for Means (equal variances), Independent Z-Test for PercentagesUpper case letters indicate significance at the 95% level.
Page 67
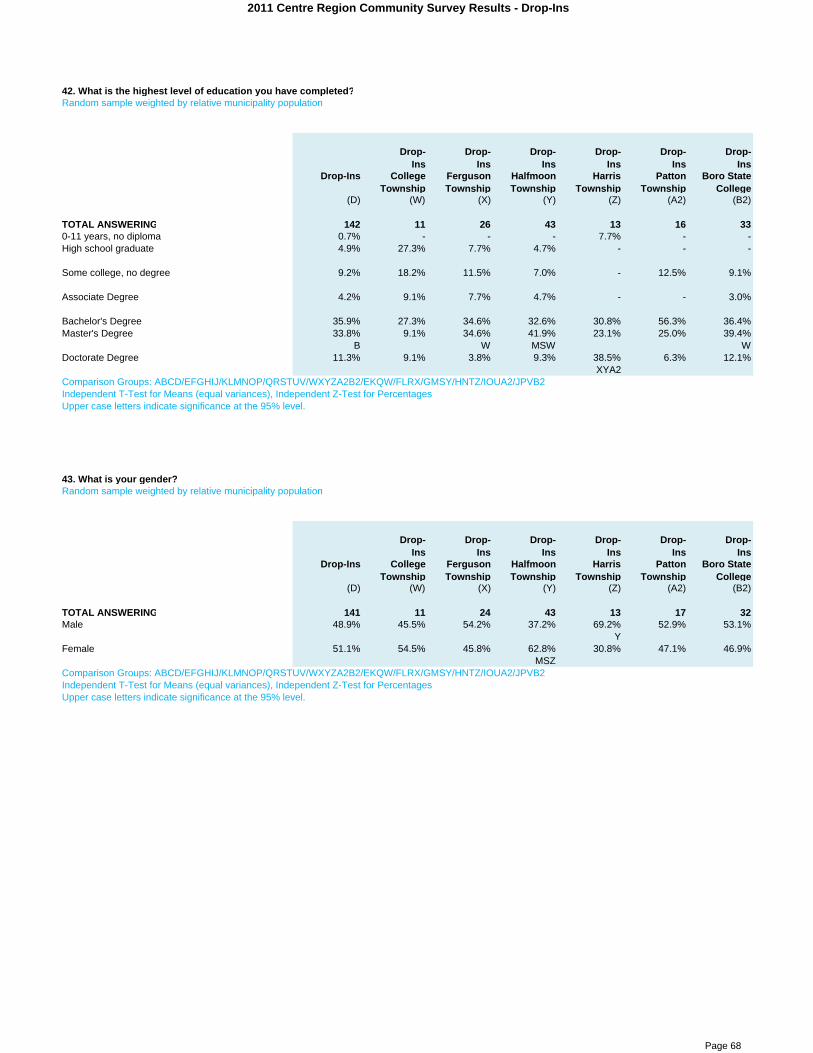
2011 Centre Region Community Survey Results - Drop-Ins
42. What is the highest level of education you have completed?Random sample weighted by relative municipality population
Drop-
Ins Drop-
Ins Drop-
Ins Drop-
Ins Drop-
Ins Drop-
Ins Drop-Ins College
Township Ferguson Township
Halfmoon Township
Harris Township
Patton Township
Boro State College
(D) (W) (X) (Y) (Z) (A2) (B2)
TOTAL ANSWERING 142 11 26 43 13 16 330-11 years, no diploma 0.7% - - - 7.7% - -High school graduate 4.9% 27.3% 7.7% 4.7% - - -
Some college, no degree 9.2% 18.2% 11.5% 7.0% - 12.5% 9.1%
Associate Degree 4.2% 9.1% 7.7% 4.7% - - 3.0%
Bachelor's Degree 35.9% 27.3% 34.6% 32.6% 30.8% 56.3% 36.4%Master's Degree 33.8% 9.1% 34.6% 41.9% 23.1% 25.0% 39.4%
B W MSW WDoctorate Degree 11.3% 9.1% 3.8% 9.3% 38.5% 6.3% 12.1%
XYA2Comparison Groups: ABCD/EFGHIJ/KLMNOP/QRSTUV/WXYZA2B2/EKQW/FLRX/GMSY/HNTZ/IOUA2/JPVB2Independent T-Test for Means (equal variances), Independent Z-Test for PercentagesUpper case letters indicate significance at the 95% level.
43. What is your gender?Random sample weighted by relative municipality population
Drop-
Ins Drop-
Ins Drop-
Ins Drop-
Ins Drop-
Ins Drop-
Ins Drop-Ins College
Township Ferguson Township
Halfmoon Township
Harris Township
Patton Township
Boro State College
(D) (W) (X) (Y) (Z) (A2) (B2)
TOTAL ANSWERING 141 11 24 43 13 17 32Male 48.9% 45.5% 54.2% 37.2% 69.2% 52.9% 53.1%
YFemale 51.1% 54.5% 45.8% 62.8% 30.8% 47.1% 46.9%
MSZComparison Groups: ABCD/EFGHIJ/KLMNOP/QRSTUV/WXYZA2B2/EKQW/FLRX/GMSY/HNTZ/IOUA2/JPVB2Independent T-Test for Means (equal variances), Independent Z-Test for PercentagesUpper case letters indicate significance at the 95% level.
Page 68

Centre Region Comprehensive Plan Survey
Appendix C ‐ Combined Results Centre Regional Planning Agency | January 2012
APPENDIX C
RANDOM SAMPLE AND DROP‐IN SAMPLE COMBINED RESULTS
BACKGROUND
The random sample survey and “drop‐in” sample survey results were combined in this appendix. By
aggregating the results, the consultant was able to compare responses for each question in the
combined results with those in the random sample results (at the regional level). The combined results
show that the random sample results, when compared to the combined results, were nearly identical.
The combined survey results and random sample survey results produced similar responses on nearly
every question in the survey.
READING THE RESULTS
See APPENDIX A for instructions on reading the results.

2011 Centre Region Community Survey Results - Total Results
Random sample weighted by relative municipality population
Total Total Total Total Total Total
TOTAL College Township
Ferguson Township
Halfmoon Township
Harris Township
Patton Township
Boro State College
(A) (E) (F) (G) (H) (I) (J)
TOTAL ANSWERING 611 89 154 67 55 102 133Mail 47.8% 59.6% 52.6% 19.4% 49.1% 44.1% 53.4%
GI G G G GWeb Sample 27.7% 28.1% 30.5% 14.9% 27.3% 39.2% 21.8%
G G GJWeb Drop-in 24.5% 12.4% 16.9% 65.7% 23.6% 16.7% 24.8%
EFHIJ EComparison Groups: ABCD/EFGHIJ/KLMNOP/QRSTUV/WXYZA2B2/EKQW/FLRX/GMSY/HNTZ/IOUA2/JPVB2Independent T-Test for Means (equal variances), Independent Z-Test for PercentagesUpper case letters indicate significance at the 95% level.
ModeRandom sample weighted by relative municipality population
Total Total Total Total Total Total
TOTAL College Township
Ferguson Township
Halfmoon Township
Harris Township
Patton Township
Boro State College
(A) (E) (F) (G) (H) (I) (J)
TOTAL ANSWERING 611 89 154 67 55 102 133Random Sample 75.5% 87.6% 83.1% 34.3% 76.4% 83.3% 75.2%
GJ G G G GDrop-Ins 24.5% 12.4% 16.9% 65.7% 23.6% 16.7% 24.8%
EFHIJ EComparison Groups: ABCD/EFGHIJ/KLMNOP/QRSTUV/WXYZA2B2/EKQW/FLRX/GMSY/HNTZ/IOUA2/JPVB2Independent T-Test for Means (equal variances), Independent Z-Test for PercentagesUpper case letters indicate significance at the 95% level.
Page 1

2011 Centre Region Community Survey Results - Total Results
Attitudes about Land Use and Development in the Centre Region
Random sample weighted by relative municipality population
Total Total Total Total Total Total
TOTAL College Township
Ferguson Township
Halfmoon Township
Harris Township
Patton Township
Boro State College
(A) (E) (F) (G) (H) (I) (J)
TOTAL ANSWERING 593 85 151 66 54 100 132Having access to open space (parks, green belts, wooded land) near residential areas
56.0% 47.1% 54.3% 60.6% 57.4% 64.0% 54.5%
EMaintaining a low level of environmental pollution 49.4% 52.9% 49.0% 54.5% 53.7% 46.0% 46.2%Encouraging a sustainable region 40.1% 40.0% 36.4% 50.0% 31.5% 38.0% 43.9%
HProtecting neighborhoods from encroachment by non-residential land uses
30.7% 32.9% 36.4% 28.8% 31.5% 22.0% 31.1%
IBuilding and maintaining livable neighborhoods 25.1% 22.4% 21.9% 22.7% 29.6% 26.0% 29.5%
Attracting business 23.1% 28.2% 26.5% 16.7% 24.1% 23.0% 18.9%
Improving personal security and public safety 22.3% 18.8% 27.2% 21.2% 22.2% 23.0% 18.9%B2
Expanding the variety and availability of retail goods and services
17.4% 17.6% 20.5% 12.1% 13.0% 17.0% 17.4%
Maintaining and enhancing the visual appearance of buildings and landscaping
16.7% 18.8% 13.9% 13.6% 16.7% 20.0% 18.2%
Increasing education opportunities for all age groups 14.0% 17.6% 11.3% 15.2% 14.8% 17.0% 10.6%
Other 4.9% 3.5% 4.0% 4.5% 5.6% 4.0% 7.6%
Comparison Groups: ABCD/EFGHIJ/KLMNOP/QRSTUV/WXYZA2B2/EKQW/FLRX/GMSY/HNTZ/IOUA2/JPVB2Independent T-Test for Means (equal variances), Independent Z-Test for PercentagesUpper case letters indicate significance at the 95% level.
1. MOST IMPORTANT OBJECTIVES which could be used to guide future growth and development in the Centre Region. (Percent selected in top three most important.)
Page 2
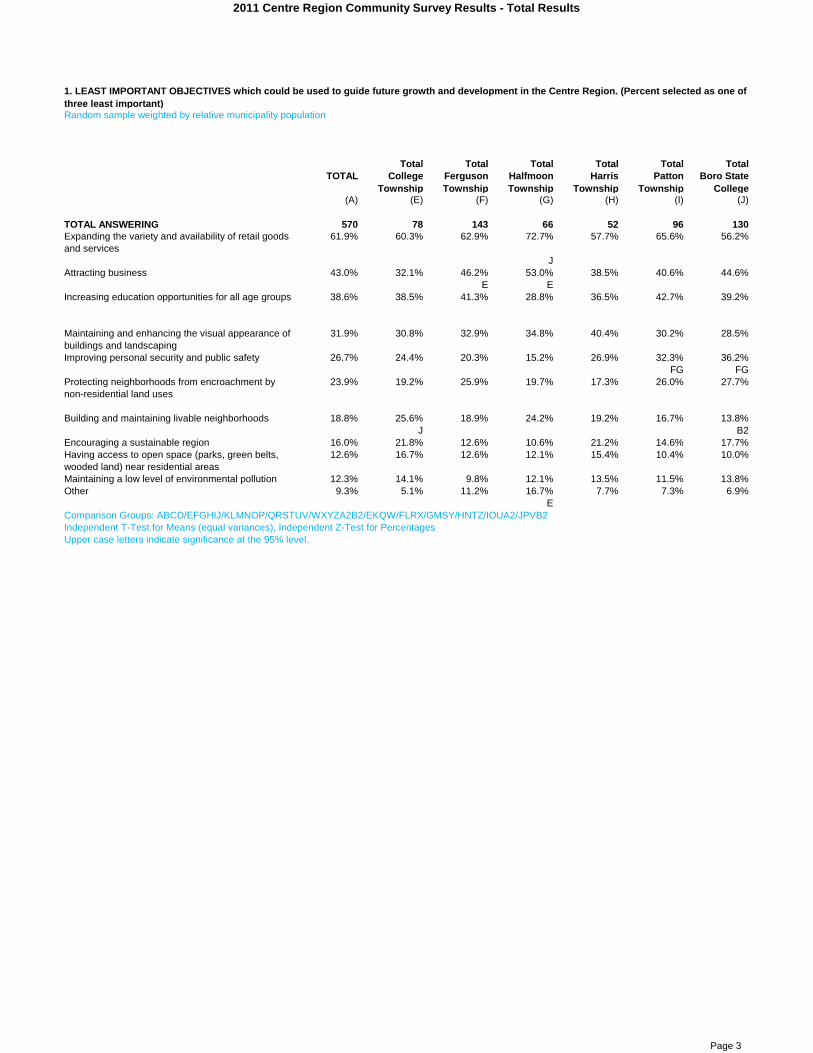
2011 Centre Region Community Survey Results - Total Results
Random sample weighted by relative municipality population
Total Total Total Total Total Total
TOTAL College Township
Ferguson Township
Halfmoon Township
Harris Township
Patton Township
Boro State College
(A) (E) (F) (G) (H) (I) (J)
TOTAL ANSWERING 570 78 143 66 52 96 130Expanding the variety and availability of retail goods and services
61.9% 60.3% 62.9% 72.7% 57.7% 65.6% 56.2%
JAttracting business 43.0% 32.1% 46.2% 53.0% 38.5% 40.6% 44.6%
E EIncreasing education opportunities for all age groups 38.6% 38.5% 41.3% 28.8% 36.5% 42.7% 39.2%
Maintaining and enhancing the visual appearance of buildings and landscaping
31.9% 30.8% 32.9% 34.8% 40.4% 30.2% 28.5%
Improving personal security and public safety 26.7% 24.4% 20.3% 15.2% 26.9% 32.3% 36.2%FG FG
Protecting neighborhoods from encroachment by non-residential land uses
23.9% 19.2% 25.9% 19.7% 17.3% 26.0% 27.7%
Building and maintaining livable neighborhoods 18.8% 25.6% 18.9% 24.2% 19.2% 16.7% 13.8%J B2
Encouraging a sustainable region 16.0% 21.8% 12.6% 10.6% 21.2% 14.6% 17.7%Having access to open space (parks, green belts, wooded land) near residential areas
12.6% 16.7% 12.6% 12.1% 15.4% 10.4% 10.0%
Maintaining a low level of environmental pollution 12.3% 14.1% 9.8% 12.1% 13.5% 11.5% 13.8%Other 9.3% 5.1% 11.2% 16.7% 7.7% 7.3% 6.9%
EComparison Groups: ABCD/EFGHIJ/KLMNOP/QRSTUV/WXYZA2B2/EKQW/FLRX/GMSY/HNTZ/IOUA2/JPVB2Independent T-Test for Means (equal variances), Independent Z-Test for PercentagesUpper case letters indicate significance at the 95% level.
1. LEAST IMPORTANT OBJECTIVES which could be used to guide future growth and development in the Centre Region. (Percent selected as one of three least important)
Page 3

2011 Centre Region Community Survey Results - Total Results
Random sample weighted by relative municipality population
Total Total Total Total Total Total
TOTAL College Township
Ferguson Township
Halfmoon Township
Harris Township
Patton Township
Boro State College
(A) (E) (F) (G) (H) (I) (J)
TOTAL ANSWERING 599 85 154 66 54 102 132High rate of population growth (An additional 32,000 residents)
5.3% 7.1% 3.2% 4.5% 3.7% 7.8% 6.1%
PVModerate rate of population growth (An additional 18,000 residents)
30.4% 29.4% 33.8% 21.2% 33.3% 33.3% 28.0%
GLow rate of population growth (An additional 6,000 residents)
35.7% 27.1% 40.9% 48.5% 35.2% 31.4% 32.6%
E EIJNo increase in population 15.7% 18.8% 12.3% 13.6% 22.2% 13.7% 17.4%
It doesn't matter to me 12.9% 17.6% 9.7% 12.1% 5.6% 13.7% 15.9%H H
Comparison Groups: ABCD/EFGHIJ/KLMNOP/QRSTUV/WXYZA2B2/EKQW/FLRX/GMSY/HNTZ/IOUA2/JPVB2Independent T-Test for Means (equal variances), Independent Z-Test for PercentagesUpper case letters indicate significance at the 95% level.
2. During the next 30 years what rate of population growth would you prefer for the Centre Region? Please check the population number which corresponds to your preference (Check only one).
Page 4

2011 Centre Region Community Survey Results - Total Results
Random sample weighted by relative municipality population
Total Total Total Total Total Total
TOTAL College Township
Ferguson Township
Halfmoon Township
Harris Township
Patton Township
Boro State College
(A) (E) (F) (G) (H) (I) (J)
TOTAL ANSWERING 603 89 151 67 55 102 133Balance community growth while protecting and enhancing the Centre Region's environmental, historic, and cultural resources.
89.7% 88.8% 90.1% 89.6% 90.9% 91.2% 89.5%
Maintain a cooperative relationship between the Centre Region municipalities and Penn State University to ensure that future growth at the University benefits the community.
85.4% 78.7% 83.4% 82.1% 85.5% 90.2% 89.5%
E EPreserve prime farmland for agricultural use. 83.4% 76.4% 84.8% 85.1% 85.5% 81.4% 86.5%Coordinate land development activity with the transportation system for the safe, efficient, and convenient movement of people and goods.
83.1% 74.2% 81.5% 82.1% 80.0% 87.3% 89.5%
E ECoordinate land development activity with necessary public facilities and services in a cost-effective manner.
80.9% 74.2% 82.1% 76.1% 87.3% 78.4% 85.7%
E EDirect the majority of future growth to areas within the Regional Growth Boundary so that new development can be efficiently served by public utilities, services, and transit.
71.5% 70.8% 70.2% 71.6% 74.5% 70.6% 72.9%
Provide a variety of housing opportunities to satisfy the needs of all existing and future residents of the Centre Region.
71.3% 62.9% 69.5% 65.7% 65.5% 76.5% 79.7%
E EFGObtain additional parkland and open-space areas, and provide a broad range of recreational opportunities.
69.0% 58.4% 66.9% 73.1% 69.1% 74.5% 72.2%
E EPreserve and enhance the low-density community character in the rural areas located outside of the Regional Growth Boundary.
68.5% 64.0% 65.6% 86.6% 80.0% 60.8% 66.2%
EFIJ EFIJComparison Groups: ABCD/EFGHIJ/KLMNOP/QRSTUV/WXYZA2B2/EKQW/FLRX/GMSY/HNTZ/IOUA2/JPVB2Independent T-Test for Means (equal variances), Independent Z-Test for PercentagesUpper case letters indicate significance at the 95% level.
3. RELEVANT GOALS. Please select which best corresponds to your current opinion regarding each of the goals. (Percent selected as "still relevant")
Page 5

2011 Centre Region Community Survey Results - Total Results
Random sample weighted by relative municipality population
Total Total Total Total Total Total
TOTAL College Township
Ferguson Township
Halfmoon Township
Harris Township
Patton Township
Boro State College
(A) (E) (F) (G) (H) (I) (J)
TOTAL ANSWERING 603 89 151 67 55 102 133Obtain additional parkland and open-space areas, and provide a broad range of recreational opportunities.
19.9% 27.0% 19.2% 17.9% 23.6% 14.7% 19.5%
IProvide a variety of housing opportunities to satisfy the needs of all existing and future residents of the Centre Region.
17.6% 16.9% 18.5% 23.9% 25.5% 13.7% 14.3%
Preserve and enhance the low-density community character in the rural areas located outside of the Regional Growth Boundary.
15.6% 16.9% 13.9% 10.4% 12.7% 19.6% 18.0%
XDirect the majority of future growth to areas within the Regional Growth Boundary so that new development can be efficiently served by public utilities, services, and transit.
10.3% 10.1% 7.9% 16.4% 12.7% 10.8% 9.0%
Preserve prime farmland for agricultural use. 7.6% 6.7% 7.9% 9.0% 9.1% 11.8% 3.8%J
Coordinate land development activity with necessary public facilities and services in a cost-effective manner.
7.6% 9.0% 6.6% 10.4% 9.1% 9.8% 4.5%
Coordinate land development activity with the transportation system for the safe, efficient, and convenient movement of people and goods.
7.5% 10.1% 6.0% 7.5% 14.5% 7.8% 4.5%
JMaintain a cooperative relationship between the Centre Region municipalities and Penn State University to ensure that future growth at the University benefits the community.
7.3% 10.1% 7.9% 10.4% 5.5% 6.9% 4.5%
Balance community growth while protecting and enhancing the Centre Region's environmental, historic, and cultural resources.
4.6% 3.4% 4.0% 9.0% 3.6% 3.9% 4.5%
Comparison Groups: ABCD/EFGHIJ/KLMNOP/QRSTUV/WXYZA2B2/EKQW/FLRX/GMSY/HNTZ/IOUA2/JPVB2Independent T-Test for Means (equal variances), Independent Z-Test for PercentagesUpper case letters indicate significance at the 95% level.
3. NO LONGER RELEVANT GOALS. Please select which best corresponds to your current opinion regarding each of the goals. (Percent selected as "no longer relevant")
Page 6

2011 Centre Region Community Survey Results - Total Results
Random sample weighted by relative municipality population
Total Total Total Total Total Total
TOTAL College Township
Ferguson Township
Halfmoon Township
Harris Township
Patton Township
Boro State College
(A) (E) (F) (G) (H) (I) (J)
TOTAL ANSWERING 603 89 151 67 55 102 133Still Relevant 89.7% 88.8% 90.1% 89.6% 90.9% 91.2% 89.5%No Longer Relevant 4.6% 3.4% 4.0% 9.0% 3.6% 3.9% 4.5%Don’t Know/Not Sure 5.0% 6.7% 5.3% 1.5% 5.5% 4.9% 4.5%Comparison Groups: ABCD/EFGHIJ/KLMNOP/QRSTUV/WXYZA2B2/EKQW/FLRX/GMSY/HNTZ/IOUA2/JPVB2Independent T-Test for Means (equal variances), Independent Z-Test for PercentagesUpper case letters indicate significance at the 95% level.
public utilities, services, and transit.Random sample weighted by relative municipality population
Total Total Total Total Total Total
TOTAL College Township
Ferguson Township
Halfmoon Township
Harris Township
Patton Township
Boro State College
(A) (E) (F) (G) (H) (I) (J)
TOTAL ANSWERING 603 89 151 67 55 102 133Still Relevant 71.5% 70.8% 70.2% 71.6% 74.5% 70.6% 72.9%No Longer Relevant 10.3% 10.1% 7.9% 16.4% 12.7% 10.8% 9.0%Don’t Know/Not Sure 16.9% 18.0% 18.5% 11.9% 12.7% 17.6% 17.3%Comparison Groups: ABCD/EFGHIJ/KLMNOP/QRSTUV/WXYZA2B2/EKQW/FLRX/GMSY/HNTZ/IOUA2/JPVB2Independent T-Test for Means (equal variances), Independent Z-Test for PercentagesUpper case letters indicate significance at the 95% level.
3. Please select which best corresponds to your current opinion regarding the following goal. Balance community growth while protecting and enhancing the Centre Region's environmental, historic, and cultural resources.
3. Please select which best corresponds to your current opinion regarding the following goal. Direct the majority of future growth to areas within the Regional Growth Boundary so that new development can be efficiently served by
Page 7

2011 Centre Region Community Survey Results - Total Results
Random sample weighted by relative municipality population
Total Total Total Total Total Total
TOTAL College Township
Ferguson Township
Halfmoon Township
Harris Township
Patton Township
Boro State College
(A) (E) (F) (G) (H) (I) (J)
TOTAL ANSWERING 603 89 151 67 55 102 133Still Relevant 68.5% 64.0% 65.6% 86.6% 80.0% 60.8% 66.2%
EFIJ EFIJNo Longer Relevant 15.6% 16.9% 13.9% 10.4% 12.7% 19.6% 18.0%
XDon’t Know/Not Sure 14.3% 16.9% 17.9% 3.0% 7.3% 19.6% 12.8%
G GH GH GComparison Groups: ABCD/EFGHIJ/KLMNOP/QRSTUV/WXYZA2B2/EKQW/FLRX/GMSY/HNTZ/IOUA2/JPVB2Independent T-Test for Means (equal variances), Independent Z-Test for PercentagesUpper case letters indicate significance at the 95% level.
3. Please select which best corresponds to your current opinion regarding the following goal.Preserve prime farmland for agricultural use.Random sample weighted by relative municipality population
Total Total Total Total Total Total
TOTAL College Township
Ferguson Township
Halfmoon Township
Harris Township
Patton Township
Boro State College
(A) (E) (F) (G) (H) (I) (J)
TOTAL ANSWERING 603 89 151 67 55 102 133Still Relevant 83.4% 76.4% 84.8% 85.1% 85.5% 81.4% 86.5%No Longer Relevant 7.6% 6.7% 7.9% 9.0% 9.1% 11.8% 3.8%
JDon’t Know/Not Sure 8.3% 15.7% 6.0% 6.0% 5.5% 6.9% 9.8%
FGHComparison Groups: ABCD/EFGHIJ/KLMNOP/QRSTUV/WXYZA2B2/EKQW/FLRX/GMSY/HNTZ/IOUA2/JPVB2Independent T-Test for Means (equal variances), Independent Z-Test for PercentagesUpper case letters indicate significance at the 95% level.
3. Please select which best corresponds to your current opinion regarding the following goal. Preserve and enhance the low-density community character in the rural areas located outside of the Regional Growth Boundary.
Page 8

2011 Centre Region Community Survey Results - Total Results
Random sample weighted by relative municipality population
Total Total Total Total Total Total
TOTAL College Township
Ferguson Township
Halfmoon Township
Harris Township
Patton Township
Boro State College
(A) (E) (F) (G) (H) (I) (J)
TOTAL ANSWERING 603 89 151 67 55 102 133Still Relevant 83.1% 74.2% 81.5% 82.1% 80.0% 87.3% 89.5%
E ENo Longer Relevant 7.5% 10.1% 6.0% 7.5% 14.5% 7.8% 4.5%
JDon’t Know/Not Sure 7.8% 12.4% 9.3% 10.4% 5.5% 4.9% 4.5%
JComparison Groups: ABCD/EFGHIJ/KLMNOP/QRSTUV/WXYZA2B2/EKQW/FLRX/GMSY/HNTZ/IOUA2/JPVB2Independent T-Test for Means (equal variances), Independent Z-Test for PercentagesUpper case letters indicate significance at the 95% level.
3. Please select which best corresponds to your current opinion regarding the following goal.Coordinate land development activity with necessary public facilities and services in a cost-effective manner.Random sample weighted by relative municipality population
Total Total Total Total Total Total
TOTAL College Township
Ferguson Township
Halfmoon Township
Harris Township
Patton Township
Boro State College
(A) (E) (F) (G) (H) (I) (J)
TOTAL ANSWERING 603 89 151 67 55 102 133Still Relevant 80.9% 74.2% 82.1% 76.1% 87.3% 78.4% 85.7%
E ENo Longer Relevant 7.6% 9.0% 6.6% 10.4% 9.1% 9.8% 4.5%
Don’t Know/Not Sure 9.3% 12.4% 7.9% 13.4% 3.6% 9.8% 8.3%H H
Comparison Groups: ABCD/EFGHIJ/KLMNOP/QRSTUV/WXYZA2B2/EKQW/FLRX/GMSY/HNTZ/IOUA2/JPVB2Independent T-Test for Means (equal variances), Independent Z-Test for PercentagesUpper case letters indicate significance at the 95% level.
3. Please select which best corresponds to your current opinion regarding the following goal.Obtain additional parkland and open-space areas, and provide a broad range of recreational opportunities.Random sample weighted by relative municipality population
Total Total Total Total Total Total
TOTAL College Township
Ferguson Township
Halfmoon Township
Harris Township
Patton Township
Boro State College
(A) (E) (F) (G) (H) (I) (J)
TOTAL ANSWERING 603 89 151 67 55 102 133Still Relevant 69.0% 58.4% 66.9% 73.1% 69.1% 74.5% 72.2%
E ENo Longer Relevant 19.9% 27.0% 19.2% 17.9% 23.6% 14.7% 19.5%
IDon’t Know/Not Sure 9.5% 10.1% 11.3% 9.0% 7.3% 9.8% 7.5%Comparison Groups: ABCD/EFGHIJ/KLMNOP/QRSTUV/WXYZA2B2/EKQW/FLRX/GMSY/HNTZ/IOUA2/JPVB2Independent T-Test for Means (equal variances), Independent Z-Test for PercentagesUpper case letters indicate significance at the 95% level.
3. Please select which best corresponds to your current opinion regarding the following goal. Coordinate land development activity with the transportation system for the safe, efficient, and convenient movement of people and goods.
Page 9

2011 Centre Region Community Survey Results - Total Results
Random sample weighted by relative municipality population
Total Total Total Total Total Total
TOTAL College Township
Ferguson Township
Halfmoon Township
Harris Township
Patton Township
Boro State College
(A) (E) (F) (G) (H) (I) (J)
TOTAL ANSWERING 603 89 151 67 55 102 133Still Relevant 71.3% 62.9% 69.5% 65.7% 65.5% 76.5% 79.7%
E EFGNo Longer Relevant 17.6% 16.9% 18.5% 23.9% 25.5% 13.7% 14.3%Don’t Know/Not Sure 9.5% 15.7% 9.3% 10.4% 9.1% 9.8% 4.5%
JComparison Groups: ABCD/EFGHIJ/KLMNOP/QRSTUV/WXYZA2B2/EKQW/FLRX/GMSY/HNTZ/IOUA2/JPVB2Independent T-Test for Means (equal variances), Independent Z-Test for PercentagesUpper case letters indicate significance at the 95% level.
3. Please select which best corresponds to your current opinion regarding the following goal.
Random sample weighted by relative municipality population
Total Total Total Total Total Total
TOTAL College Township
Ferguson Township
Halfmoon Township
Harris Township
Patton Township
Boro State College
(A) (E) (F) (G) (H) (I) (J)
TOTAL ANSWERING 603 89 151 67 55 102 133Still Relevant 85.4% 78.7% 83.4% 82.1% 85.5% 90.2% 89.5%
E ENo Longer Relevant 7.3% 10.1% 7.9% 10.4% 5.5% 6.9% 4.5%Don’t Know/Not Sure 5.6% 7.9% 6.0% 6.0% 7.3% 2.9% 5.3%Comparison Groups: ABCD/EFGHIJ/KLMNOP/QRSTUV/WXYZA2B2/EKQW/FLRX/GMSY/HNTZ/IOUA2/JPVB2Independent T-Test for Means (equal variances), Independent Z-Test for PercentagesUpper case letters indicate significance at the 95% level.
3. Please select which best corresponds to your current opinion regarding the following goal. Provide a variety of housing opportunities to satisfy the needs of all existing and future residents of the Centre Region.
Maintain a cooperative relationship between the Centre Region municipalities and Penn State University to ensure that future growth at the University benefits the community.
Page 10
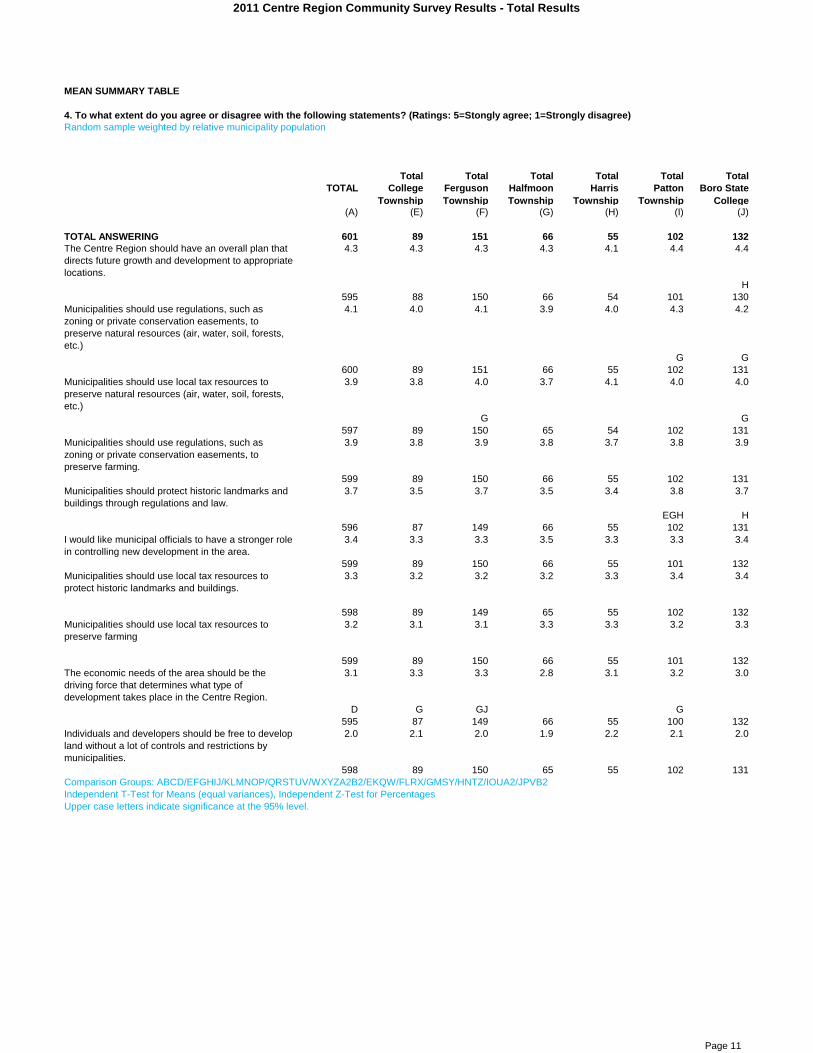
2011 Centre Region Community Survey Results - Total Results
MEAN SUMMARY TABLE
Random sample weighted by relative municipality population
Total Total Total Total Total Total
TOTAL College Township
Ferguson Township
Halfmoon Township
Harris Township
Patton Township
Boro State College
(A) (E) (F) (G) (H) (I) (J)
TOTAL ANSWERING 601 89 151 66 55 102 132The Centre Region should have an overall plan that directs future growth and development to appropriate locations.
4.3 4.3 4.3 4.3 4.1 4.4 4.4
H595 88 150 66 54 101 130
Municipalities should use regulations, such as zoning or private conservation easements, to preserve natural resources (air, water, soil, forests, etc.)
4.1 4.0 4.1 3.9 4.0 4.3 4.2
G G600 89 151 66 55 102 131
Municipalities should use local tax resources to preserve natural resources (air, water, soil, forests, etc.)
3.9 3.8 4.0 3.7 4.1 4.0 4.0
G G597 89 150 65 54 102 131
Municipalities should use regulations, such as zoning or private conservation easements, to preserve farming.
3.9 3.8 3.9 3.8 3.7 3.8 3.9
599 89 150 66 55 102 131Municipalities should protect historic landmarks and buildings through regulations and law.
3.7 3.5 3.7 3.5 3.4 3.8 3.7
EGH H596 87 149 66 55 102 131
I would like municipal officials to have a stronger role in controlling new development in the area.
3.4 3.3 3.3 3.5 3.3 3.3 3.4
599 89 150 66 55 101 132Municipalities should use local tax resources to protect historic landmarks and buildings.
3.3 3.2 3.2 3.2 3.3 3.4 3.4
598 89 149 65 55 102 132Municipalities should use local tax resources to preserve farming
3.2 3.1 3.1 3.3 3.3 3.2 3.3
599 89 150 66 55 101 132The economic needs of the area should be the driving force that determines what type of development takes place in the Centre Region.
3.1 3.3 3.3 2.8 3.1 3.2 3.0
D G GJ G595 87 149 66 55 100 132
Individuals and developers should be free to develop land without a lot of controls and restrictions by municipalities.
2.0 2.1 2.0 1.9 2.2 2.1 2.0
598 89 150 65 55 102 131Comparison Groups: ABCD/EFGHIJ/KLMNOP/QRSTUV/WXYZA2B2/EKQW/FLRX/GMSY/HNTZ/IOUA2/JPVB2Independent T-Test for Means (equal variances), Independent Z-Test for PercentagesUpper case letters indicate significance at the 95% level.
4. To what extent do you agree or disagree with the following statements? (Ratings: 5=Stongly agree; 1=Strongly disagree)
Page 11
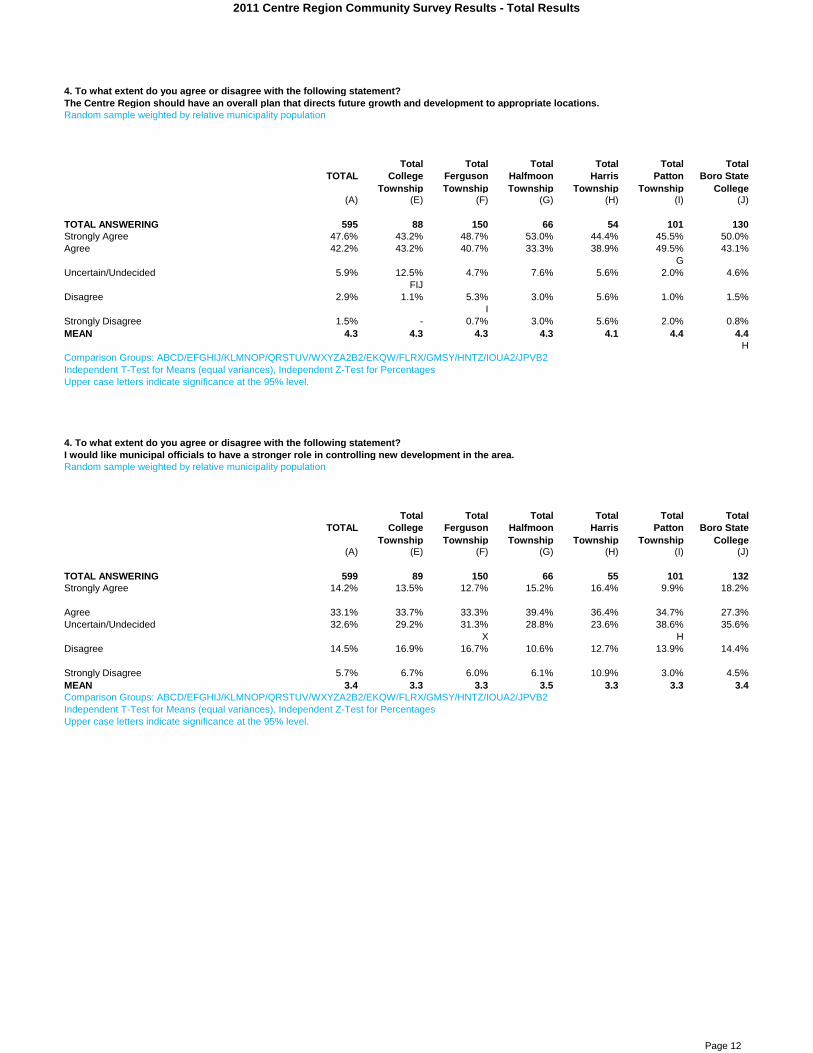
2011 Centre Region Community Survey Results - Total Results
4. To what extent do you agree or disagree with the following statement?The Centre Region should have an overall plan that directs future growth and development to appropriate locations.Random sample weighted by relative municipality population
Total Total Total Total Total Total
TOTAL College Township
Ferguson Township
Halfmoon Township
Harris Township
Patton Township
Boro State College
(A) (E) (F) (G) (H) (I) (J)
TOTAL ANSWERING 595 88 150 66 54 101 130Strongly Agree 47.6% 43.2% 48.7% 53.0% 44.4% 45.5% 50.0%Agree 42.2% 43.2% 40.7% 33.3% 38.9% 49.5% 43.1%
GUncertain/Undecided 5.9% 12.5% 4.7% 7.6% 5.6% 2.0% 4.6%
FIJDisagree 2.9% 1.1% 5.3% 3.0% 5.6% 1.0% 1.5%
IStrongly Disagree 1.5% - 0.7% 3.0% 5.6% 2.0% 0.8%MEAN 4.3 4.3 4.3 4.3 4.1 4.4 4.4
HComparison Groups: ABCD/EFGHIJ/KLMNOP/QRSTUV/WXYZA2B2/EKQW/FLRX/GMSY/HNTZ/IOUA2/JPVB2Independent T-Test for Means (equal variances), Independent Z-Test for PercentagesUpper case letters indicate significance at the 95% level.
4. To what extent do you agree or disagree with the following statement?I would like municipal officials to have a stronger role in controlling new development in the area.Random sample weighted by relative municipality population
Total Total Total Total Total Total
TOTAL College Township
Ferguson Township
Halfmoon Township
Harris Township
Patton Township
Boro State College
(A) (E) (F) (G) (H) (I) (J)
TOTAL ANSWERING 599 89 150 66 55 101 132Strongly Agree 14.2% 13.5% 12.7% 15.2% 16.4% 9.9% 18.2%
Agree 33.1% 33.7% 33.3% 39.4% 36.4% 34.7% 27.3%Uncertain/Undecided 32.6% 29.2% 31.3% 28.8% 23.6% 38.6% 35.6%
X HDisagree 14.5% 16.9% 16.7% 10.6% 12.7% 13.9% 14.4%
Strongly Disagree 5.7% 6.7% 6.0% 6.1% 10.9% 3.0% 4.5%MEAN 3.4 3.3 3.3 3.5 3.3 3.3 3.4Comparison Groups: ABCD/EFGHIJ/KLMNOP/QRSTUV/WXYZA2B2/EKQW/FLRX/GMSY/HNTZ/IOUA2/JPVB2Independent T-Test for Means (equal variances), Independent Z-Test for PercentagesUpper case letters indicate significance at the 95% level.
Page 12

2011 Centre Region Community Survey Results - Total Results
Random sample weighted by relative municipality population
Total Total Total Total Total Total
TOTAL College Township
Ferguson Township
Halfmoon Township
Harris Township
Patton Township
Boro State College
(A) (E) (F) (G) (H) (I) (J)
TOTAL ANSWERING 598 89 150 65 55 102 131Strongly Agree 4.3% 2.2% 4.7% 3.1% 12.7% - 5.3%
EAgree 10.4% 14.6% 10.0% 7.7% 9.1% 11.8% 9.2%Uncertain/Undecided 8.7% 9.0% 10.7% 3.1% 3.6% 14.7% 6.9%
GH GHDisagree 39.0% 40.4% 34.0% 44.6% 36.4% 45.1% 36.6%
XStrongly Disagree 37.6% 33.7% 40.7% 41.5% 38.2% 28.4% 42.0%
I IMEAN 2.0 2.1 2.0 1.9 2.2 2.1 2.0Comparison Groups: ABCD/EFGHIJ/KLMNOP/QRSTUV/WXYZA2B2/EKQW/FLRX/GMSY/HNTZ/IOUA2/JPVB2Independent T-Test for Means (equal variances), Independent Z-Test for PercentagesUpper case letters indicate significance at the 95% level.
Random sample weighted by relative municipality population
Total Total Total Total Total Total
TOTAL College Township
Ferguson Township
Halfmoon Township
Harris Township
Patton Township
Boro State College
(A) (E) (F) (G) (H) (I) (J)
TOTAL ANSWERING 595 87 149 66 55 100 132Strongly Agree 11.8% 16.1% 15.4% 9.1% 7.3% 12.0% 7.6%
XJAgree 33.1% 33.3% 35.6% 21.2% 36.4% 38.0% 31.1%
G GUncertain/Undecided 21.2% 21.8% 20.8% 18.2% 25.5% 18.0% 23.5%Disagree 25.9% 18.4% 22.1% 45.5% 18.2% 26.0% 28.8%
MSEFHIJStrongly Disagree 8.1% 10.3% 6.0% 6.1% 12.7% 6.0% 9.1%MEAN 3.1 3.3 3.3 2.8 3.1 3.2 3.0
D G GJ GComparison Groups: ABCD/EFGHIJ/KLMNOP/QRSTUV/WXYZA2B2/EKQW/FLRX/GMSY/HNTZ/IOUA2/JPVB2Independent T-Test for Means (equal variances), Independent Z-Test for PercentagesUpper case letters indicate significance at the 95% level.
4. To what extent do you agree or disagree with the following statement? Individuals and developers should be free to develop land without a lot of controls and restrictions by municipalities.
4. To what extent do you agree or disagree with the following statement? The economic needs of the area should be the driving force that determines what type of development takes place in the Centre Region.
Page 13

2011 Centre Region Community Survey Results - Total Results
Random sample weighted by relative municipality population
Total Total Total Total Total Total
TOTAL College Township
Ferguson Township
Halfmoon Township
Harris Township
Patton Township
Boro State College
(A) (E) (F) (G) (H) (I) (J)
TOTAL ANSWERING 598 89 149 65 55 102 132Strongly Agree 9.5% 4.5% 8.7% 7.7% 14.5% 9.8% 12.1%
EAgree 39.3% 41.6% 36.9% 36.9% 38.2% 43.1% 38.6%
MS B2Uncertain/Undecided 28.1% 31.5% 29.5% 32.3% 21.8% 27.5% 26.5%Disagree 18.1% 16.9% 19.5% 16.9% 16.4% 16.7% 18.9%
Strongly Disagree 5.0% 5.6% 5.4% 6.2% 9.1% 2.9% 3.8%
MEAN 3.3 3.2 3.2 3.2 3.3 3.4 3.4
Comparison Groups: ABCD/EFGHIJ/KLMNOP/QRSTUV/WXYZA2B2/EKQW/FLRX/GMSY/HNTZ/IOUA2/JPVB2Independent T-Test for Means (equal variances), Independent Z-Test for PercentagesUpper case letters indicate significance at the 95% level.
Random sample weighted by relative municipality population
Total Total Total Total Total Total
TOTAL College Township
Ferguson Township
Halfmoon Township
Harris Township
Patton Township
Boro State College
(A) (E) (F) (G) (H) (I) (J)
TOTAL ANSWERING 596 87 149 66 55 102 131Strongly Agree 12.6% 8.0% 12.8% 7.6% 12.7% 16.7% 14.5%
Agree 55.7% 54.0% 57.0% 53.0% 41.8% 61.8% 58.0%MS A2H H
Uncertain/Undecided 18.6% 25.3% 17.4% 27.3% 25.5% 9.8% 15.3%I I I
Disagree 10.6% 8.0% 11.4% 9.1% 14.5% 9.8% 10.7%
Strongly Disagree 2.5% 4.6% 1.3% 3.0% 5.5% 2.0% 1.5%MEAN 3.7 3.5 3.7 3.5 3.4 3.8 3.7
EGH HComparison Groups: ABCD/EFGHIJ/KLMNOP/QRSTUV/WXYZA2B2/EKQW/FLRX/GMSY/HNTZ/IOUA2/JPVB2Independent T-Test for Means (equal variances), Independent Z-Test for PercentagesUpper case letters indicate significance at the 95% level.
4. To what extent do you agree or disagree with the following statement? Municipalities should use local tax resources to protect historic landmarks and buildings.
4. To what extent do you agree or disagree with the following statement? Municipalities should protect historic landmarks and buildings through regulations and law.
Page 14

2011 Centre Region Community Survey Results - Total Results
4. To what extent do you agree or disagree with the following statement?Municipalities should use local tax resources to preserve natural resources (air, water, soil, forests, etc.)Random sample weighted by relative municipality population
Total Total Total Total Total Total
TOTAL College Township
Ferguson Township
Halfmoon Township
Harris Township
Patton Township
Boro State College
(A) (E) (F) (G) (H) (I) (J)
TOTAL ANSWERING 597 89 150 65 54 102 131Strongly Agree 30.7% 24.7% 27.3% 26.2% 38.9% 34.3% 34.4%Agree 45.6% 46.1% 51.3% 41.5% 42.6% 41.2% 44.3%Uncertain/Undecided 14.2% 16.9% 16.7% 13.8% 9.3% 16.7% 10.7%Disagree 6.4% 7.9% 3.3% 10.8% 5.6% 4.9% 8.4%Strongly Disagree 3.2% 4.5% 1.3% 7.7% 3.7% 2.9% 2.3%MEAN 3.9 3.8 4.0 3.7 4.1 4.0 4.0
G GComparison Groups: ABCD/EFGHIJ/KLMNOP/QRSTUV/WXYZA2B2/EKQW/FLRX/GMSY/HNTZ/IOUA2/JPVB2Independent T-Test for Means (equal variances), Independent Z-Test for PercentagesUpper case letters indicate significance at the 95% level.
Random sample weighted by relative municipality population
Total Total Total Total Total Total
TOTAL College Township
Ferguson Township
Halfmoon Township
Harris Township
Patton Township
Boro State College
(A) (E) (F) (G) (H) (I) (J)
TOTAL ANSWERING 600 89 151 66 55 102 131Strongly Agree 37.0% 28.1% 33.1% 31.8% 38.2% 46.1% 42.7%
EF EAgree 48.0% 51.7% 53.0% 48.5% 40.0% 42.2% 46.6%
DUncertain/Undecided 8.0% 14.6% 8.6% 7.6% 9.1% 5.9% 4.6%
IJDisagree 4.2% 3.4% 4.6% 6.1% 7.3% 2.9% 3.1%Strongly Disagree 2.8% 2.2% 0.7% 6.1% 5.5% 2.9% 3.1%MEAN 4.1 4.0 4.1 3.9 4.0 4.3 4.2
G GComparison Groups: ABCD/EFGHIJ/KLMNOP/QRSTUV/WXYZA2B2/EKQW/FLRX/GMSY/HNTZ/IOUA2/JPVB2Independent T-Test for Means (equal variances), Independent Z-Test for PercentagesUpper case letters indicate significance at the 95% level.
4. To what extent do you agree or disagree with the following statement? Municipalities should use regulations, such as zoning or private conservation easements, to preserve natural resources (air, water, soil, forests, etc.)
Page 15

2011 Centre Region Community Survey Results - Total Results
4. To what extent do you agree or disagree with the following statement?Municipalities should use local tax resources to preserve farmingRandom sample weighted by relative municipality population
Total Total Total Total Total Total
TOTAL College Township
Ferguson Township
Halfmoon Township
Harris Township
Patton Township
Boro State College
(A) (E) (F) (G) (H) (I) (J)
TOTAL ANSWERING 599 89 150 66 55 101 132Strongly Agree 14.7% 14.6% 12.7% 12.1% 21.8% 10.9% 16.7%Agree 26.9% 21.3% 24.0% 36.4% 27.3% 31.7% 25.8%
EUncertain/Undecided 28.5% 31.5% 28.0% 27.3% 20.0% 27.7% 33.3%
HDisagree 23.7% 24.7% 29.3% 16.7% 20.0% 22.8% 22.0%
GStrongly Disagree 6.2% 7.9% 6.0% 7.6% 10.9% 6.9% 2.3%
JMEAN 3.2 3.1 3.1 3.3 3.3 3.2 3.3
Comparison Groups: ABCD/EFGHIJ/KLMNOP/QRSTUV/WXYZA2B2/EKQW/FLRX/GMSY/HNTZ/IOUA2/JPVB2Independent T-Test for Means (equal variances), Independent Z-Test for PercentagesUpper case letters indicate significance at the 95% level.
4. To what extent do you agree or disagree with the following statement?Municipalities should use regulations, such as zoning or private conservation easements, to preserve farming.Random sample weighted by relative municipality population
Total Total Total Total Total Total
TOTAL College Township
Ferguson Township
Halfmoon Township
Harris Township
Patton Township
Boro State College
(A) (E) (F) (G) (H) (I) (J)
TOTAL ANSWERING 599 89 150 66 55 102 131Strongly Agree 26.4% 18.0% 27.3% 25.8% 29.1% 27.5% 28.2%
Agree 46.6% 52.8% 49.3% 50.0% 40.0% 43.1% 42.7%A2
Uncertain/Undecided 16.4% 20.2% 11.3% 13.6% 14.5% 17.6% 21.4%F
Disagree 7.8% 9.0% 9.3% 4.5% 9.1% 7.8% 6.9%Strongly Disagree 2.8% - 2.7% 6.1% 7.3% 3.9% 0.8%MEAN 3.9 3.8 3.9 3.8 3.7 3.8 3.9Comparison Groups: ABCD/EFGHIJ/KLMNOP/QRSTUV/WXYZA2B2/EKQW/FLRX/GMSY/HNTZ/IOUA2/JPVB2Independent T-Test for Means (equal variances), Independent Z-Test for PercentagesUpper case letters indicate significance at the 95% level.
Page 16

2011 Centre Region Community Survey Results - Total Results
Random sample weighted by relative municipality population
Total Total Total Total Total Total
TOTAL College Township
Ferguson Township
Halfmoon Township
Harris Township
Patton Township
Boro State College
(A) (E) (F) (G) (H) (I) (J)
TOTAL ANSWERING 600 89 151 67 55 101 131Preservation of natural resources (air, water, soil, forests, etc.)
55.7% 49.4% 52.3% 64.2% 63.6% 66.3% 47.3%
J J EFJPreservation of farming 13.8% 14.6% 17.9% 25.4% 9.1% 6.9% 9.9%
I HIJPreservation of established neighborhoods. 12.2% 12.4% 14.6% 4.5% 7.3% 9.9% 16.8%
G GHRedevelopment of older shopping centers. 10.5% 18.0% 7.9% 1.5% 10.9% 8.9% 14.5%
FG G G G GDiversify businesses in downtown State College. 7.8% 5.6% 7.3% 4.5% 9.1% 7.9% 11.5%Comparison Groups: ABCD/EFGHIJ/KLMNOP/QRSTUV/WXYZA2B2/EKQW/FLRX/GMSY/HNTZ/IOUA2/JPVB2Independent T-Test for Means (equal variances), Independent Z-Test for PercentagesUpper case letters indicate significance at the 95% level.
5. Of the remaining factors, what do you think is the next (second) most important land use issue?Random sample weighted by relative municipality population
Total Total Total Total Total Total
TOTAL College Township
Ferguson Township
Halfmoon Township
Harris Township
Patton Township
Boro State College
(A) (E) (F) (G) (H) (I) (J)
TOTAL ANSWERING 596 89 150 67 54 99 131Preservation of farming 30.0% 23.6% 28.7% 41.8% 38.9% 36.4% 21.4%
EJ J JPreservation of established neighborhoods. 27.5% 28.1% 26.7% 17.9% 29.6% 26.3% 33.6%
D GPreservation of natural resources (air, water, soil, forests, etc.)
17.8% 18.0% 20.7% 22.4% 9.3% 14.1% 18.3%
H HRedevelopment of older shopping centers. 14.9% 13.5% 16.7% 11.9% 14.8% 16.2% 14.5%Diversify businesses in downtown State College. 9.7% 16.9% 7.3% 6.0% 7.4% 7.1% 12.2%
FGIComparison Groups: ABCD/EFGHIJ/KLMNOP/QRSTUV/WXYZA2B2/EKQW/FLRX/GMSY/HNTZ/IOUA2/JPVB2Independent T-Test for Means (equal variances), Independent Z-Test for PercentagesUpper case letters indicate significance at the 95% level.
5. Please place the following land use issues in the Centre Region in priority order. First, what is the MOST important priority?
Page 17

2011 Centre Region Community Survey Results - Total Results
5. What is the next (third) most important land use issue?Random sample weighted by relative municipality population
Total Total Total Total Total Total
TOTAL College Township
Ferguson Township
Halfmoon Township
Harris Township
Patton Township
Boro State College
(A) (E) (F) (G) (H) (I) (J)
TOTAL ANSWERING 591 88 149 67 53 99 130Preservation of established neighborhoods. 26.6% 31.8% 22.1% 41.8% 30.2% 26.3% 20.0%
FIJ A2Redevelopment of older shopping centers. 23.9% 27.3% 22.8% 22.4% 24.5% 28.3% 17.7%
Preservation of farming 21.7% 17.0% 24.8% 16.4% 24.5% 21.2% 23.8%Diversify businesses in downtown State College. 14.4% 11.4% 13.4% 9.0% 5.7% 16.2% 23.1%
H EFGHPreservation of natural resources (air, water, soil, forests, etc.)
13.5% 12.5% 16.8% 10.4% 15.1% 8.1% 15.4%
IComparison Groups: ABCD/EFGHIJ/KLMNOP/QRSTUV/WXYZA2B2/EKQW/FLRX/GMSY/HNTZ/IOUA2/JPVB2Independent T-Test for Means (equal variances), Independent Z-Test for PercentagesUpper case letters indicate significance at the 95% level.
5. And, what is the next (fourth) most important land use issue?Random sample weighted by relative municipality population
Total Total Total Total Total Total
TOTAL College Township
Ferguson Township
Halfmoon Township
Harris Township
Patton Township
Boro State College
(A) (E) (F) (G) (H) (I) (J)
TOTAL ANSWERING 589 88 147 67 53 99 130Redevelopment of older shopping centers. 25.8% 23.9% 28.6% 44.8% 26.4% 19.2% 20.0%
EFHIJDiversify businesses in downtown State College. 24.3% 21.6% 21.8% 25.4% 26.4% 27.3% 26.2%Preservation of established neighborhoods. 23.3% 20.5% 26.5% 23.9% 24.5% 28.3% 16.2%
J JPreservation of farming 18.5% 22.7% 14.3% 6.0% 13.2% 17.2% 28.5%
G G G FGHIPreservation of natural resources (air, water, soil, forests, etc.)
8.1% 11.4% 8.8% - 9.4% 8.1% 9.2%
Comparison Groups: ABCD/EFGHIJ/KLMNOP/QRSTUV/WXYZA2B2/EKQW/FLRX/GMSY/HNTZ/IOUA2/JPVB2Independent T-Test for Means (equal variances), Independent Z-Test for PercentagesUpper case letters indicate significance at the 95% level.
Page 18

2011 Centre Region Community Survey Results - Total Results
5. LEAST important land use issue:Random sample weighted by relative municipality population
Total Total Total Total Total Total
TOTAL College Township
Ferguson Township
Halfmoon Township
Harris Township
Patton Township
Boro State College
(A) (E) (F) (G) (H) (I) (J)
TOTAL ANSWERING 589 88 147 67 53 99 130Diversify businesses in downtown State College. 43.8% 44.3% 49.7% 55.2% 50.9% 43.4% 26.9%
J J J J JRedevelopment of older shopping centers. 24.6% 17.0% 23.8% 19.4% 22.6% 27.3% 33.1%
X EGPreservation of farming 16.6% 22.7% 15.0% 10.4% 17.0% 18.2% 16.9%
GPreservation of established neighborhoods. 10.4% 6.8% 10.2% 11.9% 7.5% 9.1% 13.8%Preservation of natural resources (air, water, soil, forests, etc.)
4.6% 9.1% 1.4% 3.0% 1.9% 2.0% 9.2%
FHI FHIComparison Groups: ABCD/EFGHIJ/KLMNOP/QRSTUV/WXYZA2B2/EKQW/FLRX/GMSY/HNTZ/IOUA2/JPVB2Independent T-Test for Means (equal variances), Independent Z-Test for PercentagesUpper case letters indicate significance at the 95% level.
Page 19

2011 Centre Region Community Survey Results - Total Results
6. Do you feel the Centre Region needs more of the following types of land uses (Check all that apply)? Percent "Yes"Random sample weighted by relative municipality population
Total Total Total Total Total Total
TOTAL College Township
Ferguson Township
Halfmoon Township
Harris Township
Patton Township
Boro State College
(A) (E) (F) (G) (H) (I) (J)
TOTAL ANSWERING 611 89 154 67 55 102 133Mixed use areas (i.e. residential, commercial, office) 29.6% 25.8% 33.8% 25.4% 29.1% 31.4% 30.1%
Neighborhood based convenience uses (dry cleaner, tax service, barber shop, drug store)
26.0% 24.7% 29.2% 20.9% 21.8% 23.5% 30.1%
Specialty stores and boutiques 22.3% 27.0% 20.1% 13.4% 21.8% 18.6% 30.8%G FGI
Industrial areas 18.0% 22.5% 17.5% 22.4% 18.2% 18.6% 14.3%
Regional shopping mall 17.3% 18.0% 21.4% 10.4% 18.2% 20.6% 14.3%G
Grocery store or shopping center 12.8% 18.0% 13.6% 9.0% 16.4% 5.9% 15.0%I I I
No additional commercial uses needed 35.4% 34.8% 34.4% 49.3% 45.5% 33.3% 27.1%FIJ J B2
Other please specify 7.5% 9.0% 5.2% 6.0% 7.3% 7.8% 9.8%
Comparison Groups: ABCD/EFGHIJ/KLMNOP/QRSTUV/WXYZA2B2/EKQW/FLRX/GMSY/HNTZ/IOUA2/JPVB2Independent T-Test for Means (equal variances), Independent Z-Test for PercentagesUpper case letters indicate significance at the 95% level.
Page 20

2011 Centre Region Community Survey Results - Total Results
7. Do you feel your neighborhood needs more of the following types of land uses (Check all that apply)? Percent "Yes"Random sample weighted by relative municipality population
Total Total Total Total Total Total
TOTAL College Township
Ferguson Township
Halfmoon Township
Harris Township
Patton Township
Boro State College
(A) (E) (F) (G) (H) (I) (J)
TOTAL ANSWERING 611 89 154 67 55 102 133Neighborhood based convenience uses (dry cleaner, tax service, barber shop, drug store)
20.1% 16.9% 19.5% 25.4% 20.0% 20.6% 21.8%
Mixed use areas (i.e. residential, commercial, office) 12.6% 9.0% 12.3% 10.4% 18.2% 8.8% 18.0%
EIGrocery store or shopping center 11.3% 9.0% 11.0% 17.9% 20.0% 4.9% 12.0%
I I ISpecialty stores and boutiques 10.5% 14.6% 7.8% 7.5% 10.9% 7.8% 14.3%Regional shopping mall 4.7% 7.9% 7.1% 1.5% 1.8% 4.9% 3.0%
G GIndustrial areas 2.5% 5.6% 1.3% 1.5% 1.8% 4.9% 0.8%No additional commercial uses needed 55.3% 55.1% 57.1% 53.7% 60.0% 61.8% 50.4%
MS B2Other please specify 8.2% 11.2% 5.2% 11.9% 7.3% 6.9% 9.8%
Comparison Groups: ABCD/EFGHIJ/KLMNOP/QRSTUV/WXYZA2B2/EKQW/FLRX/GMSY/HNTZ/IOUA2/JPVB2Independent T-Test for Means (equal variances), Independent Z-Test for PercentagesUpper case letters indicate significance at the 95% level.
Page 21
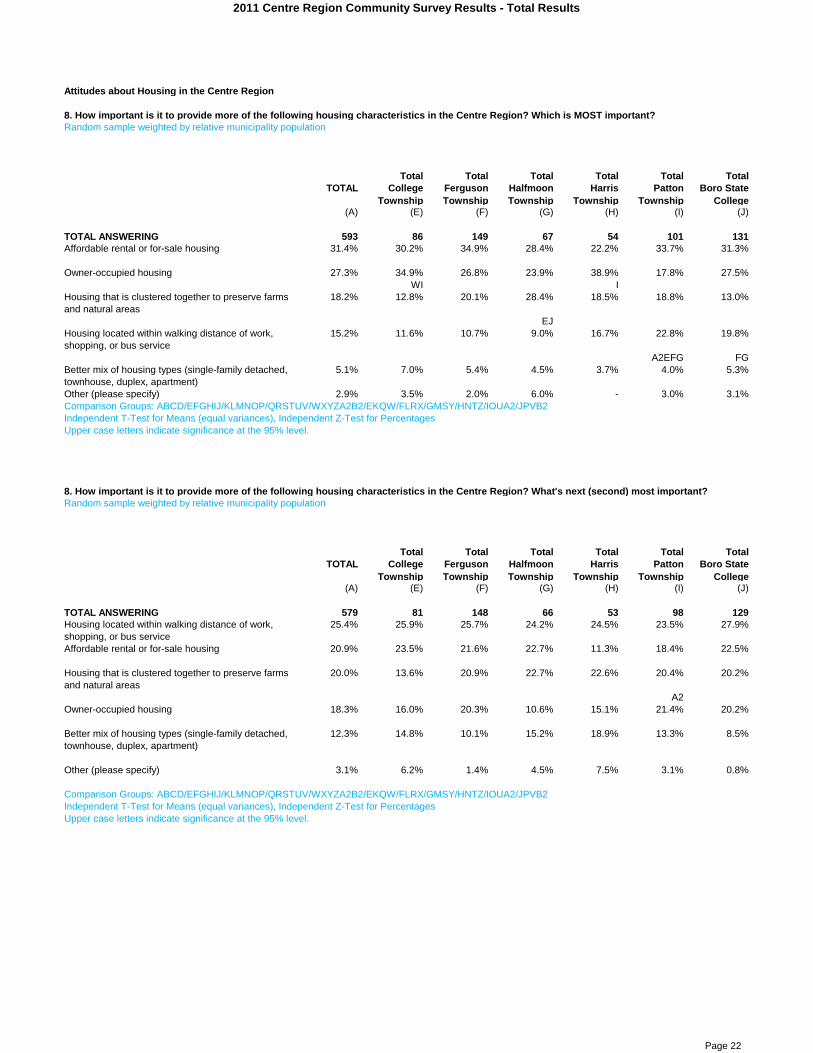
2011 Centre Region Community Survey Results - Total Results
Attitudes about Housing in the Centre Region
8. How important is it to provide more of the following housing characteristics in the Centre Region? Which is MOST important?Random sample weighted by relative municipality population
Total Total Total Total Total Total
TOTAL College Township
Ferguson Township
Halfmoon Township
Harris Township
Patton Township
Boro State College
(A) (E) (F) (G) (H) (I) (J)
TOTAL ANSWERING 593 86 149 67 54 101 131Affordable rental or for-sale housing 31.4% 30.2% 34.9% 28.4% 22.2% 33.7% 31.3%
Owner-occupied housing 27.3% 34.9% 26.8% 23.9% 38.9% 17.8% 27.5%WI I
Housing that is clustered together to preserve farms and natural areas
18.2% 12.8% 20.1% 28.4% 18.5% 18.8% 13.0%
EJHousing located within walking distance of work, shopping, or bus service
15.2% 11.6% 10.7% 9.0% 16.7% 22.8% 19.8%
A2EFG FGBetter mix of housing types (single-family detached, townhouse, duplex, apartment)
5.1% 7.0% 5.4% 4.5% 3.7% 4.0% 5.3%
Other (please specify) 2.9% 3.5% 2.0% 6.0% - 3.0% 3.1%Comparison Groups: ABCD/EFGHIJ/KLMNOP/QRSTUV/WXYZA2B2/EKQW/FLRX/GMSY/HNTZ/IOUA2/JPVB2Independent T-Test for Means (equal variances), Independent Z-Test for PercentagesUpper case letters indicate significance at the 95% level.
8. How important is it to provide more of the following housing characteristics in the Centre Region? What's next (second) most important?Random sample weighted by relative municipality population
Total Total Total Total Total Total
TOTAL College Township
Ferguson Township
Halfmoon Township
Harris Township
Patton Township
Boro State College
(A) (E) (F) (G) (H) (I) (J)
TOTAL ANSWERING 579 81 148 66 53 98 129Housing located within walking distance of work, shopping, or bus service
25.4% 25.9% 25.7% 24.2% 24.5% 23.5% 27.9%
Affordable rental or for-sale housing 20.9% 23.5% 21.6% 22.7% 11.3% 18.4% 22.5%
Housing that is clustered together to preserve farms and natural areas
20.0% 13.6% 20.9% 22.7% 22.6% 20.4% 20.2%
A2Owner-occupied housing 18.3% 16.0% 20.3% 10.6% 15.1% 21.4% 20.2%
Better mix of housing types (single-family detached, townhouse, duplex, apartment)
12.3% 14.8% 10.1% 15.2% 18.9% 13.3% 8.5%
Other (please specify) 3.1% 6.2% 1.4% 4.5% 7.5% 3.1% 0.8%
Comparison Groups: ABCD/EFGHIJ/KLMNOP/QRSTUV/WXYZA2B2/EKQW/FLRX/GMSY/HNTZ/IOUA2/JPVB2Independent T-Test for Means (equal variances), Independent Z-Test for PercentagesUpper case letters indicate significance at the 95% level.
Page 22
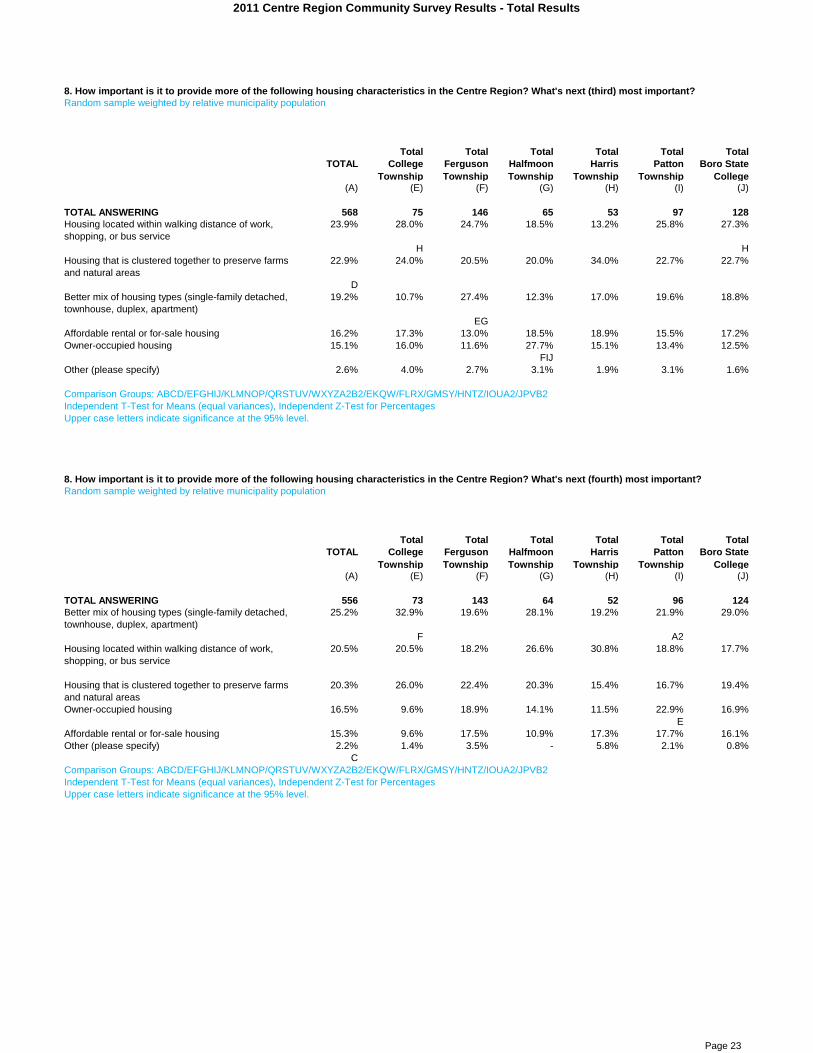
2011 Centre Region Community Survey Results - Total Results
8. How important is it to provide more of the following housing characteristics in the Centre Region? What's next (third) most important?Random sample weighted by relative municipality population
Total Total Total Total Total Total
TOTAL College Township
Ferguson Township
Halfmoon Township
Harris Township
Patton Township
Boro State College
(A) (E) (F) (G) (H) (I) (J)
TOTAL ANSWERING 568 75 146 65 53 97 128Housing located within walking distance of work, shopping, or bus service
23.9% 28.0% 24.7% 18.5% 13.2% 25.8% 27.3%
H HHousing that is clustered together to preserve farms and natural areas
22.9% 24.0% 20.5% 20.0% 34.0% 22.7% 22.7%
DBetter mix of housing types (single-family detached, townhouse, duplex, apartment)
19.2% 10.7% 27.4% 12.3% 17.0% 19.6% 18.8%
EGAffordable rental or for-sale housing 16.2% 17.3% 13.0% 18.5% 18.9% 15.5% 17.2%Owner-occupied housing 15.1% 16.0% 11.6% 27.7% 15.1% 13.4% 12.5%
FIJOther (please specify) 2.6% 4.0% 2.7% 3.1% 1.9% 3.1% 1.6%
Comparison Groups: ABCD/EFGHIJ/KLMNOP/QRSTUV/WXYZA2B2/EKQW/FLRX/GMSY/HNTZ/IOUA2/JPVB2Independent T-Test for Means (equal variances), Independent Z-Test for PercentagesUpper case letters indicate significance at the 95% level.
8. How important is it to provide more of the following housing characteristics in the Centre Region? What's next (fourth) most important?Random sample weighted by relative municipality population
Total Total Total Total Total Total
TOTAL College Township
Ferguson Township
Halfmoon Township
Harris Township
Patton Township
Boro State College
(A) (E) (F) (G) (H) (I) (J)
TOTAL ANSWERING 556 73 143 64 52 96 124Better mix of housing types (single-family detached, townhouse, duplex, apartment)
25.2% 32.9% 19.6% 28.1% 19.2% 21.9% 29.0%
F A2Housing located within walking distance of work, shopping, or bus service
20.5% 20.5% 18.2% 26.6% 30.8% 18.8% 17.7%
Housing that is clustered together to preserve farms and natural areas
20.3% 26.0% 22.4% 20.3% 15.4% 16.7% 19.4%
Owner-occupied housing 16.5% 9.6% 18.9% 14.1% 11.5% 22.9% 16.9%E
Affordable rental or for-sale housing 15.3% 9.6% 17.5% 10.9% 17.3% 17.7% 16.1%Other (please specify) 2.2% 1.4% 3.5% - 5.8% 2.1% 0.8%
CComparison Groups: ABCD/EFGHIJ/KLMNOP/QRSTUV/WXYZA2B2/EKQW/FLRX/GMSY/HNTZ/IOUA2/JPVB2Independent T-Test for Means (equal variances), Independent Z-Test for PercentagesUpper case letters indicate significance at the 95% level.
Page 23

2011 Centre Region Community Survey Results - Total Results
8. How important is it to provide more of the following housing characteristics in the Centre Region? What's next (fifth) most important?Random sample weighted by relative municipality population
Total Total Total Total Total Total
TOTAL College Township
Ferguson Township
Halfmoon Township
Harris Township
Patton Township
Boro State College
(A) (E) (F) (G) (H) (I) (J)
TOTAL ANSWERING 547 72 142 63 49 95 123Better mix of housing types (single-family detached, townhouse, duplex, apartment)
34.9% 31.9% 31.7% 38.1% 38.8% 37.9% 35.8%
B2Owner-occupied housing 19.9% 19.4% 20.4% 15.9% 16.3% 22.1% 22.0%Housing that is clustered together to preserve farms and natural areas
16.5% 20.8% 14.1% 6.3% 10.2% 21.1% 21.1%
G G GHousing located within walking distance of work, shopping, or bus service
13.2% 9.7% 19.7% 20.6% 12.2% 6.3% 7.3%
EIJ IJAffordable rental or for-sale housing 12.4% 15.3% 9.9% 14.3% 20.4% 10.5% 11.4%Other (please specify) 3.1% 2.8% 4.2% 4.8% 2.0% 2.1% 2.4%
BCComparison Groups: ABCD/EFGHIJ/KLMNOP/QRSTUV/WXYZA2B2/EKQW/FLRX/GMSY/HNTZ/IOUA2/JPVB2Independent T-Test for Means (equal variances), Independent Z-Test for PercentagesUpper case letters indicate significance at the 95% level.
Page 24

2011 Centre Region Community Survey Results - Total Results
9. How important is it to increase each of the following housing types in the Centre Region? First, which is MOST important?Random sample weighted by relative municipality population
Total Total Total Total Total Total
TOTAL College Township
Ferguson Township
Halfmoon Township
Harris Township
Patton Township
Boro State College
(A) (E) (F) (G) (H) (I) (J)
TOTAL ANSWERING 554 78 143 62 53 90 124Single-family detached homes 54.2% 55.1% 52.4% 56.5% 71.7% 57.8% 44.4%
EFJSenior housing (55+) 19.5% 21.8% 23.1% 24.2% 13.2% 17.8% 16.1%
Condiminiums or townhouses 8.7% 6.4% 8.4% 8.1% 7.5% 10.0% 9.7%Apartment buildings/complexes 7.8% 9.0% 7.0% 3.2% 3.8% 4.4% 13.7%
GHIApartments in single-family homes 5.2% 2.6% 4.2% 1.6% - 5.6% 12.1%
EFGDuplexes 3.1% 3.8% 2.8% 3.2% 1.9% 2.2% 4.0%Mobile homes 1.6% 1.3% 2.1% 3.2% 1.9% 2.2% -Comparison Groups: ABCD/EFGHIJ/KLMNOP/QRSTUV/WXYZA2B2/EKQW/FLRX/GMSY/HNTZ/IOUA2/JPVB2Independent T-Test for Means (equal variances), Independent Z-Test for PercentagesUpper case letters indicate significance at the 95% level.
Random sample weighted by relative municipality population
Total Total Total Total Total Total
TOTAL College Township
Ferguson Township
Halfmoon Township
Harris Township
Patton Township
Boro State College
(A) (E) (F) (G) (H) (I) (J)
TOTAL ANSWERING 540 70 142 61 52 87 124Condiminiums or townhouses 26.9% 32.9% 26.1% 19.7% 30.8% 28.7% 25.0%
MS Z B2Senior housing (55+) 20.0% 20.0% 20.4% 24.6% 17.3% 24.1% 15.3%Single-family detached homes 15.6% 11.4% 17.6% 16.4% 7.7% 16.1% 18.5%
H HDuplexes 13.7% 11.4% 12.0% 18.0% 13.5% 9.2% 18.5%
IApartments in single-family homes 12.0% 11.4% 14.1% 11.5% 19.2% 9.2% 9.7%Apartment buildings/complexes 9.4% 7.1% 8.5% 6.6% 9.6% 10.3% 11.3%Mobile homes 2.4% 5.7% 1.4% 3.3% 1.9% 2.3% 1.6%Comparison Groups: ABCD/EFGHIJ/KLMNOP/QRSTUV/WXYZA2B2/EKQW/FLRX/GMSY/HNTZ/IOUA2/JPVB2Independent T-Test for Means (equal variances), Independent Z-Test for PercentagesUpper case letters indicate significance at the 95% level.
9. How important is it to increase each of the following housing types in the Centre Region? Of those remaining, which would you say is the second most important?
Page 25

2011 Centre Region Community Survey Results - Total Results
Random sample weighted by relative municipality population
Total Total Total Total Total Total
TOTAL College Township
Ferguson Township
Halfmoon Township
Harris Township
Patton Township
Boro State College
(A) (E) (F) (G) (H) (I) (J)
TOTAL ANSWERING 528 67 142 61 50 84 120Condiminiums or townhouses 25.4% 31.3% 21.8% 31.1% 24.0% 23.8% 25.8%Duplexes 24.8% 25.4% 26.8% 19.7% 16.0% 25.0% 29.2%
MS HSenior housing (55+) 15.5% 10.4% 16.2% 14.8% 22.0% 19.0% 11.7%Apartments in single-family homes 12.9% 11.9% 11.3% 13.1% 20.0% 8.3% 15.0%
Apartment buildings/complexes 10.4% 10.4% 8.5% 9.8% 12.0% 13.1% 10.8%Single-family detached homes 8.3% 7.5% 12.0% 6.6% 4.0% 9.5% 5.8%
HMobile homes 2.7% 3.0% 3.5% 4.9% 2.0% 1.2% 1.7%Comparison Groups: ABCD/EFGHIJ/KLMNOP/QRSTUV/WXYZA2B2/EKQW/FLRX/GMSY/HNTZ/IOUA2/JPVB2Independent T-Test for Means (equal variances), Independent Z-Test for PercentagesUpper case letters indicate significance at the 95% level.
Random sample weighted by relative municipality population
Total Total Total Total Total Total
TOTAL College Township
Ferguson Township
Halfmoon Township
Harris Township
Patton Township
Boro State College
(A) (E) (F) (G) (H) (I) (J)
TOTAL ANSWERING 522 64 141 61 50 84 118Duplexes 23.2% 28.1% 20.6% 24.6% 20.0% 25.0% 22.9%Condiminiums or townhouses 20.1% 12.5% 21.3% 18.0% 32.0% 22.6% 17.8%
EApartment buildings/complexes 19.2% 23.4% 24.1% 21.3% 16.0% 14.3% 15.3%
Apartments in single-family homes 16.5% 12.5% 19.1% 14.8% 16.0% 16.7% 15.3%X
Senior housing (55+) 8.6% 10.9% 7.8% 8.2% 6.0% 11.9% 7.6%Single-family detached homes 8.0% 7.8% 5.7% 6.6% 2.0% 7.1% 14.4%
FHMobile homes 4.4% 4.7% 1.4% 6.6% 8.0% 2.4% 6.8%
FComparison Groups: ABCD/EFGHIJ/KLMNOP/QRSTUV/WXYZA2B2/EKQW/FLRX/GMSY/HNTZ/IOUA2/JPVB2Independent T-Test for Means (equal variances), Independent Z-Test for PercentagesUpper case letters indicate significance at the 95% level.
9. How important is it to increase each of the following housing types in the Centre Region? Which would you say is the next (third) most important?
9. How important is it to increase each of the following housing types in the Centre Region? Which would you say is the next (fourth) most important?
Page 26

2011 Centre Region Community Survey Results - Total Results
Random sample weighted by relative municipality population
Total Total Total Total Total Total
TOTAL College Township
Ferguson Township
Halfmoon Township
Harris Township
Patton Township
Boro State College
(A) (E) (F) (G) (H) (I) (J)
TOTAL ANSWERING 512 62 140 61 48 80 118Apartment buildings/complexes 21.3% 11.3% 20.7% 27.9% 20.8% 30.0% 18.6%
E EApartments in single-family homes 19.3% 17.7% 16.4% 24.6% 16.7% 25.0% 18.6%
Duplexes 17.2% 14.5% 20.0% 11.5% 35.4% 16.3% 11.0%J EFGIJ
Mobile homes 14.5% 24.2% 14.3% 8.2% 10.4% 12.5% 16.1%GH
Senior housing (55+) 11.7% 14.5% 13.6% 9.8% 6.3% 3.8% 16.9%I I HI
Condiminiums or townhouses 10.0% 6.5% 11.4% 11.5% 4.2% 10.0% 10.2%Single-family detached homes 6.1% 11.3% 3.6% 6.6% 6.3% 2.5% 8.5%
IComparison Groups: ABCD/EFGHIJ/KLMNOP/QRSTUV/WXYZA2B2/EKQW/FLRX/GMSY/HNTZ/IOUA2/JPVB2Independent T-Test for Means (equal variances), Independent Z-Test for PercentagesUpper case letters indicate significance at the 95% level.
9. How important is it to increase each of the following housing types in the Centre Region? Which would you say is the next (fifth) most important?
Page 27

2011 Centre Region Community Survey Results - Total Results
Random sample weighted by relative municipality population
Total Total Total Total Total Total
TOTAL College Township
Ferguson Township
Halfmoon Township
Harris Township
Patton Township
Boro State College
(A) (E) (F) (G) (H) (I) (J)
TOTAL ANSWERING 602 87 154 67 55 102 132Yes 40.7% 44.8% 40.3% 41.8% 29.1% 37.3% 46.2%
HNo 54.7% 54.0% 55.2% 50.7% 65.5% 56.9% 50.0%
JDon't Know 4.7% 1.1% 4.5% 7.5% 5.5% 5.9% 3.8%
Comparison Groups: ABCD/EFGHIJ/KLMNOP/QRSTUV/WXYZA2B2/EKQW/FLRX/GMSY/HNTZ/IOUA2/JPVB2Independent T-Test for Means (equal variances), Independent Z-Test for PercentagesUpper case letters indicate significance at the 95% level.
10. Do you spend more than 30% of your household income on housing costs (Housing costs include principal, interest, insurance and taxes for homeowners; rent and utilities for renters)?
Page 28

2011 Centre Region Community Survey Results - Total Results
11. Do you feel there is enough rental housing available in your price range in the Centre Region?Random sample weighted by relative municipality population
Total Total Total Total Total Total
TOTAL College Township
Ferguson Township
Halfmoon Township
Harris Township
Patton Township
Boro State College
(A) (E) (F) (G) (H) (I) (J)
TOTAL ANSWERING 599 86 152 67 55 102 133Yes 29.4% 29.1% 27.6% 22.4% 36.4% 34.3% 28.6%
No 38.6% 38.4% 41.4% 31.3% 36.4% 35.3% 42.1%
Don't Know 32.1% 32.6% 30.9% 46.3% 27.3% 30.4% 29.3%FHIJ A2 B2
Comparison Groups: ABCD/EFGHIJ/KLMNOP/QRSTUV/WXYZA2B2/EKQW/FLRX/GMSY/HNTZ/IOUA2/JPVB2Independent T-Test for Means (equal variances), Independent Z-Test for PercentagesUpper case letters indicate significance at the 95% level.
Page 29

2011 Centre Region Community Survey Results - Total Results
12. Do you feel there are enough homes available for purchase in your price range in the Centre Region?Random sample weighted by relative municipality population
Total Total Total Total Total Total
TOTAL College Township
Ferguson Township
Halfmoon Township
Harris Township
Patton Township
Boro State College
(A) (E) (F) (G) (H) (I) (J)
TOTAL ANSWERING 598 86 153 66 55 102 132Yes 43.0% 39.5% 49.0% 47.0% 49.1% 42.2% 34.1%
JNo 42.0% 51.2% 39.2% 34.8% 40.0% 39.2% 45.5%
GDon't Know 15.1% 9.3% 11.8% 18.2% 10.9% 18.6% 20.5%
EFComparison Groups: ABCD/EFGHIJ/KLMNOP/QRSTUV/WXYZA2B2/EKQW/FLRX/GMSY/HNTZ/IOUA2/JPVB2Independent T-Test for Means (equal variances), Independent Z-Test for PercentagesUpper case letters indicate significance at the 95% level.
Page 30

2011 Centre Region Community Survey Results - Total Results
Attitudes about Community Services and Facilities
MEAN SUMMARY TABLE
13. Are you satisfied with the public services in the Centre Region? (Ratings: 5=Very Satisfied; 1=Very Dissatisfied)Random sample weighted by relative municipality population
Total Total Total Total Total Total
TOTAL College Township
Ferguson Township
Halfmoon Township
Harris Township
Patton Township
Boro State College
(A) (E) (F) (G) (H) (I) (J)
TOTAL ANSWERING 604 88 154 67 55 102 133Fire Services 4.3 4.3 4.3 3.8 4.4 4.3 4.4
G G G G G596 87 151 67 55 101 130
Ambulance Service 4.2 4.3 4.2 3.9 4.3 4.2 4.3D G G G G G
597 87 153 67 55 99 131Public Sewer Service 4.2 4.2 4.3 3.4 4.4 4.1 4.4
G G G G GI524 84 134 30 48 92 131
Public Water Service 4.2 4.1 4.2 4.0 4.3 4.2 4.3
559 85 144 48 51 95 131Police Services 4.2 4.3 4.2 3.7 4.2 4.2 4.2
G G G G G593 87 153 62 55 101 130
Recycling 4.0 3.9 4.0 3.8 4.2 3.9 4.1G
597 88 153 65 53 102 131Emergency Health Care 3.9 4.0 4.0 3.7 4.0 3.9 4.1
D G595 86 150 67 55 101 131
Electric Service 3.9 3.9 4.0 3.9 3.8 3.9 4.0
601 86 153 67 55 102 133High Speed Internet 3.6 3.4 3.7 3.6 3.6 3.5 3.6
581 83 147 64 53 101 128Composting 3.3 3.3 3.3 3.0 3.1 3.1 3.5
FGHI530 80 136 47 47 96 119
Cable Service 3.2 3.1 3.1 3.1 3.2 3.1 3.3D
579 87 146 60 54 99 128Public WiFi access 3.1 3.1 3.2 3.2 3.1 3.0 3.0
X541 78 139 54 49 93 123
Comparison Groups: ABCD/EFGHIJ/KLMNOP/QRSTUV/WXYZA2B2/EKQW/FLRX/GMSY/HNTZ/IOUA2/JPVB2Independent T-Test for Means (equal variances), Independent Z-Test for PercentagesUpper case letters indicate significance at the 95% level.
Page 31

2011 Centre Region Community Survey Results - Total Results
Police Services
13. Are you satisfied with the above public service in the Centre Region? (Ratings: 5=Very Satisfied; 1=Very Dissatisfied)Random sample weighted by relative municipality population
Total Total Total Total Total Total
TOTAL College Township
Ferguson Township
Halfmoon Township
Harris Township
Patton Township
Boro State College
(A) (E) (F) (G) (H) (I) (J)
TOTAL ANSWERING 601 87 154 67 55 102 131Very Satisfied 38.1% 39.1% 44.8% 14.9% 41.8% 33.3% 43.5%
G G G G GSatisfied 47.1% 55.2% 41.6% 47.8% 45.5% 57.8% 41.2%
FJ FJUncertain/Undecided 6.5% 2.3% 5.2% 19.4% 1.8% 3.9% 6.9%
EFHIJDissatisfied 5.2% 3.4% 5.8% 9.0% 9.1% 1.0% 5.3%
I I I IVery Dissatisfied 1.8% - 1.9% 1.5% 1.8% 2.9% 2.3%Not Available 1.3% - 0.6% 7.5% - 1.0% 0.8%
FJMEAN 4.2 4.3 4.2 3.7 4.2 4.2 4.2
G G G G GComparison Groups: ABCD/EFGHIJ/KLMNOP/QRSTUV/WXYZA2B2/EKQW/FLRX/GMSY/HNTZ/IOUA2/JPVB2Independent T-Test for Means (equal variances), Independent Z-Test for PercentagesUpper case letters indicate significance at the 95% level.
Fire Services
13. Are you satisfied with the above public service in the Centre Region? (Ratings: 5=Very Satisfied; 1=Very Dissatisfied)Random sample weighted by relative municipality population
Total Total Total Total Total Total
TOTAL College Township
Ferguson Township
Halfmoon Township
Harris Township
Patton Township
Boro State College
(A) (E) (F) (G) (H) (I) (J)
TOTAL ANSWERING 601 87 153 67 55 102 132Very Satisfied 43.6% 43.7% 47.7% 17.9% 49.1% 39.2% 53.0%
G G G G GISatisfied 42.8% 44.8% 37.9% 53.7% 45.5% 49.0% 36.4%
FJUncertain/Undecided 11.1% 11.5% 10.5% 22.4% 3.6% 9.8% 9.1%
FHIJDissatisfied 1.7% - 2.6% 6.0% 1.8% 1.0% -
Very Dissatisfied - - - - - - -Not Available 0.8% - 1.3% - - 1.0% 1.5%MEAN 4.3 4.3 4.3 3.8 4.4 4.3 4.4
G G G G GComparison Groups: ABCD/EFGHIJ/KLMNOP/QRSTUV/WXYZA2B2/EKQW/FLRX/GMSY/HNTZ/IOUA2/JPVB2Independent T-Test for Means (equal variances), Independent Z-Test for PercentagesUpper case letters indicate significance at the 95% level.
Page 32

2011 Centre Region Community Survey Results - Total Results
Ambulance Service
13. Are you satisfied with the above public service in the Centre Region? (Ratings: 5=Very Satisfied; 1=Very Dissatisfied)Random sample weighted by relative municipality population
Total Total Total Total Total Total
TOTAL College Township
Ferguson Township
Halfmoon Township
Harris Township
Patton Township
Boro State College
(A) (E) (F) (G) (H) (I) (J)
TOTAL ANSWERING 602 87 154 67 55 101 133Very Satisfied 39.4% 41.4% 42.9% 19.4% 41.8% 35.6% 45.9%
G G G G GSatisfied 44.7% 49.4% 40.3% 55.2% 47.3% 45.5% 39.8%
FJUncertain/Undecided 13.6% 9.2% 14.3% 22.4% 9.1% 14.9% 12.0%
EHDissatisfied 1.5% - 1.9% 3.0% 1.8% 2.0% 0.8%Very Dissatisfied - - - - - - -Not Available 0.8% - 0.6% - - 2.0% 1.5%MEAN 4.2 4.3 4.2 3.9 4.3 4.2 4.3
D G G G G GComparison Groups: ABCD/EFGHIJ/KLMNOP/QRSTUV/WXYZA2B2/EKQW/FLRX/GMSY/HNTZ/IOUA2/JPVB2Independent T-Test for Means (equal variances), Independent Z-Test for PercentagesUpper case letters indicate significance at the 95% level.
Emergency Health Care
13. Are you satisfied with the above public service in the Centre Region? (Ratings: 5=Very Satisfied; 1=Very Dissatisfied)Random sample weighted by relative municipality population
Total Total Total Total Total Total
TOTAL College Township
Ferguson Township
Halfmoon Township
Harris Township
Patton Township
Boro State College
(A) (E) (F) (G) (H) (I) (J)
TOTAL ANSWERING 602 87 153 67 55 102 133Very Satisfied 30.1% 28.7% 35.3% 11.9% 32.7% 28.4% 34.6%
D G G G G GSatisfied 45.2% 47.1% 39.9% 61.2% 45.5% 44.1% 42.1%
FIJUncertain/Undecided 14.0% 13.8% 12.4% 14.9% 10.9% 15.7% 15.8%
Dissatisfied 7.8% 9.2% 7.8% 11.9% 7.3% 7.8% 4.5%Very Dissatisfied 1.8% - 2.6% - 3.6% 2.9% 1.5%Not Available 1.2% 1.1% 2.0% - - 1.0% 1.5%MEAN 3.9 4.0 4.0 3.7 4.0 3.9 4.1
D GComparison Groups: ABCD/EFGHIJ/KLMNOP/QRSTUV/WXYZA2B2/EKQW/FLRX/GMSY/HNTZ/IOUA2/JPVB2Independent T-Test for Means (equal variances), Independent Z-Test for PercentagesUpper case letters indicate significance at the 95% level.
Page 33

2011 Centre Region Community Survey Results - Total Results
Public Water Service
13. Are you satisfied with the above public service in the Centre Region? (Ratings: 5=Very Satisfied; 1=Very Dissatisfied)Random sample weighted by relative municipality population
Total Total Total Total Total Total
TOTAL College Township
Ferguson Township
Halfmoon Township
Harris Township
Patton Township
Boro State College
(A) (E) (F) (G) (H) (I) (J)
TOTAL ANSWERING 599 86 153 66 55 102 132Very Satisfied 35.2% 31.4% 39.2% 10.6% 40.0% 31.4% 46.2%
WG G G G EGISatisfied 46.9% 55.8% 44.4% 54.5% 43.6% 50.0% 39.4%
J JUncertain/Undecided 6.7% 7.0% 5.9% 6.1% 3.6% 7.8% 7.6%Dissatisfied 3.2% 2.3% 2.0% 1.5% 3.6% 3.9% 5.3%Very Dissatisfied 1.3% 2.3% 2.6% - 1.8% - 0.8%Not Available 6.7% 1.2% 5.9% 27.3% 7.3% 6.9% 0.8%
C EJ EFHIJ EJMEAN 4.2 4.1 4.2 4.0 4.3 4.2 4.3
Comparison Groups: ABCD/EFGHIJ/KLMNOP/QRSTUV/WXYZA2B2/EKQW/FLRX/GMSY/HNTZ/IOUA2/JPVB2Independent T-Test for Means (equal variances), Independent Z-Test for PercentagesUpper case letters indicate significance at the 95% level.
Public Sewer Service
13. Are you satisfied with the above public service in the Centre Region? (Ratings: 5=Very Satisfied; 1=Very Dissatisfied)Random sample weighted by relative municipality population
Total Total Total Total Total Total
TOTAL College Township
Ferguson Township
Halfmoon Township
Harris Township
Patton Township
Boro State College
(A) (E) (F) (G) (H) (I) (J)
TOTAL ANSWERING 597 85 152 66 55 102 132Very Satisfied 33.2% 31.8% 36.2% 1.5% 40.0% 28.4% 47.0%
G G G G EGISatisfied 43.6% 57.6% 43.4% 22.7% 40.0% 49.0% 42.4%
D FGHJ G G G GUncertain/Undecided 7.4% 3.5% 5.9% 13.6% 5.5% 8.8% 7.6%
EDissatisfied 2.5% 4.7% 0.7% 6.1% 1.8% 2.0% 2.3%Very Dissatisfied 1.2% 1.2% 2.0% 1.5% - 2.0% -Not Available 12.2% 1.2% 11.8% 54.5% 12.7% 9.8% 0.8%
BC EJ EFHIJ EJ EJMEAN 4.2 4.2 4.3 3.4 4.4 4.1 4.4
G G G G GIComparison Groups: ABCD/EFGHIJ/KLMNOP/QRSTUV/WXYZA2B2/EKQW/FLRX/GMSY/HNTZ/IOUA2/JPVB2Independent T-Test for Means (equal variances), Independent Z-Test for PercentagesUpper case letters indicate significance at the 95% level.
Page 34
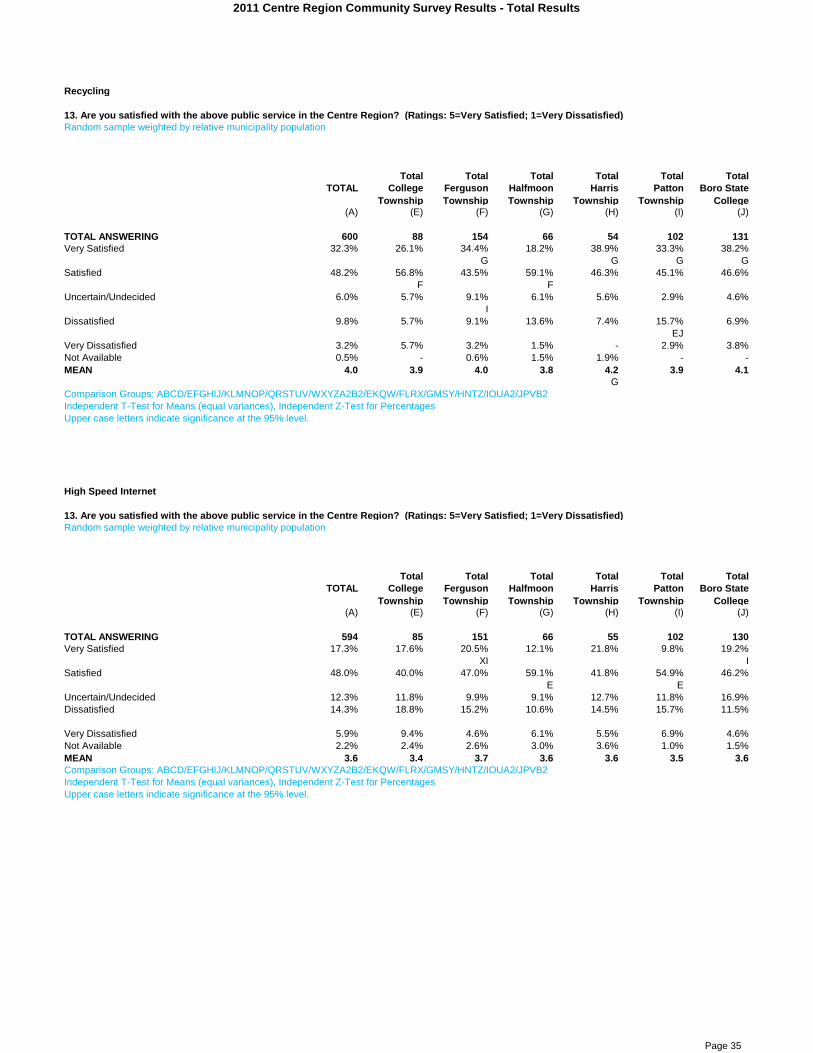
2011 Centre Region Community Survey Results - Total Results
Recycling
13. Are you satisfied with the above public service in the Centre Region? (Ratings: 5=Very Satisfied; 1=Very Dissatisfied)Random sample weighted by relative municipality population
Total Total Total Total Total Total
TOTAL College Township
Ferguson Township
Halfmoon Township
Harris Township
Patton Township
Boro State College
(A) (E) (F) (G) (H) (I) (J)
TOTAL ANSWERING 600 88 154 66 54 102 131Very Satisfied 32.3% 26.1% 34.4% 18.2% 38.9% 33.3% 38.2%
G G G GSatisfied 48.2% 56.8% 43.5% 59.1% 46.3% 45.1% 46.6%
F FUncertain/Undecided 6.0% 5.7% 9.1% 6.1% 5.6% 2.9% 4.6%
IDissatisfied 9.8% 5.7% 9.1% 13.6% 7.4% 15.7% 6.9%
EJVery Dissatisfied 3.2% 5.7% 3.2% 1.5% - 2.9% 3.8%Not Available 0.5% - 0.6% 1.5% 1.9% - -MEAN 4.0 3.9 4.0 3.8 4.2 3.9 4.1
GComparison Groups: ABCD/EFGHIJ/KLMNOP/QRSTUV/WXYZA2B2/EKQW/FLRX/GMSY/HNTZ/IOUA2/JPVB2Independent T-Test for Means (equal variances), Independent Z-Test for PercentagesUpper case letters indicate significance at the 95% level.
High Speed Internet
13. Are you satisfied with the above public service in the Centre Region? (Ratings: 5=Very Satisfied; 1=Very Dissatisfied)Random sample weighted by relative municipality population
Total Total Total Total Total Total
TOTAL College Township
Ferguson Township
Halfmoon Township
Harris Township
Patton Township
Boro State College
(A) (E) (F) (G) (H) (I) (J)
TOTAL ANSWERING 594 85 151 66 55 102 130Very Satisfied 17.3% 17.6% 20.5% 12.1% 21.8% 9.8% 19.2%
XI ISatisfied 48.0% 40.0% 47.0% 59.1% 41.8% 54.9% 46.2%
E EUncertain/Undecided 12.3% 11.8% 9.9% 9.1% 12.7% 11.8% 16.9%Dissatisfied 14.3% 18.8% 15.2% 10.6% 14.5% 15.7% 11.5%
Very Dissatisfied 5.9% 9.4% 4.6% 6.1% 5.5% 6.9% 4.6%Not Available 2.2% 2.4% 2.6% 3.0% 3.6% 1.0% 1.5%MEAN 3.6 3.4 3.7 3.6 3.6 3.5 3.6Comparison Groups: ABCD/EFGHIJ/KLMNOP/QRSTUV/WXYZA2B2/EKQW/FLRX/GMSY/HNTZ/IOUA2/JPVB2Independent T-Test for Means (equal variances), Independent Z-Test for PercentagesUpper case letters indicate significance at the 95% level.
Page 35

2011 Centre Region Community Survey Results - Total Results
Public WiFi access
13. Are you satisfied with the above public service in the Centre Region? (Ratings: 5=Very Satisfied; 1=Very Dissatisfied)Random sample weighted by relative municipality population
Total Total Total Total Total Total
TOTAL College Township
Ferguson Township
Halfmoon Township
Harris Township
Patton Township
Boro State College
(A) (E) (F) (G) (H) (I) (J)
TOTAL ANSWERING 591 84 151 67 54 102 128Very Satisfied 7.3% 9.5% 9.9% 1.5% 3.7% 6.9% 7.0%
G G GSatisfied 25.0% 21.4% 23.2% 29.9% 29.6% 23.5% 26.6%Uncertain/Undecided 34.9% 34.5% 36.4% 32.8% 35.2% 35.3% 34.4%
DDissatisfied 17.9% 20.2% 17.9% 13.4% 13.0% 17.6% 20.3%Very Dissatisfied 6.4% 7.1% 4.6% 3.0% 9.3% 7.8% 7.8%
Not Available 8.5% 7.1% 7.9% 19.4% 9.3% 8.8% 3.9%EFJ
MEAN 3.1 3.1 3.2 3.2 3.1 3.0 3.0X
Comparison Groups: ABCD/EFGHIJ/KLMNOP/QRSTUV/WXYZA2B2/EKQW/FLRX/GMSY/HNTZ/IOUA2/JPVB2Independent T-Test for Means (equal variances), Independent Z-Test for PercentagesUpper case letters indicate significance at the 95% level.
Cable Service
13. Are you satisfied with the above public service in the Centre Region? (Ratings: 5=Very Satisfied; 1=Very Dissatisfied)Random sample weighted by relative municipality population
Total Total Total Total Total Total
TOTAL College Township
Ferguson Township
Halfmoon Township
Harris Township
Patton Township
Boro State College
(A) (E) (F) (G) (H) (I) (J)
TOTAL ANSWERING 598 87 152 67 55 102 130Very Satisfied 11.4% 16.1% 13.8% 6.0% 9.1% 5.9% 12.3%
GI XISatisfied 39.5% 37.9% 34.9% 38.8% 47.3% 44.1% 40.0%
Uncertain/Undecided 12.0% 8.0% 9.9% 11.9% 10.9% 12.7% 17.7%E
Dissatisfied 21.2% 19.5% 25.0% 19.4% 18.2% 20.6% 20.0%Very Dissatisfied 12.7% 18.4% 12.5% 13.4% 12.7% 13.7% 8.5%
JNot Available 3.2% - 3.9% 10.4% 1.8% 2.9% 1.5%
HJMEAN 3.2 3.1 3.1 3.1 3.2 3.1 3.3
DComparison Groups: ABCD/EFGHIJ/KLMNOP/QRSTUV/WXYZA2B2/EKQW/FLRX/GMSY/HNTZ/IOUA2/JPVB2Independent T-Test for Means (equal variances), Independent Z-Test for PercentagesUpper case letters indicate significance at the 95% level.
Page 36

2011 Centre Region Community Survey Results - Total Results
Electric Service
13. Are you satisfied with the above public service in the Centre Region? (Ratings: 5=Very Satisfied; 1=Very Dissatisfied)Random sample weighted by relative municipality population
Total Total Total Total Total Total
TOTAL College Township
Ferguson Township
Halfmoon Township
Harris Township
Patton Township
Boro State College
(A) (E) (F) (G) (H) (I) (J)
TOTAL ANSWERING 601 86 153 67 55 102 133Very Satisfied 22.8% 24.4% 27.5% 9.0% 14.5% 24.5% 24.8%
D G GH G GSatisfied 57.6% 55.8% 54.9% 74.6% 63.6% 53.9% 54.1%
EFIJUncertain/Undecided 10.6% 10.5% 9.2% 10.4% 10.9% 7.8% 14.3%
Dissatisfied 6.8% 7.0% 7.2% 4.5% 7.3% 9.8% 5.3%Very Dissatisfied 2.2% 2.3% 1.3% 1.5% 3.6% 3.9% 1.5%MEAN 3.9 3.9 4.0 3.9 3.8 3.9 4.0
Comparison Groups: ABCD/EFGHIJ/KLMNOP/QRSTUV/WXYZA2B2/EKQW/FLRX/GMSY/HNTZ/IOUA2/JPVB2Independent T-Test for Means (equal variances), Independent Z-Test for PercentagesUpper case letters indicate significance at the 95% level.
Composting
13. Are you satisfied with the above public service in the Centre Region? (Ratings: 5=Very Satisfied; 1=Very Dissatisfied)Random sample weighted by relative municipality population
Total Total Total Total Total Total
TOTAL College Township
Ferguson Township
Halfmoon Township
Harris Township
Patton Township
Boro State College
(A) (E) (F) (G) (H) (I) (J)
TOTAL ANSWERING 595 85 150 66 55 102 132Very Satisfied 11.1% 9.4% 12.7% 4.5% 5.5% 6.9% 18.9%
G EGHISatisfied 24.4% 28.2% 22.0% 19.7% 25.5% 20.6% 28.8%Uncertain/Undecided 35.5% 41.2% 36.7% 25.8% 32.7% 47.1% 27.3%
D GJ A2GJDissatisfied 12.9% 12.9% 14.0% 16.7% 14.5% 10.8% 11.4%
Very Dissatisfied 5.2% 2.4% 5.3% 4.5% 7.3% 8.8% 3.8%E
Not Available 10.9% 5.9% 9.3% 28.8% 14.5% 5.9% 9.8%EFIJ
MEAN 3.3 3.3 3.3 3.0 3.1 3.1 3.5FGHI
Comparison Groups: ABCD/EFGHIJ/KLMNOP/QRSTUV/WXYZA2B2/EKQW/FLRX/GMSY/HNTZ/IOUA2/JPVB2Independent T-Test for Means (equal variances), Independent Z-Test for PercentagesUpper case letters indicate significance at the 95% level.
14. This question required a write-in response.
Page 37

2011 Centre Region Community Survey Results - Total Results
Attitudes about Transportation
15. In a typical week (Monday-Friday) what is the primary purpose of your travel? (Check only one)Random sample weighted by relative municipality population
Total Total Total Total Total Total
TOTAL College Township
Ferguson Township
Halfmoon Township
Harris Township
Patton Township
Boro State College
(A) (E) (F) (G) (H) (I) (J)
TOTAL ANSWERING 595 88 151 67 55 100 129Work 66.7% 58.0% 70.2% 80.6% 70.9% 67.0% 59.7%
EIJShopping 19.7% 23.9% 19.2% 11.9% 18.2% 21.0% 20.9%
GSchool 4.5% 5.7% 2.6% - 1.8% 3.0% 10.1%
FHIRecreation 3.9% 5.7% 2.0% 4.5% 3.6% 5.0% 3.9%Medical Appointment 2.2% 3.4% 2.0% 1.5% 1.8% 2.0% 2.3%Other, please specify 3.0% 3.4% 4.0% 1.5% 3.6% 2.0% 3.1%Comparison Groups: ABCD/EFGHIJ/KLMNOP/QRSTUV/WXYZA2B2/EKQW/FLRX/GMSY/HNTZ/IOUA2/JPVB2Independent T-Test for Means (equal variances), Independent Z-Test for PercentagesUpper case letters indicate significance at the 95% level.
Page 38

2011 Centre Region Community Survey Results - Total Results
16. What is the main mode of travel for your primary trip? (Check only one)Random sample weighted by relative municipality population
Total Total Total Total Total Total
TOTAL College Township
Ferguson Township
Halfmoon Township
Harris Township
Patton Township
Boro State College
(A) (E) (F) (G) (H) (I) (J)
TOTAL ANSWERING 596 89 151 66 55 99 131Automobile/truck/minivan/etc. 84.2% 85.4% 89.4% 93.9% 94.5% 93.9% 61.1%
J J J J JPublic transportation 5.4% 5.6% 2.6% 4.5% 3.6% 5.1% 9.2%
FWalk 5.0% 4.5% 2.0% - - 1.0% 16.8%
EFIBicycle 3.7% 3.4% 2.0% - 1.8% - 11.5%
EFHCarpool/vanpool 0.8% 1.1% 2.0% 1.5% - - -Motorcycle/scooter 0.7% - 2.0% - - - 0.8%Taxi 0.2% - - - - - 0.8%Comparison Groups: ABCD/EFGHIJ/KLMNOP/QRSTUV/WXYZA2B2/EKQW/FLRX/GMSY/HNTZ/IOUA2/JPVB2Independent T-Test for Means (equal variances), Independent Z-Test for PercentagesUpper case letters indicate significance at the 95% level.
Page 39
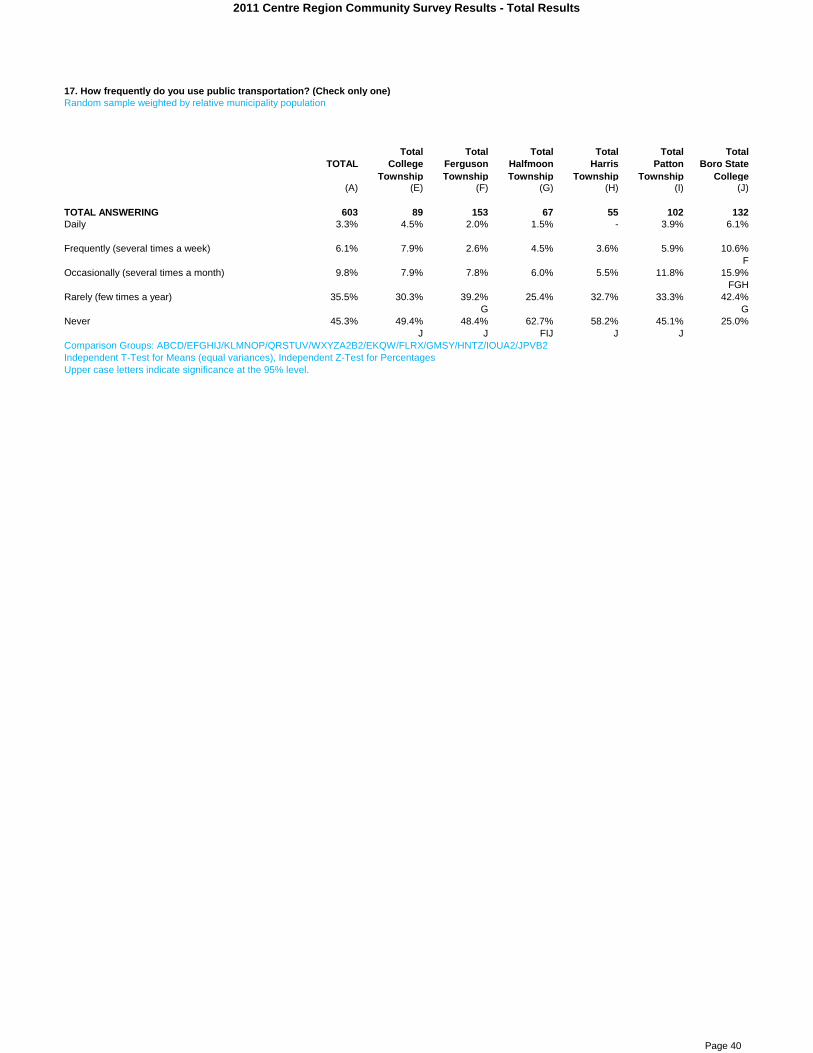
2011 Centre Region Community Survey Results - Total Results
17. How frequently do you use public transportation? (Check only one)Random sample weighted by relative municipality population
Total Total Total Total Total Total
TOTAL College Township
Ferguson Township
Halfmoon Township
Harris Township
Patton Township
Boro State College
(A) (E) (F) (G) (H) (I) (J)
TOTAL ANSWERING 603 89 153 67 55 102 132Daily 3.3% 4.5% 2.0% 1.5% - 3.9% 6.1%
Frequently (several times a week) 6.1% 7.9% 2.6% 4.5% 3.6% 5.9% 10.6%F
Occasionally (several times a month) 9.8% 7.9% 7.8% 6.0% 5.5% 11.8% 15.9%FGH
Rarely (few times a year) 35.5% 30.3% 39.2% 25.4% 32.7% 33.3% 42.4%G G
Never 45.3% 49.4% 48.4% 62.7% 58.2% 45.1% 25.0%J J FIJ J J
Comparison Groups: ABCD/EFGHIJ/KLMNOP/QRSTUV/WXYZA2B2/EKQW/FLRX/GMSY/HNTZ/IOUA2/JPVB2Independent T-Test for Means (equal variances), Independent Z-Test for PercentagesUpper case letters indicate significance at the 95% level.
Page 40

2011 Centre Region Community Survey Results - Total Results
18. Which do you use the most? (Check only one)Random sample weighted by relative municipality population
Total Total Total Total Total Total
TOTAL College Township
Ferguson Township
Halfmoon Township
Harris Township
Patton Township
Boro State College
(A) (E) (F) (G) (H) (I) (J)
TOTAL ANSWERING 314 43 75 23 20 55 96CATABus 71.3% 72.1% 70.7% 78.3% 90.0% 80.0% 62.5%
FJ A2JCampus Loop/Link 21.7% 14.0% 20.0% 21.7% 10.0% 14.5% 31.3%
EHICentre County Office of Transportation Services van/bus
1.3% 4.7% 1.3% - - - 1.0%
CATARide 1.0% 2.3% 1.3% - - - 1.0%Other, please specify 4.8% 7.0% 6.7% - - 5.5% 4.2%Comparison Groups: ABCD/EFGHIJ/KLMNOP/QRSTUV/WXYZA2B2/EKQW/FLRX/GMSY/HNTZ/IOUA2/JPVB2Independent T-Test for Means (equal variances), Independent Z-Test for PercentagesUpper case letters indicate significance at the 95% level.
Page 41

2011 Centre Region Community Survey Results - Total Results
19. Which of the following factors would encourage you to use public transportation more frequently? First, which is MOST important?Random sample weighted by relative municipality population
Total Total Total Total Total Total
TOTAL College Township
Ferguson Township
Halfmoon Township
Harris Township
Patton Township
Boro State College
(A) (E) (F) (G) (H) (I) (J)
TOTAL ANSWERING 545 76 135 65 51 93 120Increase in frequency of departures from bus stops 21.8% 10.5% 19.3% 26.2% 27.5% 26.9% 22.5%
E E E EMore direct bus route between my home and destination
18.7% 14.5% 17.0% 24.6% 25.5% 19.4% 16.7%
A bus stop closer to my home 12.3% 25.0% 11.9% 9.2% 9.8% 7.5% 10.8%FGHIJ
Service to my neighborhood 10.8% 22.4% 12.6% 3.1% 19.6% 6.5% 5.8%GIJ G GIJ
Reduce cost of bus fare or bus pass 10.5% 11.8% 9.6% 9.2% 7.8% 8.6% 13.3%Expanded hours of operation 8.1% 5.3% 9.6% 9.2% - 10.8% 9.2%A bus stop closer to my destination 3.3% 2.6% 5.9% - 2.0% 4.3% 2.5%Other, please specify 14.5% 7.9% 14.1% 18.5% 7.8% 16.1% 19.2%
EHComparison Groups: ABCD/EFGHIJ/KLMNOP/QRSTUV/WXYZA2B2/EKQW/FLRX/GMSY/HNTZ/IOUA2/JPVB2Independent T-Test for Means (equal variances), Independent Z-Test for PercentagesUpper case letters indicate significance at the 95% level.
19. Of those remaining, what would be the next (second) most desirable factor that would encourage you to use public transportation more?Random sample weighted by relative municipality population
Total Total Total Total Total Total
TOTAL College Township
Ferguson Township
Halfmoon Township
Harris Township
Patton Township
Boro State College
(A) (E) (F) (G) (H) (I) (J)
TOTAL ANSWERING 473 66 114 58 49 78 104Increase in frequency of departures from bus stops 23.3% 15.2% 23.7% 24.1% 12.2% 28.2% 29.8%
H EHMore direct bus route between my home and destination
17.8% 16.7% 19.3% 17.2% 12.2% 19.2% 18.3%
Expanded hours of operation 15.0% 9.1% 11.4% 19.0% 16.3% 15.4% 20.2%E
A bus stop closer to my destination 11.0% 15.2% 9.6% 15.5% 14.3% 7.7% 7.7%Reduce cost of bus fare or bus pass 10.1% 12.1% 11.4% 6.9% 6.1% 9.0% 11.5%A bus stop closer to my home 9.1% 18.2% 12.3% 1.7% 18.4% 5.1% 2.9%
GIJ GJ GIJService to my neighborhood 8.2% 10.6% 8.8% 6.9% 12.2% 5.1% 6.7%Other, please specify 5.5% 3.0% 3.5% 8.6% 8.2% 10.3% 2.9%
Comparison Groups: ABCD/EFGHIJ/KLMNOP/QRSTUV/WXYZA2B2/EKQW/FLRX/GMSY/HNTZ/IOUA2/JPVB2Independent T-Test for Means (equal variances), Independent Z-Test for PercentagesUpper case letters indicate significance at the 95% level.
Page 42

2011 Centre Region Community Survey Results - Total Results
19. What would be the next (third) most desirable factor to encourage you to use public transportation more often?Random sample weighted by relative municipality population
Total Total Total Total Total Total
TOTAL College Township
Ferguson Township
Halfmoon Township
Harris Township
Patton Township
Boro State College
(A) (E) (F) (G) (H) (I) (J)
TOTAL ANSWERING 436 60 107 53 45 73 94More direct bus route between my home and destination
19.5% 18.3% 21.5% 20.8% 17.8% 21.9% 16.0%
Increase in frequency of departures from bus stops 18.3% 25.0% 21.5% 15.1% 17.8% 8.2% 19.1%
I I IExpanded hours of operation 17.4% 13.3% 12.1% 26.4% 26.7% 13.7% 20.2%
MSF FReduce cost of bus fare or bus pass 11.9% 10.0% 10.3% 3.8% 11.1% 20.5% 12.8%
G GA bus stop closer to my destination 11.7% 11.7% 12.1% 11.3% 11.1% 15.1% 9.6%A bus stop closer to my home 8.5% 8.3% 9.3% 9.4% 8.9% 8.2% 7.4%Service to my neighborhood 7.8% 10.0% 10.3% 7.5% 2.2% 5.5% 8.5%
HOther, please specify 4.8% 3.3% 2.8% 5.7% 4.4% 6.8% 6.4%
Comparison Groups: ABCD/EFGHIJ/KLMNOP/QRSTUV/WXYZA2B2/EKQW/FLRX/GMSY/HNTZ/IOUA2/JPVB2Independent T-Test for Means (equal variances), Independent Z-Test for PercentagesUpper case letters indicate significance at the 95% level.
19. And what would be the next (fourth) most desirable factor to encourage you to use public transportation more often?Random sample weighted by relative municipality population
Total Total Total Total Total Total
TOTAL College Township
Ferguson Township
Halfmoon Township
Harris Township
Patton Township
Boro State College
(A) (E) (F) (G) (H) (I) (J)
TOTAL ANSWERING 395 55 96 50 43 67 80A bus stop closer to my destination 19.2% 12.7% 21.9% 22.0% 16.3% 22.4% 17.5%
Expanded hours of operation 18.5% 23.6% 21.9% 12.0% 11.6% 19.4% 16.3%
More direct bus route between my home and destination
17.7% 23.6% 13.5% 4.0% 27.9% 19.4% 21.3%
G G G G GReduce cost of bus fare or bus pass 13.2% 7.3% 15.6% 14.0% 14.0% 9.0% 17.5%Increase in frequency of departures from bus stops 12.9% 20.0% 9.4% 16.0% 14.0% 11.9% 11.3%
A bus stop closer to my home 8.4% 7.3% 8.3% 14.0% 4.7% 4.5% 11.3%Service to my neighborhood 5.3% 3.6% 5.2% 12.0% 4.7% 6.0% 2.5%Other, please specify 4.8% 1.8% 4.2% 6.0% 7.0% 7.5% 2.5%
Comparison Groups: ABCD/EFGHIJ/KLMNOP/QRSTUV/WXYZA2B2/EKQW/FLRX/GMSY/HNTZ/IOUA2/JPVB2Independent T-Test for Means (equal variances), Independent Z-Test for PercentagesUpper case letters indicate significance at the 95% level.
Page 43
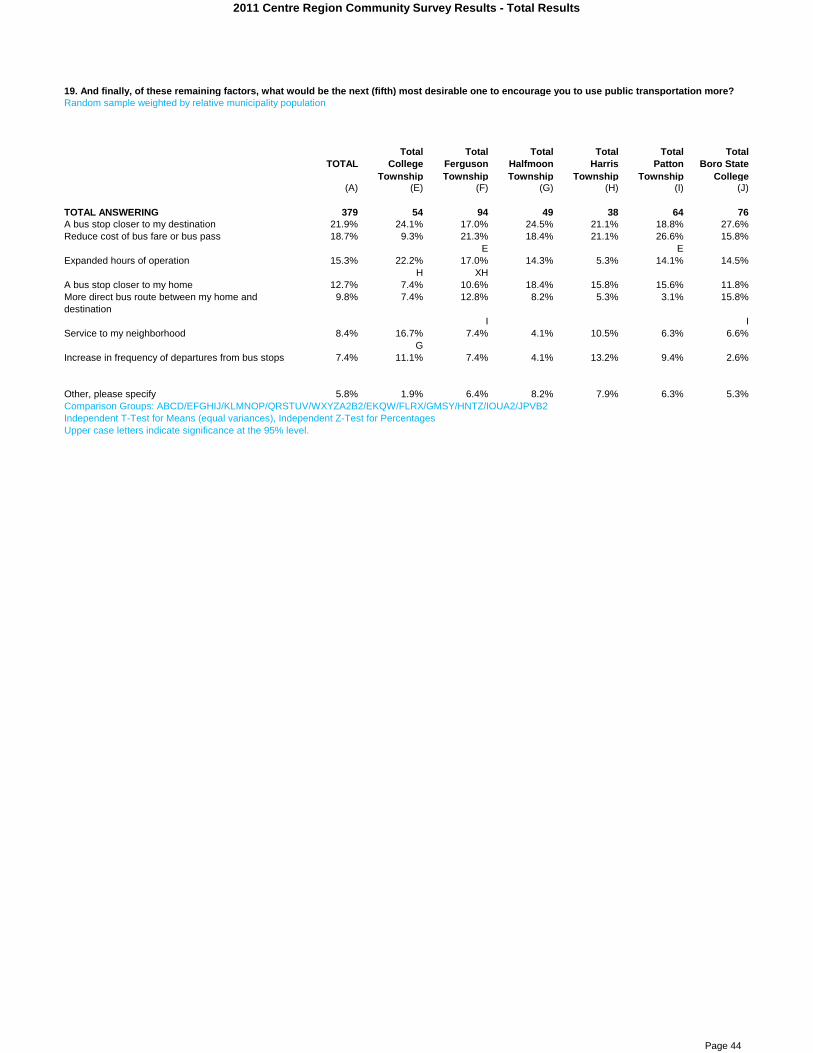
2011 Centre Region Community Survey Results - Total Results
19. And finally, of these remaining factors, what would be the next (fifth) most desirable one to encourage you to use public transportation more?Random sample weighted by relative municipality population
Total Total Total Total Total Total
TOTAL College Township
Ferguson Township
Halfmoon Township
Harris Township
Patton Township
Boro State College
(A) (E) (F) (G) (H) (I) (J)
TOTAL ANSWERING 379 54 94 49 38 64 76A bus stop closer to my destination 21.9% 24.1% 17.0% 24.5% 21.1% 18.8% 27.6%Reduce cost of bus fare or bus pass 18.7% 9.3% 21.3% 18.4% 21.1% 26.6% 15.8%
E EExpanded hours of operation 15.3% 22.2% 17.0% 14.3% 5.3% 14.1% 14.5%
H XHA bus stop closer to my home 12.7% 7.4% 10.6% 18.4% 15.8% 15.6% 11.8%More direct bus route between my home and destination
9.8% 7.4% 12.8% 8.2% 5.3% 3.1% 15.8%
I IService to my neighborhood 8.4% 16.7% 7.4% 4.1% 10.5% 6.3% 6.6%
GIncrease in frequency of departures from bus stops 7.4% 11.1% 7.4% 4.1% 13.2% 9.4% 2.6%
Other, please specify 5.8% 1.9% 6.4% 8.2% 7.9% 6.3% 5.3%Comparison Groups: ABCD/EFGHIJ/KLMNOP/QRSTUV/WXYZA2B2/EKQW/FLRX/GMSY/HNTZ/IOUA2/JPVB2Independent T-Test for Means (equal variances), Independent Z-Test for PercentagesUpper case letters indicate significance at the 95% level.
Page 44

2011 Centre Region Community Survey Results - Total Results
20. Of the following corridors, which are you most concerned with in terms of safety (Check no more than 3)? Percent selectedRandom sample weighted by relative municipality population
Total Total Total Total Total Total
TOTAL College Township
Ferguson Township
Halfmoon Township
Harris Township
Patton Township
Boro State College
(A) (E) (F) (G) (H) (I) (J)
TOTAL ANSWERING 595 89 152 66 54 100 130College and Beaver Avenues in Downtown State College
56.1% 51.7% 52.6% 57.6% 48.1% 61.0% 62.3%
North Atherton Street 45.2% 39.3% 48.0% 48.5% 46.3% 50.0% 40.8%
South Atherton Street 18.0% 21.3% 17.1% 13.6% 25.9% 15.0% 18.5%Whitehall Road 17.1% 16.9% 32.2% 12.1% 9.3% 4.0% 15.4%
I EGHIJ IEast College Avenue 14.1% 23.6% 11.2% 3.0% 20.4% 14.0% 14.6%
D FG G G G GVairo Boulevard/Waddle Road 10.8% 9.0% 9.2% 13.6% 3.7% 17.0% 9.2%
H HPark Avenue 10.4% 11.2% 4.6% 13.6% 11.1% 13.0% 13.1%
F F FUniversity Drive 9.7% 19.1% 8.6% 3.0% 11.1% 4.0% 12.3%
FGI GIWest College Avenue 9.2% 6.7% 15.8% 1.5% 9.3% 6.0% 10.0%
EGI GValley Vista Drive/Science Park Road 8.9% 1.1% 12.5% 16.7% 1.9% 13.0% 5.4%
EHJ EHJ EHOther, please specify 8.1% 6.7% 5.9% 9.1% 9.3% 13.0% 6.9%
None 11.8% 13.5% 7.2% 13.6% 18.5% 9.0% 14.6%F F
Comparison Groups: ABCD/EFGHIJ/KLMNOP/QRSTUV/WXYZA2B2/EKQW/FLRX/GMSY/HNTZ/IOUA2/JPVB2Independent T-Test for Means (equal variances), Independent Z-Test for PercentagesUpper case letters indicate significance at the 95% level.
Page 45
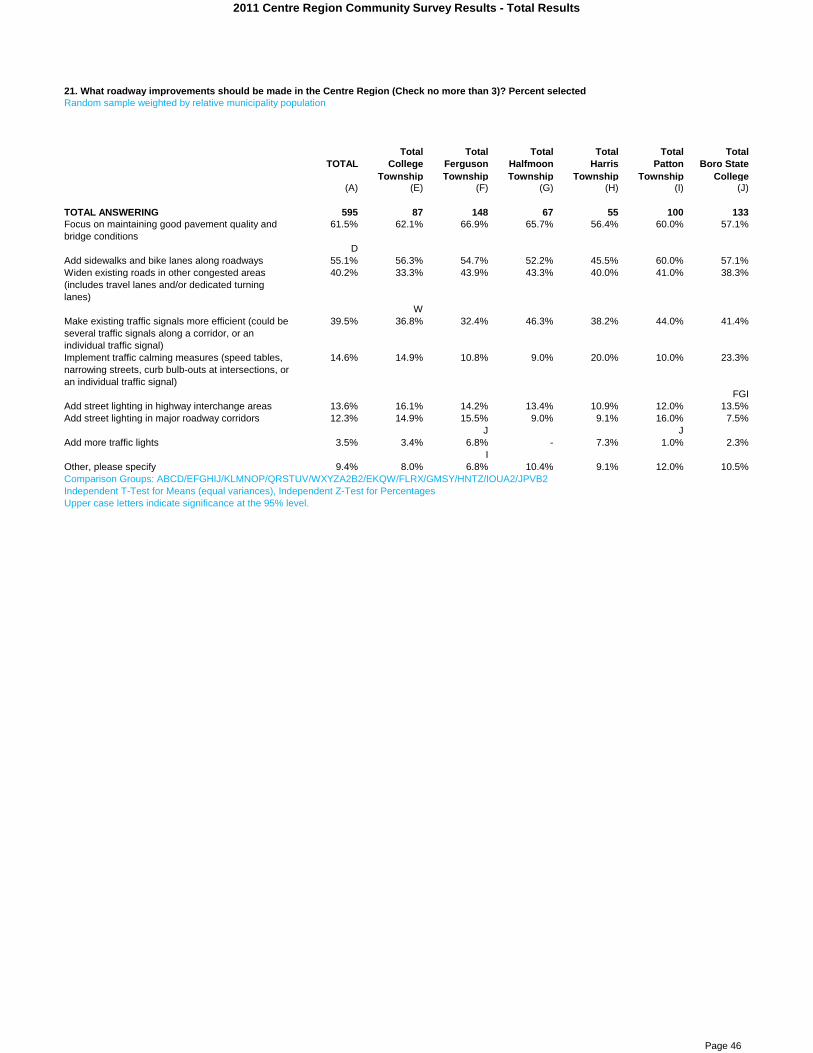
2011 Centre Region Community Survey Results - Total Results
21. What roadway improvements should be made in the Centre Region (Check no more than 3)? Percent selectedRandom sample weighted by relative municipality population
Total Total Total Total Total Total
TOTAL College Township
Ferguson Township
Halfmoon Township
Harris Township
Patton Township
Boro State College
(A) (E) (F) (G) (H) (I) (J)
TOTAL ANSWERING 595 87 148 67 55 100 133Focus on maintaining good pavement quality and bridge conditions
61.5% 62.1% 66.9% 65.7% 56.4% 60.0% 57.1%
DAdd sidewalks and bike lanes along roadways 55.1% 56.3% 54.7% 52.2% 45.5% 60.0% 57.1%Widen existing roads in other congested areas (includes travel lanes and/or dedicated turning lanes)
40.2% 33.3% 43.9% 43.3% 40.0% 41.0% 38.3%
WMake existing traffic signals more efficient (could be several traffic signals along a corridor, or an individual traffic signal)
39.5% 36.8% 32.4% 46.3% 38.2% 44.0% 41.4%
Implement traffic calming measures (speed tables, narrowing streets, curb bulb-outs at intersections, or an individual traffic signal)
14.6% 14.9% 10.8% 9.0% 20.0% 10.0% 23.3%
FGIAdd street lighting in highway interchange areas 13.6% 16.1% 14.2% 13.4% 10.9% 12.0% 13.5%Add street lighting in major roadway corridors 12.3% 14.9% 15.5% 9.0% 9.1% 16.0% 7.5%
J JAdd more traffic lights 3.5% 3.4% 6.8% - 7.3% 1.0% 2.3%
IOther, please specify 9.4% 8.0% 6.8% 10.4% 9.1% 12.0% 10.5%Comparison Groups: ABCD/EFGHIJ/KLMNOP/QRSTUV/WXYZA2B2/EKQW/FLRX/GMSY/HNTZ/IOUA2/JPVB2Independent T-Test for Means (equal variances), Independent Z-Test for PercentagesUpper case letters indicate significance at the 95% level.
Page 46

2011 Centre Region Community Survey Results - Total Results
22. What improvements in bicycle or pedestrian facilities should be made in the Centre Region (Check no more than 3)? Percent selectedRandom sample weighted by relative municipality population
Total Total Total Total Total Total
TOTAL College Township
Ferguson Township
Halfmoon Township
Harris Township
Patton Township
Boro State College
(A) (E) (F) (G) (H) (I) (J)
TOTAL ANSWERING 574 84 141 63 53 98 130Add more off-street bikeways 58.4% 51.2% 61.0% 65.1% 56.6% 58.2% 57.7%Provide connections between existing sidewalks, trails, and bikeways
53.1% 50.0% 61.0% 42.9% 47.2% 58.2% 50.8%
GAdd more bike lanes on roads 41.3% 44.0% 44.0% 41.3% 34.0% 42.9% 39.2%Expand the system of sidewalks and pedestrian trails
37.6% 33.3% 36.9% 38.1% 32.1% 42.9% 38.5%
Add more facilities that reduce conflicts between pedestrians and vehicles (mid-block crosswalks, signing, lighting, etc.)
34.3% 27.4% 32.6% 36.5% 24.5% 31.6% 45.4%
EFHIMake crosswalks more visible 12.9% 19.0% 12.8% 11.1% 18.9% 9.2% 10.0%
Other, please specify 8.5% 8.3% 6.4% 9.5% 7.5% 9.2% 10.8%Comparison Groups: ABCD/EFGHIJ/KLMNOP/QRSTUV/WXYZA2B2/EKQW/FLRX/GMSY/HNTZ/IOUA2/JPVB2Independent T-Test for Means (equal variances), Independent Z-Test for PercentagesUpper case letters indicate significance at the 95% level.
Page 47

2011 Centre Region Community Survey Results - Total Results
23. What improvements should be made to enhance transportation access to the Centre Region (Check no more than 3)? Percent selectedRandom sample weighted by relative municipality population
Total Total Total Total Total Total
TOTAL College Township
Ferguson Township
Halfmoon Township
Harris Township
Patton Township
Boro State College
(A) (E) (F) (G) (H) (I) (J)
TOTAL ANSWERING 579 86 145 64 53 98 128Major highway improvements to connect the Region with the four lane Section of Route 322 at Seven Mountains
50.1% 41.9% 60.0% 56.3% 62.3% 51.0% 35.9%
EJ J ZEJ JMore passenger air service at the University Park Airport
46.3% 41.9% 47.6% 45.3% 43.4% 52.0% 43.8%
High speed rail service 41.3% 34.9% 36.6% 28.1% 22.6% 44.9% 61.7%H GH EFGHI
New interchange between Interstate 99 and Interstate 80 at the Exit 161 Bellefonte Interchange
30.1% 33.7% 34.5% 37.5% 34.0% 29.6% 18.0%
J J J J JMore intercity bus service 21.6% 25.6% 15.2% 10.9% 20.8% 19.4% 32.8%
G FGIRoadway access to Interstate 80 via Route 322 West of Port Matilda
21.6% 18.6% 28.3% 34.4% 13.2% 21.4% 14.1%
HJ EHJA new Centre Region Bus Terminal 13.3% 14.0% 12.4% 10.9% 5.7% 12.2% 19.5%
HOther, please specify 5.5% 5.8% 4.8% 6.3% 11.3% 6.1% 3.1%
Comparison Groups: ABCD/EFGHIJ/KLMNOP/QRSTUV/WXYZA2B2/EKQW/FLRX/GMSY/HNTZ/IOUA2/JPVB2Independent T-Test for Means (equal variances), Independent Z-Test for PercentagesUpper case letters indicate significance at the 95% level.
Page 48

2011 Centre Region Community Survey Results - Total Results
Random sample weighted by relative municipality population
Total Total Total Total Total Total
TOTAL College Township
Ferguson Township
Halfmoon Township
Harris Township
Patton Township
Boro State College
(A) (E) (F) (G) (H) (I) (J)
TOTAL ANSWERING 600 89 151 67 55 101 132Yes 24.8% 22.5% 26.5% 32.8% 34.5% 27.7% 15.2%
J J J JNo 63.3% 65.2% 61.6% 52.2% 60.0% 60.4% 72.7%
FGIDon’t know 11.8% 12.4% 11.9% 14.9% 5.5% 11.9% 12.1%Comparison Groups: ABCD/EFGHIJ/KLMNOP/QRSTUV/WXYZA2B2/EKQW/FLRX/GMSY/HNTZ/IOUA2/JPVB2Independent T-Test for Means (equal variances), Independent Z-Test for PercentagesUpper case letters indicate significance at the 95% level.
24. Do you spend more than 15% of your household income on transportation costs? (Costs include monthly vehicle loan payments, insurance, vehicle registration, vehicle maintenance and repairs; bus fare, bus pass, taxi fare, etc.)
Page 49

2011 Centre Region Community Survey Results - Total Results
Attitudes regarding the Environment in the Centre Region
25. Please place the following natural and environmental issues in priority order. Which is the MOST important to you?Random sample weighted by relative municipality population
Total Total Total Total Total Total
TOTAL College Township
Ferguson Township
Halfmoon Township
Harris Township
Patton Township
Boro State College
(A) (E) (F) (G) (H) (I) (J)
TOTAL ANSWERING 590 85 152 66 54 99 130Protect drinking water quality 39.2% 49.4% 33.6% 39.4% 33.3% 40.4% 40.0%
WFQuality and quantity of water resources (which include but are not limited to, streams, rivers, wetlands)
26.6% 18.8% 28.3% 25.8% 29.6% 31.3% 25.4%
Z EOpen space 7.6% 3.5% 10.5% 12.1% 13.0% 6.1% 3.8%
EJAccess to forest, game lands, and natural areas 7.6% 9.4% 10.5% 9.1% 7.4% 4.0% 5.4%
IAir quality 6.6% 10.6% 5.9% - 9.3% 7.1% 6.2%
Use of renewable energy sources in municipal buildings and vehicles
3.9% - 2.6% 7.6% 3.7% 2.0% 7.7%
IRefuse management and recycling programs 3.4% 5.9% 3.9% - - 1.0% 6.2%
IIncrease energy efficiency in municipal buildings and vehicles
3.1% 2.4% 3.3% 3.0% - 4.0% 3.8%
Other, please specify 2.0% - 1.3% 3.0% 3.7% 4.0% 1.5%
Comparison Groups: ABCD/EFGHIJ/KLMNOP/QRSTUV/WXYZA2B2/EKQW/FLRX/GMSY/HNTZ/IOUA2/JPVB2Independent T-Test for Means (equal variances), Independent Z-Test for PercentagesUpper case letters indicate significance at the 95% level.
Random sample weighted by relative municipality population
Total Total Total Total Total Total
TOTAL College Township
Ferguson Township
Halfmoon Township
Harris Township
Patton Township
Boro State College
(A) (E) (F) (G) (H) (I) (J)
TOTAL ANSWERING 583 82 150 66 53 99 129Quality and quantity of water resources (which include but are not limited to, streams, rivers, wetlands)
25.0% 29.3% 27.3% 30.3% 20.8% 21.2% 21.7%
WAir quality 23.8% 22.0% 25.3% 21.2% 32.1% 25.3% 20.2%
Protect drinking water quality 19.0% 15.9% 19.3% 16.7% 11.3% 18.2% 25.6%H
Open space 9.4% 14.6% 8.7% 10.6% 15.1% 6.1% 6.2%Refuse management and recycling programs 8.2% 4.9% 8.0% 7.6% 7.5% 12.1% 8.5%Access to forest, game lands, and natural areas 6.0% 4.9% 5.3% 3.0% 11.3% 10.1% 3.9%Increase energy efficiency in municipal buildings and vehicles
3.9% 3.7% 1.3% 7.6% 1.9% 4.0% 6.2%
FUse of renewable energy sources in municipal buildings and vehicles
3.4% 3.7% 4.0% 1.5% - 1.0% 7.0%
GIOther, please specify 1.0% 1.2% 0.7% 1.5% - 2.0% 0.8%Comparison Groups: ABCD/EFGHIJ/KLMNOP/QRSTUV/WXYZA2B2/EKQW/FLRX/GMSY/HNTZ/IOUA2/JPVB2Independent T-Test for Means (equal variances), Independent Z-Test for PercentagesUpper case letters indicate significance at the 95% level.
25. Please place the following natural and environmental issues in priority order. Of those remaining, which is the next (second) most important to you?
Page 50

2011 Centre Region Community Survey Results - Total Results
25. Please place the following natural and environmental issues in priority order. Which is the next (third) most important to you of these?Random sample weighted by relative municipality population
Total Total Total Total Total Total
TOTAL College Township
Ferguson Township
Halfmoon Township
Harris Township
Patton Township
Boro State College
(A) (E) (F) (G) (H) (I) (J)
TOTAL ANSWERING 572 79 149 65 51 97 127Air quality 23.1% 20.3% 27.5% 23.1% 15.7% 19.6% 25.2%
Quality and quantity of water resources (which include but are not limited to, streams, rivers, wetlands)
16.3% 17.7% 12.1% 15.4% 19.6% 16.5% 18.1%
Protect drinking water quality 13.8% 10.1% 14.1% 15.4% 13.7% 18.6% 11.8%
Refuse management and recycling programs 13.3% 12.7% 12.8% 13.8% 11.8% 12.4% 15.7%
Open space 11.5% 12.7% 12.1% 9.2% 7.8% 17.5% 8.7%
Access to forest, game lands, and natural areas 10.0% 7.6% 6.7% 15.4% 21.6% 7.2% 9.4%EFI
Increase energy efficiency in municipal buildings and vehicles
5.6% 6.3% 7.4% 4.6% 3.9% 3.1% 6.3%
Use of renewable energy sources in municipal buildings and vehicles
5.2% 11.4% 6.0% - 5.9% 4.1% 3.9%
Other, please specify 1.2% 1.3% 1.3% 3.1% - 1.0% 0.8%Comparison Groups: ABCD/EFGHIJ/KLMNOP/QRSTUV/WXYZA2B2/EKQW/FLRX/GMSY/HNTZ/IOUA2/JPVB2Independent T-Test for Means (equal variances), Independent Z-Test for PercentagesUpper case letters indicate significance at the 95% level.
Random sample weighted by relative municipality population
Total Total Total Total Total Total
TOTAL College Township
Ferguson Township
Halfmoon Township
Harris Township
Patton Township
Boro State College
(A) (E) (F) (G) (H) (I) (J)
TOTAL ANSWERING 541 73 138 65 48 94 119Air quality 14.2% 12.3% 11.6% 16.9% 10.4% 20.2% 14.3%
Open space 13.1% 13.7% 11.6% 13.8% 14.6% 7.4% 18.5%I
Refuse management and recycling programs 13.1% 8.2% 10.1% 16.9% 10.4% 17.0% 16.0%Access to forest, game lands, and natural areas 12.9% 8.2% 18.8% 12.3% 6.3% 20.2% 5.9%
EHJ EHJUse of renewable energy sources in municipal buildings and vehicles
12.8% 15.1% 10.1% 12.3% 27.1% 10.6% 10.1%
ZFIJQuality and quantity of water resources (which include but are not limited to, streams, rivers, wetlands)
11.6% 12.3% 13.0% 9.2% 6.3% 12.8% 12.6%
Increase energy efficiency in municipal buildings and vehicles
10.9% 13.7% 8.0% 4.6% 18.8% 5.3% 16.8%
GI FGIProtect drinking water quality 10.2% 15.1% 14.5% 12.3% 6.3% 5.3% 5.9%
I IJOther, please specify 1.1% 1.4% 2.2% 1.5% - 1.1% -Comparison Groups: ABCD/EFGHIJ/KLMNOP/QRSTUV/WXYZA2B2/EKQW/FLRX/GMSY/HNTZ/IOUA2/JPVB2Independent T-Test for Means (equal variances), Independent Z-Test for PercentagesUpper case letters indicate significance at the 95% level.
25. Please place the following natural and environmental issues in priority order. Of those now remaining, which is the next (fourth) most important to you?
Page 51

2011 Centre Region Community Survey Results - Total Results
Random sample weighted by relative municipality population
Total Total Total Total Total Total
TOTAL College Township
Ferguson Township
Halfmoon Township
Harris Township
Patton Township
Boro State College
(A) (E) (F) (G) (H) (I) (J)
TOTAL ANSWERING 529 73 134 63 48 93 114Refuse management and recycling programs 18.5% 19.2% 19.4% 12.7% 20.8% 18.3% 19.3%
Access to forest, game lands, and natural areas 14.9% 17.8% 17.2% 12.7% 12.5% 14.0% 14.0%Open space 13.2% 13.7% 17.9% 11.1% 4.2% 16.1% 10.5%
H HIncrease energy efficiency in municipal buildings and vehicles
12.9% 12.3% 9.0% 15.9% 12.5% 15.1% 14.0%
Air quality 12.7% 17.8% 12.7% 15.9% 8.3% 9.7% 11.4%Use of renewable energy sources in municipal buildings and vehicles
11.5% 6.8% 11.2% 9.5% 10.4% 12.9% 14.9%
Protect drinking water quality 7.9% 2.7% 8.2% 9.5% 20.8% 6.5% 6.1%EFIJ
Quality and quantity of water resources (which include but are not limited to, streams, rivers, wetlands)
7.8% 6.8% 4.5% 12.7% 10.4% 6.5% 9.6%
Other, please specify 0.6% 2.7% - - - 1.1% -Comparison Groups: ABCD/EFGHIJ/KLMNOP/QRSTUV/WXYZA2B2/EKQW/FLRX/GMSY/HNTZ/IOUA2/JPVB2Independent T-Test for Means (equal variances), Independent Z-Test for PercentagesUpper case letters indicate significance at the 95% level.
25. Please place the following natural and environmental issues in priority order. And finally, of these, which is the next (fifth) most important to you?
Page 52

2011 Centre Region Community Survey Results - Total Results
26. In the past 12 months have you used Spring Creek for any of the following activities (Please check all that apply)?Random sample weighted by relative municipality population
Total Total Total Total Total Total
TOTAL College Township
Ferguson Township
Halfmoon Township
Harris Township
Patton Township
Boro State College
(A) (E) (F) (G) (H) (I) (J)
TOTAL ANSWERING 596 89 152 67 54 99 130I have not used Spring Creek 58.2% 50.6% 61.2% 67.2% 55.6% 54.5% 58.5%
EGeneral Passive Recreation 36.1% 46.1% 32.2% 26.9% 37.0% 39.4% 36.2%
FGFishing 10.2% 18.0% 9.2% 19.4% 7.4% 9.1% 3.8%
J HJCanoe, Kayak 5.0% 4.5% 5.9% 6.0% 11.1% 3.0% 3.1%
Other, please specify 3.9% 4.5% 2.6% - 3.7% 4.0% 6.9%Comparison Groups: ABCD/EFGHIJ/KLMNOP/QRSTUV/WXYZA2B2/EKQW/FLRX/GMSY/HNTZ/IOUA2/JPVB2Independent T-Test for Means (equal variances), Independent Z-Test for PercentagesUpper case letters indicate significance at the 95% level.
Page 53

2011 Centre Region Community Survey Results - Total Results
Random sample weighted by relative municipality population
Total Total Total Total Total Total
TOTAL College Township
Ferguson Township
Halfmoon Township
Harris Township
Patton Township
Boro State College
(A) (E) (F) (G) (H) (I) (J)
TOTAL ANSWERING 546 82 136 62 50 90 122Restrict development near Spring Creek and its tributaries
78.9% 70.7% 83.1% 75.8% 78.0% 80.0% 80.3%
EEducate the public about specific issues related to Spring Creek and its tributaries
59.0% 62.2% 55.9% 54.8% 56.0% 64.4% 59.8%
B2Increase vegetative buffers near Spring Creek and its tributaries
58.6% 53.7% 53.7% 62.9% 62.0% 62.2% 60.7%
Increase access to Spring Creek and its tributaries 17.8% 22.0% 17.6% 14.5% 22.0% 21.1% 13.1%
Comparison Groups: ABCD/EFGHIJ/KLMNOP/QRSTUV/WXYZA2B2/EKQW/FLRX/GMSY/HNTZ/IOUA2/JPVB2Independent T-Test for Means (equal variances), Independent Z-Test for PercentagesUpper case letters indicate significance at the 95% level.
27. Which of the following items do you feel the municipalities should engage in to protect or improve the quality of Spring Creek and its tributaries (Please check all that you think are important)?
Page 54
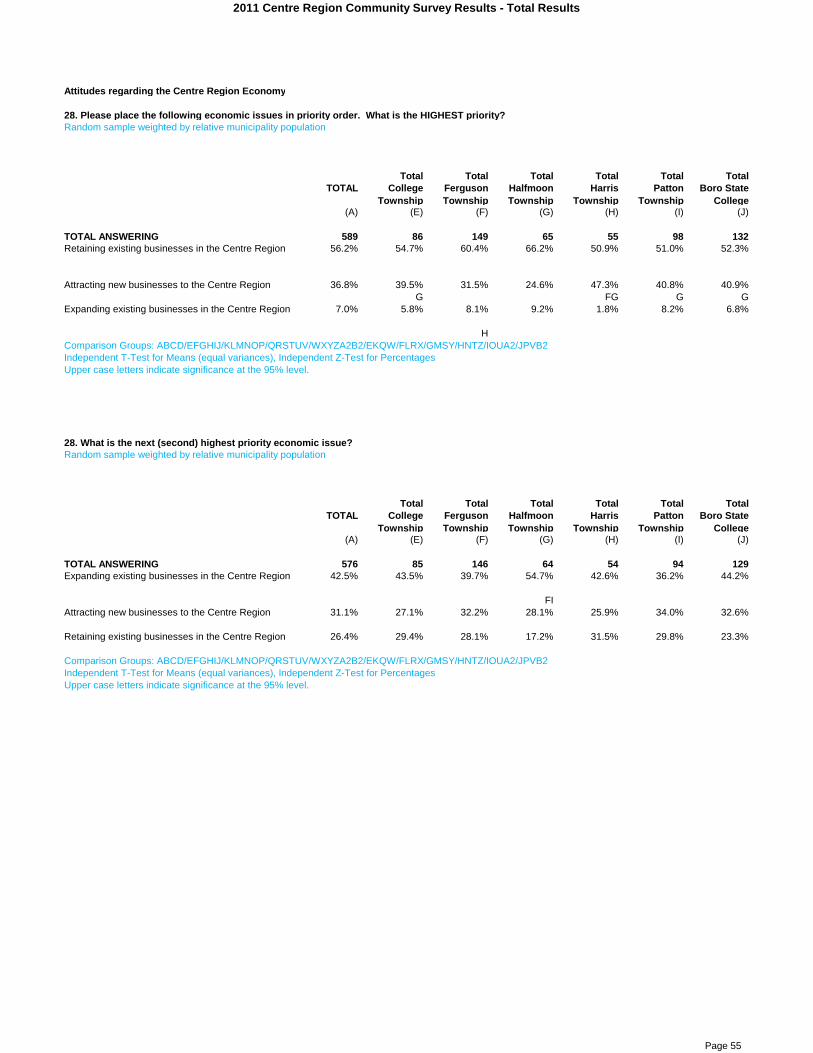
2011 Centre Region Community Survey Results - Total Results
Attitudes regarding the Centre Region Economy
28. Please place the following economic issues in priority order. What is the HIGHEST priority?Random sample weighted by relative municipality population
Total Total Total Total Total Total
TOTAL College Township
Ferguson Township
Halfmoon Township
Harris Township
Patton Township
Boro State College
(A) (E) (F) (G) (H) (I) (J)
TOTAL ANSWERING 589 86 149 65 55 98 132Retaining existing businesses in the Centre Region 56.2% 54.7% 60.4% 66.2% 50.9% 51.0% 52.3%
Attracting new businesses to the Centre Region 36.8% 39.5% 31.5% 24.6% 47.3% 40.8% 40.9%G FG G G
Expanding existing businesses in the Centre Region 7.0% 5.8% 8.1% 9.2% 1.8% 8.2% 6.8%
HComparison Groups: ABCD/EFGHIJ/KLMNOP/QRSTUV/WXYZA2B2/EKQW/FLRX/GMSY/HNTZ/IOUA2/JPVB2Independent T-Test for Means (equal variances), Independent Z-Test for PercentagesUpper case letters indicate significance at the 95% level.
28. What is the next (second) highest priority economic issue?Random sample weighted by relative municipality population
Total Total Total Total Total Total
TOTAL College Township
Ferguson Township
Halfmoon Township
Harris Township
Patton Township
Boro State College
(A) (E) (F) (G) (H) (I) (J)
TOTAL ANSWERING 576 85 146 64 54 94 129Expanding existing businesses in the Centre Region 42.5% 43.5% 39.7% 54.7% 42.6% 36.2% 44.2%
FIAttracting new businesses to the Centre Region 31.1% 27.1% 32.2% 28.1% 25.9% 34.0% 32.6%
Retaining existing businesses in the Centre Region 26.4% 29.4% 28.1% 17.2% 31.5% 29.8% 23.3%
Comparison Groups: ABCD/EFGHIJ/KLMNOP/QRSTUV/WXYZA2B2/EKQW/FLRX/GMSY/HNTZ/IOUA2/JPVB2Independent T-Test for Means (equal variances), Independent Z-Test for PercentagesUpper case letters indicate significance at the 95% level.
Page 55

2011 Centre Region Community Survey Results - Total Results
28. LOWEST (third) priority economic issueRandom sample weighted by relative municipality population
Total Total Total Total Total Total
TOTAL College Township
Ferguson Township
Halfmoon Township
Harris Township
Patton Township
Boro State College
(A) (E) (F) (G) (H) (I) (J)
TOTAL ANSWERING 576 85 146 64 54 94 129Expanding existing businesses in the Centre Region 50.3% 50.6% 52.1% 35.9% 55.6% 55.3% 48.8%
G G GAttracting new businesses to the Centre Region 31.9% 32.9% 35.6% 46.9% 25.9% 24.5% 27.9%
HIJRetaining existing businesses in the Centre Region 17.7% 16.5% 12.3% 17.2% 18.5% 20.2% 23.3%
FComparison Groups: ABCD/EFGHIJ/KLMNOP/QRSTUV/WXYZA2B2/EKQW/FLRX/GMSY/HNTZ/IOUA2/JPVB2Independent T-Test for Means (equal variances), Independent Z-Test for PercentagesUpper case letters indicate significance at the 95% level.
Page 56
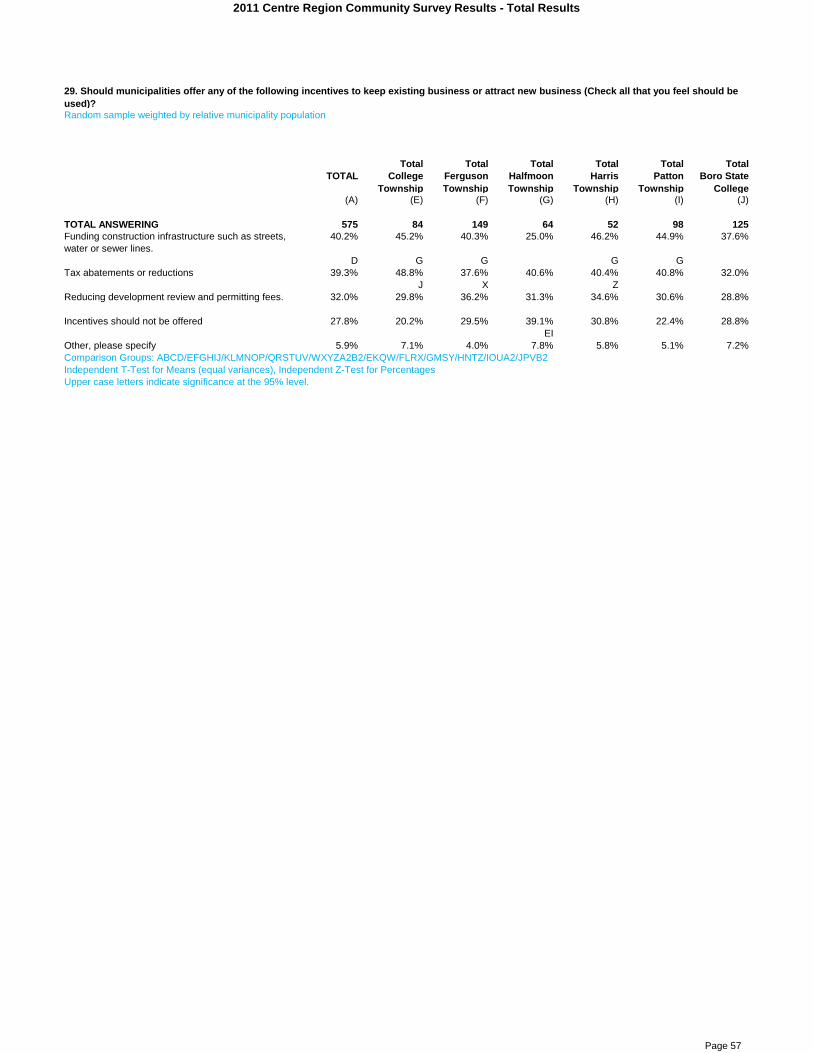
2011 Centre Region Community Survey Results - Total Results
Random sample weighted by relative municipality population
Total Total Total Total Total Total
TOTAL College Township
Ferguson Township
Halfmoon Township
Harris Township
Patton Township
Boro State College
(A) (E) (F) (G) (H) (I) (J)
TOTAL ANSWERING 575 84 149 64 52 98 125Funding construction infrastructure such as streets, water or sewer lines.
40.2% 45.2% 40.3% 25.0% 46.2% 44.9% 37.6%
D G G G GTax abatements or reductions 39.3% 48.8% 37.6% 40.6% 40.4% 40.8% 32.0%
J X ZReducing development review and permitting fees. 32.0% 29.8% 36.2% 31.3% 34.6% 30.6% 28.8%
Incentives should not be offered 27.8% 20.2% 29.5% 39.1% 30.8% 22.4% 28.8%EI
Other, please specify 5.9% 7.1% 4.0% 7.8% 5.8% 5.1% 7.2%Comparison Groups: ABCD/EFGHIJ/KLMNOP/QRSTUV/WXYZA2B2/EKQW/FLRX/GMSY/HNTZ/IOUA2/JPVB2Independent T-Test for Means (equal variances), Independent Z-Test for PercentagesUpper case letters indicate significance at the 95% level.
29. Should municipalities offer any of the following incentives to keep existing business or attract new business (Check all that you feel should be used)?
Page 57

2011 Centre Region Community Survey Results - Total Results
30. How important is it to offer the following economic development strategies in the Centre Region? First, which strategy is the MOST important?Random sample weighted by relative municipality population
Total Total Total Total Total Total
TOTAL College Township
Ferguson Township
Halfmoon Township
Harris Township
Patton Township
Boro State College
(A) (E) (F) (G) (H) (I) (J)
TOTAL ANSWERING 582 84 149 66 54 101 125Support local food, direct-farm marketing, “Buy Fresh Buy Local”
26.8% 28.6% 22.8% 31.8% 38.9% 22.8% 24.8%
FIAttract more high-tech jobs 22.7% 23.8% 24.2% 16.7% 13.0% 21.8% 28.8%
GHSupport natural and cultural resource-based tourism (hiking, biking, birding, arts)
13.9% 9.5% 12.8% 13.6% 16.7% 16.8% 15.2%
Continue to ensure infrastructure is built and maintained to serve existing businesses
12.0% 10.7% 14.1% 10.6% 9.3% 9.9% 13.6%
Attract more manufacturing jobs 7.4% 8.3% 9.4% 6.1% 7.4% 10.9% 2.4%J J
Attract more research office opportunities 3.6% 2.4% 4.0% 4.5% 1.9% 3.0% 4.8%
Support recreational-based activities and tourism (sports)
3.4% 4.8% 3.4% 3.0% 3.7% 3.0% 3.2%
Attract more retail and service jobs 1.9% 1.2% 2.0% 4.5% 1.9% 2.0% 0.8%Other, please specify 1.2% - 0.7% - 3.7% 3.0% 0.8%No specific economic development strategies are needed
7.0% 10.7% 6.7% 9.1% 3.7% 6.9% 5.6%
Comparison Groups: ABCD/EFGHIJ/KLMNOP/QRSTUV/WXYZA2B2/EKQW/FLRX/GMSY/HNTZ/IOUA2/JPVB2Independent T-Test for Means (equal variances), Independent Z-Test for PercentagesUpper case letters indicate significance at the 95% level.
Random sample weighted by relative municipality population
Total Total Total Total Total Total
TOTAL College Township
Ferguson Township
Halfmoon Township
Harris Township
Patton Township
Boro State College
(A) (E) (F) (G) (H) (I) (J)
TOTAL ANSWERING 532 73 135 60 51 93 117Support natural and cultural resource-based tourism (hiking, biking, birding, arts)
16.5% 17.8% 13.3% 18.3% 15.7% 12.9% 22.2%
Attract more high-tech jobs 15.4% 12.3% 12.6% 18.3% 9.8% 20.4% 16.2%Continue to ensure infrastructure is built and maintained to serve existing businesses
14.8% 16.4% 17.0% 21.7% 11.8% 12.9% 11.1%
Support local food, direct-farm marketing, “Buy Fresh Buy Local”
14.3% 12.3% 14.8% 11.7% 11.8% 16.1% 15.4%
Attract more manufacturing jobs 13.0% 19.2% 12.6% 6.7% 17.6% 11.8% 12.0%D G
Attract more research office opportunities 11.5% 8.2% 14.8% 10.0% 15.7% 7.5% 12.0%
Support recreational-based activities and tourism (sports)
10.5% 6.8% 10.4% 11.7% 15.7% 12.9% 8.5%
Attract more retail and service jobs 3.0% 4.1% 4.4% 1.7% 2.0% 3.2% 1.7%Other, please specify 0.9% 2.7% - - - 2.2% 0.9%Comparison Groups: ABCD/EFGHIJ/KLMNOP/QRSTUV/WXYZA2B2/EKQW/FLRX/GMSY/HNTZ/IOUA2/JPVB2Independent T-Test for Means (equal variances), Independent Z-Test for PercentagesUpper case letters indicate significance at the 95% level.
30. How important is it to offer the following economic development strategies in the Centre Region? Of the remaining options, which is next (second) most important?
Page 58

2011 Centre Region Community Survey Results - Total Results
30. How important is it to offer the following economic development strategies in the Centre Region? Which initiative is next (third) most Random sample weighted by relative municipality population
Total Total Total Total Total Total
TOTAL College Township
Ferguson Township
Halfmoon Township
Harris Township
Patton Township
Boro State College
(A) (E) (F) (G) (H) (I) (J)
TOTAL ANSWERING 514 69 133 58 51 90 110Continue to ensure infrastructure is built and maintained to serve existing businesses
23.0% 14.5% 23.3% 24.1% 23.5% 23.3% 25.5%
Support local food, direct-farm marketing, “Buy Fresh Buy Local”
13.2% 8.7% 18.0% 12.1% 9.8% 10.0% 15.5%
ESupport recreational-based activities and tourism (sports)
12.5% 14.5% 9.8% 13.8% 7.8% 14.4% 14.5%
Support natural and cultural resource-based tourism (hiking, biking, birding, arts)
11.9% 8.7% 13.5% 13.8% 15.7% 7.8% 12.7%
Attract more research office opportunities 11.7% 14.5% 8.3% 12.1% 3.9% 17.8% 11.8%H FH
Attract more high-tech jobs 11.5% 20.3% 9.8% 8.6% 23.5% 10.0% 5.5%D J FGIJ
Attract more manufacturing jobs 10.5% 13.0% 11.3% 13.8% 11.8% 8.9% 7.3%Attract more retail and service jobs 4.9% 5.8% 6.0% 1.7% 2.0% 5.6% 5.5%Other, please specify 1.0% - - - 2.0% 2.2% 1.8%Comparison Groups: ABCD/EFGHIJ/KLMNOP/QRSTUV/WXYZA2B2/EKQW/FLRX/GMSY/HNTZ/IOUA2/JPVB2Independent T-Test for Means (equal variances), Independent Z-Test for PercentagesUpper case letters indicate significance at the 95% level.
30. How important is it to offer the following economic development strategies in the Centre Region? Which is next (fourth) most important?Random sample weighted by relative municipality population
Total Total Total Total Total Total
TOTAL College Township
Ferguson Township
Halfmoon Township
Harris Township
Patton Township
Boro State College
(A) (E) (F) (G) (H) (I) (J)
TOTAL ANSWERING 481 63 123 55 49 86 102Continue to ensure infrastructure is built and maintained to serve existing businesses
26.4% 30.2% 26.0% 38.2% 26.5% 27.9% 16.7%
J JAttract more research office opportunities 13.3% 14.3% 10.6% 14.5% 10.2% 10.5% 19.6%Support natural and cultural resource-based tourism (hiking, biking, birding, arts)
11.9% 9.5% 15.4% 9.1% 10.2% 11.6% 10.8%
Support recreational-based activities and tourism (sports)
11.2% 9.5% 14.6% 9.1% 12.2% 7.0% 12.7%
Attract more high-tech jobs 11.0% 11.1% 10.6% 7.3% 12.2% 11.6% 12.7%Support local food, direct-farm marketing, “Buy Fresh Buy Local”
10.4% 7.9% 7.3% 12.7% 14.3% 11.6% 11.8%
Attract more retail and service jobs 9.1% 9.5% 10.6% 1.8% 14.3% 9.3% 8.8%G G G G
Attract more manufacturing jobs 6.2% 7.9% 4.1% 7.3% - 9.3% 6.9%Other, please specify 0.4% - 0.8% - - 1.2% -Comparison Groups: ABCD/EFGHIJ/KLMNOP/QRSTUV/WXYZA2B2/EKQW/FLRX/GMSY/HNTZ/IOUA2/JPVB2Independent T-Test for Means (equal variances), Independent Z-Test for PercentagesUpper case letters indicate significance at the 95% level.
Page 59

2011 Centre Region Community Survey Results - Total Results
30. How important is it to offer the following economic development strategies in the Centre Region? Which is next (fifth) most important?Random sample weighted by relative municipality population
Total Total Total Total Total Total
TOTAL College Township
Ferguson Township
Halfmoon Township
Harris Township
Patton Township
Boro State College
(A) (E) (F) (G) (H) (I) (J)
TOTAL ANSWERING 449 60 117 53 44 78 94Continue to ensure infrastructure is built and maintained to serve existing businesses
26.1% 20.0% 33.3% 37.7% 20.5% 20.5% 21.3%
EIJ EIJSupport recreational-based activities and tourism (sports)
13.4% 13.3% 14.5% 5.7% 18.2% 19.2% 9.6%
D GAttract more research office opportunities 12.0% 13.3% 11.1% 15.1% 13.6% 7.7% 13.8%Attract more retail and service jobs 12.0% 15.0% 11.1% 11.3% 9.1% 11.5% 13.8%Attract more high-tech jobs 10.7% 6.7% 8.5% 11.3% 11.4% 10.3% 16.0%
B2Support natural and cultural resource-based tourism (hiking, biking, birding, arts)
8.2% 6.7% 6.0% 5.7% 11.4% 10.3% 9.6%
Support local food, direct-farm marketing, “Buy Fresh Buy Local”
8.2% 15.0% 7.7% 7.5% 9.1% 6.4% 6.4%
Attract more manufacturing jobs 7.8% 10.0% 5.1% 5.7% 6.8% 12.8% 6.4%Other, please specify 1.6% - 2.6% - - 1.3% 3.2%Comparison Groups: ABCD/EFGHIJ/KLMNOP/QRSTUV/WXYZA2B2/EKQW/FLRX/GMSY/HNTZ/IOUA2/JPVB2Independent T-Test for Means (equal variances), Independent Z-Test for PercentagesUpper case letters indicate significance at the 95% level.
Page 60

2011 Centre Region Community Survey Results - Total Results
Attitudes about Local Government and Resident Communication
Random sample weighted by relative municipality population
Total Total Total Total Total Total
TOTAL College Township
Ferguson Township
Halfmoon Township
Harris Township
Patton Township
Boro State College
(A) (E) (F) (G) (H) (I) (J)
TOTAL ANSWERING 599 88 153 66 55 102 132Township Newsletter 55.9% 60.2% 68.0% 63.6% 78.2% 55.9% 25.8%
J J J EIJ JRead it in the Centre Daily Times 51.8% 53.4% 52.9% 47.0% 49.1% 49.0% 55.3%
Email 37.4% 29.5% 29.4% 59.1% 27.3% 40.2% 43.2%MSEFHIJ EFH
Inserts in utility bills, refuse bills or US Mail 32.7% 40.9% 37.3% 15.2% 32.7% 31.4% 31.1%D G G G G G
View Centre Region web page 32.4% 31.8% 28.1% 27.3% 30.9% 42.2% 33.3%FG
View municipal web page on my own 30.1% 30.7% 26.1% 28.8% 23.6% 32.4% 35.6%Social media (Facebook, Twitter, blogs) 13.9% 15.9% 9.2% 9.1% 7.3% 17.6% 20.5%
H FGHRead it in The Daily Collegian 7.5% 3.4% 4.6% 3.0% 12.7% 2.9% 17.4%
I EFGIComparison Groups: ABCD/EFGHIJ/KLMNOP/QRSTUV/WXYZA2B2/EKQW/FLRX/GMSY/HNTZ/IOUA2/JPVB2Independent T-Test for Means (equal variances), Independent Z-Test for PercentagesUpper case letters indicate significance at the 95% level.
31. Choose the 3 ways you would prefer to receive information regarding community meetings, community issues, or community events (Please check only 3).
Page 61

2011 Centre Region Community Survey Results - Total Results
Demographic Information
32. Demographic Information Please select the municipality where you currently live.Random sample weighted by relative municipality population
Total Total Total Total Total Total
TOTAL College Township
Ferguson Township
Halfmoon Township
Harris Township
Patton Township
Boro State College
(A) (E) (F) (G) (H) (I) (J)
TOTAL ANSWERING 611 89 154 67 55 102 133Ferguson Township 25.2% - 100.0% - - - -
DBorough of State College 21.8% - - - - - 100.0%
Patton Township 16.7% - - - - 100.0% -
College Township 14.6% 100.0% - - - - -D
Halfmoon Township 11.0% - - 100.0% - - -BC
Harris Township 9.0% - - - 100.0% - -Other 11 - - - - - -
1.8%Comparison Groups: ABCD/EFGHIJ/KLMNOP/QRSTUV/WXYZA2B2/EKQW/FLRX/GMSY/HNTZ/IOUA2/JPVB2Independent T-Test for Means (equal variances), Independent Z-Test for PercentagesUpper case letters indicate significance at the 95% level.
33. Please select the number of years you have lived in any of the six municipalities in the previous question.Random sample weighted by relative municipality population
Total Total Total Total Total Total
TOTAL College Township
Ferguson Township
Halfmoon Township
Harris Township
Patton Township
Boro State College
(A) (E) (F) (G) (H) (I) (J)
TOTAL ANSWERING 600 88 154 67 55 102 1321 year or less 3.3% 1.1% 2.6% - 5.5% 2.9% 6.1%
E2 to 5 years 16.8% 13.6% 20.1% 7.5% 7.3% 23.5% 18.9%
GH GH GH6 to 10 years 16.3% 18.2% 13.0% 16.4% 7.3% 23.5% 16.7%
H FH H11 to 15 years 12.3% 10.2% 13.6% 22.4% 10.9% 11.8% 8.3%
EJ16 to 20 years 9.5% 8.0% 10.4% 14.9% 7.3% 8.8% 8.3%Over 20 years 41.7% 48.9% 40.3% 38.8% 61.8% 29.4% 41.7%
I FGIJ IComparison Groups: ABCD/EFGHIJ/KLMNOP/QRSTUV/WXYZA2B2/EKQW/FLRX/GMSY/HNTZ/IOUA2/JPVB2Independent T-Test for Means (equal variances), Independent Z-Test for PercentagesUpper case letters indicate significance at the 95% level.
Page 62

2011 Centre Region Community Survey Results - Total Results
34. Are you employed?Random sample weighted by relative municipality population
Total Total Total Total Total Total
TOTAL College Township
Ferguson Township
Halfmoon Township
Harris Township
Patton Township
Boro State College
(A) (E) (F) (G) (H) (I) (J)
TOTAL ANSWERING 595 87 152 67 55 101 131Yes 72.8% 66.7% 72.4% 85.1% 74.5% 73.3% 69.5%
EFJNo 27.2% 33.3% 27.6% 14.9% 25.5% 26.7% 30.5%
G G GComparison Groups: ABCD/EFGHIJ/KLMNOP/QRSTUV/WXYZA2B2/EKQW/FLRX/GMSY/HNTZ/IOUA2/JPVB2Independent T-Test for Means (equal variances), Independent Z-Test for PercentagesUpper case letters indicate significance at the 95% level.
35. Please select the municipality in which your job is located.Random sample weighted by relative municipality population
Total Total Total Total Total Total
TOTAL College Township
Ferguson Township
Halfmoon Township
Harris Township
Patton Township
Boro State College
(A) (E) (F) (G) (H) (I) (J)
TOTAL ANSWERING 426 58 107 57 40 72 90State College Borough 40.8% 31.0% 34.6% 35.1% 27.5% 37.5% 67.8%
X EFGHICollege Township 16.7% 31.0% 17.8% 10.5% 15.0% 12.5% 12.2%
GIJFerguson Township 16.0% 15.5% 25.2% 12.3% 12.5% 19.4% 6.7%
GJ JPatton Township 6.3% 3.4% 3.7% 5.3% 5.0% 16.7% 4.4%
EFGHJBenner Township 1.9% 3.4% 0.9% 1.8% - 1.4% 3.3%Harris Township 1.9% - 1.9% 1.8% 10.0% 1.4% -Bellefonte Borough 1.6% 1.7% - - 10.0% 1.4% 1.1%Halfmoon Township 1.6% - - 12.3% - - -Spring Township 0.2% - - - - 1.4% -Another municipality in Centre County 2.8% 3.4% 1.9% 5.3% 5.0% 1.4% 2.2%Another municipality outside Centre County 10.1% 10.3% 14.0% 15.8% 15.0% 6.9% 2.2%
J J JComparison Groups: ABCD/EFGHIJ/KLMNOP/QRSTUV/WXYZA2B2/EKQW/FLRX/GMSY/HNTZ/IOUA2/JPVB2Independent T-Test for Means (equal variances), Independent Z-Test for PercentagesUpper case letters indicate significance at the 95% level.
Page 63
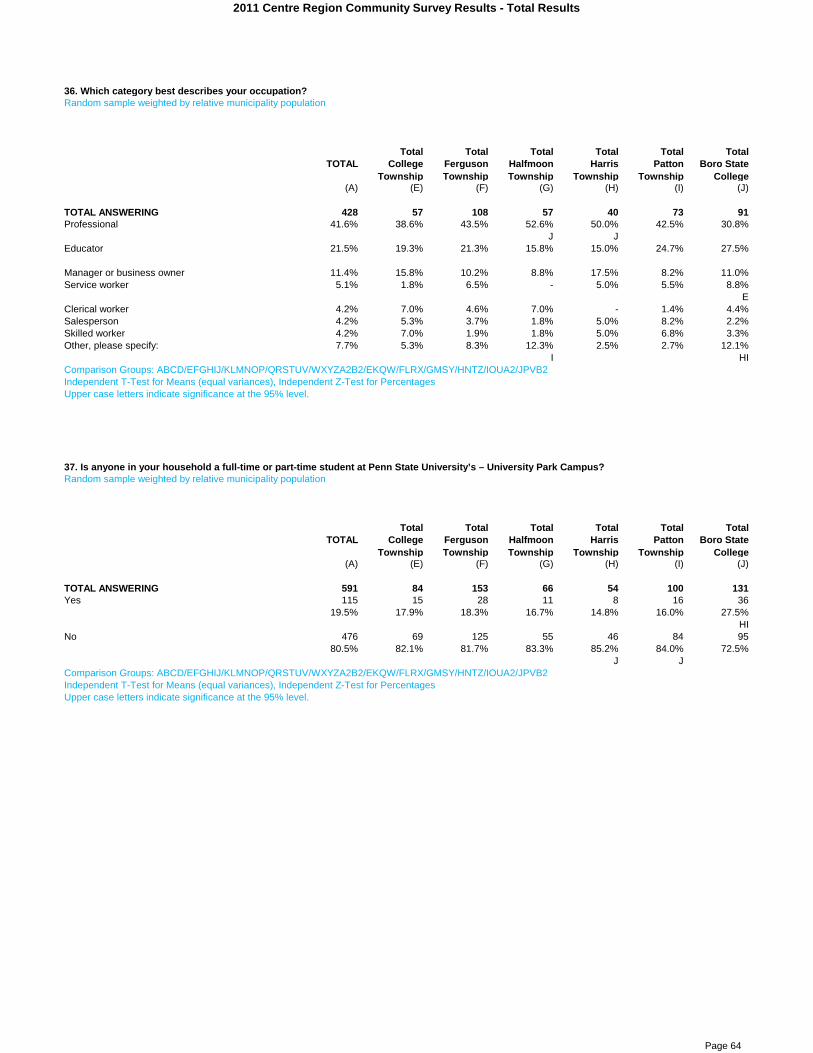
2011 Centre Region Community Survey Results - Total Results
36. Which category best describes your occupation?Random sample weighted by relative municipality population
Total Total Total Total Total Total
TOTAL College Township
Ferguson Township
Halfmoon Township
Harris Township
Patton Township
Boro State College
(A) (E) (F) (G) (H) (I) (J)
TOTAL ANSWERING 428 57 108 57 40 73 91Professional 41.6% 38.6% 43.5% 52.6% 50.0% 42.5% 30.8%
J JEducator 21.5% 19.3% 21.3% 15.8% 15.0% 24.7% 27.5%
Manager or business owner 11.4% 15.8% 10.2% 8.8% 17.5% 8.2% 11.0%Service worker 5.1% 1.8% 6.5% - 5.0% 5.5% 8.8%
EClerical worker 4.2% 7.0% 4.6% 7.0% - 1.4% 4.4%Salesperson 4.2% 5.3% 3.7% 1.8% 5.0% 8.2% 2.2%Skilled worker 4.2% 7.0% 1.9% 1.8% 5.0% 6.8% 3.3%Other, please specify: 7.7% 5.3% 8.3% 12.3% 2.5% 2.7% 12.1%
I HIComparison Groups: ABCD/EFGHIJ/KLMNOP/QRSTUV/WXYZA2B2/EKQW/FLRX/GMSY/HNTZ/IOUA2/JPVB2Independent T-Test for Means (equal variances), Independent Z-Test for PercentagesUpper case letters indicate significance at the 95% level.
37. Is anyone in your household a full-time or part-time student at Penn State University’s – University Park Campus?Random sample weighted by relative municipality population
Total Total Total Total Total Total
TOTAL College Township
Ferguson Township
Halfmoon Township
Harris Township
Patton Township
Boro State College
(A) (E) (F) (G) (H) (I) (J)
TOTAL ANSWERING 591 84 153 66 54 100 131Yes 115 15 28 11 8 16 36
19.5% 17.9% 18.3% 16.7% 14.8% 16.0% 27.5%HI
No 476 69 125 55 46 84 9580.5% 82.1% 81.7% 83.3% 85.2% 84.0% 72.5%
J JComparison Groups: ABCD/EFGHIJ/KLMNOP/QRSTUV/WXYZA2B2/EKQW/FLRX/GMSY/HNTZ/IOUA2/JPVB2Independent T-Test for Means (equal variances), Independent Z-Test for PercentagesUpper case letters indicate significance at the 95% level.
Page 64

2011 Centre Region Community Survey Results - Total Results
38. Please check the one box that most closely describes the type of housing unit you live in.Random sample weighted by relative municipality population
Total Total Total Total Total Total
TOTAL College Township
Ferguson Township
Halfmoon Township
Harris Township
Patton Township
Boro State College
(A) (E) (F) (G) (H) (I) (J)
TOTAL ANSWERING 602 88 154 67 55 102 133A detached single family home 72.9% 70.5% 77.9% 95.5% 85.5% 63.7% 58.6%
IJ EFIJ EIJTownhouse 9.8% 9.1% 9.1% - 7.3% 19.6% 9.8%
EFHJAn apartment in an apartment complex 9.6% 8.0% 4.5% 1.5% 1.8% 13.7% 21.1%
G FGH EFGHA duplex 3.2% 3.4% 5.2% - 1.8% 2.0% 3.8%An apartment in a single family home 1.5% 2.3% - - - - 5.3%
A mobile home 0.8% - 0.6% 3.0% 1.8% 1.0% -Other 2.2% 6.8% 2.6% - 1.8% - 1.5%
Comparison Groups: ABCD/EFGHIJ/KLMNOP/QRSTUV/WXYZA2B2/EKQW/FLRX/GMSY/HNTZ/IOUA2/JPVB2Independent T-Test for Means (equal variances), Independent Z-Test for PercentagesUpper case letters indicate significance at the 95% level.
39. Do you rent or own your residence?Random sample weighted by relative municipality population
Total Total Total Total Total Total
TOTAL College Township
Ferguson Township
Halfmoon Township
Harris Township
Patton Township
Boro State College
(A) (E) (F) (G) (H) (I) (J)
TOTAL ANSWERING 601 87 152 67 55 102 133Rent 20.8% 18.4% 15.1% 3.0% 14.5% 24.5% 37.6%
G G G G EFGHIOwn 79.2% 81.6% 84.9% 97.0% 85.5% 75.5% 62.4%
J J EFHIJ J JComparison Groups: ABCD/EFGHIJ/KLMNOP/QRSTUV/WXYZA2B2/EKQW/FLRX/GMSY/HNTZ/IOUA2/JPVB2Independent T-Test for Means (equal variances), Independent Z-Test for PercentagesUpper case letters indicate significance at the 95% level.
Page 65

2011 Centre Region Community Survey Results - Total Results
40. About how much was the gross income for your household in 2010? (Include all persons in the household for which a tax return was filed)Random sample weighted by relative municipality population
Total Total Total Total Total Total
TOTAL College Township
Ferguson Township
Halfmoon Township
Harris Township
Patton Township
Boro State College
(A) (E) (F) (G) (H) (I) (J)
TOTAL ANSWERING 562 81 141 62 52 96 126Less than $10,000 2.3% 4.9% - - - - 7.1%$10,000 to $14,999 2.1% 3.7% 0.7% - 5.8% 2.1% 1.6%$15,000 to $24,999 5.0% 3.7% 5.0% - 1.9% 6.3% 7.9%$25,000 to $34,999 7.7% 6.2% 6.4% 3.2% 5.8% 4.2% 15.9%
EFGHI$35,000 to $49,999 10.0% 16.0% 11.3% 6.5% 3.8% 7.3% 11.1%
H H$50,000 to $74,999 19.0% 13.6% 22.0% 16.1% 11.5% 28.1% 17.5%
EH$75,000 to $99,999 17.6% 17.3% 16.3% 21.0% 26.9% 17.7% 13.5%$100,000 to $149,999 23.5% 17.3% 27.0% 43.5% 25.0% 17.7% 18.3%
EFHIJ$150,000 to $199,999 6.6% 8.6% 5.7% 8.1% 5.8% 7.3% 5.6%$200,000 or more 6.2% 8.6% 5.7% 1.6% 13.5% 9.4% 1.6%
GJ GJ GJComparison Groups: ABCD/EFGHIJ/KLMNOP/QRSTUV/WXYZA2B2/EKQW/FLRX/GMSY/HNTZ/IOUA2/JPVB2Independent T-Test for Means (equal variances), Independent Z-Test for PercentagesUpper case letters indicate significance at the 95% level.
41. My age group is...Random sample weighted by relative municipality population
Total Total Total Total Total Total
TOTAL College Township
Ferguson Township
Halfmoon Township
Harris Township
Patton Township
Boro State College
(A) (E) (F) (G) (H) (I) (J)
TOTAL ANSWERING 591 87 150 66 53 98 13218 - 24 4.6% 4.6% 1.3% - - 7.1% 9.8%
F F25 - 34 14.0% 8.0% 12.7% 3.0% 11.3% 16.3% 24.2%
G G EFGH35 - 44 14.2% 11.5% 14.7% 22.7% 11.3% 18.4% 9.8%
J45 - 59 34.5% 31.0% 37.3% 51.5% 39.6% 30.6% 25.8%
J EIJ Z60 - 64 11.5% 18.4% 10.0% 9.1% 15.1% 11.2% 9.1%
65 + 21.2% 26.4% 24.0% 13.6% 22.6% 16.3% 21.2%D G
Comparison Groups: ABCD/EFGHIJ/KLMNOP/QRSTUV/WXYZA2B2/EKQW/FLRX/GMSY/HNTZ/IOUA2/JPVB2Independent T-Test for Means (equal variances), Independent Z-Test for PercentagesUpper case letters indicate significance at the 95% level.
Page 66

2011 Centre Region Community Survey Results - Total Results
42. What is the highest level of education you have completed?Random sample weighted by relative municipality population
Total Total Total Total Total Total
TOTAL College Township
Ferguson Township
Halfmoon Township
Harris Township
Patton Township
Boro State College
(A) (E) (F) (G) (H) (I) (J)
TOTAL ANSWERING 593 88 150 66 55 99 1310-11 years, no diploma 0.2% - - - 1.8% - -High school graduate 6.4% 10.2% 6.0% 10.6% 9.1% 3.0% 3.8%
ISome college, no degree 10.3% 19.3% 11.3% 10.6% 7.3% 8.1% 6.1%
HIJAssociate Degree 5.7% 8.0% 7.3% 4.5% 5.5% 2.0% 4.6%
IBachelor's Degree 33.7% 33.0% 30.0% 33.3% 36.4% 37.4% 35.9%Master's Degree 27.0% 13.6% 27.3% 33.3% 16.4% 33.3% 32.1%
E EH EH EHDoctorate Degree 16.7% 15.9% 18.0% 7.6% 23.6% 16.2% 17.6%
XG G GComparison Groups: ABCD/EFGHIJ/KLMNOP/QRSTUV/WXYZA2B2/EKQW/FLRX/GMSY/HNTZ/IOUA2/JPVB2Independent T-Test for Means (equal variances), Independent Z-Test for PercentagesUpper case letters indicate significance at the 95% level.
43. What is your gender?Random sample weighted by relative municipality population
Total Total Total Total Total Total
TOTAL College Township
Ferguson Township
Halfmoon Township
Harris Township
Patton Township
Boro State College
(A) (E) (F) (G) (H) (I) (J)
TOTAL ANSWERING 592 88 150 66 55 96 132Male 54.9% 48.9% 56.7% 47.0% 70.9% 58.3% 52.3%
EGJFemale 45.1% 51.1% 43.3% 53.0% 29.1% 41.7% 47.7%
H H HComparison Groups: ABCD/EFGHIJ/KLMNOP/QRSTUV/WXYZA2B2/EKQW/FLRX/GMSY/HNTZ/IOUA2/JPVB2Independent T-Test for Means (equal variances), Independent Z-Test for PercentagesUpper case letters indicate significance at the 95% level.
Page 67
Centre Region Comprehensive Plan Survey
Appendix D – Weighted Random Sample Results Centre Regional Planning Agency | January 2012
APPENDIX D
WEIGHTED RANDOM SAMPLE RESULTS
BACKGROUND
The consultant weighted the random sample in this Appendix to compensate for a low return rate from
the Borough of State College in an effort to compare with the random sample (unweighted) results.
The Borough was not oversampled to compensate for the number of students living in the Borough;
therefore, the percentage of surveys returned was much lower than for other municipalities. The
weighted results did not have statistically significant differences with the random sample. After this
test, and in consultation with IntelliQ, the CPRA elected to use the results of the unweighted random
sample to analyze the results.
READING THE RESULTS
The results for all responses are included in the column labeled “Random Sample.” This column is the
sum of all municipal results and is the data used in the analysis for this report. Results for individual
municipalities are labeled and displayed in the columns to the right of the “Random Sample” column.
Statistically Significant Response Rates: The consultant performed cross tabulations by
municipality to determine if there was a statistically significant difference in response rates
by municipality for individual questions. For example, for question 1 on page 3, the response
“Improving personal security and public safety” was statistically higher in College, Ferguson,
Harris and Patton Townships than it was in Halfmoon Township. The response in State College
Borough was statistically higher than the response rate in Halfmoon and Ferguson Townships.
The “upper case letters” below the response rate refer to the individual municipalities and are
associated with the response immediately above the “upper case letters.” All results indicate
significant at the 95% level, meaning if the same question were asked of all members of the
municipality, 95% would answer the same. See the example on page 3.
Questions that require a variety of choices be ranked (most important, second most important,
third most important, etc): There are a number of questions in the survey that require a
respondent to rank a variety of choices, most important, second most important, third most
important, etc. Question 25 on page 50 is an example of this type of question. These questions
may be reported two ways. The first way of reporting the question indicates the percentage
of respondents selecting the choices as most important, second most important, third most
important, etc. When the columns are totaled vertically, they will add to 100%. For example,
for question 25 on page 50, 7.1% of respondents ranked “air quality” as the most important
issue, while 3.7% ranked “refuse management and recycling programs” as the most important
issue.

Centre Region Comprehensive Plan Survey
Appendix D – Weighted Random Sample Results Centre Regional Planning Agency | January 2012
Another way of reporting these questions is to sum the percentage of respondents ranking an issue in
the top five. For example, 91% of all respondents rank “protect drinking water quality” in the top five
environmental issues from all potential choices. This reporting is completed by summing the percentage
of respondents who ranked the issue as most important (41.1%), plus second most important (21.2%),
plus third most important (14.1%), plus fourth most important (7.5%), plus fifth most important (6.8%),
the sum of which equals 92%.

2011 Centre Region Community Survey Results - Weighted Random Sample
Random sample weighted by relative municipality population
WEIGHTED
WEIGHTED
WEIGHTED
WEIGHTED
WEIGHTED
WEIGHTED
WEIGHTED
Random Sample
Random Sample
Random Sample
Random Sample
Random Sample
Random Sample
Random Sample
College Township
Ferguson Township
Halfmoon Township
Harris Township
Patton Township
Boro State College
(C) (K) (L) (M) (N) (O) (P)
TOTAL ANSWERING 461 55 100 14 32 82 178Mail 64.8% 67.9% 63.3% 56.5% 64.3% 52.9% 71.0%
A O G JOWeb Sample 35.2% 32.1% 36.7% 43.5% 35.7% 47.1% 29.0%
A G KPWeb Drop-in - - - - - - -
Comparison Groups: ABCD/EFGHIJ/KLMNOP/QRSTUV/WXYZA2B2/EKQW/FLRX/GMSY/HNTZ/IOUA2/JPVB2Independent T-Test for Means (equal variances), Independent Z-Test for PercentagesUpper case letters indicate significance at the 95% level.
ModeRandom sample weighted by relative municipality population
WEIGHTED
WEIGHTED
WEIGHTED
WEIGHTED
WEIGHTED
WEIGHTED
WEIGHTED
Random Sample
Random Sample
Random Sample
Random Sample
Random Sample
Random Sample
Random Sample
College Township
Ferguson Township
Halfmoon Township
Harris Township
Patton Township
Boro State College
(C) (K) (L) (M) (N) (O) (P)
TOTAL ANSWERING 461 55 100 14 32 82 178Random Sample 100.0% 100.0% 100.0% 100.0% 100.0% 100.0% 100.0%
A E F G H I JDrop-Ins - - - - - - -
Comparison Groups: ABCD/EFGHIJ/KLMNOP/QRSTUV/WXYZA2B2/EKQW/FLRX/GMSY/HNTZ/IOUA2/JPVB2Independent T-Test for Means (equal variances), Independent Z-Test for PercentagesUpper case letters indicate significance at the 95% level.
Page 1

2011 Centre Region Community Survey Results - Weighted Random Sample
Attitudes about Land Use and Development in the Centre Region
Random sample weighted by relative municipality population
WEIGHTED
WEIGHTED
WEIGHTED
WEIGHTED
WEIGHTED
WEIGHTED
WEIGHTED
Random Sample
Random Sample
Random Sample
Random Sample
Random Sample
Random Sample
Random Sample
College Township
Ferguson Township
Halfmoon Township
Harris Township
Patton Township
Boro State College
(C) (K) (L) (M) (N) (O) (P)
TOTAL ANSWERING 450 52 98 13 31 80 176Having access to open space (parks, green belts, wooded land) near residential areas
56.0% 45.9% 55.2% 45.5% 58.5% 67.5% 54.5%
KMaintaining a low level of environmental pollution 50.7% 54.1% 49.6% 63.6% 51.2% 48.2% 50.5%Encouraging a sustainable region 38.0% 40.5% 33.6% 36.4% 24.4% 39.8% 41.4%
NProtecting neighborhoods from encroachment by non-residential land uses
30.6% 33.8% 35.2% 27.3% 34.1% 20.5% 31.3%
OBuilding and maintaining livable neighborhoods 23.4% 23.0% 20.8% 22.7% 29.3% 25.3% 23.2%
Attracting business 21.5% 28.4% 28.8% 22.7% 22.0% 19.3% 16.2%P
Improving personal security and public safety 23.8% 20.3% 26.4% 22.7% 24.4% 24.1% 23.2%B2
Expanding the variety and availability of retail goods and services
17.0% 16.2% 21.6% 22.7% 14.6% 15.7% 15.2%
Maintaining and enhancing the visual appearance of buildings and landscaping
17.7% 20.3% 14.4% 9.1% 19.5% 21.7% 17.2%
Increasing education opportunities for all age groups 15.0% 14.9% 12.8% 27.3% 17.1% 16.9% 14.1%
Other 5.1% 2.7% 3.2% - 4.9% 1.2% 9.1%O
Comparison Groups: ABCD/EFGHIJ/KLMNOP/QRSTUV/WXYZA2B2/EKQW/FLRX/GMSY/HNTZ/IOUA2/JPVB2Independent T-Test for Means (equal variances), Independent Z-Test for PercentagesUpper case letters indicate significance at the 95% level.
1. MOST IMPORTANT OBJECTIVES which could be used to guide future growth and development in the Centre Region. (Percent selected in top three most important)
Page 2
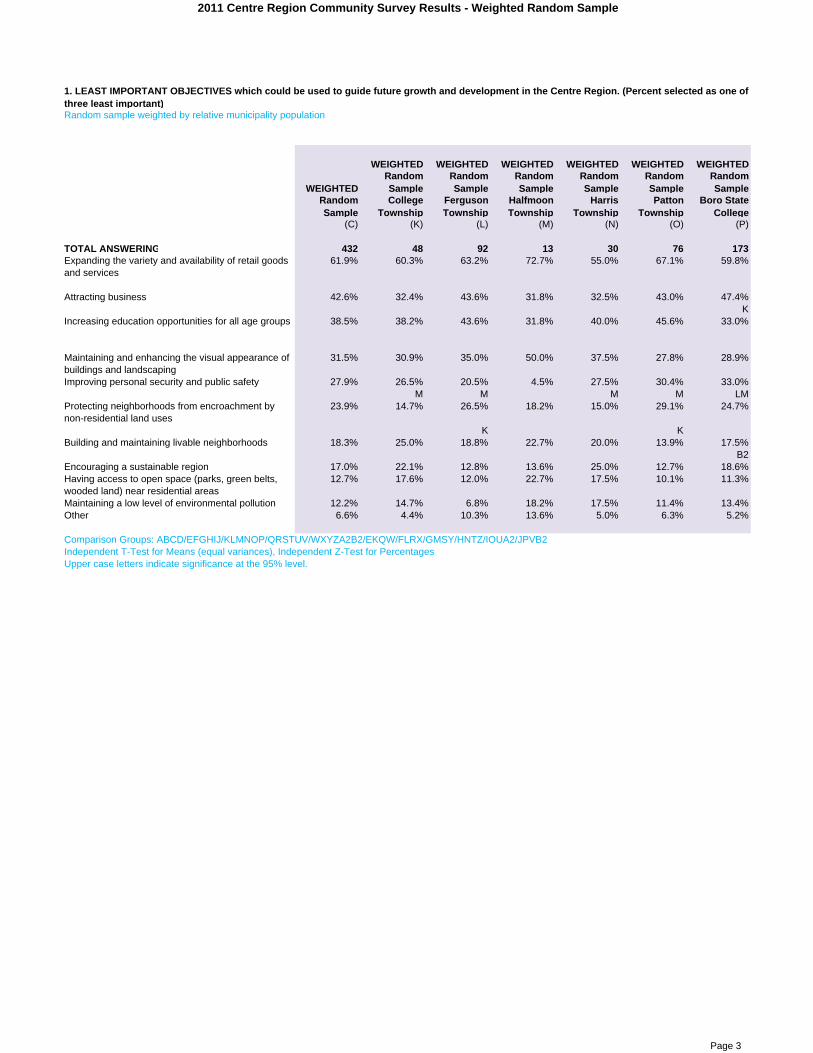
2011 Centre Region Community Survey Results - Weighted Random Sample
Random sample weighted by relative municipality population
WEIGHTED
WEIGHTED
WEIGHTED
WEIGHTED
WEIGHTED
WEIGHTED
WEIGHTED
Random Sample
Random Sample
Random Sample
Random Sample
Random Sample
Random Sample
Random Sample
College Township
Ferguson Township
Halfmoon Township
Harris Township
Patton Township
Boro State College
(C) (K) (L) (M) (N) (O) (P)
TOTAL ANSWERING 432 48 92 13 30 76 173Expanding the variety and availability of retail goods and services
61.9% 60.3% 63.2% 72.7% 55.0% 67.1% 59.8%
Attracting business 42.6% 32.4% 43.6% 31.8% 32.5% 43.0% 47.4%K
Increasing education opportunities for all age groups 38.5% 38.2% 43.6% 31.8% 40.0% 45.6% 33.0%
Maintaining and enhancing the visual appearance of buildings and landscaping
31.5% 30.9% 35.0% 50.0% 37.5% 27.8% 28.9%
Improving personal security and public safety 27.9% 26.5% 20.5% 4.5% 27.5% 30.4% 33.0%M M M M LM
Protecting neighborhoods from encroachment by non-residential land uses
23.9% 14.7% 26.5% 18.2% 15.0% 29.1% 24.7%
K KBuilding and maintaining livable neighborhoods 18.3% 25.0% 18.8% 22.7% 20.0% 13.9% 17.5%
B2Encouraging a sustainable region 17.0% 22.1% 12.8% 13.6% 25.0% 12.7% 18.6%Having access to open space (parks, green belts, wooded land) near residential areas
12.7% 17.6% 12.0% 22.7% 17.5% 10.1% 11.3%
Maintaining a low level of environmental pollution 12.2% 14.7% 6.8% 18.2% 17.5% 11.4% 13.4%Other 6.6% 4.4% 10.3% 13.6% 5.0% 6.3% 5.2%
Comparison Groups: ABCD/EFGHIJ/KLMNOP/QRSTUV/WXYZA2B2/EKQW/FLRX/GMSY/HNTZ/IOUA2/JPVB2Independent T-Test for Means (equal variances), Independent Z-Test for PercentagesUpper case letters indicate significance at the 95% level.
1. LEAST IMPORTANT OBJECTIVES which could be used to guide future growth and development in the Centre Region. (Percent selected as one of three least important)
Page 3

2011 Centre Region Community Survey Results - Weighted Random Sample
Random sample weighted by relative municipality population
WEIGHTED
WEIGHTED
WEIGHTED
WEIGHTED
WEIGHTED
WEIGHTED
WEIGHTED
Random Sample
Random Sample
Random Sample
Random Sample
Random Sample
Random Sample
Random Sample
College Township
Ferguson Township
Halfmoon Township
Harris Township
Patton Township
Boro State College
(C) (K) (L) (M) (N) (O) (P)
TOTAL ANSWERING 455 52 100 13 31 82 176High rate of population growth (An additional 32,000 residents)
3.9% 8.1% 3.1% 9.1% 2.4% 8.2% 1.0%
P PModerate rate of population growth (An additional 18,000 residents)
30.5% 28.4% 34.4% 31.8% 39.0% 28.2% 28.3%
Low rate of population growth (An additional 6,000 residents)
35.5% 25.7% 42.2% 31.8% 39.0% 32.9% 35.4%
KNo increase in population 16.0% 20.3% 10.9% 13.6% 12.2% 16.5% 18.2%
It doesn't matter to me 14.2% 17.6% 9.4% 13.6% 7.3% 14.1% 17.2%
Comparison Groups: ABCD/EFGHIJ/KLMNOP/QRSTUV/WXYZA2B2/EKQW/FLRX/GMSY/HNTZ/IOUA2/JPVB2Independent T-Test for Means (equal variances), Independent Z-Test for PercentagesUpper case letters indicate significance at the 95% level.
2. During the next 30 years what rate of population growth would you prefer for the Centre Region? Please check the population number which corresponds to your preference (Check only one).
Page 4
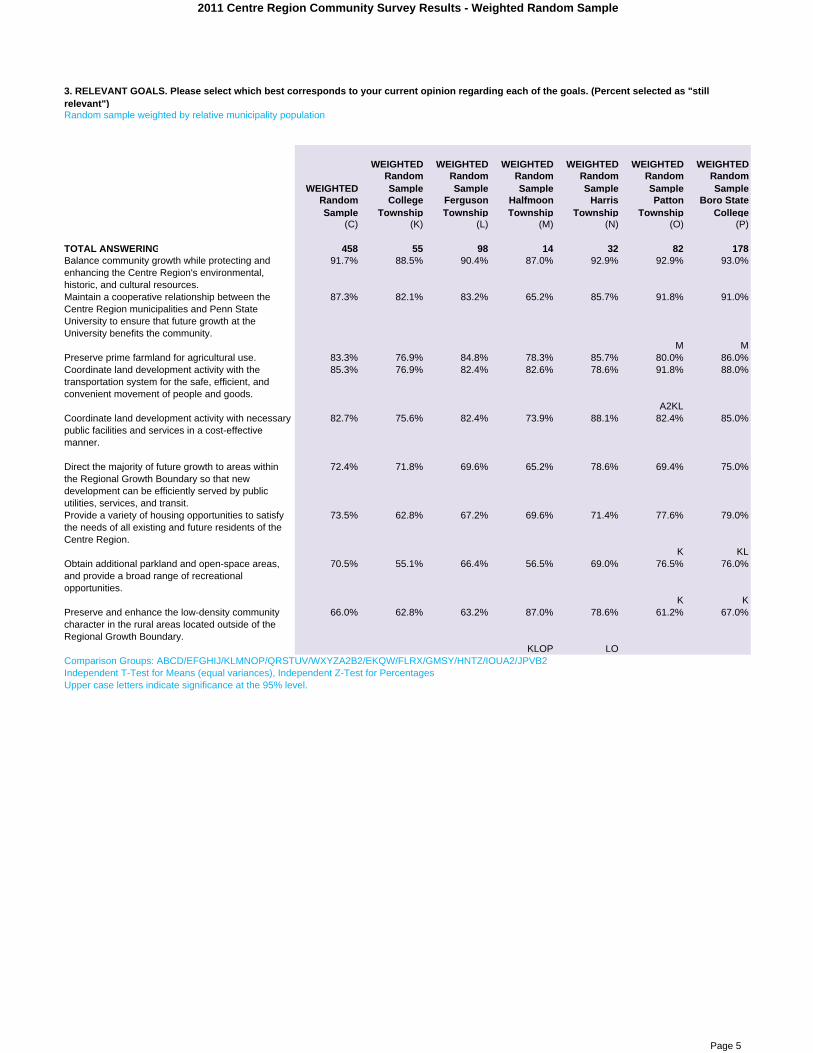
2011 Centre Region Community Survey Results - Weighted Random Sample
Random sample weighted by relative municipality population
WEIGHTED
WEIGHTED
WEIGHTED
WEIGHTED
WEIGHTED
WEIGHTED
WEIGHTED
Random Sample
Random Sample
Random Sample
Random Sample
Random Sample
Random Sample
Random Sample
College Township
Ferguson Township
Halfmoon Township
Harris Township
Patton Township
Boro State College
(C) (K) (L) (M) (N) (O) (P)
TOTAL ANSWERING 458 55 98 14 32 82 178Balance community growth while protecting and enhancing the Centre Region's environmental, historic, and cultural resources.
91.7% 88.5% 90.4% 87.0% 92.9% 92.9% 93.0%
Maintain a cooperative relationship between the Centre Region municipalities and Penn State University to ensure that future growth at the University benefits the community.
87.3% 82.1% 83.2% 65.2% 85.7% 91.8% 91.0%
M MPreserve prime farmland for agricultural use. 83.3% 76.9% 84.8% 78.3% 85.7% 80.0% 86.0%Coordinate land development activity with the transportation system for the safe, efficient, and convenient movement of people and goods.
85.3% 76.9% 82.4% 82.6% 78.6% 91.8% 88.0%
A2KLCoordinate land development activity with necessary public facilities and services in a cost-effective manner.
82.7% 75.6% 82.4% 73.9% 88.1% 82.4% 85.0%
Direct the majority of future growth to areas within the Regional Growth Boundary so that new development can be efficiently served by public utilities, services, and transit.
72.4% 71.8% 69.6% 65.2% 78.6% 69.4% 75.0%
Provide a variety of housing opportunities to satisfy the needs of all existing and future residents of the Centre Region.
73.5% 62.8% 67.2% 69.6% 71.4% 77.6% 79.0%
K KLObtain additional parkland and open-space areas, and provide a broad range of recreational opportunities.
70.5% 55.1% 66.4% 56.5% 69.0% 76.5% 76.0%
K KPreserve and enhance the low-density community character in the rural areas located outside of the Regional Growth Boundary.
66.0% 62.8% 63.2% 87.0% 78.6% 61.2% 67.0%
KLOP LOComparison Groups: ABCD/EFGHIJ/KLMNOP/QRSTUV/WXYZA2B2/EKQW/FLRX/GMSY/HNTZ/IOUA2/JPVB2Independent T-Test for Means (equal variances), Independent Z-Test for PercentagesUpper case letters indicate significance at the 95% level.
3. RELEVANT GOALS. Please select which best corresponds to your current opinion regarding each of the goals. (Percent selected as "still relevant")
Page 5

2011 Centre Region Community Survey Results - Weighted Random Sample
Random sample weighted by relative municipality population
WEIGHTED WEIGHTED WEIGHTED WEIGHTED WEIGHTED WEIGHTED
WEIGHTED Random
Sample Random
Sample Random
Sample Random
Sample Random
Sample Random
Sample Random
Sample College
Township Ferguson Township
Halfmoon Township
Harris Township
Patton Township
Boro State College
(C) (K) (L) (M) (N) (O) (P)
TOTAL ANSWERING 458 55 98 14 32 82 178Obtain additional parkland and open-space areas, and provide a broad range of recreational opportunities.
18.5% 29.5% 17.6% 34.8% 26.2% 11.8% 16.0%
WOP YOProvide a variety of housing opportunities to satisfy the needs of all existing and future residents of the Centre Region.
16.3% 16.7% 19.2% 21.7% 23.8% 11.8% 15.0%
Preserve and enhance the low-density community character in the rural areas located outside of the Regional Growth Boundary.
17.2% 17.9% 16.0% 8.7% 14.3% 18.8% 18.0%
XDirect the majority of future growth to areas within the Regional Growth Boundary so that new development can be efficiently served by public utilities, services, and transit.
8.4% 10.3% 7.2% 21.7% 11.9% 8.2% 7.0%
Preserve prime farmland for agricultural use. 6.6% 6.4% 8.0% 13.0% 7.1% 11.8% 3.0%P
Coordinate land development activity with necessary public facilities and services in a cost-effective manner.
6.3% 9.0% 4.8% 17.4% 9.5% 5.9% 5.0%
Coordinate land development activity with the transportation system for the safe, efficient, and convenient movement of people and goods.
6.1% 9.0% 6.4% 4.3% 14.3% 3.5% 5.0%
Maintain a cooperative relationship between the Centre Region municipalities and Penn State University to ensure that future growth at the University benefits the community.
6.4% 7.7% 8.0% 17.4% 7.1% 4.7% 5.0%
Balance community growth while protecting and enhancing the Centre Region's environmental, historic, and cultural resources.
3.5% 3.8% 3.2% 13.0% 2.4% 1.2% 4.0%
Comparison Groups: ABCD/EFGHIJ/KLMNOP/QRSTUV/WXYZA2B2/EKQW/FLRX/GMSY/HNTZ/IOUA2/JPVB2Independent T-Test for Means (equal variances), Independent Z-Test for PercentagesUpper case letters indicate significance at the 95% level.
3. NO LONGER RELEVANT GOALS. Please select which best corresponds to your current opinion regarding each of the goals. (Percent selected as "no longer relevant")
Page 6

2011 Centre Region Community Survey Results - Weighted Random Sample
3. Please select which best corresponds to your current opinion regarding the following goal.Balance community growth while protecting and enhancing the Centre Region's environmental, historic, and cultural resources.Random sample weighted by relative municipality population
WEIGHTED
WEIGHTED
WEIGHTED
WEIGHTED
WEIGHTED
WEIGHTED
WEIGHTED
Random Sample
Random Sample
Random Sample
Random Sample
Random Sample
Random Sample
Random Sample
College Township
Ferguson Township
Halfmoon Township
Harris Township
Patton Township
Boro State College
(C) (K) (L) (M) (N) (O) (P)
TOTAL ANSWERING 458 55 98 14 32 82 178Still Relevant 91.7% 88.5% 90.4% 87.0% 92.9% 92.9% 93.0%No Longer Relevant 3.5% 3.8% 3.2% 13.0% 2.4% 1.2% 4.0%Don’t Know/Not Sure 4.5% 6.4% 5.6% - 4.8% 5.9% 3.0%Comparison Groups: ABCD/EFGHIJ/KLMNOP/QRSTUV/WXYZA2B2/EKQW/FLRX/GMSY/HNTZ/IOUA2/JPVB2Independent T-Test for Means (equal variances), Independent Z-Test for PercentagesUpper case letters indicate significance at the 95% level.
3. Please select which best corresponds to your current opinion regarding the following goal.
Random sample weighted by relative municipality population
WEIGHTED
WEIGHTED
WEIGHTED
WEIGHTED
WEIGHTED
WEIGHTED
WEIGHTED
Random Sample
Random Sample
Random Sample
Random Sample
Random Sample
Random Sample
Random Sample
College Township
Ferguson Township
Halfmoon Township
Harris Township
Patton Township
Boro State College
(C) (K) (L) (M) (N) (O) (P)
TOTAL ANSWERING 458 55 98 14 32 82 178Still Relevant 72.4% 71.8% 69.6% 65.2% 78.6% 69.4% 75.0%No Longer Relevant 8.4% 10.3% 7.2% 21.7% 11.9% 8.2% 7.0%Don’t Know/Not Sure 17.5% 16.7% 19.2% 13.0% 9.5% 21.2% 17.0%Comparison Groups: ABCD/EFGHIJ/KLMNOP/QRSTUV/WXYZA2B2/EKQW/FLRX/GMSY/HNTZ/IOUA2/JPVB2Independent T-Test for Means (equal variances), Independent Z-Test for PercentagesUpper case letters indicate significance at the 95% level.
Direct the majority of future growth to areas within the Regional Growth Boundary so that new development can be efficiently served by public utilities, services, and transit.
Page 7

2011 Centre Region Community Survey Results - Weighted Random Sample
3. Please select which best corresponds to your current opinion regarding the following goal.Preserve and enhance the low-density community character in the rural areas located outside of the Regional Growth Boundary.Random sample weighted by relative municipality population
WEIGHTED
WEIGHTED
WEIGHTED
WEIGHTED
WEIGHTED
WEIGHTED
WEIGHTED
Random Sample
Random Sample
Random Sample
Random Sample
Random Sample
Random Sample
Random Sample
College Township
Ferguson Township
Halfmoon Township
Harris Township
Patton Township
Boro State College
(C) (K) (L) (M) (N) (O) (P)
TOTAL ANSWERING 458 55 98 14 32 82 178Still Relevant 66.0% 62.8% 63.2% 87.0% 78.6% 61.2% 67.0%
KLOP LONo Longer Relevant 17.2% 17.9% 16.0% 8.7% 14.3% 18.8% 18.0%
XDon’t Know/Not Sure 15.4% 16.7% 17.6% 4.3% 7.1% 20.0% 14.0%
M MN MNComparison Groups: ABCD/EFGHIJ/KLMNOP/QRSTUV/WXYZA2B2/EKQW/FLRX/GMSY/HNTZ/IOUA2/JPVB2Independent T-Test for Means (equal variances), Independent Z-Test for PercentagesUpper case letters indicate significance at the 95% level.
3. Please select which best corresponds to your current opinion regarding the following goal.Preserve prime farmland for agricultural use.Random sample weighted by relative municipality population
WEIGHTED
WEIGHTED
WEIGHTED
WEIGHTED
WEIGHTED
WEIGHTED
WEIGHTED
Random Sample
Random Sample
Random Sample
Random Sample
Random Sample
Random Sample
Random Sample
College Township
Ferguson Township
Halfmoon Township
Harris Township
Patton Township
Boro State College
(C) (K) (L) (M) (N) (O) (P)
TOTAL ANSWERING 458 55 98 14 32 82 178Still Relevant 83.3% 76.9% 84.8% 78.3% 85.7% 80.0% 86.0%No Longer Relevant 6.6% 6.4% 8.0% 13.0% 7.1% 11.8% 3.0%
PDon’t Know/Not Sure 9.5% 15.4% 5.6% 8.7% 7.1% 8.2% 11.0%
LComparison Groups: ABCD/EFGHIJ/KLMNOP/QRSTUV/WXYZA2B2/EKQW/FLRX/GMSY/HNTZ/IOUA2/JPVB2Independent T-Test for Means (equal variances), Independent Z-Test for PercentagesUpper case letters indicate significance at the 95% level.
Page 8

2011 Centre Region Community Survey Results - Weighted Random Sample
3. Please select which best corresponds to your current opinion regarding the following goal.Coordinate land development activity with the transportation system for the safe, efficient, and convenient movement of people and goodsRandom sample weighted by relative municipality population
WEIGHTED
WEIGHTED
WEIGHTED
WEIGHTED
WEIGHTED
WEIGHTED
WEIGHTED
Random Sample
Random Sample
Random Sample
Random Sample
Random Sample
Random Sample
Random Sample
College Township
Ferguson Township
Halfmoon Township
Harris Township
Patton Township
Boro State College
(C) (K) (L) (M) (N) (O) (P)
TOTAL ANSWERING 458 55 98 14 32 82 178Still Relevant 85.3% 76.9% 82.4% 82.6% 78.6% 91.8% 88.0%
A2KLNo Longer Relevant 6.1% 9.0% 6.4% 4.3% 14.3% 3.5% 5.0%
Don’t Know/Not Sure 6.8% 10.3% 7.2% 13.0% 7.1% 4.7% 6.0%
Comparison Groups: ABCD/EFGHIJ/KLMNOP/QRSTUV/WXYZA2B2/EKQW/FLRX/GMSY/HNTZ/IOUA2/JPVB2Independent T-Test for Means (equal variances), Independent Z-Test for PercentagesUpper case letters indicate significance at the 95% level.
3. Please select which best corresponds to your current opinion regarding the following goal.Coordinate land development activity with necessary public facilities and services in a cost-effective manner.Random sample weighted by relative municipality population
WEIGHTED
WEIGHTED
WEIGHTED
WEIGHTED
WEIGHTED
WEIGHTED
WEIGHTED
Random Sample
Random Sample
Random Sample
Random Sample
Random Sample
Random Sample
Random Sample
College Township
Ferguson Township
Halfmoon Township
Harris Township
Patton Township
Boro State College
(C) (K) (L) (M) (N) (O) (P)
TOTAL ANSWERING 458 55 98 14 32 82 178Still Relevant 82.7% 75.6% 82.4% 73.9% 88.1% 82.4% 85.0%
No Longer Relevant 6.3% 9.0% 4.8% 17.4% 9.5% 5.9% 5.0%
Don’t Know/Not Sure 8.5% 11.5% 8.8% 8.7% 2.4% 9.4% 8.0%N
Comparison Groups: ABCD/EFGHIJ/KLMNOP/QRSTUV/WXYZA2B2/EKQW/FLRX/GMSY/HNTZ/IOUA2/JPVB2Independent T-Test for Means (equal variances), Independent Z-Test for PercentagesUpper case letters indicate significance at the 95% level.
Page 9

2011 Centre Region Community Survey Results - Weighted Random Sample
3. Please select which best corresponds to your current opinion regarding the following goal.Obtain additional parkland and open-space areas, and provide a broad range of recreational opportunities.Random sample weighted by relative municipality population
WEIGHTED
WEIGHTED
WEIGHTED
WEIGHTED
WEIGHTED
WEIGHTED
WEIGHTED
Random Sample
Random Sample
Random Sample
Random Sample
Random Sample
Random Sample
Random Sample
College Township
Ferguson Township
Halfmoon Township
Harris Township
Patton Township
Boro State College
(C) (K) (L) (M) (N) (O) (P)
TOTAL ANSWERING 458 55 98 14 32 82 178Still Relevant 70.5% 55.1% 66.4% 56.5% 69.0% 76.5% 76.0%
K KNo Longer Relevant 18.5% 29.5% 17.6% 34.8% 26.2% 11.8% 16.0%
WOP YODon’t Know/Not Sure 9.6% 10.3% 12.8% 8.7% 4.8% 10.6% 8.0%Comparison Groups: ABCD/EFGHIJ/KLMNOP/QRSTUV/WXYZA2B2/EKQW/FLRX/GMSY/HNTZ/IOUA2/JPVB2Independent T-Test for Means (equal variances), Independent Z-Test for PercentagesUpper case letters indicate significance at the 95% level.
3. Please select which best corresponds to your current opinion regarding the following goal.Provide a variety of housing opportunities to satisfy the needs of all existing and future residents of the Centre RegionRandom sample weighted by relative municipality population
WEIGHTED
WEIGHTED
WEIGHTED
WEIGHTED
WEIGHTED
WEIGHTED
WEIGHTED
Random Sample
Random Sample
Random Sample
Random Sample
Random Sample
Random Sample
Random Sample
College Township
Ferguson Township
Halfmoon Township
Harris Township
Patton Township
Boro State College
(C) (K) (L) (M) (N) (O) (P)
TOTAL ANSWERING 458 55 98 14 32 82 178Still Relevant 73.5% 62.8% 67.2% 69.6% 71.4% 77.6% 79.0%
K KLNo Longer Relevant 16.3% 16.7% 19.2% 21.7% 23.8% 11.8% 15.0%Don’t Know/Not Sure 8.5% 15.4% 10.4% 8.7% 4.8% 10.6% 5.0%
NPComparison Groups: ABCD/EFGHIJ/KLMNOP/QRSTUV/WXYZA2B2/EKQW/FLRX/GMSY/HNTZ/IOUA2/JPVB2Independent T-Test for Means (equal variances), Independent Z-Test for PercentagesUpper case letters indicate significance at the 95% level.
3. Please select which best corresponds to your current opinion regarding the following goal.Maintain a cooperative relationship between the Centre Region municipalities and Penn State University to ensure that future growth at the UniversitRandom sample weighted by relative municipality population
WEIGHTED
WEIGHTED
WEIGHTED
WEIGHTED
WEIGHTED
WEIGHTED
WEIGHTED
Random Sample
Random Sample
Random Sample
Random Sample
Random Sample
Random Sample
Random Sample
College Township
Ferguson Township
Halfmoon Township
Harris Township
Patton Township
Boro State College
(C) (K) (L) (M) (N) (O) (P)
TOTAL ANSWERING 458 55 98 14 32 82 178Still Relevant 87.3% 82.1% 83.2% 65.2% 85.7% 91.8% 91.0%
M MNo Longer Relevant 6.4% 7.7% 8.0% 17.4% 7.1% 4.7% 5.0%Don’t Know/Not Sure 5.0% 6.4% 5.6% 13.0% 7.1% 3.5% 4.0%Comparison Groups: ABCD/EFGHIJ/KLMNOP/QRSTUV/WXYZA2B2/EKQW/FLRX/GMSY/HNTZ/IOUA2/JPVB2Independent T-Test for Means (equal variances), Independent Z-Test for Percentages
Page 10

2011 Centre Region Community Survey Results - Weighted Random Sample
Upper case letters indicate significance at the 95% level.
Page 11

2011 Centre Region Community Survey Results - Weighted Random Sample
MEAN SUMMARY TABLE
4. To what extent do you agree or disagree with the following statements? (Ratings: 5=Stongly agree; 1=Strongly disagree)Random sample weighted by relative municipality population
WEIGHTED
WEIGHTED
WEIGHTED
WEIGHTED
WEIGHTED
WEIGHTED
WEIGHTED
Random Sample
Random Sample
Random Sample
Random Sample
Random Sample
Random Sample
Random Sample
College Township
Ferguson Township
Halfmoon Township
Harris Township
Patton Township
Boro State College
(C) (K) (L) (M) (N) (O) (P)
TOTAL ANSWERING 456 55 98 14 32 82 176The Centre Region should have an overall plan that directs future growth and development to appropriate locations.
4.3 4.3 4.3 4.3 4.1 4.4 4.4
451 54 97 14 31 81 174Municipalities should use regulations, such as zoning or private conservation easements, to preserve natural resources (air, water, soil, forests, etc.)
4.2 4.0 4.1 3.9 3.9 4.3 4.2
KMN455 55 98 14 32 82 174
Municipalities should use local tax resources to preserve natural resources (air, water, soil, forests, etc.)
4.0 3.8 4.0 3.7 4.0 4.0 4.0
453 55 97 14 31 82 174Municipalities should use regulations, such as zoning or private conservation easements, to preserve farming.
3.8 3.8 3.9 3.7 3.6 3.8 3.9
454 55 97 14 32 82 174Municipalities should protect historic landmarks and buildings through regulations and law.
3.7 3.5 3.7 3.2 3.4 3.9 3.7
M KMN M453 53 96 14 32 82 176
I would like municipal officials to have a stronger role in controlling new development in the area.
3.4 3.3 3.3 3.6 3.2 3.3 3.4
456 55 97 14 32 82 176Municipalities should use local tax resources to protect historic landmarks and buildings.
3.3 3.2 3.2 2.9 3.2 3.5 3.4
KLM M454 55 96 13 32 82 176
Municipalities should use local tax resources to preserve farming
3.2 3.1 3.0 3.2 3.1 3.2 3.3
L455 55 97 14 32 81 176
The economic needs of the area should be the driving force that determines what type of development takes place in the Centre Region.
3.2 3.2 3.4 3.3 3.2 3.2 2.9
D P Y453 53 97 14 32 81 176
Individuals and developers should be free to develop land without a lot of controls and restrictions by municipalities.
2.0 2.1 2.0 2.0 2.4 2.1 1.9
454 55 97 14 32 82 174Comparison Groups: ABCD/EFGHIJ/KLMNOP/QRSTUV/WXYZA2B2/EKQW/FLRX/GMSY/HNTZ/IOUA2/JPVB2Independent T-Test for Means (equal variances), Independent Z-Test for PercentagesUpper case letters indicate significance at the 95% level.
Page 12
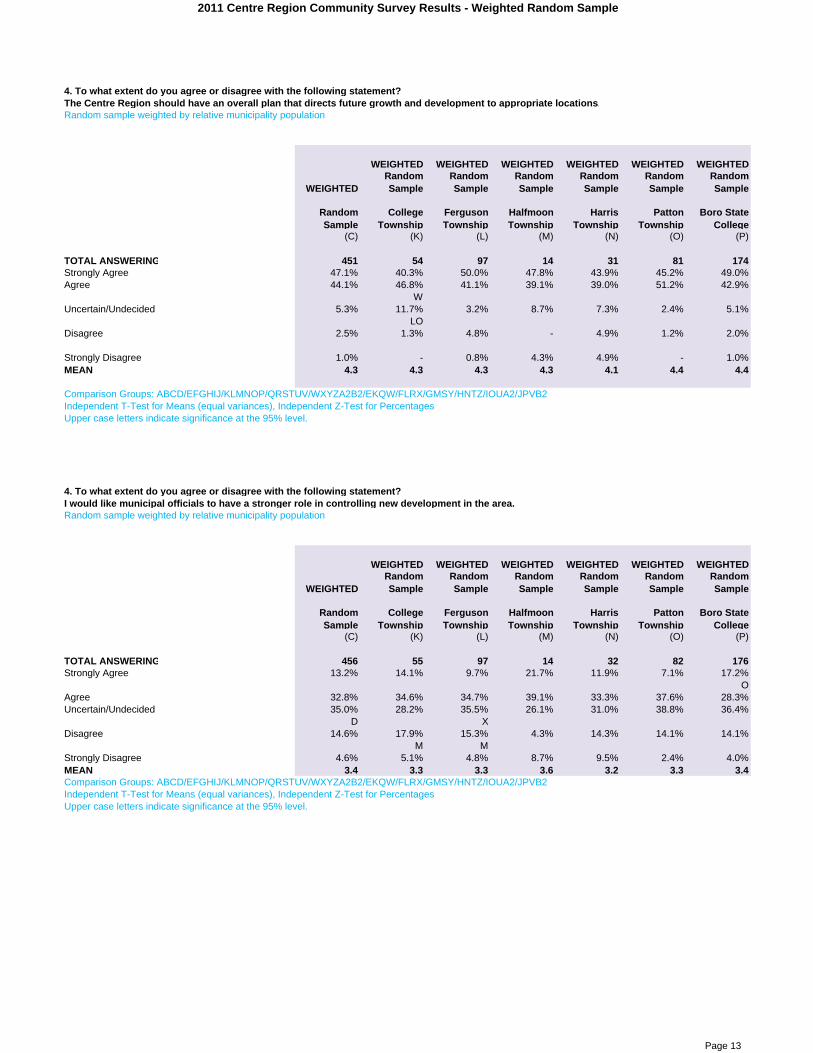
2011 Centre Region Community Survey Results - Weighted Random Sample
4. To what extent do you agree or disagree with the following statement?The Centre Region should have an overall plan that directs future growth and development to appropriate locations.Random sample weighted by relative municipality population
WEIGHTED
WEIGHTED
WEIGHTED
WEIGHTED
WEIGHTED
WEIGHTED
WEIGHTED
Random Sample
Random Sample
Random Sample
Random Sample
Random Sample
Random Sample
Random Sample
College Township
Ferguson Township
Halfmoon Township
Harris Township
Patton Township
Boro State College
(C) (K) (L) (M) (N) (O) (P)
TOTAL ANSWERING 451 54 97 14 31 81 174Strongly Agree 47.1% 40.3% 50.0% 47.8% 43.9% 45.2% 49.0%Agree 44.1% 46.8% 41.1% 39.1% 39.0% 51.2% 42.9%
WUncertain/Undecided 5.3% 11.7% 3.2% 8.7% 7.3% 2.4% 5.1%
LODisagree 2.5% 1.3% 4.8% - 4.9% 1.2% 2.0%
Strongly Disagree 1.0% - 0.8% 4.3% 4.9% - 1.0%MEAN 4.3 4.3 4.3 4.3 4.1 4.4 4.4
Comparison Groups: ABCD/EFGHIJ/KLMNOP/QRSTUV/WXYZA2B2/EKQW/FLRX/GMSY/HNTZ/IOUA2/JPVB2Independent T-Test for Means (equal variances), Independent Z-Test for PercentagesUpper case letters indicate significance at the 95% level.
4. To what extent do you agree or disagree with the following statement?I would like municipal officials to have a stronger role in controlling new development in the area.Random sample weighted by relative municipality population
WEIGHTED
WEIGHTED
WEIGHTED
WEIGHTED
WEIGHTED
WEIGHTED
WEIGHTED
Random Sample
Random Sample
Random Sample
Random Sample
Random Sample
Random Sample
Random Sample
College Township
Ferguson Township
Halfmoon Township
Harris Township
Patton Township
Boro State College
(C) (K) (L) (M) (N) (O) (P)
TOTAL ANSWERING 456 55 97 14 32 82 176Strongly Agree 13.2% 14.1% 9.7% 21.7% 11.9% 7.1% 17.2%
OAgree 32.8% 34.6% 34.7% 39.1% 33.3% 37.6% 28.3%Uncertain/Undecided 35.0% 28.2% 35.5% 26.1% 31.0% 38.8% 36.4%
D XDisagree 14.6% 17.9% 15.3% 4.3% 14.3% 14.1% 14.1%
M MStrongly Disagree 4.6% 5.1% 4.8% 8.7% 9.5% 2.4% 4.0%MEAN 3.4 3.3 3.3 3.6 3.2 3.3 3.4Comparison Groups: ABCD/EFGHIJ/KLMNOP/QRSTUV/WXYZA2B2/EKQW/FLRX/GMSY/HNTZ/IOUA2/JPVB2Independent T-Test for Means (equal variances), Independent Z-Test for PercentagesUpper case letters indicate significance at the 95% level.
Page 13

2011 Centre Region Community Survey Results - Weighted Random Sample
4. To what extent do you agree or disagree with the following statement?Individuals and developers should be free to develop land without a lot of controls and restrictions by municipalities.Random sample weighted by relative municipality population
WEIGHTED
WEIGHTED
WEIGHTED
WEIGHTED
WEIGHTED
WEIGHTED
WEIGHTED
Random Sample
Random Sample
Random Sample
Random Sample
Random Sample
Random Sample
Random Sample
College Township
Ferguson Township
Halfmoon Township
Harris Township
Patton Township
Boro State College
(C) (K) (L) (M) (N) (O) (P)
TOTAL ANSWERING 454 55 97 14 32 82 174Strongly Agree 4.4% 2.6% 4.8% 4.3% 14.3% - 5.1%
KAgree 9.6% 15.4% 8.1% 8.7% 9.5% 10.6% 8.2%Uncertain/Undecided 7.9% 5.1% 9.7% 4.3% 4.8% 15.3% 5.1%
KNPDisagree 40.9% 41.0% 38.7% 47.8% 40.5% 47.1% 38.8%
D XStrongly Disagree 37.2% 35.9% 38.7% 34.8% 31.0% 27.1% 42.9%
OMEAN 2.0 2.1 2.0 2.0 2.4 2.1 1.9Comparison Groups: ABCD/EFGHIJ/KLMNOP/QRSTUV/WXYZA2B2/EKQW/FLRX/GMSY/HNTZ/IOUA2/JPVB2Independent T-Test for Means (equal variances), Independent Z-Test for PercentagesUpper case letters indicate significance at the 95% level.
4. To what extent do you agree or disagree with the following statement?The economic needs of the area should be the driving force that determines what type of development takes place in the Centre Region.Random sample weighted by relative municipality population
WEIGHTED
WEIGHTED
WEIGHTED
WEIGHTED
WEIGHTED
WEIGHTED
WEIGHTED
Random Sample
Random Sample
Random Sample
Random Sample
Random Sample
Random Sample
Random Sample
College Township
Ferguson Township
Halfmoon Township
Harris Township
Patton Township
Boro State College
(C) (K) (L) (M) (N) (O) (P)
TOTAL ANSWERING 453 53 97 14 32 81 176Strongly Agree 10.4% 15.8% 17.7% 17.4% 7.1% 11.9% 4.0%
P XNPAgree 34.8% 31.6% 36.3% 30.4% 40.5% 36.9% 33.3%
Uncertain/Undecided 22.2% 23.7% 19.4% 26.1% 28.6% 19.0% 23.2%Disagree 25.6% 18.4% 21.0% 21.7% 14.3% 26.2% 32.3%
KNStrongly Disagree 7.1% 10.5% 5.6% 4.3% 9.5% 6.0% 7.1%MEAN 3.2 3.2 3.4 3.3 3.2 3.2 2.9
D P YComparison Groups: ABCD/EFGHIJ/KLMNOP/QRSTUV/WXYZA2B2/EKQW/FLRX/GMSY/HNTZ/IOUA2/JPVB2Independent T-Test for Means (equal variances), Independent Z-Test for PercentagesUpper case letters indicate significance at the 95% level.
Page 14

2011 Centre Region Community Survey Results - Weighted Random Sample
4. To what extent do you agree or disagree with the following statement?Municipalities should use local tax resources to protect historic landmarks and buildings.Random sample weighted by relative municipality population
WEIGHTED
WEIGHTED
WEIGHTED
WEIGHTED
WEIGHTED
WEIGHTED
WEIGHTED
Random Sample
Random Sample
Random Sample
Random Sample
Random Sample
Random Sample
Random Sample
College Township
Ferguson Township
Halfmoon Township
Harris Township
Patton Township
Boro State College
(C) (K) (L) (M) (N) (O) (P)
TOTAL ANSWERING 454 55 96 13 32 82 176Strongly Agree 8.2% 5.1% 6.5% 9.1% 9.5% 9.4% 9.1%
Agree 41.2% 37.2% 37.4% 13.6% 38.1% 44.7% 45.5%M M M M B2M
Uncertain/Undecided 27.1% 32.1% 29.3% 36.4% 23.8% 29.4% 23.2%Disagree 19.0% 19.2% 22.0% 36.4% 16.7% 15.3% 18.2%
X YStrongly Disagree 4.6% 6.4% 4.9% 4.5% 11.9% 1.2% 4.0%
OMEAN 3.3 3.2 3.2 2.9 3.2 3.5 3.4
KLM MComparison Groups: ABCD/EFGHIJ/KLMNOP/QRSTUV/WXYZA2B2/EKQW/FLRX/GMSY/HNTZ/IOUA2/JPVB2Independent T-Test for Means (equal variances), Independent Z-Test for PercentagesUpper case letters indicate significance at the 95% level.
4. To what extent do you agree or disagree with the following statement? Municipalities should protect historic landmarks and buildings through regulations and law.Random sample weighted by relative municipality population
WEIGHTED
WEIGHTED
WEIGHTED
WEIGHTED
WEIGHTED
WEIGHTED
WEIGHTED
Random Sample
Random Sample
Random Sample
Random Sample
Random Sample
Random Sample
Random Sample
College Township
Ferguson Township
Halfmoon Township
Harris Township
Patton Township
Boro State College
(C) (K) (L) (M) (N) (O) (P)
TOTAL ANSWERING 453 53 96 14 32 82 176Strongly Agree 11.7% 9.2% 12.2% 8.7% 9.5% 12.9% 12.1%
Agree 58.0% 51.3% 60.2% 30.4% 45.2% 68.2% 58.6%M A2KMN M
Uncertain/Undecided 16.9% 26.3% 14.6% 34.8% 26.2% 10.6% 15.2%O O O
Disagree 11.4% 7.9% 11.4% 21.7% 11.9% 8.2% 13.1%Y B2
Strongly Disagree 2.0% 5.3% 1.6% 4.3% 7.1% - 1.0%MEAN 3.7 3.5 3.7 3.2 3.4 3.9 3.7
M KMN MComparison Groups: ABCD/EFGHIJ/KLMNOP/QRSTUV/WXYZA2B2/EKQW/FLRX/GMSY/HNTZ/IOUA2/JPVB2Independent T-Test for Means (equal variances), Independent Z-Test for PercentagesUpper case letters indicate significance at the 95% level.
Page 15

2011 Centre Region Community Survey Results - Weighted Random Sample
4. To what extent do you agree or disagree with the following statement?Municipalities should use local tax resources to preserve natural resources (air, water, soil, forests, etc.)Random sample weighted by relative municipality population
WEIGHTED
WEIGHTED
WEIGHTED
WEIGHTED
WEIGHTED
WEIGHTED
WEIGHTED
Random Sample
Random Sample
Random Sample
Random Sample
Random Sample
Random Sample
Random Sample
College Township
Ferguson Township
Halfmoon Township
Harris Township
Patton Township
Boro State College
(C) (K) (L) (M) (N) (O) (P)
TOTAL ANSWERING 453 55 97 14 31 82 174Strongly Agree 31.2% 23.1% 25.8% 26.1% 36.6% 34.1% 34.7%Agree 45.4% 47.4% 51.6% 39.1% 43.9% 43.5% 42.9%Uncertain/Undecided 13.8% 16.7% 17.7% 13.0% 9.8% 16.5% 10.2%Disagree 7.0% 7.7% 4.0% 17.4% 4.9% 4.7% 9.2%Strongly Disagree 2.6% 5.1% 0.8% 4.3% 4.9% 1.2% 3.1%MEAN 4.0 3.8 4.0 3.7 4.0 4.0 4.0
Comparison Groups: ABCD/EFGHIJ/KLMNOP/QRSTUV/WXYZA2B2/EKQW/FLRX/GMSY/HNTZ/IOUA2/JPVB2Independent T-Test for Means (equal variances), Independent Z-Test for PercentagesUpper case letters indicate significance at the 95% level.
4. To what extent do you agree or disagree with the following statement?
Random sample weighted by relative municipality population
WEIGHTED
WEIGHTED
WEIGHTED
WEIGHTED
WEIGHTED
WEIGHTED
WEIGHTED
Random Sample
Random Sample
Random Sample
Random Sample
Random Sample
Random Sample
Random Sample
College Township
Ferguson Township
Halfmoon Township
Harris Township
Patton Township
Boro State College
(C) (K) (L) (M) (N) (O) (P)
TOTAL ANSWERING 455 55 98 14 32 82 174Strongly Agree 36.5% 28.2% 31.2% 21.7% 31.0% 45.9% 39.8%
KLMAgree 50.8% 55.1% 54.4% 60.9% 45.2% 43.5% 51.0%
DUncertain/Undecided 6.7% 11.5% 8.8% 8.7% 9.5% 7.1% 3.1%
PDisagree 3.6% 2.6% 4.8% 4.3% 9.5% 3.5% 2.0%Strongly Disagree 2.5% 2.6% 0.8% 4.3% 4.8% - 4.1%MEAN 4.2 4.0 4.1 3.9 3.9 4.3 4.2
KMNComparison Groups: ABCD/EFGHIJ/KLMNOP/QRSTUV/WXYZA2B2/EKQW/FLRX/GMSY/HNTZ/IOUA2/JPVB2Independent T-Test for Means (equal variances), Independent Z-Test for PercentagesUpper case letters indicate significance at the 95% level.
Municipalities should use regulations, such as zoning or private conservation easements, to preserve natural resources (air, water, soil, forests, etc.)
Page 16

2011 Centre Region Community Survey Results - Weighted Random Sample
4. To what extent do you agree or disagree with the following statement?Municipalities should use local tax resources to preserve farmingRandom sample weighted by relative municipality population
WEIGHTED
WEIGHTED
WEIGHTED
WEIGHTED
WEIGHTED
WEIGHTED
WEIGHTED
Random Sample
Random Sample
Random Sample
Random Sample
Random Sample
Random Sample
Random Sample
College Township
Ferguson Township
Halfmoon Township
Harris Township
Patton Township
Boro State College
(C) (K) (L) (M) (N) (O) (P)
TOTAL ANSWERING 455 55 97 14 32 81 176Strongly Agree 13.5% 14.1% 9.7% 13.0% 16.7% 8.3% 17.2%Agree 26.3% 20.5% 23.4% 30.4% 26.2% 33.3% 26.3%
Uncertain/Undecided 30.5% 30.8% 29.8% 30.4% 21.4% 31.0% 32.3%A2
Disagree 24.8% 25.6% 32.3% 17.4% 23.8% 22.6% 22.2%X
Strongly Disagree 4.8% 9.0% 4.8% 8.7% 11.9% 4.8% 2.0%P
MEAN 3.2 3.1 3.0 3.2 3.1 3.2 3.3L
Comparison Groups: ABCD/EFGHIJ/KLMNOP/QRSTUV/WXYZA2B2/EKQW/FLRX/GMSY/HNTZ/IOUA2/JPVB2Independent T-Test for Means (equal variances), Independent Z-Test for PercentagesUpper case letters indicate significance at the 95% level.
4. To what extent do you agree or disagree with the following statement?Municipalities should use regulations, such as zoning or private conservation easements, to preserve farming.Random sample weighted by relative municipality population
WEIGHTED
WEIGHTED
WEIGHTED
WEIGHTED
WEIGHTED
WEIGHTED
WEIGHTED
Random Sample
Random Sample
Random Sample
Random Sample
Random Sample
Random Sample
Random Sample
College Township
Ferguson Township
Halfmoon Township
Harris Township
Patton Township
Boro State College
(C) (K) (L) (M) (N) (O) (P)
TOTAL ANSWERING 454 55 97 14 32 82 174Strongly Agree 25.0% 17.9% 25.8% 13.0% 23.8% 21.2% 29.6%
MAgree 47.1% 53.8% 51.6% 65.2% 40.5% 48.2% 41.8%
NP A2Uncertain/Undecided 16.9% 19.2% 9.7% 8.7% 16.7% 20.0% 19.4%
A2L LDisagree 8.7% 9.0% 9.7% 4.3% 11.9% 8.2% 8.2%Strongly Disagree 2.3% - 3.2% 8.7% 7.1% 2.4% 1.0%MEAN 3.8 3.8 3.9 3.7 3.6 3.8 3.9Comparison Groups: ABCD/EFGHIJ/KLMNOP/QRSTUV/WXYZA2B2/EKQW/FLRX/GMSY/HNTZ/IOUA2/JPVB2Independent T-Test for Means (equal variances), Independent Z-Test for PercentagesUpper case letters indicate significance at the 95% level.
Page 17
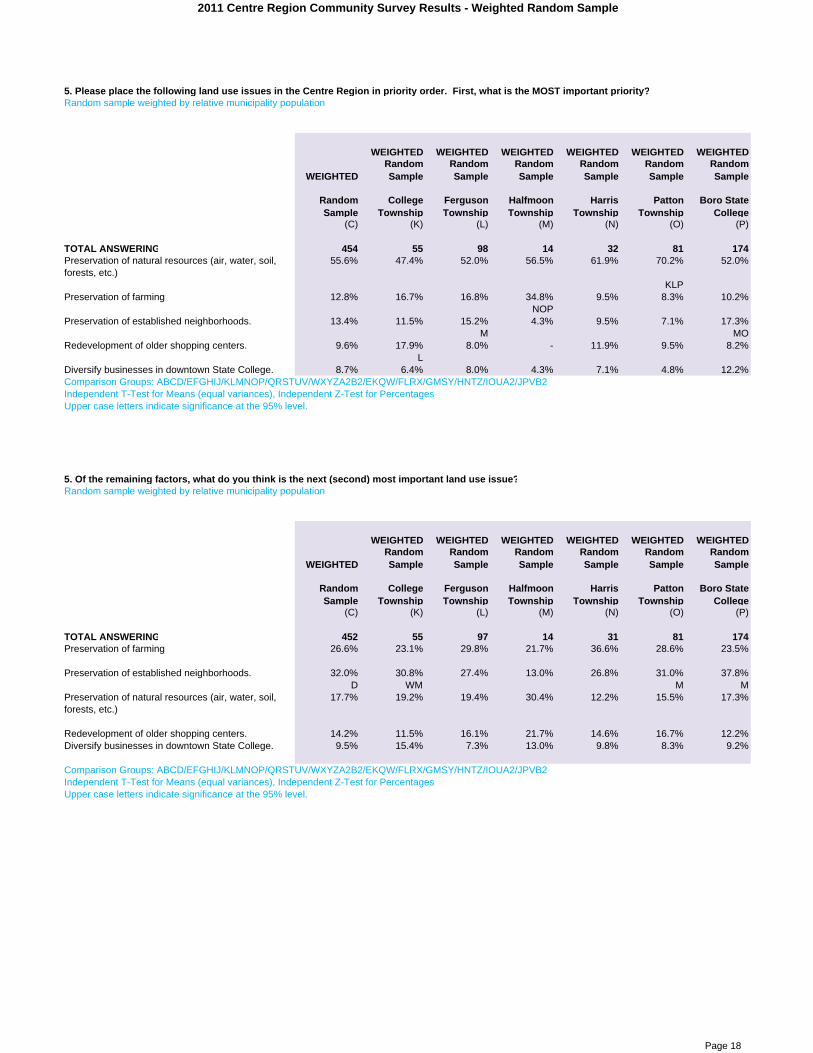
2011 Centre Region Community Survey Results - Weighted Random Sample
5. Please place the following land use issues in the Centre Region in priority order. First, what is the MOST important priority?Random sample weighted by relative municipality population
WEIGHTED
WEIGHTED
WEIGHTED
WEIGHTED
WEIGHTED
WEIGHTED
WEIGHTED
Random Sample
Random Sample
Random Sample
Random Sample
Random Sample
Random Sample
Random Sample
College Township
Ferguson Township
Halfmoon Township
Harris Township
Patton Township
Boro State College
(C) (K) (L) (M) (N) (O) (P)
TOTAL ANSWERING 454 55 98 14 32 81 174Preservation of natural resources (air, water, soil, forests, etc.)
55.6% 47.4% 52.0% 56.5% 61.9% 70.2% 52.0%
KLPPreservation of farming 12.8% 16.7% 16.8% 34.8% 9.5% 8.3% 10.2%
NOPPreservation of established neighborhoods. 13.4% 11.5% 15.2% 4.3% 9.5% 7.1% 17.3%
M MORedevelopment of older shopping centers. 9.6% 17.9% 8.0% - 11.9% 9.5% 8.2%
LDiversify businesses in downtown State College. 8.7% 6.4% 8.0% 4.3% 7.1% 4.8% 12.2%Comparison Groups: ABCD/EFGHIJ/KLMNOP/QRSTUV/WXYZA2B2/EKQW/FLRX/GMSY/HNTZ/IOUA2/JPVB2Independent T-Test for Means (equal variances), Independent Z-Test for PercentagesUpper case letters indicate significance at the 95% level.
5. Of the remaining factors, what do you think is the next (second) most important land use issue?Random sample weighted by relative municipality population
WEIGHTED
WEIGHTED
WEIGHTED
WEIGHTED
WEIGHTED
WEIGHTED
WEIGHTED
Random Sample
Random Sample
Random Sample
Random Sample
Random Sample
Random Sample
Random Sample
College Township
Ferguson Township
Halfmoon Township
Harris Township
Patton Township
Boro State College
(C) (K) (L) (M) (N) (O) (P)
TOTAL ANSWERING 452 55 97 14 31 81 174Preservation of farming 26.6% 23.1% 29.8% 21.7% 36.6% 28.6% 23.5%
Preservation of established neighborhoods. 32.0% 30.8% 27.4% 13.0% 26.8% 31.0% 37.8%D WM M M
Preservation of natural resources (air, water, soil, forests, etc.)
17.7% 19.2% 19.4% 30.4% 12.2% 15.5% 17.3%
Redevelopment of older shopping centers. 14.2% 11.5% 16.1% 21.7% 14.6% 16.7% 12.2%Diversify businesses in downtown State College. 9.5% 15.4% 7.3% 13.0% 9.8% 8.3% 9.2%
Comparison Groups: ABCD/EFGHIJ/KLMNOP/QRSTUV/WXYZA2B2/EKQW/FLRX/GMSY/HNTZ/IOUA2/JPVB2Independent T-Test for Means (equal variances), Independent Z-Test for PercentagesUpper case letters indicate significance at the 95% level.
Page 18

2011 Centre Region Community Survey Results - Weighted Random Sample
5. What is the next (third) most important land use issue?Random sample weighted by relative municipality population
WEIGHTED
WEIGHTED
WEIGHTED
WEIGHTED
WEIGHTED
WEIGHTED
WEIGHTED
Random Sample
Random Sample
Random Sample
Random Sample
Random Sample
Random Sample
Random Sample
College Township
Ferguson Township
Halfmoon Township
Harris Township
Patton Township
Boro State College
(C) (K) (L) (M) (N) (O) (P)
TOTAL ANSWERING 448 54 96 14 30 81 173Preservation of established neighborhoods. 25.2% 29.9% 24.4% 39.1% 27.5% 29.8% 20.6%
A2Redevelopment of older shopping centers. 23.4% 28.6% 17.9% 26.1% 25.0% 25.0% 23.7%
Preservation of farming 23.5% 18.2% 26.0% 26.1% 25.0% 25.0% 22.7%Diversify businesses in downtown State College. 16.1% 11.7% 13.8% - 5.0% 16.7% 21.6%
N NPreservation of natural resources (air, water, soil, forests, etc.)
11.7% 11.7% 17.9% 8.7% 17.5% 3.6% 11.3%
O O OComparison Groups: ABCD/EFGHIJ/KLMNOP/QRSTUV/WXYZA2B2/EKQW/FLRX/GMSY/HNTZ/IOUA2/JPVB2Independent T-Test for Means (equal variances), Independent Z-Test for PercentagesUpper case letters indicate significance at the 95% level.
5. And, what is the next (fourth) most important land use issue?Random sample weighted by relative municipality population
WEIGHTED
WEIGHTED
WEIGHTED
WEIGHTED
WEIGHTED
WEIGHTED
WEIGHTED
Random Sample
Random Sample
Random Sample
Random Sample
Random Sample
Random Sample
Random Sample
College Township
Ferguson Township
Halfmoon Township
Harris Township
Patton Township
Boro State College
(C) (K) (L) (M) (N) (O) (P)
TOTAL ANSWERING 447 54 95 14 30 81 173Redevelopment of older shopping centers. 24.3% 24.7% 30.6% 43.5% 25.0% 19.0% 21.6%
ODiversify businesses in downtown State College. 25.0% 22.1% 21.5% 21.7% 22.5% 28.6% 26.8%Preservation of established neighborhoods. 19.8% 20.8% 22.3% 30.4% 27.5% 25.0% 13.4%
PPreservation of farming 21.2% 19.5% 15.7% 4.3% 17.5% 19.0% 27.8%
M M M LMPreservation of natural resources (air, water, soil, forests, etc.)
9.7% 13.0% 9.9% - 7.5% 8.3% 10.3%
DComparison Groups: ABCD/EFGHIJ/KLMNOP/QRSTUV/WXYZA2B2/EKQW/FLRX/GMSY/HNTZ/IOUA2/JPVB2Independent T-Test for Means (equal variances), Independent Z-Test for PercentagesUpper case letters indicate significance at the 95% level.
Page 19

2011 Centre Region Community Survey Results - Weighted Random Sample
5. LEAST important land use issue:Random sample weighted by relative municipality population
WEIGHTED
WEIGHTED
WEIGHTED
WEIGHTED
WEIGHTED
WEIGHTED
WEIGHTED
Random Sample
Random Sample
Random Sample
Random Sample
Random Sample
Random Sample
Random Sample
College Township
Ferguson Township
Halfmoon Township
Harris Township
Patton Township
Boro State College
(C) (K) (L) (M) (N) (O) (P)
TOTAL ANSWERING 447 54 95 14 30 81 173Diversify businesses in downtown State College. 40.4% 44.2% 48.8% 60.9% 55.0% 41.7% 29.9%
P P PRedevelopment of older shopping centers. 28.2% 16.9% 27.3% 8.7% 22.5% 29.8% 34.0%
XM KM KMPreservation of farming 16.7% 23.4% 12.4% 13.0% 15.0% 19.0% 16.5%
Preservation of established neighborhoods. 9.7% 6.5% 10.7% 13.0% 7.5% 7.1% 11.3%Preservation of natural resources (air, water, soil, forests, etc.)
5.0% 9.1% 0.8% 4.3% - 2.4% 8.2%
L LComparison Groups: ABCD/EFGHIJ/KLMNOP/QRSTUV/WXYZA2B2/EKQW/FLRX/GMSY/HNTZ/IOUA2/JPVB2Independent T-Test for Means (equal variances), Independent Z-Test for PercentagesUpper case letters indicate significance at the 95% level.
Page 20
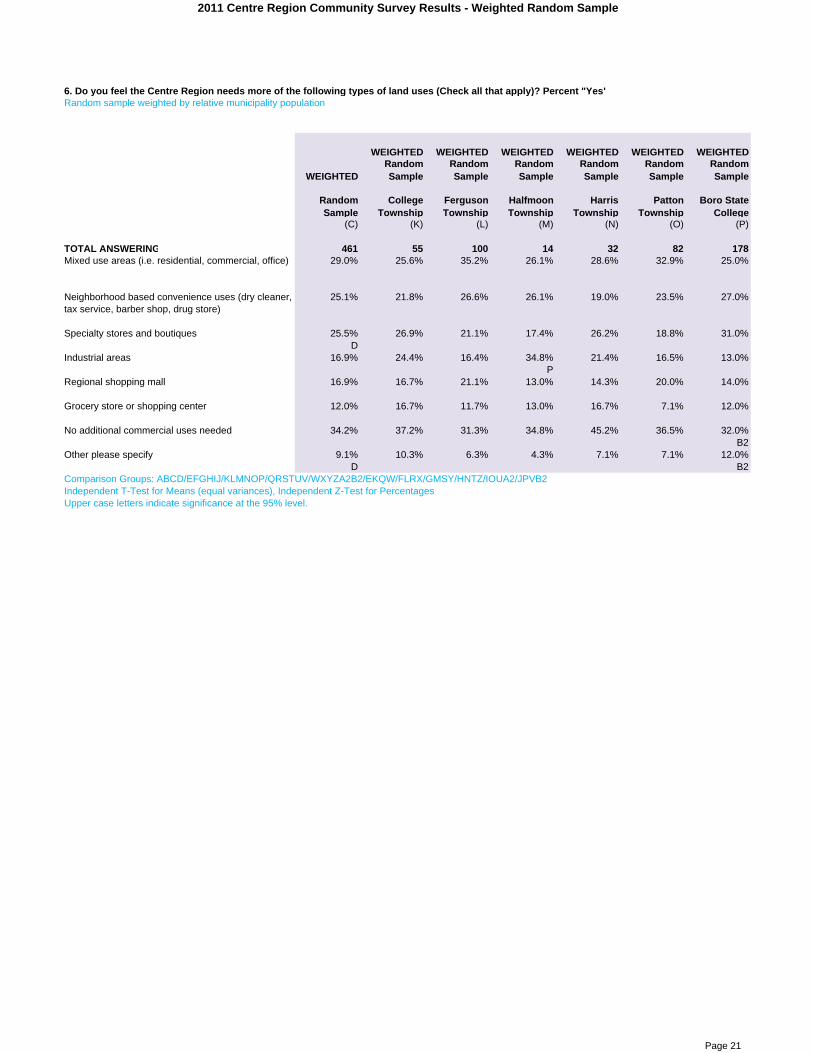
2011 Centre Region Community Survey Results - Weighted Random Sample
6. Do you feel the Centre Region needs more of the following types of land uses (Check all that apply)? Percent "Yes"Random sample weighted by relative municipality population
WEIGHTED
WEIGHTED
WEIGHTED
WEIGHTED
WEIGHTED
WEIGHTED
WEIGHTED
Random Sample
Random Sample
Random Sample
Random Sample
Random Sample
Random Sample
Random Sample
College Township
Ferguson Township
Halfmoon Township
Harris Township
Patton Township
Boro State College
(C) (K) (L) (M) (N) (O) (P)
TOTAL ANSWERING 461 55 100 14 32 82 178Mixed use areas (i.e. residential, commercial, office) 29.0% 25.6% 35.2% 26.1% 28.6% 32.9% 25.0%
Neighborhood based convenience uses (dry cleaner, tax service, barber shop, drug store)
25.1% 21.8% 26.6% 26.1% 19.0% 23.5% 27.0%
Specialty stores and boutiques 25.5% 26.9% 21.1% 17.4% 26.2% 18.8% 31.0%D
Industrial areas 16.9% 24.4% 16.4% 34.8% 21.4% 16.5% 13.0%P
Regional shopping mall 16.9% 16.7% 21.1% 13.0% 14.3% 20.0% 14.0%
Grocery store or shopping center 12.0% 16.7% 11.7% 13.0% 16.7% 7.1% 12.0%
No additional commercial uses needed 34.2% 37.2% 31.3% 34.8% 45.2% 36.5% 32.0%B2
Other please specify 9.1% 10.3% 6.3% 4.3% 7.1% 7.1% 12.0%D B2
Comparison Groups: ABCD/EFGHIJ/KLMNOP/QRSTUV/WXYZA2B2/EKQW/FLRX/GMSY/HNTZ/IOUA2/JPVB2Independent T-Test for Means (equal variances), Independent Z-Test for PercentagesUpper case letters indicate significance at the 95% level.
Page 21

2011 Centre Region Community Survey Results - Weighted Random Sample
7. Do you feel your neighborhood needs more of the following types of land uses (Check all that apply)? Percent "Yes"Random sample weighted by relative municipality population
WEIGHTED
WEIGHTED
WEIGHTED
WEIGHTED
WEIGHTED
WEIGHTED
WEIGHTED
Random Sample
Random Sample
Random Sample
Random Sample
Random Sample
Random Sample
Random Sample
College Township
Ferguson Township
Halfmoon Township
Harris Township
Patton Township
Boro State College
(C) (K) (L) (M) (N) (O) (P)
TOTAL ANSWERING 461 55 100 14 32 82 178Neighborhood based convenience uses (dry cleaner, tax service, barber shop, drug store)
16.4% 15.4% 17.2% 30.4% 16.7% 16.5% 15.0%
Mixed use areas (i.e. residential, commercial, office) 10.1% 6.4% 12.5% 8.7% 14.3% 8.2% 10.0%
Grocery store or shopping center 10.4% 7.7% 10.9% 30.4% 21.4% 4.7% 10.0%KOP O
Specialty stores and boutiques 9.7% 14.1% 7.8% 4.3% 7.1% 5.9% 12.0%Regional shopping mall 4.2% 7.7% 7.0% - - 3.5% 3.0%
Industrial areas 2.3% 6.4% 1.6% - 2.4% 3.5% 1.0%No additional commercial uses needed 58.5% 56.4% 58.6% 30.4% 66.7% 64.7% 57.0%
D M M M M B2MOther please specify 8.7% 11.5% 5.5% 21.7% 2.4% 5.9% 11.0%
N N NComparison Groups: ABCD/EFGHIJ/KLMNOP/QRSTUV/WXYZA2B2/EKQW/FLRX/GMSY/HNTZ/IOUA2/JPVB2Independent T-Test for Means (equal variances), Independent Z-Test for PercentagesUpper case letters indicate significance at the 95% level.
Page 22
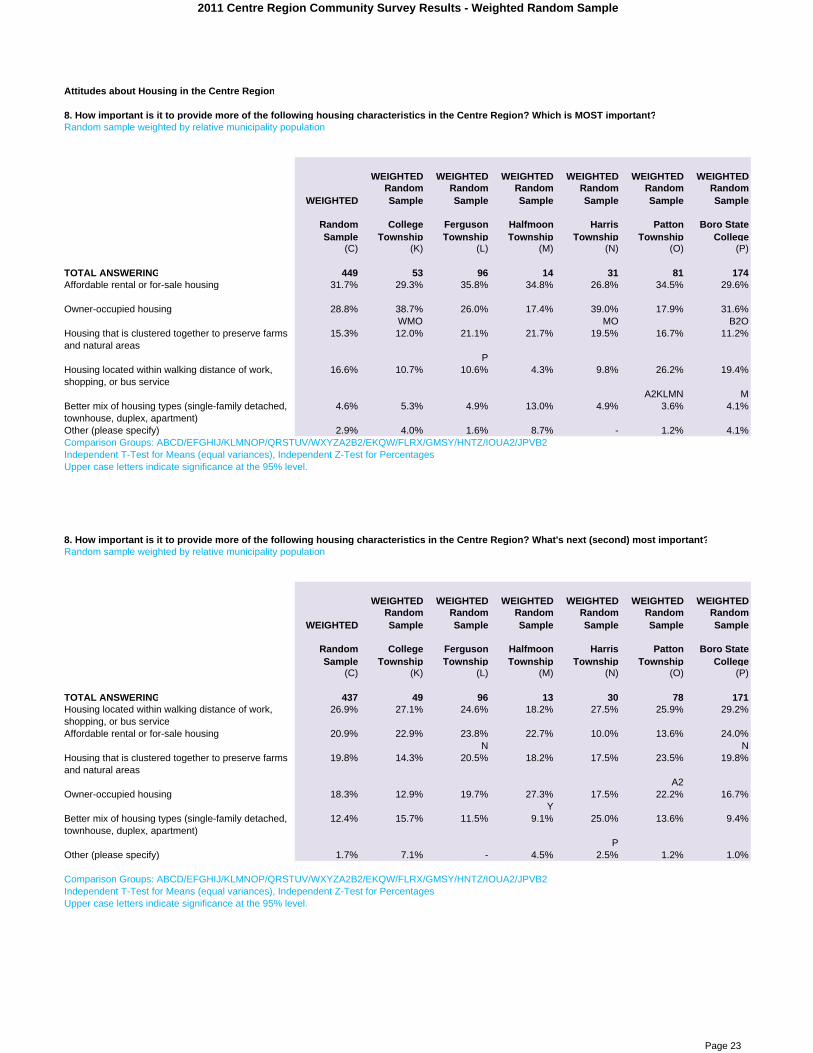
2011 Centre Region Community Survey Results - Weighted Random Sample
Attitudes about Housing in the Centre Region
8. How important is it to provide more of the following housing characteristics in the Centre Region? Which is MOST important?Random sample weighted by relative municipality population
WEIGHTED
WEIGHTED
WEIGHTED
WEIGHTED
WEIGHTED
WEIGHTED
WEIGHTED
Random Sample
Random Sample
Random Sample
Random Sample
Random Sample
Random Sample
Random Sample
College Township
Ferguson Township
Halfmoon Township
Harris Township
Patton Township
Boro State College
(C) (K) (L) (M) (N) (O) (P)
TOTAL ANSWERING 449 53 96 14 31 81 174Affordable rental or for-sale housing 31.7% 29.3% 35.8% 34.8% 26.8% 34.5% 29.6%
Owner-occupied housing 28.8% 38.7% 26.0% 17.4% 39.0% 17.9% 31.6%WMO MO B2O
Housing that is clustered together to preserve farms and natural areas
15.3% 12.0% 21.1% 21.7% 19.5% 16.7% 11.2%
PHousing located within walking distance of work, shopping, or bus service
16.6% 10.7% 10.6% 4.3% 9.8% 26.2% 19.4%
A2KLMN MBetter mix of housing types (single-family detached, townhouse, duplex, apartment)
4.6% 5.3% 4.9% 13.0% 4.9% 3.6% 4.1%
Other (please specify) 2.9% 4.0% 1.6% 8.7% - 1.2% 4.1%Comparison Groups: ABCD/EFGHIJ/KLMNOP/QRSTUV/WXYZA2B2/EKQW/FLRX/GMSY/HNTZ/IOUA2/JPVB2Independent T-Test for Means (equal variances), Independent Z-Test for PercentagesUpper case letters indicate significance at the 95% level.
8. How important is it to provide more of the following housing characteristics in the Centre Region? What's next (second) most important?Random sample weighted by relative municipality population
WEIGHTED
WEIGHTED
WEIGHTED
WEIGHTED
WEIGHTED
WEIGHTED
WEIGHTED
Random Sample
Random Sample
Random Sample
Random Sample
Random Sample
Random Sample
Random Sample
College Township
Ferguson Township
Halfmoon Township
Harris Township
Patton Township
Boro State College
(C) (K) (L) (M) (N) (O) (P)
TOTAL ANSWERING 437 49 96 13 30 78 171Housing located within walking distance of work, shopping, or bus service
26.9% 27.1% 24.6% 18.2% 27.5% 25.9% 29.2%
Affordable rental or for-sale housing 20.9% 22.9% 23.8% 22.7% 10.0% 13.6% 24.0%N N
Housing that is clustered together to preserve farms and natural areas
19.8% 14.3% 20.5% 18.2% 17.5% 23.5% 19.8%
A2Owner-occupied housing 18.3% 12.9% 19.7% 27.3% 17.5% 22.2% 16.7%
YBetter mix of housing types (single-family detached, townhouse, duplex, apartment)
12.4% 15.7% 11.5% 9.1% 25.0% 13.6% 9.4%
POther (please specify) 1.7% 7.1% - 4.5% 2.5% 1.2% 1.0%
Comparison Groups: ABCD/EFGHIJ/KLMNOP/QRSTUV/WXYZA2B2/EKQW/FLRX/GMSY/HNTZ/IOUA2/JPVB2Independent T-Test for Means (equal variances), Independent Z-Test for PercentagesUpper case letters indicate significance at the 95% level.
Page 23

2011 Centre Region Community Survey Results - Weighted Random Sample
8. How important is it to provide more of the following housing characteristics in the Centre Region? What's next (third) most important?Random sample weighted by relative municipality population
WEIGHTED
WEIGHTED
WEIGHTED
WEIGHTED
WEIGHTED
WEIGHTED
WEIGHTED
Random Sample
Random Sample
Random Sample
Random Sample
Random Sample
Random Sample
Random Sample
College Township
Ferguson Township
Halfmoon Township
Harris Township
Patton Township
Boro State College
(C) (K) (L) (M) (N) (O) (P)
TOTAL ANSWERING 430 46 94 12 30 78 169Housing located within walking distance of work, shopping, or bus service
25.2% 29.2% 25.0% 23.8% 15.0% 24.7% 26.3%
Housing that is clustered together to preserve farms and natural areas
25.7% 24.6% 22.5% 23.8% 40.0% 23.5% 26.3%
D LBetter mix of housing types (single-family detached, townhouse, duplex, apartment)
18.8% 10.8% 27.5% 4.8% 15.0% 18.5% 17.9%
KM M MAffordable rental or for-sale housing 16.0% 15.4% 12.5% 14.3% 20.0% 17.3% 16.8%Owner-occupied housing 13.1% 16.9% 11.7% 33.3% 10.0% 13.6% 11.6%
LNPOther (please specify) 1.4% 3.1% 0.8% - - 2.5% 1.1%
Comparison Groups: ABCD/EFGHIJ/KLMNOP/QRSTUV/WXYZA2B2/EKQW/FLRX/GMSY/HNTZ/IOUA2/JPVB2Independent T-Test for Means (equal variances), Independent Z-Test for PercentagesUpper case letters indicate significance at the 95% level.
8. How important is it to provide more of the following housing characteristics in the Centre Region? What's next (fourth) most important?Random sample weighted by relative municipality population
WEIGHTED
WEIGHTED
WEIGHTED
WEIGHTED
WEIGHTED
WEIGHTED
WEIGHTED
Random Sample
Random Sample
Random Sample
Random Sample
Random Sample
Random Sample
Random Sample
College Township
Ferguson Township
Halfmoon Township
Harris Township
Patton Township
Boro State College
(C) (K) (L) (M) (N) (O) (P)
TOTAL ANSWERING 420 45 92 12 30 77 164Better mix of housing types (single-family detached, townhouse, duplex, apartment)
25.1% 34.4% 18.8% 38.1% 25.6% 25.0% 25.0%
L A2Housing located within walking distance of work, shopping, or bus service
18.6% 20.3% 19.7% 19.0% 30.8% 16.3% 16.3%
Housing that is clustered together to preserve farms and natural areas
21.0% 26.6% 23.9% 19.0% 12.8% 16.3% 21.7%
Owner-occupied housing 17.6% 7.8% 21.4% 9.5% 10.3% 21.3% 18.5%XK K K
Affordable rental or for-sale housing 17.1% 9.4% 16.2% 14.3% 17.9% 20.0% 18.5%Other (please specify) 0.6% 1.6% - - 2.6% 1.3% -
Comparison Groups: ABCD/EFGHIJ/KLMNOP/QRSTUV/WXYZA2B2/EKQW/FLRX/GMSY/HNTZ/IOUA2/JPVB2Independent T-Test for Means (equal variances), Independent Z-Test for PercentagesUpper case letters indicate significance at the 95% level.
Page 24

2011 Centre Region Community Survey Results - Weighted Random Sample
8. How important is it to provide more of the following housing characteristics in the Centre Region? What's next (fifth) most important?Random sample weighted by relative municipality population
WEIGHTED
WEIGHTED
WEIGHTED
WEIGHTED
WEIGHTED
WEIGHTED
WEIGHTED
Random Sample
Random Sample
Random Sample
Random Sample
Random Sample
Random Sample
Random Sample
College Township
Ferguson Township
Halfmoon Township
Harris Township
Patton Township
Boro State College
(C) (K) (L) (M) (N) (O) (P)
TOTAL ANSWERING 416 44 92 12 28 76 164Better mix of housing types (single-family detached, townhouse, duplex, apartment)
37.1% 31.7% 35.0% 28.6% 32.4% 36.7% 41.3%
X B2Owner-occupied housing 20.5% 17.5% 20.5% 9.5% 18.9% 24.1% 20.7%Housing that is clustered together to preserve farms and natural areas
17.7% 20.6% 12.8% 19.0% 13.5% 21.5% 18.5%
Housing located within walking distance of work, shopping, or bus service
12.0% 9.5% 20.5% 33.3% 16.2% 5.1% 8.7%
KOP KOPAffordable rental or for-sale housing 11.8% 17.5% 11.1% 9.5% 18.9% 11.4% 9.8%Other (please specify) 1.0% 3.2% - - - 1.3% 1.1%
Comparison Groups: ABCD/EFGHIJ/KLMNOP/QRSTUV/WXYZA2B2/EKQW/FLRX/GMSY/HNTZ/IOUA2/JPVB2Independent T-Test for Means (equal variances), Independent Z-Test for PercentagesUpper case letters indicate significance at the 95% level.
Page 25

2011 Centre Region Community Survey Results - Weighted Random Sample
9. How important is it to increase each of the following housing types in the Centre Region? First, which is MOST important?Random sample weighted by relative municipality population
WEIGHTED
WEIGHTED
WEIGHTED
WEIGHTED
WEIGHTED
WEIGHTED
WEIGHTED
Random Sample
Random Sample
Random Sample
Random Sample
Random Sample
Random Sample
Random Sample
College Township
Ferguson Township
Halfmoon Township
Harris Township
Patton Township
Boro State College
(C) (K) (L) (M) (N) (O) (P)
TOTAL ANSWERING 420 47 94 12 31 73 162Single-family detached homes 52.3% 53.7% 53.3% 57.1% 78.0% 56.6% 44.0%
KLOPSenior housing (55+) 19.7% 23.9% 21.7% 28.6% 12.2% 18.4% 18.7%
Condiminiums or townhouses 7.6% 4.5% 8.3% 4.8% 7.3% 9.2% 7.7%Apartment buildings/complexes 10.1% 9.0% 7.5% - 2.4% 5.3% 16.5%
D LNOApartments in single-family homes 6.6% 3.0% 5.0% - - 5.3% 11.0%
KDuplexes 2.7% 4.5% 3.3% 4.8% - 2.6% 2.2%Mobile homes 1.0% 1.5% 0.8% 4.8% - 2.6% -Comparison Groups: ABCD/EFGHIJ/KLMNOP/QRSTUV/WXYZA2B2/EKQW/FLRX/GMSY/HNTZ/IOUA2/JPVB2Independent T-Test for Means (equal variances), Independent Z-Test for PercentagesUpper case letters indicate significance at the 95% level.
9. How important is it to increase each of the following housing types in the Centre Region? Of those remaining, which would you say is the second Random sample weighted by relative municipality population
WEIGHTED
WEIGHTED
WEIGHTED
WEIGHTED
WEIGHTED
WEIGHTED
WEIGHTED
Random Sample
Random Sample
Random Sample
Random Sample
Random Sample
Random Sample
Random Sample
College Township
Ferguson Township
Halfmoon Township
Harris Township
Patton Township
Boro State College
(C) (K) (L) (M) (N) (O) (P)
TOTAL ANSWERING 410 42 93 12 30 70 162Condiminiums or townhouses 30.0% 35.0% 26.9% 5.0% 37.5% 30.1% 30.8%
D M M ZM M B2MSenior housing (55+) 18.7% 20.0% 21.0% 25.0% 15.0% 23.3% 15.4%Single-family detached homes 15.4% 11.7% 16.0% 15.0% 2.5% 15.1% 18.7%
N N NDuplexes 13.0% 11.7% 11.8% 25.0% 12.5% 8.2% 15.4%
Apartments in single-family homes 12.1% 11.7% 14.3% 20.0% 20.0% 9.6% 9.9%Apartment buildings/complexes 8.4% 6.7% 8.4% 5.0% 10.0% 11.0% 7.7%Mobile homes 2.4% 3.3% 1.7% 5.0% 2.5% 2.7% 2.2%Comparison Groups: ABCD/EFGHIJ/KLMNOP/QRSTUV/WXYZA2B2/EKQW/FLRX/GMSY/HNTZ/IOUA2/JPVB2Independent T-Test for Means (equal variances), Independent Z-Test for PercentagesUpper case letters indicate significance at the 95% level.
Page 26

2011 Centre Region Community Survey Results - Weighted Random Sample
9. How important is it to increase each of the following housing types in the Centre Region? Which would you say is the next (third) most important?Random sample weighted by relative municipality population
WEIGHTED
WEIGHTED
WEIGHTED
WEIGHTED
WEIGHTED
WEIGHTED
WEIGHTED
Random Sample
Random Sample
Random Sample
Random Sample
Random Sample
Random Sample
Random Sample
College Township
Ferguson Township
Halfmoon Township
Harris Township
Patton Township
Boro State College
(C) (K) (L) (M) (N) (O) (P)
TOTAL ANSWERING 396 40 93 12 29 68 155Condiminiums or townhouses 24.9% 31.6% 22.7% 40.0% 26.3% 20.0% 25.3%Duplexes 25.9% 26.3% 25.2% 5.0% 18.4% 24.3% 29.9%
M M M MSenior housing (55+) 15.8% 12.3% 16.8% 25.0% 23.7% 21.4% 11.5%Apartments in single-family homes 10.9% 10.5% 10.1% 5.0% 13.2% 8.6% 12.6%
Apartment buildings/complexes 11.0% 10.5% 9.2% 10.0% 13.2% 14.3% 10.3%Single-family detached homes 9.1% 5.3% 12.6% 10.0% 2.6% 11.4% 8.0%
NMobile homes 2.4% 3.5% 3.4% 5.0% 2.6% - 2.3%Comparison Groups: ABCD/EFGHIJ/KLMNOP/QRSTUV/WXYZA2B2/EKQW/FLRX/GMSY/HNTZ/IOUA2/JPVB2Independent T-Test for Means (equal variances), Independent Z-Test for PercentagesUpper case letters indicate significance at the 95% level.
9. How important is it to increase each of the following housing types in the Centre Region? Which would you say is the next (fourth) most importantRandom sample weighted by relative municipality population
WEIGHTED
WEIGHTED
WEIGHTED
WEIGHTED
WEIGHTED
WEIGHTED
WEIGHTED
Random Sample
Random Sample
Random Sample
Random Sample
Random Sample
Random Sample
Random Sample
College Township
Ferguson Township
Halfmoon Township
Harris Township
Patton Township
Boro State College
(C) (K) (L) (M) (N) (O) (P)
TOTAL ANSWERING 390 38 92 12 29 68 151Duplexes 22.2% 25.9% 20.3% 20.0% 21.1% 25.7% 21.2%Condiminiums or townhouses 19.6% 13.0% 19.5% 30.0% 26.3% 22.9% 17.6%
Apartment buildings/complexes 17.6% 20.4% 22.9% 15.0% 21.1% 15.7% 14.1%
Apartments in single-family homes 17.6% 13.0% 22.0% 10.0% 13.2% 17.1% 17.6%X
Senior housing (55+) 8.5% 13.0% 6.8% 10.0% 5.3% 10.0% 8.2%Single-family detached homes 9.4% 9.3% 6.8% - 2.6% 7.1% 14.1%
NMobile homes 5.2% 5.6% 1.7% 15.0% 10.5% 1.4% 7.1%
Comparison Groups: ABCD/EFGHIJ/KLMNOP/QRSTUV/WXYZA2B2/EKQW/FLRX/GMSY/HNTZ/IOUA2/JPVB2Independent T-Test for Means (equal variances), Independent Z-Test for PercentagesUpper case letters indicate significance at the 95% level.
Page 27

2011 Centre Region Community Survey Results - Weighted Random Sample
9. How important is it to increase each of the following housing types in the Centre Region? Which would you say is the next (fifth) most important?Random sample weighted by relative municipality population
WEIGHTED
WEIGHTED
WEIGHTED
WEIGHTED
WEIGHTED
WEIGHTED
WEIGHTED
Random Sample
Random Sample
Random Sample
Random Sample
Random Sample
Random Sample
Random Sample
College Township
Ferguson Township
Halfmoon Township
Harris Township
Patton Township
Boro State College
(C) (K) (L) (M) (N) (O) (P)
TOTAL ANSWERING 385 37 92 12 28 65 151Apartment buildings/complexes 20.9% 11.3% 21.4% 35.0% 24.3% 23.9% 20.0%
KApartments in single-family homes 20.4% 17.0% 15.4% 20.0% 21.6% 29.9% 20.0%
LDuplexes 17.4% 15.1% 21.4% 15.0% 32.4% 14.9% 14.1%
OP B2Mobile homes 16.3% 28.3% 15.4% 5.0% 8.1% 13.4% 17.6%
MNO MSenior housing (55+) 11.0% 11.3% 12.8% - 8.1% 4.5% 14.1%
O OCondiminiums or townhouses 8.9% 5.7% 11.1% 15.0% - 11.9% 8.2%Single-family detached homes 5.0% 11.3% 2.6% 10.0% 5.4% 1.5% 5.9%
OComparison Groups: ABCD/EFGHIJ/KLMNOP/QRSTUV/WXYZA2B2/EKQW/FLRX/GMSY/HNTZ/IOUA2/JPVB2Independent T-Test for Means (equal variances), Independent Z-Test for PercentagesUpper case letters indicate significance at the 95% level.
Page 28

2011 Centre Region Community Survey Results - Weighted Random Sample
Random sample weighted by relative municipality population
WEIGHTED
WEIGHTED
WEIGHTED
WEIGHTED
WEIGHTED
WEIGHTED
WEIGHTED
Random Sample
Random Sample
Random Sample
Random Sample
Random Sample
Random Sample
Random Sample
College Township
Ferguson Township
Halfmoon Township
Harris Township
Patton Township
Boro State College
(C) (K) (L) (M) (N) (O) (P)
TOTAL ANSWERING 459 53 100 14 32 82 178Yes 41.2% 43.4% 43.0% 47.8% 31.0% 38.8% 42.0%
No 55.4% 56.6% 54.7% 47.8% 64.3% 54.1% 55.0%B2
Don't Know 3.4% - 2.3% 4.3% 4.8% 7.1% 3.0%
Comparison Groups: ABCD/EFGHIJ/KLMNOP/QRSTUV/WXYZA2B2/EKQW/FLRX/GMSY/HNTZ/IOUA2/JPVB2Independent T-Test for Means (equal variances), Independent Z-Test for PercentagesUpper case letters indicate significance at the 95% level.
10. Do you spend more than 30% of your household income on housing costs (Housing costs include principal, interest, insurance and taxes for homeowners; rent and utilities for renters)?
Page 29
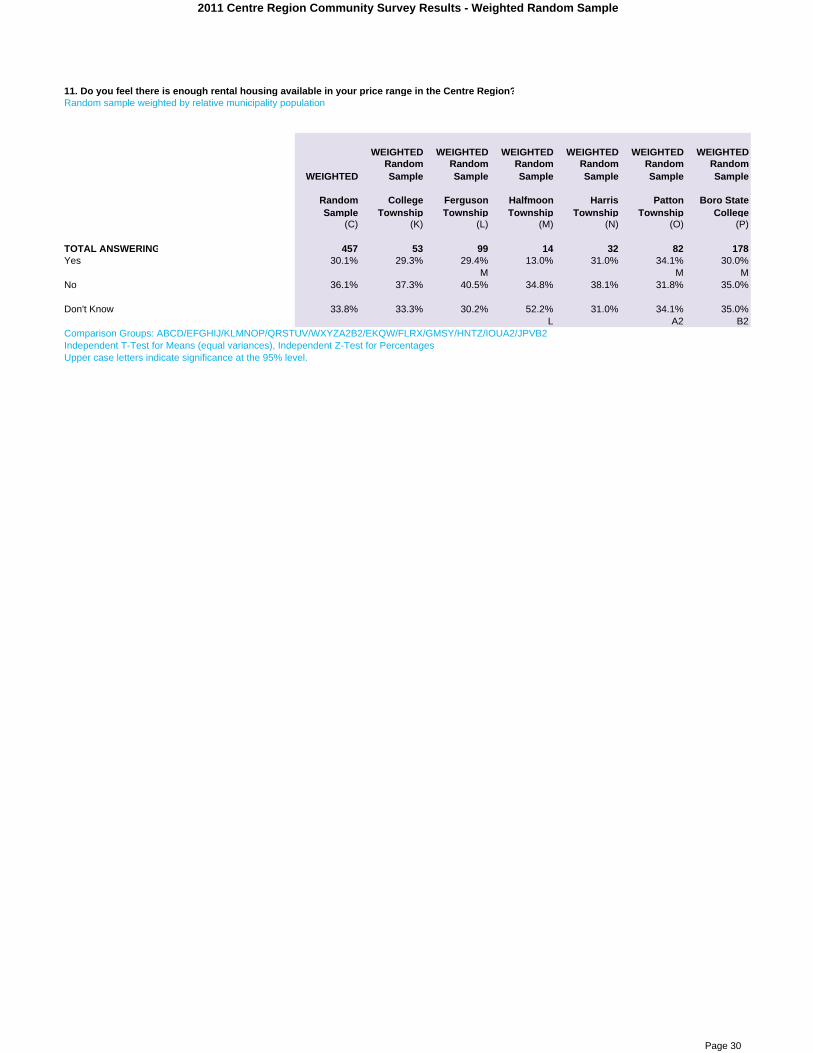
2011 Centre Region Community Survey Results - Weighted Random Sample
11. Do you feel there is enough rental housing available in your price range in the Centre Region?Random sample weighted by relative municipality population
WEIGHTED
WEIGHTED
WEIGHTED
WEIGHTED
WEIGHTED
WEIGHTED
WEIGHTED
Random Sample
Random Sample
Random Sample
Random Sample
Random Sample
Random Sample
Random Sample
College Township
Ferguson Township
Halfmoon Township
Harris Township
Patton Township
Boro State College
(C) (K) (L) (M) (N) (O) (P)
TOTAL ANSWERING 457 53 99 14 32 82 178Yes 30.1% 29.3% 29.4% 13.0% 31.0% 34.1% 30.0%
M M MNo 36.1% 37.3% 40.5% 34.8% 38.1% 31.8% 35.0%
Don't Know 33.8% 33.3% 30.2% 52.2% 31.0% 34.1% 35.0%L A2 B2
Comparison Groups: ABCD/EFGHIJ/KLMNOP/QRSTUV/WXYZA2B2/EKQW/FLRX/GMSY/HNTZ/IOUA2/JPVB2Independent T-Test for Means (equal variances), Independent Z-Test for PercentagesUpper case letters indicate significance at the 95% level.
Page 30

2011 Centre Region Community Survey Results - Weighted Random Sample
12. Do you feel there are enough homes available for purchase in your price range in the Centre Region?Random sample weighted by relative municipality population
WEIGHTED
WEIGHTED
WEIGHTED
WEIGHTED
WEIGHTED
WEIGHTED
WEIGHTED
Random Sample
Random Sample
Random Sample
Random Sample
Random Sample
Random Sample
Random Sample
College Township
Ferguson Township
Halfmoon Township
Harris Township
Patton Township
Boro State College
(C) (K) (L) (M) (N) (O) (P)
TOTAL ANSWERING 456 53 100 14 32 82 176Yes 43.1% 41.3% 51.2% 52.2% 45.2% 42.4% 38.4%
B2No 40.1% 50.7% 37.8% 30.4% 40.5% 38.8% 39.4%
Don't Know 16.8% 8.0% 11.0% 17.4% 14.3% 18.8% 22.2%K KL
Comparison Groups: ABCD/EFGHIJ/KLMNOP/QRSTUV/WXYZA2B2/EKQW/FLRX/GMSY/HNTZ/IOUA2/JPVB2Independent T-Test for Means (equal variances), Independent Z-Test for PercentagesUpper case letters indicate significance at the 95% level.
Page 31
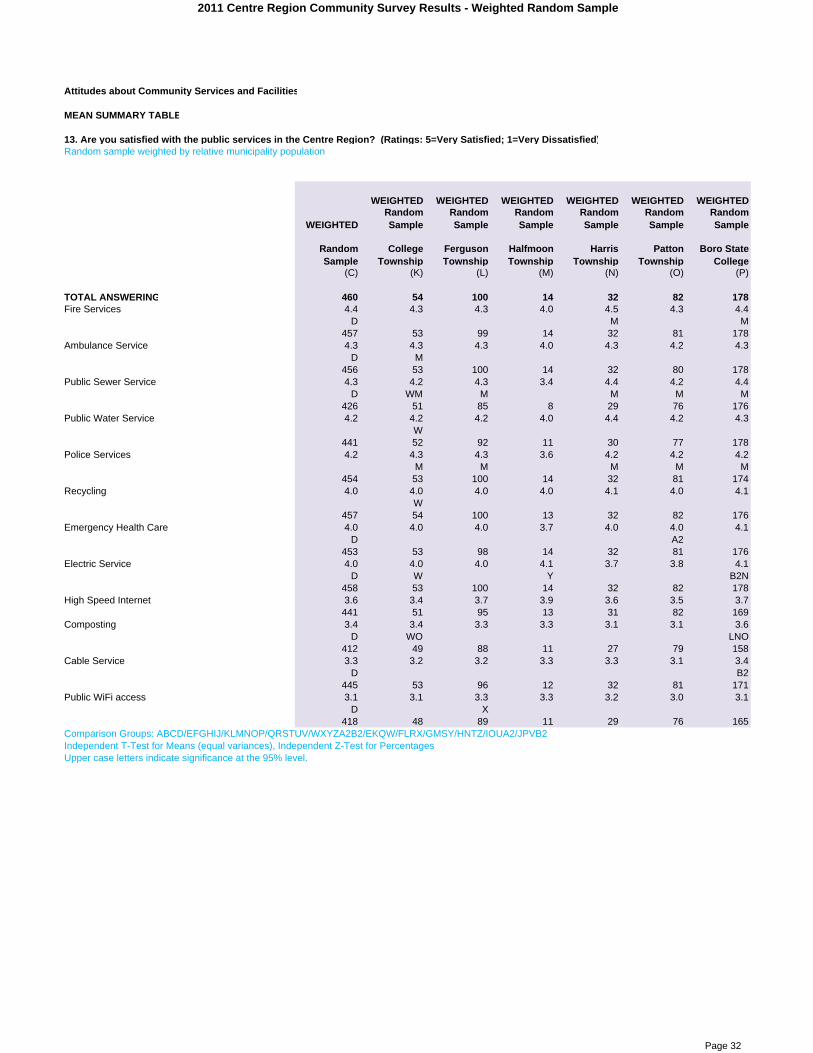
2011 Centre Region Community Survey Results - Weighted Random Sample
Attitudes about Community Services and Facilities
MEAN SUMMARY TABLE
13. Are you satisfied with the public services in the Centre Region? (Ratings: 5=Very Satisfied; 1=Very Dissatisfied)Random sample weighted by relative municipality population
WEIGHTED
WEIGHTED
WEIGHTED
WEIGHTED
WEIGHTED
WEIGHTED
WEIGHTED
Random Sample
Random Sample
Random Sample
Random Sample
Random Sample
Random Sample
Random Sample
College Township
Ferguson Township
Halfmoon Township
Harris Township
Patton Township
Boro State College
(C) (K) (L) (M) (N) (O) (P)
TOTAL ANSWERING 460 54 100 14 32 82 178Fire Services 4.4 4.3 4.3 4.0 4.5 4.3 4.4
D M M457 53 99 14 32 81 178
Ambulance Service 4.3 4.3 4.3 4.0 4.3 4.2 4.3D M
456 53 100 14 32 80 178Public Sewer Service 4.3 4.2 4.3 3.4 4.4 4.2 4.4
D WM M M M M426 51 85 8 29 76 176
Public Water Service 4.2 4.2 4.2 4.0 4.4 4.2 4.3W
441 52 92 11 30 77 178Police Services 4.2 4.3 4.3 3.6 4.2 4.2 4.2
M M M M M454 53 100 14 32 81 174
Recycling 4.0 4.0 4.0 4.0 4.1 4.0 4.1W
457 54 100 13 32 82 176Emergency Health Care 4.0 4.0 4.0 3.7 4.0 4.0 4.1
D A2453 53 98 14 32 81 176
Electric Service 4.0 4.0 4.0 4.1 3.7 3.8 4.1D W Y B2N
458 53 100 14 32 82 178High Speed Internet 3.6 3.4 3.7 3.9 3.6 3.5 3.7
441 51 95 13 31 82 169Composting 3.4 3.4 3.3 3.3 3.1 3.1 3.6
D WO LNO412 49 88 11 27 79 158
Cable Service 3.3 3.2 3.2 3.3 3.3 3.1 3.4D B2
445 53 96 12 32 81 171Public WiFi access 3.1 3.1 3.3 3.3 3.2 3.0 3.1
D X418 48 89 11 29 76 165
Comparison Groups: ABCD/EFGHIJ/KLMNOP/QRSTUV/WXYZA2B2/EKQW/FLRX/GMSY/HNTZ/IOUA2/JPVB2Independent T-Test for Means (equal variances), Independent Z-Test for PercentagesUpper case letters indicate significance at the 95% level.
Page 32

2011 Centre Region Community Survey Results - Weighted Random Sample
Police Services
13. Are you satisfied with the above public service in the Centre Region? (Ratings: 5=Very Satisfied; 1=Very Dissatisfied)Random sample weighted by relative municipality population
WEIGHTED
WEIGHTED
WEIGHTED
WEIGHTED
WEIGHTED
WEIGHTED
WEIGHTED
Random Sample
Random Sample
Random Sample
Random Sample
Random Sample
Random Sample
Random Sample
College Township
Ferguson Township
Halfmoon Township
Harris Township
Patton Township
Boro State College
(C) (K) (L) (M) (N) (O) (P)
TOTAL ANSWERING 456 53 100 14 32 82 174Very Satisfied 40.0% 40.8% 46.1% 17.4% 42.9% 32.9% 40.8%
M M M MSatisfied 47.7% 52.6% 41.4% 47.8% 45.2% 58.8% 44.9%
LUncertain/Undecided 5.4% 2.6% 5.5% 13.0% 2.4% 3.5% 7.1%
Dissatisfied 5.0% 3.9% 5.5% 17.4% 7.1% - 6.1%
Very Dissatisfied 1.5% - 0.8% 4.3% 2.4% 3.5% 1.0%Not Available 0.4% - 0.8% - - 1.2% -
MEAN 4.2 4.3 4.3 3.6 4.2 4.2 4.2M M M M M
Comparison Groups: ABCD/EFGHIJ/KLMNOP/QRSTUV/WXYZA2B2/EKQW/FLRX/GMSY/HNTZ/IOUA2/JPVB2Independent T-Test for Means (equal variances), Independent Z-Test for PercentagesUpper case letters indicate significance at the 95% level.
Fire Services
13. Are you satisfied with the above public service in the Centre Region? (Ratings: 5=Very Satisfied; 1=Very Dissatisfied)Random sample weighted by relative municipality population
WEIGHTED
WEIGHTED
WEIGHTED
WEIGHTED
WEIGHTED
WEIGHTED
WEIGHTED
Random Sample
Random Sample
Random Sample
Random Sample
Random Sample
Random Sample
Random Sample
College Township
Ferguson Township
Halfmoon Township
Harris Township
Patton Township
Boro State College
(C) (K) (L) (M) (N) (O) (P)
TOTAL ANSWERING 458 53 100 14 32 82 178Very Satisfied 47.3% 44.7% 46.5% 21.7% 50.0% 38.8% 54.0%
M M M MOSatisfied 41.6% 43.4% 38.6% 60.9% 47.6% 50.6% 36.0%
LP PUncertain/Undecided 10.2% 11.8% 11.8% 17.4% 2.4% 9.4% 10.0%
N N NDissatisfied 0.5% - 2.4% - - - -
Very Dissatisfied - - - - - - -Not Available 0.4% - 0.8% - - 1.2% -MEAN 4.4 4.3 4.3 4.0 4.5 4.3 4.4
D M MComparison Groups: ABCD/EFGHIJ/KLMNOP/QRSTUV/WXYZA2B2/EKQW/FLRX/GMSY/HNTZ/IOUA2/JPVB2Independent T-Test for Means (equal variances), Independent Z-Test for PercentagesUpper case letters indicate significance at the 95% level.
Page 33
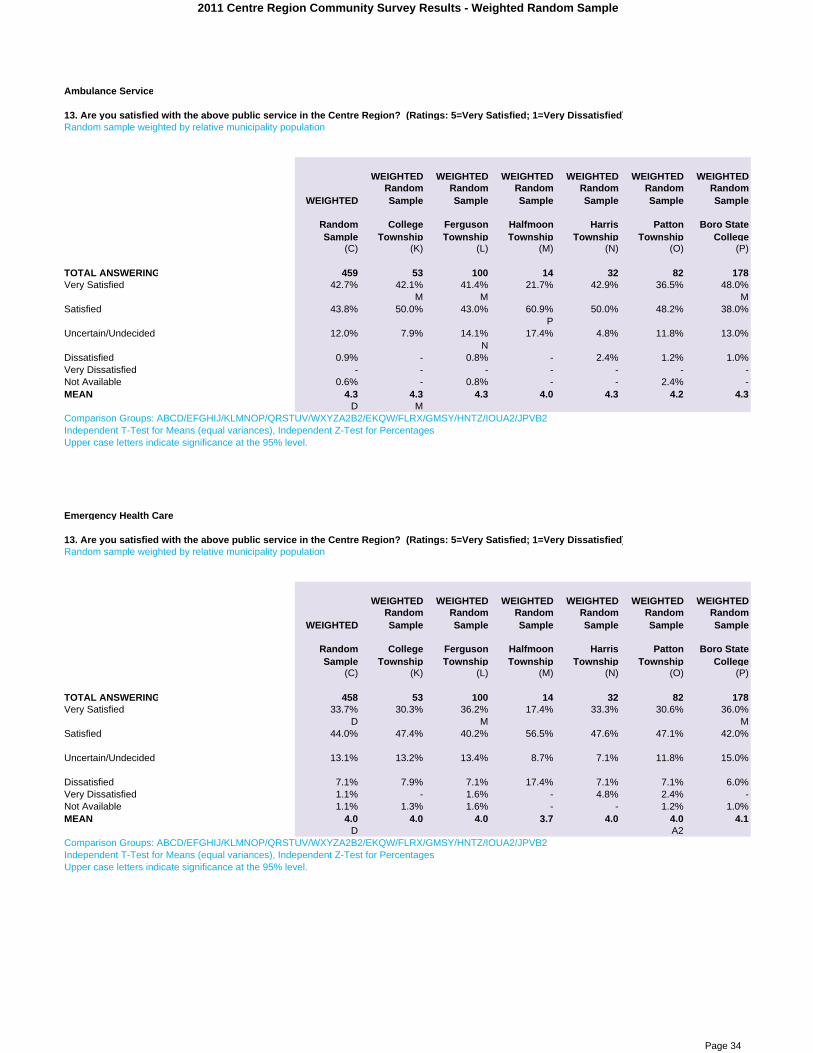
2011 Centre Region Community Survey Results - Weighted Random Sample
Ambulance Service
13. Are you satisfied with the above public service in the Centre Region? (Ratings: 5=Very Satisfied; 1=Very Dissatisfied)Random sample weighted by relative municipality population
WEIGHTED
WEIGHTED
WEIGHTED
WEIGHTED
WEIGHTED
WEIGHTED
WEIGHTED
Random Sample
Random Sample
Random Sample
Random Sample
Random Sample
Random Sample
Random Sample
College Township
Ferguson Township
Halfmoon Township
Harris Township
Patton Township
Boro State College
(C) (K) (L) (M) (N) (O) (P)
TOTAL ANSWERING 459 53 100 14 32 82 178Very Satisfied 42.7% 42.1% 41.4% 21.7% 42.9% 36.5% 48.0%
M M MSatisfied 43.8% 50.0% 43.0% 60.9% 50.0% 48.2% 38.0%
PUncertain/Undecided 12.0% 7.9% 14.1% 17.4% 4.8% 11.8% 13.0%
NDissatisfied 0.9% - 0.8% - 2.4% 1.2% 1.0%Very Dissatisfied - - - - - - -Not Available 0.6% - 0.8% - - 2.4% -MEAN 4.3 4.3 4.3 4.0 4.3 4.2 4.3
D MComparison Groups: ABCD/EFGHIJ/KLMNOP/QRSTUV/WXYZA2B2/EKQW/FLRX/GMSY/HNTZ/IOUA2/JPVB2Independent T-Test for Means (equal variances), Independent Z-Test for PercentagesUpper case letters indicate significance at the 95% level.
Emergency Health Care
13. Are you satisfied with the above public service in the Centre Region? (Ratings: 5=Very Satisfied; 1=Very Dissatisfied)Random sample weighted by relative municipality population
WEIGHTED
WEIGHTED
WEIGHTED
WEIGHTED
WEIGHTED
WEIGHTED
WEIGHTED
Random Sample
Random Sample
Random Sample
Random Sample
Random Sample
Random Sample
Random Sample
College Township
Ferguson Township
Halfmoon Township
Harris Township
Patton Township
Boro State College
(C) (K) (L) (M) (N) (O) (P)
TOTAL ANSWERING 458 53 100 14 32 82 178Very Satisfied 33.7% 30.3% 36.2% 17.4% 33.3% 30.6% 36.0%
D M MSatisfied 44.0% 47.4% 40.2% 56.5% 47.6% 47.1% 42.0%
Uncertain/Undecided 13.1% 13.2% 13.4% 8.7% 7.1% 11.8% 15.0%
Dissatisfied 7.1% 7.9% 7.1% 17.4% 7.1% 7.1% 6.0%Very Dissatisfied 1.1% - 1.6% - 4.8% 2.4% -Not Available 1.1% 1.3% 1.6% - - 1.2% 1.0%MEAN 4.0 4.0 4.0 3.7 4.0 4.0 4.1
D A2Comparison Groups: ABCD/EFGHIJ/KLMNOP/QRSTUV/WXYZA2B2/EKQW/FLRX/GMSY/HNTZ/IOUA2/JPVB2Independent T-Test for Means (equal variances), Independent Z-Test for PercentagesUpper case letters indicate significance at the 95% level.
Page 34

2011 Centre Region Community Survey Results - Weighted Random Sample
Public Water Service
13. Are you satisfied with the above public service in the Centre Region? (Ratings: 5=Very Satisfied; 1=Very Dissatisfied)Random sample weighted by relative municipality population
WEIGHTED
WEIGHTED
WEIGHTED
WEIGHTED
WEIGHTED
WEIGHTED
WEIGHTED
Random Sample
Random Sample
Random Sample
Random Sample
Random Sample
Random Sample
Random Sample
College Township
Ferguson Township
Halfmoon Township
Harris Township
Patton Township
Boro State College
(C) (K) (L) (M) (N) (O) (P)
TOTAL ANSWERING 458 53 100 14 32 82 178Very Satisfied 38.8% 34.7% 37.8% 8.7% 42.9% 30.6% 46.0%
WM M M M MOSatisfied 46.0% 54.7% 44.1% 65.2% 45.2% 50.6% 41.0%
PUncertain/Undecided 7.0% 5.3% 6.3% 8.7% 4.8% 9.4% 7.0%Dissatisfied 3.6% 2.7% 2.4% - 2.4% 3.5% 5.0%Very Dissatisfied 1.1% 1.3% 2.4% - - - 1.0%Not Available 3.6% 1.3% 7.1% 17.4% 4.8% 5.9% -
K KMEAN 4.2 4.2 4.2 4.0 4.4 4.2 4.3
WComparison Groups: ABCD/EFGHIJ/KLMNOP/QRSTUV/WXYZA2B2/EKQW/FLRX/GMSY/HNTZ/IOUA2/JPVB2Independent T-Test for Means (equal variances), Independent Z-Test for PercentagesUpper case letters indicate significance at the 95% level.
Public Sewer Service
13. Are you satisfied with the above public service in the Centre Region? (Ratings: 5=Very Satisfied; 1=Very Dissatisfied)Random sample weighted by relative municipality population
WEIGHTED
WEIGHTED
WEIGHTED
WEIGHTED
WEIGHTED
WEIGHTED
WEIGHTED
Random Sample
Random Sample
Random Sample
Random Sample
Random Sample
Random Sample
Random Sample
College Township
Ferguson Township
Halfmoon Township
Harris Township
Patton Township
Boro State College
(C) (K) (L) (M) (N) (O) (P)
TOTAL ANSWERING 454 52 99 14 32 82 176Very Satisfied 37.9% 33.8% 34.9% 4.3% 42.9% 29.4% 46.5%
D M M M M MOSatisfied 46.7% 58.1% 42.9% 30.4% 40.5% 51.8% 45.5%
D LMUncertain/Undecided 6.5% 4.1% 6.3% 8.7% 4.8% 9.4% 6.1%
Dissatisfied 2.0% 1.4% 0.8% 8.7% 2.4% 2.4% 2.0%Very Dissatisfied 0.6% 1.4% 1.6% 4.3% - - -Not Available 6.3% 1.4% 13.5% 43.5% 9.5% 7.1% -
XK KLNOMEAN 4.3 4.2 4.3 3.4 4.4 4.2 4.4
D WM M M M MComparison Groups: ABCD/EFGHIJ/KLMNOP/QRSTUV/WXYZA2B2/EKQW/FLRX/GMSY/HNTZ/IOUA2/JPVB2Independent T-Test for Means (equal variances), Independent Z-Test for PercentagesUpper case letters indicate significance at the 95% level.
Page 35

2011 Centre Region Community Survey Results - Weighted Random Sample
Recycling
13. Are you satisfied with the above public service in the Centre Region? (Ratings: 5=Very Satisfied; 1=Very Dissatisfied)Random sample weighted by relative municipality population
WEIGHTED
WEIGHTED
WEIGHTED
WEIGHTED
WEIGHTED
WEIGHTED
WEIGHTED
Random Sample
Random Sample
Random Sample
Random Sample
Random Sample
Random Sample
Random Sample
College Township
Ferguson Township
Halfmoon Township
Harris Township
Patton Township
Boro State College
(C) (K) (L) (M) (N) (O) (P)
TOTAL ANSWERING 458 54 100 14 32 82 176Very Satisfied 34.9% 28.6% 33.6% 21.7% 38.1% 36.5% 37.4%
Satisfied 47.8% 58.4% 44.5% 60.9% 47.6% 43.5% 47.5%
Uncertain/Undecided 5.1% 5.2% 9.4% 8.7% 4.8% 3.5% 3.0%P
Dissatisfied 8.5% 1.3% 8.6% 4.3% 9.5% 14.1% 8.1%K K K
Very Dissatisfied 3.4% 6.5% 3.1% - - 2.4% 4.0%Not Available 0.3% - 0.8% 4.3% - - -MEAN 4.0 4.0 4.0 4.0 4.1 4.0 4.1
WComparison Groups: ABCD/EFGHIJ/KLMNOP/QRSTUV/WXYZA2B2/EKQW/FLRX/GMSY/HNTZ/IOUA2/JPVB2Independent T-Test for Means (equal variances), Independent Z-Test for PercentagesUpper case letters indicate significance at the 95% level.
High Speed Internet
13. Are you satisfied with the above public service in the Centre Region? (Ratings: 5=Very Satisfied; 1=Very Dissatisfied)Random sample weighted by relative municipality population
WEIGHTED
WEIGHTED
WEIGHTED
WEIGHTED
WEIGHTED
WEIGHTED
WEIGHTED
Random Sample
Random Sample
Random Sample
Random Sample
Random Sample
Random Sample
Random Sample
College Township
Ferguson Township
Halfmoon Township
Harris Township
Patton Township
Boro State College
(C) (K) (L) (M) (N) (O) (P)
TOTAL ANSWERING 449 52 98 13 32 82 173Very Satisfied 18.5% 17.6% 24.0% 13.6% 19.0% 10.6% 19.6%
XOSatisfied 47.9% 40.5% 44.8% 72.7% 45.2% 56.5% 46.4%
KLNP KUncertain/Undecided 12.7% 12.2% 9.6% 4.5% 14.3% 11.8% 15.5%Dissatisfied 14.2% 17.6% 15.2% 4.5% 14.3% 16.5% 12.4%
M MVery Dissatisfied 4.7% 9.5% 3.2% 4.5% 4.8% 4.7% 4.1%Not Available 2.0% 2.7% 3.2% - 2.4% - 2.1%MEAN 3.6 3.4 3.7 3.9 3.6 3.5 3.7Comparison Groups: ABCD/EFGHIJ/KLMNOP/QRSTUV/WXYZA2B2/EKQW/FLRX/GMSY/HNTZ/IOUA2/JPVB2Independent T-Test for Means (equal variances), Independent Z-Test for PercentagesUpper case letters indicate significance at the 95% level.
Page 36

2011 Centre Region Community Survey Results - Weighted Random Sample
Public WiFi access
13. Are you satisfied with the above public service in the Centre Region? (Ratings: 5=Very Satisfied; 1=Very Dissatisfied)Random sample weighted by relative municipality population
WEIGHTED
WEIGHTED
WEIGHTED
WEIGHTED
WEIGHTED
WEIGHTED
WEIGHTED
Random Sample
Random Sample
Random Sample
Random Sample
Random Sample
Random Sample
Random Sample
College Township
Ferguson Township
Halfmoon Township
Harris Township
Patton Township
Boro State College
(C) (K) (L) (M) (N) (O) (P)
TOTAL ANSWERING 448 51 98 14 32 82 171Very Satisfied 7.8% 11.0% 12.0% 4.3% 2.4% 4.7% 7.3%
N NOSatisfied 25.3% 21.9% 22.4% 21.7% 31.0% 23.5% 28.1%Uncertain/Undecided 37.5% 34.2% 37.6% 47.8% 40.5% 38.8% 36.5%
D A2Dissatisfied 18.2% 19.2% 16.0% 8.7% 11.9% 21.2% 19.8%Very Dissatisfied 4.5% 6.8% 2.4% - 4.8% 4.7% 5.2%
Not Available 6.6% 6.8% 9.6% 17.4% 9.5% 7.1% 3.1%P
MEAN 3.1 3.1 3.3 3.3 3.2 3.0 3.1D X
Comparison Groups: ABCD/EFGHIJ/KLMNOP/QRSTUV/WXYZA2B2/EKQW/FLRX/GMSY/HNTZ/IOUA2/JPVB2Independent T-Test for Means (equal variances), Independent Z-Test for PercentagesUpper case letters indicate significance at the 95% level.
Cable Service
13. Are you satisfied with the above public service in the Centre Region? (Ratings: 5=Very Satisfied; 1=Very Dissatisfied)Random sample weighted by relative municipality population
WEIGHTED
WEIGHTED
WEIGHTED
WEIGHTED
WEIGHTED
WEIGHTED
WEIGHTED
Random Sample
Random Sample
Random Sample
Random Sample
Random Sample
Random Sample
Random Sample
College Township
Ferguson Township
Halfmoon Township
Harris Township
Patton Township
Boro State College
(C) (K) (L) (M) (N) (O) (P)
TOTAL ANSWERING 452 53 99 14 32 82 173Very Satisfied 12.8% 17.1% 15.9% 8.7% 7.1% 5.9% 14.4%
D O XOSatisfied 41.8% 38.2% 34.1% 47.8% 52.4% 47.1% 42.3%
LUncertain/Undecided 14.3% 9.2% 11.1% 8.7% 11.9% 14.1% 18.6%
Dissatisfied 19.6% 18.4% 26.2% 13.0% 16.7% 18.8% 17.5%Very Dissatisfied 10.0% 17.1% 9.5% 13.0% 11.9% 12.9% 6.2%
PNot Available 1.6% - 3.2% 8.7% - 1.2% 1.0%
MEAN 3.3 3.2 3.2 3.3 3.3 3.1 3.4D B2
Comparison Groups: ABCD/EFGHIJ/KLMNOP/QRSTUV/WXYZA2B2/EKQW/FLRX/GMSY/HNTZ/IOUA2/JPVB2Independent T-Test for Means (equal variances), Independent Z-Test for PercentagesUpper case letters indicate significance at the 95% level.
Page 37
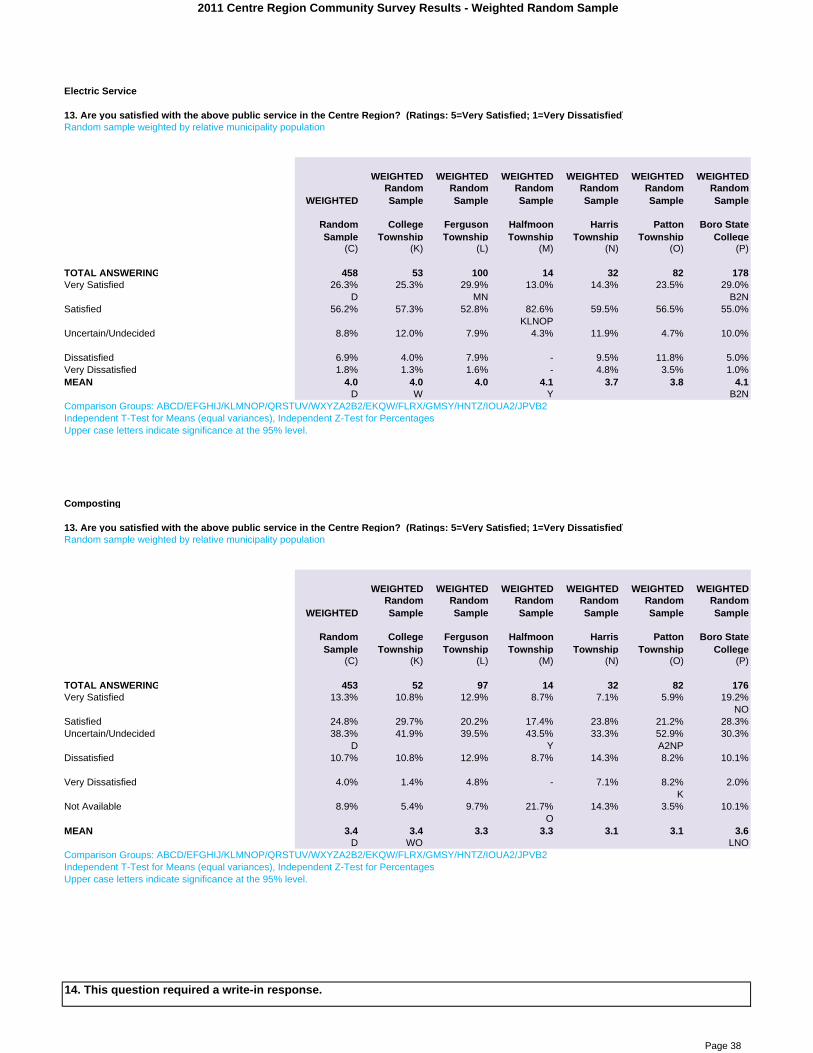
2011 Centre Region Community Survey Results - Weighted Random Sample
Electric Service
13. Are you satisfied with the above public service in the Centre Region? (Ratings: 5=Very Satisfied; 1=Very Dissatisfied)Random sample weighted by relative municipality population
WEIGHTED
WEIGHTED
WEIGHTED
WEIGHTED
WEIGHTED
WEIGHTED
WEIGHTED
Random Sample
Random Sample
Random Sample
Random Sample
Random Sample
Random Sample
Random Sample
College Township
Ferguson Township
Halfmoon Township
Harris Township
Patton Township
Boro State College
(C) (K) (L) (M) (N) (O) (P)
TOTAL ANSWERING 458 53 100 14 32 82 178Very Satisfied 26.3% 25.3% 29.9% 13.0% 14.3% 23.5% 29.0%
D MN B2NSatisfied 56.2% 57.3% 52.8% 82.6% 59.5% 56.5% 55.0%
KLNOPUncertain/Undecided 8.8% 12.0% 7.9% 4.3% 11.9% 4.7% 10.0%
Dissatisfied 6.9% 4.0% 7.9% - 9.5% 11.8% 5.0%Very Dissatisfied 1.8% 1.3% 1.6% - 4.8% 3.5% 1.0%MEAN 4.0 4.0 4.0 4.1 3.7 3.8 4.1
D W Y B2NComparison Groups: ABCD/EFGHIJ/KLMNOP/QRSTUV/WXYZA2B2/EKQW/FLRX/GMSY/HNTZ/IOUA2/JPVB2Independent T-Test for Means (equal variances), Independent Z-Test for PercentagesUpper case letters indicate significance at the 95% level.
Composting
13. Are you satisfied with the above public service in the Centre Region? (Ratings: 5=Very Satisfied; 1=Very Dissatisfied)Random sample weighted by relative municipality population
WEIGHTED
WEIGHTED
WEIGHTED
WEIGHTED
WEIGHTED
WEIGHTED
WEIGHTED
Random Sample
Random Sample
Random Sample
Random Sample
Random Sample
Random Sample
Random Sample
College Township
Ferguson Township
Halfmoon Township
Harris Township
Patton Township
Boro State College
(C) (K) (L) (M) (N) (O) (P)
TOTAL ANSWERING 453 52 97 14 32 82 176Very Satisfied 13.3% 10.8% 12.9% 8.7% 7.1% 5.9% 19.2%
NOSatisfied 24.8% 29.7% 20.2% 17.4% 23.8% 21.2% 28.3%Uncertain/Undecided 38.3% 41.9% 39.5% 43.5% 33.3% 52.9% 30.3%
D Y A2NPDissatisfied 10.7% 10.8% 12.9% 8.7% 14.3% 8.2% 10.1%
Very Dissatisfied 4.0% 1.4% 4.8% - 7.1% 8.2% 2.0%K
Not Available 8.9% 5.4% 9.7% 21.7% 14.3% 3.5% 10.1%O
MEAN 3.4 3.4 3.3 3.3 3.1 3.1 3.6D WO LNO
Comparison Groups: ABCD/EFGHIJ/KLMNOP/QRSTUV/WXYZA2B2/EKQW/FLRX/GMSY/HNTZ/IOUA2/JPVB2Independent T-Test for Means (equal variances), Independent Z-Test for PercentagesUpper case letters indicate significance at the 95% level.
14. This question required a write-in response.
Page 38

2011 Centre Region Community Survey Results - Weighted Random Sample
Page 39

2011 Centre Region Community Survey Results - Weighted Random Sample
Attitudes about Transportation
15. In a typical week (Monday-Friday) what is the primary purpose of your travel? (Check only one)Random sample weighted by relative municipality population
WEIGHTED
WEIGHTED
WEIGHTED
WEIGHTED
WEIGHTED
WEIGHTED
WEIGHTED
Random Sample
Random Sample
Random Sample
Random Sample
Random Sample
Random Sample
Random Sample
College Township
Ferguson Township
Halfmoon Township
Harris Township
Patton Township
Boro State College
(C) (K) (L) (M) (N) (O) (P)
TOTAL ANSWERING 449 54 99 14 32 80 171Work 63.3% 57.1% 71.4% 73.9% 73.8% 66.3% 56.3%
KP PShopping 21.4% 26.0% 17.5% 17.4% 16.7% 20.5% 24.0%
School 5.9% 5.2% 2.4% - 2.4% 3.6% 10.4%LN
Recreation 4.3% 5.2% 2.4% 4.3% - 6.0% 5.2%Medical Appointment 2.5% 3.9% 2.4% 4.3% 2.4% 2.4% 2.1%Other, please specify 2.5% 2.6% 4.0% - 4.8% 1.2% 2.1%Comparison Groups: ABCD/EFGHIJ/KLMNOP/QRSTUV/WXYZA2B2/EKQW/FLRX/GMSY/HNTZ/IOUA2/JPVB2Independent T-Test for Means (equal variances), Independent Z-Test for PercentagesUpper case letters indicate significance at the 95% level.
Page 40

2011 Centre Region Community Survey Results - Weighted Random Sample
16. What is the main mode of travel for your primary trip? (Check only one)Random sample weighted by relative municipality population
WEIGHTED
WEIGHTED
WEIGHTED
WEIGHTED
WEIGHTED
WEIGHTED
WEIGHTED
Random Sample
Random Sample
Random Sample
Random Sample
Random Sample
Random Sample
Random Sample
College Township
Ferguson Township
Halfmoon Township
Harris Township
Patton Township
Boro State College
(C) (K) (L) (M) (N) (O) (P)
TOTAL ANSWERING 453 55 100 13 32 79 174Automobile/truck/minivan/etc. 79.9% 85.9% 89.8% 100.0% 97.6% 93.9% 61.2%
P P GYKLOP KLP PPublic transportation 6.5% 6.4% 3.1% - - 6.1% 10.2%
LWalk 7.7% 3.8% 2.4% - - - 17.3%
KLBicycle 4.2% 2.6% 0.8% - 2.4% - 9.2%
LCarpool/vanpool 0.7% 1.3% 2.4% - - - -Motorcycle/scooter 0.7% - 1.6% - - - 1.0%Taxi 0.4% - - - - - 1.0%Comparison Groups: ABCD/EFGHIJ/KLMNOP/QRSTUV/WXYZA2B2/EKQW/FLRX/GMSY/HNTZ/IOUA2/JPVB2Independent T-Test for Means (equal variances), Independent Z-Test for PercentagesUpper case letters indicate significance at the 95% level.
Page 41
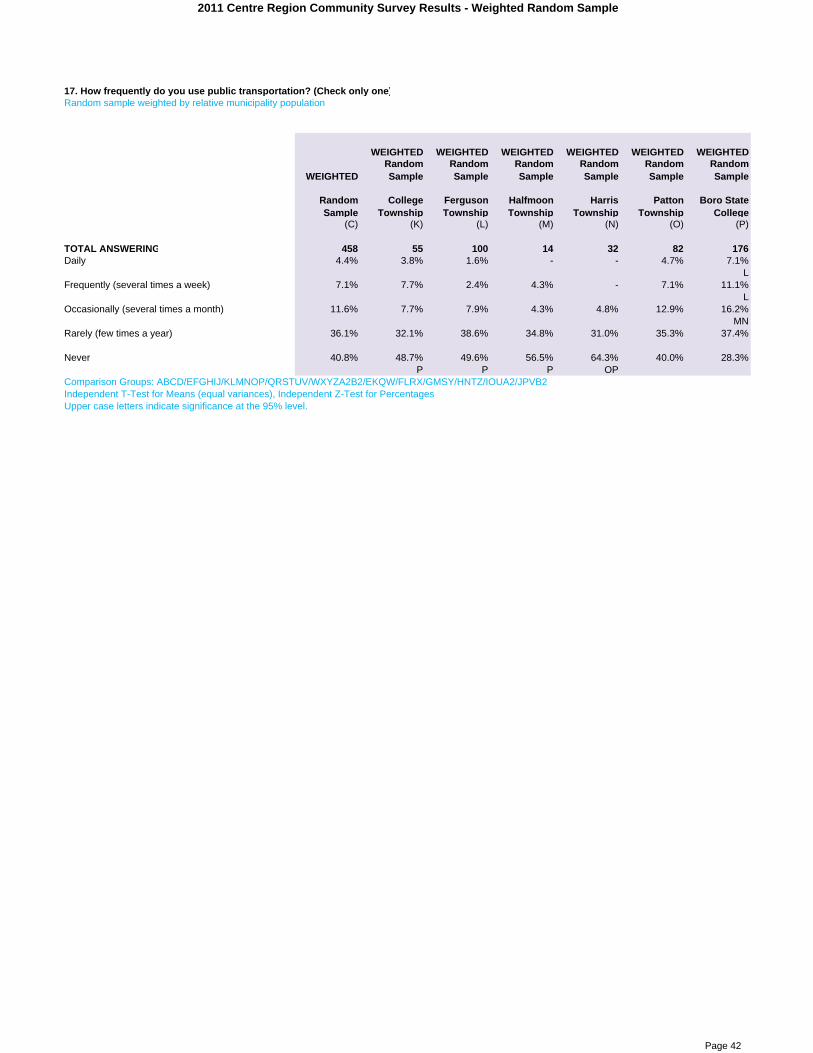
2011 Centre Region Community Survey Results - Weighted Random Sample
17. How frequently do you use public transportation? (Check only one)Random sample weighted by relative municipality population
WEIGHTED
WEIGHTED
WEIGHTED
WEIGHTED
WEIGHTED
WEIGHTED
WEIGHTED
Random Sample
Random Sample
Random Sample
Random Sample
Random Sample
Random Sample
Random Sample
College Township
Ferguson Township
Halfmoon Township
Harris Township
Patton Township
Boro State College
(C) (K) (L) (M) (N) (O) (P)
TOTAL ANSWERING 458 55 100 14 32 82 176Daily 4.4% 3.8% 1.6% - - 4.7% 7.1%
LFrequently (several times a week) 7.1% 7.7% 2.4% 4.3% - 7.1% 11.1%
LOccasionally (several times a month) 11.6% 7.7% 7.9% 4.3% 4.8% 12.9% 16.2%
MNRarely (few times a year) 36.1% 32.1% 38.6% 34.8% 31.0% 35.3% 37.4%
Never 40.8% 48.7% 49.6% 56.5% 64.3% 40.0% 28.3%P P P OP
Comparison Groups: ABCD/EFGHIJ/KLMNOP/QRSTUV/WXYZA2B2/EKQW/FLRX/GMSY/HNTZ/IOUA2/JPVB2Independent T-Test for Means (equal variances), Independent Z-Test for PercentagesUpper case letters indicate significance at the 95% level.
Page 42

2011 Centre Region Community Survey Results - Weighted Random Sample
18. Which do you use the most? (Check only one)Random sample weighted by relative municipality population
WEIGHTED
WEIGHTED
WEIGHTED
WEIGHTED
WEIGHTED
WEIGHTED
WEIGHTED
Random Sample
Random Sample
Random Sample
Random Sample
Random Sample
Random Sample
Random Sample
College Township
Ferguson Township
Halfmoon Township
Harris Township
Patton Township
Boro State College
(C) (K) (L) (M) (N) (O) (P)
TOTAL ANSWERING 260 27 48 5 10 49 121CATABus 68.8% 71.1% 68.9% 77.8% 84.6% 84.3% 60.3%
P A2LPCampus Loop/Link 25.6% 13.2% 23.0% 22.2% 15.4% 13.7% 35.3%
KOCentre County Office of Transportation Services van/bus
1.5% 5.3% 1.6% - - - 1.5%
CATARide 1.3% 2.6% 1.6% - - - 1.5%Other, please specify 2.8% 7.9% 4.9% - - 2.0% 1.5%Comparison Groups: ABCD/EFGHIJ/KLMNOP/QRSTUV/WXYZA2B2/EKQW/FLRX/GMSY/HNTZ/IOUA2/JPVB2Independent T-Test for Means (equal variances), Independent Z-Test for PercentagesUpper case letters indicate significance at the 95% level.
Page 43
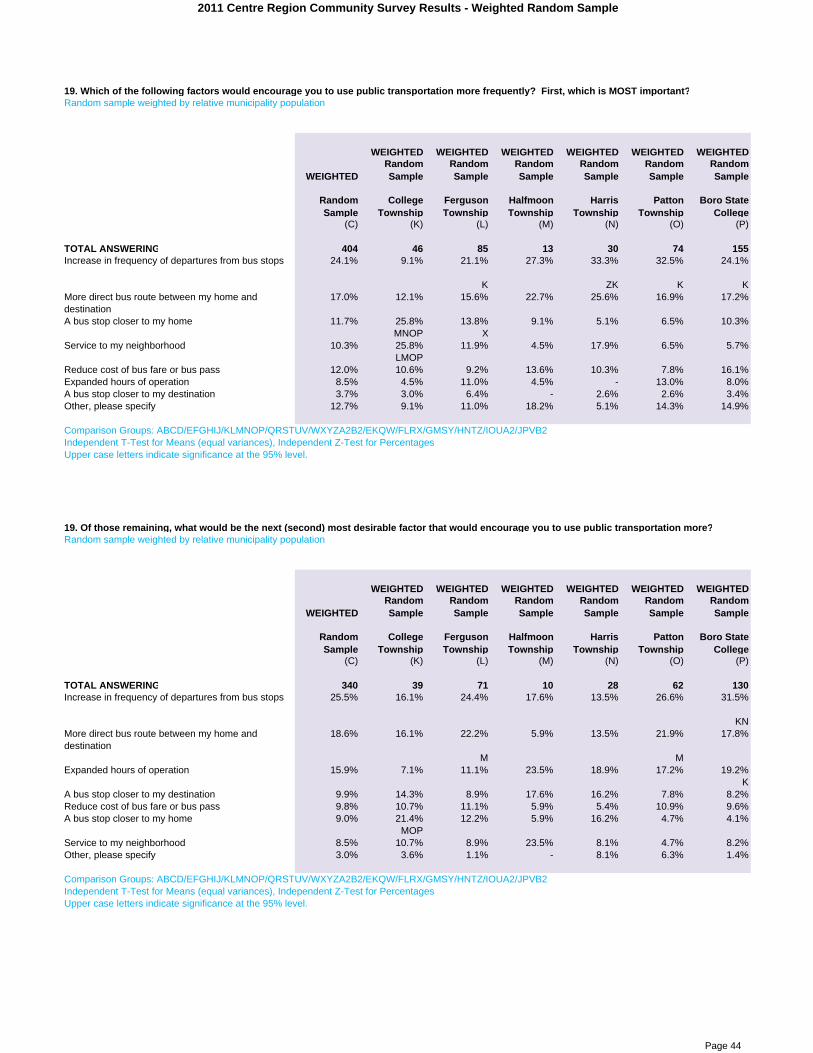
2011 Centre Region Community Survey Results - Weighted Random Sample
19. Which of the following factors would encourage you to use public transportation more frequently? First, which is MOST important?Random sample weighted by relative municipality population
WEIGHTED
WEIGHTED
WEIGHTED
WEIGHTED
WEIGHTED
WEIGHTED
WEIGHTED
Random Sample
Random Sample
Random Sample
Random Sample
Random Sample
Random Sample
Random Sample
College Township
Ferguson Township
Halfmoon Township
Harris Township
Patton Township
Boro State College
(C) (K) (L) (M) (N) (O) (P)
TOTAL ANSWERING 404 46 85 13 30 74 155Increase in frequency of departures from bus stops 24.1% 9.1% 21.1% 27.3% 33.3% 32.5% 24.1%
K ZK K KMore direct bus route between my home and destination
17.0% 12.1% 15.6% 22.7% 25.6% 16.9% 17.2%
A bus stop closer to my home 11.7% 25.8% 13.8% 9.1% 5.1% 6.5% 10.3%MNOP X
Service to my neighborhood 10.3% 25.8% 11.9% 4.5% 17.9% 6.5% 5.7%LMOP
Reduce cost of bus fare or bus pass 12.0% 10.6% 9.2% 13.6% 10.3% 7.8% 16.1%Expanded hours of operation 8.5% 4.5% 11.0% 4.5% - 13.0% 8.0%A bus stop closer to my destination 3.7% 3.0% 6.4% - 2.6% 2.6% 3.4%Other, please specify 12.7% 9.1% 11.0% 18.2% 5.1% 14.3% 14.9%
Comparison Groups: ABCD/EFGHIJ/KLMNOP/QRSTUV/WXYZA2B2/EKQW/FLRX/GMSY/HNTZ/IOUA2/JPVB2Independent T-Test for Means (equal variances), Independent Z-Test for PercentagesUpper case letters indicate significance at the 95% level.
19. Of those remaining, what would be the next (second) most desirable factor that would encourage you to use public transportation more?Random sample weighted by relative municipality population
WEIGHTED
WEIGHTED
WEIGHTED
WEIGHTED
WEIGHTED
WEIGHTED
WEIGHTED
Random Sample
Random Sample
Random Sample
Random Sample
Random Sample
Random Sample
Random Sample
College Township
Ferguson Township
Halfmoon Township
Harris Township
Patton Township
Boro State College
(C) (K) (L) (M) (N) (O) (P)
TOTAL ANSWERING 340 39 71 10 28 62 130Increase in frequency of departures from bus stops 25.5% 16.1% 24.4% 17.6% 13.5% 26.6% 31.5%
KNMore direct bus route between my home and destination
18.6% 16.1% 22.2% 5.9% 13.5% 21.9% 17.8%
M MExpanded hours of operation 15.9% 7.1% 11.1% 23.5% 18.9% 17.2% 19.2%
KA bus stop closer to my destination 9.9% 14.3% 8.9% 17.6% 16.2% 7.8% 8.2%Reduce cost of bus fare or bus pass 9.8% 10.7% 11.1% 5.9% 5.4% 10.9% 9.6%A bus stop closer to my home 9.0% 21.4% 12.2% 5.9% 16.2% 4.7% 4.1%
MOPService to my neighborhood 8.5% 10.7% 8.9% 23.5% 8.1% 4.7% 8.2%Other, please specify 3.0% 3.6% 1.1% - 8.1% 6.3% 1.4%
Comparison Groups: ABCD/EFGHIJ/KLMNOP/QRSTUV/WXYZA2B2/EKQW/FLRX/GMSY/HNTZ/IOUA2/JPVB2Independent T-Test for Means (equal variances), Independent Z-Test for PercentagesUpper case letters indicate significance at the 95% level.
Page 44

2011 Centre Region Community Survey Results - Weighted Random Sample
19. What would be the next (third) most desirable factor to encourage you to use public transportation more often?Random sample weighted by relative municipality population
WEIGHTED
WEIGHTED
WEIGHTED
WEIGHTED
WEIGHTED
WEIGHTED
WEIGHTED
Random Sample
Random Sample
Random Sample
Random Sample
Random Sample
Random Sample
Random Sample
College Township
Ferguson Township
Halfmoon Township
Harris Township
Patton Township
Boro State College
(C) (K) (L) (M) (N) (O) (P)
TOTAL ANSWERING 305 36 65 9 25 58 112More direct bus route between my home and destination
19.2% 17.6% 21.7% 26.7% 18.2% 23.3% 15.9%
Increase in frequency of departures from bus stops 16.7% 21.6% 20.5% 6.7% 12.1% 8.3% 19.0%
OExpanded hours of operation 16.4% 15.7% 10.8% 6.7% 27.3% 11.7% 20.6%
MReduce cost of bus fare or bus pass 14.6% 11.8% 8.4% 6.7% 15.2% 21.7% 15.9%
D LA bus stop closer to my destination 12.0% 11.8% 14.5% 13.3% 9.1% 15.0% 9.5%A bus stop closer to my home 9.6% 7.8% 9.6% 20.0% 12.1% 8.3% 9.5%Service to my neighborhood 8.5% 9.8% 13.3% 13.3% 3.0% 5.0% 7.9%
NOther, please specify 3.0% 3.9% 1.2% 6.7% 3.0% 6.7% 1.6%
Comparison Groups: ABCD/EFGHIJ/KLMNOP/QRSTUV/WXYZA2B2/EKQW/FLRX/GMSY/HNTZ/IOUA2/JPVB2Independent T-Test for Means (equal variances), Independent Z-Test for PercentagesUpper case letters indicate significance at the 95% level.
19. And what would be the next (fourth) most desirable factor to encourage you to use public transportation more often?Random sample weighted by relative municipality population
WEIGHTED
WEIGHTED
WEIGHTED
WEIGHTED
WEIGHTED
WEIGHTED
WEIGHTED
Random Sample
Random Sample
Random Sample
Random Sample
Random Sample
Random Sample
Random Sample
College Township
Ferguson Township
Halfmoon Township
Harris Township
Patton Township
Boro State College
(C) (K) (L) (M) (N) (O) (P)
TOTAL ANSWERING 271 33 59 8 24 53 94A bus stop closer to my destination 18.1% 10.6% 21.3% 21.4% 22.6% 25.5% 13.2%
KExpanded hours of operation 18.7% 25.5% 17.3% 7.1% 9.7% 18.2% 20.8%
MMore direct bus route between my home and destination
20.6% 23.4% 16.0% - 32.3% 18.2% 22.6%
Reduce cost of bus fare or bus pass 13.7% 6.4% 17.3% 21.4% 9.7% 9.1% 17.0%Increase in frequency of departures from bus stops 12.4% 19.1% 9.3% 28.6% 12.9% 10.9% 11.3%
A bus stop closer to my home 9.3% 8.5% 10.7% 21.4% 3.2% 5.5% 11.3%Service to my neighborhood 4.9% 4.3% 6.7% - 6.5% 5.5% 3.8%Other, please specify 2.3% 2.1% 1.3% - 3.2% 7.3% -
Comparison Groups: ABCD/EFGHIJ/KLMNOP/QRSTUV/WXYZA2B2/EKQW/FLRX/GMSY/HNTZ/IOUA2/JPVB2Independent T-Test for Means (equal variances), Independent Z-Test for PercentagesUpper case letters indicate significance at the 95% level.
Page 45

2011 Centre Region Community Survey Results - Weighted Random Sample
19. And finally, of these remaining factors, what would be the next (fifth) most desirable one to encourage you to use public transportation more?Random sample weighted by relative municipality population
WEIGHTED
WEIGHTED
WEIGHTED
WEIGHTED
WEIGHTED
WEIGHTED
WEIGHTED
Random Sample
Random Sample
Random Sample
Random Sample
Random Sample
Random Sample
Random Sample
College Township
Ferguson Township
Halfmoon Township
Harris Township
Patton Township
Boro State College
(C) (K) (L) (M) (N) (O) (P)
TOTAL ANSWERING 260 32 57 8 21 52 89A bus stop closer to my destination 23.2% 26.1% 17.8% 28.6% 17.9% 20.4% 28.0%Reduce cost of bus fare or bus pass 20.1% 10.9% 23.3% 7.1% 21.4% 24.1% 20.0%
Expanded hours of operation 15.5% 21.7% 20.5% 28.6% 3.6% 14.8% 12.0%N XN N
A bus stop closer to my home 10.5% 6.5% 9.6% 14.3% 17.9% 14.8% 8.0%More direct bus route between my home and destination
11.2% 8.7% 12.3% 7.1% 3.6% 3.7% 18.0%
NOService to my neighborhood 8.5% 10.9% 8.2% - 14.3% 7.4% 8.0%
Increase in frequency of departures from bus stops 6.4% 13.0% 5.5% 7.1% 14.3% 7.4% 2.0%
POther, please specify 4.5% 2.2% 2.7% 7.1% 7.1% 7.4% 4.0%Comparison Groups: ABCD/EFGHIJ/KLMNOP/QRSTUV/WXYZA2B2/EKQW/FLRX/GMSY/HNTZ/IOUA2/JPVB2Independent T-Test for Means (equal variances), Independent Z-Test for PercentagesUpper case letters indicate significance at the 95% level.
Page 46

2011 Centre Region Community Survey Results - Weighted Random Sample
20. Of the following corridors, which are you most concerned with in terms of safety (Check no more than 3)? Percent selectedRandom sample weighted by relative municipality population
WEIGHTED
WEIGHTED
WEIGHTED
WEIGHTED
WEIGHTED
WEIGHTED
WEIGHTED
Random Sample
Random Sample
Random Sample
Random Sample
Random Sample
Random Sample
Random Sample
College Township
Ferguson Township
Halfmoon Township
Harris Township
Patton Township
Boro State College
(C) (K) (L) (M) (N) (O) (P)
TOTAL ANSWERING 451 55 99 14 31 80 173College and Beaver Avenues in Downtown State College
57.6% 50.0% 53.2% 43.5% 43.9% 62.7% 63.9%
N NNorth Atherton Street 41.6% 37.2% 45.2% 43.5% 41.5% 51.8% 36.1%
PSouth Atherton Street 17.8% 24.4% 16.7% 13.0% 24.4% 15.7% 16.5%Whitehall Road 17.1% 19.2% 31.0% 17.4% 9.8% 4.8% 15.5%
O NOP OEast College Avenue 16.3% 25.6% 10.3% 4.3% 22.0% 14.5% 17.5%
D LM M B2MVairo Boulevard/Waddle Road 10.0% 6.4% 9.5% 21.7% 4.9% 16.9% 8.2%
KNPark Avenue 10.0% 11.5% 5.6% 8.7% 12.2% 13.3% 10.3%
University Drive 10.9% 21.8% 9.5% 4.3% 14.6% 3.6% 11.3%D LMO O
West College Avenue 10.3% 7.7% 11.9% 4.3% 12.2% 6.0% 12.4%B2
Valley Vista Drive/Science Park Road 7.8% 1.3% 12.7% 13.0% 2.4% 13.3% 5.2%KNP KN
Other, please specify 8.4% 7.7% 6.3% 21.7% 7.3% 12.0% 7.2%Y
None 12.2% 11.5% 7.9% 4.3% 19.5% 9.6% 15.5%M M
Comparison Groups: ABCD/EFGHIJ/KLMNOP/QRSTUV/WXYZA2B2/EKQW/FLRX/GMSY/HNTZ/IOUA2/JPVB2Independent T-Test for Means (equal variances), Independent Z-Test for PercentagesUpper case letters indicate significance at the 95% level.
Page 47

2011 Centre Region Community Survey Results - Weighted Random Sample
21. What roadway improvements should be made in the Centre Region (Check no more than 3)? Percent selectedRandom sample weighted by relative municipality population
WEIGHTED
WEIGHTED
WEIGHTED
WEIGHTED
WEIGHTED
WEIGHTED
WEIGHTED
Random Sample
Random Sample
Random Sample
Random Sample
Random Sample
Random Sample
Random Sample
College Township
Ferguson Township
Halfmoon Township
Harris Township
Patton Township
Boro State College
(C) (K) (L) (M) (N) (O) (P)
TOTAL ANSWERING 453 53 96 14 32 80 178Focus on maintaining good pavement quality and bridge conditions
65.0% 65.8% 70.5% 78.3% 61.9% 61.4% 63.0%
D B2Add sidewalks and bike lanes along roadways 54.8% 53.9% 53.3% 43.5% 45.2% 62.7% 55.0%Widen existing roads in other congested areas (includes travel lanes and/or dedicated turning lanes)
40.2% 36.8% 45.9% 47.8% 42.9% 36.1% 39.0%
WMake existing traffic signals more efficient (could be several traffic signals along a corridor, or an individual traffic signal)
39.6% 38.2% 32.8% 34.8% 40.5% 45.8% 41.0%
Implement traffic calming measures (speed tables, narrowing streets, curb bulb-outs at intersections, or an individual traffic signal)
14.7% 14.5% 10.7% - 16.7% 12.0% 19.0%
Add street lighting in highway interchange areas 13.4% 17.1% 13.9% 17.4% 9.5% 12.0% 13.0%Add street lighting in major roadway corridors 10.0% 14.5% 13.1% 4.3% 7.1% 14.5% 6.0%
Add more traffic lights 3.7% 3.9% 6.6% - 7.1% 1.2% 3.0%O
Other, please specify 8.8% 9.2% 6.6% 17.4% 4.8% 10.8% 9.0%Comparison Groups: ABCD/EFGHIJ/KLMNOP/QRSTUV/WXYZA2B2/EKQW/FLRX/GMSY/HNTZ/IOUA2/JPVB2Independent T-Test for Means (equal variances), Independent Z-Test for PercentagesUpper case letters indicate significance at the 95% level.
Page 48

2011 Centre Region Community Survey Results - Weighted Random Sample
22. What improvements in bicycle or pedestrian facilities should be made in the Centre Region (Check no more than 3)? Percent selectedRandom sample weighted by relative municipality population
WEIGHTED
WEIGHTED
WEIGHTED
WEIGHTED
WEIGHTED
WEIGHTED
WEIGHTED
Random Sample
Random Sample
Random Sample
Random Sample
Random Sample
Random Sample
Random Sample
College Township
Ferguson Township
Halfmoon Township
Harris Township
Patton Township
Boro State College
(C) (K) (L) (M) (N) (O) (P)
TOTAL ANSWERING 435 51 90 12 31 78 173Add more off-street bikeways 56.4% 47.9% 60.0% 50.0% 58.5% 59.3% 55.7%Provide connections between existing sidewalks, trails, and bikeways
53.5% 50.7% 62.6% 35.0% 48.8% 63.0% 47.4%
MP A2MPAdd more bike lanes on roads 40.5% 43.8% 44.3% 45.0% 36.6% 42.0% 37.1%Expand the system of sidewalks and pedestrian trails
38.5% 31.5% 38.3% 35.0% 31.7% 40.7% 41.2%
Add more facilities that reduce conflicts between pedestrians and vehicles (mid-block crosswalks, signing, lighting, etc.)
36.3% 28.8% 33.0% 35.0% 22.0% 33.3% 44.3%
KNMake crosswalks more visible 12.7% 20.5% 11.3% 25.0% 22.0% 11.1% 9.3%
P YOther, please specify 8.6% 9.6% 6.1% 15.0% 4.9% 7.4% 10.3%Comparison Groups: ABCD/EFGHIJ/KLMNOP/QRSTUV/WXYZA2B2/EKQW/FLRX/GMSY/HNTZ/IOUA2/JPVB2Independent T-Test for Means (equal variances), Independent Z-Test for PercentagesUpper case letters indicate significance at the 95% level.
Page 49

2011 Centre Region Community Survey Results - Weighted Random Sample
23. What improvements should be made to enhance transportation access to the Centre Region (Check no more than 3)? Percent selectedRandom sample weighted by relative municipality population
WEIGHTED
WEIGHTED
WEIGHTED
WEIGHTED
WEIGHTED
WEIGHTED
WEIGHTED
Random Sample
Random Sample
Random Sample
Random Sample
Random Sample
Random Sample
Random Sample
College Township
Ferguson Township
Halfmoon Township
Harris Township
Patton Township
Boro State College
(C) (K) (L) (M) (N) (O) (P)
TOTAL ANSWERING 439 53 95 12 30 78 171Major highway improvements to connect the Region with the four lane Section of Route 322 at Seven Mountains
46.6% 44.0% 59.5% 76.2% 72.5% 44.4% 34.4%
KOP YKOP ZKOPMore passenger air service at the University Park Airport
44.7% 42.7% 47.1% 38.1% 47.5% 51.9% 40.6%
High speed rail service 46.6% 32.0% 38.0% 23.8% 17.5% 49.4% 61.5%N A2KMN KLMN
New interchange between Interstate 99 and Interstate 80 at the Exit 161 Bellefonte Interchange
26.4% 36.0% 35.5% 33.3% 37.5% 24.7% 16.7%
P P PMore intercity bus service 22.6% 21.3% 14.9% 9.5% 15.0% 23.5% 29.2%
LMRoadway access to Interstate 80 via Route 322 West of Port Matilda
21.1% 21.3% 29.8% 28.6% 15.0% 23.5% 15.6%
NPA new Centre Region Bus Terminal 13.6% 13.3% 11.6% 14.3% 2.5% 13.6% 16.7%
N N N NOther, please specify 3.7% 5.3% 3.3% 9.5% 5.0% 4.9% 2.1%
Comparison Groups: ABCD/EFGHIJ/KLMNOP/QRSTUV/WXYZA2B2/EKQW/FLRX/GMSY/HNTZ/IOUA2/JPVB2Independent T-Test for Means (equal variances), Independent Z-Test for PercentagesUpper case letters indicate significance at the 95% level.
Page 50

2011 Centre Region Community Survey Results - Weighted Random Sample
Random sample weighted by relative municipality population
WEIGHTED
WEIGHTED
WEIGHTED
WEIGHTED
WEIGHTED
WEIGHTED
WEIGHTED
Random Sample
Random Sample
Random Sample
Random Sample
Random Sample
Random Sample
Random Sample
College Township
Ferguson Township
Halfmoon Township
Harris Township
Patton Township
Boro State College
(C) (K) (L) (M) (N) (O) (P)
TOTAL ANSWERING 455 55 98 14 32 81 176Yes 21.6% 21.8% 25.6% 17.4% 33.3% 31.0% 13.1%
P P A2PNo 66.5% 64.1% 63.2% 65.2% 61.9% 58.3% 73.7%
ODon’t know 11.9% 14.1% 11.2% 17.4% 4.8% 10.7% 13.1%Comparison Groups: ABCD/EFGHIJ/KLMNOP/QRSTUV/WXYZA2B2/EKQW/FLRX/GMSY/HNTZ/IOUA2/JPVB2Independent T-Test for Means (equal variances), Independent Z-Test for PercentagesUpper case letters indicate significance at the 95% level.
24. Do you spend more than 15% of your household income on transportation costs? (Costs include monthly vehicle loan payments, insurance, vehicle registration, vehicle maintenance and repairs; bus fare, bus pass, taxi fare, etc.)
Page 51

2011 Centre Region Community Survey Results - Weighted Random Sample
Attitudes regarding the Environment in the Centre Region
25. Please place the following natural and environmental issues in priority order. Which is the MOST important to you?Random sample weighted by relative municipality population
WEIGHTED
WEIGHTED
WEIGHTED
WEIGHTED
WEIGHTED
WEIGHTED
WEIGHTED
Random Sample
Random Sample
Random Sample
Random Sample
Random Sample
Random Sample
Random Sample
College Township
Ferguson Township
Halfmoon Township
Harris Township
Patton Township
Boro State College
(C) (K) (L) (M) (N) (O) (P)
TOTAL ANSWERING 447 52 99 13 31 79 173Protect drinking water quality 41.1% 55.4% 33.3% 36.4% 36.6% 41.5% 42.3%
WLNQuality and quantity of water resources (which include but are not limited to, streams, rivers, wetlands)
28.1% 16.2% 29.4% 40.9% 36.6% 34.1% 25.8%
K K ZK KOpen space 5.7% 2.7% 8.7% 4.5% 14.6% 6.1% 3.1%
KPAccess to forest, game lands, and natural areas 6.5% 5.4% 11.9% 9.1% 7.3% 2.4% 5.2%
OAir quality 7.1% 10.8% 7.1% - - 6.1% 8.2%
Use of renewable energy sources in municipal buildings and vehicles
3.8% - 2.4% 9.1% 2.4% 2.4% 6.2%
Refuse management and recycling programs 3.7% 6.8% 3.2% - - 1.2% 5.2%
Increase energy efficiency in municipal buildings and vehicles
3.1% 2.7% 3.2% - - 4.9% 3.1%
Other, please specify 1.0% - 0.8% - 2.4% 1.2% 1.0%
Comparison Groups: ABCD/EFGHIJ/KLMNOP/QRSTUV/WXYZA2B2/EKQW/FLRX/GMSY/HNTZ/IOUA2/JPVB2Independent T-Test for Means (equal variances), Independent Z-Test for PercentagesUpper case letters indicate significance at the 95% level.
Random sample weighted by relative municipality population
WEIGHTED
WEIGHTED
WEIGHTED
WEIGHTED
WEIGHTED
WEIGHTED
WEIGHTED
Random Sample
Random Sample
Random Sample
Random Sample
Random Sample
Random Sample
Random Sample
College Township
Ferguson Township
Halfmoon Township
Harris Township
Patton Township
Boro State College
(C) (K) (L) (M) (N) (O) (P)
TOTAL ANSWERING 440 50 97 13 30 79 171Quality and quantity of water resources (which include but are not limited to, streams, rivers, wetlands)
23.8% 32.4% 26.6% 13.6% 17.5% 20.7% 22.9%
WMAir quality 23.9% 23.9% 28.2% 27.3% 35.0% 26.8% 17.7%
X PProtect drinking water quality 21.2% 16.9% 19.4% 18.2% 10.0% 18.3% 27.1%
NOpen space 8.3% 12.7% 9.7% 13.6% 17.5% 6.1% 5.2%Refuse management and recycling programs 8.3% 5.6% 5.6% 9.1% 7.5% 13.4% 8.3%Access to forest, game lands, and natural areas 6.1% 4.2% 5.6% 4.5% 10.0% 8.5% 5.2%Increase energy efficiency in municipal buildings and vehicles
3.3% 1.4% 0.8% 9.1% 2.5% 4.9% 4.2%
Use of renewable energy sources in municipal buildings and vehicles
4.5% 1.4% 4.0% - - 1.2% 8.3%
KOOther, please specify 0.7% 1.4% - 4.5% - - 1.0%Comparison Groups: ABCD/EFGHIJ/KLMNOP/QRSTUV/WXYZA2B2/EKQW/FLRX/GMSY/HNTZ/IOUA2/JPVB2
25. Please place the following natural and environmental issues in priority order. Of those remaining, which is the next (second) most important to you?
Page 52

2011 Centre Region Community Survey Results - Weighted Random Sample
Independent T-Test for Means (equal variances), Independent Z-Test for PercentagesUpper case letters indicate significance at the 95% level.
Page 53

2011 Centre Region Community Survey Results - Weighted Random Sample
25. Please place the following natural and environmental issues in priority order. Which is the next (third) most important to you of these?Random sample weighted by relative municipality population
WEIGHTED
WEIGHTED
WEIGHTED
WEIGHTED
WEIGHTED
WEIGHTED
WEIGHTED
Random Sample
Random Sample
Random Sample
Random Sample
Random Sample
Random Sample
Random Sample
College Township
Ferguson Township
Halfmoon Township
Harris Township
Patton Township
Boro State College
(C) (K) (L) (M) (N) (O) (P)
TOTAL ANSWERING 431 48 96 12 29 78 167Air quality 23.4% 19.1% 23.6% 28.6% 18.4% 22.2% 25.5%
A2Quality and quantity of water resources (which include but are not limited to, streams, rivers, wetlands)
15.6% 17.6% 13.0% 14.3% 18.4% 16.0% 16.0%
Protect drinking water quality 14.1% 10.3% 15.4% 33.3% 18.4% 17.3% 10.6%YKP
Refuse management and recycling programs 14.4% 14.7% 14.6% 4.8% 13.2% 12.3% 16.0%X
Open space 12.4% 13.2% 13.8% - 5.3% 18.5% 10.6%X N
Access to forest, game lands, and natural areas 8.5% 5.9% 5.7% 19.0% 21.1% 7.4% 8.5%KL
Increase energy efficiency in municipal buildings and vehicles
5.6% 7.4% 6.5% - 2.6% 3.7% 6.4%
Use of renewable energy sources in municipal buildings and vehicles
5.5% 10.3% 7.3% - 2.6% 2.5% 5.3%
Other, please specify 0.6% 1.5% - - - - 1.1%Comparison Groups: ABCD/EFGHIJ/KLMNOP/QRSTUV/WXYZA2B2/EKQW/FLRX/GMSY/HNTZ/IOUA2/JPVB2Independent T-Test for Means (equal variances), Independent Z-Test for PercentagesUpper case letters indicate significance at the 95% level.
Random sample weighted by relative municipality population
WEIGHTED
WEIGHTED
WEIGHTED
WEIGHTED
WEIGHTED
WEIGHTED
WEIGHTED
Random Sample
Random Sample
Random Sample
Random Sample
Random Sample
Random Sample
Random Sample
College Township
Ferguson Township
Halfmoon Township
Harris Township
Patton Township
Boro State College
(C) (K) (L) (M) (N) (O) (P)
TOTAL ANSWERING 401 45 89 12 27 75 153Air quality 14.4% 12.5% 12.4% 19.0% 11.4% 16.7% 15.1%
Open space 13.7% 14.1% 10.6% 14.3% 8.6% 9.0% 18.6%
Refuse management and recycling programs 14.3% 9.4% 10.6% 28.6% 14.3% 15.4% 16.3%Access to forest, game lands, and natural areas 12.3% 7.8% 18.6% 4.8% 5.7% 21.8% 7.0%
KMNP KMNPUse of renewable energy sources in municipal buildings and vehicles
12.9% 15.6% 11.5% 4.8% 34.3% 11.5% 10.5%
ZKLMOPQuality and quantity of water resources (which include but are not limited to, streams, rivers, wetlands)
13.0% 12.5% 14.2% 4.8% 8.6% 12.8% 14.0%
Increase energy efficiency in municipal buildings and vehicles
11.6% 14.1% 8.0% 9.5% 14.3% 6.4% 15.1%
Protect drinking water quality 7.5% 12.5% 13.3% 14.3% 2.9% 6.4% 3.5%P NP
Other, please specify 0.4% 1.6% 0.9% - - - -Comparison Groups: ABCD/EFGHIJ/KLMNOP/QRSTUV/WXYZA2B2/EKQW/FLRX/GMSY/HNTZ/IOUA2/JPVB2Independent T-Test for Means (equal variances), Independent Z-Test for PercentagesUpper case letters indicate significance at the 95% level.
25. Please place the following natural and environmental issues in priority order. Of those now remaining, which is the next (fourth) most important to you?
Page 54

2011 Centre Region Community Survey Results - Weighted Random Sample
Random sample weighted by relative municipality population
WEIGHTED
WEIGHTED
WEIGHTED
WEIGHTED
WEIGHTED
WEIGHTED
WEIGHTED
Random Sample
Random Sample
Random Sample
Random Sample
Random Sample
Random Sample
Random Sample
College Township
Ferguson Township
Halfmoon Township
Harris Township
Patton Township
Boro State College
(C) (K) (L) (M) (N) (O) (P)
TOTAL ANSWERING 388 45 85 12 27 74 144Refuse management and recycling programs 18.6% 18.8% 18.3% 19.0% 11.4% 16.9% 21.0%
Access to forest, game lands, and natural areas 15.3% 18.8% 17.4% 14.3% 11.4% 15.6% 13.6%Open space 13.6% 15.6% 18.3% 14.3% 5.7% 14.3% 11.1%
NIncrease energy efficiency in municipal buildings and vehicles
13.6% 10.9% 11.0% 14.3% 17.1% 14.3% 14.8%
Air quality 11.8% 17.2% 11.9% 9.5% 11.4% 10.4% 11.1%Use of renewable energy sources in municipal buildings and vehicles
13.0% 7.8% 10.1% 19.0% 11.4% 15.6% 14.8%
Protect drinking water quality 6.8% 1.6% 9.2% - 22.9% 6.5% 4.9%K KOP
Quality and quantity of water resources (which include but are not limited to, streams, rivers, wetlands)
6.9% 6.2% 3.7% 9.5% 8.6% 6.5% 8.6%
Other, please specify 0.4% 3.1% - - - - -Comparison Groups: ABCD/EFGHIJ/KLMNOP/QRSTUV/WXYZA2B2/EKQW/FLRX/GMSY/HNTZ/IOUA2/JPVB2Independent T-Test for Means (equal variances), Independent Z-Test for PercentagesUpper case letters indicate significance at the 95% level.
25. Please place the following natural and environmental issues in priority order. And finally, of these, which is the next (fifth) most important to you?
Page 55

2011 Centre Region Community Survey Results - Weighted Random Sample
26. In the past 12 months have you used Spring Creek for any of the following activities (Please check all that apply)?Random sample weighted by relative municipality population
WEIGHTED
WEIGHTED
WEIGHTED
WEIGHTED
WEIGHTED
WEIGHTED
WEIGHTED
Random Sample
Random Sample
Random Sample
Random Sample
Random Sample
Random Sample
Random Sample
College Township
Ferguson Township
Halfmoon Township
Harris Township
Patton Township
Boro State College
(C) (K) (L) (M) (N) (O) (P)
TOTAL ANSWERING 451 55 99 14 31 80 173I have not used Spring Creek 57.2% 50.0% 61.9% 69.6% 56.1% 57.8% 55.7%
General Passive Recreation 37.2% 47.4% 31.0% 21.7% 34.1% 39.8% 38.1%LM
Fishing 8.7% 17.9% 8.7% 21.7% 9.8% 7.2% 5.2%OP
Canoe, Kayak 4.3% 5.1% 4.8% - 14.6% 2.4% 3.1%OP
Other, please specify 4.7% 3.8% 3.2% - 4.9% 2.4% 7.2%Comparison Groups: ABCD/EFGHIJ/KLMNOP/QRSTUV/WXYZA2B2/EKQW/FLRX/GMSY/HNTZ/IOUA2/JPVB2Independent T-Test for Means (equal variances), Independent Z-Test for PercentagesUpper case letters indicate significance at the 95% level.
Page 56
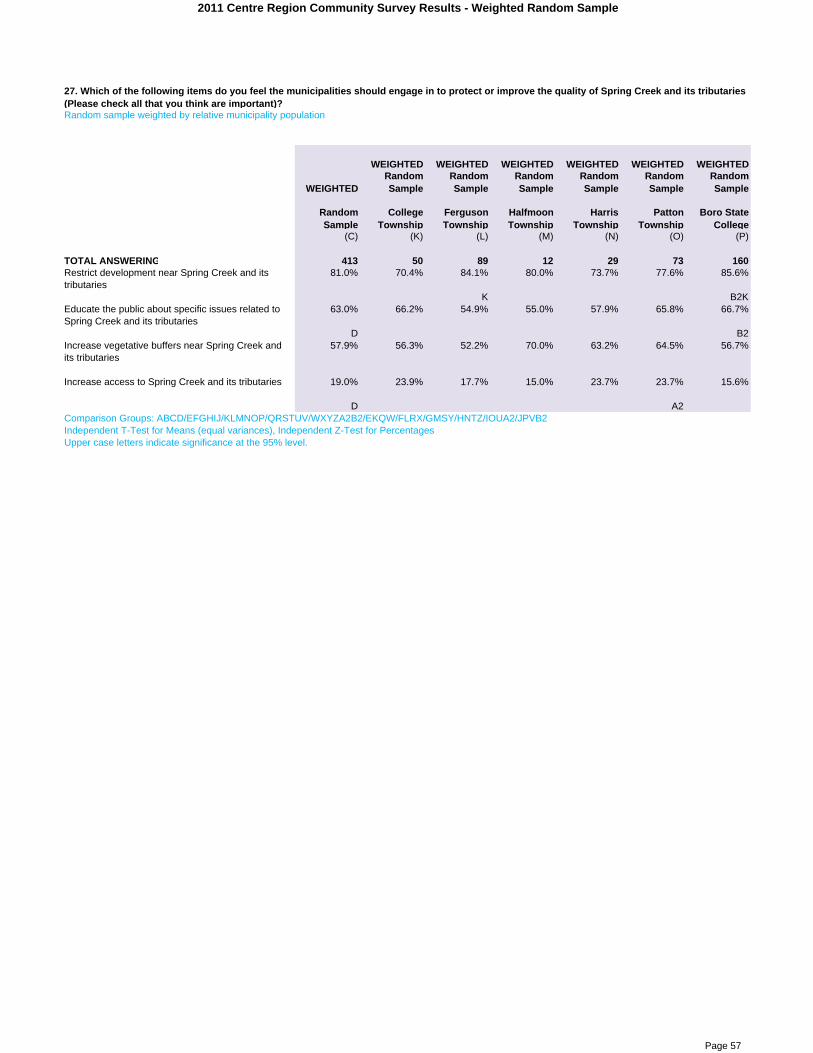
2011 Centre Region Community Survey Results - Weighted Random Sample
Random sample weighted by relative municipality population
WEIGHTED
WEIGHTED
WEIGHTED
WEIGHTED
WEIGHTED
WEIGHTED
WEIGHTED
Random Sample
Random Sample
Random Sample
Random Sample
Random Sample
Random Sample
Random Sample
College Township
Ferguson Township
Halfmoon Township
Harris Township
Patton Township
Boro State College
(C) (K) (L) (M) (N) (O) (P)
TOTAL ANSWERING 413 50 89 12 29 73 160Restrict development near Spring Creek and its tributaries
81.0% 70.4% 84.1% 80.0% 73.7% 77.6% 85.6%
K B2KEducate the public about specific issues related to Spring Creek and its tributaries
63.0% 66.2% 54.9% 55.0% 57.9% 65.8% 66.7%
D B2Increase vegetative buffers near Spring Creek and its tributaries
57.9% 56.3% 52.2% 70.0% 63.2% 64.5% 56.7%
Increase access to Spring Creek and its tributaries 19.0% 23.9% 17.7% 15.0% 23.7% 23.7% 15.6%
D A2Comparison Groups: ABCD/EFGHIJ/KLMNOP/QRSTUV/WXYZA2B2/EKQW/FLRX/GMSY/HNTZ/IOUA2/JPVB2Independent T-Test for Means (equal variances), Independent Z-Test for PercentagesUpper case letters indicate significance at the 95% level.
27. Which of the following items do you feel the municipalities should engage in to protect or improve the quality of Spring Creek and its tributaries (Please check all that you think are important)?
Page 57
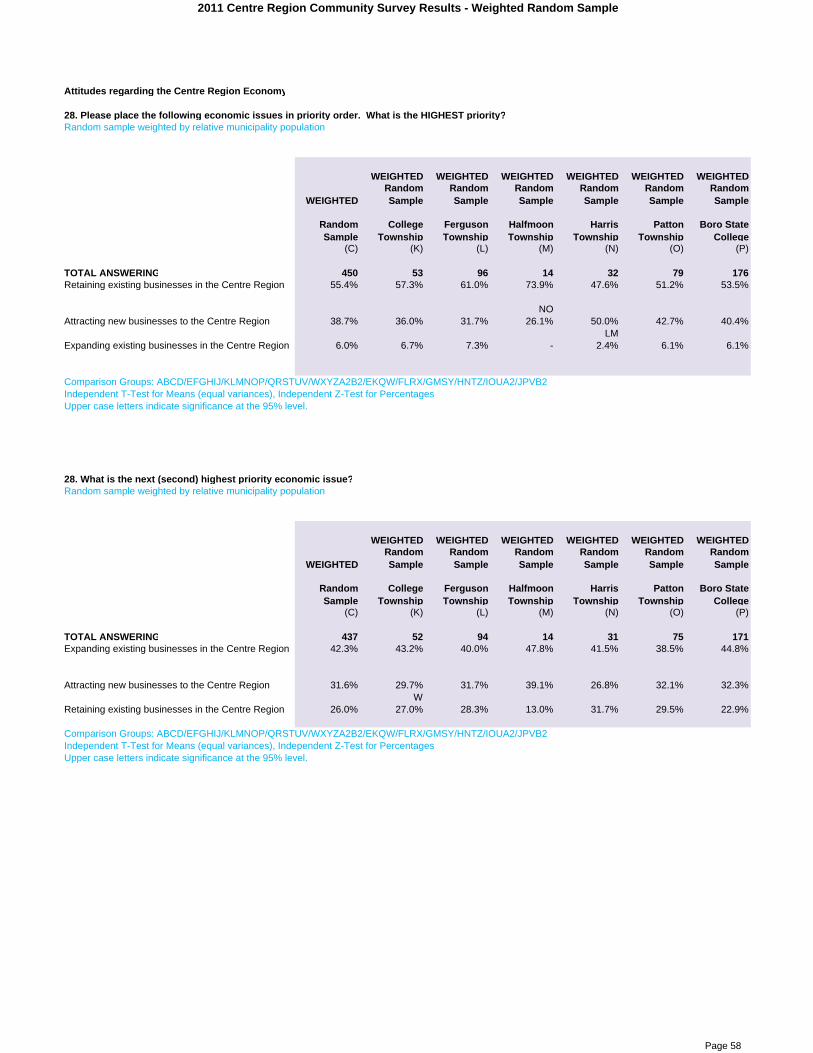
2011 Centre Region Community Survey Results - Weighted Random Sample
Attitudes regarding the Centre Region Economy
28. Please place the following economic issues in priority order. What is the HIGHEST priority?Random sample weighted by relative municipality population
WEIGHTED
WEIGHTED
WEIGHTED
WEIGHTED
WEIGHTED
WEIGHTED
WEIGHTED
Random Sample
Random Sample
Random Sample
Random Sample
Random Sample
Random Sample
Random Sample
College Township
Ferguson Township
Halfmoon Township
Harris Township
Patton Township
Boro State College
(C) (K) (L) (M) (N) (O) (P)
TOTAL ANSWERING 450 53 96 14 32 79 176Retaining existing businesses in the Centre Region 55.4% 57.3% 61.0% 73.9% 47.6% 51.2% 53.5%
NOAttracting new businesses to the Centre Region 38.7% 36.0% 31.7% 26.1% 50.0% 42.7% 40.4%
LMExpanding existing businesses in the Centre Region 6.0% 6.7% 7.3% - 2.4% 6.1% 6.1%
Comparison Groups: ABCD/EFGHIJ/KLMNOP/QRSTUV/WXYZA2B2/EKQW/FLRX/GMSY/HNTZ/IOUA2/JPVB2Independent T-Test for Means (equal variances), Independent Z-Test for PercentagesUpper case letters indicate significance at the 95% level.
28. What is the next (second) highest priority economic issue?Random sample weighted by relative municipality population
WEIGHTED
WEIGHTED
WEIGHTED
WEIGHTED
WEIGHTED
WEIGHTED
WEIGHTED
Random Sample
Random Sample
Random Sample
Random Sample
Random Sample
Random Sample
Random Sample
College Township
Ferguson Township
Halfmoon Township
Harris Township
Patton Township
Boro State College
(C) (K) (L) (M) (N) (O) (P)
TOTAL ANSWERING 437 52 94 14 31 75 171Expanding existing businesses in the Centre Region 42.3% 43.2% 40.0% 47.8% 41.5% 38.5% 44.8%
Attracting new businesses to the Centre Region 31.6% 29.7% 31.7% 39.1% 26.8% 32.1% 32.3%W
Retaining existing businesses in the Centre Region 26.0% 27.0% 28.3% 13.0% 31.7% 29.5% 22.9%
Comparison Groups: ABCD/EFGHIJ/KLMNOP/QRSTUV/WXYZA2B2/EKQW/FLRX/GMSY/HNTZ/IOUA2/JPVB2Independent T-Test for Means (equal variances), Independent Z-Test for PercentagesUpper case letters indicate significance at the 95% level.
Page 58

2011 Centre Region Community Survey Results - Weighted Random Sample
28. LOWEST (third) priority economic issueRandom sample weighted by relative municipality population
WEIGHTED
WEIGHTED
WEIGHTED
WEIGHTED
WEIGHTED
WEIGHTED
WEIGHTED
Random Sample
Random Sample
Random Sample
Random Sample
Random Sample
Random Sample
Random Sample
College Township
Ferguson Township
Halfmoon Township
Harris Township
Patton Township
Boro State College
(C) (K) (L) (M) (N) (O) (P)
TOTAL ANSWERING 437 52 94 14 31 75 171Expanding existing businesses in the Centre Region 51.5% 50.0% 52.5% 52.2% 56.1% 55.1% 49.0%
YAttracting new businesses to the Centre Region 30.0% 33.8% 35.8% 34.8% 22.0% 24.4% 29.2%
Retaining existing businesses in the Centre Region 18.5% 16.2% 11.7% 13.0% 22.0% 20.5% 21.9%
LComparison Groups: ABCD/EFGHIJ/KLMNOP/QRSTUV/WXYZA2B2/EKQW/FLRX/GMSY/HNTZ/IOUA2/JPVB2Independent T-Test for Means (equal variances), Independent Z-Test for PercentagesUpper case letters indicate significance at the 95% level.
Page 59

2011 Centre Region Community Survey Results - Weighted Random Sample
Random sample weighted by relative municipality population
WEIGHTED
WEIGHTED
WEIGHTED
WEIGHTED
WEIGHTED
WEIGHTED
WEIGHTED
Random Sample
Random Sample
Random Sample
Random Sample
Random Sample
Random Sample
Random Sample
College Township
Ferguson Township
Halfmoon Township
Harris Township
Patton Township
Boro State College
(C) (K) (L) (M) (N) (O) (P)
TOTAL ANSWERING 432 51 97 12 30 78 164Funding construction infrastructure such as streets, water or sewer lines.
41.8% 46.6% 43.5% 38.1% 51.3% 45.7% 35.9%
D XTax abatements or reductions 38.8% 46.6% 41.1% 47.6% 48.7% 40.7% 31.5%
P X ZReducing development review and permitting fees. 33.5% 31.5% 37.9% 28.6% 35.9% 30.9% 32.6%
Incentives should not be offered 25.8% 20.5% 25.8% 28.6% 25.6% 23.5% 28.3%
Other, please specify 5.0% 8.2% 4.0% 9.5% 5.1% 2.5% 5.4%Comparison Groups: ABCD/EFGHIJ/KLMNOP/QRSTUV/WXYZA2B2/EKQW/FLRX/GMSY/HNTZ/IOUA2/JPVB2Independent T-Test for Means (equal variances), Independent Z-Test for PercentagesUpper case letters indicate significance at the 95% level.
29. Should municipalities offer any of the following incentives to keep existing business or attract new business (Check all that you feel should be used)?
Page 60

2011 Centre Region Community Survey Results - Weighted Random Sample
30. How important is it to offer the following economic development strategies in the Centre Region? First, which strategy is the MOST important?Random sample weighted by relative municipality population
WEIGHTED
WEIGHTED
WEIGHTED
WEIGHTED
WEIGHTED
WEIGHTED
WEIGHTED
Random Sample
Random Sample
Random Sample
Random Sample
Random Sample
Random Sample
Random Sample
College Township
Ferguson Township
Halfmoon Township
Harris Township
Patton Township
Boro State College
(C) (K) (L) (M) (N) (O) (P)
TOTAL ANSWERING 437 52 96 13 31 81 164Support local food, direct-farm marketing, “Buy Fresh Buy Local”
26.2% 25.7% 25.2% 22.7% 41.5% 25.0% 25.0%
Attract more high-tech jobs 20.8% 21.6% 21.1% 27.3% 12.2% 20.2% 21.7%
Support natural and cultural resource-based tourism (hiking, biking, birding, arts)
15.1% 10.8% 13.0% 4.5% 14.6% 17.9% 17.4%
M MContinue to ensure infrastructure is built and maintained to serve existing businesses
12.4% 12.2% 13.0% 4.5% 9.8% 8.3% 15.2%
Attract more manufacturing jobs 7.1% 8.1% 8.1% 13.6% 9.8% 10.7% 3.3%
Attract more research office opportunities 4.8% 2.7% 4.9% 4.5% 2.4% 3.6% 6.5%D
Support recreational-based activities and tourism (sports)
4.1% 5.4% 4.1% 4.5% 2.4% 3.6% 4.3%
Attract more retail and service jobs 1.4% 1.4% 2.4% 4.5% 2.4% 2.4% -Other, please specify 0.8% - 0.8% - - 1.2% 1.1%No specific economic development strategies are needed
7.2% 12.2% 7.3% 13.6% 4.9% 7.1% 5.4%
Comparison Groups: ABCD/EFGHIJ/KLMNOP/QRSTUV/WXYZA2B2/EKQW/FLRX/GMSY/HNTZ/IOUA2/JPVB2Independent T-Test for Means (equal variances), Independent Z-Test for PercentagesUpper case letters indicate significance at the 95% level.
Random sample weighted by relative municipality population
WEIGHTED
WEIGHTED
WEIGHTED
WEIGHTED
WEIGHTED
WEIGHTED
WEIGHTED
Random Sample
Random Sample
Random Sample
Random Sample
Random Sample
Random Sample
Random Sample
College Township
Ferguson Township
Halfmoon Township
Harris Township
Patton Township
Boro State College
(C) (K) (L) (M) (N) (O) (P)
TOTAL ANSWERING 399 44 87 11 29 74 153Support natural and cultural resource-based tourism (hiking, biking, birding, arts)
17.0% 17.5% 13.5% 5.3% 7.9% 15.6% 22.1%
MNAttract more high-tech jobs 15.1% 11.1% 10.8% 21.1% 7.9% 19.5% 17.4%Continue to ensure infrastructure is built and maintained to serve existing businesses
13.4% 17.5% 14.4% 15.8% 13.2% 13.0% 11.6%
Support local food, direct-farm marketing, “Buy Fresh Buy Local”
15.1% 12.7% 14.4% 15.8% 13.2% 13.0% 17.4%
Attract more manufacturing jobs 13.8% 20.6% 15.3% 15.8% 21.1% 11.7% 10.5%D
Attract more research office opportunities 11.0% 6.3% 14.4% 5.3% 21.1% 7.8% 10.5%K
Support recreational-based activities and tourism (sports)
10.9% 7.9% 11.7% 15.8% 13.2% 15.6% 8.1%
Attract more retail and service jobs 3.0% 3.2% 5.4% 5.3% 2.6% 3.9% 1.2%Other, please specify 0.8% 3.2% - - - - 1.2%Comparison Groups: ABCD/EFGHIJ/KLMNOP/QRSTUV/WXYZA2B2/EKQW/FLRX/GMSY/HNTZ/IOUA2/JPVB2Independent T-Test for Means (equal variances), Independent Z-Test for PercentagesUpper case letters indicate significance at the 95% level.
30. How important is it to offer the following economic development strategies in the Centre Region? Of the remaining options, which is next (second) most important?
Page 61

2011 Centre Region Community Survey Results - Weighted Random Sample
Random sample weighted by relative municipality population
WEIGHTED
WEIGHTED
WEIGHTED
WEIGHTED
WEIGHTED
WEIGHTED
WEIGHTED
Random Sample
Random Sample
Random Sample
Random Sample
Random Sample
Random Sample
Random Sample
College Township
Ferguson Township
Halfmoon Township
Harris Township
Patton Township
Boro State College
(C) (K) (L) (M) (N) (O) (P)
TOTAL ANSWERING 380 41 85 11 29 72 140Continue to ensure infrastructure is built and maintained to serve existing businesses
22.1% 13.6% 22.0% 36.8% 21.1% 24.0% 22.8%
Support local food, direct-farm marketing, “Buy Fresh Buy Local”
13.6% 8.5% 18.3% 15.8% 5.3% 10.7% 15.2%
NSupport recreational-based activities and tourism (sports)
13.5% 11.9% 10.1% 5.3% 5.3% 14.7% 17.7%
NSupport natural and cultural resource-based tourism (hiking, biking, birding, arts)
11.5% 8.5% 14.7% 21.1% 18.4% 8.0% 10.1%
Attract more research office opportunities 12.2% 13.6% 9.2% 10.5% 5.3% 14.7% 13.9%
Attract more high-tech jobs 11.8% 23.7% 10.1% 5.3% 31.6% 10.7% 6.3%D LMOP LMOP
Attract more manufacturing jobs 9.3% 15.3% 9.2% 5.3% 10.5% 9.3% 7.6%Attract more retail and service jobs 4.9% 5.1% 6.4% - 2.6% 6.7% 3.8%Other, please specify 1.2% - - - - 1.3% 2.5%Comparison Groups: ABCD/EFGHIJ/KLMNOP/QRSTUV/WXYZA2B2/EKQW/FLRX/GMSY/HNTZ/IOUA2/JPVB2Independent T-Test for Means (equal variances), Independent Z-Test for PercentagesUpper case letters indicate significance at the 95% level.
30. How important is it to offer the following economic development strategies in the Centre Region? Which is next (fourth) most important?Random sample weighted by relative municipality population
WEIGHTED
WEIGHTED
WEIGHTED
WEIGHTED
WEIGHTED
WEIGHTED
WEIGHTED
Random Sample
Random Sample
Random Sample
Random Sample
Random Sample
Random Sample
Random Sample
College Township
Ferguson Township
Halfmoon Township
Harris Township
Patton Township
Boro State College
(C) (K) (L) (M) (N) (O) (P)
TOTAL ANSWERING 350 38 78 11 28 70 126Continue to ensure infrastructure is built and maintained to serve existing businesses
22.9% 27.8% 24.2% 22.2% 21.6% 27.8% 18.3%
Attract more research office opportunities 14.0% 14.8% 9.1% 22.2% 13.5% 12.5% 16.9%Support natural and cultural resource-based tourism (hiking, biking, birding, arts)
12.3% 9.3% 14.1% 16.7% 10.8% 11.1% 12.7%
Support recreational-based activities and tourism (sports)
12.5% 11.1% 16.2% 11.1% 8.1% 5.6% 15.5%
OAttract more high-tech jobs 11.0% 9.3% 12.1% - 13.5% 11.1% 11.3%Support local food, direct-farm marketing, “Buy Fresh Buy Local”
10.7% 9.3% 6.1% 16.7% 16.2% 12.5% 11.3%
Attract more retail and service jobs 10.2% 9.3% 13.1% - 16.2% 9.7% 8.5%
Attract more manufacturing jobs 6.1% 9.3% 5.1% 11.1% - 8.3% 5.6%Other, please specify 0.3% - - - - 1.4% -Comparison Groups: ABCD/EFGHIJ/KLMNOP/QRSTUV/WXYZA2B2/EKQW/FLRX/GMSY/HNTZ/IOUA2/JPVB2Independent T-Test for Means (equal variances), Independent Z-Test for PercentagesUpper case letters indicate significance at the 95% level.
30. How important is it to offer the following economic development strategies in the Centre Region? Which initiative is next (third) most important?
Page 62

2011 Centre Region Community Survey Results - Weighted Random Sample
30. How important is it to offer the following economic development strategies in the Centre Region? Which is next (fifth) most important?Random sample weighted by relative municipality population
WEIGHTED
WEIGHTED
WEIGHTED
WEIGHTED
WEIGHTED
WEIGHTED
WEIGHTED
Random Sample
Random Sample
Random Sample
Random Sample
Random Sample
Random Sample
Random Sample
College Township
Ferguson Township
Halfmoon Township
Harris Township
Patton Township
Boro State College
(C) (K) (L) (M) (N) (O) (P)
TOTAL ANSWERING 320 36 74 10 24 63 114Continue to ensure infrastructure is built and maintained to serve existing businesses
20.1% 13.7% 30.9% 29.4% 21.9% 16.9% 15.6%
KOPSupport recreational-based activities and tourism (sports)
14.6% 15.7% 14.9% 17.6% 21.9% 20.0% 9.4%
DAttract more research office opportunities 11.7% 15.7% 10.6% 5.9% 6.3% 9.2% 14.1%Attract more retail and service jobs 12.8% 15.7% 13.8% 11.8% 12.5% 13.8% 10.9%Attract more high-tech jobs 14.1% 7.8% 8.5% 5.9% 12.5% 12.3% 21.9%
D B2KLMSupport natural and cultural resource-based tourism (hiking, biking, birding, arts)
9.3% 5.9% 5.3% 17.6% 12.5% 7.7% 12.5%
Support local food, direct-farm marketing, “Buy Fresh Buy Local”
7.2% 13.7% 8.5% - 3.1% 6.2% 6.2%
Attract more manufacturing jobs 8.5% 11.8% 6.4% 11.8% 9.4% 12.3% 6.2%Other, please specify 1.7% - 1.1% - - 1.5% 3.1%Comparison Groups: ABCD/EFGHIJ/KLMNOP/QRSTUV/WXYZA2B2/EKQW/FLRX/GMSY/HNTZ/IOUA2/JPVB2Independent T-Test for Means (equal variances), Independent Z-Test for PercentagesUpper case letters indicate significance at the 95% level.
Page 63

2011 Centre Region Community Survey Results - Weighted Random Sample
Attitudes about Local Government and Resident Communication
Random sample weighted by relative municipality population
WEIGHTED
WEIGHTED
WEIGHTED
WEIGHTED
WEIGHTED
WEIGHTED
WEIGHTED
Random Sample
Random Sample
Random Sample
Random Sample
Random Sample
Random Sample
Random Sample
College Township
Ferguson Township
Halfmoon Township
Harris Township
Patton Township
Boro State College
(C) (K) (L) (M) (N) (O) (P)
TOTAL ANSWERING 458 54 100 14 32 82 176Township Newsletter 49.9% 61.0% 67.2% 65.2% 81.0% 55.3% 27.3%
P P P KOP PRead it in the Centre Daily Times 52.2% 53.2% 53.9% 60.9% 54.8% 50.6% 50.5%
Email 34.3% 27.3% 28.9% 26.1% 21.4% 38.8% 40.4%N N
Inserts in utility bills, refuse bills or US Mail 35.9% 42.9% 38.3% 21.7% 33.3% 32.9% 35.4%D M B2
View Centre Region web page 34.0% 33.8% 28.1% 21.7% 28.6% 42.4% 35.4%LM
View municipal web page on my own 32.7% 31.2% 27.3% 39.1% 23.8% 30.6% 38.4%Social media (Facebook, Twitter, blogs) 13.0% 13.0% 9.4% 8.7% 4.8% 18.8% 14.1%
NRead it in The Daily Collegian 9.3% 2.6% 4.7% 4.3% 14.3% 3.5% 16.2%
K KLMOComparison Groups: ABCD/EFGHIJ/KLMNOP/QRSTUV/WXYZA2B2/EKQW/FLRX/GMSY/HNTZ/IOUA2/JPVB2Independent T-Test for Means (equal variances), Independent Z-Test for PercentagesUpper case letters indicate significance at the 95% level.
31. Choose the 3 ways you would prefer to receive information regarding community meetings, community issues, or community events (Please check only 3).
Page 64
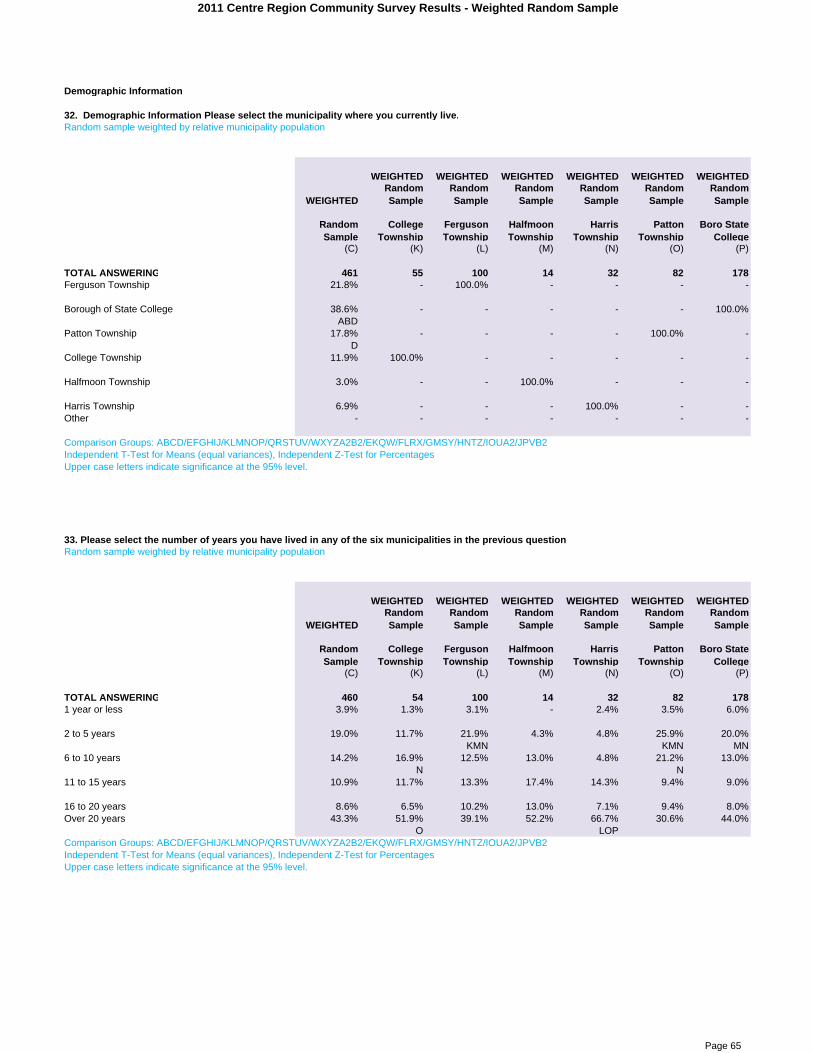
2011 Centre Region Community Survey Results - Weighted Random Sample
Demographic Information
32. Demographic Information Please select the municipality where you currently live.Random sample weighted by relative municipality population
WEIGHTED
WEIGHTED
WEIGHTED
WEIGHTED
WEIGHTED
WEIGHTED
WEIGHTED
Random Sample
Random Sample
Random Sample
Random Sample
Random Sample
Random Sample
Random Sample
College Township
Ferguson Township
Halfmoon Township
Harris Township
Patton Township
Boro State College
(C) (K) (L) (M) (N) (O) (P)
TOTAL ANSWERING 461 55 100 14 32 82 178Ferguson Township 21.8% - 100.0% - - - -
Borough of State College 38.6% - - - - - 100.0%ABD
Patton Township 17.8% - - - - 100.0% -D
College Township 11.9% 100.0% - - - - -
Halfmoon Township 3.0% - - 100.0% - - -
Harris Township 6.9% - - - 100.0% - -Other - - - - - - -
Comparison Groups: ABCD/EFGHIJ/KLMNOP/QRSTUV/WXYZA2B2/EKQW/FLRX/GMSY/HNTZ/IOUA2/JPVB2Independent T-Test for Means (equal variances), Independent Z-Test for PercentagesUpper case letters indicate significance at the 95% level.
33. Please select the number of years you have lived in any of the six municipalities in the previous questionRandom sample weighted by relative municipality population
WEIGHTED
WEIGHTED
WEIGHTED
WEIGHTED
WEIGHTED
WEIGHTED
WEIGHTED
Random Sample
Random Sample
Random Sample
Random Sample
Random Sample
Random Sample
Random Sample
College Township
Ferguson Township
Halfmoon Township
Harris Township
Patton Township
Boro State College
(C) (K) (L) (M) (N) (O) (P)
TOTAL ANSWERING 460 54 100 14 32 82 1781 year or less 3.9% 1.3% 3.1% - 2.4% 3.5% 6.0%
2 to 5 years 19.0% 11.7% 21.9% 4.3% 4.8% 25.9% 20.0%KMN KMN MN
6 to 10 years 14.2% 16.9% 12.5% 13.0% 4.8% 21.2% 13.0%N N
11 to 15 years 10.9% 11.7% 13.3% 17.4% 14.3% 9.4% 9.0%
16 to 20 years 8.6% 6.5% 10.2% 13.0% 7.1% 9.4% 8.0%Over 20 years 43.3% 51.9% 39.1% 52.2% 66.7% 30.6% 44.0%
O LOPComparison Groups: ABCD/EFGHIJ/KLMNOP/QRSTUV/WXYZA2B2/EKQW/FLRX/GMSY/HNTZ/IOUA2/JPVB2Independent T-Test for Means (equal variances), Independent Z-Test for PercentagesUpper case letters indicate significance at the 95% level.
Page 65

2011 Centre Region Community Survey Results - Weighted Random Sample
34. Are you employed?Random sample weighted by relative municipality population
WEIGHTED
WEIGHTED
WEIGHTED
WEIGHTED
WEIGHTED
WEIGHTED
WEIGHTED
Random Sample
Random Sample
Random Sample
Random Sample
Random Sample
Random Sample
Random Sample
College Township
Ferguson Township
Halfmoon Township
Harris Township
Patton Township
Boro State College
(C) (K) (L) (M) (N) (O) (P)
TOTAL ANSWERING 453 53 99 14 32 81 174Yes 70.0% 65.8% 70.6% 78.3% 76.2% 73.8% 67.3%
No 30.0% 34.2% 29.4% 21.7% 23.8% 26.2% 32.7%D
Comparison Groups: ABCD/EFGHIJ/KLMNOP/QRSTUV/WXYZA2B2/EKQW/FLRX/GMSY/HNTZ/IOUA2/JPVB2Independent T-Test for Means (equal variances), Independent Z-Test for PercentagesUpper case letters indicate significance at the 95% level.
35. Please select the municipality in which your job is located.Random sample weighted by relative municipality population
WEIGHTED
WEIGHTED
WEIGHTED
WEIGHTED
WEIGHTED
WEIGHTED
WEIGHTED
Random Sample
Random Sample
Random Sample
Random Sample
Random Sample
Random Sample
Random Sample
College Township
Ferguson Township
Halfmoon Township
Harris Township
Patton Township
Boro State College
(C) (K) (L) (M) (N) (O) (P)
TOTAL ANSWERING 310 35 67 11 24 58 116State College Borough 49.6% 32.0% 39.5% 27.8% 29.0% 45.0% 69.2%
AD X KLMNOCollege Township 16.1% 28.0% 22.1% 5.6% 19.4% 13.3% 10.8%
MP MFerguson Township 11.6% 16.0% 17.4% 16.7% 12.9% 11.7% 6.2%
PPatton Township 7.3% 2.0% 3.5% 11.1% 6.5% 16.7% 6.2%
KLBenner Township 2.2% 4.0% 1.2% - - 1.7% 3.1%Harris Township 1.1% - 1.2% - 6.5% 1.7% -Bellefonte Borough 1.8% 2.0% - - 9.7% 1.7% 1.5%Halfmoon Township 0.6% - - 16.7% - - -Spring Township - - - - - - -Another municipality in Centre County 2.7% 4.0% 2.3% 11.1% 6.5% 1.7% 1.5%Another municipality outside Centre County 7.1% 12.0% 12.8% 11.1% 9.7% 6.7% 1.5%
P PComparison Groups: ABCD/EFGHIJ/KLMNOP/QRSTUV/WXYZA2B2/EKQW/FLRX/GMSY/HNTZ/IOUA2/JPVB2Independent T-Test for Means (equal variances), Independent Z-Test for PercentagesUpper case letters indicate significance at the 95% level.
Page 66

2011 Centre Region Community Survey Results - Weighted Random Sample
36. Which category best describes your occupation?Random sample weighted by relative municipality population
WEIGHTED
WEIGHTED
WEIGHTED
WEIGHTED
WEIGHTED
WEIGHTED
WEIGHTED
Random Sample
Random Sample
Random Sample
Random Sample
Random Sample
Random Sample
Random Sample
College Township
Ferguson Township
Halfmoon Township
Harris Township
Patton Township
Boro State College
(C) (K) (L) (M) (N) (O) (P)
TOTAL ANSWERING 314 34 69 11 24 59 117Professional 37.2% 38.8% 37.5% 61.1% 48.4% 41.0% 30.3%
PEducator 25.9% 22.4% 23.9% 11.1% 12.9% 29.5% 30.3%
D N MNManager or business owner 9.3% 14.3% 10.2% - 19.4% 6.6% 7.6%Service worker 5.7% 2.0% 8.0% - 3.2% 6.6% 6.1%
Clerical worker 3.8% 6.1% 5.7% 5.6% - - 4.5%Salesperson 4.8% 6.1% 3.4% 5.6% 6.5% 8.2% 3.0%Skilled worker 3.5% 4.1% 2.3% - 6.5% 4.9% 3.0%Other, please specify: 9.8% 6.1% 9.1% 16.7% 3.2% 3.3% 15.2%
NOComparison Groups: ABCD/EFGHIJ/KLMNOP/QRSTUV/WXYZA2B2/EKQW/FLRX/GMSY/HNTZ/IOUA2/JPVB2Independent T-Test for Means (equal variances), Independent Z-Test for PercentagesUpper case letters indicate significance at the 95% level.
37. Is anyone in your household a full-time or part-time student at Penn State University’s – University Park Campus?Random sample weighted by relative municipality population
WEIGHTED
WEIGHTED
WEIGHTED
WEIGHTED
WEIGHTED
WEIGHTED
WEIGHTED
Random Sample
Random Sample
Random Sample
Random Sample
Random Sample
Random Sample
Random Sample
College Township
Ferguson Township
Halfmoon Township
Harris Township
Patton Township
Boro State College
(C) (K) (L) (M) (N) (O) (P)
TOTAL ANSWERING 455 51 100 13 31 81 178Yes 99 8 17 2 5 14 52
21.7% 16.4% 17.2% 13.6% 17.1% 17.9% 29.0%KL
No 356 43 83 11 26 67 12678.3% 83.6% 82.8% 86.4% 82.9% 82.1% 71.0%
P PComparison Groups: ABCD/EFGHIJ/KLMNOP/QRSTUV/WXYZA2B2/EKQW/FLRX/GMSY/HNTZ/IOUA2/JPVB2Independent T-Test for Means (equal variances), Independent Z-Test for PercentagesUpper case letters indicate significance at the 95% level.
Page 67

2011 Centre Region Community Survey Results - Weighted Random Sample
38. Please check the one box that most closely describes the type of housing unit you live in.Random sample weighted by relative municipality population
WEIGHTED
WEIGHTED
WEIGHTED
WEIGHTED
WEIGHTED
WEIGHTED
WEIGHTED
Random Sample
Random Sample
Random Sample
Random Sample
Random Sample
Random Sample
Random Sample
College Township
Ferguson Township
Halfmoon Township
Harris Township
Patton Township
Boro State College
(C) (K) (L) (M) (N) (O) (P)
TOTAL ANSWERING 460 54 100 14 32 82 178A detached single family home 68.8% 72.7% 76.6% 100.0% 88.1% 61.2% 61.0%
OP KLNOP KOPTownhouse 10.1% 9.1% 10.2% - 2.4% 20.0% 8.0%
N KNPAn apartment in an apartment complex 12.3% 5.2% 4.7% - 2.4% 15.3% 20.0%
KLN KLNA duplex 3.6% 2.6% 5.5% - 2.4% 2.4% 4.0%An apartment in a single family home 2.6% 2.6% - - - - 6.0%
DA mobile home 0.4% - - - 2.4% 1.2% -Other 2.1% 7.8% 3.1% - 2.4% - 1.0%
PComparison Groups: ABCD/EFGHIJ/KLMNOP/QRSTUV/WXYZA2B2/EKQW/FLRX/GMSY/HNTZ/IOUA2/JPVB2Independent T-Test for Means (equal variances), Independent Z-Test for PercentagesUpper case letters indicate significance at the 95% level.
39. Do you rent or own your residence?Random sample weighted by relative municipality population
WEIGHTED
WEIGHTED
WEIGHTED
WEIGHTED
WEIGHTED
WEIGHTED
WEIGHTED
Random Sample
Random Sample
Random Sample
Random Sample
Random Sample
Random Sample
Random Sample
College Township
Ferguson Township
Halfmoon Township
Harris Township
Patton Township
Boro State College
(C) (K) (L) (M) (N) (O) (P)
TOTAL ANSWERING 458 53 99 14 32 82 178Rent 25.7% 15.8% 15.9% - 16.7% 27.1% 37.0%
D KLNOwn 74.3% 84.2% 84.1% 100.0% 83.3% 72.9% 63.0%
P P KLNOP PComparison Groups: ABCD/EFGHIJ/KLMNOP/QRSTUV/WXYZA2B2/EKQW/FLRX/GMSY/HNTZ/IOUA2/JPVB2Independent T-Test for Means (equal variances), Independent Z-Test for PercentagesUpper case letters indicate significance at the 95% level.
Page 68

2011 Centre Region Community Survey Results - Weighted Random Sample
40. About how much was the gross income for your household in 2010? (Include all persons in the household for which a tax return was filed)Random sample weighted by relative municipality population
WEIGHTED
WEIGHTED
WEIGHTED
WEIGHTED
WEIGHTED
WEIGHTED
WEIGHTED
Random Sample
Random Sample
Random Sample
Random Sample
Random Sample
Random Sample
Random Sample
College Township
Ferguson Township
Halfmoon Township
Harris Township
Patton Township
Boro State College
(C) (K) (L) (M) (N) (O) (P)
TOTAL ANSWERING 429 50 91 12 30 78 169Less than $10,000 3.4% 4.2% - - - - 7.4%$10,000 to $14,999 2.1% 2.8% 0.9% - 5.1% 2.5% 2.1%$15,000 to $24,999 5.8% 2.8% 5.2% - 2.6% 7.4% 7.4%$25,000 to $34,999 9.2% 7.0% 7.8% 5.0% 5.1% 4.9% 13.7%
O$35,000 to $49,999 11.2% 15.5% 10.3% 10.0% 5.1% 8.6% 12.6%
$50,000 to $74,999 19.3% 15.5% 20.7% 25.0% 15.4% 25.9% 16.8%
$75,000 to $99,999 16.6% 16.9% 17.2% 25.0% 28.2% 16.0% 13.7%$100,000 to $149,999 20.6% 18.3% 25.0% 35.0% 23.1% 17.3% 18.9%
$150,000 to $199,999 6.6% 9.9% 6.0% - 5.1% 7.4% 6.3%$200,000 or more 5.2% 7.0% 6.9% - 10.3% 9.9% 1.1%
P PComparison Groups: ABCD/EFGHIJ/KLMNOP/QRSTUV/WXYZA2B2/EKQW/FLRX/GMSY/HNTZ/IOUA2/JPVB2Independent T-Test for Means (equal variances), Independent Z-Test for PercentagesUpper case letters indicate significance at the 95% level.
41. My age group is...Random sample weighted by relative municipality population
WEIGHTED
WEIGHTED
WEIGHTED
WEIGHTED
WEIGHTED
WEIGHTED
WEIGHTED
Random Sample
Random Sample
Random Sample
Random Sample
Random Sample
Random Sample
Random Sample
College Township
Ferguson Township
Halfmoon Township
Harris Township
Patton Township
Boro State College
(C) (K) (L) (M) (N) (O) (P)
TOTAL ANSWERING 453 54 98 14 30 79 17818 - 24 6.3% 2.6% 0.8% - - 8.5% 11.0%
L KL25 - 34 14.9% 6.5% 11.2% - 15.0% 18.3% 19.0%
K K35 - 44 11.8% 13.0% 16.0% 13.0% 5.0% 14.6% 9.0%
N45 - 59 31.6% 27.3% 36.0% 43.5% 47.5% 29.3% 28.0%
ZKP60 - 64 11.8% 20.8% 10.4% 17.4% 12.5% 12.2% 9.0%
P65 + 23.6% 29.9% 25.6% 26.1% 20.0% 17.1% 24.0%
DComparison Groups: ABCD/EFGHIJ/KLMNOP/QRSTUV/WXYZA2B2/EKQW/FLRX/GMSY/HNTZ/IOUA2/JPVB2Independent T-Test for Means (equal variances), Independent Z-Test for PercentagesUpper case letters indicate significance at the 95% level.
Page 69

2011 Centre Region Community Survey Results - Weighted Random Sample
42. What is the highest level of education you have completed?Random sample weighted by relative municipality population
WEIGHTED
WEIGHTED
WEIGHTED
WEIGHTED
WEIGHTED
WEIGHTED
WEIGHTED
Random Sample
Random Sample
Random Sample
Random Sample
Random Sample
Random Sample
Random Sample
College Township
Ferguson Township
Halfmoon Township
Harris Township
Patton Township
Boro State College
(C) (K) (L) (M) (N) (O) (P)
TOTAL ANSWERING 451 54 97 14 32 80 1740-11 years, no diploma - - - - - - -High school graduate 6.3% 7.8% 5.6% 21.7% 11.9% 3.6% 5.1%
OSome college, no degree 9.2% 19.5% 11.3% 17.4% 9.5% 7.2% 5.1%
OPAssociate Degree 5.5% 7.8% 7.3% 4.3% 7.1% 2.4% 5.1%
Bachelor's Degree 33.8% 33.8% 29.0% 34.8% 38.1% 33.7% 35.7%Master's Degree 26.4% 14.3% 25.8% 17.4% 14.3% 34.9% 29.6%
K KN KNDoctorate Degree 18.7% 16.9% 21.0% 4.3% 19.0% 18.1% 19.4%
D M XM M M MComparison Groups: ABCD/EFGHIJ/KLMNOP/QRSTUV/WXYZA2B2/EKQW/FLRX/GMSY/HNTZ/IOUA2/JPVB2Independent T-Test for Means (equal variances), Independent Z-Test for PercentagesUpper case letters indicate significance at the 95% level.
43. What is your gender?Random sample weighted by relative municipality population
WEIGHTED
WEIGHTED
WEIGHTED
WEIGHTED
WEIGHTED
WEIGHTED
WEIGHTED
Random Sample
Random Sample
Random Sample
Random Sample
Random Sample
Random Sample
Random Sample
College Township
Ferguson Township
Halfmoon Township
Harris Township
Patton Township
Boro State College
(C) (K) (L) (M) (N) (O) (P)
TOTAL ANSWERING 452 54 99 14 32 76 178Male 55.8% 49.4% 57.1% 65.2% 71.4% 59.5% 52.0%
Y KPFemale 44.2% 50.6% 42.9% 34.8% 28.6% 40.5% 48.0%
N NComparison Groups: ABCD/EFGHIJ/KLMNOP/QRSTUV/WXYZA2B2/EKQW/FLRX/GMSY/HNTZ/IOUA2/JPVB2Independent T-Test for Means (equal variances), Independent Z-Test for PercentagesUpper case letters indicate significance at the 95% level.
Page 70
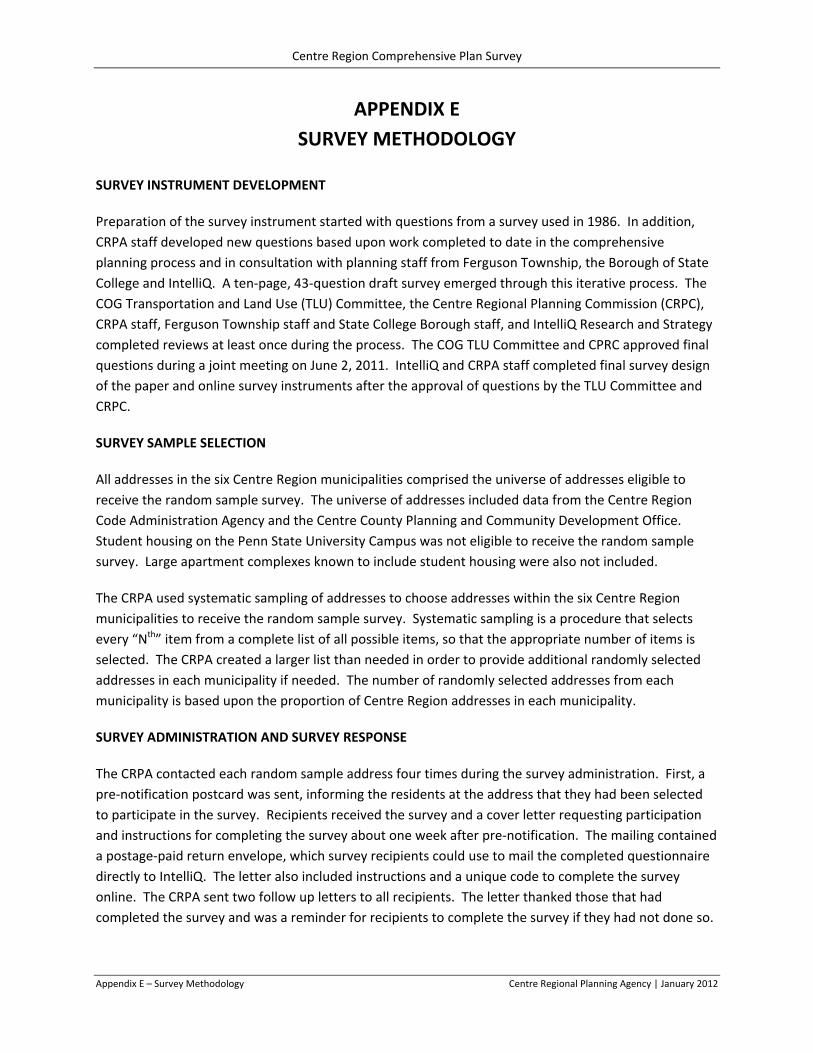
Centre Region Comprehensive Plan Survey
Appendix E – Survey Methodology Centre Regional Planning Agency | January 2012
APPENDIX E
SURVEY METHODOLOGY
SURVEY INSTRUMENT DEVELOPMENT
Preparation of the survey instrument started with questions from a survey used in 1986. In addition,
CRPA staff developed new questions based upon work completed to date in the comprehensive
planning process and in consultation with planning staff from Ferguson Township, the Borough of State
College and IntelliQ. A ten‐page, 43‐question draft survey emerged through this iterative process. The
COG Transportation and Land Use (TLU) Committee, the Centre Regional Planning Commission (CRPC),
CRPA staff, Ferguson Township staff and State College Borough staff, and IntelliQ Research and Strategy
completed reviews at least once during the process. The COG TLU Committee and CPRC approved final
questions during a joint meeting on June 2, 2011. IntelliQ and CRPA staff completed final survey design
of the paper and online survey instruments after the approval of questions by the TLU Committee and
CRPC.
SURVEY SAMPLE SELECTION
All addresses in the six Centre Region municipalities comprised the universe of addresses eligible to
receive the random sample survey. The universe of addresses included data from the Centre Region
Code Administration Agency and the Centre County Planning and Community Development Office.
Student housing on the Penn State University Campus was not eligible to receive the random sample
survey. Large apartment complexes known to include student housing were also not included.
The CRPA used systematic sampling of addresses to choose addresses within the six Centre Region
municipalities to receive the random sample survey. Systematic sampling is a procedure that selects
every “Nth” item from a complete list of all possible items, so that the appropriate number of items is
selected. The CRPA created a larger list than needed in order to provide additional randomly selected
addresses in each municipality if needed. The number of randomly selected addresses from each
municipality is based upon the proportion of Centre Region addresses in each municipality.
SURVEY ADMINISTRATION AND SURVEY RESPONSE
The CRPA contacted each random sample address four times during the survey administration. First, a
pre‐notification postcard was sent, informing the residents at the address that they had been selected
to participate in the survey. Recipients received the survey and a cover letter requesting participation
and instructions for completing the survey about one week after pre‐notification. The mailing contained
a postage‐paid return envelope, which survey recipients could use to mail the completed questionnaire
directly to IntelliQ. The letter also included instructions and a unique code to complete the survey
online. The CRPA sent two follow up letters to all recipients. The letter thanked those that had
completed the survey and was a reminder for recipients to complete the survey if they had not done so.

Centre Region Comprehensive Plan Survey
Appendix E – Survey Methodology Centre Regional Planning Agency | January 2012
A total of 461 persons responded to the random sample survey of 2,005, resulting in a response rate
of 23%. Another 150 individuals completed the “drop‐in” survey. The response rate is about 30% when
the random sample and “drop‐in” surveys are combined. Initially, there were 2,020 addresses for the
survey mailing. Six of the initial addresses were discarded due to problems with the address. A total
of 18 pre‐notification postcards were returned as “undeliverable,” and nine of these addresses were
eventually removed from the mailing list. A total of three surveys were returned as “undeliverable,”
resulting in a total of 2,002 surveys eventually making it to individual mailboxes in the region.
95 PERCENT CONFIDENCE INTERVALS
The 95 percent confidence interval (or “margin of error”) quantifies the “sampling error” or precision of
the estimates made from the survey results. A 95 percent confidence interval can be calculated for any
sample size, and indicates that in 95 of 100 surveys conducted like this one, for a particular item, a result
would be found that is within ±3 percentage points of the result that would be found if everyone in the
population of interest was surveyed. Other types of “error” such as nonresponse error may also
influence or bias results (i.e. those who did not respond to the survey may have felt differently about
the issues covered than those who did respond).
DATA ENTRY, DATA WEIGHTING, AND DATA ANALYSIS
Data entry, data weighting, and data analysis was conducted by IntelliQ under contract with the Centre
Region Council of Governments. Appendix D contains the weighted random sample results for the
survey. The weighted sample was used to test the validity of the random sample. There were not
statistically significant differences between the results, and in the end, the CRPA used the unweighted
random sample for analysis in this document.
RESPONDENT CHARACTERISTICS
The CRPA sent surveys to 2,002 random addresses in the region. It primarily asked for resident opinions
regarding long‐term land use, transportation, environmental and housing questions. The intent was to
understand opinions from full‐time, year‐round residents of the Centre Region.
The CRPA compared demographic characteristics of the survey sample, where possible, to those
demographic characteristics found in the 2010 US Census estimates in the region. The consultant did
not adjust (i.e. weight) demographic characteristics to reflect the larger population in the region. There
are differences between the random sample demographics and the 2010 US Census estimates. The
differences are largely attributed to the number of students living in the region. For example, the
student population artificially reduces the median age, median income, and homeownership estimates
found in the US Census.

Centre Region Comprehensive Plan Survey
Appendix E – Survey Methodology Centre Regional Planning Agency | January 2012
The following differences between demographic characteristics of the random sample and the 2010 US
Census estimates are noted:
The random sample is older.
The random sample is wealthier.
There are more homeowners in the random sample.
There are more single‐family homeowners in the random sample.
The random sample had longer‐term residents.
The random sample had a slightly higher level of education.
Location of residence, length of residence, home ownership and type of residence
Returnedvia US Mail
63%
Returned via Web37%
A total of 461 responses to the random samplesurvey = 23% Response Rate
Halfmoon Township5%
Harris Township9%
CollegeTownship
17%
PattonTownship
18%
Borough of State College22%
FergusonTownship
29%
Where do you live?

Centre Region Comprehensive Plan Survey
Appendix E – Survey Methodology Centre Regional Planning Agency | January 2012
1 year or less3%2 to 5 years
18%
6 to 10 years14%
11 to 15 years12%
16 to 20 years9% Over 20 years
44%
How long have you lived in a Centre Region municipality?
Rent22%
Own78%
Do you rent or own your residence?

Centre Region Comprehensive Plan Survey
Appendix E – Survey Methodology Centre Regional Planning Agency | January 2012
Location of work, employment status and employment classification
0%
2%
3%
4%
10%
10%
72%
0% 10% 20% 30% 40% 50% 60% 70% 80%
A mobile home
An apartment in a single family home
Other
A duplex
An apartment in an apartment complex
Townhouse
A detached single family home
Percent Responding
Please indicate which type of housing unit you live in.
29%
71%
0% 10% 20% 30% 40% 50% 60% 70% 80%
No
Yes
Percent Responding
Are you employed?

Centre Region Comprehensive Plan Survey
Appendix E – Survey Methodology Centre Regional Planning Agency | January 2012
0%
1%
1%
2%
2%
3%
7%
9%
13%
18%
44%
0% 5% 10% 15% 20% 25% 30% 35% 40% 45% 50%
Spring Township
Harris Township
Halfmoon Township
Benner Township
Bellefonte Borough
Another municipalityin Centre County
Patton Township
Another municipalityoutside of Centre County
Ferguson Township
College Township
State College Borough
Percent Responding
Select the municipality where your job is located.
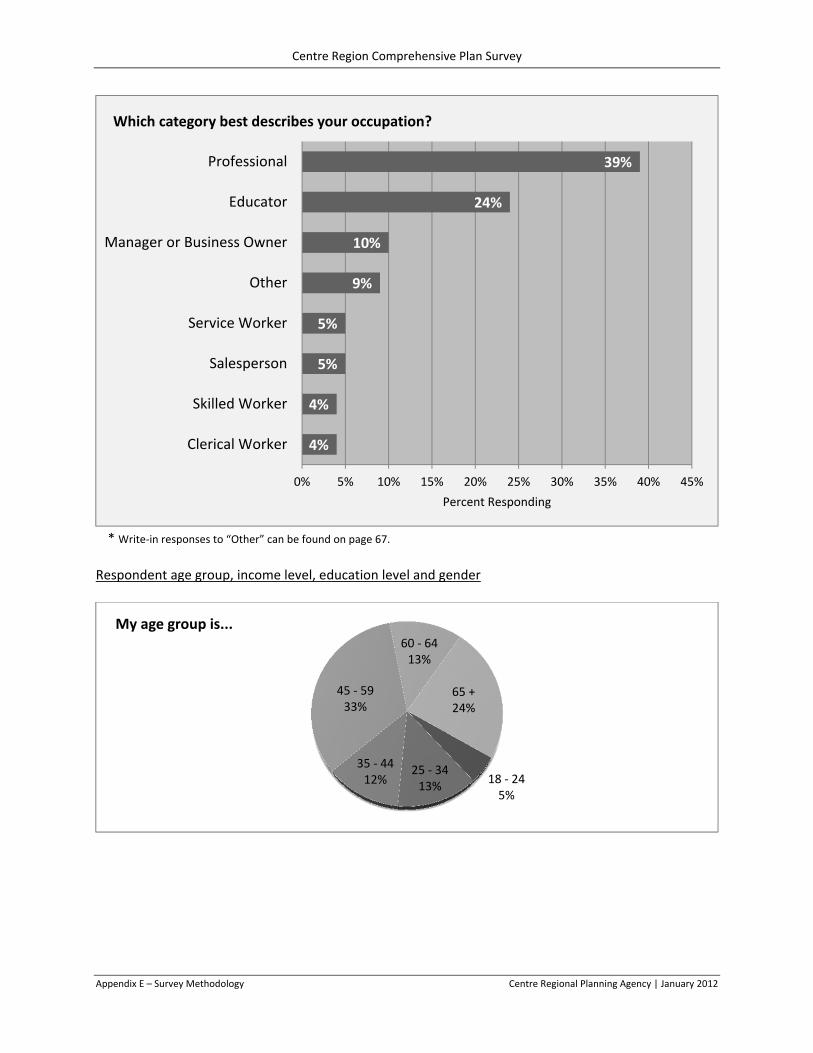
Centre Region Comprehensive Plan Survey
Appendix E – Survey Methodology Centre Regional Planning Agency | January 2012
* Write‐in responses to “Other” can be found on page 67.
Respondent age group, income level, education level and gender
4%
4%
5%
5%
9%
10%
24%
39%
0% 5% 10% 15% 20% 25% 30% 35% 40% 45%
Clerical Worker
Skilled Worker
Salesperson
Service Worker
Other
Manager or Business Owner
Educator
Professional
Percent Responding
Which category best describes your occupation?
18 ‐ 245%
25 ‐ 3413%
35 ‐ 4412%
45 ‐ 5933%
60 ‐ 6413%
65 +24%
My age group is...

Centre Region Comprehensive Plan Survey
Appendix E – Survey Methodology Centre Regional Planning Agency | January 2012
2%
2%
5%
8%
11%
19%
18%
21%
7%
6%
0% 5% 10% 15% 20% 25%
Less than $10,000
$10,000 to $14,999
$15,000 to $24,999
$25,000 to $34,999
$35,000 to $49,999
$50,000 to $74,999
$75,000 to $99,999
$100,000 to $149,999
$150,000 to $199,999
$200,000 or more
Percent Responding
About how much was your gross household income in 2010?

Centre Region Comprehensive Plan Survey
Appendix E – Survey Methodology Centre Regional Planning Agency | January 2012
0%
7%
11%
6%
33%
25%
18%
0% 5% 10% 15% 20% 25% 30% 35%
0‐11 years, no diploma
High school graduate
Some college, no degree
Associate Degree
Bachelor's Degree
Master's Degree
Doctorate Degree
Percent Responding
Highest level of education completed?
Male57%
Female43%
What is your gender?

Centre Region Comprehensive Plan Survey
Appendix F – 1986 Survey Questionnaire and Results Centre Regional Planning Agency | January 2012
APPENDIX F
1986 SURVEY QUESTIONNAIRE AND RESULTS
The last survey to measure resident opinion regarding region‐wide land use issues was competed in
1986. Several questions from the 1986 survey were included in 2011 to measure any significant changes
in the intervening 25 years. The results are summarized below and discussed in more detail following
the table.
1986 and 2011 Survey Questions 1986 2011
Strongly Agree/ Agree
Uncertain/ Undecided
Strongly Disagree/ Disagree
Strongly Agree/ Agree
Uncertain/ Undecided
Strongly Disagree/ Disagree
The Centre Region should have an overall plan which identifies where different types of development would be permitted.1
87% 7% 6% 90%
+3%
6%
‐1%
4%
‐2%
I would like local government officials to have a stronger role in controlling new development in the area.
54% 27% 18% 46%
‐8%
35%
+8%
19%
+1%
Individuals and developers should be free to develop land without a lot of controls and restrictions by local government.2
13% 7% 79% 15%
+2%
8%
+1%
77%
‐1%
Local government should protect historic landmarks and buildings through regulations and law.3
75% 15% 10% 68%
‐7%
18%
+3%
14%
+4%
Local government should use local tax resources to restore and preserve historic landmarks and buildings.4
78% 14% 9% 47%
‐31%
28%
+14%
25%
+16%
The economic needs of the area should be the main thing that determines what type of development takes place in the Centre Region.5
39% 18% 43% 47%
+8%
22%
+4%
31%
‐12%
There are not enough homes available for purchase in my price range.6
35% 26% 39% 46%
[yes]
41%
[no]
15% [don’t Know]
There are not enough rental units available in my price range.7
27% 36% 37% 30%
[yes]
37%
[no]
34% [don’t Know]
Source: Centre Regional Planning Agency, November 2011 Notes:
(1) Changed in 2011 to “The Centre Region should have an overall plan that directs future growth and development to appropriate locations.”
(2) Changed in 2011 to “Individuals and developers should be free to develop land without a lot of controls and restrictions by municipalities.”
(3) Changed in 2011 to “Municipalities should protect historic landmarks and buildings through regulations and law.” (4) Changed in 2011 to “Municipalities should use local tax resources to protect historic landmarks and buildings.” (5) Changed in 2011 to “The economic needs of the area should be the driving force that determines what type of development
takes place in the Centre Region.” (6) Changed in 2011 to “Do you feel there are enough homes available for purchase in your price range in the Centre Region?” (7) Changed in 2011 to “Do you feel there is enough rental housing available in your price range in the Centre Region?”
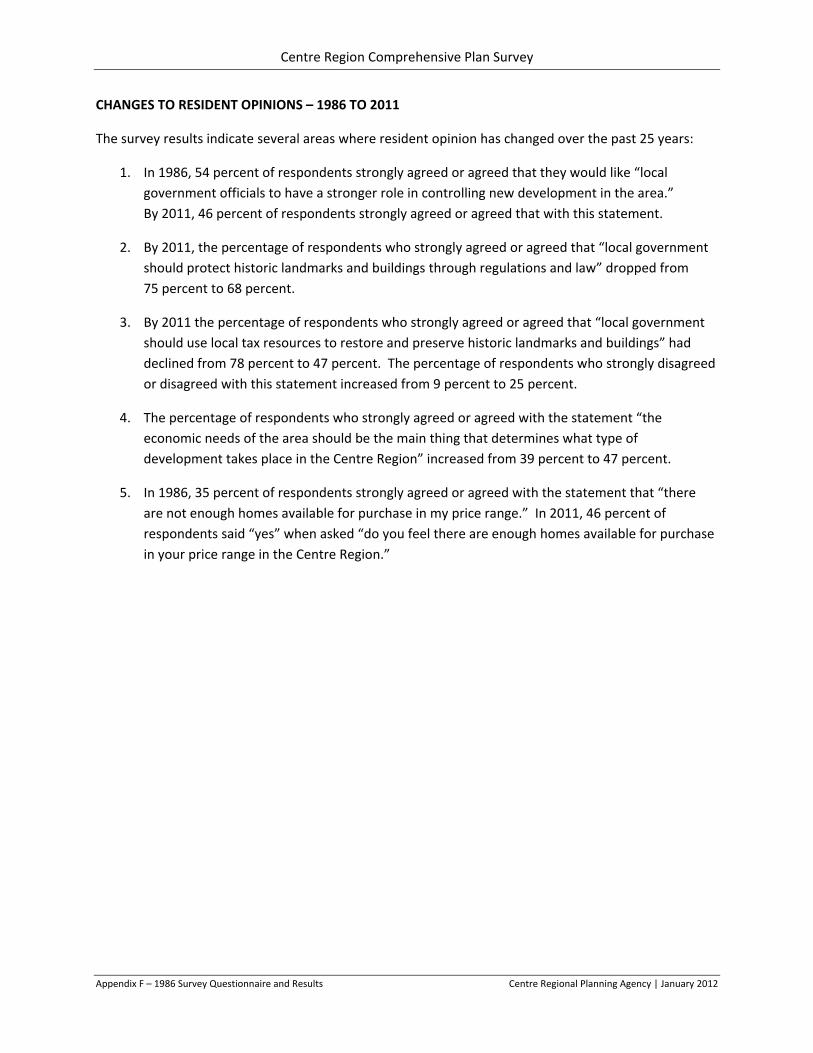
Centre Region Comprehensive Plan Survey
Appendix F – 1986 Survey Questionnaire and Results Centre Regional Planning Agency | January 2012
CHANGES TO RESIDENT OPINIONS – 1986 TO 2011
The survey results indicate several areas where resident opinion has changed over the past 25 years:
1. In 1986, 54 percent of respondents strongly agreed or agreed that they would like “local
government officials to have a stronger role in controlling new development in the area.”
By 2011, 46 percent of respondents strongly agreed or agreed that with this statement.
2. By 2011, the percentage of respondents who strongly agreed or agreed that “local government
should protect historic landmarks and buildings through regulations and law” dropped from
75 percent to 68 percent.
3. By 2011 the percentage of respondents who strongly agreed or agreed that “local government
should use local tax resources to restore and preserve historic landmarks and buildings” had
declined from 78 percent to 47 percent. The percentage of respondents who strongly disagreed
or disagreed with this statement increased from 9 percent to 25 percent.
4. The percentage of respondents who strongly agreed or agreed with the statement “the
economic needs of the area should be the main thing that determines what type of
development takes place in the Centre Region” increased from 39 percent to 47 percent.
5. In 1986, 35 percent of respondents strongly agreed or agreed with the statement that “there
are not enough homes available for purchase in my price range.” In 2011, 46 percent of
respondents said “yes” when asked “do you feel there are enough homes available for purchase
in your price range in the Centre Region.”
Centre Region Comprehensive Plan Survey
APPENDIX G – Communication and Notification Centre Regional Planning Agency | January 2012
APPENDIX G
COMMUNICATION AND NOTIFICATION
The CRPA employed an extensive publicity and notification methodology to solicit public participation in
the survey.
CENTRE DAILY TIMES INSERT
This consisted of a color 8 ½ x 11 full color insert in the Centre Daily Times. The distribution
included all subscribers to the newspaper.
PRE‐NOTIFICATION POSTCARD
Pre‐notification postcards were sent to the 2,000 randomly selected addresses about two
weeks prior to receiving the survey.
FIRST REMINDER LETTER
A reminder letter was sent to all 2,000 randomly selected addresses about two weeks after
they had received the survey.
CENTRE DAILY TIMES ARTICLE
An article was placed in Centre Daily Times opinion page about halfway through the survey
process.
SECOND REMINDER LETTER
A second reminder letter was sent to all 2,000 randomly selected addresses about two
weeks prior to the survey deadline.
PROJECT SCHEDULE
A project schedule was reviewed monthly at the Centre Regional Planning Commission
(CRPC) and COG Transportation and Land Use (TLU) Committee meetings throughout the
survey process.
PUBLIC MEETINGS
Regular announcements were made at COG meetings, CRPC meetings, and municipal
meetings attended by CRPA staff.
WEBPAGE POSTINGS
The drop‐in survey was posted on the COG webpage throughout the survey period, and
several municipalities posted reminders for residents on municipal web pages.

Centre Region Comprehensive Plan Survey
APPENDIX G – Communication and Notification Centre Regional Planning Agency | January 2012
CENTRE DAILY TIMES INSERT

Centre Region Comprehensive Plan Survey
APPENDIX G – Communication and Notification Centre Regional Planning Agency | January 2012
PRE‐NOTIFICATION POSTCARD
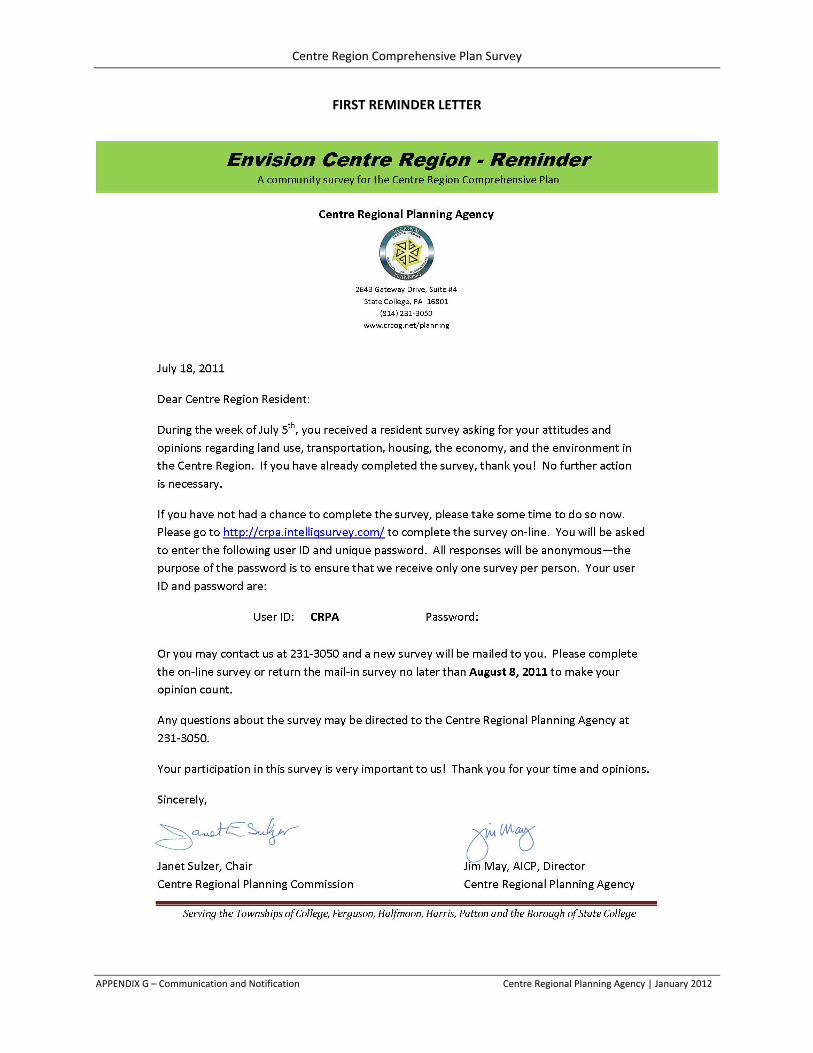
Centre Region Comprehensive Plan Survey
APPENDIX G – Communication and Notification Centre Regional Planning Agency | January 2012
FIRST REMINDER LETTER

Centre Region Comprehensive Plan Survey
APPENDIX G – Communication and Notification Centre Regional Planning Agency | January 2012
CENTRE DAILY TIMES ARTICLE

Centre Region Comprehensive Plan Survey
APPENDIX G – Communication and Notification Centre Regional Planning Agency | January 2012
SECOND REMINDER LETTER

Centre Region Comprehensive Plan Survey
APPENDIX G – Communication and Notification Centre Regional Planning Agency | January 2012
PROJECT SCHEDULE