final upper red river of the north watershed total maximum ... · pdf fileafo. december. 2017...
TRANSCRIPT
afo
December 2017
Upper Red River of the North Watershed Total Maximum
Daily Load Report
wq-iw5-09e
2
Authors and contributors: Rachel Olm, Tim Erickson and Mark Deutschman Houston Engineering, Inc. 6901 East Fish Lake Road, Suite 140 Maple Grove, Minnesota
Ms. Tara Mercil and T. R. James Minnesota Pollution Control Agency 714 Lake Avenue, Suite 220 Detroit Lakes, Minnesota
Acknowledgements:
Mr. Erik Jones Houston Engineering, Inc. 1401 21st Avenue North Fargo, North Dakota Mr. Bruce Albright Buffalo-Red River Watershed District 1303 4th Avenue Northeast Barnesville, Minnesota
The MPCA is reducing printing and mailing costs by using the Internet to distribute reports and information to a wider audience. Visit our website for more information. The MPCA reports are printed on 100% post-consumer recycled paper manufactured without chlorine or chlorine derivatives.
Cover Photo Credit:
Minnesota Pollution Control Agency (MPCA), 2013. Upper Red River of the North Watershed Monitoring and Assessment Report, January 2013.
3
Contents Contents ............................................................................................................................................3
List of Tables ......................................................................................................................................5
List of Figures .....................................................................................................................................6
TMDL Summary Table ........................................................................................................................7
Acronyms ..........................................................................................................................................9
Executive Summary .......................................................................................................................... 10
1. Project Overview ...................................................................................................................... 11
1.1 Purpose .............................................................................................................................................. 11
1.2 Identification of Waterbodies ............................................................................................................ 12
1.3 Priority Ranking .................................................................................................................................. 14
2. Applicable Water Quality Standards and Numeric Water Quality Targets ................................... 15
2.1 Lakes ................................................................................................................................................... 15
2.2 Streams .............................................................................................................................................. 15
3. Watershed and Waterbody Characterization ............................................................................. 17
3.1 Streams .............................................................................................................................................. 19
3.2 Subwatersheds ................................................................................................................................... 19
3.2.1 The Wolverton Creek Subwatershed (HUC 090201040304) .............................................. 21
3.2.2 The Whiskey Creek Subwatershed (HUC 090201040203) .................................................. 21
3.3 Land Use ............................................................................................................................................. 24
3.4 Current/Historic Water Quality .......................................................................................................... 26
3.4.1 Escherichia coli .................................................................................................................... 28
3.4.2 Total Suspended Solids (TSS) .............................................................................................. 30
3.5 Pollutant Source Summary ................................................................................................................. 30
3.5.1 Escherichia coli .................................................................................................................... 30
3.5.1.1 Permitted ........................................................................................................................ 32
3.5.1.2 Non-permitted Sources ................................................................................................... 32
E. coli Source Summary ................................................................................................................... 38
3.5.2 TSS ....................................................................................................................................... 39
3.5.2.1 Permitted (Point) Sources ............................................................................................... 39
3.5.2.2 Non-permitted ................................................................................................................ 40
4 TMDL Development .................................................................................................................. 42
4.1 Escherichia coli ................................................................................................................................... 42
4.1.1 Loading Capacity Methodology .......................................................................................... 42
4.1.2 Load Allocation Methodology ............................................................................................. 45

4
4.1.3 Wasteload Allocation Methodology ................................................................................... 46
4.1.4 Margin of Safety .................................................................................................................. 46
4.1.5 Seasonal Variation .............................................................................................................. 47
4.1.6 Reserve Capacity ................................................................................................................. 47
4.1.7 TMDL Summary ................................................................................................................... 47
4.2 TSS ...................................................................................................................................................... 48
4.2.1 Loading Capacity ................................................................................................................. 48
4.2.2 Load Allocation Methodology ............................................................................................. 49
4.2.3 Wasteload Allocation Methodology ................................................................................... 49
4.2.4 Margin of Safety .................................................................................................................. 51
4.2.5 Season Variation ................................................................................................................. 51
4.2.6 Reserve Capacity ................................................................................................................. 51
4.2.7 TMDL Summary ................................................................................................................... 51
5 Future Growth Considerations .................................................................................................. 53
5.1 New or Expanding Permitted MS4 WLA Transfer Process ................................................................. 53
5.2 New or Expanding Wastewater.......................................................................................................... 53
6 Reasonable Assurance .............................................................................................................. 55
7 Monitoring Plan ........................................................................................................................ 57
8 Implementation Strategy Summary ........................................................................................... 58
8.1 Permitted Sources .............................................................................................................................. 59
8.1.1 Construction Stormwater ................................................................................................... 59
8.1.2 Industrial Stormwater ......................................................................................................... 59
8.1.3 MS4 ..................................................................................................................................... 59
8.1.4 Wastewater ......................................................................................................................... 59
8.2 Non-Permitted Sources ...................................................................................................................... 59
8.3 Cost .................................................................................................................................................... 61
8.4 Adaptive Management....................................................................................................................... 61
9 Public Participation ................................................................................................................... 63
Public Notice ....................................................................................................................................... 63
10 Literature Cited ..................................................................................................................... 64
Appendices ...................................................................................................................................... 65
5
List of Tables Table 1-1: URRW impairments addressed in this report. ........................................................................... 12
Table 2-1: Surface water quality standards for URRW stream reaches addressed in this report. ............. 16
Table 3-1: Impaired stream reach direct and total drainage areas. ........................................................... 19
Table 3-2: Land use percentages in the URRW by drainage area. Land use statistics are based on 2011 NLCD. ........................................................................................................................................................... 24
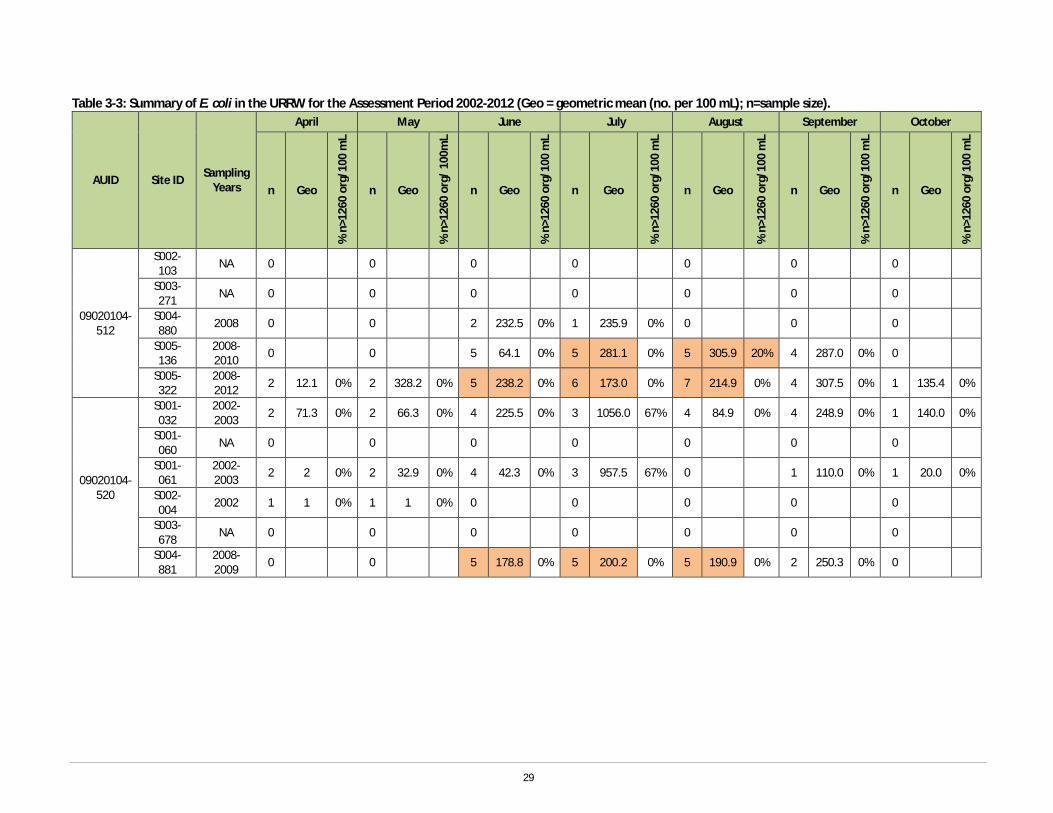
Table 3-3: Summary of E. coli in the URRW for the Assessment Period 2002-2012 (Geo = geometric mean (no. per 100 mL); n=sample size). ............................................................................................................... 29
Table 3-4: Summary of Sites with Total Suspended Solids Observations (n=sample size) ......................... 30
Table 3-5: Bacteria production rates by source .......................................................................................... 31
Table 3-6: WWTFs, permitted flows and bacteria loads for minor facilities in the URRW. ........................ 32
Table 3-7: SSTS compliance status in the URRW. ....................................................................................... 33
Table 3-8: Data sources, assumptions, and distribution of bacteria attributed to humans. ...................... 34
Table 3-9: Livestock Population Estimates (numbers) in the URRW. ......................................................... 35
Table 3-10: Data sources, assumptions, and watershed distribution of bacteria from livestock. ............. 36
Table 3-11: Data Sources and Assumption for Wildlife Population and Bacteria Delivery. ....................... 37
Table 3-12: E. coli Relative Source Summaries. .......................................................................................... 39
Table 3-13: Relevant WWTF permits in the TMDL...................................................................................... 40
Table 4-1: Converting flow and concentration into bacterial load. ............................................................ 43
Table 4-2: Water quality sites used to develop load duration curves by AUID. ......................................... 45
Table 4-3: Annual and daily E. coli wasteload allocations for URRW WWTFs discharging to impaired HUC 12. ............................................................................................................................................................... 46
Table 4-4: Maximum required bacterial load reductions for the URRW. ................................................... 47
Table 4-5: Bacteria loading capacities and allocations for AUID 09020104-512. ....................................... 48
Table 4-6: Bacteria loading capacities and allocations for AUID 09020104-520. ....................................... 48
Table 4-7: Converting flow and concentration to sediment load. .............................................................. 49
Table 4-8: Water Quality Sites used to Develop TSS LDCs. ......................................................................... 49
Table 4-9: Annual and daily TSS wasteload allocations for URRW WWTFs contributing to TSS impaired reach ........................................................................................................................................................... 51
Table 4-10: Maximum required TSS load reductions for the URRW. ......................................................... 51
6
List of Figures Figure 1-1: Impairments in the URRW. ....................................................................................................... 13
Figure 3-1: EPA Level 3 Eco-regions of the URRW. ..................................................................................... 18
Figure 3-2: URRW HUC-12 Subwatersheds ................................................................................................. 20
Figure 3-3: Wolverton Creek Subwatershed ............................................................................................... 22
Figure 3-4: Whiskey Creek Subwatershed .................................................................................................. 23
Figure 3-5: Land uses in the URRW (2011 NLCD dataset). .......................................................................... 25
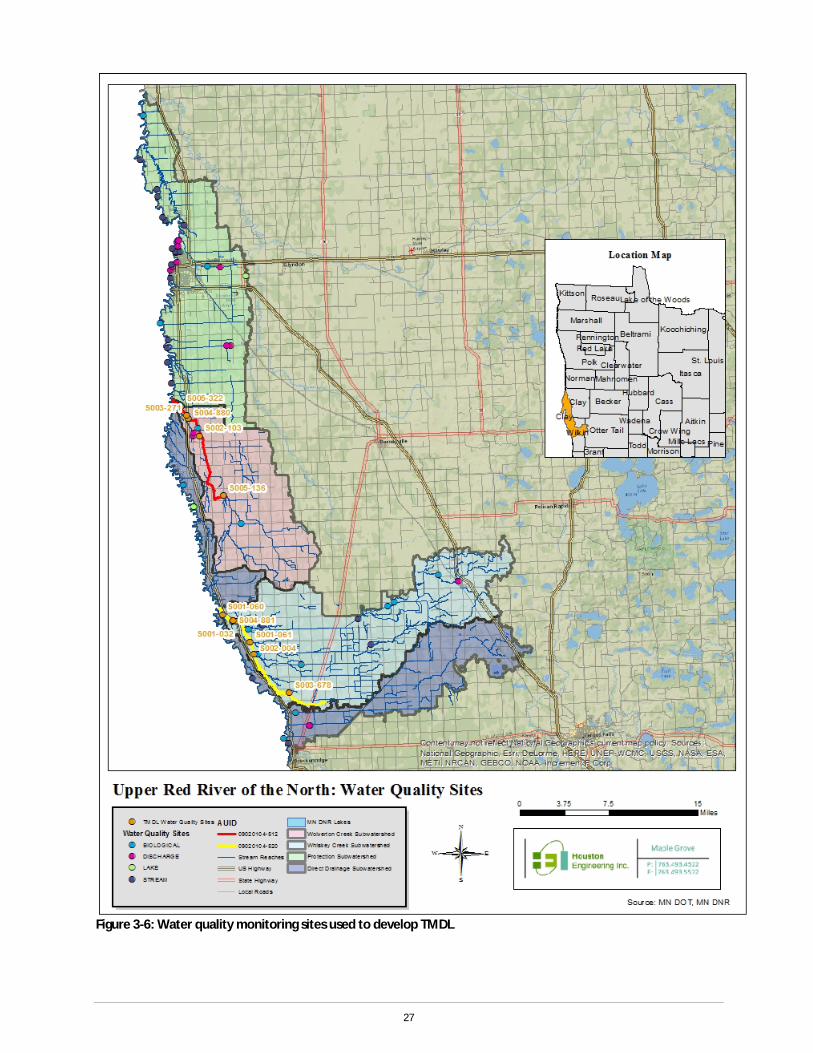
Figure 3-6: Water quality monitoring sites used to develop TMDL ............................................................ 27
Figure 3-7: Targeting field scale catchments within Whiskey Creek based upon sediment delivery to the subwatershed outlet. .................................................................................................................................. 41
Figure 4-1: Wolverton and Whiskey Creeks, water quality monitoring locations, and USGS flow monitoring stations used for LDCs in the URRW. ....................................................................................... 44
Figure 6-1: Minnesota Water Quality Framework. ..................................................................................... 56
Figure 8-1: Adaptive Management ............................................................................................................. 62
7
TMDL Summary Table EPA/MPCA Required
Elements Summary TMDL Page #
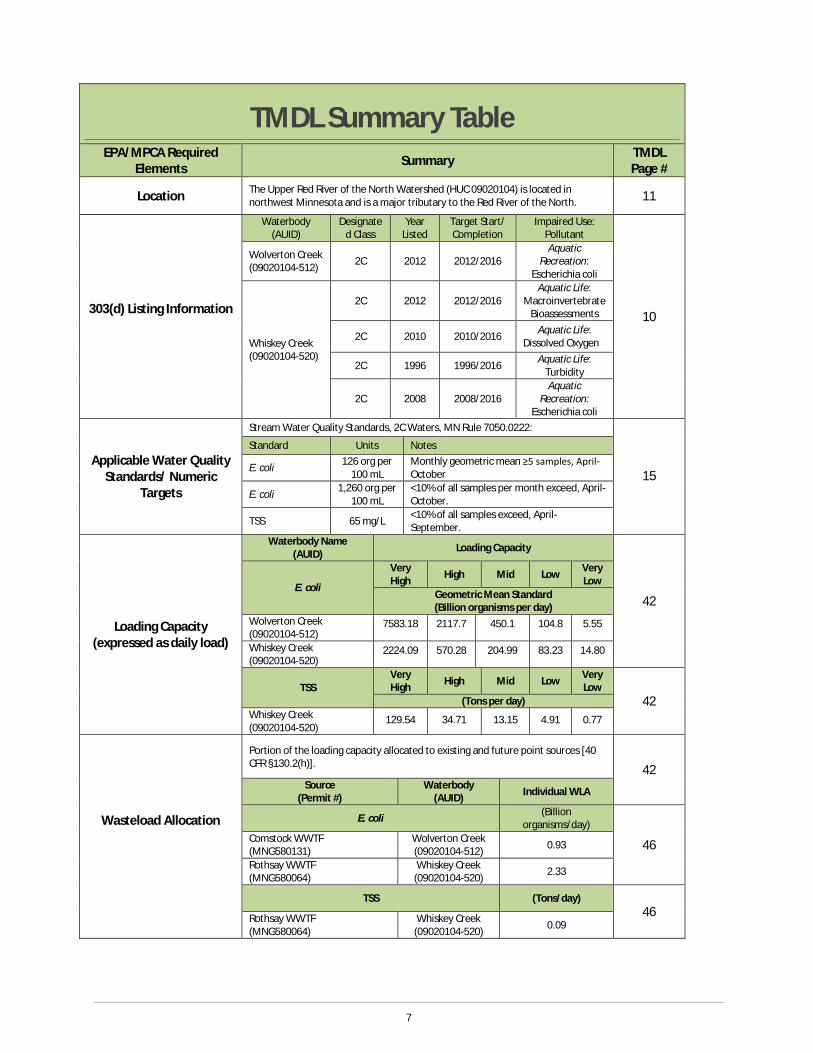
Location The Upper Red River of the North Watershed (HUC 09020104) is located in northwest Minnesota and is a major tributary to the Red River of the North. 11
303(d) Listing Information
Waterbody (AUID)
Designated Class
Year Listed
Target Start/ Completion
Impaired Use: Pollutant
10
Wolverton Creek (09020104-512) 2C 2012 2012/2016
Aquatic Recreation:
Escherichia coli
Whiskey Creek (09020104-520)
2C 2012 2012/2016 Aquatic Life:
Macroinvertebrate Bioassessments
2C 2010 2010/2016 Aquatic Life: Dissolved Oxygen
2C 1996 1996/2016 Aquatic Life: Turbidity
2C 2008 2008/2016 Aquatic
Recreation: Escherichia coli
Applicable Water Quality Standards/ Numeric
Targets
Stream Water Quality Standards, 2C Waters, MN Rule 7050.0222:
15
Standard Units Notes
E. coli 126 org per 100 mL
Monthly geometric mean ≥5 samples, April-October
E. coli 1,260 org per 100 mL
<10% of all samples per month exceed, April-October.
TSS 65 mg/L <10% of all samples exceed, April-September.
Loading Capacity (expressed as daily load)
Waterbody Name (AUID) Loading Capacity
42 E. coli
Very High High Mid Low Very
Low Geometric Mean Standard (Billion organisms per day)
Wolverton Creek (09020104-512)
7583.18 2117.7 450.1 104.8 5.55
Whiskey Creek (09020104-520)
2224.09 570.28 204.99 83.23 14.80
TSS Very High High Mid Low Very
Low 42 (Tons per day)
Whiskey Creek (09020104-520)
129.54 34.71 13.15 4.91 0.77
Wasteload Allocation
Portion of the loading capacity allocated to existing and future point sources [40 CFR §130.2(h)]. 42
Source (Permit #)
Waterbody (AUID) Individual WLA
E. coli (Billion organisms/day)
46 Comstock WWTF (MNG580131)
Wolverton Creek (09020104-512) 0.93
Rothsay WWTF (MNG580064)
Whiskey Creek (09020104-520) 2.33
TSS (Tons/day) 46 Rothsay WWTF
(MNG580064) Whiskey Creek
(09020104-520) 0.09
8
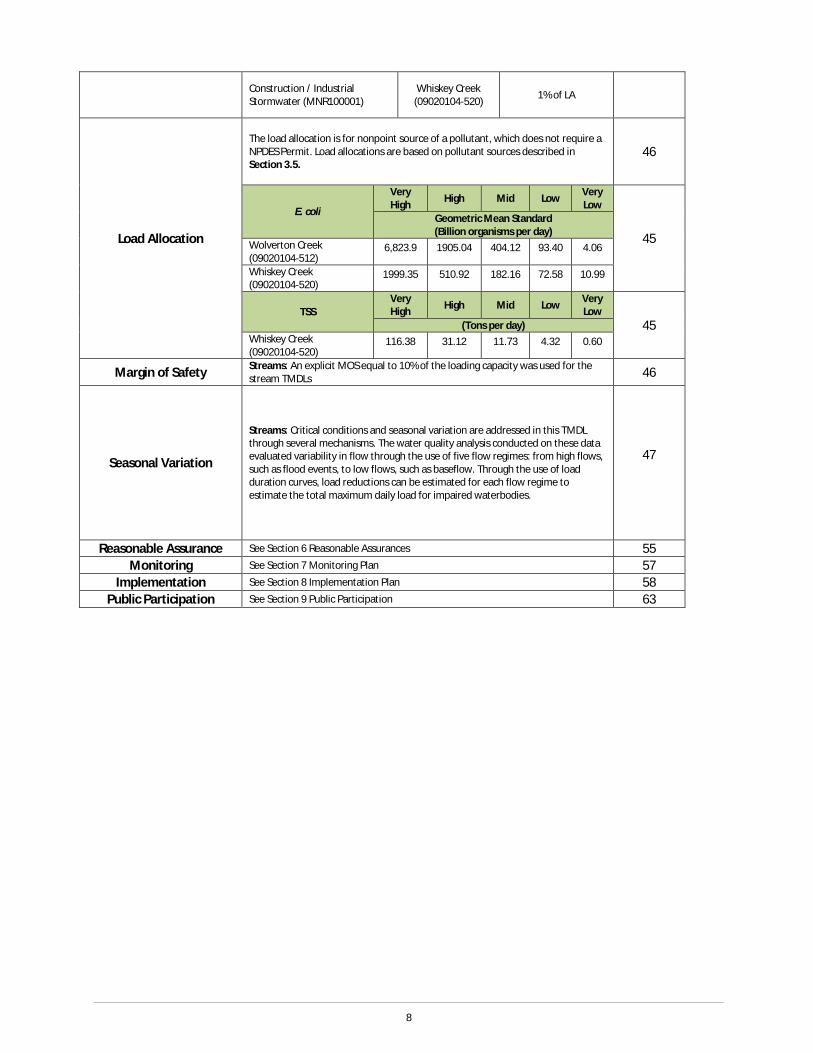
Construction / Industrial Stormwater (MNR100001)
Whiskey Creek (09020104-520) 1% of LA
Load Allocation
The load allocation is for nonpoint source of a pollutant, which does not require a NPDES Permit. Load allocations are based on pollutant sources described in Section 3.5.
46
E. coli
Very High High Mid Low Very
Low
45 Geometric Mean Standard (Billion organisms per day)
Wolverton Creek (09020104-512)
6,823.9 1905.04 404.12 93.40 4.06
Whiskey Creek (09020104-520)
1999.35 510.92 182.16 72.58 10.99
TSS Very High High Mid Low Very
Low 45 (Tons per day)
Whiskey Creek (09020104-520)
116.38 31.12 11.73 4.32 0.60
Margin of Safety Streams: An explicit MOS equal to 10% of the loading capacity was used for the stream TMDLs 46
Seasonal Variation
Streams: Critical conditions and seasonal variation are addressed in this TMDL through several mechanisms. The water quality analysis conducted on these data evaluated variability in flow through the use of five flow regimes: from high flows, such as flood events, to low flows, such as baseflow. Through the use of load duration curves, load reductions can be estimated for each flow regime to estimate the total maximum daily load for impaired waterbodies.
47
Reasonable Assurance See Section 6 Reasonable Assurances 55 Monitoring See Section 7 Monitoring Plan 57
Implementation See Section 8 Implementation Plan 58 Public Participation See Section 9 Public Participation 63

9
Acronyms AUID Assessment Unit ID
BMP best management practice
CAFO Concentrated Animal Feeding Operation
cfu colony-forming unit
DNR Minnesota Department of Natural Resources
EPA Environmental Protection Agency
EQuIS Environmental Quality Information System
GW Groundwater
HSPF Hydrologic Simulation Program-Fortran
in/yr inches per year
km2 square kilometer
LA Load Allocation
Lb pound
lb/day pounds per day
lb/yr pounds per year
m meter
mg/L milligrams per liter
mg/m2-day milligram per square meter per day
mL milliliter
MOS Margin of Safety
MPCA Minnesota Pollution Control Agency
MS4 Municipal Separate Storm Sewer Systems
NPDES National Pollutant Discharge Elimination System
RR Release rate
SSTS Subsurface Sewage Treatment Systems
TMDL Total Maximum Daily Load
UAL Unit-area Load
μg/L microgram per liter
WLA Wasteload Allocation
WRAPS Watershed Restoration and Protection Strategy
10
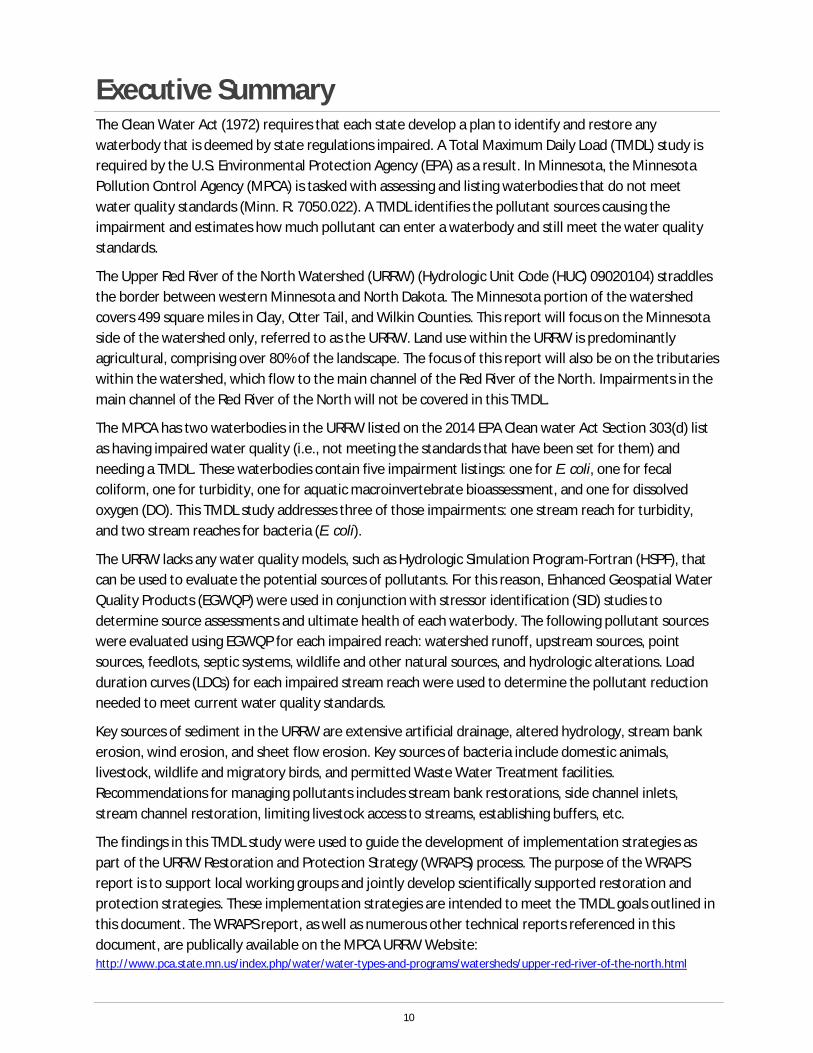
Executive Summary The Clean Water Act (1972) requires that each state develop a plan to identify and restore any waterbody that is deemed by state regulations impaired. A Total Maximum Daily Load (TMDL) study is required by the U.S. Environmental Protection Agency (EPA) as a result. In Minnesota, the Minnesota Pollution Control Agency (MPCA) is tasked with assessing and listing waterbodies that do not meet water quality standards (Minn. R. 7050.022). A TMDL identifies the pollutant sources causing the impairment and estimates how much pollutant can enter a waterbody and still meet the water quality standards.
The Upper Red River of the North Watershed (URRW) (Hydrologic Unit Code (HUC) 09020104) straddles the border between western Minnesota and North Dakota. The Minnesota portion of the watershed covers 499 square miles in Clay, Otter Tail, and Wilkin Counties. This report will focus on the Minnesota side of the watershed only, referred to as the URRW. Land use within the URRW is predominantly agricultural, comprising over 80% of the landscape. The focus of this report will also be on the tributaries within the watershed, which flow to the main channel of the Red River of the North. Impairments in the main channel of the Red River of the North will not be covered in this TMDL.
The MPCA has two waterbodies in the URRW listed on the 2014 EPA Clean water Act Section 303(d) list as having impaired water quality (i.e., not meeting the standards that have been set for them) and needing a TMDL. These waterbodies contain five impairment listings: one for E. coli, one for fecal coliform, one for turbidity, one for aquatic macroinvertebrate bioassessment, and one for dissolved oxygen (DO). This TMDL study addresses three of those impairments: one stream reach for turbidity, and two stream reaches for bacteria (E. coli).
The URRW lacks any water quality models, such as Hydrologic Simulation Program-Fortran (HSPF), that can be used to evaluate the potential sources of pollutants. For this reason, Enhanced Geospatial Water Quality Products (EGWQP) were used in conjunction with stressor identification (SID) studies to determine source assessments and ultimate health of each waterbody. The following pollutant sources were evaluated using EGWQP for each impaired reach: watershed runoff, upstream sources, point sources, feedlots, septic systems, wildlife and other natural sources, and hydrologic alterations. Load duration curves (LDCs) for each impaired stream reach were used to determine the pollutant reduction needed to meet current water quality standards.
Key sources of sediment in the URRW are extensive artificial drainage, altered hydrology, stream bank erosion, wind erosion, and sheet flow erosion. Key sources of bacteria include domestic animals, livestock, wildlife and migratory birds, and permitted Waste Water Treatment facilities. Recommendations for managing pollutants includes stream bank restorations, side channel inlets, stream channel restoration, limiting livestock access to streams, establishing buffers, etc.
The findings in this TMDL study were used to guide the development of implementation strategies as part of the URRW Restoration and Protection Strategy (WRAPS) process. The purpose of the WRAPS report is to support local working groups and jointly develop scientifically supported restoration and protection strategies. These implementation strategies are intended to meet the TMDL goals outlined in this document. The WRAPS report, as well as numerous other technical reports referenced in this document, are publically available on the MPCA URRW Website: http://www.pca.state.mn.us/index.php/water/water-types-and-programs/watersheds/upper-red-river-of-the-north.html
11
1. Project Overview
1.1 Purpose The URRW straddles the border between western Minnesota and North Dakota. The Minnesota portion of the watershed comprises approximately 499 square miles within Clay, Otter Tail, and Wilkin counties (HEI 2012). This TMDL will focus on the Minnesota side of the watershed only and cover only impairments in tributaries within the watershed that drain to the Red River of the North. No impairments in the Red River of the North main channel will be covered in this TMDL. The watershed is located in the Red River of the North Basin. The majority of the URRW is in the Lake Agassiz Plain (LAP) ecoregion, with only a small, southeastern portion in the North Central Hardwood Forest (NCHF) ecoregion. Land use is predominantly agricultural. Municipalities within the URRW include Georgetown, Dilworth, Moorhead, Sabin, Comstock, Wolverton, Rothsay, Kent, and Breckenridge (HEI 2012).
The MPCA has listed two waterbodies in the URRW (Wolverton Creek and Whiskey Creek) as having impaired water quality (i.e., not meeting the standards that have been set for them) and needing a TMDL. These waterbodies have five impairment listings: one for E. coli, one for fecal coliform, one for turbidity, one for aquatic macroinvertebrate bioassessment, and one for DO. In 2015, Minnesota transitioned from a turbidity standard, used to represent sediment transport, to a total suspended solids (TSS) standard. Although the standard has changed in the rules, the 2014 Clean Water Act Section 303(d) list of impaired waters still lists turbidity as the impairment. For the turbidity impairment, a TSS TMDL was developed. Further discussion is provided in Section 2.
A TMDL is defined as the maximum quantity of a pollutant that a water body can receive while meeting the (numeric) water quality standards for beneficial uses. The TMDL apportions the maximum pollutant load between point sources (i.e., a wasteload allocation (WLA) to sources, which are authorized by a permit under the Clean Water Act), nonpoint sources (i.e., load allocation (LA)) and a margin a safety. The margin of safety (MOS) is a portion of the maximum pollutant load reserved to account for uncertainty.
Since the primary stressor identified as causing the macroinvertebrate bioassessment impairment in the watershed (flow regime alteration) is not a conventional pollutant and therefore lacks a numeric standard, a TMDL for the biological impairment is not addressed by this TMDL. DO and excess suspended sediment are also listed as stressors for the macroinvertebrate bioassessment (MPCA 2015). The DO stressor and impairment is expected to be addressed in a future TMDL. The turbidity/sediment stressors are addressed through the TSS TMDLs.
In 2006, Minnesota passed the Clean Water Legacy Act (CWLA) to protect, restore, and preserve the quality of Minnesota’s surface waters. As a result, the MPCA established a watershed approach to restore and protect Minnesota’s waters. One component of that work is to complete TMDLs for the impaired waterbodies within each watershed and develop a watershed-wide TMDL report. This report is intended to address the TMDL requirement for this watershed.

12
1.2 Identification of Waterbodies This TMDL addresses three impairments in the URRW (Table 1-1, Figure 1-1), including one stream reach listed for turbidity and two stream reaches listed for bacteria (E. coli). The biological impairment based on macroinvertebrate bioassessment in the watershed is not explicitly addressed in this report since its primary identified stressor; altered hydrology (MPCA 2014), is not a conventional pollutant for which a TMDL can be written, as it is lacking of a numeric standard. Turbidity/sediment and low DO were also identified as stressors for the macroinvertebrate bioassessment impairment. The turbidity/sediment aspects of the biological impairments are addressed through the TSS TMDL for this reach, while the DO stressor and impairment is expected to be addressed in a future TMDL.
Table 1-1: URRW impairments addressed in this report.
Assessment Unit ID Waterbody Impairment / parameter Beneficial Use Year
Listed
Addressed in this TMDL?
09020104-512 Wolverton Creek: Unnamed cr to Red R Escherichia coli Aquatic
Recreation 2012 Yes
09020104-520 Whiskey Creek: T133 R47W S13, east line to Red R
Macroinvertebrate Bioassessments Aquatic Life 2012 No
Dissolved Oxygen Aquatic Life 2010 No
Turbidity Aquatic Life 1996 Yes
Fecal Coliform (Escherichia coli)
Aquatic Recreation 2008 Yes

13
Figure 1-1: Impairments in the URRW.
14
1.3 Priority Ranking The MPCA’s schedule for TMDL completions, as indicated on the 303(d) impaired waters list, reflects Minnesota’s priority ranking of this TMDL. The MPCA has aligned our TMDL priorities with the watershed approach and our WRAPS cycle. The schedule for TMDL completion corresponds to the WRAPS report completion on the 10-year cycle. The MPCA developed a state plan, Minnesota’s TMDL Priority Framework Report, to meet the needs of EPA’s national measure (WQ-27) under EPA’s Long-Term Vision for Assessment, Restoration and Protection under the Clean Water Act Section 303(d) Program. As part of these efforts, the MPCA identified water quality impaired segments that will be addressed by TMDLs by 2022. The URRW waters addressed by this TMDL are part of that MPCA prioritization plan to meet the EPA’s national measure.
The MPCA is required to list and prioritize TMDL development for impaired stream reaches and lakes. Schedules are estimated and indicate when a TMDL may be completed, not when a waterbody will meet its water quality standard.
15
2. Applicable Water Quality Standards and Numeric Water Quality Targets
Water quality standards are the fundamental benchmarks by which the quality of surface waters are measured and used to determine impairment. Use attainment status describes whether a waterbody is supporting its designated beneficial use, as evaluated by the comparison of monitoring data to criteria specified in the Minnesota Water Quality Standards (Minn. R. ch. 7050, 20081). These standards can be numeric or narrative in nature, and define the concentrations or conditions of surface waters that allow them to meet their designated beneficial uses, such as for fishing (aquatic life), swimming (aquatic recreation) or human consumption (aquatic consumption). All impaired waters addressed in this TMDL are classified as Class 2C waters (MPCA 2015).
Class 2C waters - The quality of Class 2C surface waters shall be such as to permit the propagation and maintenance of a healthy community of indigenous fish and associated aquatic life, and their habitats. These waters shall be suitable for boating and other forms of aquatic recreation for which the waters may be usable (Minn. R. 7050.0222, subp. 5).
2.1 Lakes Due to the limited natural ability for water retention and drainage, there are no assessable lakes within the URRW. Only one lake within the URRW is classified as protected by the Minnesota Department of Natural Resources (DNR). Nelson Lake (56-1015-00) lies in the eastern tip of the Whiskey Creek Subwatershed. Neither assessment level data nor Citizen Lake Monitoring Program (CLMP) trend data is available for this lake and no lake water chemistry sampling was conducted. There will be no further discussion regarding lakes in this TMDL.
2.2 Streams The Minnesota narrative water quality standard for all Class 2 waters (Minn. R. 7050.0150, subp. 3) states that:
The aquatic habitat, which includes the waters of the state and stream bed, shall not be degraded in any material manner, there shall be no material increase in undesirable slime growths or aquatic plants, including algae, nor shall there be any significant increase in harmful pesticide or other residues in the waters, sediments, and aquatic flora and fauna; the normal fishery and lower aquatic biota upon which it is dependent and the use thereof shall not be seriously impaired or endangered, the species composition shall not be altered materially, and the propagation or migration of the fish and other biota normally present shall not be prevented or hindered by the discharge of any sewage, industrial waste, or other wastes to the waters.
Applicable water quality standards for the URRW stream impairments in this report are shown in Table 2-1, while Table 1-1 shows the specific water bodies affected.
1 https://www.revisor.leg.state.mn.us/rules/?id=7050

16
Table 2-1: Surface water quality standards for URRW stream reaches addressed in this report.
Parameter Water Quality Standard Units Criteria Period of Time
Standard Applies
Escherichia coli (E. coli)
Not to exceed 126 org/100 mL Monthly geometric mean April 1-October 31
Not to exceed 1,260 org/100 mL Upper 10th percentile
Total suspended solids (TSS)-Southern Nutrient Region
Not to exceed 65 mg/L Upper 10th percentile April 1 – September 30
Bacteria
Minnesota recently changed from a fecal coliform standard to an E. coli standard for bacteria impairments. The bacteria standard change is supported by an EPA guidance document on bacteriological criteria (EPA 1986). As of 2013, Minn. R. ch. 7050.0222 water quality standards for E. coli states:
Escherichia (E.) coli - Not to exceed 126 organisms per 100 milliliters as a geometric mean of not less than five samples representative of conditions within any calendar month, nor shall more than ten percent of all samples taken during any calendar month individually exceed 1,260 organisms per 100 milliliters. The standard applies only between April 1 and October 31.
Although surface water quality standards are now based on E. coli, wastewater treatment facilities (WWTFs) are permitted based on fecal coliform (not E. coli) concentrations. In addition, Whiskey Creek (Assessment Unit ID – AUID – 09020104-520) is still listed as having a fecal coliform impairment, which will be treated as an E. coli impairment for the remainder of this TMDL document. A conversion factor of 126 E. coli organisms per 100 mL for every 200 fecal coliform per 100 mL is used and discussed in Section 4.1.
The E. coli standard is based on the geometric mean of water quality observations. Geometric mean is used in place of arithmetic mean in order to describe the central tendency of the data, dampening the effect that very high or very low values have on arithmetic means. The MPCA’s Guidance Manual for Assessing the Quality of Minnesota Surface Waters for Determination of Impairment: 305(b) Report and 303(d) List provides details regarding how waters are assessed for conformance to the E. coli standard (MPCA 2012).
Sediment
In January 2015, the EPA issued an approval of the adopted amendments to the State Water Quality Standards, replacing the historically used turbidity standard with TSS standards. The TSS TMDLs now replace the turbidity TMDLs. Therefore, this TMDL will address the turbidity impairment in the URRW as a TSS impairment.
TSS is a direct measurement of the TSS in a water quality sample. The recently approved Minnesota state TSS standards are based upon nutrient regions, which are loosely based on ecoregions. The URRW is located in the Southern Nutrient Region; therefore, the applicable TSS standard is 65 mg/L (MPCA 2015).
17
3. Watershed and Waterbody Characterization The URRW (HUC 09020104) straddles the border of western Minnesota and North Dakota. The Minnesota portion of the watershed comprises over 499 square miles and includes portions of Clay, Otter Tail, and Wilkin Counties (HEI 2012). In the Minnesota portion of the URRW, two main tributaries (Wolverton and Whiskey Creek) flow north and west to enter the Red River of the North, which proceeds north to the U.S. – Canada border, and ultimately Lake Winnipeg and Hudson Bay. The URRW includes a segment of the Red River mainstem; however, this TMDL will only cover the tributary streams. The mainstem Red River will be covered in a separate, basin-wide TMDL.
Approximately 84% of the land in the URRW is currently under agricultural production, while approximately 8% of the land use is comprised of residential and commercial development (see Figure 3-5). Municipalities within the URRW include Georgetown, Dilworth, Moorhead, Sabin, Comstock, Wolverton, Rothsay, Kent, and Breckenridge (HEI 2012).
The URRW includes portions of two Level III ecoregions as defined by the EPA: the LAP and the NCHFs (see Figure 3-1). The vast majority of the watershed is located in the LAP (95%), with only a very small portion of the southeastern watershed is in the NCHF ecoregion (HEI 2012). The EPA defines an ecoregion as a relatively homogeneous ecological area defined by similarity of climate, landform, soil, potential natural vegetation, hydrology, or other ecologically relevant variables. Much of the LAP has been drained for agricultural use. Since natural processes often vary by ecoregion, some water quality standards have taken these regions into account. Descriptions of the ecoregions in the URRW are given as follows (EPA 2013):
“The LAP was formed by Glacial Lake Agassiz, the last in a series of proglacial lakes to fill the Red River Valley in the three million years since the beginning of the Pleistocene. Thick beds of lake sediments on top of glacial till create the extremely flat floor of the LAP. The historic tall grass prairie has been replaced by intensive row crop agriculture. The preferred crops in the northern half of the region are potatoes, beans, sugar beets, and wheat; soybeans, sugar beets, and corn predominate in the south.”
“The NCHF ecoregion is transitional between the predominantly forested Northern Lakes and Forests (NLF) to the north and the agricultural ecoregions to the south. Land use/land cover in this ecoregion consists of a mosaic of forests, wetlands and lakes, cropland agriculture, pasture, and dairy operations. The growing season is generally longer and warmer than that of NLF and the soils are more arable and fertile, contributing to the greater agricultural component of land use. Lake trophic states tend to be higher in the NCHF than in the NLF, with higher percentages in eutrophic and hypereutrophic classes.”
More information about the physical characteristics of the URRW can be found in the URRW Biotic SID (MPCA 2015) Report, the URRW Monitoring and Assessment Report (MPCA 2013), and/or the URRW Watershed Conditions Report (HEI 2012).

18
Figure 3-1: EPA Level 3 Eco-regions of the URRW.

19
3.1 Streams The direct drainage areas, total contributing drainage areas, any noncontributing areas, and any upstream waterbodies for impaired AUID stream reaches in the URRW are listed in Table 3-1. The direct drainage areas include only the areas draining to the impaired AUID, or the total drainage areas minus the noncontributing area. Direct drainages and total contributing drainage areas were delineated using hydrologically-conditioned 3-meter digital elevation models (DEM) derived from the state’s airborne Light Detection and Ranging (LiDAR) technology. The noncontributing areas are based on a 10-year, 24-hour precipitation event.
Table 3-1: Impaired stream reach direct and total drainage areas.
AUID
(0
9020
104-
XXX)
Name HU
C 12
Su
bwat
ersh
ed
Dire
ct D
rain
age
Area
(acr
es)
Tota
l Dra
inag
e Ar
ea
(acr
es)
Non
cont
ribut
ing
Area
(acr
es)1
Ups
trea
m
Wat
erbo
dy
512 Wolverton Creek: Unnamed cr to Red R
Wolverton Creek 65,140 65,634 494 Wolverton Creek
(AUID 09020104-519)
520 Whiskey Creek: T133 R47W S13, east line to Red R
Whiskey Creek 101,688 103,195 1,507 Whiskey Creek
(AUID 09020104-521)
3.2 Subwatersheds For purposes of this TMDL, the watershed is divided into four 12-digit HUC watersheds (see Figure 3-1), used to organize components of this TMDL throughout the document. Those watersheds are the Direct Drainage to the Red River Subwatershed, the Protection Subwatershed, the Wolverton Creek Subwatershed, and the Whiskey Creek Subwatershed. This report will only include discussions on the two subwatersheds with impairments: the Wolverton Creek Subwatershed, and the Whiskey Creek Subwatershed.

20
Figure 3-2: URRW HUC-12 Subwatersheds
21
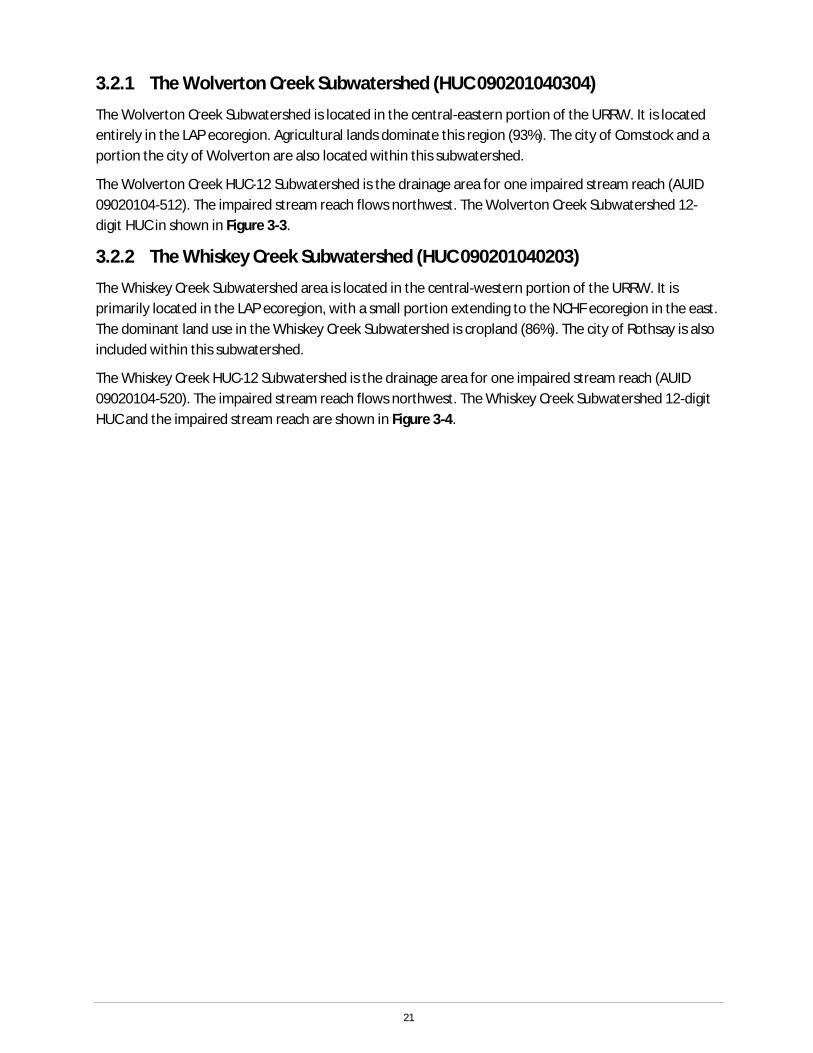
3.2.1 The Wolverton Creek Subwatershed (HUC 090201040304)
The Wolverton Creek Subwatershed is located in the central-eastern portion of the URRW. It is located entirely in the LAP ecoregion. Agricultural lands dominate this region (93%). The city of Comstock and a portion the city of Wolverton are also located within this subwatershed.
The Wolverton Creek HUC-12 Subwatershed is the drainage area for one impaired stream reach (AUID 09020104-512). The impaired stream reach flows northwest. The Wolverton Creek Subwatershed 12-digit HUC in shown in Figure 3-3.
3.2.2 The Whiskey Creek Subwatershed (HUC 090201040203)
The Whiskey Creek Subwatershed area is located in the central-western portion of the URRW. It is primarily located in the LAP ecoregion, with a small portion extending to the NCHF ecoregion in the east. The dominant land use in the Whiskey Creek Subwatershed is cropland (86%). The city of Rothsay is also included within this subwatershed.
The Whiskey Creek HUC-12 Subwatershed is the drainage area for one impaired stream reach (AUID 09020104-520). The impaired stream reach flows northwest. The Whiskey Creek Subwatershed 12-digit HUC and the impaired stream reach are shown in Figure 3-4.
22
Figure 3-3: Wolverton Creek Subwatershed

23
Figure 3-4: Whiskey Creek Subwatershed
24
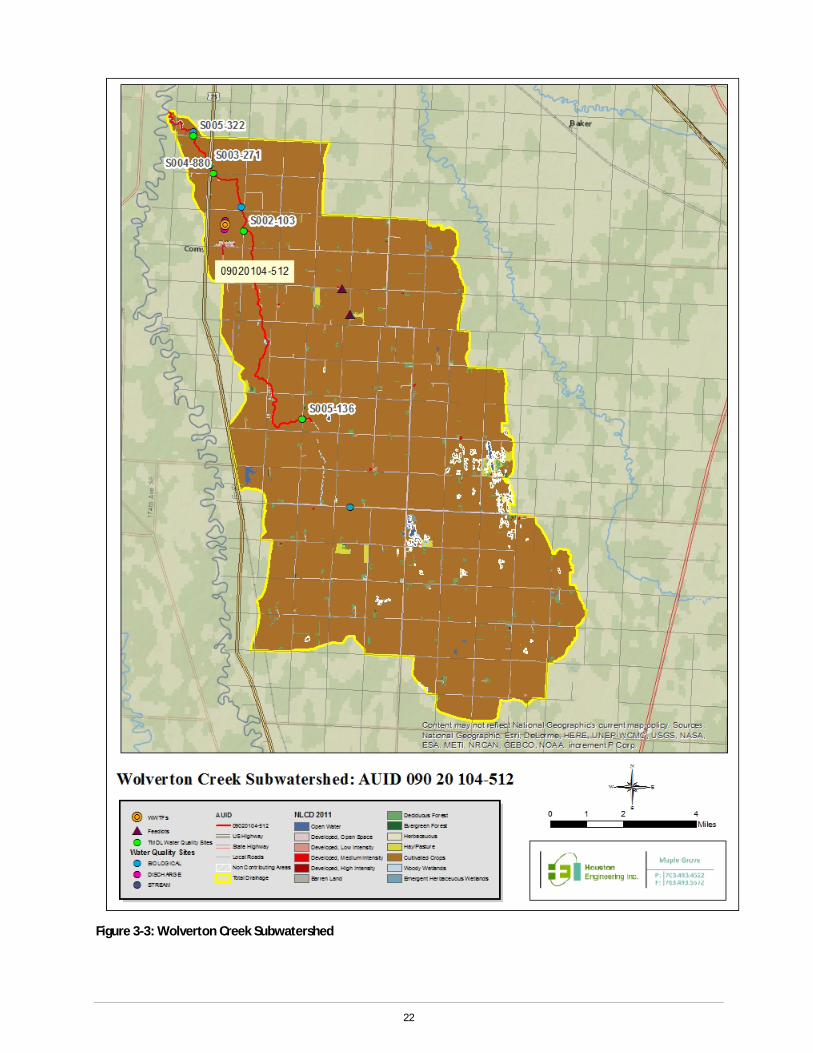
3.3 Land Use Land use within the URRW can be described using the Multi-Resolution Land Characteristic Consortium 2011 National Land Cover Dataset2 (NLCD) (Figure 3-5). Land use in the URRW is primarily cropland, comprising 84% of the entire watershed area. Table 3-2 contains a summary of land use in the URRW, organized by HUC-12 subwatershed.
Table 3-2: Land use percentages in the URRW by drainage area. Land use statistics are based on 2011 NLCD.
Watershed/ Immediate Drainage
Area
Open Water Urban Barren
Forest/ Shrub
Pasture/ Hay/
Grassland Cropland Wetland
Entire Watershed 1.1% 8.7% 0.3% 0.6% 2.0% 84.0% 3.2%
Wolverton Creek (AUID 09020104-512)
090201040304 0.3% 4.5% 0.0% 1.2% 0.6% 92.9% 0.4% Whiskey Creek (AUID 09020104-520)
090201040203 0.3% 5.2% 0.9% 0.1% 3.4% 85.9% 4.3%
2http://www.mrlc.gov/nlcd2011.php

25
Figure 3-5: Land uses in the URRW (2011 NLCD dataset).
26
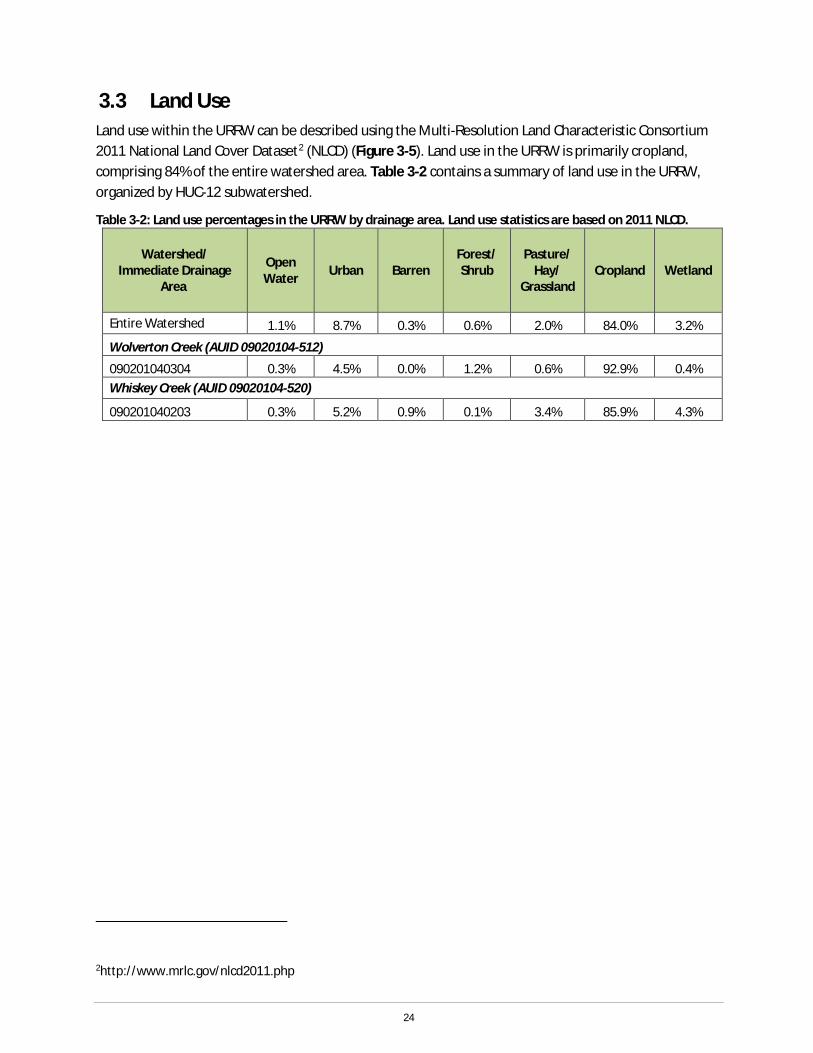
3.4 Current/Historic Water Quality The existing water quality conditions were analyzed using data downloaded from the MPCA’s Environmental Quality Information System (EQuIS) database. EQuIS stores water quality data from more than 17,000 sampling locations across the state, containing information from Minnesota streams and lakes dating back to 1926. EQuIS stores data collected by the MPCA, partner agencies, grantees, and citizen volunteers. All water quality sampling data utilized for assessments, modeling, and data analysis for this report and reference reports, are stored in this database and are accessible through the MPCA’s EDA (Environmental Data Access) Website.
According to EQuIS and the MPCA spatial datasets, there are 17 biological monitoring sites, 2 lake water quality monitoring sites, 33 stream water quality monitoring sites, and 15 streamflow discharge sites located in the URRW (Figure 3-6). Not all sites were used in the development of the URRW’s TMDLs. Sites were excluded for various reasons including: 1) their period of record being outside of the assessment period (2002 through 2012); 2) the sites were not located in impaired stream reaches or lakes; or 3) a site did not have relevant observed data. Ultimately, five stream water quality monitoring sites were used to develop the TMDL for Wolverton Creek (AUID 09020101-512), and six stream water quality monitoring sites were used to develop the TMDLs for Whiskey Creek (AUID 09020101-520). As neither of the two creeks have a continuous flow record, observed flow data at nearby continuous flow stations and the drainage area ratio method were also used in the development of the URRW’s TMDLs. The USGS 05061500 South Branch Buffalo River at Sabin, Minnesota station was used to estimate flows in Wolverton Creek, and the USGS 05053000 Wild Rice River near Abercrombie, North Dakota station was used to estimate flows in Whiskey Creek (Section 4).
The MPCA conducts intensive watershed monitoring for two years in all 80 watersheds in Minnesota on a 10-year cycle, i.e. every major watershed is sampled for two years, once every 10-years. The URRW intensive watershed monitoring occurred in 2008 and 2009. To supplement between intensive monitoring years, the MPCA coordinates two programs aimed at encouraging citizen surface water monitoring; i.e., the CLMP and the Citizen Stream Monitoring Program (CSMP). Sustained citizen monitoring can provide the long-term picture needed to help evaluate current water quality status and trends. The advance identification of lake and stream sites that will be sampled by agency staff provides an opportunity to actively recruit volunteers to monitor those sites, so that water quality data collected by volunteers are available for the years before and after the intensive monitoring effort by the MPCA staff (MPCA 2012a; page 14).
Data from the current 10-year assessment period (2002 through 2012) that was consistent with the months where the water quality standard applies were used for development of this TMDL. For TSS, data only collected during the months of April through September were used. For E. coli, data only collected during the months April through October were used.
27
Figure 3-6: Water quality monitoring sites used to develop TMDL

28
3.4.1 Escherichia coli A stream reach is listed as impaired for recreational use due to elevated E. coli if the geometric mean of the aggregated monthly E. coli concentrations for one or more months (with five or more samples) exceeds 126 organisms per 100 mL, or if more than 10% of the individual samples within a month (with five or more samples) exceeds 1,260 organisms per 100 mL.
Table 3-3 shows the number of samples for each month, the monthly geometric means, and the number of samples in each month exceeding 1,260 organisms per 100 mL for April to October for the two impaired stream reaches in the URRW. The months where either standard were exceeded and has at least five samples are highlighted in orange. Many more months showed standard exceedances but did not meet the five samples threshold to quality for a standard exceedance. In general, E. coli concentrations were highest in June, July, and August.
29
Table 3-3: Summary of E. coli in the URRW for the Assessment Period 2002-2012 (Geo = geometric mean (no. per 100 mL); n=sample size).
AUID Site ID Sampling Years
April May June July August September October
n Geo
% n
>126
0 or
g/10
0 m
L
n Geo
% n
>126
0 or
g/ 1
00m
L
n Geo
% n
>126
0 or
g/10
0 m
L
n Geo
% n
>126
0 or
g/10
0 m
L
n Geo
% n
>126
0 or
g/10
0 m
L
n Geo
% n
>126
0 or
g/10
0 m
L
n Geo
% n
>126
0 or
g/10
0 m
L
09020104-512
S002-103 NA 0 0 0 0 0 0 0
S003-271 NA 0 0 0 0 0 0 0
S004-880 2008 0 0 2 232.5 0% 1 235.9 0% 0 0 0
S005-136
2008-2010 0 0 5 64.1 0% 5 281.1 0% 5 305.9 20% 4 287.0 0% 0
S005-322
2008-2012 2 12.1 0% 2 328.2 0% 5 238.2 0% 6 173.0 0% 7 214.9 0% 4 307.5 0% 1 135.4 0%
09020104-520
S001-032
2002-2003 2 71.3 0% 2 66.3 0% 4 225.5 0% 3 1056.0 67% 4 84.9 0% 4 248.9 0% 1 140.0 0%
S001-060 NA 0 0 0 0 0 0 0
S001-061
2002-2003 2 2 0% 2 32.9 0% 4 42.3 0% 3 957.5 67% 0 1 110.0 0% 1 20.0 0%
S002-004 2002 1 1 0% 1 1 0% 0 0 0 0 0
S003-678 NA 0 0 0 0 0 0 0
S004-881
2008-2009 0 0 5 178.8 0% 5 200.2 0% 5 190.9 0% 2 250.3 0% 0

30
3.4.2 Total Suspended Solids (TSS) In January of 2015, the EPA issued an approval of the adopted amendments to the State Water Quality Standards, replacing the historically-used turbidity standard with TSS standards. The TSS TMDLs now replace the turbidity TMDLs.
The recently approved Minnesota state TSS standards are based upon nutrient regions, which are based on ecoregions. The URRW is located in the Southern Nutrient Region; therefore, the applicable TSS standard is 65 mg/L (MPCA 2015).
Table 3-4: Summary of Sites with Total Suspended Solids Observations (n=sample size)
AUID Site ID
Total Suspended Solids
Sampling Years n Average
[mg/L] 90th
Percentile # of Exceed.
09020104-520
S001-032 2002-2003 15 47.0 73.2 3
S001-060 2005-2006 16 59.6 116.0 5
S001-061 2002-2006 27 24.0 61.0 2 S002-004 2002 2 3.0 3.8 0 S003-678 NA 0 NA NA NA S004-881 2008 9 42.4 74.2 2
3.5 Pollutant Source Summary A key component for developing TMDLs is understanding the sources contributing to the impairment(s). The majority of streams in the URRW have been highly altered to promote farmland drainage, including channelization, ditching, and groundwater withdrawal. The highly altered landscape and stream channel characteristics have resulted in impaired conditions as measured with a broad suite of aquatic community, water chemistry, and stream habitat indicators. Several stressors in the URRW play a role in influencing water quality in the system and limiting the health of these aquatic communities.
This section provides a brief description by pollutant of the sources in the watershed potentially contributing to the listed impairments. A more in-depth discussion of the biological stressors, pollutant sources, and causal pathways, excluding E. coli, can be found in the Upper Red River of the North Watershed Biotic SID Report (MPCA 2014b). More discussion on the current conditions in the watershed can be found in the Upper Red River of the North Watershed Monitoring and Assessment Report (MPCA 2014a).
3.5.1 Escherichia coli
The relationship between bacterial sources and bacterial concentrations found in streams is complex, driven in part by the amount of precipitation and runoff, surface water temperature, the type of livestock management practices, wildlife population abundance and spatial distribution, bacterial survival rates, land use practices, and other environmental factors. These relationships were evaluated for common sources of bacteria. To evaluate the potential sources of bacteria delivered to the impaired waterbodies in the URRW, a bacteria source investigation was conducted based on population production estimates and delivery mechanics. The bacteria source investigation included the following steps:
31
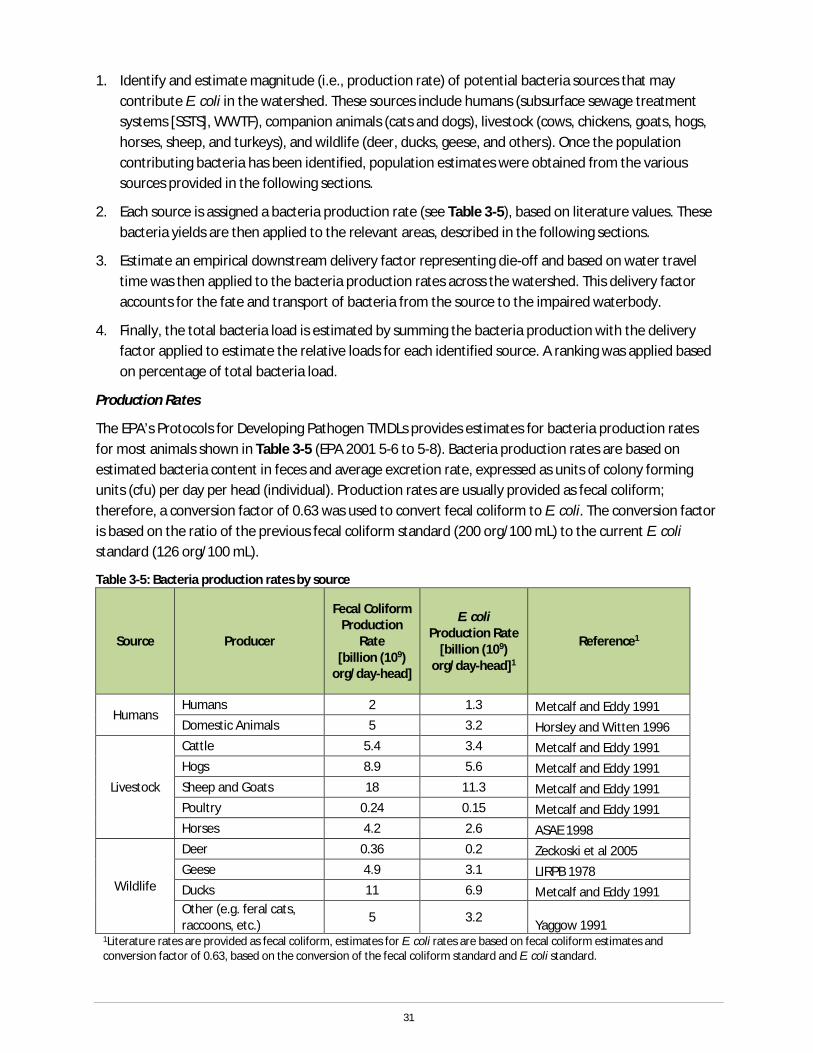
1. Identify and estimate magnitude (i.e., production rate) of potential bacteria sources that may contribute E. coli in the watershed. These sources include humans (subsurface sewage treatment systems [SSTS], WWTF), companion animals (cats and dogs), livestock (cows, chickens, goats, hogs, horses, sheep, and turkeys), and wildlife (deer, ducks, geese, and others). Once the population contributing bacteria has been identified, population estimates were obtained from the various sources provided in the following sections.
2. Each source is assigned a bacteria production rate (see Table 3-5), based on literature values. These bacteria yields are then applied to the relevant areas, described in the following sections.
3. Estimate an empirical downstream delivery factor representing die-off and based on water travel time was then applied to the bacteria production rates across the watershed. This delivery factor accounts for the fate and transport of bacteria from the source to the impaired waterbody.
4. Finally, the total bacteria load is estimated by summing the bacteria production with the delivery factor applied to estimate the relative loads for each identified source. A ranking was applied based on percentage of total bacteria load.
Production Rates
The EPA’s Protocols for Developing Pathogen TMDLs provides estimates for bacteria production rates for most animals shown in Table 3-5 (EPA 2001 5-6 to 5-8). Bacteria production rates are based on estimated bacteria content in feces and average excretion rate, expressed as units of colony forming units (cfu) per day per head (individual). Production rates are usually provided as fecal coliform; therefore, a conversion factor of 0.63 was used to convert fecal coliform to E. coli. The conversion factor is based on the ratio of the previous fecal coliform standard (200 org/100 mL) to the current E. coli standard (126 org/100 mL).
Table 3-5: Bacteria production rates by source
Source Producer
Fecal Coliform Production
Rate [billion (109)
org/day-head]
E. coli Production Rate
[billion (109) org/day-head]1
Reference1
Humans Humans 2 1.3 Metcalf and Eddy 1991 Domestic Animals 5 3.2 Horsley and Witten 1996
Livestock
Cattle 5.4 3.4 Metcalf and Eddy 1991 Hogs 8.9 5.6 Metcalf and Eddy 1991 Sheep and Goats 18 11.3 Metcalf and Eddy 1991 Poultry 0.24 0.15 Metcalf and Eddy 1991 Horses 4.2 2.6 ASAE 1998
Wildlife
Deer 0.36 0.2 Zeckoski et al 2005 Geese 4.9 3.1 LIRPB 1978 Ducks 11 6.9 Metcalf and Eddy 1991 Other (e.g. feral cats, raccoons, etc.) 5 3.2 Yaggow 1991
1Literature rates are provided as fecal coliform, estimates for E. coli rates are based on fecal coliform estimates and conversion factor of 0.63, based on the conversion of the fecal coliform standard and E. coli standard.

32
3.5.1.1 Permitted
Wastewater Treatment Facilities
Permitted WWTFs in the State of Minnesota are required to monitor their effluent to ensure that concentrations of specific pollutants remain within levels specified in their National Pollutant Discharge Elimination System (NPDES) discharge Permit (Permit). In Minnesota, WWTFs are permitted based on fecal coliform, not E. coli. Effluent limits require that fecal coliform concentrations remain below 200 organisms/100 mL (MPCA 2002). Based on the previous fecal standard and the current E. coli standard, a ratio of 200:126 (0.63) is used to convert fecal coliform to E. coli. Therefore, the effluent limit for E. coli concentrations remains below 126 organisms/100 mL.
The URRW contains two “minor” (as defined by the MPCA) WWTFs that contribute to an impaired reach. These facilities are pond-type treatment plants with primary and secondary treatment ponds. The general operation of these facilities is to discharge their treated wastewater into the surface water system in the spring/early summer and again in the late fall of each year (HEI 2013). The most typical windows for releases are in April through June and then again in September through November. Table 3-6 identifies the two permitted WWTFs in the URRW that contribute to an impaired reach, and their permitted daily discharge flow and permitted daily bacteria load.
Table 3-6: WWTFs, permitted flows and bacteria loads for minor facilities in the URRW.
Facility Permit
Number
12-Digit HUC (09020104-
XXXX)
Discharge to
City / Township
System Type
Permitted Daily Flow
[mgd]
Equivalent Bacteria Load as E. coli: 126
org/100mL [billion
org/day]
Comstock MNG580131 0304 Wolverton
Creek Comstock WWTF 0.021 1.48
Rothsay MNG580064 0203 Whiskey
Creek Rothsay WWTF 0.056 3.70
NPDES Permitted Concentrated Animal Feeding Operation
The MPCA regulates the collection, transportation, storage, processing and disposal of animal manure and other livestock operation wastes (MPCA 2011). The MPCA currently uses the federal definition of a Concentrated Animal Feeding Operation (CAFO) in its regulation of animal facilities. In Minnesota, the following types of livestock facilities are issued, and must operate under, a NPDES Permit: a) all federally defined (CAFOs); and b) all CAFOs and non-CAFOs, which have 1,000 or more animal units (MPCA 2010). There are no CAFOs requiring NPDES Permits in the URRW, and therefore there are no CAFOs contributing to the listed impairments.
3.5.1.2 Non-permitted Sources
Humans
Subsurface Sewage Treatment Systems
Malfunctioning SSTSs can be an important source of fecal contamination to surface waters, especially during dry periods when these sources continue to discharge and surface water runoff is minimal. These
33
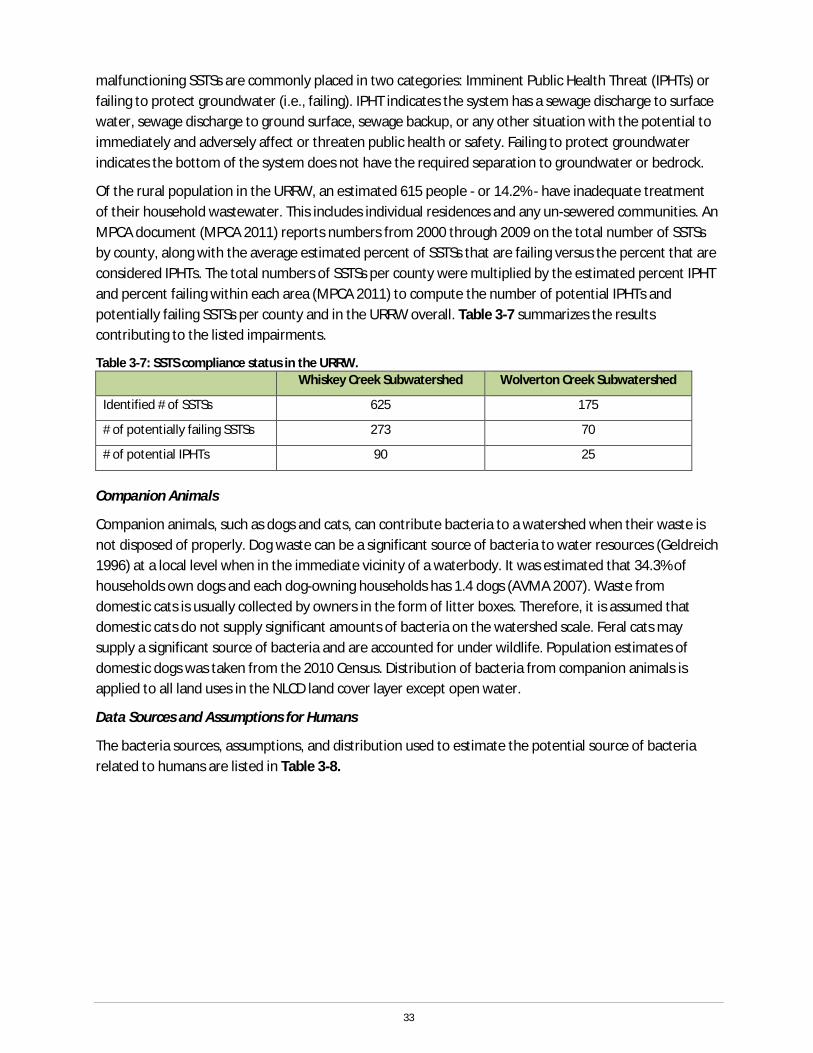
malfunctioning SSTSs are commonly placed in two categories: Imminent Public Health Threat (IPHTs) or failing to protect groundwater (i.e., failing). IPHT indicates the system has a sewage discharge to surface water, sewage discharge to ground surface, sewage backup, or any other situation with the potential to immediately and adversely affect or threaten public health or safety. Failing to protect groundwater indicates the bottom of the system does not have the required separation to groundwater or bedrock.
Of the rural population in the URRW, an estimated 615 people - or 14.2% - have inadequate treatment of their household wastewater. This includes individual residences and any un-sewered communities. An MPCA document (MPCA 2011) reports numbers from 2000 through 2009 on the total number of SSTSs by county, along with the average estimated percent of SSTSs that are failing versus the percent that are considered IPHTs. The total numbers of SSTSs per county were multiplied by the estimated percent IPHT and percent failing within each area (MPCA 2011) to compute the number of potential IPHTs and potentially failing SSTSs per county and in the URRW overall. Table 3-7 summarizes the results contributing to the listed impairments.
Table 3-7: SSTS compliance status in the URRW. Whiskey Creek Subwatershed Wolverton Creek Subwatershed
Identified # of SSTSs 625 175
# of potentially failing SSTSs 273 70
# of potential IPHTs 90 25
Companion Animals
Companion animals, such as dogs and cats, can contribute bacteria to a watershed when their waste is not disposed of properly. Dog waste can be a significant source of bacteria to water resources (Geldreich 1996) at a local level when in the immediate vicinity of a waterbody. It was estimated that 34.3% of households own dogs and each dog-owning households has 1.4 dogs (AVMA 2007). Waste from domestic cats is usually collected by owners in the form of litter boxes. Therefore, it is assumed that domestic cats do not supply significant amounts of bacteria on the watershed scale. Feral cats may supply a significant source of bacteria and are accounted for under wildlife. Population estimates of domestic dogs was taken from the 2010 Census. Distribution of bacteria from companion animals is applied to all land uses in the NLCD land cover layer except open water.
Data Sources and Assumptions for Humans
The bacteria sources, assumptions, and distribution used to estimate the potential source of bacteria related to humans are listed in Table 3-8.

34
Table 3-8: Data sources, assumptions, and distribution of bacteria attributed to humans. Bacteria Source Distribution
Unsewered Communities-Failing and IPHT SSTS
Population in unsewered communities based on 2010 Census Block information. Number of failing and IPHT SSTS from County estimates (MPCA, 2011).
The population of unsewered communities were estimated, based on 2010 Census Block data. Production rates of 1.3 x 10⁹ cfu/day/person was used. Total bacteria was applied to Developed land use classes in the NLCD 2011 dataset.
Companion Animals (Dogs only)
34.3% of households own dogs, 1.4 dogs in households with dogs. Populations of dogs was based on the 2010 Census Block data.
An estimated 38% of dog owners do not dispose of waste properly (TBEP 2011). Population distributions are based on 2010 Census Blocks. Production rate of 3.2 x 10⁹ cfu/day/dog was used. Total bacteria was distributed among all land use classes in the NLCD 2011 dataset except open water.
Livestock
Livestock Populations
The Census of Agriculture is a complete count of U.S. farms and ranches. The census of agriculture defines a farm as any place from which $1,000 or more of agricultural products were produced and sold, or normally would have been sold, during the census year (USDA 2009). The census looks at data in many areas, including animal ownership and sales. The authority for the Census comes from federal law under the Census of Agriculture Act of 1997 (Public Law 105-113, Title 7, United States Code, Section 2204g). The Census is taken every fifth year, covering the prior year and the most recent Census was completed for the year 2012.
The USDA National Agricultural Statistics Service (NASS) provides livestock numbers, by county. Estimates numbers are available for cattle, hogs, horses, sheep, goats, and poultry (chicken and turkey) through the U.S. Census of Agriculture. County livestock populations were distributed across the watershed in an area-weighted basis. For example, if County A is 100 square miles and has 100 head of cattle within County A, the population density of cattle is one head per square mile. If 60 square miles of County A were located in Wolverton Creek, then an estimated 60 head of cattle would be in the watershed.
Livestock populations were estimated for cattle, chickens, goats, horses, sheep, and turkeys for each subwatershed area contributing to the listed impairments, and are provided in Table 3-9. Although the MPCA’s geographic feedlot database developed for registered and NPDES permitting provide location and allowable populations of animals, these populations are the maximum allowable populations under the permits and are not the actual populations at these sites. Therefore, the USDA census data was used to estimate livestock populations.

35
Table 3-9: Livestock Population Estimates (numbers) in the URRW.
Animal Type Wolverton Creek Subwatershed
Whiskey Creek Subwatershed
Cattle
All 586 2,340
Beef 554 2,209
Cattle on Feed 32 131
Other
Pigs 1,031 575
Sheep and Goats 5 45
Horses 33 74
Poultry
Layers 43,750 234
Boilers 110 203
Turkey 15,456 56,438
Ducks and other 8 324
Livestock waste is distributed throughout the watershed in three main categories: grazing animals, animal feedlot operations, and land application of manure. Discussion of each of these categories follows.
Grazing
Grazing occurs on pastured areas where concentrations of animals allow grasses or other vegetative cover to be maintained during the growing season. Grazing pasture neither requires a permit nor registration in the State of Minnesota. According to Minnesota Shoreland Management Rules, agricultural areas adjacent to lakes, rivers, and streams require a buffer strip of permanent vegetation that is 50 feet wide unless the areas are part of a resource management system plan (Minn. R. 6120.330, subp. 7). Grazing cattle were assumed to be the total cattle population from the Census of Agriculture (see Livestock Populations) minus the cattle on feed.
Animal Feedlots
Animal feedlots that do not meet requirements for an NPDES Permit (less than 1,000 animal units) may be required to be registered with the MPCA. Animal feedlots outside of shoreland areas with more than 50, but less than 1,000 animal units are regulated by the MPCA under a feedlot registration program. Animal feedlots inside shoreland areas with more than 10 but fewer than 50 animal units are also regulated under the same feedlot registration program. A permit is required for feedlots with 1,000 animal units or more. Shoreland is defined in Minn. Stat. § 103F.205 to include: land within 1,000 feet of the normal high-watermark of lakes, ponds, or flowages; land within 300 feet of a river or stream; and designated floodplains (MPCA 2009). These smaller facilities are subject to state feedlot rules, which include provisions for registration, inspection, permitting, and upgrading.
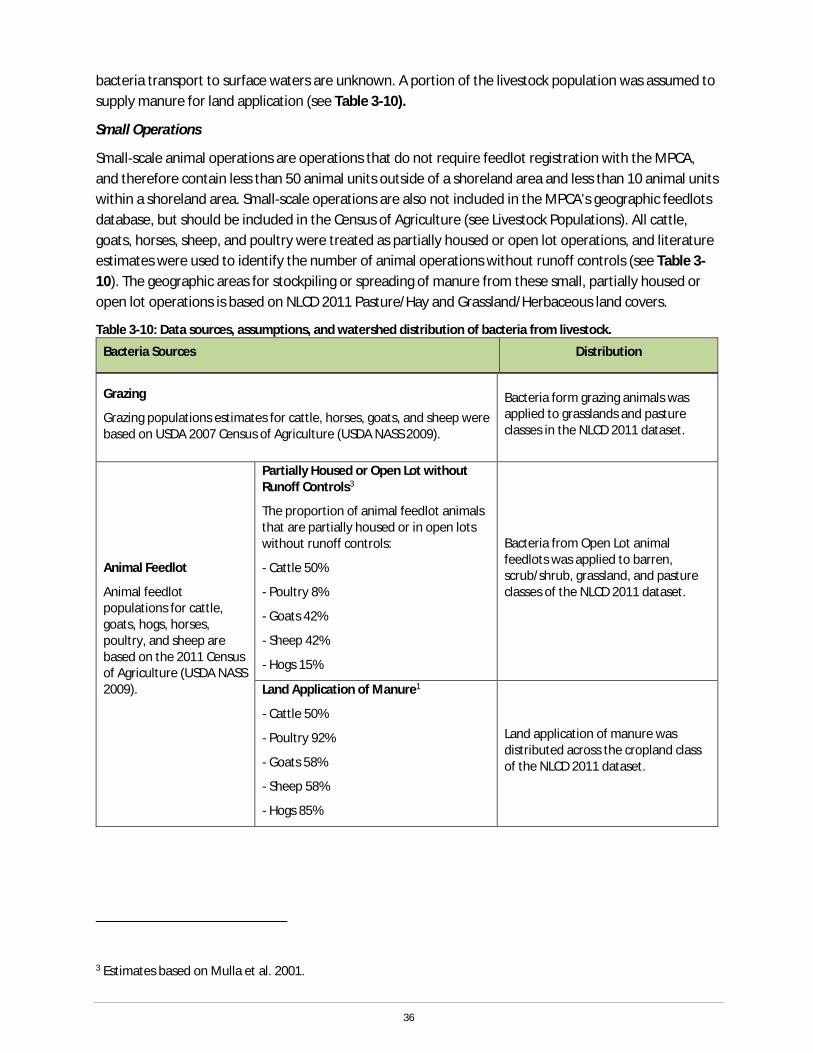
Land Application of Manure
Manure is often surface applied or incorporated into fields as a fertilizer and soil amendment. The land application of manure has the potential to be a substantial source of fecal bacteria, transported to waterbodies from surface runoff and drain tile intakes. Minn. R. ch. 7020 contains manure application setbacks based on research related to nutrient transport, but the effectiveness of these setbacks on
36
bacteria transport to surface waters are unknown. A portion of the livestock population was assumed to supply manure for land application (see Table 3-10).
Small Operations
Small-scale animal operations are operations that do not require feedlot registration with the MPCA, and therefore contain less than 50 animal units outside of a shoreland area and less than 10 animal units within a shoreland area. Small-scale operations are also not included in the MPCA’s geographic feedlots database, but should be included in the Census of Agriculture (see Livestock Populations). All cattle, goats, horses, sheep, and poultry were treated as partially housed or open lot operations, and literature estimates were used to identify the number of animal operations without runoff controls (see Table 3-10). The geographic areas for stockpiling or spreading of manure from these small, partially housed or open lot operations is based on NLCD 2011 Pasture/Hay and Grassland/Herbaceous land covers.
Table 3-10: Data sources, assumptions, and watershed distribution of bacteria from livestock.
Bacteria Sources Distribution
Grazing
Grazing populations estimates for cattle, horses, goats, and sheep were based on USDA 2007 Census of Agriculture (USDA NASS 2009).
Bacteria form grazing animals was applied to grasslands and pasture classes in the NLCD 2011 dataset.
Animal Feedlot
Animal feedlot populations for cattle, goats, hogs, horses, poultry, and sheep are based on the 2011 Census of Agriculture (USDA NASS 2009).
Partially Housed or Open Lot without Runoff Controls3
The proportion of animal feedlot animals that are partially housed or in open lots without runoff controls:
- Cattle 50%
- Poultry 8%
- Goats 42%
- Sheep 42%
- Hogs 15%
Bacteria from Open Lot animal feedlots was applied to barren, scrub/shrub, grassland, and pasture classes of the NLCD 2011 dataset.
Land Application of Manure1
- Cattle 50%
- Poultry 92%
- Goats 58%
- Sheep 58%
- Hogs 85%
Land application of manure was distributed across the cropland class of the NLCD 2011 dataset.
3 Estimates based on Mulla et al. 2001.
37
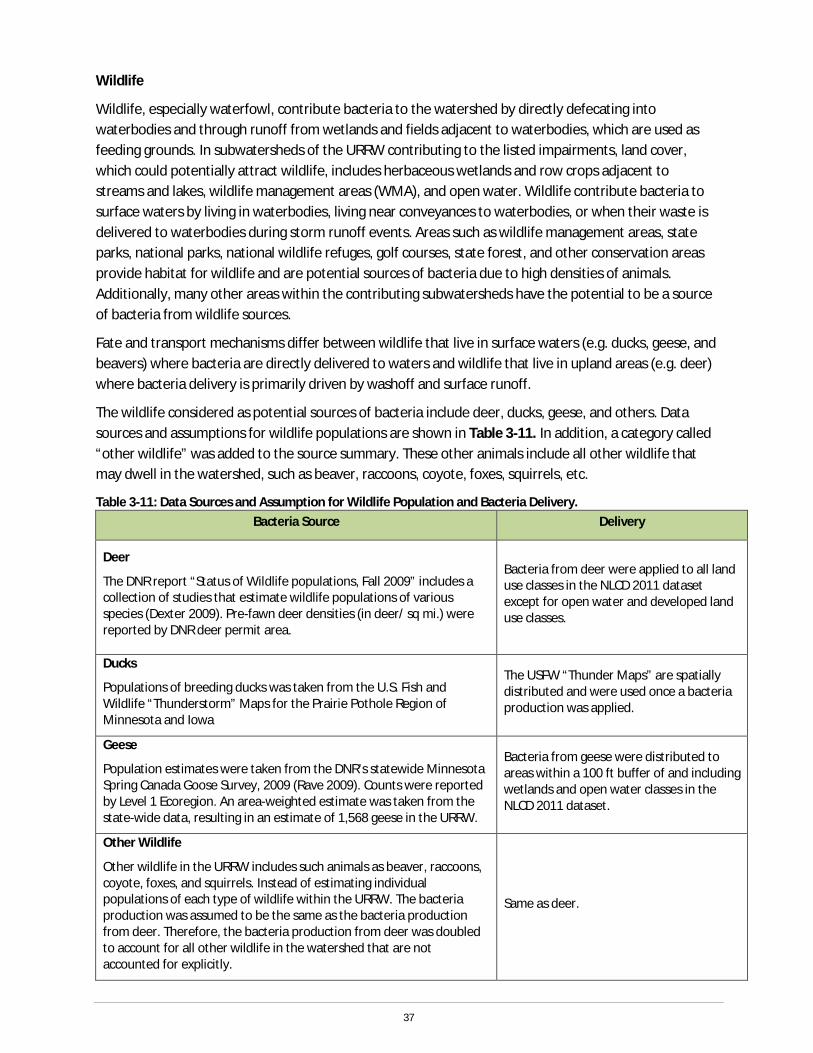
Wildlife
Wildlife, especially waterfowl, contribute bacteria to the watershed by directly defecating into waterbodies and through runoff from wetlands and fields adjacent to waterbodies, which are used as feeding grounds. In subwatersheds of the URRW contributing to the listed impairments, land cover, which could potentially attract wildlife, includes herbaceous wetlands and row crops adjacent to streams and lakes, wildlife management areas (WMA), and open water. Wildlife contribute bacteria to surface waters by living in waterbodies, living near conveyances to waterbodies, or when their waste is delivered to waterbodies during storm runoff events. Areas such as wildlife management areas, state parks, national parks, national wildlife refuges, golf courses, state forest, and other conservation areas provide habitat for wildlife and are potential sources of bacteria due to high densities of animals. Additionally, many other areas within the contributing subwatersheds have the potential to be a source of bacteria from wildlife sources.
Fate and transport mechanisms differ between wildlife that live in surface waters (e.g. ducks, geese, and beavers) where bacteria are directly delivered to waters and wildlife that live in upland areas (e.g. deer) where bacteria delivery is primarily driven by washoff and surface runoff.
The wildlife considered as potential sources of bacteria include deer, ducks, geese, and others. Data sources and assumptions for wildlife populations are shown in Table 3-11. In addition, a category called “other wildlife” was added to the source summary. These other animals include all other wildlife that may dwell in the watershed, such as beaver, raccoons, coyote, foxes, squirrels, etc.
Table 3-11: Data Sources and Assumption for Wildlife Population and Bacteria Delivery. Bacteria Source Delivery
Deer
The DNR report “Status of Wildlife populations, Fall 2009” includes a collection of studies that estimate wildlife populations of various species (Dexter 2009). Pre-fawn deer densities (in deer/ sq mi.) were reported by DNR deer permit area.
Bacteria from deer were applied to all land use classes in the NLCD 2011 dataset except for open water and developed land use classes.
Ducks
Populations of breeding ducks was taken from the U.S. Fish and Wildlife “Thunderstorm” Maps for the Prairie Pothole Region of Minnesota and Iowa
The USFW “Thunder Maps” are spatially distributed and were used once a bacteria production was applied.
Geese
Population estimates were taken from the DNR’s statewide Minnesota Spring Canada Goose Survey, 2009 (Rave 2009). Counts were reported by Level 1 Ecoregion. An area-weighted estimate was taken from the state-wide data, resulting in an estimate of 1,568 geese in the URRW.
Bacteria from geese were distributed to areas within a 100 ft buffer of and including wetlands and open water classes in the NLCD 2011 dataset.
Other Wildlife
Other wildlife in the URRW includes such animals as beaver, raccoons, coyote, foxes, and squirrels. Instead of estimating individual populations of each type of wildlife within the URRW. The bacteria production was assumed to be the same as the bacteria production from deer. Therefore, the bacteria production from deer was doubled to account for all other wildlife in the watershed that are not accounted for explicitly.
Same as deer.
38
Natural/Background Sources
Two Minnesota studies described the potential for the presence of “naturalized” or “indigenous” E. coli in watershed soils (Ishii et al. 2006) and ditch sediment and water (Sadowsky et al. 2010). Sadowsky et al. (2010) conducted DNA fingerprinting of E. coli in sediment and water samples from Seven Mile Creek, located in south-central Minnesota. They concluded that roughly 63.5% of the bacteria were represented by a single isolate, suggesting new or transient sources of E. coli. The remaining 36.5% of strains were represented by multiple isolates, suggesting persistence of specific E. coli. The authors suggested that 36% might be used as a rough indicator of “background” levels of bacteria at this site during the study period but results might not be transferable to other locations without further study. Although the result may not be transferable to other locations, they do suggest the presence of natural background E. coli and a fraction of E. coli may be present regardless of the control measures taken by traditional implementation strategies.
Fate and Delivery of Bacteria
A delivery factor was developed to account for the fate and transport of bacteria from the landscape to the impaired waterbody. The delivery factor accounts for factors such as proximity to surface waters, landscape slope, imperviousness, and the probable bacteria die-off rate (bacteria cannot survive outside of a warm blooded host). Therefore, the die-off rate is known to follow an exponential (first-order) loss rate. The bacteria delivery factor assumed delivery to the waterbody is dependent on water travel time and a bacteria die-off rate.
The EPA’s Protocols for Developing Pathogen TMDLs provides a methodology for estimating bacteria die-off and lists coefficients for die-off calculations (EPA 2001). The die-off equation was given as:
𝐶𝐶 = 𝐶𝐶0𝑒𝑒𝑒𝑒𝑒𝑒(−𝐾𝐾𝑇𝑇𝑡𝑡) [Equation 1]
Where C is the concentration of bacteria (cfu/day), C0 is the initial concentration of bacteria (cfu/day), K is the decay (die-off) coefficient (1/day), and Tt is travel time (days). The die-off coefficient for natural surface water used in the URRW was 0.202 days-1 (essentially meaning about 20% per day).
The die-off equation [1] was applied to a water travel-time grid for the watershed as a whole and each impaired reach to estimate the delivery factor. An assumption is that the time of travel through the watershed by bacteria is the same as water.
E. coli Source Summary
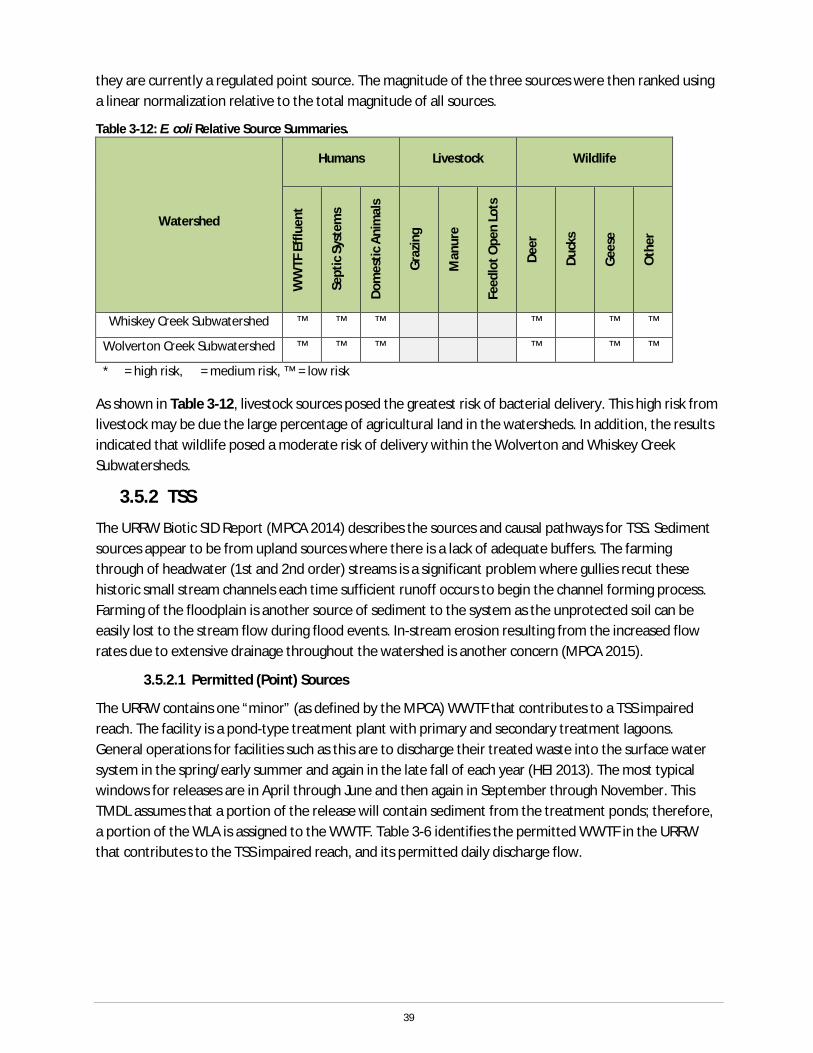
The magnitude of the bacteria sources contributing to the listed impairments were placed into one of three categories: low, medium, and high. The rankings are based the percentage of total bacteria load for each potential source. The sources were categorized into 10 groups. If all 10 potential sources contributed equally, they should each contribute 10% of the total load. As such, we ranked potential sources contributing 5% to 20% of the total load as a medium risk, or half to twice the expected value. If the source of bacteria was less than 5% of the total load, a rank of low was assigned and if greater than 20%, a rank of high was assigned. The rankings for the URRW were all relative to the delivery of E. coli to the URRW outlet.
The bacterial source loading to the outlet of the URRW was calculated for each HUC 12 with an impaired reach. The bacterial sources were aggregated to Human (STSS; Pets), Livestock (Grazing; Manure; Animal Feedlots), and Wildlife (Deer; Ducks; Geese; Other). WWTFs were excluded from the HUC 12 rankings as
39
they are currently a regulated point source. The magnitude of the three sources were then ranked using a linear normalization relative to the total magnitude of all sources.
Table 3-12: E. coli Relative Source Summaries.
Watershed
Humans Livestock Wildlife
WW
TF E
fflue
nt
Sept
ic S
yste
ms
Dom
estic
Ani
mal
s
Gra
zing
Man
ure
Feed
lot O
pen
Lots
Deer
Duck
s
Gee
se
Oth
er
Whiskey Creek Subwatershed ô ô ô ò ò ò ô õ ô ô
Wolverton Creek Subwatershed ô ô ô ò õ ò ô õ ô ô
*ò = high risk, õ = medium risk, ô = low risk
As shown in Table 3-12, livestock sources posed the greatest risk of bacterial delivery. This high risk from livestock may be due the large percentage of agricultural land in the watersheds. In addition, the results indicated that wildlife posed a moderate risk of delivery within the Wolverton and Whiskey Creek Subwatersheds.
3.5.2 TSS
The URRW Biotic SID Report (MPCA 2014) describes the sources and causal pathways for TSS. Sediment sources appear to be from upland sources where there is a lack of adequate buffers. The farming through of headwater (1st and 2nd order) streams is a significant problem where gullies recut these historic small stream channels each time sufficient runoff occurs to begin the channel forming process. Farming of the floodplain is another source of sediment to the system as the unprotected soil can be easily lost to the stream flow during flood events. In-stream erosion resulting from the increased flow rates due to extensive drainage throughout the watershed is another concern (MPCA 2015).
3.5.2.1 Permitted (Point) Sources
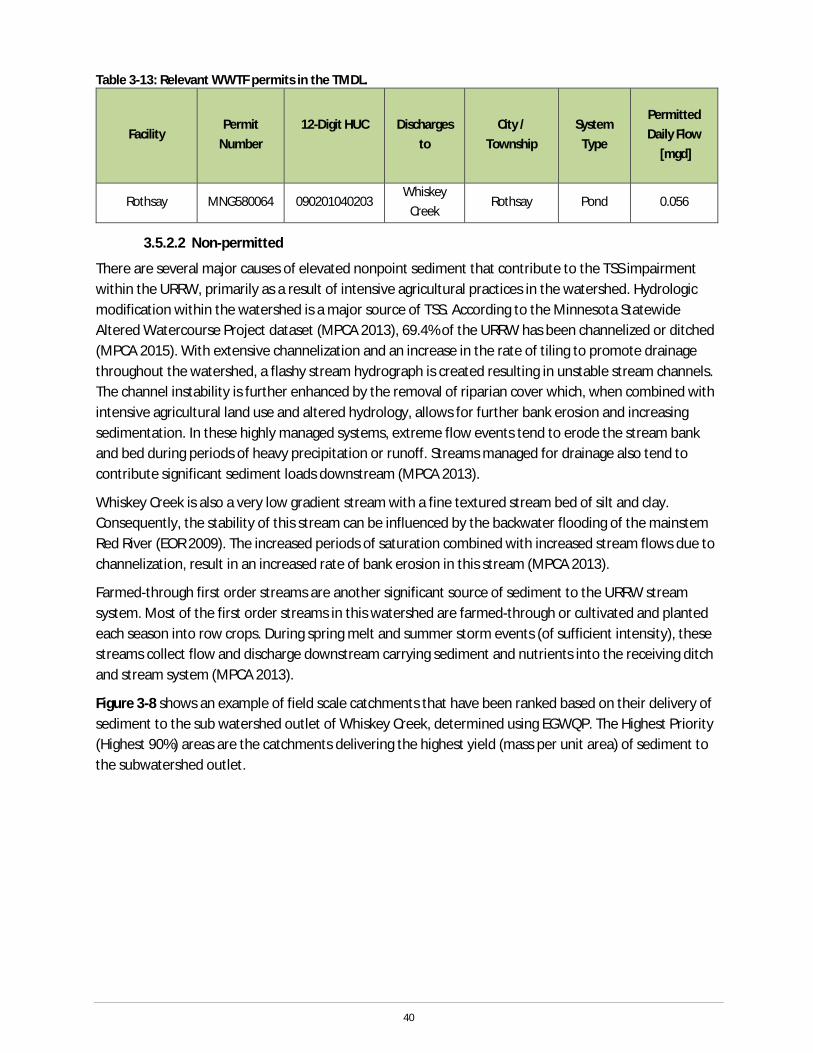
The URRW contains one “minor” (as defined by the MPCA) WWTF that contributes to a TSS impaired reach. The facility is a pond-type treatment plant with primary and secondary treatment lagoons. General operations for facilities such as this are to discharge their treated waste into the surface water system in the spring/early summer and again in the late fall of each year (HEI 2013). The most typical windows for releases are in April through June and then again in September through November. This TMDL assumes that a portion of the release will contain sediment from the treatment ponds; therefore, a portion of the WLA is assigned to the WWTF. Table 3-6 identifies the permitted WWTF in the URRW that contributes to the TSS impaired reach, and its permitted daily discharge flow.
40
Table 3-13: Relevant WWTF permits in the TMDL.
Facility Permit
Number 12-Digit HUC
Discharges
to City /
Township System
Type
Permitted Daily Flow
[mgd]
Rothsay MNG580064 090201040203 Whiskey
Creek Rothsay Pond 0.056
3.5.2.2 Non-permitted
There are several major causes of elevated nonpoint sediment that contribute to the TSS impairment within the URRW, primarily as a result of intensive agricultural practices in the watershed. Hydrologic modification within the watershed is a major source of TSS. According to the Minnesota Statewide Altered Watercourse Project dataset (MPCA 2013), 69.4% of the URRW has been channelized or ditched (MPCA 2015). With extensive channelization and an increase in the rate of tiling to promote drainage throughout the watershed, a flashy stream hydrograph is created resulting in unstable stream channels. The channel instability is further enhanced by the removal of riparian cover which, when combined with intensive agricultural land use and altered hydrology, allows for further bank erosion and increasing sedimentation. In these highly managed systems, extreme flow events tend to erode the stream bank and bed during periods of heavy precipitation or runoff. Streams managed for drainage also tend to contribute significant sediment loads downstream (MPCA 2013).
Whiskey Creek is also a very low gradient stream with a fine textured stream bed of silt and clay. Consequently, the stability of this stream can be influenced by the backwater flooding of the mainstem Red River (EOR 2009). The increased periods of saturation combined with increased stream flows due to channelization, result in an increased rate of bank erosion in this stream (MPCA 2013).
Farmed-through first order streams are another significant source of sediment to the URRW stream system. Most of the first order streams in this watershed are farmed-through or cultivated and planted each season into row crops. During spring melt and summer storm events (of sufficient intensity), these streams collect flow and discharge downstream carrying sediment and nutrients into the receiving ditch and stream system (MPCA 2013).
Figure 3-8 shows an example of field scale catchments that have been ranked based on their delivery of sediment to the sub watershed outlet of Whiskey Creek, determined using EGWQP. The Highest Priority (Highest 90%) areas are the catchments delivering the highest yield (mass per unit area) of sediment to the subwatershed outlet.
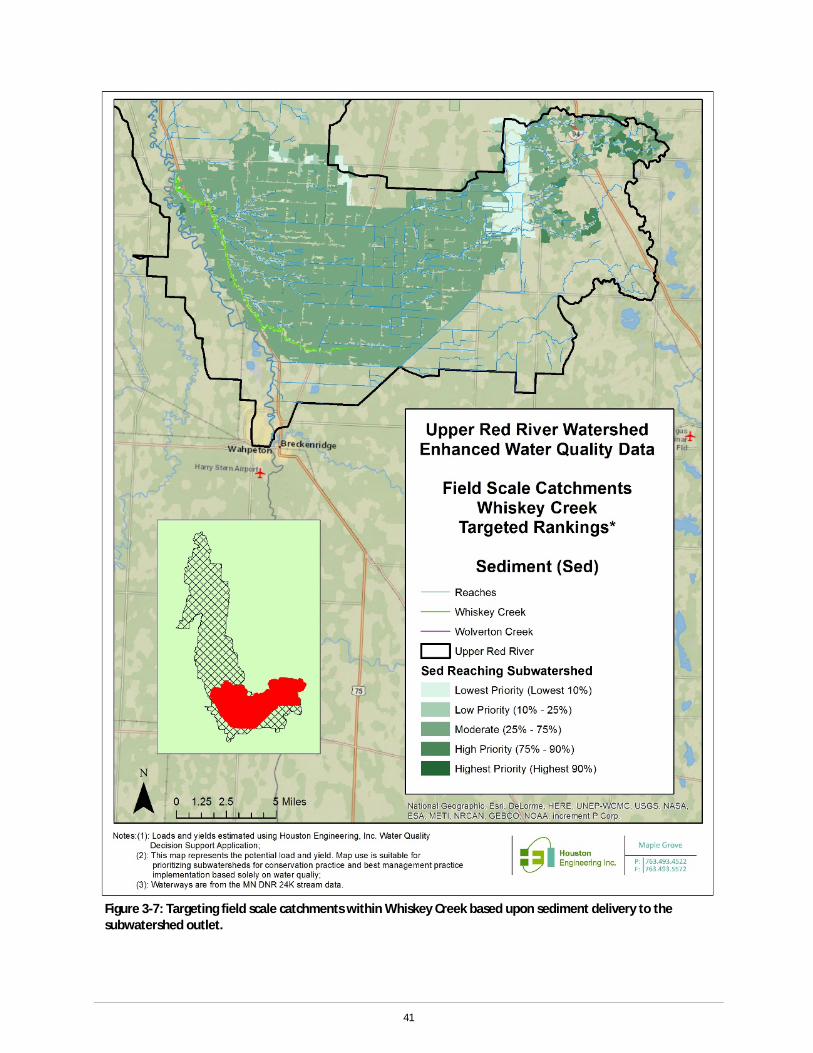
41
Figure 3-7: Targeting field scale catchments within Whiskey Creek based upon sediment delivery to the subwatershed outlet.
42
4 TMDL Development TMDLs are developed based on the following equation:
TMDL = LC = ∑WLA + ∑LA + MOS + RC Where:
LC = loading capacity, or the greatest amount of a pollutant a waterbody can receive and still meet water quality standards (see Section 4.1.1);
WLA = wasteload allocation, or the portion of the loading capacity allocated to existing or future permitted point sources (see Section 3.2);
LA = load allocation, or the portion of the loading capacity allocated for existing or future nonpoint sources (see Section 3.3);
MOS = margin of safety, or accounting for any uncertainty associated with attaining the water quality standard. The MOS may be explicitly stated as an added, separate quantity in the TMDL calculation or maybe implicit, as in a conservative assumption (EPA, 2007) (see Section 3.4);
RC = reserve capacity, or the portion of the TMDL that accommodates for future loads;
The following sections discuss each component of the URRW TMDLs in greater detail.
4.1 Escherichia coli
4.1.1 Loading Capacity Methodology
The loading capacity (LC) is the greatest amount of a pollutant a waterbody can receive and still meet the water quality standard. LC for stream reaches in the URRW with E. coli impairments and receiving a TMDL were determined using the load duration curve (LDC) approach. A LDC is developed by applying a particular pollutant load standard or criteria to a stream’s flow duration curve (FDC) and expressing it as a pollutant load per day. FDC analysis looks at the cumulative frequency of historic flows and plots flows over the exceedance probability scale. The probability of exceedance scale ranges from 0% to 100% with high flows near 0% and low flows being near 100% exceedance (e.g. the maximum flow during the time period will be near 0% exceedance). LDC analysis is the same but applies the water standard to the flows to obtain a load for a given flow frequency. Methods detailed in the EPA document An Approach for Using LDCs in the Development of TMDLs were used in creating the curves (EPA 2007).
To adequately capture different types of flow events and pollutant loading during these events, five flow regimes were identified per EPA guidance (EPA 2007; page 2): High flow (0% to 10%), Moist Conditions (10% to 40%), Mid-range Flows (40% to 60%), Dry Conditions (60% to 90%), and Low Flow (90% to 100%).
Benefits of LDC analysis include: (1) the loading capacities are calculated for multiple flow regimes, not just a single point; (2) use of the method helps identify specific flow regimes and hydrologic processes/patterns where loading maybe a concern; and (3) ensuring that the applicable water quality standards are protective across all flow regimes. Some limitations with the LDC approach exist: (1) the approach is limited in the ability to track individual loadings or relative source contributions and (2) is

43
appropriate when a correlation between flow and water quality exists and flow is the driving force behind pollutant delivery mechanics.
For E. coli, the LC was calculated using both the instantaneous standard of 1260 organisms/100 mL and the geometric mean (i.e., geomean) standard of 126 organisms/100 mL. Conversions for computing bacterial loads are shown in Table 4-1.
Table 4-1: Converting flow and concentration into bacterial load. Load (org/day) = Concentration (organisms/100mL) * Flow (cfs) * Factor
Multiply by 28.316 to convert ft3 per second → L/sec
Multiply by 1000 to convert Liters per second → mL/sec
Divide by 100 to convert Milliliters per second → organisms/sec
Multiply by 86,400 to convert organisms per second → organisms/day
LDCs were developed for both Wolverton and Whiskey Creeks. Neither of the two creeks has a continuous flow record, which is needed to calculate LDCs. In addition, no modeled continuous flow data are available for these systems during the time that water quality data are available. As such, observed flow data at nearby continuous flow stations and the drainage area ratio method were used to estimate hydrographs of Wolverton and Whiskey Creeks for the purpose of creating the LDCs (HEI 2014).
Nearby subwatersheds with continuous flow data and assumed similar flow patterns to those in Wolverton and Whiskey Creeks were identified. The drainage area ratio method was then used to estimate mean daily flows in the Wolverton and Whiskey Creek subwatersheds, based on the observed flows from the identified subwatersheds. Flows from the South Branch of the Buffalo River Subwatershed (USGS station 05061500) were used to estimate flows in Wolverton Creek. Data from the Wild Rice River Subwatershed (USGS station 05053000) were used to estimate flows in Whiskey Creek. The location of these stations, relative to their respective LDCs, is shown on Figure 4-1.
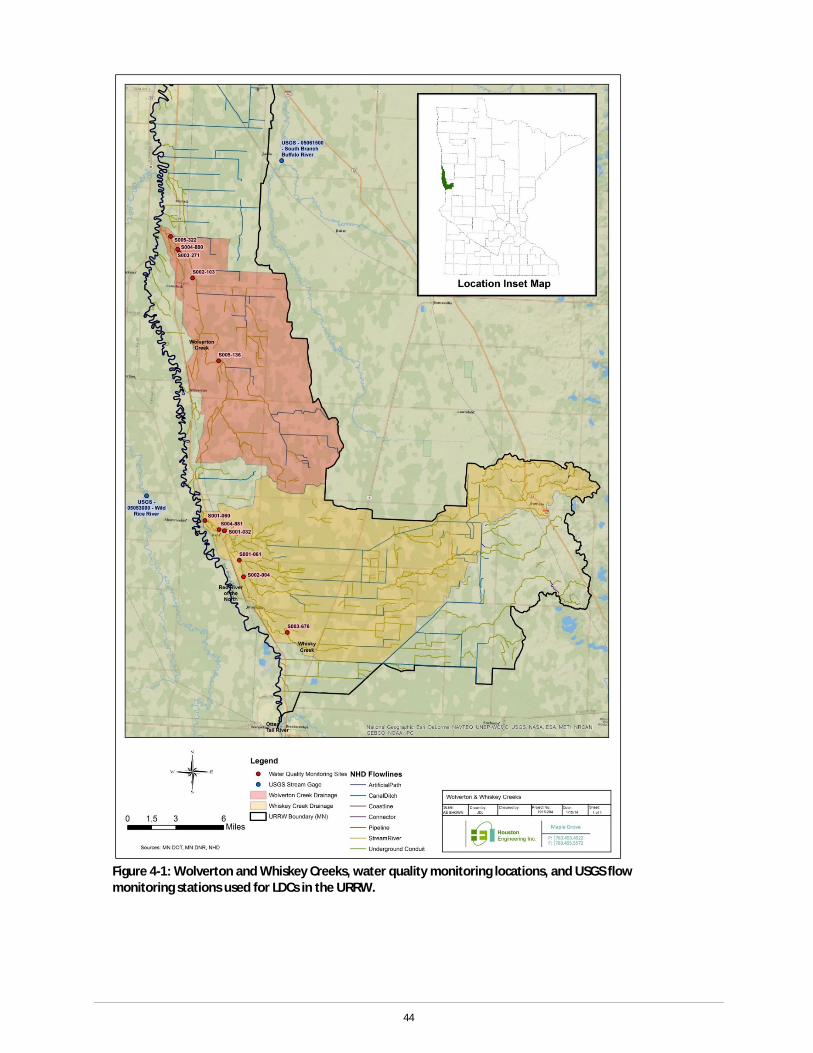
44
Figure 4-1: Wolverton and Whiskey Creeks, water quality monitoring locations, and USGS flow monitoring stations used for LDCs in the URRW.
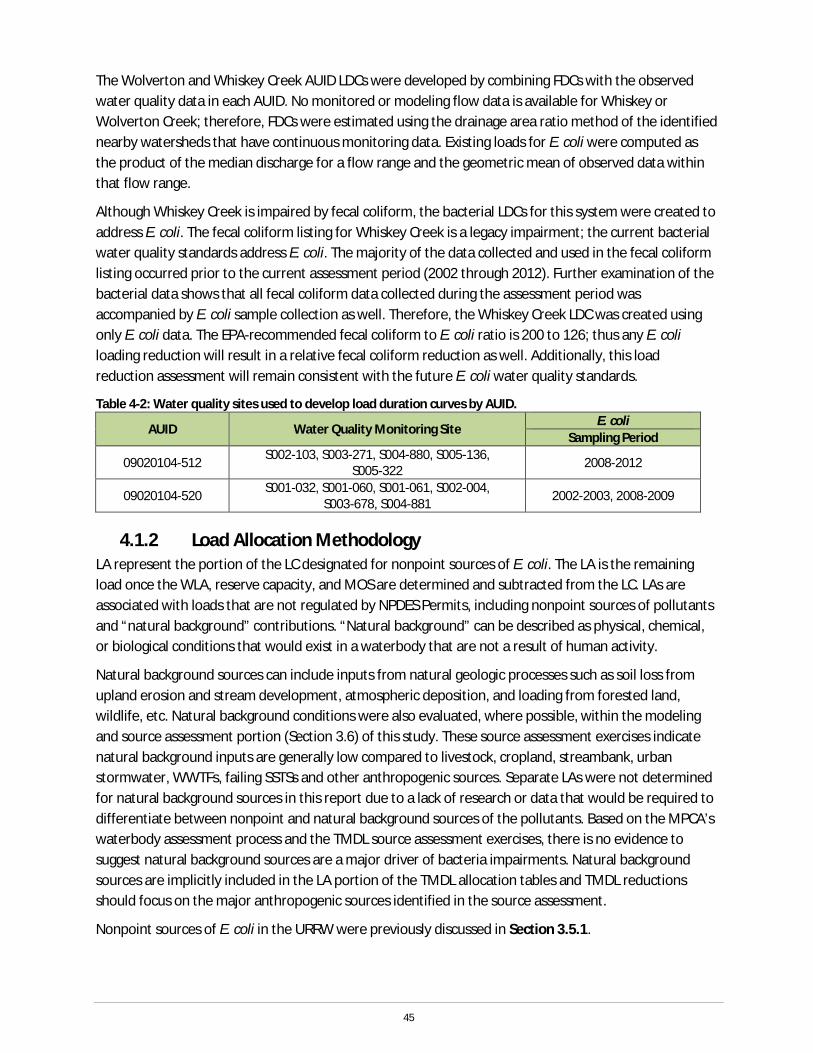
45
The Wolverton and Whiskey Creek AUID LDCs were developed by combining FDCs with the observed water quality data in each AUID. No monitored or modeling flow data is available for Whiskey or Wolverton Creek; therefore, FDCs were estimated using the drainage area ratio method of the identified nearby watersheds that have continuous monitoring data. Existing loads for E. coli were computed as the product of the median discharge for a flow range and the geometric mean of observed data within that flow range.
Although Whiskey Creek is impaired by fecal coliform, the bacterial LDCs for this system were created to address E. coli. The fecal coliform listing for Whiskey Creek is a legacy impairment; the current bacterial water quality standards address E. coli. The majority of the data collected and used in the fecal coliform listing occurred prior to the current assessment period (2002 through 2012). Further examination of the bacterial data shows that all fecal coliform data collected during the assessment period was accompanied by E. coli sample collection as well. Therefore, the Whiskey Creek LDC was created using only E. coli data. The EPA-recommended fecal coliform to E. coli ratio is 200 to 126; thus any E. coli loading reduction will result in a relative fecal coliform reduction as well. Additionally, this load reduction assessment will remain consistent with the future E. coli water quality standards.
Table 4-2: Water quality sites used to develop load duration curves by AUID.
AUID Water Quality Monitoring Site E. coli
Sampling Period
09020104-512 S002-103, S003-271, S004-880, S005-136, S005-322 2008-2012
09020104-520 S001-032, S001-060, S001-061, S002-004, S003-678, S004-881 2002-2003, 2008-2009
4.1.2 Load Allocation Methodology LA represent the portion of the LC designated for nonpoint sources of E. coli. The LA is the remaining load once the WLA, reserve capacity, and MOS are determined and subtracted from the LC. LAs are associated with loads that are not regulated by NPDES Permits, including nonpoint sources of pollutants and “natural background” contributions. “Natural background” can be described as physical, chemical, or biological conditions that would exist in a waterbody that are not a result of human activity.
Natural background sources can include inputs from natural geologic processes such as soil loss from upland erosion and stream development, atmospheric deposition, and loading from forested land, wildlife, etc. Natural background conditions were also evaluated, where possible, within the modeling and source assessment portion (Section 3.6) of this study. These source assessment exercises indicate natural background inputs are generally low compared to livestock, cropland, streambank, urban stormwater, WWTFs, failing SSTSs and other anthropogenic sources. Separate LAs were not determined for natural background sources in this report due to a lack of research or data that would be required to differentiate between nonpoint and natural background sources of the pollutants. Based on the MPCA’s waterbody assessment process and the TMDL source assessment exercises, there is no evidence to suggest natural background sources are a major driver of bacteria impairments. Natural background sources are implicitly included in the LA portion of the TMDL allocation tables and TMDL reductions should focus on the major anthropogenic sources identified in the source assessment.
Nonpoint sources of E. coli in the URRW were previously discussed in Section 3.5.1.
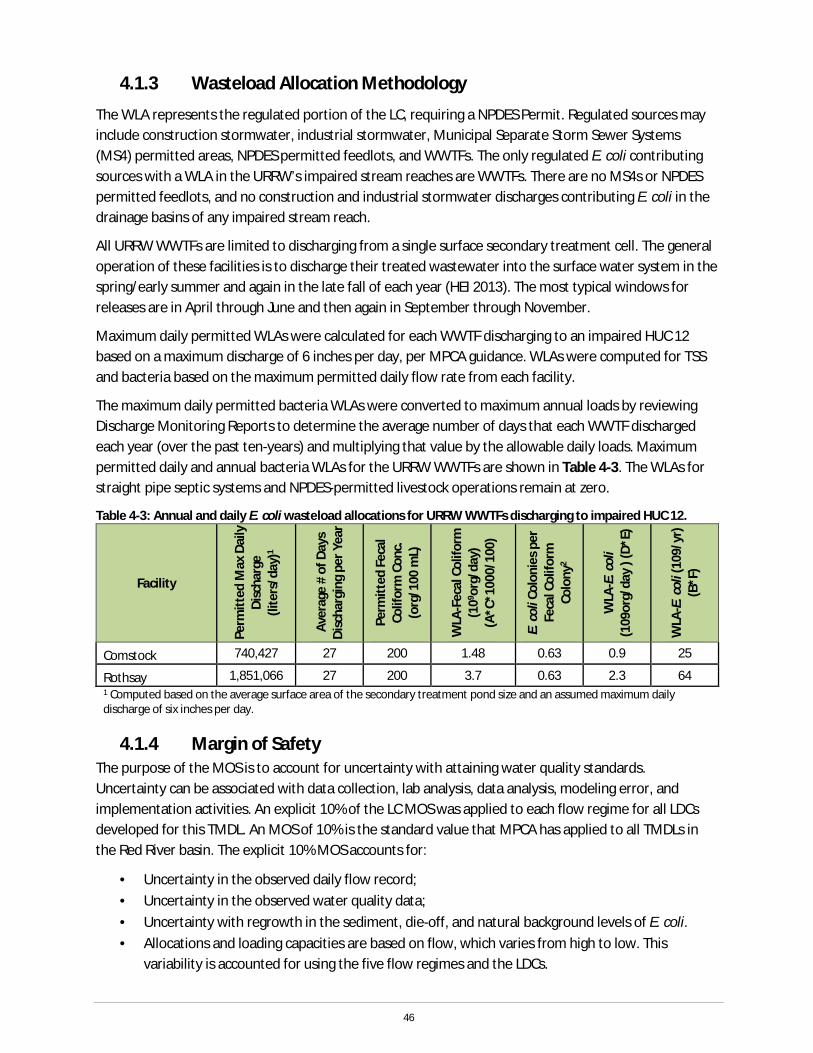
46
4.1.3 Wasteload Allocation Methodology
The WLA represents the regulated portion of the LC, requiring a NPDES Permit. Regulated sources may include construction stormwater, industrial stormwater, Municipal Separate Storm Sewer Systems (MS4) permitted areas, NPDES permitted feedlots, and WWTFs. The only regulated E. coli contributing sources with a WLA in the URRW’s impaired stream reaches are WWTFs. There are no MS4s or NPDES permitted feedlots, and no construction and industrial stormwater discharges contributing E. coli in the drainage basins of any impaired stream reach.
All URRW WWTFs are limited to discharging from a single surface secondary treatment cell. The general operation of these facilities is to discharge their treated wastewater into the surface water system in the spring/early summer and again in the late fall of each year (HEI 2013). The most typical windows for releases are in April through June and then again in September through November.
Maximum daily permitted WLAs were calculated for each WWTF discharging to an impaired HUC 12 based on a maximum discharge of 6 inches per day, per MPCA guidance. WLAs were computed for TSS and bacteria based on the maximum permitted daily flow rate from each facility.
The maximum daily permitted bacteria WLAs were converted to maximum annual loads by reviewing Discharge Monitoring Reports to determine the average number of days that each WWTF discharged each year (over the past ten-years) and multiplying that value by the allowable daily loads. Maximum permitted daily and annual bacteria WLAs for the URRW WWTFs are shown in Table 4-3. The WLAs for straight pipe septic systems and NPDES-permitted livestock operations remain at zero.
Table 4-3: Annual and daily E. coli wasteload allocations for URRW WWTFs discharging to impaired HUC 12.
Facility
Perm
itted
Max
Dai
ly
Disc
harg
e (li
ters
/day
)1
Aver
age
# of
Day
s Di
scha
rgin
g pe
r Yea
r
Perm
itted
Fec
al
Colif
orm
Con
c.
(org
/100
mL)
WLA
-Fec
al C
olifo
rm
(109 o
rg/d
ay)
(A*C
*100
0/10
0)
E. c
oli C
olon
ies p
er
Feca
l Col
iform
Co
lony
2
WLA
-E. c
oli
(109
org/
day
) (D*
E)
WLA
-E. c
oli (
109/
yr)
(B*F
)
Comstock 740,427 27 200 1.48 0.63 0.9 25
Rothsay 1,851,066 27 200 3.7 0.63 2.3 64 1 Computed based on the average surface area of the secondary treatment pond size and an assumed maximum daily discharge of six inches per day.
4.1.4 Margin of Safety The purpose of the MOS is to account for uncertainty with attaining water quality standards. Uncertainty can be associated with data collection, lab analysis, data analysis, modeling error, and implementation activities. An explicit 10% of the LC MOS was applied to each flow regime for all LDCs developed for this TMDL. An MOS of 10% is the standard value that MPCA has applied to all TMDLs in the Red River basin. The explicit 10% MOS accounts for:
· Uncertainty in the observed daily flow record; · Uncertainty in the observed water quality data; · Uncertainty with regrowth in the sediment, die-off, and natural background levels of E. coli. · Allocations and loading capacities are based on flow, which varies from high to low. This
variability is accounted for using the five flow regimes and the LDCs.

47
4.1.5 Seasonal Variation
The water quality standard for E. coli applies to April through October, coinciding with the time period when aquatic recreation occurs including portions of or all of the spring, summer, and fall season. Spring is usually associated with the spring snowmelt and flood flows, the summer with low flows and rapid-rising flows for storm events, fall with increases in precipitation and rapidly changing landscape, especially in agricultural landscapes. The summer months tend to be the time when the water quality standards for E. coli are exceeded the most. This is partly due to the fact that the required five samples to assess a stream reach is impaired is meet most often, partly due to the build-up and washoff of bacteria associated with summer hydrology, and partly due to warmer water temperatures.
A summary of the bacteria load reduction results and critical flow regimes can be found in Table 4-4. Results are summarized by indicating the maximum required percent load reduction for each curve and the flow regime and water quality criteria under which this maximum reduction occurred (i.e., the critical flow regime and criteria). The critical flow regime for bacteria loading ranges from low flows to high flows. The critical criterion is the geomean criterion, indicating a chronic bacterial water quality problem in the watershed.
Table 4-4: Maximum required bacterial load reductions for the URRW.
AUID
Bacteria
Max. % Load Reduction Critical Flow Regime Critical Criterion
09020104-512 49% Low Geometric Mean 09020104-520 64% High Geometric Mean
4.1.6 Reserve Capacity No additional reserve capacity was included for the point sources in the URRW, given the nature of assumptions used to create the WLAs. Similarly, no reserve capacity was included for nonpoint sources in the watershed (LAs), given that the land use in the URRW is dominated by agriculture and is unlikely to substantially change in the future. For more information on how future growth and reserve capacity, see Section 5.
4.1.7 TMDL Summary
Tables 4-5 and 4-6 show the computed loading capacities and allocations for the stream E. coli impairments in the URRW. The various components of these allocations were developed as described in Sections 4.1.1 – 4.1.4. All E. coli TMDLs apply to the geometric mean standard.
The LDC method is based on an analysis that encompasses the cumulative frequency of historic flow data over a specified period. Because this method uses a long-term record of daily flow volumes, virtually the full spectrum of allowable loading capacities is represented by the resulting curve. In the TMDL equation tables of this report (Tables 4-5 – 4-6) only five points on the entire LC curve are depicted (the midpoints of the designated flow zones). However, it should be understood that the entire curve represents the TMDL and is what is ultimately approved by the EPA. The LDCs used to develop the loading capacities and allocations are provided in Appendix A.

48
In addition to the TMDL components, the existing load, the unallocated load (if applicable), and the estimated load reduction as a percentage are given for each flow regime. The existing load is based on existing water quality data, the unallocated load is the potential load available if the existing load is lower than the loading capacity for a given flow regime (i.e. the loading capacity minus the existing load). An unallocated load is only provided if the existing load is lower than the loading capacity. The estimated load reduction is required load reduction, as a percentage of existing load, to meet the loading capacity. A load reduction is only provided if the loading capacity is less than the existing load.
Table 4-5: Bacteria loading capacities and allocations for AUID 09020104-512.
E. coli
Flow Condition
Very High High Mid Low Very Low
Geometric Mean (Billion organisms per day)
Loading Capacity 7,583.18 2,117.74 450.06 104.81 5.55
Waste Load Allocation
Total WLA 0.93 0.93 0.93 0.93 0.93
Comstock WWTF 0.93 0.93 0.93 0.93 0.93
Load Allocation Total LA 6,823.93 1,905.04 404.12 93.40 4.06
Margin of Safety (MOS) 758.32 211.77 45.01 10.48 0.55
Existing Load 9,118.27 3,056.77 735.69 160.28 10.91
Unallocated Load 0 0 0 0 0
Estimated Load Reduction 17% 31% 39% 35% 49%
Table 4-6: Bacteria loading capacities and allocations for AUID 09020104-520.
E. coli Flow Condition
Very High High Mid Low Very Low Geometric Mean (Billion organisms per day)
Loading Capacity 2,224.09 570.28 204.99 83.23 14.80
Waste Load Allocation
Total WLA 2.33 2.33 2.33 2.33 2.33 Rothsay WWTF 2.33 2.33 2.33 2.33 2.33
Load Allocation Total LA 1,999.35 510.92 182.16 72.58 10.99 Margin of Safety (MOS) 222.41 57.03 20.50 8.32 1.48
Existing Load 6,250.73 58.50 233.06 76.13 30.60
Unallocated Load 0.00 454.75 0.00 0.00 0.00
Estimated Load Reduction 64% 0% 12% 0% 52%
4.2 TSS
4.2.1 Loading Capacity The LDC approach was used to compute needed sediment load reductions in the URRW. To adequately capture different types of flow events and pollutant loading during these events five flow regimes were identified per EPA guidance: Very High (0% to 10%), High (10% to 40%), Mid (40% to 60%), Low (60% to

49
90%), and Very Low Flow (90% to 100%). Development of the LDCs is discussed in previous sections (see Section 4.1.1 and Appendix A).
The TSS standard LDCs were created for the Southern Region TSS standard of 65 mg/L. The TSS standard LDCs were calculated using only the TSS data collected during the assessment period. The standard only applies during the months of April through September. Therefore, the TSS standard LDCs were created using only TSS data and flow data from this period. As with the other LDCs, a 10% MOS was applied. Conversion factors for this work are shown in Table 4-7.
Table 4-7: Converting flow and concentration to sediment load. Load (tons/day) = TSS standard (mg/L) * Flow (cfs) * Conversion Factor
For each flow regime
Multiply flow (cfs) by 28.31 (L/ft3) and 86,400 (sec/day) to convert
cfs → L/day
Multiply TSS standard (65 mg/L) by L/day to convert
L/day → mg/day
Divide mg/day by 907,184,740 (mg/ton) to convert
mg/day → tons/day
A description of how the LDCs were developed can be found in Section 4.1.1 and Appendix A. The water quality sites used to develop the TSS LDC are provided in Table 4-8.
Table 4-8: Water Quality Sites used to Develop TSS LDCs. AUID
(09020104-XXX)
Water Quality Monitoring Locations TSS Data
520 S001-032, S001-060, S001-061, S002-004, S003-678, S004-881 2002-2003, 2005-2006, 2008
4.2.2 Load Allocation Methodology Once WLAs, reserve capacities, and MOSs were determined, the remaining LC was considered LA. LAs are associated with loads that are not regulated by NPDES Permits, including nonpoint sources of pollutants and “natural background” contributions. “Natural background” can be described as physical, chemical, or biological conditions that would exist in a waterbody that are not a result of human activity. Nonpoint sources of pollution in the URRW were discussed previously (see Section 3.5.2.2) and include channelization, ditching, bank erosion, and farmed-through first-order streams.
4.2.3 Wasteload Allocation Methodology
The WLA represents the regulated portion of the LC, requiring a NPDES Permit. Regulated sources may include construction stormwater, industrial stormwater, MS4 permitted areas, NPDES permitted feedlots, and WWTFs. The only regulated TSS sources with a WLA in the URRW’s impaired stream reaches are construction and industrial stormwater discharges and WWTFs. There are no MS4s or NPDES permitted feedlots in the drainage basins of any impaired stream reach.
WLAs for construction and industrial stormwater discharges were combined and addressed through a categorical allocation. This TMDL assumes that 0.1% of the URRW’s land area is under construction and

50
therefore contributes construction and/or industrial stormwater runoff at any given time. Historic permits and land use in the watershed support this assumption.
Stormwater runoff from construction sites that disturb a) one acre of soil or more, b) less than one acre of soil and is part of a “larger common plan of development or sale” that is greater than one acre, or c) less than one acre, but determined to pose a risk to water quality are regulated under the state’s NPDES/State Disposal System (SDS) General Stormwater Permits for Construction Activity (MNR1000001). This permit requires and identifies BMPs to be implemented to protect water resources from mobilized sediment and other pollutants of concern. If the owner/operators of impacted construction sites within the URRW obtain and abide by the NPDES/SDS General Construction Stormwater Permit, the stormwater discharges associated with those sites are expected to meet the WLAs set in this TMDL.
Similar to construction activities, industrial sites are regulated under general permits, in this case either the NPDES/SDS Industrial Stormwater Multi-Sector General Permit (MNR050000) or the NPDES/SDS General Permit for Construction Sand & Gravel, Rock Quarrying, and Hot Mix Asphalt Production facilities (MNG490000). Like the NPDES/SDS General Construction Stormwater Permit, these permits identify BMPs to be implemented to protect water resources from pollutant discharges at the site. If the owner/operators of industrial sites within the URRW obtain and abide by the necessary NPDES/SDS General Stormwater Permits, the discharges associated with those sites are expected to meet the WLAs set in this TMDL.
Due to the transient nature of construction and industrial activities, it is assumed 0.1%of the drainage area is under construction and industrial activities at any given time. Therefore, to calculate the WLA for construction and industrial stormwater, 0.1%of the load allocation for the stream reach was assumed and assigned to construction/industrial stormwater WLA. It should be noted, the construction/industrial stormwater WLA is dependent on the LA.
The URRW contains one “minor” (as defined by the MPCA) WWTF that contributes to a TSS impaired reach. This facility is a pond-type treatment plant with primary and secondary treatment ponds. General operations for facilities such as this are to discharge their treated wastewater into the surface water system in the spring/early summer and again in the late fall of each year (HEI 2013). The most typical windows for releases are in April through June and then again in September through November.
The maximum daily permitted WLA was calculated for the WWTF discharging to a HUC 12 with a TSS impaired reach based on a maximum discharge of 6 inches per day, per MPCA guidance. The WLA was computed for TSS based on the maximum permitted daily flow rate from the facility.
The maximum daily permitted TSS WLA was converted to maximum annual loads by reviewing Discharge Monitoring Reports to determine the average number of days that each WWTF discharged each year (over the past 10 years), and multiplying that value by the allowable daily loads. The maximum permitted daily and annual TSS WLA for the URRW WWTF contributing to the TSS impairment is shown in Table 4-9.
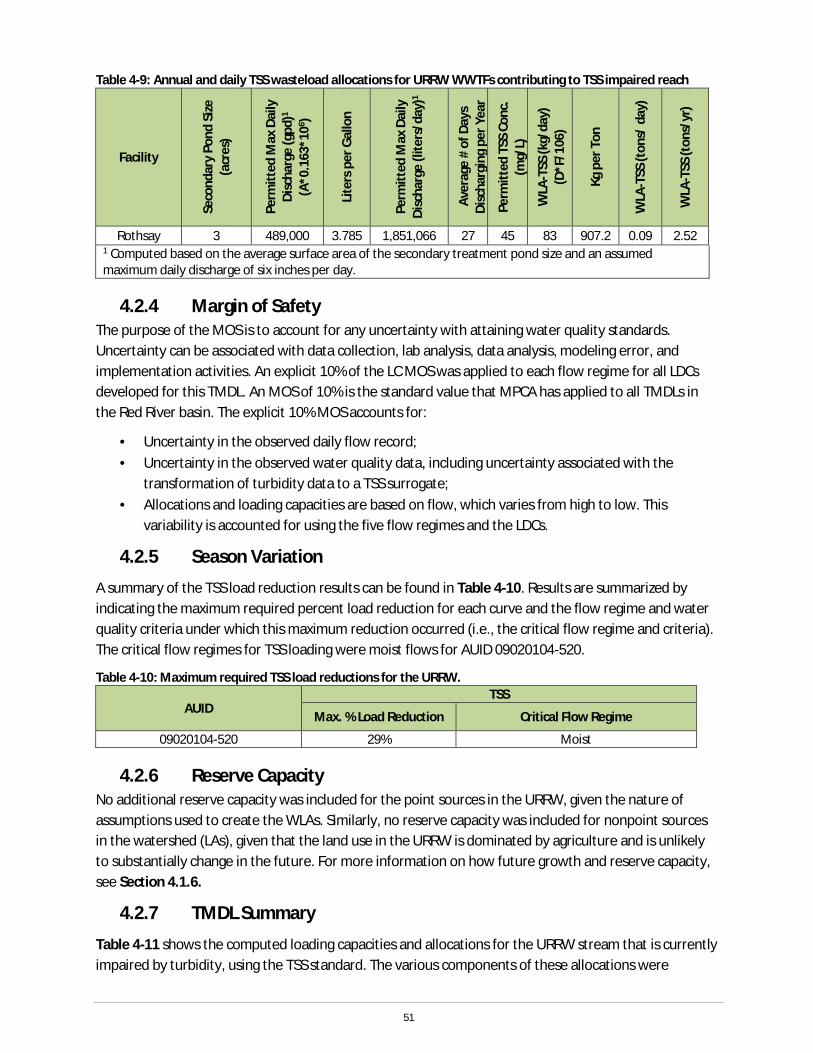
51
Table 4-9: Annual and daily TSS wasteload allocations for URRW WWTFs contributing to TSS impaired reach
Facility
Seco
ndar
y Po
nd S
ize
(acr
es)
Perm
itted
Max
Dai
ly
Disc
harg
e (g
pd)1
(A*0
.163
*106 )
Lite
rs p
er G
allo
n
Perm
itted
Max
Dai
ly
Disc
harg
e (li
ters
/day
)1
Aver
age
# of
Day
s Di
scha
rgin
g pe
r Yea
r
Perm
itted
TSS
Con
c.
(mg/
L)
WLA
-TSS
(kg/
day)
(D
*F/1
06)
Kg p
er T
on
WLA
-TSS
(ton
s/ d
ay)
WLA
-TSS
(ton
s/yr
)
Rothsay 3 489,000 3.785 1,851,066 27 45 83 907.2 0.09 2.52 1 Computed based on the average surface area of the secondary treatment pond size and an assumed maximum daily discharge of six inches per day.
4.2.4 Margin of Safety The purpose of the MOS is to account for any uncertainty with attaining water quality standards. Uncertainty can be associated with data collection, lab analysis, data analysis, modeling error, and implementation activities. An explicit 10% of the LC MOS was applied to each flow regime for all LDCs developed for this TMDL. An MOS of 10% is the standard value that MPCA has applied to all TMDLs in the Red River basin. The explicit 10% MOS accounts for:
· Uncertainty in the observed daily flow record; · Uncertainty in the observed water quality data, including uncertainty associated with the
transformation of turbidity data to a TSS surrogate; · Allocations and loading capacities are based on flow, which varies from high to low. This
variability is accounted for using the five flow regimes and the LDCs.
4.2.5 Season Variation
A summary of the TSS load reduction results can be found in Table 4-10. Results are summarized by indicating the maximum required percent load reduction for each curve and the flow regime and water quality criteria under which this maximum reduction occurred (i.e., the critical flow regime and criteria). The critical flow regimes for TSS loading were moist flows for AUID 09020104-520.
Table 4-10: Maximum required TSS load reductions for the URRW.
AUID TSS
Max. % Load Reduction Critical Flow Regime
09020104-520 29% Moist
4.2.6 Reserve Capacity No additional reserve capacity was included for the point sources in the URRW, given the nature of assumptions used to create the WLAs. Similarly, no reserve capacity was included for nonpoint sources in the watershed (LAs), given that the land use in the URRW is dominated by agriculture and is unlikely to substantially change in the future. For more information on how future growth and reserve capacity, see Section 4.1.6.
4.2.7 TMDL Summary
Table 4-11 shows the computed loading capacities and allocations for the URRW stream that is currently impaired by turbidity, using the TSS standard. The various components of these allocations were
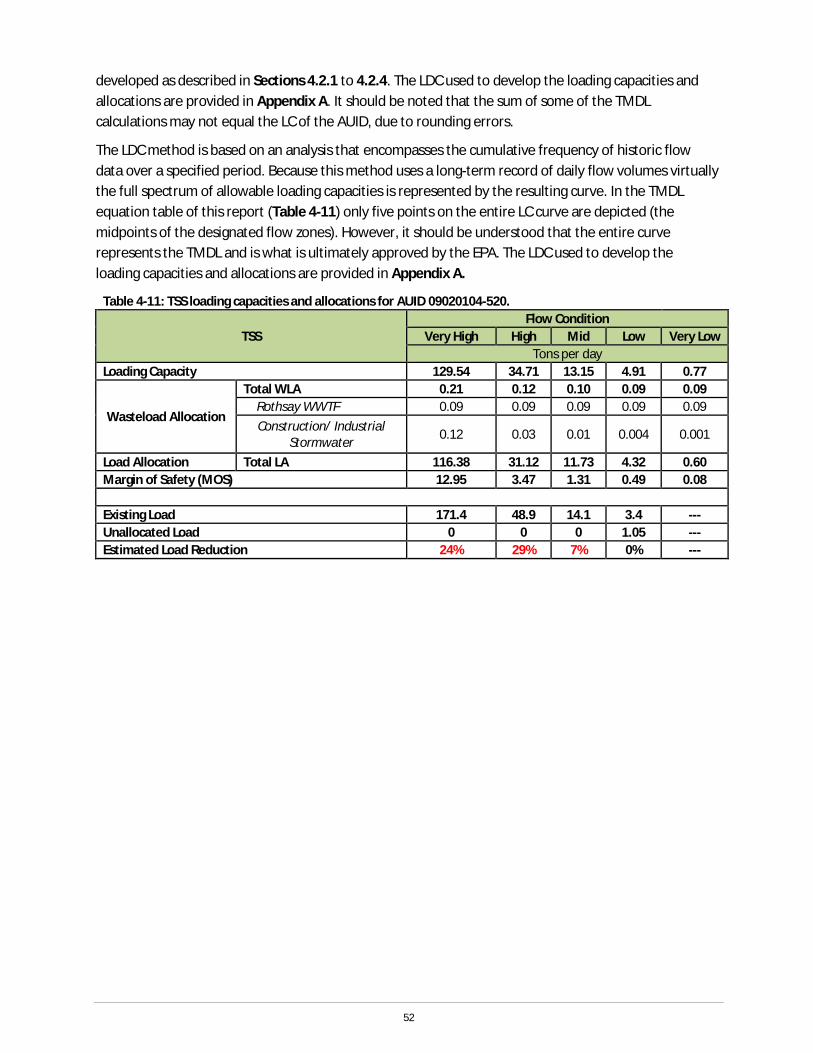
52
developed as described in Sections 4.2.1 to 4.2.4. The LDC used to develop the loading capacities and allocations are provided in Appendix A. It should be noted that the sum of some of the TMDL calculations may not equal the LC of the AUID, due to rounding errors.
The LDC method is based on an analysis that encompasses the cumulative frequency of historic flow data over a specified period. Because this method uses a long-term record of daily flow volumes virtually the full spectrum of allowable loading capacities is represented by the resulting curve. In the TMDL equation table of this report (Table 4-11) only five points on the entire LC curve are depicted (the midpoints of the designated flow zones). However, it should be understood that the entire curve represents the TMDL and is what is ultimately approved by the EPA. The LDC used to develop the loading capacities and allocations are provided in Appendix A.
Table 4-11: TSS loading capacities and allocations for AUID 09020104-520.
TSS Flow Condition
Very High High Mid Low Very Low Tons per day
Loading Capacity 129.54 34.71 13.15 4.91 0.77
Wasteload Allocation
Total WLA 0.21 0.12 0.10 0.09 0.09 Rothsay WWTF 0.09 0.09 0.09 0.09 0.09 Construction/ Industrial
Stormwater 0.12 0.03 0.01 0.004 0.001
Load Allocation Total LA 116.38 31.12 11.73 4.32 0.60 Margin of Safety (MOS) 12.95 3.47 1.31 0.49 0.08
Existing Load 171.4 48.9 14.1 3.4 --- Unallocated Load 0 0 0 1.05 --- Estimated Load Reduction 24% 29% 7% 0% ---
53
5 Future Growth Considerations The primary economic force in the URRW is agriculture. As the watershed is primarily agricultural, little change in land use is expected in the future. Like much of the Red River Valley, land use in the URRW has changed very little in recent years. Analysis of the 2001 and 2006 NLCD dataset show about 1% change in land uses in the URRW between the years. Most of this small changes occurred in increases in cropland and wetland areas and decreases in forest and urban areas.
Small changes are occurring in the demographics of the watershed. Rural areas have been experiencing a general decline in population since the 1960s, due to changes in farm practices and the difficulty in finding employment in small towns. Based on information from the Minnesota State Demographic Center, areas in the region that are more urban and more recreationally sought (lakes) are increasing in population and the more rural areas are decreasing (HEI 2010).
5.1 New or Expanding Permitted MS4 WLA Transfer Process Future transfer of watershed runoff loads in this TMDL may be necessary if any of the following scenarios occur within the project watershed boundaries:
1. New development occurs within a regulated MS4. Newly developed areas that are not already included in the WLA must be transferred from the LA to the WLA to account for the growth.
2. One regulated MS4 acquires land from another regulated MS4. Examples include annexation or highway expansions. In these cases, the transfer is WLA to WLA.
3. One or more non-regulated MS4s become regulated. If this has not been accounted for in the WLA, then a transfer must occur from the LA.
4. Expansion of a U.S. Census Bureau Urban Area encompasses new regulated areas for existing permittees. An example is existing state highways that were outside an Urban Area at the time the TMDL was completed, but are now inside a newly expanded Urban Area. This will require either a WLA to WLA transfer or a LA to WLA transfer.
5. A new MS4 or other stormwater-related point source is identified and is covered under a NPDES Permit. In this situation, a transfer must occur from the LA.
Load transfers will be based on methods consistent with those used in setting the allocations in this TMDL. In cases where WLA is transferred from or to a regulated MS4, the permittees will be notified of the transfer and have an opportunity to comment.
5.2 New or Expanding Wastewater The MPCA, in coordination with the U.S. EPA Region 5, has developed a streamlined process for setting or revising WLAs for new or expanding wastewater discharges to waterbodies with an EPA approved TMDL (MPCA 2012). This procedure will be used to update WLAs in approved TMDLs for new or expanding wastewater dischargers whose permitted effluent limits are at or below the instream target and will ensure that the effluent concentrations will not exceed applicable water quality standards or surrogate measures. The process for modifying any and all WLAs will be handled by the MPCA, with input and involvement by the U.S. EPA, once a permit request or reissuance is submitted. The overall process will use the permitting public notice process to allow for the public and U.S. EPA to comment on
54
the permit changes based on the proposed WLA modification(s). Once any comments or concerns are addressed, and the MPCA determines that the new or expanded wastewater discharge is consistent with the applicable water quality standards, the permit will be issued and any updates to the TMDL WLA(s) will be made.
For more information on the overall process, visit the MPCA’s TMDL Policy and Guidance webpage.

55
6 Reasonable Assurance Reasonable assurance of the load reductions and strategies developed under this TMDL comes from multiple sources. WLAs are assured through the issuance and regulation of NPDES Permits. LAs and their associated nonpoint source implementation strategies are reasonably assured by historic and ongoing collaborations in the watershed. Several agencies and local governmental units have been and continue to work toward the goal of reducing pollutant loads in the URRW. Strong partnerships between the BRRWD, counties, and soil and water conservation districts (SWCDs) have led to the implementation of conservation practices in the past and will continue to do so into the future. Upon approval of the TMDL by the EPA, the Buffalo Red River Watershed District (BRRWD) will incorporate the various implementation activities described by this TMDL into their WMP. The BRRWD is committed to taking a lead role during the implementation of this TMDL and has the ability to generate revenue and receive grants to finance the implementation items.
In addition to commitment from local agencies, the state of Minnesota has also made a commitment to protect and restore the quality of its waters. In 2008, Minnesota voters approved the Clean Water, Land, and Legacy Amendment to increase the state sales tax to fund water quality improvements. The interagency Minnesota Water Quality Framework (Figure 6-1) illustrates the cycle of assessment, watershed planning, and implementation to which the state is committed. The TMDL and WRAPS components provide data needed for local water planning to prioritize, target, and measure implementation efforts, to better achieve water quality goals (Steps C, D, and E). Funding to support implementation activities (Step A) under this framework is made available through Minnesota’s Board of Water and Soil Resources (BWSR), an agency that the BRRWD has received grants from in the past.
The Buffalo Red River Watershed has the ability to provide funding for projects consistent with those identified within the Watershed Management Plan. The Watershed Management Plan is required to be updated following a 10-year cycle and future revisions will include projects and methods to make progress toward implementing the TMDLs.
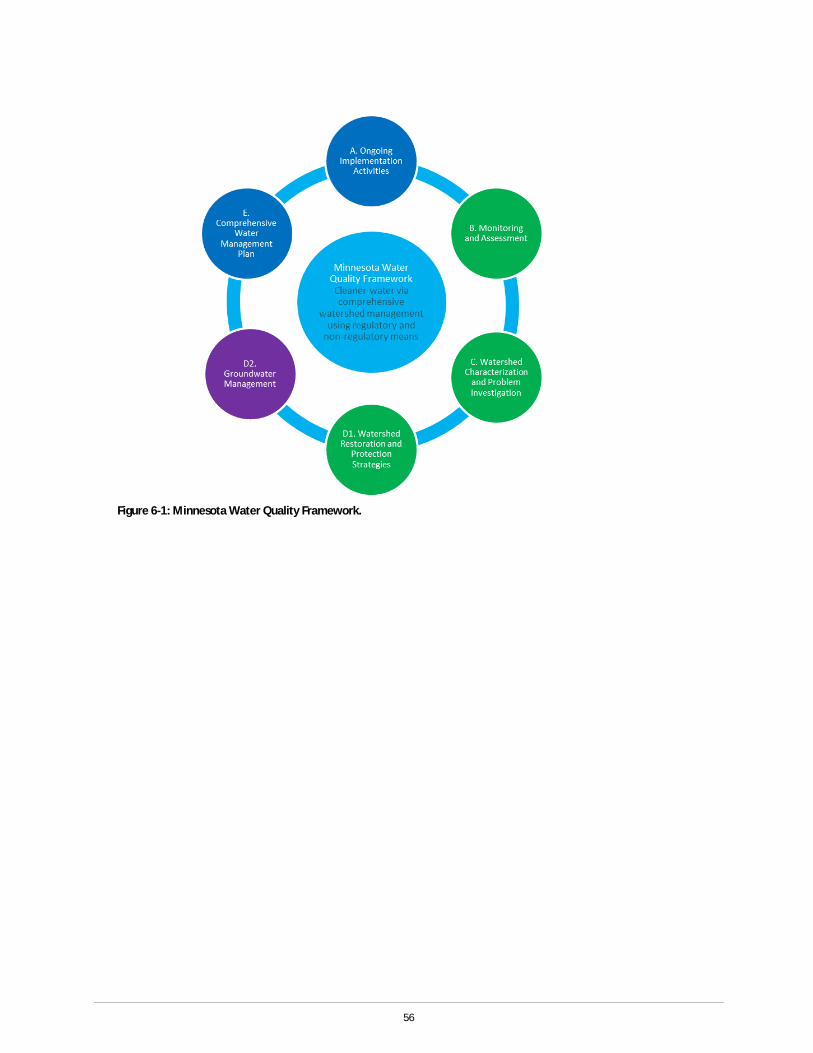
56
Figure 6-1: Minnesota Water Quality Framework.
57
7 Monitoring Plan Continued stream monitoring within the URRW will continue primarily through the efforts of the BRRWD. As outlined in Section 4.2 of the BRRWD WMP (HEI 2010b), the BRRWD has established regional assessment locations (RALs) in streams throughout the URRW, and are currently employing a water quality monitoring program that consists of financial support to the River Watch Program and International Water Institute. Samples are collected on (at least) a monthly basis from April through September. The samples are analyzed for turbidity, temperature, pH, DO, connectivity, chloride, nutrients, TSS and E. coli. In addition to the stream monitoring sponsored by the BRRWD, the MPCA also has on-going monitoring in the watershed. Their major watershed pollutant load monitoring will continue to provide a long-term on-going record of water quality at the URRW outlet.
The MPCA will return to the watershed under their Intensive Watershed Monitoring program in 2019 through 2020. The lakes of the URRW are not assessable, so there is no routine lake monitoring at this time.

58
8 Implementation Strategy Summary Water quality restoration and implementation strategies within the URRW were identified through collaboration with state and local partners. Due to the homogeneous nature of the watershed, most of the suggested strategies are applicable throughout the watershed.
The identified implementation strategies and priorities are discussed in the URRW WRAPS Report (HEI 2017 Draft) and the Upper Red River of the North Watershed Biotic SID Report (MPCA 2015). Below is a summary of the suggested strategies needed to achieve restoration goals in the URRW:
· Restore Wolverton Creek to re-establish a more natural functioning stream and floodplain for water quality improvement and improved habitat;
· Restore Whiskey Creek to re-establish a more natural functioning stream and floodplain for water quality improvement and improved habitat;
· Prevent or mitigate activities that will further alter the hydrology of the watershed, improve storage capacity within the watershed;
· Consider opportunities and options to attenuate peak flows and augment base flows in streams throughout the watershed;
· Consider implementation of previously identified regional retention sites in the URRW to restore watershed hydrology
· Re-establish natural functioning stream channels wherever possible using natural channel design principles;
· Increase the quantity and quality of instream habitat throughout the watershed;
· Establish and/or protect riparian corridors along all waterways, including ditches, using native vegetation whenever possible;
· Implement agricultural Best Management Practices (BMPs) to reduce soil erosion and sedimentation; and
· Limit or exclude the access of livestock to waterways.
Current state programs and resources exist that provide implementation support to achieve restoration goals in the URRW. For example, the Minnesota Agricultural Water Quality Certification Program (MAWQCP) is open for enrollment and is a voluntary opportunity for farmers and agricultural landowners to take the lead in implementing conservation practices that protect water; producers seeking certification can obtain specially designated technical and financial assistance to implement practices that promote water quality (http://www.mda.state.mn.us/awqcp).
In addition, the Agricultural BMPs Handbook for Minnesota provides detailed information on specific BMPs and conservation practices that may be suitable for implementation. (http://www.mda.state.mn.us/protecting/cleanwaterfund/research/agbmphandbook.aspx).
59
8.1 Permitted Sources
8.1.1 Construction Stormwater
The WLA for stormwater discharges from sites where there is construction activity reflects the number of construction sites greater than one acre expected to be active in the watershed at any one time, and the BMPs and other stormwater control measures that should be implemented at the sites to limit the discharge of pollutants of concern. The BMPs and other stormwater control measures that should be implemented at construction sites are defined in the State's NPDES/SDS General Stormwater Permit for Construction Activity (MNR100001). If a construction site owner/operator obtains coverage under the NPDES/SDS General Stormwater Permit and properly selects, installs and maintains all BMPs required under the permit, including those related to impaired waters discharges and any applicable additional requirements found in Appendix A of the Construction General Permit, the stormwater discharges would be expected to be consistent with the WLA in this TMDL. All local construction stormwater requirements must also be met.
8.1.2 Industrial Stormwater
The WLA for stormwater discharges from sites where there is industrial activity reflects the number of sites in the watershed for which NPDES Industrial Stormwater Permit coverage is required, and the BMPs and other stormwater control measures that should be implemented at the sites to limit the discharge of pollutants of concern. The BMPs and other stormwater control measures that should be implemented at the industrial sites are defined in the State's NPDES/SDS Industrial Stormwater Multi- Sector General Permit (MNR050000) or NPDES/SDS General Permit for Construction Sand & Gravel, Rock Quarrying and Hot Mix Asphalt Production facilities (MNG490000). If a facility owner/operator obtains stormwater coverage under the appropriate NPDES/SDS Permit and properly selects, installs and maintains all BMPs required under the permit, the stormwater discharges would be expected to be consistent with the WLA in this TMDL. All local stormwater management requirements must also be met.
8.1.3 MS4
The city of Moorhead is the only MS4 in the URRW; however, it is not in the impaired subwatersheds, therefore no implementation strategies were developed for MS4s in the URRW.
8.1.4 Wastewater
The requirements of the WWTFs’ NPDES permits along with the WLAs should be sufficient implementation strategies for the WWTFs in the watershed. If a WWTF follows all requirements under the NPDES Wastewater Permit, the wastewater would be expected to be consistent with the WLA in this TMDL.
8.2 Non-Permitted Sources The BRRWD and the Wilkin, Clay, and West Otter Tail SWCDs have a long history of improving water quality. All three have been actively seeking grants to improve local water quality since the passage of the Clean Water, Land and Legacy Amendment, and before.
60
In 2007, the Clay SWCD received funds to work on installing sediment controls along Wolverton Creek. In partnership with the BRRWD and Wilkin SWCD, the Clay SWCD grant was used to install a series of 13 grade control rock riffles, 9 stream barbs, and 4 side inlet structures along the portion of Wolverton Creek downstream of Highway No. 75. The lower reach of Wolverton Creek was downcutting and this project prevented additional downcutting of the channel. As part of that grant, the Wolverton Creek channel was surveyed for future restoration work.
Through a 2011 Clean Water Fund grant, the BRRWD partnered again with the Wilkin and Clay SWCDs to complete work along Wolverton Creek. The funding was used to install a number of side inlet structures, buffer strips, and outlet grade control on public drainage systems within the Wolverton Creek subwatershed. Based on the previous survey, the BRRWD developed a plan to restore over 26 miles of the Wolverton Creek. The expected sediment loading reduction is in the range of 6,000 to 7,000 tons/year. The BRRWD is currently seeking outside funding to complete this $8-$10 Million project.
In 2014, Otter Tail County started their buffer initiative. The County planned to buffer all streams over the course of five years. In 2015, the West Otter Tail SWCD was granted $290,616 to assist with that effort through a Clean Water Fund Soil Erosion and Drainage Law Compliance grant. The 2015 Governor’s Buffer Initiative signed into law during the 2015 Special Session will result in additional funding to all SWCDs within the URRW (and statewide) to accelerate implementation of buffers along all legal ditches and Public Waters. All public drainage systems must be buffered by November 2018 and all Public Waters must be buffered by November 2017.
The Wilkin County SWCD has received grant funding for retrofitting legal ditch systems within the Whiskey Creek Watershed. A 2010 CWF grant for $256,410 was leveraged with $119,500 in local funds to install 14 miles of buffer strips and berms, and 56 side inlet sediment control structures along 14 miles of ditch system with an expected sediment reduction of 300 tons/year. A 2012 CWF grant for $294,506 was leveraged with $240,500 to install 6.5 miles of berms and side inlet sediment controls and 25 acres of buffer strips along the Connelly Ditch (Wilkin County Ditch No. 31). This project is expected to reduce sediment by 335 tons/year and reduce peak flows by 50% to 75%. A 2014 CWF grant is being used to install grade control on gullies flowing to the Red River
The success of the ditch retrofit BMP projects installed by Wilkin County has resulted in the county moving forward with completing the retrofits on all ditch systems within the URRW in Wilkin County, regardless of whether outside CWF grant were available. As of 2015, Wilkin County had two remaining systems in the Whiskey Creek Watershed that needed retrofits: Wilkin County Ditches Nos. 34 and 1-C. These systems are currently under construction.
In 2012, the BRRWD completed a redetermination of benefits for Clay County Ditches Nos. 40, 11 (North and South), 36, and 60. As part of this work, buffer strips and side inlet culverts were installed. The BRRWD plans to install buffers on Wilkin County Ditch No. 22 Laterals Nos. 1 and 2, and Wilkin County Ditches No. 5A and 26 in 2015.
In 2013, the BRRWD was awarded a $333,590 CWF grant to retrofit Clay County Ditches Nos. 9, 32, and 33. The grant funding was supplemented with an additional $256,120 of local funding for the work as well. The work resulted in 40 acres of new buffer strips and 179 side inlet sediment control structures which are expected to reduce sediment loss to the Red River by 1,942 tons/year and phosphorus loss by 2,729 lbs. per year.
61
These ditch retrofit projects reduce the amount of sediment loading reaching Whiskey Creek, Wolverton Creek, and the Red River and will help address the turbidity/TSS impairments throughout the watershed and reduce the elevated turbidity stressors on biological impairments. In addition, the berms and side inlet culverts installed as part of these projects temporarily detain surface runoff, helping reduce the altered hydrology stressors identified in the SID Report (MPCA 2014b).
In addition to the Clean Water Fund supported efforts in the URRW, in 2013, the BRRWD in partnership with the Wilkin and West Otter Tail SWCDs, agreed to submit the Whiskey Creek/Wilkin County Ditch No. 31 watershed as a pilot for the Minnesota Agricultural Water Quality Certification Program. The program encourages farm producers to implement conservation BMPs that will improve the water quality of runoff leaving their fields. Using existing USDA Farm Bill programs and state cost share a number of conservation practices have been installed. As of June 2017, 13 agricultural producers had been certified by this program resulting in 9,424 certified acres in the URRW.
In 2015 in partnership with Wilkin County, the BRRWD completed a one-mile restoration of Whiskey Creek. This restoration created a two-stage natural design channel with a permanently protected expanded riparian buffer. Side inlet sediment controls also were installed along the channel. Cost for this restoration was $60,000.
The BRRWD has identified three regional retention sites within the URRW. These sites have been identified and preliminary hydrologic design work has been completed. The sites have been located to provide flood damage reduction benefits, which would address the altered hydrology identified in the SID Report for the URRW. Significant effort and funding would be required to implement these sites. Each site would have an approximate cost of $10 to $15 Million.
8.3 Cost The CWLA requires that a TMDL study include an overall approximation of implementation costs (Minn. Stat. 2007, § 114D.25). Based on cost estimates from current, planned and proposed work (listed above) in the URRW, a reasonable estimate to continue efforts for reducing sediment and bacterial loading in the impaired reaches, addressed in this study, would be $20 to $30 million dollars over 10 years. These dollars would be spent primarily on practices such as restoration of Whiskey and Wolverton Creek, regional retention projects, riparian vegetative buffers, sediment BMPs (water and sediment control basins and side inlets), pasture management, conservation tillage, vegetative practices, wetland restorations, and structural practices.
8.4 Adaptive Management Adaptive management is an iterative implementation process that makes progress toward achieving water quality goals while using any new data and information to reduce uncertainty and adjust implementation activities. It is an ongoing process of evaluating and adjusting the strategies and activities that will be developed to implement the TMDL. The implementation of practicable controls should take place even while additional data collection and analysis are conducted to guide future implementation actions. Adaptive management does not include changes to water quality standards or LC. Any changes to water quality standards or LC must be preceded by appropriate administrative processes; including public notice and an opportunity for public review and comment.
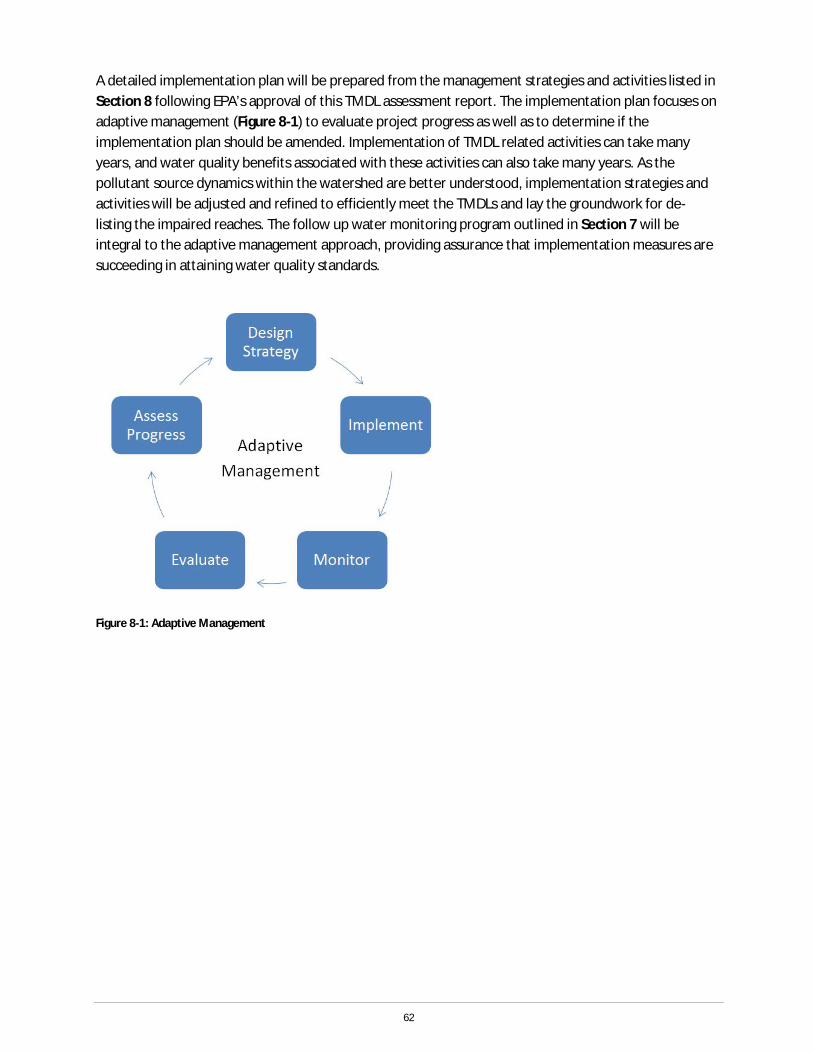
62
A detailed implementation plan will be prepared from the management strategies and activities listed in Section 8 following EPA’s approval of this TMDL assessment report. The implementation plan focuses on adaptive management (Figure 8-1) to evaluate project progress as well as to determine if the implementation plan should be amended. Implementation of TMDL related activities can take many years, and water quality benefits associated with these activities can also take many years. As the pollutant source dynamics within the watershed are better understood, implementation strategies and activities will be adjusted and refined to efficiently meet the TMDLs and lay the groundwork for de-listing the impaired reaches. The follow up water monitoring program outlined in Section 7 will be integral to the adaptive management approach, providing assurance that implementation measures are succeeding in attaining water quality standards.
Figure 8-1: Adaptive Management
63
9 Public Participation Public participation (i.e., civic engagement) during this TMDL process was led by the BRRWD. A TMDL stakeholder group was identified early in the TMDL process and kept up to date of actions as the project proceeded. Members of the group included area landowners, representatives from the area SWCDs, counties and townships, representatives from state agencies (MPCA, DNR, BWSR), and board members of the BRRWD. TMDL updates were regularly presented through open houses and public meetings in the watershed. In addition, the BRRWD developed a project webpage (http://www.brrwd.org/) where updates and select reports were posted. The MPCA also developed a project webpage4 to keep the public informed of progress.
An open house style “kickoff meeting” was held at the Barnesville office of the BRRWD on June 14, 2012, for interested stakeholders and resource managers to become familiar with the WRAPS and TMDL process for the URRW. Similarly, another open house was held on January 7, 2016, for reviewing findings of and draft documents for the WRAPS and TMDLs. A Technical Stakeholder Group (TSG) was developed to share local knowledge about problems and to guide the development of potential implementation strategies based on technical data. The WRAPS TSG included representatives from the BRRWD, the SWCDs, and state agencies. This group was primarily engaged to discuss potential products developed to identify geographic areas for implementing projects.
Since water quality is among the ongoing priorities of the BRRWD’s management activities, future civic engagement will continue to go through the District. The BRRWD will update, educate, and engage stakeholders on water quality issues through the normal District communications, including plan update events and on their website. As one of most trusted authorities on water issues in the area (U of MN WRC 2012), the BRRWD is uniquely suited to provide information and leadership on this topic.
Public Notice An opportunity for public comment on the draft TMDL report was provided via a public notice in the State Register from July 24, 2017 to August 23, 2017.
4 http://www.pca.state.mn.us/index.php/water/water-types-and-programs/watersheds/upper-red-river-of-the-north.html

64
10 Literature Cited Houston Engineering, Inc. (HEI). 2010. Buffalo-Red River Watershed District Revised Watershed
Management Plan. June 23, 2010.
Houston Engineering, Inc. (HEI). 2012. Watershed Conditions Report-Upper Red River Watershed. Report submitted to the MPCA and Buffalo-Red River Watershed District. 134pp.
Houston Engineering, Inc. (HEI). 2013. Red River bacterial impairments & urban sources of bacteria in the Moorhead area. Technical Memorandum to the MPCA.
Houston Engineering, Inc. (HEI). 2014. Upper Red River Watershed Watershed Restoration & Protection Project: Load Duration Curves for Wolverton Creek & Whiskey Creek. February 2014.
Houston Engineering, Inc. (HEI). 2014. PTMA BMPs and Measurement Methods. Technical Memorandum to the MPCA.
Houston Engineering, Inc. (HEI). 2015. Upper Red River of the North Watershed Restoration and Protection Strategy. Draft Document.
Minnesota Pollution Control Agency (MPCA). 2013. Upper Red River of the North Watershed Monitoring and Assessment Report. January 2013.
Minnesota Pollution Control Agency (MPCA). 2015. Upper Red River of the North Watershed Biotic Stressor Identification Report. April 2015.
University of Minnesota Water Resources Center (U of MN WRC). 2012. BRRWD Social Indicators Survey Final Report. May 30, 2012.

65
Appendices
Upper Red River Watershed
Watershed Restoration & Protection Project
Load Duration Curves for Wolverton Creek & Whiskey Creek
Revised Final Report
December 10, 2015
Submitted to:
Minnesota Pollution Control Agency 714 Lake Ave, Suite 220 Detroit Lakes, MN 56501
Buffalo-Red River Watershed District 114 Front Street South Barnesville, MN 56514
Submitted by:
6901 E. Fish Lake Road, Suite 140 Maple Grove, MN 55369 Ph. (763) 493-4522
i | P a g e
Table of Contents
1 Introduction ........................................................................................................................................................... 1
2 Methodology ......................................................................................................................................................... 3
2.1 Data .............................................................................................................................................................. 3
2.2 Bacterial LDCs ............................................................................................................................................... 4
2.3 Turbidity using TSS Surrogate LDCs .............................................................................................................. 5
2.4 Proposed TSS Standard LDCs........................................................................................................................ 5
3 Results ................................................................................................................................................................... 6
4 Load Reductions .................................................................................................................................................... 9
4.1 Bacteria ........................................................................................................................................................ 9
4.2 Turbidity using TSS Surrogate and Proposed TSS Standard ....................................................................... 11
4.3 Critical Condition ........................................................................................................................................ 11
5 Conclusion ........................................................................................................................................................... 12
6 References ........................................................................................................................................................... 13

ii | P a g e
List of Tables
Table 1. AUID, water quality, and flow location information. ....................................................................................... 1
Table 2. Water quality data used for each AUID. .......................................................................................................... 4
Table 3. Example bacterial load reduction table (AUID 09020106-520) ..................................................................... 10
Table 4. Example turbidity using TSS surrogate load reduction table (AUID 09020106-520) ..................................... 10
Table 5. Example proposed TSS standard load reduction table (AUID 09020106-520) .............................................. 10
Table 6. Maximum required bacterial and TSS load reductions for Wolverton and Whiskey creeks. ........................ 11
List of Figures
Figure 1. Wolverton and Whiskey Creeks, water quality monitoring locations, and USGS flow monitoring stations
used for LDCs in the URRW............................................................................................................................................ 2
Figure 2. Wolverton Creek AUID 09020106-512 bacterial LDC ..................................................................................... 6
Figure 3. Whiskey Creek AUID 09020106-520 bacterial LDC ......................................................................................... 7
Figure 4. Whiskey Creek AUID 09020106-520 turbidity using TSS surrogate LDC ......................................................... 8
Figure 5. Whiskey Creek AUID 09020106-520 proposed TSS standard LDC. ................................................................. 9
iii | P a g e
Acronyms and Abbreviations List
AUID Assessment Unit ID EQuIS Environmental Quality Information System FNU Formazin Nephelometric Units LDC Load Duration Curve MPCA Minnesota Pollution Control Agency NCHF North Central Hardwood Forest NTU Nephelometric Turbidity Units NTRU Nephelometric Turbidity Ratio Units TMDL Total Maximum Daily Load TSS Total Suspended Solids URRW Upper Red River Watershed USEPA United States Environmental Protection Agency WRAP Watershed Restoration and Protection
1 | P a g e
1 INTRODUCTION
This report summarizes the methods used and results for load duration curves (LDCs) for the Wolverton and
Whiskey Creek impaired stream segments (delineated by assessment unit ID (AUID) in the Upper Red River
Watershed (URRW)). Both of the creeks are impaired for aquatic recreation due to elevated bacteria levels;
Whiskey Creek is also impaired for aquatic life due to high turbidity. A dual endpoint TMDL will be performed for
Whiskey Creek for both turbidity and total suspended solids (TSS) impairments. As a result, LDCs have been
created using both the current turbidity standard as well as the proposed TSS standard. Results of the LDC analysis
include estimating the necessary load reductions within each flow regime, which will be used to establish the total
maximum daily loads (TMDLs) for these waterbodies. The efforts in this report were performed under Task 2 of
Phase II of the URRW Watershed Restoration and Protection (WRAP) project. A list of the AUIDs addressed in this
report is included in Table 1. Also included is a list of water quality monitoring stations located within each creek
and the associated USGS flow monitoring stations used to estimate loading and determine load reductions. The
creeks, monitoring locations, and USGS monitoring stations are also shown in Figure 1.
Table 1. AUID, water quality, and flow location information.
AUID (09020104-XXX)
Waterbody Stressors Water Quality Stations USGS Flow Station
512 Wolverton Creek
E. coli S002-103, S003-271, S004-880, S005-136, S005-322
05053000
520 Whiskey Creek
Fecal coliform, Turbidity
S001-032, S001-060, S001-061, S002-004, S003-678, S004-881
05061500

2 | P a g e
Figure 1. Wolverton and Whiskey Creeks, water quality monitoring locations, and USGS flow monitoring stations used for LDCs in the URRW.

3 | P a g e
2 METHODOLOGY
LDCs were developed for both Wolverton and Whiskey Creeks. Neither of the two creeks has a continuous flow
record, which is needed to calculate LDCs. In addition, no modeled continuous flow data are available for these
systems during the time that water quality data are available. As such, it was decided to use observed flow data at
nearby continuous flow stations and the drainage area ratio method to estimate hydrographs of Wolverton and
Whiskey Creeks for the purpose of creating the LDCs. The drainage area ratio method was deemed appropriate for
developing the LDCs because, when using LDCs to develop TMDLs, the overall magnitude of the flows used is less
important than the pattern of flow throughout the year (USEPA, 2007). The drainage area ratio method uses the
same flow values to estimate observed and allowable loads, resulting in equivalent percent load reductions
regardless of flow magnitude and provides a suitable alternative in the absence of observed flows. Using an
appropriate nearby waterbody with similar flow patterns is important because the overall flow pattern determines
the nature of the load duration.
Nearby subwatersheds with continuous flow data and assumed similar flow patterns to those in Wolverton and
Whiskey Creeks were identified and are further discussed below in Section 2.1. The drainage area ratio method
was then used to estimate mean daily flows in the Wolverton and Whiskey Creek subwatersheds, based on the
observed flows from the identified subwatersheds. Flows from the South Branch of the Buffalo River subwatershed
(USGS station 05061500) were used to estimate flows in Wolverton Creek. Data from the Wild Rice River
subwatershed (USGS station 05053000) were used to estimate flows in Whiskey Creek. The location of these
stations, relative to their respective LDCs, is shown on Figure 1.
The Wolverton and Whiskey Creek AUID LDCs were then developed by combining the estimated flows with the
observed water quality data in each AUID. Methods detailed in the US Environmental Protection Agency (USEPA)
document An Approach for Using Load Duration Curves in the Development of TMDLs were used in creating the
curves (USEPA, 2007). A summary of the methods applied in the URRW are provided below.
2.1 Data
Regional topography, hydrology, and seasonal flow patterns were considered when identifying nearby systems
with continuous flow data for use in estimating flows Whiskey and Wolverton Creeks. It was determined that the
flow patterns in Whiskey Creek are similar to those in the South Branch of the Buffalo River. Therefore continuous
flow data from the USGS gaging station at Sabin, MN was used to represent flows in Whiskey Creek (Figure 1). The
Wolverton Creek system, however, is more ephemeral in nature and tends to dry up in the fall. When compared to
the South Branch of the Buffalo River, the Wild Rice River, in North Dakota, shows a more frequent pattern of
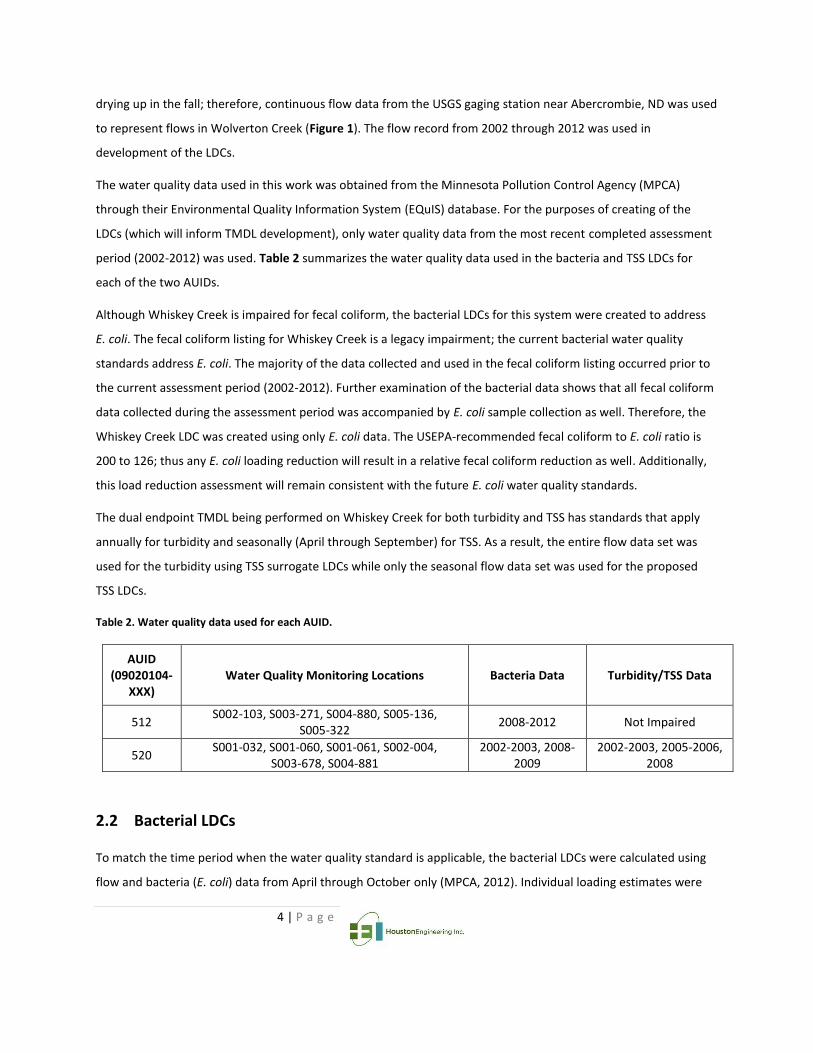
4 | P a g e
drying up in the fall; therefore, continuous flow data from the USGS gaging station near Abercrombie, ND was used
to represent flows in Wolverton Creek (Figure 1). The flow record from 2002 through 2012 was used in
development of the LDCs.
The water quality data used in this work was obtained from the Minnesota Pollution Control Agency (MPCA)
through their Environmental Quality Information System (EQuIS) database. For the purposes of creating of the
LDCs (which will inform TMDL development), only water quality data from the most recent completed assessment
period (2002-2012) was used. Table 2 summarizes the water quality data used in the bacteria and TSS LDCs for
each of the two AUIDs.
Although Whiskey Creek is impaired for fecal coliform, the bacterial LDCs for this system were created to address
E. coli. The fecal coliform listing for Whiskey Creek is a legacy impairment; the current bacterial water quality
standards address E. coli. The majority of the data collected and used in the fecal coliform listing occurred prior to
the current assessment period (2002-2012). Further examination of the bacterial data shows that all fecal coliform
data collected during the assessment period was accompanied by E. coli sample collection as well. Therefore, the
Whiskey Creek LDC was created using only E. coli data. The USEPA-recommended fecal coliform to E. coli ratio is
200 to 126; thus any E. coli loading reduction will result in a relative fecal coliform reduction as well. Additionally,
this load reduction assessment will remain consistent with the future E. coli water quality standards.
The dual endpoint TMDL being performed on Whiskey Creek for both turbidity and TSS has standards that apply
annually for turbidity and seasonally (April through September) for TSS. As a result, the entire flow data set was
used for the turbidity using TSS surrogate LDCs while only the seasonal flow data set was used for the proposed
TSS LDCs.
Table 2. Water quality data used for each AUID.
AUID (09020104-
XXX) Water Quality Monitoring Locations Bacteria Data Turbidity/TSS Data
512 S002-103, S003-271, S004-880, S005-136,
S005-322 2008-2012 Not Impaired
520 S001-032, S001-060, S001-061, S002-004,
S003-678, S004-881 2002-2003, 2008-
2009 2002-2003, 2005-2006,
2008
2.2 Bacterial LDCs
To match the time period when the water quality standard is applicable, the bacterial LDCs were calculated using
flow and bacteria (E. coli) data from April through October only (MPCA, 2012). Individual loading estimates were
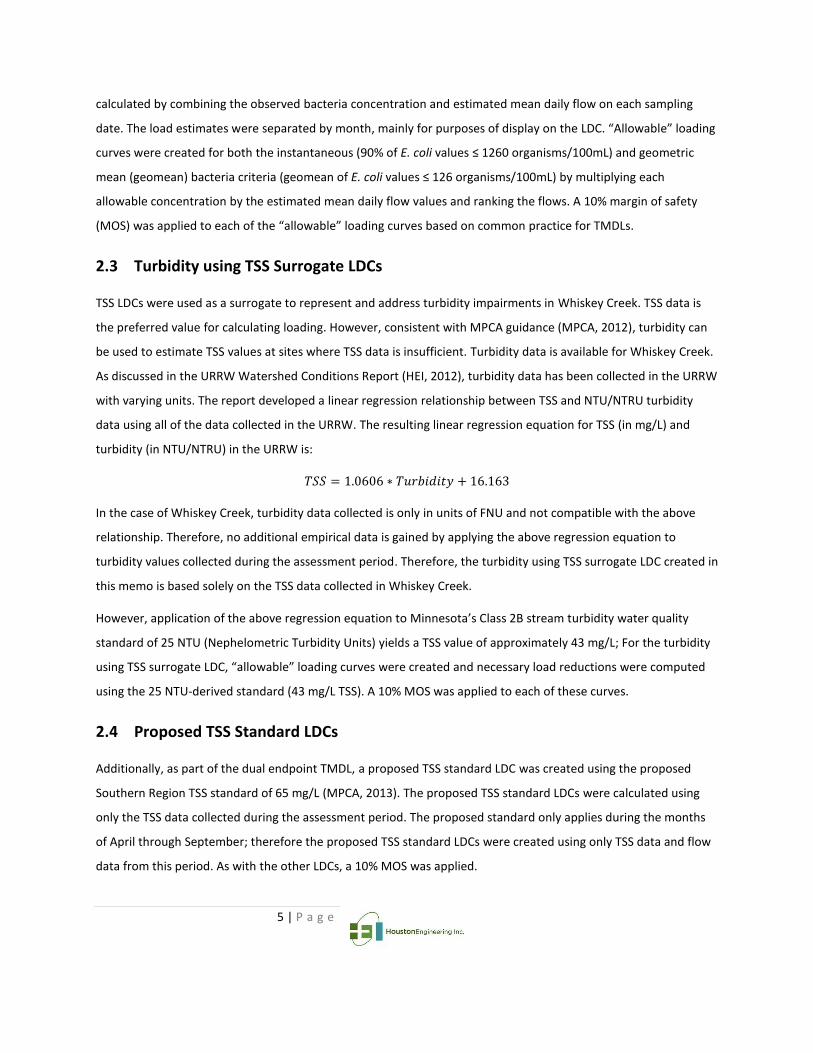
5 | P a g e
calculated by combining the observed bacteria concentration and estimated mean daily flow on each sampling
date. The load estimates were separated by month, mainly for purposes of display on the LDC. “Allowable” loading
curves were created for both the instantaneous (90% of E. coli values ≤ 1260 organisms/100mL) and geometric
mean (geomean) bacteria criteria (geomean of E. coli values ≤ 126 organisms/100mL) by multiplying each
allowable concentration by the estimated mean daily flow values and ranking the flows. A 10% margin of safety
(MOS) was applied to each of the “allowable” loading curves based on common practice for TMDLs.
2.3 Turbidity using TSS Surrogate LDCs
TSS LDCs were used as a surrogate to represent and address turbidity impairments in Whiskey Creek. TSS data is
the preferred value for calculating loading. However, consistent with MPCA guidance (MPCA, 2012), turbidity can
be used to estimate TSS values at sites where TSS data is insufficient. Turbidity data is available for Whiskey Creek.
As discussed in the URRW Watershed Conditions Report (HEI, 2012), turbidity data has been collected in the URRW
with varying units. The report developed a linear regression relationship between TSS and NTU/NTRU turbidity
data using all of the data collected in the URRW. The resulting linear regression equation for TSS (in mg/L) and
turbidity (in NTU/NTRU) in the URRW is:
𝑇𝑆𝑆 = 1.0606 ∗ 𝑇𝑢𝑟𝑏𝑖𝑑𝑖𝑡𝑦 + 16.163
In the case of Whiskey Creek, turbidity data collected is only in units of FNU and not compatible with the above
relationship. Therefore, no additional empirical data is gained by applying the above regression equation to
turbidity values collected during the assessment period. Therefore, the turbidity using TSS surrogate LDC created in
this memo is based solely on the TSS data collected in Whiskey Creek.
However, application of the above regression equation to Minnesota’s Class 2B stream turbidity water quality
standard of 25 NTU (Nephelometric Turbidity Units) yields a TSS value of approximately 43 mg/L; For the turbidity
using TSS surrogate LDC, “allowable” loading curves were created and necessary load reductions were computed
using the 25 NTU-derived standard (43 mg/L TSS). A 10% MOS was applied to each of these curves.
2.4 Proposed TSS Standard LDCs
Additionally, as part of the dual endpoint TMDL, a proposed TSS standard LDC was created using the proposed
Southern Region TSS standard of 65 mg/L (MPCA, 2013). The proposed TSS standard LDCs were calculated using
only the TSS data collected during the assessment period. The proposed standard only applies during the months
of April through September; therefore the proposed TSS standard LDCs were created using only TSS data and flow
data from this period. As with the other LDCs, a 10% MOS was applied.
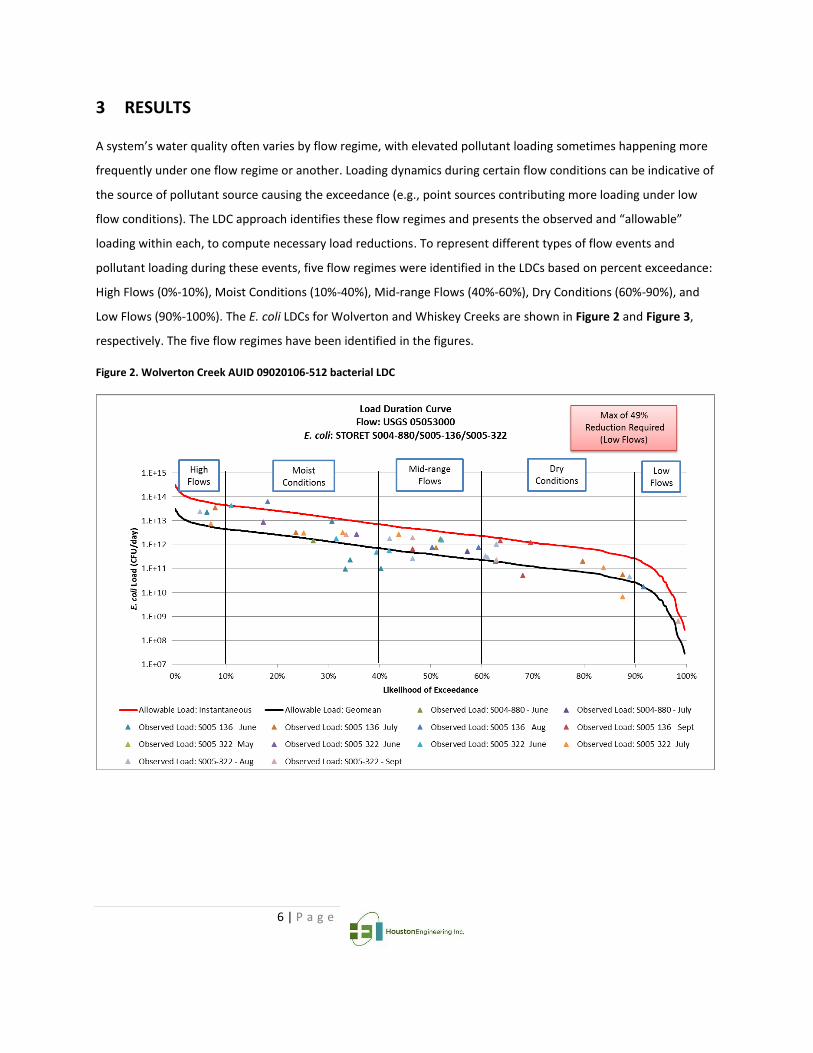
6 | P a g e
3 RESULTS
A system’s water quality often varies by flow regime, with elevated pollutant loading sometimes happening more
frequently under one flow regime or another. Loading dynamics during certain flow conditions can be indicative of
the source of pollutant source causing the exceedance (e.g., point sources contributing more loading under low
flow conditions). The LDC approach identifies these flow regimes and presents the observed and “allowable”
loading within each, to compute necessary load reductions. To represent different types of flow events and
pollutant loading during these events, five flow regimes were identified in the LDCs based on percent exceedance:
High Flows (0%-10%), Moist Conditions (10%-40%), Mid-range Flows (40%-60%), Dry Conditions (60%-90%), and
Low Flows (90%-100%). The E. coli LDCs for Wolverton and Whiskey Creeks are shown in Figure 2 and Figure 3,
respectively. The five flow regimes have been identified in the figures.
Figure 2. Wolverton Creek AUID 09020106-512 bacterial LDC
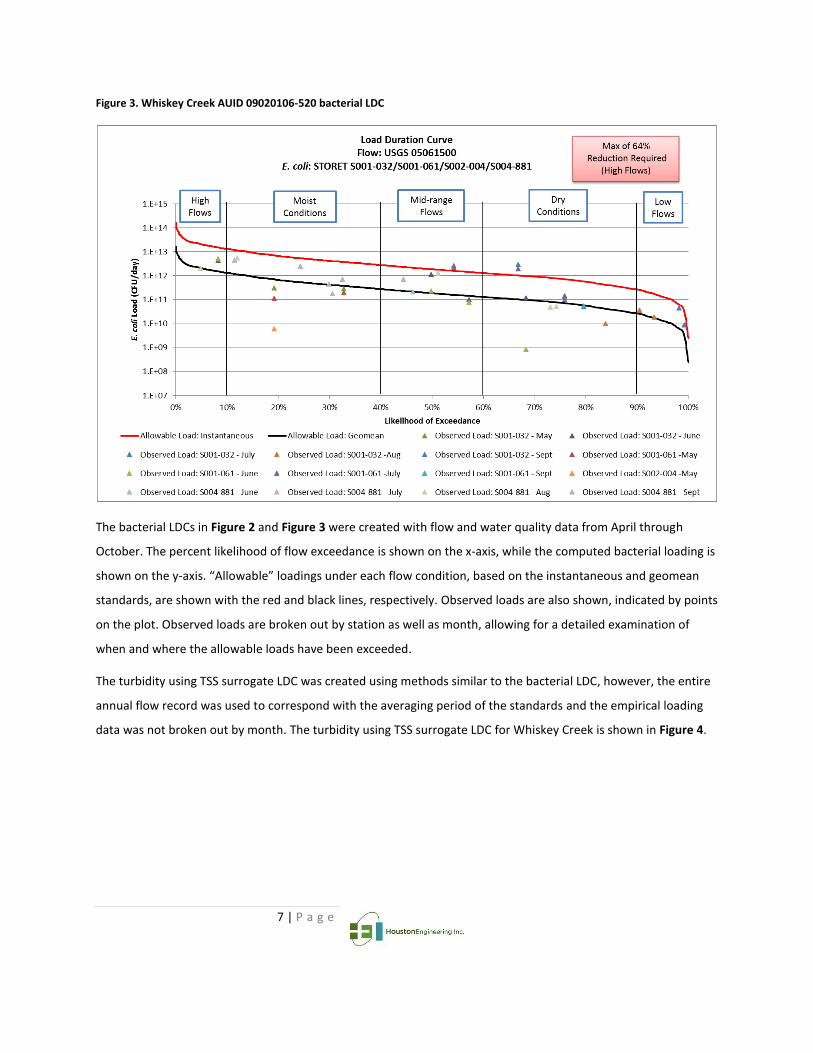
7 | P a g e
Figure 3. Whiskey Creek AUID 09020106-520 bacterial LDC
The bacterial LDCs in Figure 2 and Figure 3 were created with flow and water quality data from April through
October. The percent likelihood of flow exceedance is shown on the x-axis, while the computed bacterial loading is
shown on the y-axis. “Allowable” loadings under each flow condition, based on the instantaneous and geomean
standards, are shown with the red and black lines, respectively. Observed loads are also shown, indicated by points
on the plot. Observed loads are broken out by station as well as month, allowing for a detailed examination of
when and where the allowable loads have been exceeded.
The turbidity using TSS surrogate LDC was created using methods similar to the bacterial LDC, however, the entire
annual flow record was used to correspond with the averaging period of the standards and the empirical loading
data was not broken out by month. The turbidity using TSS surrogate LDC for Whiskey Creek is shown in Figure 4.

8 | P a g e
Figure 4. Whiskey Creek AUID 09020106-520 turbidity using TSS surrogate LDC
The black line in the turbidity using TSS surrogate LDC represents the “allowable” load based on the URRW
turbidity/TSS relationship of 25 NTU to 43 mg/L.
The proposed TSS standard LDC was also created using similar methods, however, only the seasonal (April through
September) flow record was used. The proposed TSS standard LDC for Whiskey Creek is shown in Figure 5.

9 | P a g e
Figure 5. Whiskey Creek AUID 09020106-520 proposed TSS standard LDC.
The red line in the proposed TSS standard LDC represents the “allowable” load based on the proposed Southern
Region TSS standard of 65 mg/L.
4 LOAD REDUCTIONS
4.1 Bacteria
Total required bacterial load reductions (in organisms/day) and percent load reductions were calculated for each
curve, using both the geomean and instantaneous criteria. Methods outlined in the USEPA guidance document
(USEPA, 2007) were followed, computing observed and “allowable” loads for each flow regime by combining the
median flow in each regime with the applicable water quality criteria and/or representative observed E. coli
concentration. An example of this process is shown in Table 3. The reduction for each criterion (in each flow
regime) is determined using the difference between the observed and “allowable” values.
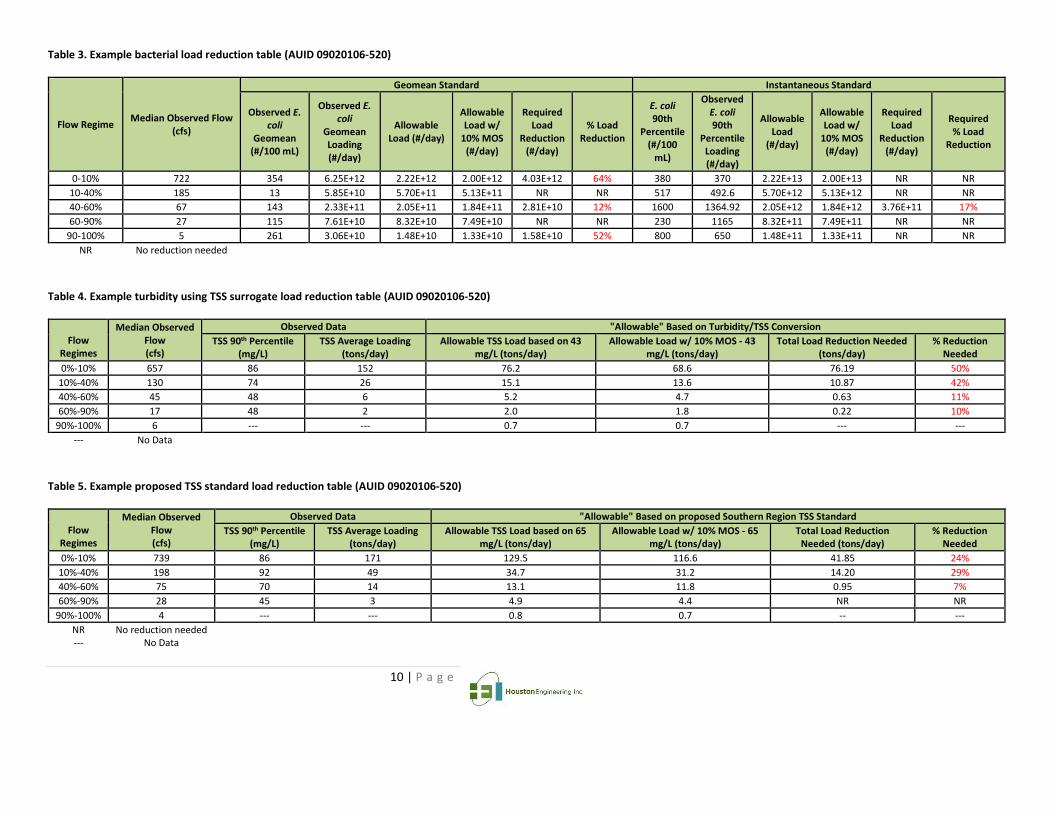
10 | P a g e
Table 3. Example bacterial load reduction table (AUID 09020106-520)
Flow Regime Median Observed Flow
(cfs)
Geomean Standard Instantaneous Standard
Observed E. coli
Geomean (#/100 mL)
Observed E. coli
Geomean Loading (#/day)
Allowable Load (#/day)
Allowable Load w/
10% MOS (#/day)
Required Load
Reduction (#/day)
% Load Reduction
E. coli 90th
Percentile (#/100
mL)
Observed E. coli 90th
Percentile Loading (#/day)
Allowable Load
(#/day)
Allowable Load w/
10% MOS (#/day)
Required Load
Reduction (#/day)
Required % Load
Reduction
0-10% 722 354 6.25E+12 2.22E+12 2.00E+12 4.03E+12 64% 380 370 2.22E+13 2.00E+13 NR NR
10-40% 185 13 5.85E+10 5.70E+11 5.13E+11 NR NR 517 492.6 5.70E+12 5.13E+12 NR NR
40-60% 67 143 2.33E+11 2.05E+11 1.84E+11 2.81E+10 12% 1600 1364.92 2.05E+12 1.84E+12 3.76E+11 17%
60-90% 27 115 7.61E+10 8.32E+10 7.49E+10 NR NR 230 1165 8.32E+11 7.49E+11 NR NR
90-100% 5 261 3.06E+10 1.48E+10 1.33E+10 1.58E+10 52% 800 650 1.48E+11 1.33E+11 NR NR
NR No reduction needed
Table 4. Example turbidity using TSS surrogate load reduction table (AUID 09020106-520)
Flow
Regimes
Median Observed Flow (cfs)
Observed Data "Allowable" Based on Turbidity/TSS Conversion
TSS 90th Percentile (mg/L)
TSS Average Loading (tons/day)
Allowable TSS Load based on 43 mg/L (tons/day)
Allowable Load w/ 10% MOS - 43 mg/L (tons/day)
Total Load Reduction Needed (tons/day)
% Reduction Needed
0%-10% 657 86 152 76.2 68.6 76.19 50%
10%-40% 130 74 26 15.1 13.6 10.87 42%
40%-60% 45 48 6 5.2 4.7 0.63 11%
60%-90% 17 48 2 2.0 1.8 0.22 10%
90%-100% 6 --- --- 0.7 0.7 --- ---
--- No Data
Table 5. Example proposed TSS standard load reduction table (AUID 09020106-520)
Flow
Regimes
Median Observed Flow (cfs)
Observed Data "Allowable" Based on proposed Southern Region TSS Standard
TSS 90th Percentile (mg/L)
TSS Average Loading (tons/day)
Allowable TSS Load based on 65 mg/L (tons/day)
Allowable Load w/ 10% MOS - 65 mg/L (tons/day)
Total Load Reduction Needed (tons/day)
% Reduction Needed
0%-10% 739 86 171 129.5 116.6 41.85 24%
10%-40% 198 92 49 34.7 31.2 14.20 29%
40%-60% 75 70 14 13.1 11.8 0.95 7%
60%-90% 28 45 3 4.9 4.4 NR NR
90%-100% 4 --- --- 0.8 0.7 -- ---
NR No reduction needed --- No Data
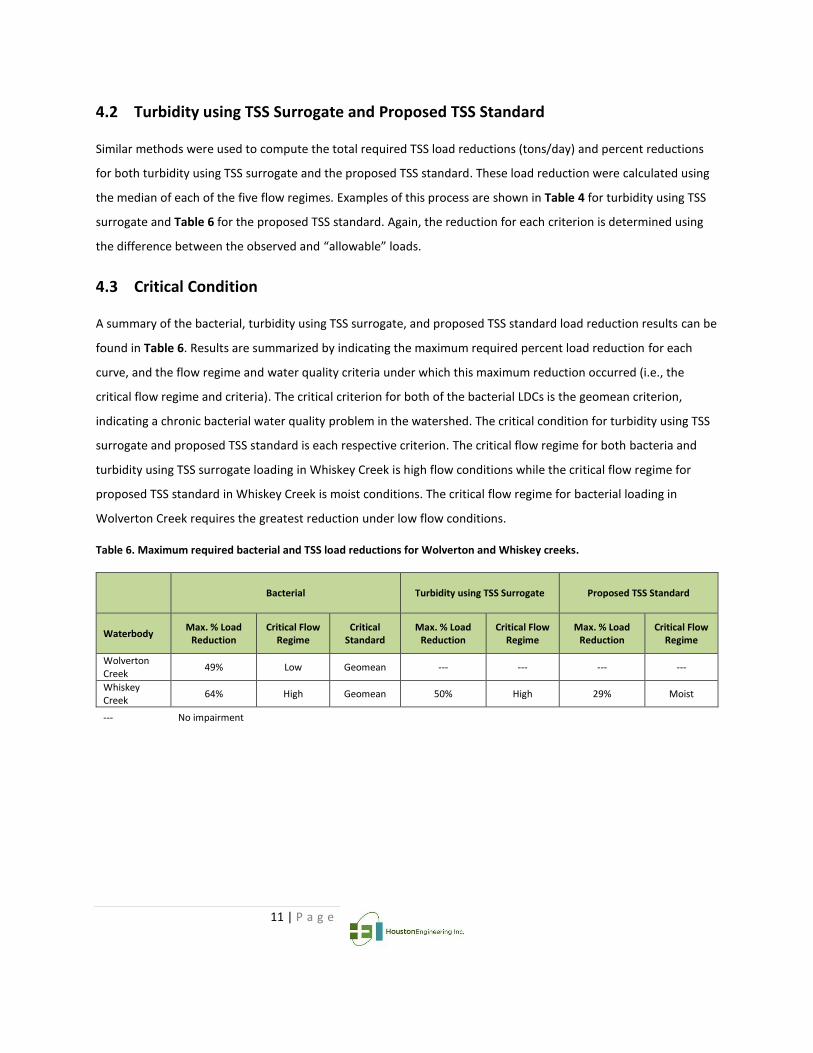
11 | P a g e
4.2 Turbidity using TSS Surrogate and Proposed TSS Standard
Similar methods were used to compute the total required TSS load reductions (tons/day) and percent reductions
for both turbidity using TSS surrogate and the proposed TSS standard. These load reduction were calculated using
the median of each of the five flow regimes. Examples of this process are shown in Table 4 for turbidity using TSS
surrogate and Table 6 for the proposed TSS standard. Again, the reduction for each criterion is determined using
the difference between the observed and “allowable” loads.
4.3 Critical Condition
A summary of the bacterial, turbidity using TSS surrogate, and proposed TSS standard load reduction results can be
found in Table 6. Results are summarized by indicating the maximum required percent load reduction for each
curve, and the flow regime and water quality criteria under which this maximum reduction occurred (i.e., the
critical flow regime and criteria). The critical criterion for both of the bacterial LDCs is the geomean criterion,
indicating a chronic bacterial water quality problem in the watershed. The critical condition for turbidity using TSS
surrogate and proposed TSS standard is each respective criterion. The critical flow regime for both bacteria and
turbidity using TSS surrogate loading in Whiskey Creek is high flow conditions while the critical flow regime for
proposed TSS standard in Whiskey Creek is moist conditions. The critical flow regime for bacterial loading in
Wolverton Creek requires the greatest reduction under low flow conditions.
Table 6. Maximum required bacterial and TSS load reductions for Wolverton and Whiskey creeks.
Bacterial Turbidity using TSS Surrogate Proposed TSS Standard
Waterbody Max. % Load
Reduction Critical Flow
Regime Critical
Standard Max. % Load
Reduction Critical Flow
Regime Max. % Load
Reduction Critical Flow
Regime
Wolverton Creek
49% Low Geomean --- --- --- ---
Whiskey Creek
64% High Geomean 50% High 29% Moist
--- No impairment
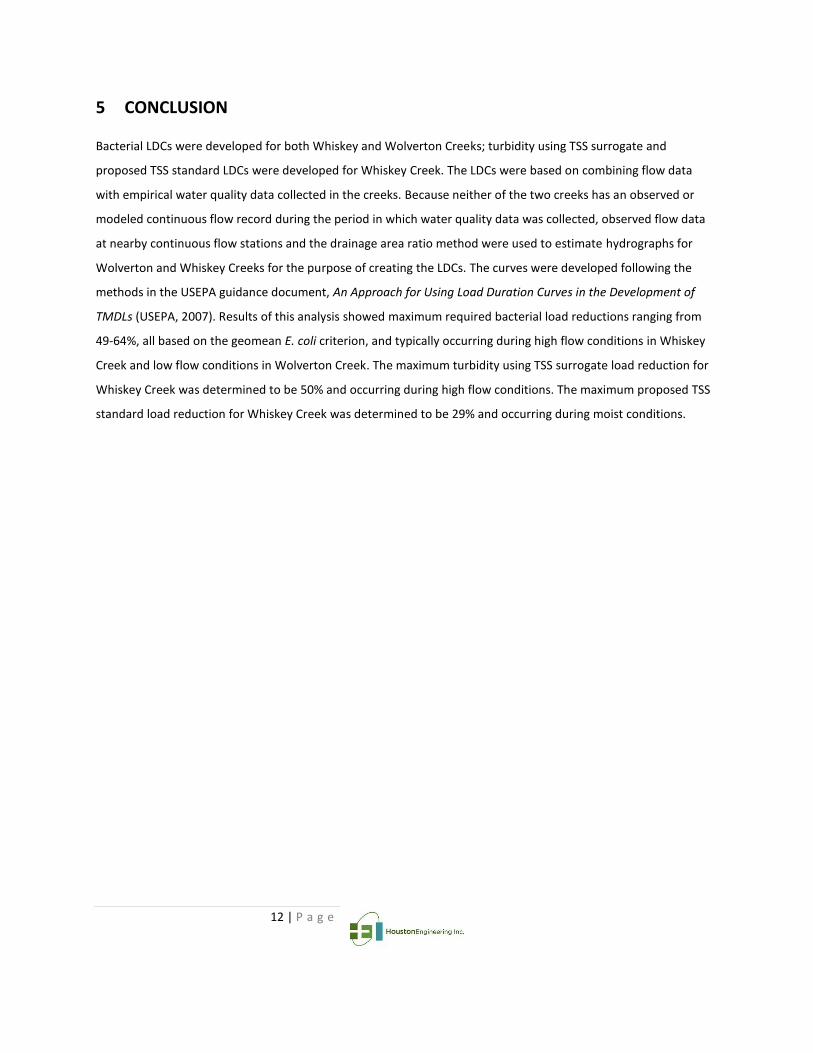
12 | P a g e
5 CONCLUSION
Bacterial LDCs were developed for both Whiskey and Wolverton Creeks; turbidity using TSS surrogate and
proposed TSS standard LDCs were developed for Whiskey Creek. The LDCs were based on combining flow data
with empirical water quality data collected in the creeks. Because neither of the two creeks has an observed or
modeled continuous flow record during the period in which water quality data was collected, observed flow data
at nearby continuous flow stations and the drainage area ratio method were used to estimate hydrographs for
Wolverton and Whiskey Creeks for the purpose of creating the LDCs. The curves were developed following the
methods in the USEPA guidance document, An Approach for Using Load Duration Curves in the Development of
TMDLs (USEPA, 2007). Results of this analysis showed maximum required bacterial load reductions ranging from
49-64%, all based on the geomean E. coli criterion, and typically occurring during high flow conditions in Whiskey
Creek and low flow conditions in Wolverton Creek. The maximum turbidity using TSS surrogate load reduction for
Whiskey Creek was determined to be 50% and occurring during high flow conditions. The maximum proposed TSS
standard load reduction for Whiskey Creek was determined to be 29% and occurring during moist conditions.

13 | P a g e
6 REFERENCES
Houston Engineering, Inc. (HEI). 2012. Upper Red River Watershed. Major Watershed Restoration & Protection Plan. Watershed Conditions Report. September 11, 2012.
MPCA (Minnesota Pollution Control Agency). 2012. Guidance Manual for Assessing the Quality of Minnesota Surface Waters for Determination of Impairment: 305(b) Report and 303(d) List. Minnesota Pollution Control Agency. St. Paul, MN
MPCA (Minnesota Pollution Control Agency). 2013. Proposed Permanent Rules Relating to Water Quality. 7050.0150 Determination of Water Quality, Biological and Physical Conditions, and Compliance Standards. http://www.pca.state.mn.us/index.php/view-document.html?gid=19525 Minnesota Pollution Control Agency. St. Paul, MN
United States Environmental Protection Agency (USEPA). 2007. An Approach for Using Load Duration Curves in the Development of TMDLs. EPA 841-B-07-006. August 2007.