final winter 2012 survey report
DESCRIPTION
Final report on data from the Winter 2012 Survey of staffing and recruiting managers in Greater Cincinnati. Survey conducted by the Staffing & Recruiting Committee of the Greater Cincinnati Human Resources Association. Survey questions, analysis and report done by Joy Lovejoy, ABC, program manager-surveys for the Staffing & Recruiting Committee.TRANSCRIPT
1
Winter 2012 Survey Report
Talent Acquisition Practices in Greater Cincinnati
Staffing & Recruiting Committee
C
About this SurveyThe Staffing & RecruitingCommittee of the GreaterCincinnati Human ResourcesAssociation (GCHRA) surveysarea hiring managers twiceeach year in order to trackstaffing practices among areacompanies and organizations.
The Winter 2012 Survey wasconducted between late-January and mid-February2012.
A total of 135 hiring manag-ers responded to the onlinesurvey, representing 97 com-panies or organizations inGreater Cincinnati. The re-turn rate for the companiesor organizations was 12.7percent.
This rate is not strong enoughto say definitively that thedata is representative of thetalent acquisition community.The survey data, however,may be taken as guidance tothe state of talent acquisitionin Greater Cincinnati at thetime the survey was con-ducted in late-January andmid-February 2012.
Page
About this Survey 1
First Quarter 2012 HiringPractices 2
Qualifications Sought inCandidates 4
Employee Turnover 6
Recruiting Practices 7
Some Positions Difficultto Fill 7
Compensation 9
Social Media and CandidateSourcing Method 10
Demographics 11
Industry Groups 11
Location, Location, Location 12
Employees in Organizationsor Companies 12
Outlook for Second Quarter2012 13
Staffing & Recruiting Committee
C
Winter 2012 Survey Report
Talent Acquisition Practices in Greater Cincinnati
Staffing & Recruiting Committee
A comparison of the datareturned on the Winter 2012Survey to the same questionsasked in the Summer 2011survey showed consistency inthe data between the twosurveys.
Respondents completed a totalof 38 questions designed tomeasure practices in fourareas:
Hiring practices in thefirst quarter (January,February and March) of2012
Recruiting practices
Demographics of surveyparticipants and theircompanies or organiza-tions
The outlook for hiringpractices in the secondquarter (April, May andJune) of 2012
About this Survey
Page
About this Survey 1
First Quarter 2012 HiringPractices 2
Qualifications Sought inCandidates 4
Employee Turnover 6
Recruiting Practices 7
Some Positions Difficultto Fill 7
Compensation 9
Social Media and CandidateSourcing Method 10
Demographics 11
Industry Groups 11
Location, Location, Location 12
Employees in Organizationsor Companies 12
Outlook for Second Quarter2012 13
Table of Contents
About this Survey

2
percent of respondentsreported hiring only for newpositions.
Hiring data from the twosurveys also showed:
Hiring only to fill vacan-cies in existing positionswas reported by 28.3percent of the 2012respondents and 22.7percent of respondentsto the 2011 survey
Hiring to fill vacancies inboth existing positionsand hiring for newpositions was reportedby 61.6 percent ofrespondents in 2012 and76.1 percent ofrespondents in 2011
The 2012 survey found that15.5 percent of respondentsreported that their company ororganization was not hiring,compared to 15.2 percent of
respondents for the 2011survey. Among the reasonsfor not hiring cited by the2012 respondents were:
Hiring freeze – 42.9percent compared to50.0 percent in 2011
Rightsizing – 28.5percent compared to 35percent in 2011
Restructuring – 19.0percent compared to5.0 percent in 2011
Downsizing – 9.5percent compared to10.0 percent in 2011
Chart 1 displays the types ofpositions respondents reportedas filled for their companies/organizations during the firstquarter of 2012.
First Quarter 2012 Hiring Practices
Hiring during the first quarter(January, February and March)of 2012 was up slightly comparedto the 3rd quarter of 2011. Thatwas one of the findings amongrespondents to the Winter 2012Survey.
The 2012 survey found that 114respondents, representing 84.4percent of the total respondents,reported their company or or-ganization was hiring in the firstquarter. When the same ques-tion was asked of respondents inthe 2011 survey, conducted lastJuly, 82.7 percent of the respon-dents reported hiring by theircompanies or organizations.
Data from the 2012 surveyshowed that 10.1 percent of therespondents reported hiring fornew positions only. Newlycreated positions are generallyseen as indicators of a growingeconomy. The July 2011survey data showed just 1.1
Chart 1: Positions Filled in 1st Qtr. 2012by Percent of Total Responses for Each Position
(Respondents Could Select More than One Position Level)
20.4
31.6
51.0
49.0
44.9
44.9
64.3
22.423.5
Executive DirectorSupervisor/Manager Exempt - TechnicalExempt - Non-technical Non-exempt hourly - TechnicalNon-exempt hourly-Non-Techical Non-exempt salaried - TechnicalNon exempt salaried - Non-Technical
3
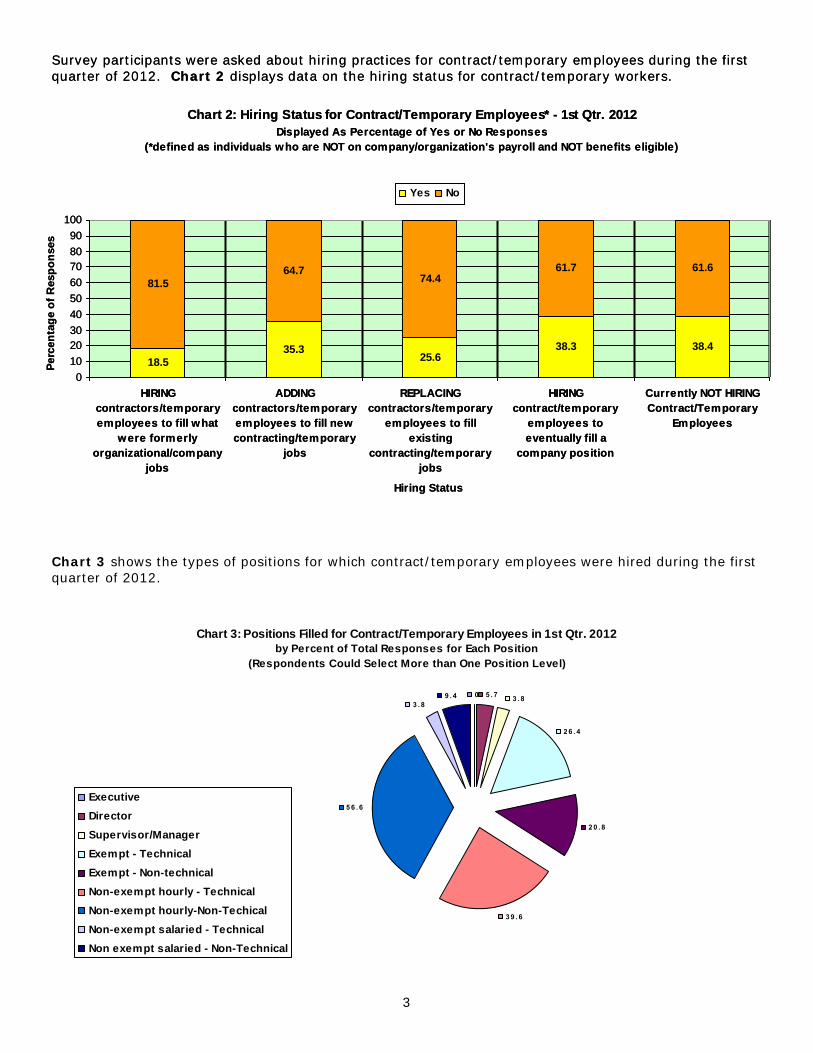
Chart 3: Positions Filled for Contract/Temporary Employees in 1st Qtr. 2012by Percent of Total Responses for Each Position
(Respondents Could Select More than One Position Level)
0 5 . 7 3 . 8
2 6 . 4
2 0 . 8
3 9 . 6
5 6 . 6
3 . 89 . 4
ExecutiveDirectorSupervisor/ManagerExempt - TechnicalExempt - Non-technicalNon-exempt hourly - TechnicalNon-exempt hourly-Non-TechicalNon-exempt salaried - TechnicalNon exempt salaried - Non-Technical
Survey participants were asked about hiring practices for contract/temporary employees during the firstquarter of 2012. Chart 2 displays data on the hiring status for contract/temporary workers.
Chart 2: Hiring Status for Contract/Temporary Employees* - 1st Qtr. 2012Displayed As Percentage of Yes or No Responses
(*defined as individuals who are NOT on company/organization's payroll and NOT benefits eligible)
18.535.3
25.638.3 38.4
81.564.7
74.461.7 61.6
0102030405060708090
100
HIRINGcontractors/temporaryemployees to fill what
were formerlyorganizational/company
jobs
ADDINGcontractors/temporaryemployees to fill newcontracting/temporary
jobs
REPLACINGcontractors/temporary
employees to fillexisting
contracting/temporaryjobs
HIRINGcontract/temporary
employees toeventually fill a
company position
Currently NOT HIRINGContract/Temporary
Employees
Hiring Status
Perc
enta
ge o
f Res
pons
es
Yes No
Chart 3 shows the types of positions for which contract/temporary employees were hired during the firstquarter of 2012.
Survey participants were asked about hiring practices for contract/temporary employees during the firstquarter of 2012. Chart 2 displays data on the hiring status for contract/temporary workers.
Chart 2: Hiring Status for Contract/Temporary Employees* - 1st Qtr. 2012Displayed As Percentage of Yes or No Responses
(*defined as individuals who are NOT on company/organization's payroll and NOT benefits eligible)
18.535.3
25.638.3 38.4
81.564.7
74.461.7 61.6
0102030405060708090
100
HIRINGcontractors/temporaryemployees to fill what
were formerlyorganizational/company
jobs
ADDINGcontractors/temporaryemployees to fill newcontracting/temporary
jobs
REPLACINGcontractors/temporary
employees to fillexisting
contracting/temporaryjobs
HIRINGcontract/temporary
employees toeventually fill a
company position
Currently NOT HIRINGContract/Temporary
Employees
Hiring Status
Perc
enta
ge o
f Res
pons
es
Yes No
4
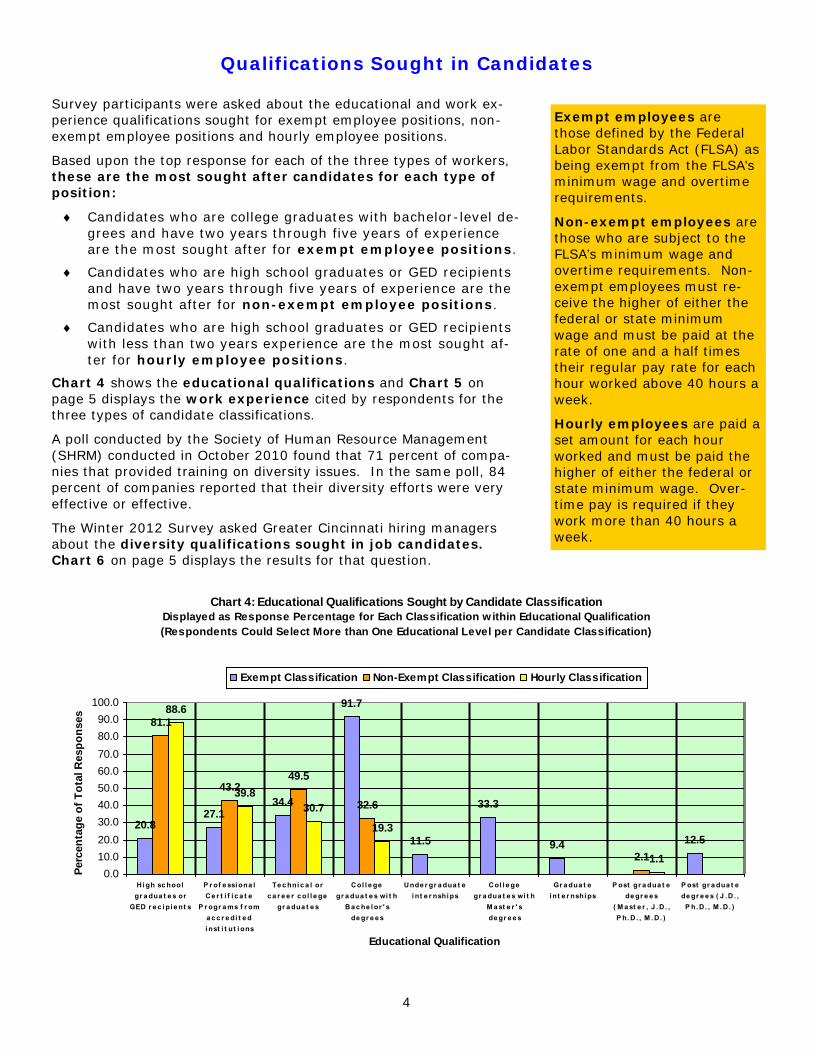
Chart 4: Educational Qualifications Sought by Candidate ClassificationDisplayed as Response Percentage for Each Classification w ithin Educational Qualification(Respondents Could Select More than One Educational Level per Candidate Classification)
20.827.1
34.4
91.7
11.5
33.3
9.4 12.5
81.1
43.249.5
32.6
2.1
88.6
39.830.7
19.3
1.10.0
10.020.030.040.050.060.070.080.090.0
100.0
Hi gh sc hoolgr a dua t e s or
GED r e c i pi e nt s
P r of e ssi ona lCe r t i f i c a t e
P r ogr a ms f r oma c c r e di t e di nst i t ut i ons
Te c hni c a l orc a r e e r c ol l e ge
gr a dua t e s
Col l e gegr a dua t e s wi t h
Ba c he l or ' sde gr e e s
Unde r gr a dua t ei nt e r nshi ps
Col l e gegr a dua t e s wi t h
M a st e r ' sde gr e e s
Gr a dua t ei nt e r nshi ps
P ost gr a dua t ede gr e e s
( M a st e r , J . D . ,P h. D . , M . D . )
P ost gr a dua t ede gr e e s ( J . D . ,
P h. D . , M . D . )
Educational Qualification
Perc
enta
ge o
f Tot
al R
espo
nses
Exempt Classification Non-Exempt Classification Hourly Classification
Qualifications Sought in Candidates
Survey participants were asked about the educational and work ex-perience qualifications sought for exempt employee positions, non-exempt employee positions and hourly employee positions.
Based upon the top response for each of the three types of workers,these are the most sought after candidates for each type ofposition:
Candidates who are college graduates with bachelor-level de-grees and have two years through five years of experienceare the most sought after for exempt employee positions.
Candidates who are high school graduates or GED recipientsand have two years through five years of experience are themost sought after for non-exempt employee positions.
Candidates who are high school graduates or GED recipientswith less than two years experience are the most sought af-ter for hourly employee positions.
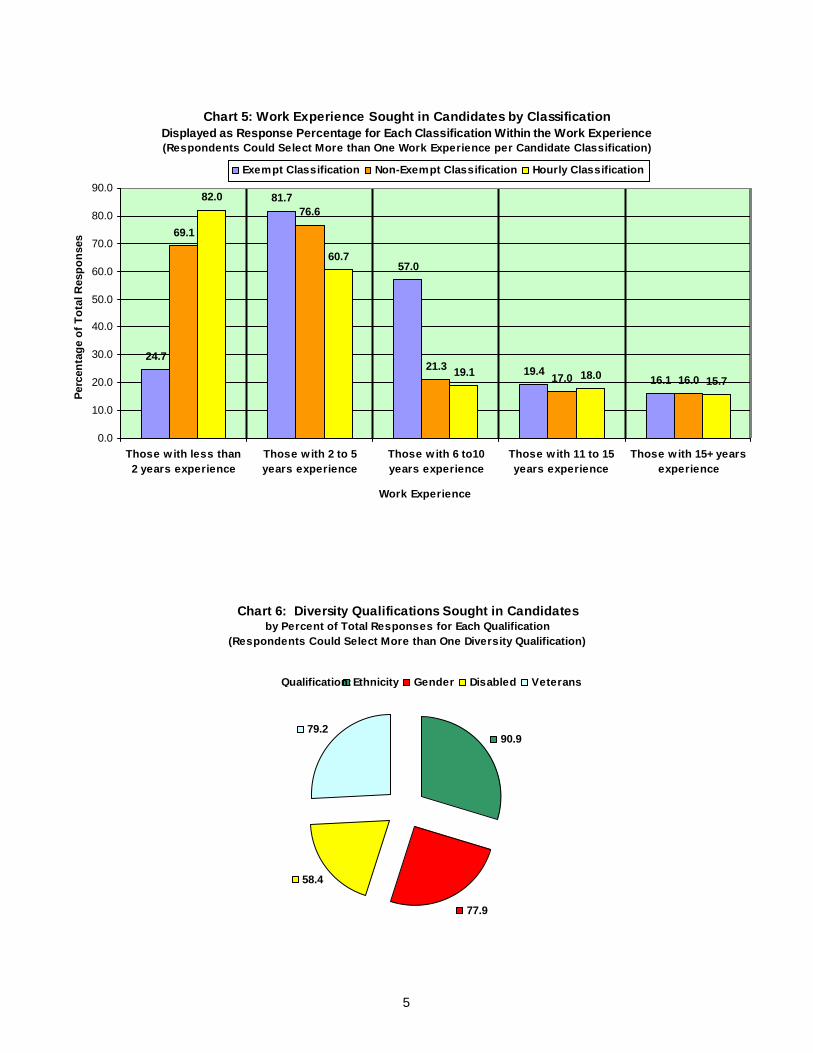
Chart 4 shows the educational qualifications and Chart 5 onpage 5 displays the work experience cited by respondents for thethree types of candidate classifications.
A poll conducted by the Society of Human Resource Management(SHRM) conducted in October 2010 found that 71 percent of compa-nies that provided training on diversity issues. In the same poll, 84percent of companies reported that their diversity efforts were veryeffective or effective.
The Winter 2012 Survey asked Greater Cincinnati hiring managersabout the diversity qualifications sought in job candidates.Chart 6 on page 5 displays the results for that question.
Exempt employees arethose defined by the FederalLabor Standards Act (FLSA) asbeing exempt from the FLSA’sminimum wage and overtimerequirements.
Non-exempt employees arethose who are subject to theFLSA’s minimum wage andovertime requirements. Non-exempt employees must re-ceive the higher of either thefederal or state minimumwage and must be paid at therate of one and a half timestheir regular pay rate for eachhour worked above 40 hours aweek.
Hourly employees are paid aset amount for each hourworked and must be paid thehigher of either the federal orstate minimum wage. Over-time pay is required if theywork more than 40 hours aweek.
5
Chart 5: Work Experience Sought in Candidates by ClassificationDisplayed as Response Percentage for Each Classification Within the Work Experience(Respondents Could Select More than One Work Experience per Candidate Classification)
24.7
81.7
57.0
19.416.1
69.1
76.6
21.317.0 16.0
82.0
60.7
19.1 18.0 15.7
0.0
10.0
20.0
30.0
40.0
50.0
60.0
70.0
80.0
90.0
Those with less than2 years experience
Those with 2 to 5years experience
Those with 6 to10years experience
Those with 11 to 15years experience
Those with 15+ yearsexperience
Work Experience
Perc
enta
ge o
f Tot
al R
espo
nses
Exempt Classification Non-Exempt Classification Hourly Classification
Chart 6: Diversity Qualifications Sought in Candidatesby Percent of Total Responses for Each Qualification
(Respondents Could Select More than One Diversity Qualification)
90.9
77.9
58.4
79.2
Ethnicity Gender Disabled VeteransQualification:
6
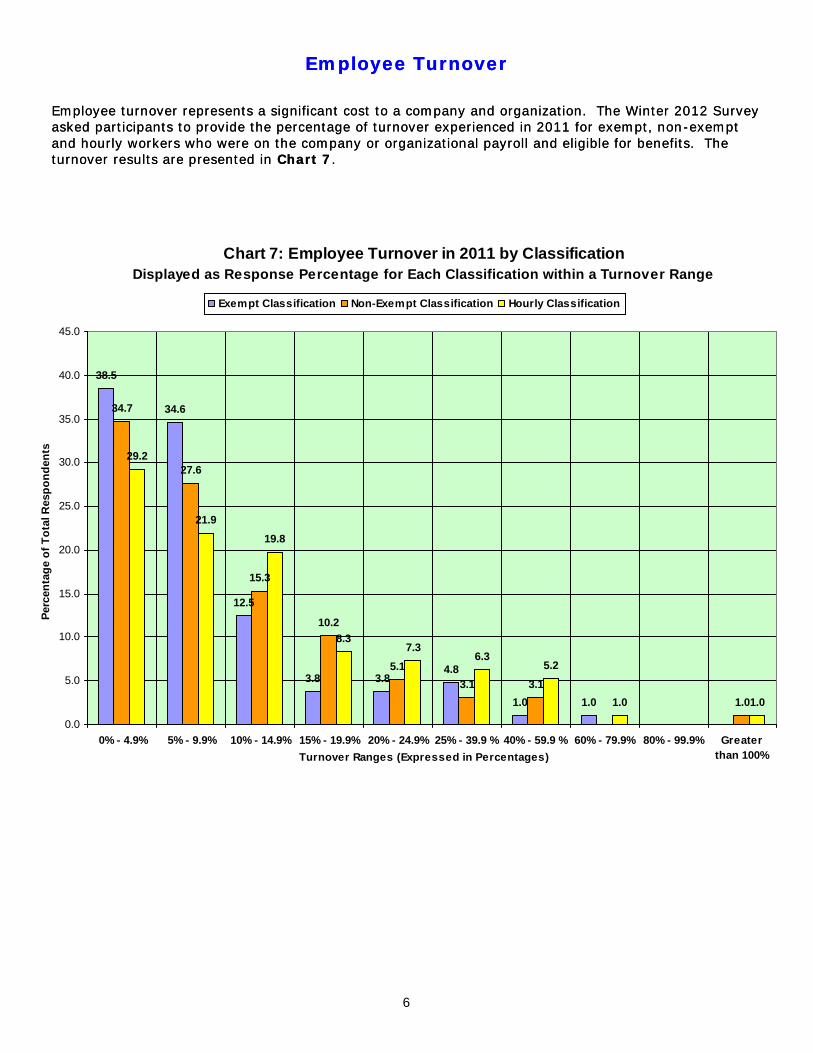
Employee Turnover
Employee turnover represents a significant cost to a company and organization. The Winter 2012 Surveyasked participants to provide the percentage of turnover experienced in 2011 for exempt, non-exemptand hourly workers who were on the company or organizational payroll and eligible for benefits. Theturnover results are presented in Chart 7.
Chart 7: Employee Turnover in 2011 by ClassificationDisplayed as Response Percentage for Each Classification within a Turnover Range
38.5
34.6
12.5
3.8 3.84.8
1.0 1.0
34.7
27.6
15.3
10.2
5.13.1 3.1
1.0
29.2
21.919.8
8.37.3
6.35.2
1.0 1.0
0.0
5.0
10.0
15.0
20.0
25.0
30.0
35.0
40.0
45.0
0% - 4.9% 5% - 9.9% 10% - 14.9% 15% - 19.9% 20% - 24.9% 25% - 39.9 % 40% - 59.9 % 60% - 79.9% 80% - 99.9% Greaterthan 100%Turnover Ranges (Expressed in Percentages)
Perc
enta
ge o
f Tot
al R
espo
nden
ts
Exempt Classification Non-Exempt Classification Hourly Classification
Employee Turnover
Employee turnover represents a significant cost to a company and organization. The Winter 2012 Surveyasked participants to provide the percentage of turnover experienced in 2011 for exempt, non-exemptand hourly workers who were on the company or organizational payroll and eligible for benefits. Theturnover results are presented in Chart 7.
7
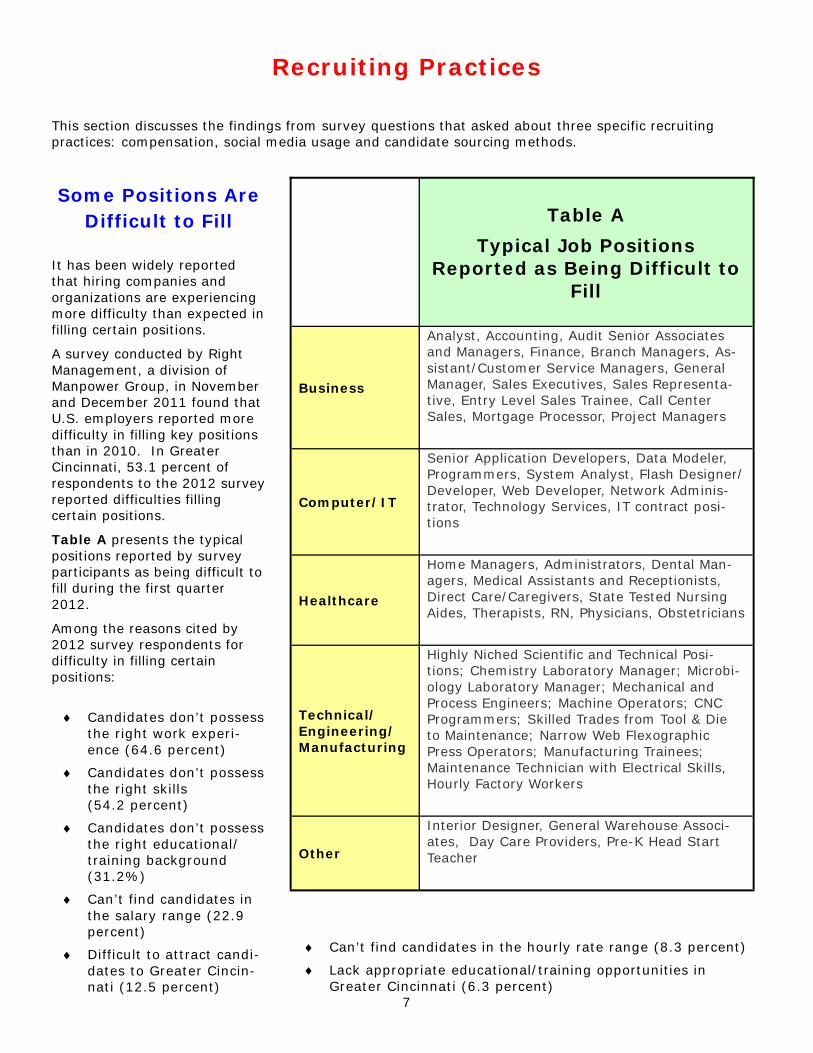
Recruiting Practices
This section discusses the findings from survey questions that asked about three specific recruitingpractices: compensation, social media usage and candidate sourcing methods.
Table A
Typical Job PositionsReported as Being Difficult to
Fill
Business
Analyst, Accounting, Audit Senior Associatesand Managers, Finance, Branch Managers, As-sistant/Customer Service Managers, GeneralManager, Sales Executives, Sales Representa-tive, Entry Level Sales Trainee, Call CenterSales, Mortgage Processor, Project Managers
Computer/IT
Senior Application Developers, Data Modeler,Programmers, System Analyst, Flash Designer/Developer, Web Developer, Network Adminis-trator, Technology Services, IT contract posi-tions
Healthcare
Home Managers, Administrators, Dental Man-agers, Medical Assistants and Receptionists,Direct Care/Caregivers, State Tested NursingAides, Therapists, RN, Physicians, Obstetricians
Technical/Engineering/Manufacturing
Highly Niched Scientific and Technical Posi-tions; Chemistry Laboratory Manager; Microbi-ology Laboratory Manager; Mechanical andProcess Engineers; Machine Operators; CNCProgrammers; Skilled Trades from Tool & Dieto Maintenance; Narrow Web FlexographicPress Operators; Manufacturing Trainees;Maintenance Technician with Electrical Skills,Hourly Factory Workers
Other
Interior Designer, General Warehouse Associ-ates, Day Care Providers, Pre-K Head StartTeacher
Some Positions AreDifficult to Fill
It has been widely reportedthat hiring companies andorganizations are experiencingmore difficulty than expected infilling certain positions.
A survey conducted by RightManagement, a division ofManpower Group, in Novemberand December 2011 found thatU.S. employers reported moredifficulty in filling key positionsthan in 2010. In GreaterCincinnati, 53.1 percent ofrespondents to the 2012 surveyreported difficulties fillingcertain positions.
Table A presents the typicalpositions reported by surveyparticipants as being difficult tofill during the first quarter2012.
Among the reasons cited by2012 survey respondents fordifficulty in filling certainpositions:
Candidates don’t possessthe right work experi-ence (64.6 percent)
Candidates don’t possessthe right skills(54.2 percent)
Candidates don’t possessthe right educational/training background(31.2%)
Can’t find candidates inthe salary range (22.9percent)
Difficult to attract candi-dates to Greater Cincin-nati (12.5 percent)
Can’t find candidates in the hourly rate range (8.3 percent)
Lack appropriate educational/training opportunities inGreater Cincinnati (6.3 percent)
8
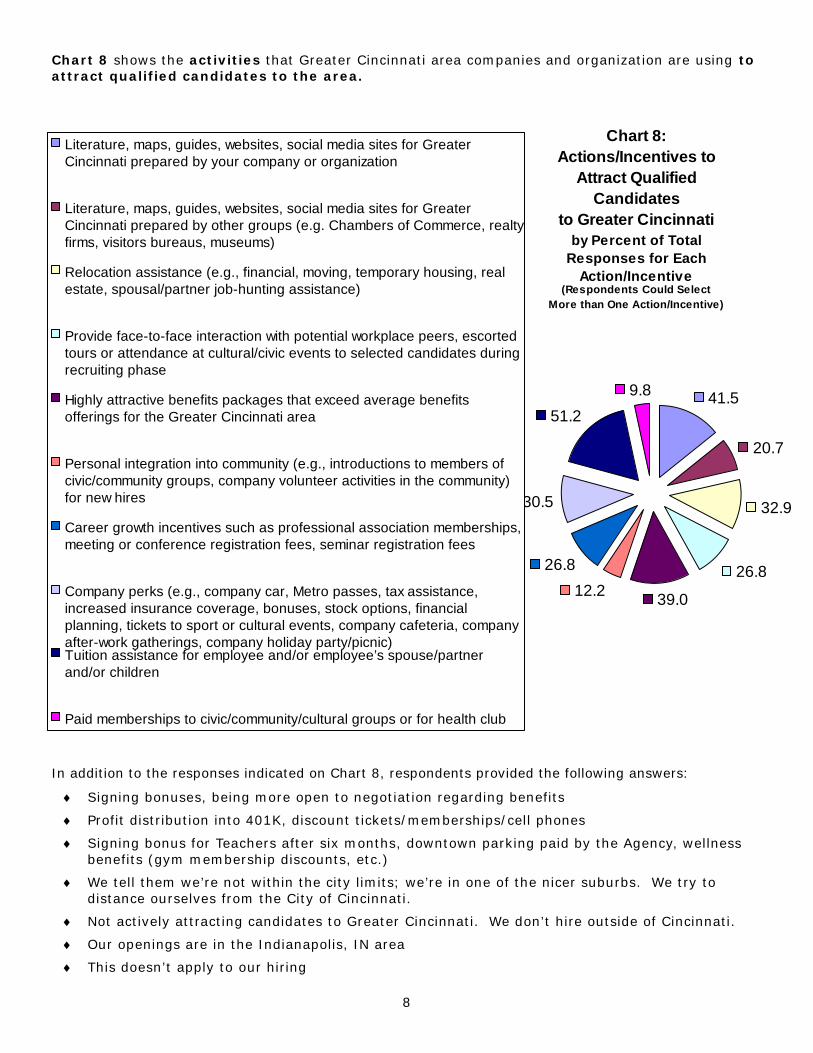
In addition to the responses indicated on Chart 8, respondents provided the following answers:
Signing bonuses, being more open to negotiation regarding benefits
Profit distribution into 401K, discount tickets/memberships/cell phones
Signing bonus for Teachers after six months, downtown parking paid by the Agency, wellnessbenefits (gym membership discounts, etc.)
We tell them we’re not within the city limits; we’re in one of the nicer suburbs. We try todistance ourselves from the City of Cincinnati.
Not actively attracting candidates to Greater Cincinnati. We don’t hire outside of Cincinnati.
Our openings are in the Indianapolis, IN area
This doesn’t apply to our hiring
41.5
20.7
32.9
26.8
39.012.226.8
30.5
51.29.8
Literature, maps, guides, websites, social media sites for GreaterCincinnati prepared by your company or organization
Literature, maps, guides, websites, social media sites for GreaterCincinnati prepared by other groups (e.g. Chambers of Commerce, realtyfirms, visitors bureaus, museums)
Relocation assistance (e.g., financial, moving, temporary housing, realestate, spousal/partner job-hunting assistance)
Provide face-to-face interaction with potential workplace peers, escortedtours or attendance at cultural/civic events to selected candidates duringrecruiting phase
Highly attractive benefits packages that exceed average benefitsofferings for the Greater Cincinnati area
Personal integration into community (e.g., introductions to members ofcivic/community groups, company volunteer activities in the community)for new hires
Career growth incentives such as professional association memberships,meeting or conference registration fees, seminar registration fees
Company perks (e.g., company car, Metro passes, tax assistance,increased insurance coverage, bonuses, stock options, financialplanning, tickets to sport or cultural events, company cafeteria, companyafter-work gatherings, company holiday party/picnic)Tuition assistance for employee and/or employee’s spouse/partnerand/or children
Paid memberships to civic/community/cultural groups or for health club
Chart 8:Actions/Incentives to
Attract QualifiedCandidates
to Greater Cincinnatiby Percent of Total
Responses for EachAction/Incentive
(Respondents Could SelectMore than One Action/Incentive)
Chart 8 shows the activities that Greater Cincinnati area companies and organization are using toattract qualified candidates to the area.

9
Compensation
Survey participants were asked if the salary and hourly rates paid to new hires in 2012 are higher,lower, or showed no change from those paid to new hires in 2011. Across all classifications, morethan 50 percent of staffing and recruiting managers reported that 2012 salary and hourly rates inGreater Cincinnati have not changed from those paid to new hires in 2011. Table B breaks out thedata on 2012 salaries and hourly rates.
Table B — New Hires2012 Salaries and Hourly Rates
Compared to 2011 Salaries and Hourly Rates(Reported as percentage of respondents’ answers within each level)
The survey also asked about salary increase ranges being paid to current employees for the currentfiscal year. Responses to this question are presented in Chart 9.
LEVEL:Supervisor,Manager,
Director andExecutive
LEVEL:Exempt
LEVEL:Non-Exempt
SalariedTechnical
andNon-Exempt
Salaried Non-Technical
LEVEL:Hourly
Technicaland
Hourly Non-Technical
Higher thanin 2011 39.2% 32.5% 30.0% 35.4%Lower thanin 2011 1.3% 1.2% 0.0% 0.0%No Changefrom 2011 59.5% 66.3% 70.0% 64.6%
Chart 9: Salary Range Increase Paid to Current Employeesin Current Fiscal Year
Displayed as Response Percentage for Each Salary Range within a Job Classification
31.1 29.524.7 26.4 27.7 28.6
32.126.1
32.529.5
2.2 1.1 1.1 2.4 2.4 2.3
10.012.5 11.2
13.89.6
14.3 16.7 18.215.6 16.7
45.650.0
56.2 55.2 56.6 54.851.3 53.4 51.9 53.8
4.4 4.5 4.5 2.3 2.46.7
3.4 2.2 1.1 1.20.0
10.0
20.0
30.0
40.0
50.0
60.0
Executive Director Manager Supervisor Exempt -Technical
Exempt -Non-
technical
Non-exempthourly -
Technical
Non-exempthourly-
Non-Techical
Non-exempt
salaried -Technical
Non-exempt
salaried -Non-
Technical
Perc
enta
ge o
f Res
pons
es
No Increase Less than 1% 1%-1.9% 2%-3.9% 2%-3.9% 8% or HigherSalary Ranges:
10
Social Media and Candidate Sourcing Methods
In the past few years, US business has moved from viewing social media asstrictly branding and advertising channels to social media as tools for businessprocesses, operations and engagement. Human Resources now uses socialmedia not only to create interest in the company among active job seekers, butalso as a tool for sourcing and recruiting passive candidates.
Survey participants were asked what percentage of their company’s ororganization’s human resources or recruiting annual budget is allocated tosocial media recruiting. The data from the Winter 2012 Survey show thatbudgets allocated to social media recruiting are trending up from thedata reported in the 2011 survey:
57.0 percent of respondents reported that less than one percent ofbudget is allocated to social media recruiting. This is up from the 54.5percent of respondents in the 2011 survey.
31.2 percent of respondents reported that between 1.0 percent and 4.9percent of budget is allocated to social media recruiting. This is slightlybelow the 31.3 percent of respondents in the 2011 survey.
6.5 percent of respondents reported that between 10.0 percent and 19.9percent of budget is allocated to social media recruiting. This is up fromthe 6.0 percent of respondents in the 2011 survey.
3.2 percent of respondents reported that between 5.0 percent and 9.9percent of budget is allocated to social media recruiting. This is downfrom the 7.1 percent of respondents in the 2011 survey.
2.2 percent of respondents reported that 20.0 percent or more of budgetis allocated to social media recruiting. This is up from the 1.0 percent ofrespondents in the 2011 survey.
LinkedIn is the big winner among the social media tools that surveyparticipants use in the recruiting and hiring process. LinkedIn is used by 83.1percent of the respondents. Survey participants were asked to indicate all ofthe social media tools used for recruiting and hiring new employees. The datashowed that in addition to LinkedIn, the following social media tools are used:
Facebook is used by 47.2 percent of respondents
Craig’s List is used by 36.0 percent of respondents
Twitter is used by 24.7 percent of respondents
Google+ is used by 11.2 percent of respondents
YouTube is used by 9.0% percent of respondents
Google Social Media Analytics is used by 3.4 percent of respondents
Survey data showed that 2.2 percent of respondents used the following forrecruiting and hiring purposes:
Online job board Monster
Industry specific websites
No social media
The following social media and online job boards are each used by 1.1 percentof respondents in the recruiting and hiring process:
Yammer.com
Bullhorn Reach.com
TweetMyJobs.com
Monster.com
Lur website
With so much social media avail-able for recruiting and hiring dostaffing and recruiting managershave confidence in the effective-ness of any other methods tosource candidates? The answer,according to survey participants is“Yes.”
We asked survey participantsto indicate the top three mosteffective sourcing methods.The runaway winner: employeereferrals, cited by 77.2 percent ofrespondents. The next two run-ners-up were commercial onlinejob boards (i.e., Monster, Career-builder), cited by 54.5 percent ofrespondents and the company’sor organization’s website, citedby 38.6 percent of respondents.
Survey respondents cited thefollowing effective sourcingmethods in addition to the topthree:
23.8 percent cited socialmedia
20.8 percent cited job fairs/campus career services
19.8 percent cited referralsfrom industry contacts
17.8 percent citedadvertising in traditionalmedia (i.e., newspapers,magazines, professionaljournals, TV, radio, cable)
13.9 percent each citedsearch firms andprofessional associations/conferences
12.9 percent cited rehires offormer employees
5.5 percent cited formercollege interns or formerCoOp students
2.0 percent each citedcollege/university websitesand military websites
11
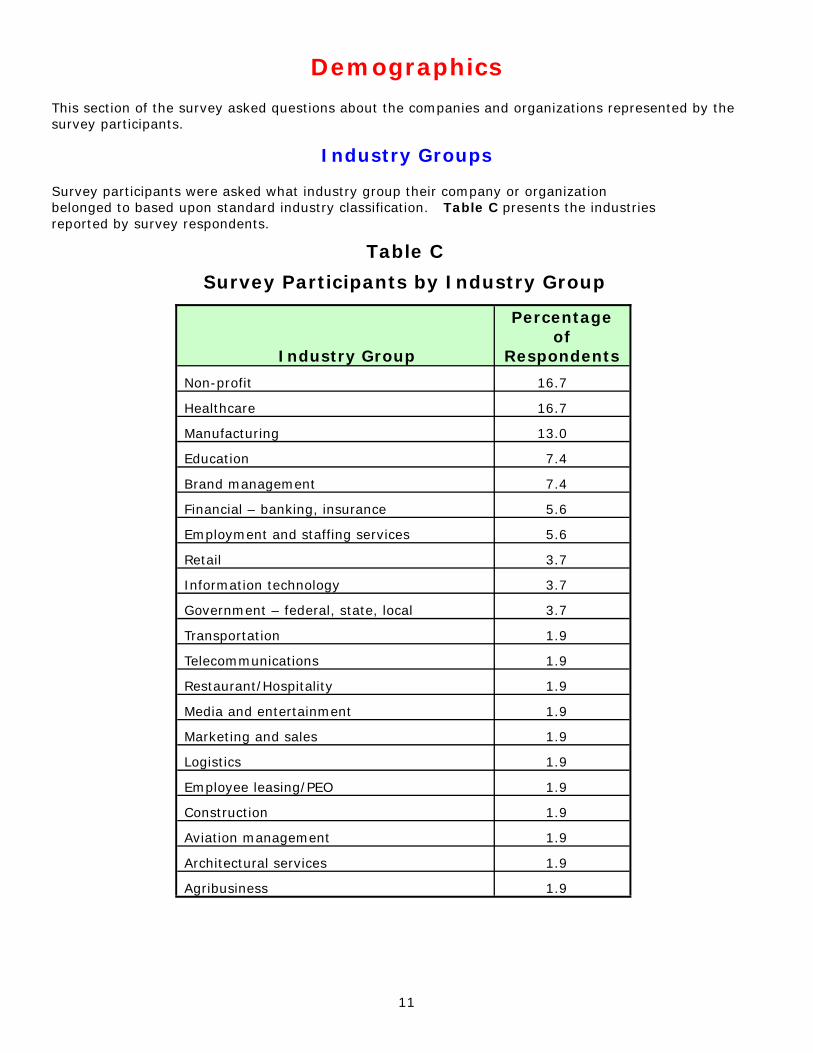
Demographics
This section of the survey asked questions about the companies and organizations represented by thesurvey participants.
Industry Groups
Survey participants were asked what industry group their company or organizationbelonged to based upon standard industry classification. Table C presents the industriesreported by survey respondents.
Table C
Survey Participants by Industry Group
Industry Group
Percentageof
Respondents
Non-profit 16.7
Healthcare 16.7
Manufacturing 13.0
Education 7.4
Brand management 7.4
Financial – banking, insurance 5.6
Employment and staffing services 5.6
Retail 3.7
Information technology 3.7
Government – federal, state, local 3.7
Transportation 1.9
Telecommunications 1.9
Restaurant/Hospitality 1.9
Media and entertainment 1.9
Marketing and sales 1.9
Logistics 1.9
Employee leasing/PEO 1.9
Construction 1.9
Aviation management 1.9
Architectural services 1.9
Agribusiness 1.9

12
Location, Location, Location
Data from the 2012 survey showed that the Greater Cincinnati area serves as animportant location for the companies and organizations represented by therespondents:
60.8 percent of respondents reported that their national/global headquarters is located in thetri-state area
21.6 percent of respondents said their regional/divisional headquarters is located in the tri -state area
9.3 percent of respondents reported that their subsidiary headquarters is located in the tri -state area
Just 14.4 percent of respondents reported that their national/global headquarters is locationoutside the tri-state area
Employees in Organizations or Companies
The 2012 survey asked participants about the distribution of employees. Table D shows thepercentage of respondents who indicated their company or organization had employees or contract/temporary employees in specific locations.
Table D
Number of Employees in Organizations or CompaniesRepresented by 2012 Survey Participants
(Reported as Percentage of Respondents / Grey Shading = No Response)
Number ofEmployees
Employees in theTri-State
Contract/Temporary
Employees in theTri-State
Employees in theEntire Company/
Corporation
Less than 10 2.0% 72.0% 2.0%
11-50 6.9% 16.1% 4.0%
51-100 16.8% 5.4% 9.0%
101-250 27.7% 3.2% 23.0%
251 or more 3.2%
251-500 13.9% 10.0%
501-1,000 9.9% 6.0%
1,001-2,000 6.9% 8.0%
2,001 or more 15.8%
2,001-5,000 14.0%
5,001-10,000 9.0%
10,001-15,000 3.0%
15,001-20,000 2.0%
20,001 and above 10.0%
13
Outlook for Second Quarter 2012
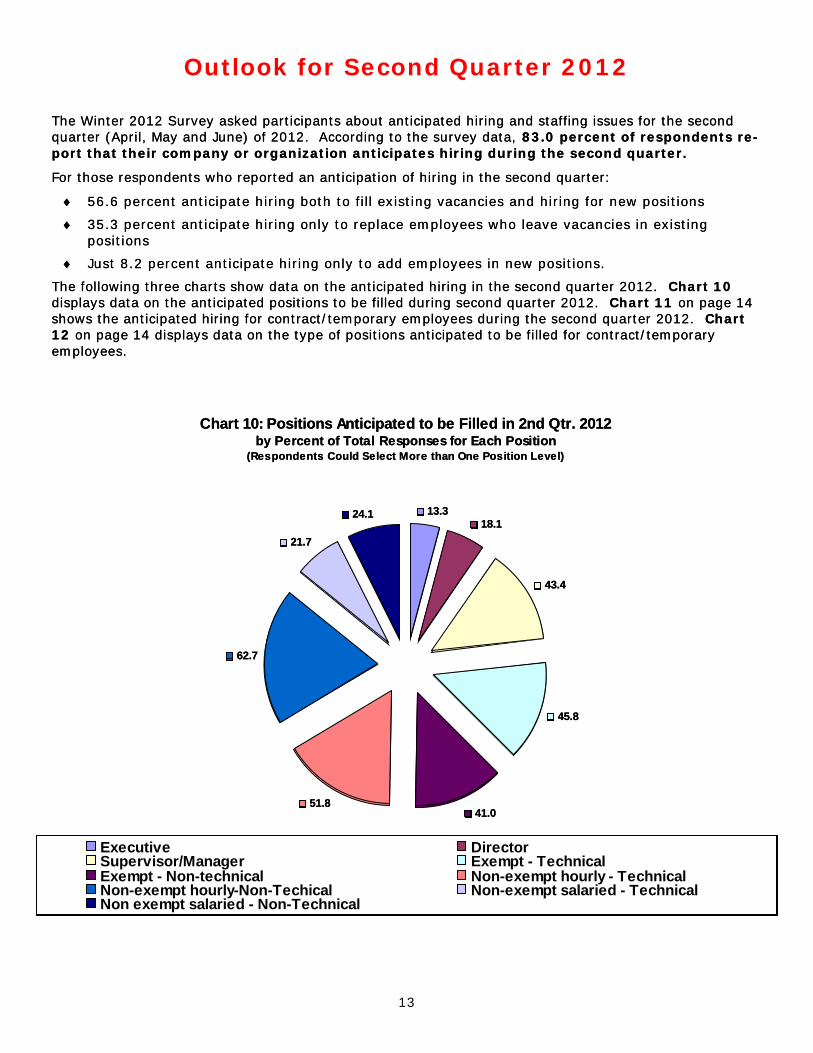
The Winter 2012 Survey asked participants about anticipated hiring and staffing issues for the secondquarter (April, May and June) of 2012. According to the survey data, 83.0 percent of respondents re-port that their company or organization anticipates hiring during the second quarter.
For those respondents who reported an anticipation of hiring in the second quarter:
56.6 percent anticipate hiring both to fill existing vacancies and hiring for new positions
35.3 percent anticipate hiring only to replace employees who leave vacancies in existingpositions
Just 8.2 percent anticipate hiring only to add employees in new positions.
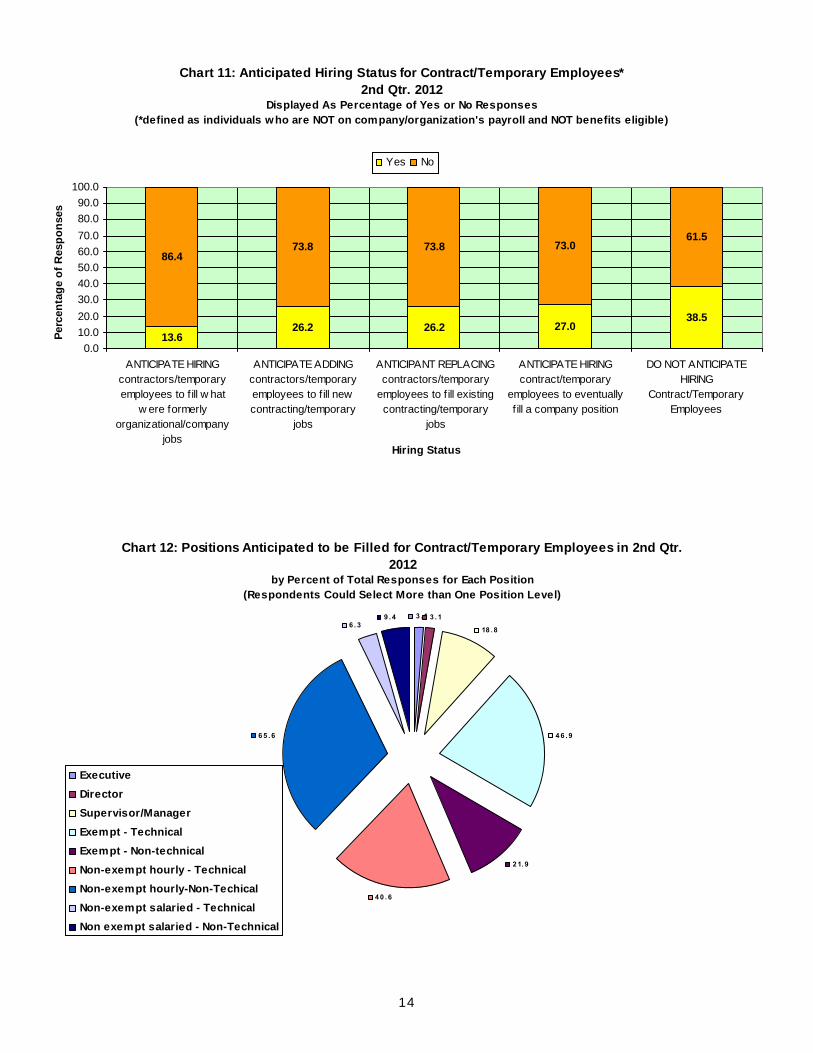
The following three charts show data on the anticipated hiring in the second quarter 2012. Chart 10displays data on the anticipated positions to be filled during second quarter 2012. Chart 11 on page 14shows the anticipated hiring for contract/temporary employees during the second quarter 2012. Chart12 on page 14 displays data on the type of positions anticipated to be filled for contract/temporaryemployees.
Chart 10: Positions Anticipated to be Filled in 2nd Qtr. 2012by Percent of Total Responses for Each Position
(Respondents Could Select More than One Position Level)
13.318.1
43.4
45.8
41.051.8
62.7
21.7
24.1
Executive DirectorSupervisor/Manager Exempt - TechnicalExempt - Non-technical Non-exempt hourly - TechnicalNon-exempt hourly-Non-Techical Non-exempt salaried - TechnicalNon exempt salaried - Non-Technical
The Winter 2012 Survey asked participants about anticipated hiring and staffing issues for the secondquarter (April, May and June) of 2012. According to the survey data, 83.0 percent of respondents re-port that their company or organization anticipates hiring during the second quarter.
For those respondents who reported an anticipation of hiring in the second quarter:
56.6 percent anticipate hiring both to fill existing vacancies and hiring for new positions
35.3 percent anticipate hiring only to replace employees who leave vacancies in existingpositions
Just 8.2 percent anticipate hiring only to add employees in new positions.
The following three charts show data on the anticipated hiring in the second quarter 2012. Chart 10displays data on the anticipated positions to be filled during second quarter 2012. Chart 11 on page 14shows the anticipated hiring for contract/temporary employees during the second quarter 2012. Chart12 on page 14 displays data on the type of positions anticipated to be filled for contract/temporaryemployees.
Chart 10: Positions Anticipated to be Filled in 2nd Qtr. 2012by Percent of Total Responses for Each Position
(Respondents Could Select More than One Position Level)
13.318.1
43.4
45.8
41.051.8
62.7
21.7
24.1
Executive DirectorSupervisor/Manager Exempt - TechnicalExempt - Non-technical Non-exempt hourly - TechnicalNon-exempt hourly-Non-Techical Non-exempt salaried - TechnicalNon exempt salaried - Non-Technical
14
Chart 11: Anticipated Hiring Status for Contract/Temporary Employees*2nd Qtr. 2012
Displayed As Percentage of Yes or No Responses(*defined as individuals who are NOT on company/organization's payroll and NOT benefits eligible)
13.626.2 26.2 27.0
38.5
86.473.8 73.8 73.0
61.5
0.010.020.030.040.050.060.070.080.090.0
100.0
ANTICIPATE HIRINGcontractors/temporaryemployees to f ill w hat
w ere formerlyorganizational/company
jobs
ANTICIPATE ADDINGcontractors/temporaryemployees to f ill newcontracting/temporary
jobs
ANTICIPANT REPLACINGcontractors/temporary
employees to f ill existingcontracting/temporary
jobs
ANTICIPATE HIRINGcontract/temporary
employees to eventuallyf ill a company position
DO NOT ANTICIPATEHIRING
Contract/TemporaryEmployees
Hiring Status
Perc
enta
ge o
f Res
pons
es
Yes No
Chart 12: Positions Anticipated to be Filled for Contract/Temporary Employees in 2nd Qtr.2012
by Percent of Total Responses for Each Position(Respondents Could Select More than One Position Level)
3 . 1 3 . 1
18 . 8
4 6 . 9
2 1. 9
4 0 . 6
6 5 . 6
6 . 39 . 4
ExecutiveDirectorSupervisor/ManagerExempt - TechnicalExempt - Non-technicalNon-exempt hourly - TechnicalNon-exempt hourly-Non-TechicalNon-exempt salaried - TechnicalNon exempt salaried - Non-Technical