final_report_124
TRANSCRIPT

CENG 124B, Spring 2016Dr. Fakhimi Dr. Russ
Section A01, Team 9, Final Project Report
Removal of Ammonium Hydroxidein Ethanol Solution
Authors: Alan Tam, Yuanyuan LiuJoseph Guarnes, Thanh-Phuong Nguyen
Advising Professor: Dr. Fakhimi
Project Manager: Robin Ihnfeldt

CENG 124B, Spring 2016Dr. Fakhimi Dr. Russ
To: Dr. Ihnfeldt
From: Team 9, Section A01
Alan Tam, Yuanyuan Liu, Joseph Guarnes, Thanh-Phuong Nguyen
Date: June 2nd, 2016
Subject: Final Project Report on the Stober Silica project # 7
Dear Dr. Ihnfeldt,
In this report, we have optimized the bubble size and the size of the bubble bed column. Ourteam also reported our estimated cost of the distillation column. Further work is needed to be doneon the Aspen simulation for distillation as the previous Aspen results did not suffice.
If you have any questions, please do not hesitate to contact us.
Best Regards,
Alan Tam Yuanyuan Liu
Joseph Guarnes Thanh-Phuong Nguyen

Contents1 INTRODUCTION 2
2 PROJECT STATEMENT 3
3 PAST RESEARCH 3
4 DESIGN AND SPECIFICATIONS 44.1 Method 1: Distillation Column . . . . . . . . . . . . . . . . . . . . . . . . . . . 44.2 Method 2: Bubble Bed and Carbon Bed . . . . . . . . . . . . . . . . . . . . . . . 4
5 SAFETY ANALYSIS 9
6 SIZING AND COSTING 116.1 Bubble Bed and Carbon Bed . . . . . . . . . . . . . . . . . . . . . . . . . . . . . 116.2 Distillation Column . . . . . . . . . . . . . . . . . . . . . . . . . . . . . . . . . . 12
7 ENVIRONMENTAL IMPACT STATEMENT 157.1 Inventory . . . . . . . . . . . . . . . . . . . . . . . . . . . . . . . . . . . . . . . 157.2 Assessment . . . . . . . . . . . . . . . . . . . . . . . . . . . . . . . . . . . . . . 157.3 Evaluation . . . . . . . . . . . . . . . . . . . . . . . . . . . . . . . . . . . . . . . 17
1

1 INTRODUCTION
The Stober Silica reaction is a nanoparticle generation process that can be used for preparation
of monodispersed silica nanoparticles of various diameters. Not only silica abrasives have wide
applications in physical chemistry but also in pharmacy, photographic emulsions and chemical
mechanical polishing.1 The Stober reaction is expressed as
Si(OC2H5)4 +2H2O−−→ SiO2 +4C2H5OH (1)
General Engineering Research, L.L.C (GE&R) uses this process to manufacture silica nanopar-
ticles with 20− 200nm diameters at high purity by varying the concentration of ammonium hy-
droxide since it affects the size of the silica products. The bulk of the material cost is from ethanol
because the Stober reaction uses a lot of ethanol. The process flow diagram of Stober silica process
is shown in Fig. 1.
The product is centrifuged in order to separate silica particles from the waste stream. The silica
product is then collected from the centrifuge while the waste stream is treated. Since the concen-
tration of the ammonium hydroxide affects the size of the particle, it is important to completely
remove it from the waste stream.1K. Nozawa H. Gaihanou, L. R. e. a. Smart Control of Monodisperse Stber Slica Particles: Effect of Reactant
Addition Rate on Growth Process. Langmuir (ACS Publications) 2004.
Figure 1: PFD of the Stober Silica Process
2

2 PROJECT STATEMENT
The main issue with the Stober process is that it uses a large amount of ethanol which accounts
approximately 85 % of the material cost as noted from The main objective of this project is to
recycle ethanol from the waste stream. The waste stream is composed of ethanol (90%), water
(<2%), ammonium hydroxide (<2%), a bit of TEOS (<1%) and potentially other organic/alcohol
byproducts. According to Dr. Ihnfeldt, the pH of the waste stream is approximately 11, which
allows ammonia to be in a gas phase due to lack of protons.
NH4++OH−⇀↽NH3 +H2O (2)
According to the equilibrium reaction shown in Eq. (2), ammonia will not protonate unless
acid is added to the waste stream. When acid is added the to waste stream, the available protons
will shift the equilibrium to the left producing ammonium. Thus at pH of 11, the waste stream will
contain dissolved ammonia gas.
3 PAST RESEARCH
In the previous progress reports, it was briefly mentioned that utilizing reverse osmosis was not
considered for the project to do limited performance and high cost of the operations.2 In addition,
three other methods were analyzed. Firstly, the TransMemberanceChemiSorption (TMCS) was
found to be ineffective in ethanol solution because it breaks the membrane down easily compare
to water solution.3 Lastly, the stripping column was analyzed and simulated from ASPEN which
showed separation results between ammonia and ethanol. However, it was not considered due to
the inexplicably low exit stream temperature and high costs from Aspen.
2J.P. Choudhury, P. G.; Guha, B. Separation of Ethanol From Ethanol-Water Mixture by Reverse Osmosis. Biotech-nology and Bioengineering 1984, 27, 1081–1084.
3Performance, M. U. Using ’TransMembraneChemiSorption’ (TMCS) for Ammonia Removal from IndustrialWaste Waters.
3

4 DESIGN AND SPECIFICATIONS
4.1 Method 1: Distillation Column
The distillation column was utilized to remove the ammonia in the ethanol solution. The As-
pen simulations calculate the product compositions based on the Edmister approach based on the
number of stages, the feed location, reflux ratio, and pressures of condenser and reboiler.4 Ide-
ally, a completed removal of ammonia would be preferred; however, an amount of less than 0.1%
of ammonia left in the solution would be acceptable. The feed of this distillation consisted of
1.524kmol/hr of ethanol, a very small amount of water of 0.04815kmol/hr and 0.0321kmol/hr
of ammonia. There were 15 stages and reflux ratio of 2. The bottom stream (labeled as BOTT)
showed that less than 0.001 kmol/hr of ammonia remained along with 1.52kmol of ethanol and
0.048kmol of water solution as shown in Table 1. The percentage of ammonia left in the solution
is 0.001% (lower than the 0.1% requirement). The heat duties of both the condenser and reboiler
were taken into account to compare how effective and energy efficient the system was. The heat
duty of condenser and reboiler were calculated to be 158.65kW and 270.58kW respectively.
4.2 Method 2: Bubble Bed and Carbon Bed
The two processes used to remove the ammonium hydroxide were further considered under dif-
ferent conditions. The waste stream was first sent to a simple bubble bed reactor to remove most
of the ammonium hydroxide in the stream. The bottom stream of this reactor contained mostly
ethanol and the remaining amount of ammonium hydroxide, which could then be eliminated up to
66% by using an activated carbon bed reactor.5 A PFD of the system can be found in Fig. 2.
The bubble bed was simplified and simulated in Aspen as a flash column with one feed as
the waste stream and the others as the air stream. Different temperatures were selected from
4Luyben, W. L., Distillation Design and Control Using Aspen Simulation, 2nd ed.; John Wiley Sons, Inc: NewJersey, 2013.
5C. C. Rodrigues D. Moraes Jr., S. W. N. M. G. B. Ammonia Adsorption in a Fixed Bed of Activated Carbon.Bioresource Technology 2007, 98, 886–891.
4

Table 1: Steam Table for Distillation Column
Figure 2: PFD of Removal of Ammonium Hydroxide Process
5

Table 2: Stream table for Flash Column at 28 degree
28◦C to 40◦C to determine the lowest operational temperature with good separation without losing
significant amount of ethanol. The Aspen simulations showed that as the operation temperature of
the bubble bed column increased, the higher the percentage of ammonium hydroxide removal, from
92.4% to 95.7% as the temperature was increased from 28◦C to 40◦C. The increase in temperature
also led to an increase in the amount of ethanol loss. There was a trade-off between the percentage
of ammonium hydroxide removed and the amount of ethanol loss. The percentage of ammonium
hydroxide remained in the final ethanol product after the bubble bed column was approximately
1.5% for all temperatures within 28◦C to 40◦C, it was considered to be more beneficial to operate
the column at the lowest temperature possible, at 28◦C, as it lost the least amount of ethanol.
The Aspen simulation result for the Air Stripping column can be found in Table 2. The oper-
ation temperature of the column was at 28◦C, as close to the boiling temperature of ammonium
hydroxide (24.7◦C) as possible. Assuming the column is operated 8 hours per day, its waste stream
flow rate would be at 1.605kmol/hr. The air stream inlet was also set at 0.05kmol/hr. The resulted
bottom stream (liquid) contained approximately 0.147% of ammonium hydroxide. Under the oper-
ation condition, about 10% of ethanol was lost to the vapor stream. All streams displayed negative
enthalpy values, indicating that the system released energy in the separation process of ammonium
hydroxide from liquid into vapor form.
6

Figure 3: Comparison of the Mass Transfer Rates with Various Col-umn Heights for 0.25, 0.5, and 1 cm in Bubble Diameter
More specifications were considered for the bubble bed reactor such as the diameter, velocity
and distribution of the air bubble, and the height of the bubble bed column. Assuming the bubbles
were in the homogeneous flow regime with uniform distribution over the cross section area of the
bubble bed reactor, the bubbles should have low gas velocity with uG less than or equal 0.05m/s,
according to Yamashita et al. (1979).6 The activated carbon bed was then fed with the ethanol
mixture from the bubble bed reactor. As the waste stream of the Stober process had approximately
2452ppm of ammonium hydroxide, the activated carbon bed was considered to be appropriate
for the recycling process of ethanol. At 40◦C, the adsorption capacity of activated carbon was
found to be 0.6 to 1.8 mg NH3/g C, using a total of 50 g of activated carbon in a solution with
the initial ammonia concentration Co of 600-2400 ppm.7 Assuming the removal efficiency of the
activated carbon to be between 68%-76%, the final ethanol product would have less than 0.1%
of residual ammonium hydroxide in ethanol, which would meet the requirement for the recycled
ethanol stream.8
In order to find the optimum bubble and column size for the bubble bed reactor, the mass
6F. Yamashita, Y. M.; Fujuta, S. Sizes and Size Distributions of Bubbles in a Bubble Column-Comparison betweenTwo Point Electric Probe Method and the Photographic Method. J. Chem. Eng. Japan 1979, 12, 5–9.
7C. C. Rodrigues, “Ammonia Adsorption in a Fixed Bed of Activated Carbon”.8Ibid.
7

transfer coefficient (Kc) was calculated for reasonable bubble sizes. The mass transfer coefficient
is defined as
Kc = 2√
DAB
πtc(3)
where DAB is the diffusivity coefficient of ammonia to air and tc is the contact time between
the two species. The mass transfer rates were then found and plotted in Fig. 3 using the Kc values
and the equation
nA = Kc∆CAA (4)
where nA is the mass transfer rate (mol/s), A is the surface area (m2) and ∆CA is the ammonia
concentration gradient (mol/m3).
Fig. 3 shows that a bubble diameter of 1cm has the highest mass transfer rate, and would theo-
retically strip the most ammonia. However since larger bubbles take up more space, the number of
bubbles that can fit in the column would be fewer. Moreover, larger bubbles have a higher tendency
to collide, which in turn decreases the surface area. Therefore, to optimize the surface area and
thus the mass transfer rate, it is better to have a higher distribution of smaller bubbles. The sum
of the surface area of smaller bubbles is higher than the surface area of one big bubble. A bubble
diameter of 0.5cm was therefore chosen over a bubble with 1cm diameter. The chosen bubbles will
have a terminal velocity of 16cm/s using the Davies and Taylors equation which is expressed as:
v∞ = 0.707√
gde (5)
where g is the force of gravity and de is the diameter of the bubble.9
In Fig. 3, the mass transfer rate decreases along the liquid column height because the concen-
tration gradient gets smaller along the column. The mass transfer rate plateaus around a column
9Davies, R. M.; Taylor, G. I. The Mechanics of Large bubbles Rising Through Liquids in Tubes. Proc. of Roy.Soc. 1950, 12, 375–390.
8

height of 2m; therefore, the liquid column height of 1.5m was chosen due to its efficiency. With the
liquid height of 1.5m, the contact time of the bubble is around 9.6s given that the time is determined
by dividing the column height with the terminal velocity.
Given that the operating pressure and temperature are standard (e.g. 1atm and 25◦C), it is not
cost effective to use any sort of metal as a material for the column. Instead, the column will be
made out of polycarbonate as it can easily withstand standard pressure and temperature at low cost.
5 SAFETY ANALYSIS
The failure mode effect analysis (FMEA) was used on the air stripping column and the activated
carbon columns to identify possible process for each step. Because the waste stream is highly
volatile and flammable, it is necessary to access every possible failures of every step of the process
to protect the workers, the public and the environment.
As shown from Table 3 and Table 4, the vessel rupture risk needs additional mitigation due to
feeds volatility and flammability. The workers, the public and the environment will be exposed
to waste stream which will lead to great harm due to its harmful properties. The Hazard and
Operability Study (HAZOP) analysis is implemented on the overall system as shown on Table 10 in
the Appendices, which evaluates every line and vessel for the recycle process regarding deviations
from intentions, causes of them and consequences.
These hazards (as shown in Section 7.3 below) are important to consider as they not only affect
the product streams of the flash column but also jeopardize the safety of the workers and the public
(such as vessel rupture, leakage, etc.). It is desirable to separate ammonium hydroxide from the
feed. However, it must be done without leakage, vessel rupture, flow blockage and equipment
failure because the feed is highly flammable and volatile. Therefore valve controls, temperature
controls are implemented to the system as shown in Fig. 4 to mitigate the risk of these hazards.
9
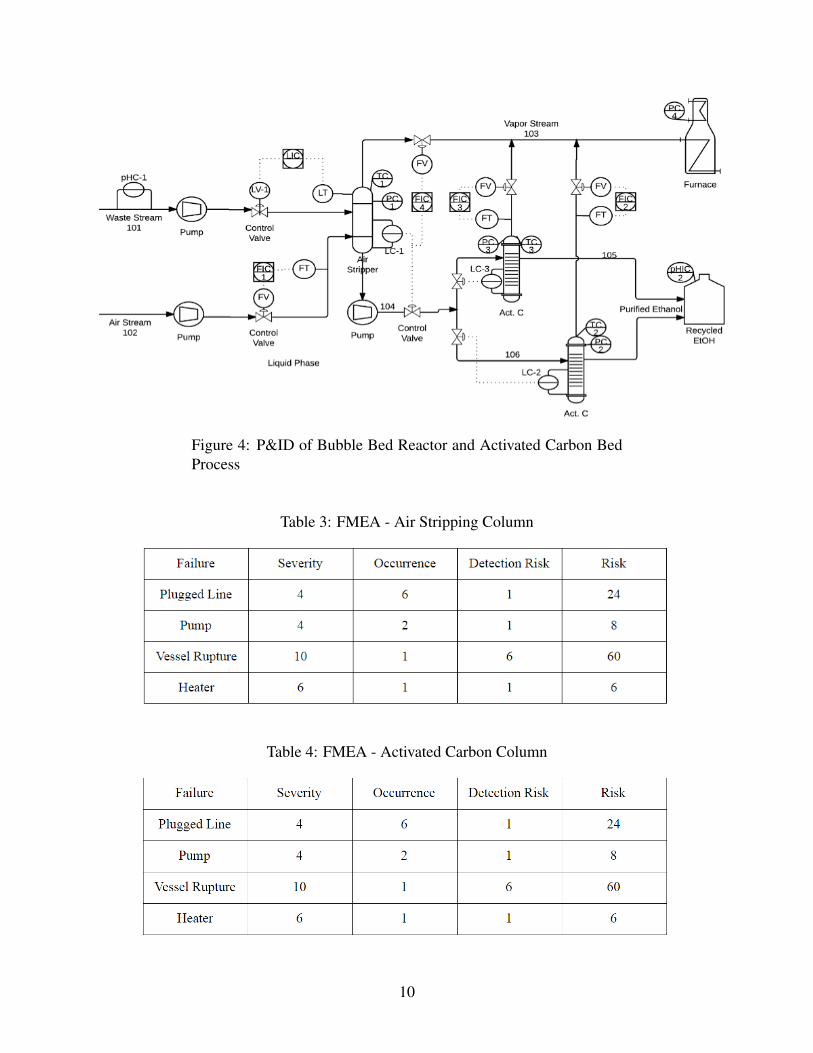
Figure 4: P&ID of Bubble Bed Reactor and Activated Carbon BedProcess
Table 3: FMEA - Air Stripping Column
Table 4: FMEA - Activated Carbon Column
10
6 SIZING AND COSTING
6.1 Bubble Bed and Carbon Bed
The sizing of the bubble bed columns were calculated. For the bubble bed, the height of the column
is 2.0m which takes into the account of the liquid column height (1.5m), the head space and the
air space at the bottom of the column. Given the total flow rate (1.29375kmol/hr) and the contact
time (9.6s or 0.00266hr), the volume of the bubble bed column is 3444cm3. Using the height of
the column and the volume, the radius of the column is 2.3cm.
The sizing of the activated carbon bed was calculated by determining the required amount of
granulated activated carbons to adsorb ammonia from the stream. In Table 2, the exiting liquid
stream has 0.023kmol/hr of ammonia and it takes 1g of activated carbon to remove an average
of 1.2mg ammonia (from Design and Specifications sections). Therefore, the required amount to
adsorb ammonia until there is less than 0.5% of it left in the stream is 227.08kg. Using the weight
and the density of activated carbon, the required activated carbon bed volume is 0.1081m3. With
the column height of 1.5m, the radius of the column is 0.1515m. Regarding the cost, the price of
activated carbon is $8.70 per kg. With the required weight of 227.08kg, the cost of activated carbon
is $1975.60 for one column. Since there are two activated carbon beds, the total cost of activated
carbon is $3951.2.
11

Table 5: Cost of Bubble Bed and Carbon Bed
Material Cost per Unit Amount Cost
Activated Carbon $8.70/kg 554.16 kg $3,951.20
Carbon Bed: Clear
Acrylic Cylinder,
6”x6”
$20.00/unit 4 units $80.00
Bubble Bed: Plex-
iglass 3” OD, 2
3/4” IDx12”
$15.99/unit 5 units $79.95
Total $4,111.15
Table 5 shows the necessary raw material for the bubble bed and carbon bed. The reason
why stainless steel was not chosen is that metal would easily dissipate the heat from the system
which is working at temperature 28 ◦C and 40 ◦C. Acrylic and plexiglass were chosen to be the
columns material. Table 5 also shows the cost of the activated carbon and column material. The
total was calculated to be $4,111 which was much lower than the calculated cost for distillation
column. With the consideration of the size of the process, it is more beneficial economically and
functionally to implement the bubble bed and carbon bed.
6.2 Distillation Column
The cost of distillation was given by B/R Instrument Corporation. It can be found in Table 6. The
distillation set includes a 6in diameter 15-stage packed column, a reboiler, a condenser, a 100L
stainless steel pot, stirring mantle for the steel pot, a mounting frame, receivers and controls.
12

Table 6: Cost of Distillation Column
It is expected that the distillation system would last for ten years. However, as the year passes,
the value decreases due to continuous wear and tear. Table 7 shows the accumulated depreciation
of the system over the course of ten years. The total depreciation of the distillation is $46961.04.
Table 8 displays the total cost of the distillation system over the course of ten years which accounts
for the the worker operating the system and the depreciation. The total cost of the system is
estimated to be $969011.
13

Table 7: Depreciation of Distillation Column
Table 8: Total of the distillation system over ten years
14

7 ENVIRONMENTAL IMPACT STATEMENT
The environmental impact of the project is evaluated in this environmental impact statement. The
purpose of the project is to recycle ethanol from the waste stream of a Stober Silica process, thus
lowering material costs for the process. Our proposed action is the construction of an ammonia
purification process, which separates the ammonia from the ethanol and ultimately incinerates the
ammonia and other wastes. For this study, the affected environment is taken to be the proposed
location of the plant; the neighborhood of Sorrento Valley which is in San Diego, CA. In consider-
ation are the effects on the local air, water and land quality, plant and animal life, socioeconomic
factors, and more.
7.1 Inventory
The environment of Sorrento Valley is a populated urban/business district. The business areas
consist of tech, industrial, and chemical companies while the neighborhoods consist of upper-
middle class families. The area is also near a train station and multiple freeways, therefore local
noise levels are moderate to high. It also has a high plant and animal biodiversity concentration,
as well as multiple nearby water sources.10 The area has multiple valleys and hence is dry, with
occasional floods. Despite all the previous conditions, the air, water, and land are all clean and of
good quality.11
7.2 Assessment
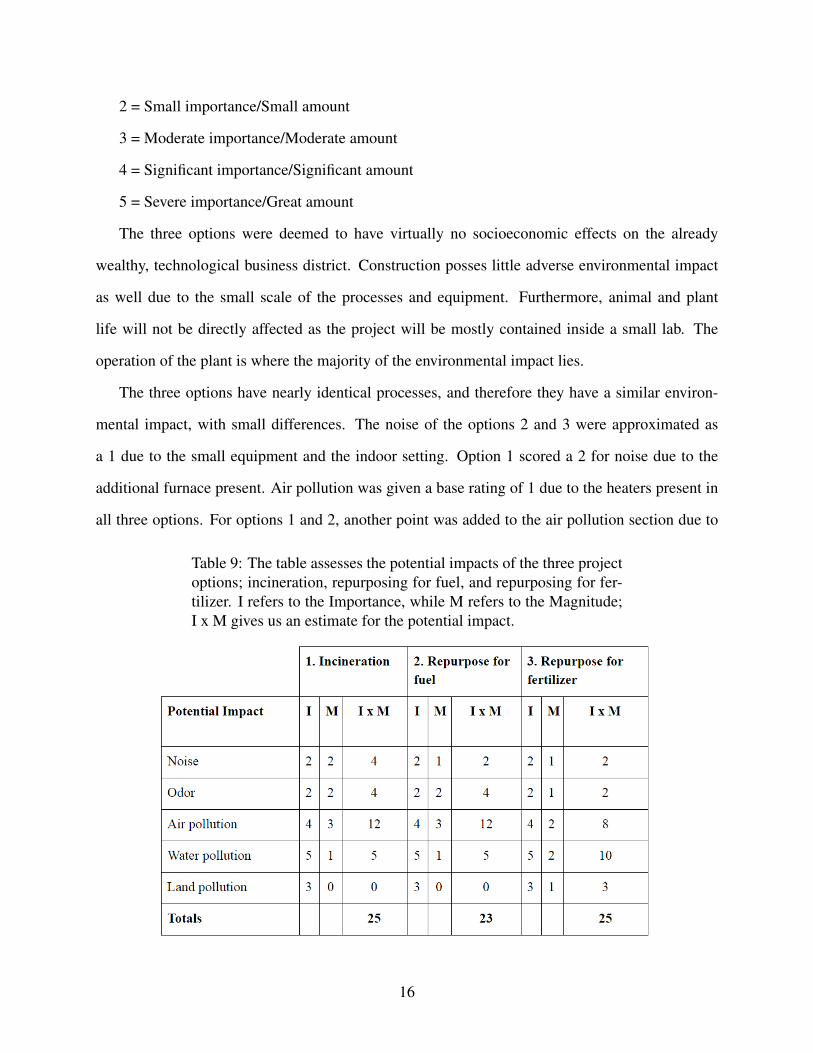
The assessment chart (Table 9) comes from estimates of the importance of various environmental
factors, and estimates of the magnitude that the project would have on such environmental factors.
The numbers range on the arbitrary scale from 0 to 5. The scale is described below:
0 = No importance/None
1 = Minimal importance/Minimal amount
10The San Diego Wildfires Education Project.11Of San Diego, A. P. C. D. C. Air Quality Forecast.
15
2 = Small importance/Small amount
3 = Moderate importance/Moderate amount
4 = Significant importance/Significant amount
5 = Severe importance/Great amount
The three options were deemed to have virtually no socioeconomic effects on the already
wealthy, technological business district. Construction posses little adverse environmental impact
as well due to the small scale of the processes and equipment. Furthermore, animal and plant
life will not be directly affected as the project will be mostly contained inside a small lab. The
operation of the plant is where the majority of the environmental impact lies.
The three options have nearly identical processes, and therefore they have a similar environ-
mental impact, with small differences. The noise of the options 2 and 3 were approximated as
a 1 due to the small equipment and the indoor setting. Option 1 scored a 2 for noise due to the
additional furnace present. Air pollution was given a base rating of 1 due to the heaters present in
all three options. For options 1 and 2, another point was added to the air pollution section due to
Table 9: The table assesses the potential impacts of the three projectoptions; incineration, repurposing for fuel, and repurposing for fer-tilizer. I refers to the Importance, while M refers to the Magnitude;I x M gives us an estimate for the potential impact.
16

the extra release of ammonia into the air when the waste is burned/used for fuel; likewise for odor.
Water and land pollution had a greater score in option 3 than in options 1 and 2, due to additional
ammonia going into the ground when used as fertilizer.
7.3 Evaluation
On the arbitrarily set scale, the proposed action received a score of 25. The alternatives received
scores 23 and 25. These results show that environmentally speaking, the three options have similar
amounts of impact. The variances in impact are due to the differences in the final steps in the
processes. Incineration and repurposing for fuel lead to greater air pollution, while repurposing
for fertilizer leads to more water and land pollution. On a side note, the incineration option has a
greater direct impact, as the pollution occurs onsite, while pollution in the other two options occur
off site and by other parties. Overall, the impact of the proposed action, and the alternatives, is
permissible. Due to the small scale of the project, and high purification, the project will have a
small impact on the environment.
17

Appendix
Table 10: HAZOP Analysis
A-1

A-2

A-3