finalversion,january23,2003 - cnbc – center for … neurophysiol j0396-2 r 0 adaptation and...
TRANSCRIPT

J Neurophysiol J0396-2 R 0
Adaptation and Temporal Decorrelation by Single Neurons
in the Primary Visual Cortex
Xiao-Jing Wang1, Yinghui Liu1,
Maria V. Sanchez-Vives2 and David A. McCormick3
1Volen Center for Complex Systems, Brandeis University, Waltham, MA 02454, USA;
2 Instituto de Neurociencias, Universidad Miguel Hernandez-CSIC, 03550 San Juan de
Alicante, Spain
3 Department of Neurobiology, Yale University School of Medicine, New Haven, CT
06510
Correspondence: Xiao-Jing Wang, Center for Complex Systems, MS 013,
Brandeis University, Waltham 02454. Phone: 781-736-3147, fax: 781-736-2915,
email: [email protected]
Abbreviated title: Temporal decorrelation by intrinsic cellular dynamics
Keywords: redundancy reduction, decorrelation, contrast adaptation, sodium ac-
tivated potassium current, biophysical modeling.
Acknowledgements: We would like to thank Sacha Nelson and Nicolas Brunel for a
critical reading of this paper. This work was supported by the NSF, the Alfred P. Sloan
Foundation and the Swartz Foundation to XJW; by grants GV00-138-3 (Generalitat Va-
lenciana) and PM98-0102-CO2-01 (DGCYT, Spain) to MVSV; by NEI R01 to DAM.
Final version, January 23, 2003

J Neurophysiol J0396-2 R 1
Abstract
Limiting redundancy in the real-world sensory inputs is of obvious benefit
for efficient neural coding, but little is known about how this may be accom-
plished by biophysical neural mechanisms. One possible cellular mechanism
is through adaptation to relatively constant inputs. Recent investigations
in primary visual (V1) cortical neurons have demonstrated that adaptation
to prolonged changes in stimulus contrast is mediated in part through in-
trinsic ionic currents, a Ca2+-activated K+ current (IKCa) and especially a
Na+-activated K+ current (IKNa). The present study was designed to test
the hypothesis that the activation of adaptation ionic currents may provide a
cellular mechanism for temporal decorrelation in V1.
A conductance-based neuron model was simulated, which included an
IKCa and an IKNa. We show that the model neuron reproduces the adaptive
behavior of V1 neurons in response to high contrast inputs. When the stimulus
is stochastic with 1/f 2 or 1/f -type temporal correlations, these autocorrela-
tions are greatly reduced in the output spike train of the model neuron. The
IKCa is effective at reducing positive temporal correlations at approximately
100 msec timescale, while a slower adaptation mediated by IKNa is effective
in reducing temporal correlations over the range of 1-20 sec.
Intracellular injection of stochastic currents into layer 2/3 and 4 (pyra-
midal and stellate) neurons in ferret primary visual cortical slices revealed
neuronal responses that exhibited temporal decorrelation in similarity with
the model. Enhancing the slow afterhyperpolarization resulted in a strength-
ening of the decorrelation effect. These results demonstrate that intrinsic
membrane properties of neocortical neurons provide a mechanism for decor-
relation of sensory inputs.

J Neurophysiol J0396-2 R 2
1 Introduction
In natural environments, sensory inputs from the external world to the brain are
statistically redundant, characterized by strong and long-range correlations in space
(Ruderman and Bialek 1994, Ruderman 1994) and in time (Dong and Atick 1995a,
van Hateren and van der Schaaf 1996). In order for the brain to encode sensory
stimuli and detect changes efficiently, it is desirable to reduce input redundancy
through a decorrelation operation (Attneave 1954, Barlow 1961, Srinivasan et al.
1982, Barlow and Foldiak 1989, Atick 1992, Field 1994). In the visual system,
theoretical models, natural-scene analysis and physiological studies have shown that
decreases of redundancy by decorrelation is key to the efficient neural encoding of
images (Laughlin 1981, Dong and Atick 1995b, Olshausen and Field 1996, Dan et al.
1996, Bell and Sejnowski 1997, Vinji and Gallant 2000. For a review see Simoncelli
and Olshausen 2001). Barlow (1961, 1990) suggested that decorrelation could be
subserved by neuronal adaptation in the neocortex. This idea is supported by recent
work demonstrating that neuronal adaptation occurs over a wide range of timescales
(Fairhall et al., 2001) and that these adaptation dynamics can serve to maximize
information transmission (Baddeley et al. 1997, Wainwright 1999, Brenner et al.
2000). It is thus of considerable interest to identify cellular and synaptic mechanisms
of adaptation and to investigate whether the same mechanisms can also subserve
decorrelation in the brain.
In the primary visual cortex (V1), a neuron’s response to a low-contrast visual
pattern is substantially reduced (adapted) following a few seconds of stimulation
(Blackmore and Campbell 1969, Maffei et al. 1973, Movshon and Lennie 1979,
Ohzawa et al. 1985, Sclar et al. 1985, Greenlee and Heitger 1988, Vidyasagar
1990, Nelson 1991, Greenlee et al. 1991, Ahmed et al. 1997, Carandini et al.
1998, Dragoi et al. 2000). This history-dependent adaptive gain control allows
visual cortical neurons to display a high sensitivity, without being limited by sat-
uration or insensitivity. In addition, pattern adaptation provides a mechanism to
reduce redundancy in the processing of natural scenes - by removing temporally
constant stimuli while remaining responsive to more rapid changes. Several mecha-

J Neurophysiol J0396-2 R 3
nisms have been proposed for contrast adaptation of V1 neurons, including a slow
form of synaptic depression (time constant 10 sec) (Finlayson and Cynader 1995,
Chance et al. 1998, Adorjan et al. 1999). Recent studies with intracellular record-
ings of cat primary visual cortical neurons in vivo revealed that prolonged (tens of
seconds) presentation of optimal high contrast visual stimuli results in a hyperpo-
larization of the recorded cell (Carandini and Ferster 1997; Sanchez-Vives et al.,
2000a). This hyperpolarization correlates with the persistent decrease in sensitivity
following adaptation and appears to be generated through ionic mechanisms intrin-
sic to single neurons. For example, intracellular current injection into single cortical
cells could replicate the hyperpolarization induced by high contrast visual stimuli
(Sanchez-Vives et al 2000a). Examination of similar hyperpolarizations generated
in response to prolonged action potential activity in vitro reveal that it is generated
by a Ca2+-activated K+ current IKCa and especially a Na+-activated K+ current
IKNa (Sanchez-Vives et al., 2000b).
Based on these data, we constructed a conductance-based model of a visual corti-
cal neuron endowed with IKCa and IKNa. The model was calibrated by reproducing
the adaptive neural response to long-lasting sinusoidal currents (Sanchez-Vives et al.
2000b). Using correlated stochastic inputs (with second-order statistics of natural-
scenes), we show that adaptation currents endow the model neuron with the ability
to remove long-range temporal correlations in the input so that the output spike dis-
charges are decorrelated at long timescales. Applying the same protocol of stochastic
inputs to V1 cells in cortical slices, we found that neurons of primary visual cortex
can indeed remove long-range temporal correlations in the stochastic inputs. Fur-
thermore, an enhancement of the slow hyperpolarization in single cells increased
the degree of decorrelation. These results suggest that intrinsic adaptation ionic
currents provide a candidate cellular mechanism for temporal decorrelation in V1
neurons.

J Neurophysiol J0396-2 R 4
2 Methods
2.1 The model
We were primarily motivated by the observation that slow membrane hyperpolar-
ization resulting from repetitive activation of cortical neurons is largely produced
by sodium/calcium-dependent potassium currents (Sanchez-Vives et al. 2000a-b).
Here, we implemented both types of adaptation currents in a Hodgkin-Huxley-type
conductance-based model (Hodgkin and Huxley 1952). The model was modified
from Wang (1998), with the addition of a sodium-activated potassium current IKNa.
The model has two compartments, one representing the soma/axonal initial seg-
ment (Vs), the other representing the dendrite (Vd) (Pinsky and Rinzel 1994). The
spike generating Na+ and K+ currents are located in the somatic compartment.
High-threshold Ca2+ currents ICa are distributed in both compartments and acti-
vate Ca2+-dependent K+ currents IKCa. A slow Na+-activated K+ current IKNa is
located in the somatic compartment.
The model obeys the following seven differential equations:
CmdVs
dt= −IL − INa − IK − ICa,s − IKCa,s − IKNa − (gc/p)(Vs − Vd) + I (1)
dh
dt= φh(αh(Vs)(1 − h) − βh(Vs)h) (2)
dn
dt= φn(αn(Vs)(1 − n) − βn(Vs)n) (3)
d[Ca2+]sdt
= −αCa,sICa,s − [Ca2+]s/τCa,s (4)
d[Na+]idt
= −αNaINa − 3Rpump(ϕNa([Na+]i) − ϕNa([Na+]eq)) (5)
CmdVd
dt= −IL − ICa,d − IKCa,d − (gc/(1 − p))(Vd − Vs) (6)
d[Ca2+]ddt
= −αCa,dICa,d − [Ca2+]d/τCa,d (7)

J Neurophysiol J0396-2 R 5
where Cm = 1 µF/cm2, I is the applied current, and the leak current is IL = gL(V −
VL). The coupling current between soma and dendrite is proportional to (Vs − Vd),
with coupling conductance gc = 2 mS/cm2. The parameter p =(somatic area /
total area) = 0.5. Maximum conductances gL = 0.1, gNa = 45, gK = 18, gCa,s =
gCa,d = 1, gKCa,s = gKCa,d = 5, gKNa = 5 in mS/cm2. The reversal potentials
VL = −65, VNa = +55, VK = −80, VCa = +120 in mV.
The voltage-dependent currents are described by the Hodgkin-Huxley formalism
(Hodgkin and Huxley 1952). The dynamics of the gating variable x follows first-
order kinetics:
dx
dt= φx [αx(V )(1 − x) − βx(V )x)]
= φx [x∞(V ) − x] /τx(V ) (8)
with x∞(V ) =α(V )/[α(V )+β(V )] as the steady state value and τx(V ) = 1/[α(V )+
β(V )] as the time constant, and φx is the temperature factor.
The sodium current in the somatic compartment is INa = gNam∞
3(Vs)h(Vs −
VNa). The fast activation variable m is replaced by its steady state value m∞(Vs)
(given that τm is only a fraction of a millisecond): m∞ = αm/[αm+βm] and αm(V ) =
−0.1(V + 33)/{exp[−0.1(V + 33)] − 1} and βm(V ) = 4 exp[−(V + 58)/12]. The
inactivation variable h for INa is described by αh(V ) = 0.07 exp[−(V + 50)/10] and
βh(V ) = 1/{exp[−0.1(V + 20)] + 1}. The delayed rectifier is IK = gKn4(Vs − VK),
with the activation variable n described by αn(V ) = −0.01(V + 34)/{exp[−0.1(V +
34)] − 1} and βn(V ) = 0.125 × exp[−(V + 44)/25]. The temperature factor φh =
φn = 4.
The high-threshold calcium current ICa = gCaν∞2(V )(V −VCa), where the activa-
tion variable ν is replaced by its steady state value ν∞(V ) = 1/{1+exp[−(V +20)/9]}
because of its fast dynamics. The voltage independent, calcium-activated potassium
current IKCa = gKCa([Ca2+]i/([Ca2+]i + KD))(V − VK), with KD = 30 µM . The
intracellular calcium concentration [Ca2+]i is assumed to be governed by a linear
equation, with αCa proportional to the membrane area and the volume immediately

J Neurophysiol J0396-2 R 6
beneath the membrane, αCa = 0.002 µM(msµA)−1cm2 in the dendrite compartment
and 0.00067 µM(msµA)−1cm2 in the somatic compartment. The various extrusion
and buffering mechanisms are described collectively by a first-order decay process
with a time constant τCa = 80 msec in the dendritic compartment and 240 msec in
the somatic compartment (Helmchen et al. 1996).
The Na+-activated K+ current IKNa (Kameyama et al. 1984, Schwindt et al.
1988, Schwindt et al. 1989, Egan et al. 1992a-b, Dryer 1994) is modeled according
to a quantitative study of this ionic current in dorsal root ganglion cells (Bischoff
et al. 1998). The intracellular [Na+]i concentration is incremented by Na+ influx
through INa during action potentials. (In cortical neurons, Na+ influx could also
be contributed by synaptic currents, which we do not model here for the sake of
simplicity.) The Na+-dependent K+ current IKNa = gKNaω∞([Na+]i)(Vs − VK),
with the activation function ω∞([Na+]i) given by (Bischoff et al. 1998):
ω∞([Na+]i) =Pmax
1 + (EC50/[Na+]i)nH(9)
where Pmax = 0.37 defines the maximum opening probability of the channels.
EC50 = 38.7 mM is the [Na+]i for half activation and the Hill coefficient nH = 3.5.
The influx of [Na+]i is controlled by −αNaINa. We chose αNa = 0.0003 mM(msµA)−1cm2
so that the influx of [Na+]i is about 100 µM per action potential. This number is
consistent with the measurements using the Na+-sensitive dye SBFI from hippocam-
pal pyramidal neuron’s soma and dendrites (Jaffe et al. 1992, Rose and Ransom
1997, Rose et al. 1999). Although SBFI imaging gives only relative changes rather
than absolute Na+ concentration, indirect estimates range from 50-300 µM per spike
(Rose et al. 1999, WN Ross, personal communication).
The extrusion of [Na+]i is assumed to be largely due to a Na+/K+ ionic pump,
which extrudes three Na+ ions for every two K+ ions brought into the cell (Fain
1999). Previous in vitro studies (Sanchez-Vives et al., 2000a) show that the slow
afterhyperpolarization following prolonged discharge is mediated largely by IKNa
with a relatively small or latent contribution by the Na+/K+ pump. Therefore

J Neurophysiol J0396-2 R 7
here we have focused on the influence of IKNa on temporal decorrelation and for
simplicity have not included the current generated by the Na+/K+ pump. However,
our conclusions would remain the same, if such a current is taken into account, since
it has the same time course as IKNa.
The [Na+]i extrusion by the ion pump was modeled (Li et al. 1996) as −3Rpump
(ϕNa([Na+]i) − ϕNa([Na+]eq) where ϕNa(x) = x3/(x3 + Kp3) with Kp = 15 mM .
The cubic nonlinearity is related to the cooperative binding of three Na+ ions to the
pump molecule in the early steps of Na+ transport. Rpump = 0.0006 mM/ms. The
sodium concentration at the resting state is assumed to be [Na+]eq = 8 mM (Grafe
et al. 1982; Galvan et al. 1984). The equilibration of [Na+]i is a nonlinear process
and takes tens of seconds. The very slow kinetics of the Na+/K+ ionic pump
is important for the model to reproduce visual cortical neurons’ slow adaptation
behavior.
Model simulations were carried out on a PC Pentium computer, using the 4th
order Runge-Kutta integration method and a time step of 0.05 ms.
2.2 Temporally correlated input
The spatial-temporal power spectrum S(k, f), where k ∼ 1/L is the spatial fre-
quency and f ∼ 1/T is the temporal frequency, has been used to characterize the
second-order statistics of natural-scenes. Typically, the spatial power spectrum of
a natural image behaves ∼ 1/k2 (Ruderman 1994). The temporal power spectrum
scales like 1/f 2 when observed with a broad visual field (at large L) and 1/f when
observed with a narrow visual field (small L) (Dong and Atick 1995a, van Hateren
1997). This characteristic relationship between power and frequency reflect strong
temporal-spatial correlations present in natural-scenes. Both 1/f 2 and 1/f type
inputs were used in this study.
A temporally correlated stochastic input with 1/f 2 type spectral scaling can be
generated by an Ornstein-Uhlenbeck process as:

J Neurophysiol J0396-2 R 8
dI
dt= −I/τcorr + ση(t) (10)
where the decay time constant is τcorr = 2000 msecs, η(t) is a Gaussian white-
noise term, and σ is the standard deviation of the noise distribution. Note that
the precise value of τcorr is not important, as long as it is large enough so that the
power spectrum of the input has a reasonable range of 1/f 2 scaling (see below). The
generated input I(t) is a correlated stochastic process, its autocorrelation function
is:
< I(t)I(t + τ) >= (σ2τcorr/2) exp(−τ/τcorr), (11)
which shows a positive correlation with characteristic correlation range τcorr. The
power spectrum of I(t) is:
SI =σ2
ω2 + (1/τcorr)2(12)
Therefore, SI ∼ σ2/ω2 for 1/τcorr � ω. Therefore, a good range of 1/f 2 scaling
can be realized for a sufficiently long τcorr. The power reaches a plateau at very low
frequencies ω < 1/τcorr, or f = ω/2π < 1/(2πτcorr) ' 0.1 Hz.
There is no simple stochastic differential equation for generating 1/f -type inputs.
Therefore, we used another method, derived from an explicit 1/f power spectrum
through the inverse Fourier transform:
I(t) =∫
√
S(f) ξ(f) ei(tf+φf )df (13)
where S(f) ∼ 1/f and ξ(f) is a Gaussian white noise term with a prescribed vari-
ance, and φf is a statistically independent random phase. By this construction, the
power spectrum of I(t) is < (√
S(f) ξ(f) eiphif )2 >= S(f). Experimental evidence
indicates that the early stage of visual signal processing (such as a photoreceptor)
acts as a low-pass filter and the power for frequencies above 20 − 30 Hz is filtered
out (van Hateren 1997). To mimic this in our model, we introduced a cutoff of

J Neurophysiol J0396-2 R 9
(S(f) = 0 for f > 20 Hz).
2.3 Temporal correlation of the neuronal activity
A spike train is a point process described by a sequence of delta functions in time
s(t) =∑
i δ(t − ti). One could calculate directly the auto-correlation function of
this point process (Gabbiani and Koch 1998). However, in order to assess the
decorrelation effect, we need to compare the time correlation of the output with that
of the signal, which is an analog quantity. For this reason we converted the discrete
spike train into a continuous instantaneous rate function r(t) = 1/(ti+1 − ti) for
ti < t < ti+1. The autocorrelation function for r(t) is calculated, with normalization,
as follows:
φ(τ) =
∫ +∞
−∞r(t)r(t + τ)dt − (
∫ +∞
−∞r(t)dt)2
∫ +∞
−∞r(t)2dt − (
∫ +∞
−∞r(t)dt)2
(14)
with φ(−τ) = φ(τ), −1 ≤ φ(τ) ≤ 1 and φ(τ = 0) = 1. The same formula is used
to compute the autocorrelation function of the input current I(t). Since both are
normalized to 1 at τ = 0, the input and output autocorrelations can be compared
directly on the same graph.
The power spectrum density is calculated directly from long time series (time
duration T > 50 sec if fmin = 1/T < 0.02 Hz). We normalized the power spectrum
so that its integral (the total power) is the same for the input and the output. This
allowed the relative power at different frequencies in the input and output to be
compared.
2.4 In vitro experimental work
To test the theoretical predictions, intracellular recordings were performed from lay-
ers 2/3 and 4 (pyramidal and spiny stellate) neurons in primary visual cortex slices
from the ferret. Ferrets were cared for and used in accordance with all appropriate
regulatory guidelines. For the preparation of slices, 2-4 month old ferrets of either

J Neurophysiol J0396-2 R 10
sex were deeply anesthetized with sodium pentobarbital (40 mg/kg) and killed by
decapitation. The forebrain was rapidly removed and the hemispheres were sep-
arated with a midline incision. Four hundred microns thick coronal slices of the
primary visual cortex were cut on a vibratome (DSK Microslicer; Ted Pella, Inc.
Redding, CA). A modification of the technique developed by Aghajanian and Ras-
mussen (1989) was used to increase tissue viability. During preparation of slices,
the tissue was placed in a solution in which NaCl was replaced with sucrose while
maintaining an osmolarity of 307 mOsm. After preparation, slices were placed in an
interface style recording chamber (Fine Sciences Tools, Foster City, CA). Cortical
slices were superfused for the first 10 minutes with an equal mixture by volume of
the normal bathing medium and the sucrose-substituted solution. Following this,
normal bathing medium was switched into the chamber throughout the experiment.
Bath temperature was maintained at 34 − 35o C.
Intracellular recordings were initiated following two hours of recovery. The nor-
mal bathing medium contained (in mM): NaCl, 124; KCl, 2.5; MgSO4, 2; NaHPO4,
1.25; CaCl2, 2; NaHCO3, 26; dextrose, 10, and was aerated with 95% O2, 5% CO2 to
a final pH of 7.4. Block of transmembrane Ca2+ currents was achieved by replacing
CaCl2 with either MnCl2 or CoCl2 while sodium phosphate was omitted from the
bathing medium to avoid precipitation.
Sharp intracellular recording electrodes were formed on a Sutter Instruments
(Novato, CA) P-80 micropipette puller from medium-walled glass (1BF100, WPI
Sarasota, FL) and beveled on a Sutter Instruments beveller to final resistances of
50 - 100 megaohms. Micropipettes were filled with 2 M Kacetate. Only those cells
that maintained a stable resting membrane potential and responded to depolarizing
current injection with the generation of trains of action potential were included for
analysis. In addition to square current pulses and sinusoidal currents, correlated
stochastic currents with either 1/f 2 or 1/f statistics -the same inputs used in model
simulations- were also injected into the recorded cells. Clampex 6.0 (Axon Instru-
ments) was the software used to transform the numerical series into an injected
current. For the purpose of this study, the size of the slow afterhyperpolarization in
a cell was measured from responses to either current pulses or sinusoidal currents of

J Neurophysiol J0396-2 R 11
long duration. The temporal correlations in the output spike trains were analyzed
and compared with that of the injected waveform.

J Neurophysiol J0396-2 R 12
3 Results
3.1 Adaptive response to high-low sinusoidal current input
[Figure 1 about here.]
We first calibrated our model by simulating intracellular data from visual cor-
tical neurons (Sanchez-Vives et al. 2000b). To compare the model with data, we
used the same low-high-low intensity pattern of 2 Hz sinusoidal injected current in
the simulation as in the experiments (Fig. 1) . The 2 Hz sinusoidal current input
in the model has a mean of 2 µA/cm2. The low-intensity input (with an ampli-
tude of 0.3 µA/cm2) is applied before and after the high-intensity input (amplitude
of 3 µA/cm2, duration of 20 secs). The model cell generates two spikes per cycle
with the low-intensity input before the high-intensity input. At the beginning of
the high-intensity current, as many as nine spikes are generated during the first
cycle. The steady state of four spikes per cycle is reached after slow adaptation
(Fig. 1B). Following the high-intensity sinusoidal current, a prolonged slow after-
hyperpolarization (sAHP) of about 10 seconds can be observed (Fig. 1A). These
results are similar to those obtained with recordings of visual cortical neurons in
vitro (Sanchez-Vives et al. 2000b). The effects of IKCa and IKNa are clearly differ-
ent in the model. Since the decay time constant for [Ca2+]i is only 80 msec and 240
msec (in the dendritic and somatic compartments) and each cycle is 500 msec long,
[Ca2+]i does not accumulate over cycles and IKCa is effective as a feedback control
mechanism only within a cycle (Fig. 1D). By contrast, IKNa is much slower. During
low-intensity sinusoidal stimulation, intracellular [Na+]i has a steady state of about
14 mM (Fig. 1C). During high-intensity stimulation, [Na+]i accumulates slowly to
a plateau level of 17.5 mM. The time course is exponential with a time constant of
τadap ' 4 sec. A qualitative derivation of τadap is given in the Appendix (see also
Wang 1998, Liu and Wang 2001). The same exponential time course is seen for the
decreasing instantaneous firing rate associated with adaptation (Fig. 1B), showing
that the slow spike-frequency adaptation is caused by the increase of [Na+]i, hence

J Neurophysiol J0396-2 R 13
IKNa. The slow afterhyperpolarization following the high-intensity stimulation dis-
plays a similar time course as [Na+]i, and the decay of IKNa controls the time course
of the post-adaptation recovery of neuronal excitability. The decay time constant
of sAHP is therefore governed by the slow kinetics of the Na+/K+-pump. When
the [Na+]i is around [Na+]eq = 8 mM , its decay through the ionic pump can be ap-
proximately linearized by ϕ(Na) = ϕ(Naeq) + ϕ′(Naeq)(Na − Naeq). The equation
for [Na+]i decay back to [Na+]eq is approximately given by
d[Na+]idt
= −3Rpump ϕ′([Na+]eq)(Na − Naeq) (15)
which yields the decay time constant τNa = 1/(3Rpumpϕ′([Na+]eq)) ' 13 sec.
3.2 Decorrelation of 1/f 2-type inputs by intrinsic adapta-
tion mechanisms
In response to a long-lasting constant input, the model neuron adapts over time and
its firing activity is small in the steady state. On the other hand, since the slow IKNa
acts with a delay, rapid changes in the input cannot be filtered out and will be de-
tected and encoded by vigorous transient neural responses. Therefore, adaptation
ion channels could provide a cellular mechanism to remove temporal redundancy
in the input. To test this hypothesis, we used stochastic current injections with
prescribed autocorrelation statistics (see Methods). For a stochastic current gener-
ated from an Ornstein-Uhlenbeck process (decay time constant τcorr=2000 msecs),
the power spectrum ∼ 1/ω2 when ω � (1/τcorr) = 0.5 Hz and reaches a plateau
for small ω � (1/τcorr) (Fig. 2). The cutoff frequency for the plateau is given by
ω ' 1/τcorr, or f ' 1/(2πτcorr) ' 0.1 Hz.
As shown in Fig. 2, in response to such a correlated stochastic current, the
model neuron’s spike activity is not a linear transformation of the input (Fig. 2A).
Compared to the input, the output autocorrelation is suppressed at long timescales,

J Neurophysiol J0396-2 R 14
and is zero for τ > 2 sec (Fig. 2B). The power spectrum shows a relative enhancement
at high frequencies (> 1 Hz). Concomittantly, there is a relative loss of power at
low frequencies (< 0.1 Hz), the plateau is reduced from 1.8 for the input to 0.5 for
the output (Fig. 2C).
We noticed that decorrelation could occur even without adaptation currents, if
the model neuron fires at such a low rate that the spike discharges before and after a
long silent episode could become statistically uncorrelated. We examined this effect
by removal of the adaptation currents from the model cell. Replacing the adapta-
tion currents with constant current injection revealed that obtaining decorrelation
effects similar to those of the intact model (e.g. such as those illustrated in Fig. 2)
required the average firing rate to be very low (r < 1 − 2 Hz; data not shown).
Roughly speaking, in order to achieve significant decorrelations, the average inter-
spike interval (1/r) should be comparable to, or longer than, the input correlation
time (e.g. seconds in the present case). When the firing rate is reasonably high (10
Hz or above), this effect cannot produce significant decorrelation of input.
In the presence of the slow adaptation currents IKCa and IKNa, the activation
of IKNa occurs in response to action potential activity as a slow negative feedback
(as opposed to the constant injection of current) such that the occurrence of slow
modulations of the membrane potential are decreased, while fast modulations are
left intact. Thus the activation of adaptation currents in response to activity is
more effective in reducing slow temporal correlations without destroying the fast re-
sponsiveness of the neuron (e.g. the membrane potential is ‘recentered’ during slow
changes as opposed to just simply constantly hyperpolarized). Maintained periods
of depolarization and activity result in an increase in activation of the adaptation
current therefore a reduction in excitability, while prolonged periods of hyperpo-
larization result in a de-activation of the adaptation currents and consequently an
increase in neuronal responsiveness. Consequently, while without adaptation the
neuron’s current threshold for spike discharges is 0.5 µA/cm2, in the presence of
slow adaptation (e.g. during periods of sustained current injection), the neuron
may not fire even though the average injected current ranges from 1 − 4 µA/cm2
(Fig. 2A).

J Neurophysiol J0396-2 R 15
[Figure 2 about here.]
3.3 Decorrelation of 1/f-type inputs by IKCa and IKNa at
separate timescales
In contrast to an 1/f 2-type input generated by an Ornstein-Uhlenbeck process, an
1/f -type input displays temporal correlations over arbitrarily long timescales: its
autocorrelation is large over many seconds, and its power spectrum increases as
1/f at low frequencies (Fig. 3B-C). The input shows very slow time modulations
(Fig. 3A, top panel). Compared to Fig. 2, there is also larger fluctuations at high
frequencies, since the power decreases more slowly (1/f) than an 1/f 2 input. In the
absence of IKCa and IKNa, the model neuron transduces the input faithfully, the
autocorrelation function and power spectrum of its spike train output is identical
to those of the input (data not shown). Endowed with adaptation currents, the
model neuron shows transient activity (Fig. 3A, third panel). The autocorrelation
quickly decays to zero within 500 ms (Fig. 3B). Compared to the input, the output
power spectrum shows a strong suppression at low frequencies. In effect, the output
spectrum is flattened or ‘whitened’ for f < 0.1 Hz, in contrast to the increases
according to 1/f for the input (Fig. 3C). The transient nature of the neural activity
is not simply due to a constant hyperpolarization, but to time-dependent negative
feedback. Compare for instance the two time windows indicated by horizontal bars,
each lasting for 10 sec (Fig. 3A, top panel). The second marked time window has a
lower average ‘ambient’ input current I than the first one. However, the first time
window is preceded by a period of high activity and a large [Na+]i plateau (hence a
strong IKNa), whereas the second time window follows a period of relative quiescence
(Fig. 3A). As a result, the effective current input I − IKNa is larger and the overall
firing rate is actually slightly higher (8 Hz) during the second time window than
that (7.6 Hz) during the first time window. Therefore, the slow changes in [Na+]i
track the input history over a period of seconds. The subsequent activation of IKNa
then acts as a negative feedback signal, the size of which is proportional to the

J Neurophysiol J0396-2 R 16
time-averaged input in the recent past. The neuron becomes relatively insensitive
to ‘ambient’ input levels, yet still responds vigorously to transient input changes
thanks to the lagged action of slow adaptation.
How large are the increases in membrane conductance that mediate these effects?
An increase of the internal Na+ from 17 to 20 mM in the model leads to an increase of
gKNa by 0.07 µS/cm2, resulting in an increase in total resting membrane conductance
of only 30%. Thus, the temporal decorrelation occurs largely through slow changes
in membrane potential (‘recentering’) mediated by activation and de-activation of
the adaptation currents and not through a ‘shunting’ of the membrane.
[Figure 3 about here.]
We have examined the differential roles of IKCa and IKNa in the reduction of
input redundancy. Without adaptation by either IKNa or IKCa, the output firing
rate time course is nearly identical to the time course of the inject current (Fig. 4A).
Addition of IKCa alone leads to a suppression of the slow temporal modulation of
the firing output, compared to the input. This effect is significant only at moderate
frequencies that match the timescale of activation and deactivation of this current.
This appeared as a ‘flattening’ of the power-frequency relationship between 1 and
approximately 10 Hz. At low (< 1 Hz) frequencies, IKCa is not persistent enough
to influence interspike intervals, and therefore the power-frequency relationship has
a similar shape as without IKCa (see Fig. 4B). The relative power at 1-20 Hz is
enhanced (Fig. 4B). At higher frequencies (> 20 Hz), the rate of activation of IKCa
is too slow to have a significant effect on the firing temporal fluctuations. In the
Appendix we provide an analytical derivation to show that the relative enhancement
of power at 1-20 Hz is due to a high-pass filtering of inputs by the adaptation current
IKCa.
The addition of IKNa to the model results in a marked flattening of the power-
frequency relationship at frequencies below approximately 1 Hz (Fig. 3). This effect
is dependent upon the timescale of the [Na+]i dynamics, as demonstrated directly
by accelerating the [Na+]i kinetics with a scaling factor φNa (so that both the influx
and extrusion are faster):

J Neurophysiol J0396-2 R 17
d[Na+]idt
= φNa(−αNaINa − 3Rpump(ϕNa([Na+]i) − ϕNa([Na+]eq))) (16)
While all other parameters were maintained. As φNa is increased from 1 to 2 and
4, the temporal decorrelation by IKNa at relatively short temporal ranges (<2 sec)
becomes more effective as shown in the autocorrelation function (Fig. 4C, left panel).
The power spectrum shows stronger flattening (‘whitening’) in the frequency range
up to 1 Hz (Fig. 4C, right panel). The relative power at higher frequencies, however,
remains unaffected.
[Figure 4 about here.]
3.4 Temporal decorrelation in visual cortical neurons
[Figure 5 about here.]
In order to test whether real cortical neurons can indeed decorrelate the inputs
by intrinsic adaptation mechanisms, we used intracellular recordings from layer 2/3
pyramidal and layer 4 stellate neurons (n=32) in ferret primary visual cortical slices.
The injected stochastic currents are the same as those used in model simulations and
possessed a prescribed long temporal correlations. Fig. 5 shows an example with the
1/f 2 type input (the Ornstein-Uhlenbeck process with a correlation time τcorr = 2000
ms). The baseline of the current was adjusted so that the neuron had an average
firing rate ∼ 10 Hz throughout each 60 second period of injected current. Although
the recorded output exhibits some similarity with the input pattern, it is more
transient in time (Fig. 5A) Temporal correlation analysis revealed that correlations
in the output spike trains were significantly reduced with respect to the input, and
decayed to zero for times longer than 2 sec (Fig. 5B). The power spectrum shows a
reduced relative power at low frequencies and is significantly flattened between 0.1
and 1 Hz (Fig. 5C).

J Neurophysiol J0396-2 R 18
Similar decorrelation effects were observed with the 1/f -type stochastic current
injection (Fig. 6). The baseline of the current was adjusted through the injection
of constant current so that each neuron had a firing rate of ∼ 10 Hz throughout
each 120 second recording session. The 1/f -type input exhibits slow variations over
timescales of seconds (Fig. 6A, top panel). This slow modulation is virtually absent
in the neural firing output (Fig. 6A, bottom panel). The output’s autocorrelation
is dramatically suppressed and is near zero for time scales larger than 1 sec (Fig.
6B). The power spectrum is flattened (‘whitened’) for frequencies lower than 1 Hz
(Fig. 6C).
[Figure 6 about here.]
The behavior of the recorded cortical neuron is strikingly similar to that of
the model endowed with IKCa and IKNa (compare Fig. 6 with Fig. 3). We also
compared the histograms of the instantaneous firing rates (calculated as the inverse
of the ISIs) for the model and a cortical neuron (Fig. 7). The input amplitude has
a Gaussian distribution (Fig. 7A). The firing rate histogram for the model neuron
without any adaptation current is almost Gaussian-shaped, like the input, except
for an additional small peak near zero (corresponding to time periods of relative
quiescence) (Fig. 7B). Adaptation by IKCa increases the probability for low firing
rates (peak near zero) and decreases the Gaussian-shaped peak at high rates (Fig.
7C). The addition of IKNa further altered the firing rate histogram. The peak at
high rates virtually disappears, and the peak near zero becomes dominant (Fig. 7D).
In other words, although most of the time the model neuron fires at low rates, it can
occasionally fire transiently at high rates (up to 100 Hz). The same characteristic
firing rate histogram was found for a real cortical neuron (Fig. 7E). The agreement
between data and the model provide supporting evidence that intrinsic membrane
dynamics of a single neuron in the visual cortex can decorrelate natural-scene-like
inputs with long-range temporal correlations.
[Figure 7 about here.]

J Neurophysiol J0396-2 R 19
3.5 Relationship between slow hyperpolarization and decor-
relation
Since decorrelation is observed with current injection in our slice experiments, it is
a single cell phenomenon. What are the specific membrane mechanisms underlying
this decorrelation effect? Evidence indicates that a [Na+]i-activated K+ current
INaK plays a large role in the slow hyperpolarization that contributes to adaptation
of visual cortical neurons to prolonged inputs (Sanchez-Vives et al. 2000a-b). We
attempted to establish a link between the decorrelation effect and slow hyperpolar-
ization, based on the previous observation that the slow hyperpolarization (presum-
ably produced by IKNa) is enhanced in zero calcium solution, compared to control
with [Ca2+]o = 2 mM (Sanchez-Vives et al. 2000b). The reason for this enhance-
ment is that under control condition there is a calcium-activated inward current
that counteracts IKNa. The removal of calcium eliminates this inward current and
unveils a larger slow hyperpolarization (Sanchez-Vives et al. 2000b). Our reasoning
is that, if the same adaptation mechanism subserves the decorrelation process, then
a stronger decorrelation effect should be observed in zero calcium. We tested this
prediction in n=5 cells, with both current pulses and 1/f -type stochastic currents.
In some cells we used more than one sample stimuli per cell to increase the number
of trials. Neurons show pronounced afterhyperpolarizations (sAHP) following a long
(20 sec) current injection which is either a single pulse, or a train of periodic pulses
(at 2 Hz, period of 500 msec, 250 msec on and 250 msec off) (Fig. 8). The sAHP
is longer lasting in 0 [Ca2+]o than in control (Fig. 8), consistent with the previous
results (Sanchez-Vives et al. 2000b). To quantify the size of sAHP in zero [Ca2+]o
and in control, we calculated the time integral of sAHP, divided by the total number
of spikes during the current injection. As shown in Fig. 9A, the sAHP integral per
spike is larger in 0 [Ca2+]o compared to control for all 5 cells.
[Figure 8 about here.]
[Figure 9 about here.]

J Neurophysiol J0396-2 R 20
When 1/f -type correlated stochastic inputs are applied, the autocorrelation of
the spiking output is further reduced (decorrelation is more effective) in 0 [Ca2+]o
compared to control. The reduction is very dramatic in some cells (Fig. 8B and
C), and modest in others (Fig. 8A and D). To quantify the decorrelation effect, we
calculated the integral of the autocorrelation functions of the input and the output
(Ain and Aout), and used ρdecorr = Aout/Ain as a decorrelation index. The smaller
is ρdecorr, the stronger is the decorrelation effect. In each of the 5 cells, ρdecorr is
susbtantially smaller in 0 [Ca2+]o than in control, when the comparison was made
with the same 1/f -type sample input under the two conditions (Fig. 9C). It is
important to note that the average firing rate of the neural response to 1/f -type
input either remains the same or is higher in 0 [Ca2+]o than in control (Fig. 9B).
Therefore, the stronger decorrelation effect cannot be simply attributed to a lower
firing rate in 0 [Ca2+]o.
4 Discussion
Adaptation and gain control of neurons are well known phenomena, and are the
subject of many physiological studies over the years. The main novelty of the
present work is to demonstrate, using combined computational and electrophysiolog-
ical methods, that intrinsic spike-frequency adaptation mechanisms can temporally
decorrelate inputs at the single neuron level. Based on experimental evidence from
V1 pyramidal cells (Sanchez-Vives et al. 2001), we focused on the role in neuronal
adaptation of a Na+-activated K+ current IKNa. Our main results are: (1) IKNa can
dramatically suppress temporal correlations (at timescales larger than one second)
in the neural firing output, when the input is strongly correlated (1/f 2 or 1/f type)
such as in natural-scene stimuli; (2) visual cortical neurons in in vitro slices decor-
relate the inputs in the same way as the model; (3) The degree of decorrelation is
enhanced at the same time as the size and duration of slow afterhyperpolarization,
consistent with the notion that the same ionic channels (e.g. IKNa) underlying slow
hyperpolarizations can subserve the decorrelation dynamics of single neurons in the

J Neurophysiol J0396-2 R 21
primary visual cortex.
4.1 Biophysical mechanisms of slow (seconds) neuronal adap-
tation
In the primary visual cortex, it has been proposed that contrast adaptation op-
erating at timescales of seconds can arise from short-term depression of afferent
synapses (Chance et al. 1998, Adorjan et al. 1999). Modeling studies also suggest
that short-term synaptic depression provides a candidate mechanism for decorrela-
tion of correlated input spike trains (Goldman et al. 1999, Matveev and Wang 2000,
Goldman et al. 2002). This proposal is consistent with some in vitro slice experi-
ments (Finlayson and Cynader 1995, Abbott et al. 1997, Tsodyks and Markram,
1997, Varela et al. 1997). In an in vivo study of the somatosensory cortex, a rapid
depression of thalamocortical synapses (time constant of 0.25-0.32 sec) was found to
underlie adaptation to whisker stimulation (Chung et al. 2002). However, evidence
for slow (time constant of seconds) synaptic depression in the intact brain is still
lacking. Recently, Sanchez-Vives et al. (2000a-b) discovered that slow adaptation
during prolonged visual stimuli depends on the intrinsic activation of ionic conduc-
tances, such as IKNa. These and other (Carandini and Fester 1997) studies did not
find a consistent decrease in visually evoked synaptic barrages following adaptation;
a finding that is inconsistent with a strong role for synaptic depression in adaptation.
In support of this view, we show here that a cortical pyramidal cell model endowed
only with IKNa and IKCa can reproduce adaptation to high-amplitude sinusoidal
input mimicking a high-contrast visual stimulus (Fig. 1).
Further experiments are needed to quantitatively test our model and the role of
IKNa in adaptation. One possibility is to use synthetic Na+ buffers, which should
prevent [Na+]i accumulation and hence block IKNa activation (K Svoboda, personal
communication). Another critical issue is to determine the [Na+]i dynamics in V1
pyramidal cells: what is the [Na+]i influx per spike? to what level can [Na+]i
accumulate during a long-lasting stimulation? how fast is the Na+/K+ exchange?
In the model, assuming that the baseline [Na+]i is 8 mM (Grafe et al. 1982;

J Neurophysiol J0396-2 R 22
Galvan et al. 1984), and that [Na+]i is increased by 100 µM per spike, the [Na+]i
level typically reaches 15-20 mM after long-lasting (many tens of seconds) neural
discharges at an average rate of 20 Hz. In a recent experiment, Rose et al. (1999)
used Na+ indicator dye SBFI and two-photon imaging to measure intracellular Na+
concentration evoked by action potentials in dendrites and spines of hippocampal
CA1 pyramidal cells. They found that the [Na+]i signal can integrate the spike
activity, because it has slow kinetics (time constant of several seconds). The spike-
triggered [Na+]i transients reached values of 1, 2, 4 mM for a train of 5, 10, 20 spikes,
respectively. Therefore the [Na+]i transient is about 200 µM per action potential in
the fine dendrites and spines. Because this rate of accumulation is twice the value
used in our model, we expect that in pyramidal cell’s dendrites, the [Na+]i can reach
15-20 mM after tens of seconds of neural discharges at an average rate of 10 Hz. It
would be interesting to test directly our prediction by Na+ imaging of visual cortical
neurons during prolonged discharges as in the contrast adaptation experiments.
Moreover, it would be important to know the precise spatial site of [Na+]i ac-
cumulation with respect to the location of IKNa. For example, an increase in in-
tracellular [Na+]i may be tightly localized in the submembrane space and reach
levels high enough to activate IKNa (Koh et al. 1994). Moreover, due to the differ-
ence in the surface/volume ratio, activity-induced [Na+]i accumulation could vary
widely at different somatic and dendritic compartments of a single neuron (Qian
and Sejnowski 1989). Therefore, the spatial distribution of IKNa across the somato-
dendritic membrane is important to be determined experimentally. It is conceivable
that hyperpolarizations of different portions of a neuron’s dendritic tree may re-
sult from localized entry of Ca2+ and Na+ and activation of nearby IKCa and IKNa
channels. This may serve to temporally decorrelate inputs to restricted dendritic
segments, while leaving others segments less affected.
Finally, it would also be interesting to explore additional or alternative ionic
mechanisms for neuronal adaptation in the cortex and other brain structures. In
retinal ganglion neurons, slow adaptation (Shapley and Victor 1978, Shapley 1997,
Simirnakis et al. 1997, Chader and Chichilnisky 2001, Baccus and Meister 2002)
may be related to properties of Na+ channels in these cells (Kim and Rieke 2001),

J Neurophysiol J0396-2 R 23
or/and reflect cellular mechanisms upstream in bipolar neurons (Rieke 2001, Brown
and Masland 2001). It would be interesting to test experimentally whether such
adaptation mechanisms also subserve input decorrelation in retinal neurons.
4.2 Decorrelation at the single cell level
In our model, when driven by stochastic inputs with long-range temporal correla-
tions, IKCa and IKNa remove correlations in the spiking output at different time
scales (10-100 msec and 1-10 sec, respectively). In the output power spectrum, at
< 1 Hz the power is reduced to a plateau level (is ‘whitened’) by IKNa, while IKCa
results in a flattening of the power-frequency function at frequencies between 1 and
10 Hz. We noticed that when the output firing rate is very low, decorrelation could
be a trivial consequence of the fact that most of the time the cell membrane is sub-
threshold, the consecutive spikes are separated by long times compared to the input
correlation time, so that most of the correlation information in the input is lost.
This happens when the output firing rate is roughly lower than the inverse of the
input correlation time (< 1− 2 Hz with an input correlation time of 2 sec). For this
reason, both for model simulations and experimental studies, we always made sure
to depolarize the cell with a baseline current when injected with correlated current,
so that the cells fire spikes throughout the stimulation with a relatively high mean
firing rate (10-20 Hz generally).
Interestingly, we found that visual cortical neurons in vitro show similar decor-
relation properties as the model (compare Figs. 5-6 for data with Figs. 2-3 for the
model). The distribution of instantaneous firing rates is also similar for the visual
cortical cell and the model (Fig. 7): it is roughly exponential at low rates, but there
is a second broad peak at larger firing rates (around 50-80 Hz). We attempted to
further establish the link between the slow hyperpolarization and the decorrelation
effect, by comparing the neuronal behavior in zero calcium bath solution with that
in control. We confirmed the previous observation (Sanchez-Vives et al. 2000b)
that for a given cell the slow hyperpolarization after spiking activity is stronger and
longer lasting in 0 calcium than in control. Furthermore, in response to the exactly

J Neurophysiol J0396-2 R 24
same sample of stochastic correlated input, the decorrelation effect was stronger in
0 calcium than in control (Figs. 8-9). This result lends support to the idea that the
same ion channel mechanism responsible for the slow hyperpolarization also under-
lies the decorrelation process of temporally correlated stochastic inputs. However,
our results only show that the two effects increase in a correlated way, and we do
not have direct proof for the hypothesized role of IKNa in the observed decorrelation
phenomenon at the single cell level.
It is worth noting that an adaptation mechanism removes correlations most ef-
fectively at timescales comparable to its intrinsic time constant. Therefore, with
IKNa and IKCa a neuron’s output can still show large autocorrelations at timescales
shorter than a few hundreds of milliseconds. The adaptation mechanism of redun-
dancy reduction is thus compatible with the fact that cortical neuronal spike trains
do show autocorrelations at timescales ranging from one to hundreds of milliseconds
(for a review see Singer and Gray 1995).
We have not addressed the question of whether the filter functions of cortical
neurons are optimally designed. That is, the kinetics and strength of adaption
ionic mechanisms might have been optimized, through biological evolution, for re-
dundancy reduction of the kind of natural stimuli that the animal encounters in
daily life (Atick 1992). Specifically, one could ask whether the calcium-activated
and sodium-activated potassium currents decorrelate 1/f and 1/f 2 stimuli better
than inputs with other statistic properties. However, what it means to be ‘opti-
mal’ remains to be clarified. Indeed, most likely, complete whitening of stimulus by
decorrelation is not desirable, since probability distributions of stimuli may them-
selves be used for neural representation of the sensory world in the brain (Barlow
2001, Rao et al. 2002).
4.3 Adaptation and decorrelation in the V1 network
Computational theories suggest that in the mammalian visual system, natural inputs
are decorrelated spatially at the level of the retina (Atick 1992), and temporally
in the lateral geniculate nucleus (LGN) (Dong and Atick 1995b), so that signals

J Neurophysiol J0396-2 R 25
that arrive in the visual cortex are encoded in an efficient form. In support of this
proposal, physiological studies show that in response to natural time-varying images
(movies), neurons in the cat LGN remove temporal correlations at the timescale of
50-300 ms, and the output power spectrum is whitened in the frequency range of
3-15 Hz (Dan et al. 1996). The underlying biophysical mechanism could be, at
least partly, intrinsic membrane properties of the LGN relay cells. Indeed, these
cells are known to display burst discharges due to a T-type calcium ion current;
this burst activity can remove temporal correlations in an input at the timescale of
∼ 100 ms (Kepecs et al. 2002). However, LGN cells fire bursts only under certain
conditions (including sodium pentothal anesthesia as in the experiment of Dan et al.
1996); their propensity of burst discharge during waking states remains a matter of
debate (Sherman 2001). Therefore, it is still unclear whether temporal decorrelation
primarily takes place in the LGN during animal’s natural behaviors.
Here, we hypothesize that temporal decorrelation of inputs is to a large extent
accomplished in the primary visual cortex, by the same mechanisms responsible
for the contrast adaptation. Synaptic depression can temporally decorrelate inputs
in a synapse-specific manner and at the timescale of hundreds of milliseconds (on
a similar time scale as fast intrinsic adaptation through IKCa); whereas intrinsic
membrane dynamics mediated by IKNa operate at a more global level of the neural
activity and at a slower timescale of seconds. To explore this proposal computa-
tionally, it will be necessary to extend our investigation to patten adaptation in a
V1 network model, that takes into account short-term synaptic depression (Somers
et al. 1998, Adorjan et al. 1999) and slow spike-frequency adaptation by IKNa in
single neurons. Network modeling would enable us to investigate the mechanisms for
pattern adaptation, and whether the same mechansms can remove spatiotempotal
correlations in the natural-scene inputs thereby performing redundancy reduction
in both space and time. Experimentally, our proposal could be tested by physiolog-
ical studies of V1 neurons in response to natural time-varying stimulations (such as
movies). Further experimental and theoretical studies will lead to the elucidation
of specific cellular mechanisms of adaptation and redundancy reduction processes in
the visual cortex.

J Neurophysiol J0396-2 R 26
Appendix: A qualitative explanation of power spectrum ‘whitening’ by
an adaptation current
To understand ‘whitening’ or ‘flattening’ of the neural output power spectrum
within a frequency range, let us consider a linear model of adaptation, Iadap =
GadapX where X = [Ca2+]i or [Na+]i, if Iadap = IKCa or IKNa, respectively. Fur-
thermore, assume that X obeys a linear kinetic equation
dX
dt= α
∑
i
δ(t − ti) −X
τX
' αr(t) − X/τX (17)
where the spike train∑
i δ(t− ti) is replaced by the instantaneous firing rate, which
is a valid approximation as long as τX is significantly longer than a typical ISI. The
parameter α is the X influx per spike, and τX is the time constant (∼ 100 ms for
[Ca2+]i, and ∼ 10 sec for [Na+]i). Note that although the Na+ extrusion process
is highly nonlinear, the present discussion assuming a linear kinetics is nevertheless
instructive.
Suppose that in response to a time-varying stochastic input current I, the neu-
ron’s output firing rate is given by r(t) = βItot, where Itot = I − Iadap, and the firing
threshold Ith is absorbed in I. Therefore, r(t) ' β(I(t) − Iadap(t)). Inserting this
expression into Eq. (17) we have
dX
dt= αβI(t) − (αβGadap + 1/τX)X = αβI(t) − X/τadap (18)
where we define the adaptation time constant τadap as
1/τadap = αβGadap + 1/τX (19)
Due to the additional term αβGadap, τadap is typically much shorter than τX (see
also Wang 1998, Liu and Wang 2001).
The solution of Eq. (18) yields:
X(t) =∫ t
0αβI(t′)e−(t−t′)/τadapdt′ = αβI ∗ K (20)

J Neurophysiol J0396-2 R 27
where the kernel of the convolution is
K(t) =
e−t/τadap if t ≥ 0
0 otherwise(21)
The Fourier transforms of the kernel K, X and r are as follows:
F (K) =−1
iω − 1τadap
(22)
F (X) = αβF (I)F (K) (23)
F (r) = β [F (I) − GadapF (X)] = βF (I) [1 − GadapαβF (K)] (24)
Therefore, the output power spectrum SO = |F (r)|2 can be expressed as a func-
tion of the input power SI = |F (I)|2:
SO(ω) = SI(ω)β2 ω2 + (1/τX)2
ω2 + (1/τadap)2(25)
Without adaptation, it is easy to show that
SO(ω) = β2SI(ω) (26)
Thus, the presence of IX introduces a temporal kernel which convolves with the
input to produce the output. This leads to an additional multiplicative factor for
the output power spectrum:
ω2 + (1/τX)2
ω2 + (1/τadap)2(27)
where τadap is typically much smaller than τX . At low frequencies ω � 1/τX , the
additional factor is ∼ (τadap/τX)2 � 1. (Note that at very low frequencies, this
analysis is no longer valid since the assumption that the firing is faster than the
calcium dynamics is no longer correct). In the frequency range 1/τX � ω �

J Neurophysiol J0396-2 R 28
1/τadap, this factor is ∼ ω2. At very high frequencies, this factor is one, reflecting
the fact that the slow adaptation current has no effect, as expected. Thus, spike-
frequency adaptation provides a high-pass filter in the intermediate frequency range
1/τX � ω � 1/τadap. If I(t) is a temporally correlated input with a power spectrum
SI(ω) ∼ ω−2, the output spike train is decorrelated; the power spectrum is SO(ω) ∼
SI ω2 ∼ const. Thus SO would be almost flat (‘whitened’) and behave like white-
noise for 1/τX � ω � 1/τadap.

J Neurophysiol J0396-2 R 29
References
Abbott LF, Varela JA, Sen K and Nelson SB (1997) Synaptic depression and cortical
gain control. Science 275: 220-224.
Adorjan P, Piepenbrock C and Obermayer K (1999) Contrast adaptation and info-
max in visual cortical neurons. Rev Neurosci 10:181-200.
Aghajanian GK and Rasmussen K (1989) Intracellular studies in the facial nucleus
illustrating a simple new method for obtaining viable motor neurons in adult rat
brain slices. Synapse 3:331-338.
Ahmed B, Allison JD, Douglas RJ and Martin KAC (1997) An intracellular study
of the contrast-dependence of neuronal activity in cat visual cortex. Cereb Cortex
7:559-570.
Atick JJ (1992) Could information theory provide an ecological theory of sensory
processing? Network 3:213-251.
Attneave F (1954) Some informational aspects of visual perception. Psych Rev 61:
183-193.
Baccus SA and Meister M (2002) Fast and slow contrast adaptation in retinal
circuitry. Neuron 36: 909-919.
Baddeley R, Abbott LF, Booth MC, Sengpiel F, Freeman T, Wakeman EA and Rolls
ET (1997) Responses of neurons in primary and inferior temporal visual cortices to
natural scenes. Proc R Soc Lond B Biol Sci. 264:1775-1783.
Barlow HB (1961) Possible principles underlying the transformations of sensory
messages. In Sensory Communication, ed Rosenblith WA, MIT Press.Cambridge,
MA. pp 217-234.
Barlow HB and Foldiak P (1989) Adaptation and decorrelation in the cortex. In
The Computing Neuron, ed by Durbin R et al., Addison-Wesley, New York. pp
454-472.

J Neurophysiol J0396-2 R 30
Barlow HB (1990) A theory about the functional role and synaptic mechanism of
visual after-effects. In Vision: Coding and Efficiency, ed Blakemore C, Cambridge
University Press, Cambridge.
Barlow HB (2001) Redundancy reduction revisited. Network: Comput. Neural
Systems 12: 241-253.
Bell AJ and Sejnowski TJ (1997) The ”independent components” of natural scenes
are edge filters. Vision Res 37:3327-3338.
Bischoff U, Vogel W and Safronov BV (1998) Na+-activated K+ channels in small
dorsal root ganglion neurons of rat. J Physiol 510:743-754.
Blakemore CB and Campbell FW (1969) On the existence of neurones in the human
visual system selectively sensitive to the orientation and size of retinal images. J
Physiol (Lond) 203:237-260.
Brenner N, Bialek W and de Ruyter van Steveninck R (2000) Adaptive Rescaling
Maximizes Information Transmission. Neuron 26: 695-702.
Brown SP and Masland RH (2001) Spatial scale and cellular substrate of contrast
adaptation by retinal ganglion cells. Nat. Neurosci. 4: 44-51.
Carandini M and Ferster D (1997) A tonic hyperpolarization underlying contrast
adaptation in cat visual cortex. Science 276:949-952.
Carandini M, Movshon JA and Ferster D (1998) Pattern adaptation and cross-
orientation interactions in the primary visual cortex. Neuropharmacology 37:501-
511.
Chance FS, Nelson SB and Abbott LF (1998) Synaptic depression and the temporal
response characteristics of V1 cells. J Neurosci 18:4785-4799.
Chander D and Chichilnisky EJ (2001) Adaptation to temporal contrast in primate
and salamander retina. J Neurosci 21: 9904-9916.

J Neurophysiol J0396-2 R 31
Chung S, Li X and Nelson SB (2002) Short-term depression at thalamocortical
synapses contributes to rapid adaptation of cortical sensory responses in vivo. Neu-
ron 2002 34:437-446.
Dan Y, Atick JJ and Reid RC (1996) Efficient coding of natural scenes in the
lateral geniculate nucleus: experimental test of a computational theory. J Neurosci
16:3351-3362.
Dong DW and Atick JJ (1995a) Statistics of natural time-varying images. Network:
Comput. in Neural Systems 6:345-358.
Dong DW and Atick JJ (1995b) Temporal decorrelation: a theory of lagged and
nonlagged responses in the lateral geniculate nucleus. Network: Comput. in Neural
Systems 6:159-178.
Dragoi V, Sharma J and Sur M (2000) Adaptation-induced plasticity of orientation
tuning in adult visual cortex. Neuron 28: 287-298.
Dryer SE (1994) Na+-activated K+ channels: a new family of large-conductance
ion channels. Trends Neurosci 17:155-160.
Egan TM, Dagan D, Kupper J and Levitan IB (1992a) Properties and rundown
of sodium-activated potassium channels in rat olfactory bulb neurons. J Neurosci
12:1964-1976.
Egan TM, Kupper J and Levitan IB (1992b) Na+-activated K+ channels are widely
distributed in rat CNS and Xenopus ocytes. Brain Res 584:319-321.
Ermentrout B (1998) Linearization of F-I curves by adaptation. Neural Comput
10:1721-1929.
Fain GL (1999) Molecular and Cellular Physiology of Neurons. Harvard University
Press.
Fairhall AL, Lewen GD, Bialek W, de Ruyter Van Steveninck RR (2001) Efficiency
and ambiguity in an adaptive neural code. Nature 412: 787-792.

J Neurophysiol J0396-2 R 32
Field DJ (1994) What is the goal of sensory coding? Neural Comput 6:559-601.
Finlayson PG and Cynader MS (1995) Synaptic depression in visual cortex tissue
slices: an in vitro model for cortical neuron adaptation. Exp. Brain Res. 106:145-
155.
Gabbiani F and Koch C (1998) Principles of spike train analysis. In Methods in
Neuronal Modeling: From Synapses to Networks. C. Koch and I. Segev eds. 2nd
edition, MIT Press: Cambridge, MA, 313-360.
Galvan M. Dorge A, Beck F and Rick R (1984) Intracellular electrolyte concentra-
tions in rat sympathetic neurones measured with an electron microprobe. Pflugers
Arch 400:274-279.
Goldman MS, Nelson SB and Abbott LF (1999) Decorrelation of spike trains by
synaptic depression. Neurocomputing 26/27: 147-153.
Goldman MS, Maldonado P and Abbott LF (2002) Redundancy reduction and sus-
tained firing with stochastic depressing synapses. J Neurosci 22:584-591.
Grafe P, Rimpel J and Reddy MM (1982) Changes of intracellular sodium and potas-
sium ion concentrations in frog spinal motoneurons induced by repetitive synaptic
stimulation. Neurosci 7: 2113-2120.
Greenlee MW and Heitger F (1988) The functional role of contrast adaptation.
Vision Res 28:791-797.
Greenlee MW, Georgeson MA, Magnussen S, Harris JP (1991) The time course of
adaptation to spatial contrast. Vision Res 31:223-36.
Helmchen F, Imoto K and Sakmann B (1996) Ca2+ buffering and action potential-
evoked Ca2+ signaling in dendrites of pyramidal neurons. Biophys J 70:1069-1081.
Hodgkin AL and Huxley AF (1952) A quantitative description of membrane current
and its application to conduction and excitation in nerve. J Physiol 117:500-544.

J Neurophysiol J0396-2 R 33
Jaffe DB, Johnston D, Lasser-Ross N, Lisman JE, Miyakawa H and Ross WN (1992)
The spread of Na+ spikes determines the pattern of dendritic Ca2+ entry into
hippocampal neurons. Nature 357:244-246.
Kameyama M, Sato M, Shibasaki R, Matsuda T and Irisawa H (1984) Intracellular
Na+ activates a K+ channel in mammalian cardiac cells. Nature 309:354-356.
Kepecs A, Wang X-J and Lisman J (2002) Burst neurons signal input slope. J
Neurosci 22: 9053-9062.
Kim KJ and Rieke F (2001) Temporal contrast adaptation in the input and output
signals of salamander retinal ganglion cells. J Neurosci 21: 287-299.
Koh DS, Jonas P and Vogel W (1994) Na+-activated K+ channels localized in the
nodal region of myelinated axons of Xenopus. J Physiol 479:183-197.
Laughlin SB (1981) A simple coding procedure enhances a neurons information
capacity. Z Naturforsch 36: 910-912.
Li YX, Bertram R and Rinzel J (1996) Modeling N-Methyl-D-Aspartate-Induced
bursting in dopamine neurons. Neurosci 71:397-410.
Liu YH and Wang X-J (2001) Spike-frequency adaptation of a generalized integrate-
and-fire model neuron. J Comput Neurosci 10: 25-45.
Maffei L, Fiorentini A and Bisti S (1973) Neural correlate of perceptual adaptation
to gratings. Science 182:1036-1038.
Matveev V and Wang X-J (2000) Differential short-term synaptic plasticity and
transmission of complex spike trains: to depress or to facilitate? Cerebral Cortex
10: 1143-1153.
Movshon JA and Lennie P (1979) Pattern-selective adaptation in visual cortical
neurones. Nature 278:850-852.

J Neurophysiol J0396-2 R 34
Nelson SB (1991) Temporal interactions in the cat visual system. J Neurosci 11:
344-380.
Olshausen BA and Field DJ (1996). Emergence of simple-cell receptive field prop-
erties by learning a sparse code for natural images. Nature 381:607-609.
Ohzawa I, Sclar G and Freeman RD (1985) Contrast gain control in the cat’s visual
system. J Neurophysiol 54:651-667.
Pinsky P and Rinzel J (1994) Intrinsic and network rhythmogenesis in a reduced
Traub model for CA3 neurons. J Comput Neurosci 1: 39-60.
Qian N and Sejnowski TJ (1989) An electro-diffusion model for computing mem-
brane potentials and ionic concentrations in branching dendrites, spines and axons.
Biol Cybern 62: 1-15.
Rao RP, Olshausen BA and Lewicki MS (2002) Probabilistic models of the brain.
Camrbidge, MA: MIT press.
Rieke F (2001) Temporal contrast adaptation in salamander bipolar cells. J Neurosci
21: 9445-9454.
Rose CR and Ransom BR (1997) Regulation of intracellular sodium in cultured rat
hippocampal neurones. J Physiol 499:573-587.
Rose CR, Kovalchuk Y, Eilers J, Konnerth A (1999) Two-photon Na+ imaging in
spines and fine dendrites of central neurons. Pflugers Arch 439:201-207.
Ruderman DL (1994) The statistics of natural images. Network: Comput. in Neural
Sys 5:517-548.
Ruderman DL and Bialek W (1994) Statistics of natural images: scaling in the
woods. Physical Rev Lett 73:814-817.
Sanchez-Vives MV, Nowak LG and McCormick DA (2000a) Membrane mechanisms
underlying contrast adaptation in cat area 17 in vivo. J Neurosci 20: 4267-4285.

J Neurophysiol J0396-2 R 35
Sanchez-Vives MV, Nowak LG and McCormick DA (2000b) Cellular mechanisms of
long-lasting adaptation in visual cortical neurons in vitro. J Neurosci 20: 4286-4299.
Schwindt RC, Spain WJ, Foehring RC, Chubb MC and Crill WE (1988) Slow con-
ductances in neurons from cat sensorimotor cortex in vitro and their role in slow
excitability changes. J Neurophysiol 59: 450-467.
Schwindt RC, Spain WJ and Crill WE (1989) Long-lasting reduction of excitability
by a sodium-dependent potassium current in cat neocortical neurons. J Neurophysiol
61:233-244.
Sclar G, Ohzawa I and Freeman RD (1985) Contrast gain control in the kitten’s
visual system. J Neurophysiol 54:668-673.
Shapley R (1997) Retinal physiology: adapting to the changing scene. Curr Biol 7:
R421-423.
Shapley R and Victor JD (1978) The effect of contrast on the transfer properties of
cat retinal ganglion cells. J Physiol 285: 275-298.
Sherman SM (2001) Tonic and burst firing: dual modes of thalamocortical relay.
Trends in Neurosci 24: 122-126.
Smirnakis SM, Berry MJ, Warland DK, Bialek W and Meister M (1997) Adaptation
of retinal processing to image contrast and spatial scale. Nature 386: 69-73.
Simoncelli EP and Olshausen BA (2001) Natural image statistics and neural repre-
sentation. Annu Rev Neurosci 24: 1193-1216.
Singer W and Gray CM (1995) Visual feature integration and the temporal corre-
lation hypothesis Annu Rev Neurosci 18: 555-586.
Somers DC, Todorov EV, Siapas AG, Toth LJ, Kim DS and Sur M (1998) A local
circuit approach to understanding integration of long-range inputs in primary visual
cortex. Cereb Cortex 8: 204-217.

J Neurophysiol J0396-2 R 36
Srinivasan MV, Laughlin SB and Dubs A (1982). Predictive coding: A fresh view
of inhibition in the retina. J R Soc London Ser B 216:427-459.
Tsodyks M and Markram H (1997) The neural code between neocortical pyramidal
neurons depends on neurotransmitter release probability. Proc Natl Acad Sci USA
94: 719-723.
Varela JA, Sen K, Gibson J, Fost J, Abbott LF and Nelson SB (1997) A quantitative
description of short-term plasticity at excitatory synapses in layer 2/3 of rat primary
visual cortex. J Neurosci 17:7926-2940.
van Hateren JH and van der Schaaf A (1996) Temporal properties of natural scenes.
IS&T/SPIE Proceedings. 2657:139-143.
van Hateren JH (1997) Processing of natural time series of intensities by the visual
system of the blowfly. Vision Res 37:3407-3416.
Vidyasagar TR (1990) Pattern adaptation in cat visual cortex is a cooperative phe-
nomenon. Neurosci 36:175-179.
Vinje WE and Gallant JL (2000) Sparse coding and decorrelation in primary visual
cortex during natural vision. Science 287:1273-1276.
Wainwright MJ (1999) Visual adaptation as optimal information transmission. Vis
Res 39:3960-3974.
Wang X-J (1998) Calcium coding and adaptive temporal computation in cortical
pyramidal neurons. J Neurophysiol 79:1549-1566.

Figure Captions
Figure 1 Adaptation of the model neuron in response to a low-high-low sinu-
soidal current input. (A) Membrane potential. Following the injection of high-
amplitude sinusoidal current there is a slow hyperpolarization lasting for about ten
seconds (indicated by an arrow). (B) Number of spikes per cycle. (C) Intracellular
[Na+]i accumulation mirrors the adaptation time course of the instantaneous firing
rate during the high-contrast input; whereas [Na+]i decay is correlated with the
slow hyperpolarization and recovery during the second low-amplitude period. (D)
[Ca2+]i decays fast back to the baseline between cycles. (E) 2 Hz sinusoidal in-
jected current that varies from low to high to low in amplitude. In this simulation,
gKNa = 8 mS/cm2 and gCa,s = 0.
Figure 2 Decorrelation of 1/f 2-type stochastic inputs. (A) Membrane potential
(top panel), instantaneous firing rate (middle panel) and input current (bottom
panel). (B) The autocorrelation function of the output is reduced compared to that
of the input at all timescales, and is essentially zero for τ > 2 sec. (C) Power
spectrum analysis for both the output and the input. The relative power for the
output is reduced at low frequencies and enhanced at high frequencies.
Figure 3 Decorrelation of 1/f -type stochastic input. (A) From top to bottom:
input current, membrane potential, instantaneous firing rate, intracellular Na+ and
Ca2+. Two time epoches (each lasting for 10 sec) are indicated by boxes for the
instantaneous firing rate (third panel). The first time window has a larger ‘baseline’
input current I than the second one (see dashed line, top panel). However, [Na+]i
(hence IKNa) is larger during the first time window, due to a higher activity level
that precedes the marked time window. As a result, the effective input current
is I − IKNa, and the average firing rate is actually lower in the first time window
than in the second one. (B) Autocorrelation functions for both the output and the

input. The output is dramatically decorrelated both at short and long timescales,
its autocorrelation is zero for τ > 2 sec. (C) Compared to the input, the power
spectrum of the output is flattened (‘whitened’) at low frequencies (< 1 Hz).
Figure 4 Decorrelation at low frequencies (long timescales) critically depends on
the IKNa. (A-B): IKNa blockade. (A) When both adaptation currents are blocked
(middle panel), the neural firing output shows a similar slow time course as the input
(bottom). IKCa reduces this low-frequency modulation, and enhances relative power
of fluctuations at higher frequencies (top panel). (B) The power spectrum calculated
from output rate with and without IKCa are superimposed. The flattening of the
power spectrum due to temporal decorrelation by IKCa is only limited to higher
frequency range ∼ 1 − 20 Hz. (C) Dependence of decorrelation on the speed of
[Na+]i kinetics (controlled by the parameter φNa). Faster [Na+]i kinetics abolishes
the autocorrelation at short temporal range (< 2 sec) more effectively (left panel)
and whitens the power spectrum more strongly at < 1 Hz (right panel).
Figure 5 In vitro intracellular recording from a visual cortical neuron (1/f 2
type input). (A) Top panel: injected current with 1/f 2 type power spectrum; Mid-
dle panel: recording of membrane potential; Bottom panel: instantaneous firing
rate. (B) Autocorrelation function for the input and the output. The output is
significantly decorrelated at long timescales. (C) Power for the output is reduced in
the low frequency range.
Figure 6 In vitro intracellular recording from a visual cortical neuron (1/f -type
input). (A) Neuronal response to a stochastic injected current with 1/f type power
spectrum (total recording time is 120 sec). Top: input current; middle: membrane
potential; bottom: instantaneous firing rate. (B) Autocorrelation function shows
that the output is greatly decorrelated compared to the input, the autocorrelation
function is zero for timescales larger than 1 sec. (C) Power spectrum is flattened for

f < 1 Hz.
Figure 7 Distributions of the input intensity and the instantaneous firing rates.
The input intensity has a Gaussian distribution (A). The instantaneous firing rate
histogram of the model neuron without any adaptation current (B) and with only
IKCa (C) show a bimodal distribution. In the presence of both IKNa and IKCa the
model neuron’s firing rate histogram shows an exponential function at low rates and
a small but broad peak at high rates (D). This is similar to the firing-rate histogram
from a visual cortical neuron (E) (the same cell as in Fig. 6).
Figure 8 Increase of slow hyperpolarization and enhancement of decorrelation
in 0 [Ca2+]o. (A-D) Four different cells are shown. Top panel: autocorrelation
function of input (red), output in control medium (blue) and in 0 [Ca2+]o (green).
The autocorrelation is smaller in 0 [Ca2+]o than in control. Lower panel: neural
response to a long (20 sec) current pulse (A-B) or to a period train of current
pulses (C-D). Note the slow afterhyperpolarization following the input pulse. Slow
hyperpolarization is substantially longer-lasting in 0 [Ca2+]o (green) than in control
(blue).
Figure 9 Increased slow hyperpolarization and enhanced decorrelation in 0 [Ca2+]o.
(A) Time integral of afterhyperpolarization per spike is larger in 0 [Ca2+]o compared
to control (n=5, 7 input trials). (B-C) In response to the same sample stochastic
1/f -type input, the decorrelation effect is stronger, whereas the overall firing rate is
about the same or higher, in 0 [Ca2+]o than in control (n=5, 8 input trials).

02468
10
# sp
ikes
/cyc
le
−80
−60
−40
−20
Vm
(mV
)
0 20 40Time (sec)
−20246
I (µA
/cm
2 )
131517
[Na+
] (m
M)
0
0.4
0.8
[Ca+
+] (
µM)
Figure 1
A
B
C
D
E
FIGURE 1

−80
−40
0
Vm
(m
V)
Model with IKCa and IKNa (1/f2−type input)
0
20
40
Rat
e (H
z)
−8 −4 0 4 8τ (sec)
−0.20
0.20.40.60.8
1
Aut
ocor
rela
tion
0.01 0.1 1 10Frequency (Hz)
10−5
10−3
10−1
101
Pow
er (
Hz)
OutputInput
0 5 10 15 20Time (sec)
0
4
8
I (µA
/cm
2 )
slope = −2
A
B C
FIGURE 2

05
1015
I (µA
/cm
2 )Model with IKNa and IKCa (1/f−type input)
−80
−30
20
Vm
(m
V)
050
100150
Rat
e (H
z)
15171921
[Na+
] (m
M)
0 10 20 30 40 50Time (sec)
00.5
1
[Ca+
+] (
µM)
−8 −4 0 4 8τ (sec)
−0.2
0.2
0.6
1
Aut
ocor
rela
tion
0.01 0.1 1 10Frequency (Hz)
10−1
101
103
Pow
er Input
Output
Slope=−1
A
B C
FIGURE 3

0.01 0.1 1 10Frequency (Hz)
100
102
104
Pow
er
Without IKNa
Without IKCa and IKNa
050
100150
Rat
e (H
z)
Adaptation by IKCa only
050
100150200
Rat
e (H
z)
Without adaptation
0 5000 10000Time (msec)
−2
3
8
I (µA
/cm
2 )
−8 −4 0 4 8τ (sec)
−0.20
0.20.40.60.8
1
Aut
ocor
rela
tion
0.01 0.1 1 10Frequency (Hz)
10−1
100
101
102
103
Pow
er
InputφNa=1φNa=2φNa=4
B
C
slope = −1
A
FIGURE 4

−0.5
0.5
Inpu
t (nA
)
Recording from a visual cortical neuron (1/f2−type input)
−80
−30
Vm (
mV
)
0 10 20 30 40 50 60Time (sec)
0
20
40
60
Rat
e (H
z)
−6 −4 −2 0 2 4 6τ (sec)
−0.20
0.20.40.60.8
1
Aut
ocor
rela
tion
0.01 0.1 1 10Frequency (Hz)
10−5
10−4
10−3
10−2
10−1
100
101
Pow
er
InputOutput
slope=−2
A
B C
FIGURE 5

−0.5
0
0.5
1
1.5
Inpu
t (nA
)
Recording from a visual cortical neuron (1/f−type input)
−120
−70
−20
30
Vm (
mV
)
0 10 20 30 40 50Time (sec)
0
50
100
Rat
e (H
z)
−4 −2 0 2 4τ (sec)
−0.2
0.2
0.6
1
Aut
ocor
rela
tion
0.01 0.1 1 10Frequency (Hz)
100
101
102
103
104
Pow
er
InputOutput
A
BC
Slope=−1
FIGURE 6

−5 0 5 10 15I (µA/cm
2)
0
0.002
0.004
0.006
0.008
His
togr
am
0 100 200 300Rate (Hz)
0
0.01
0.02
0.03
0 100 200Rate (Hz)
0
0.01
0.02
0.03
0 50 100 150Rate (Hz)
0
0.025
0.05
His
togr
am
0 50 100Rate (Hz)
0
0.05
0.1
Input Without adaptation With IKCa only
EModel with IKCa and IKNa Data from a cortical neuron
A B C
D
FIGURE 7
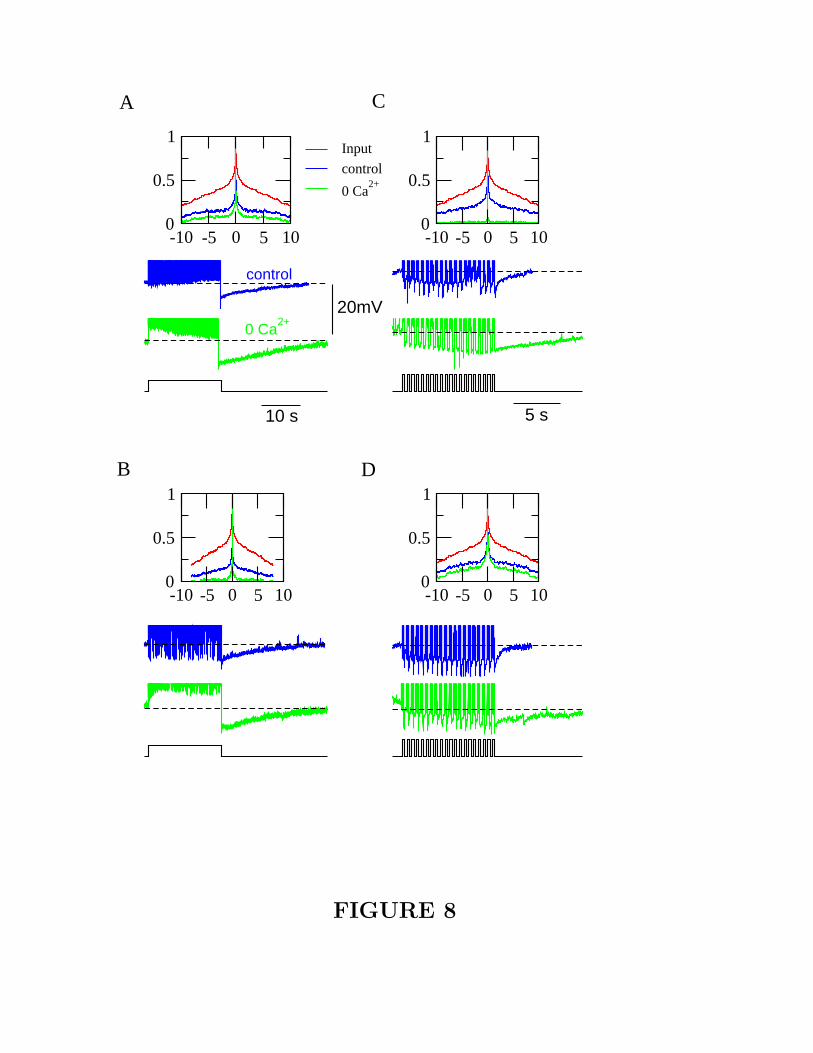
-10 -5 0 5 100
0.5
1Input
control
0 Ca2+
-10 -5 0 5 100
0.5
1
-10 -5 0 5 100
0.5
1
-10 -5 0 5 100
0.5
1
A
B
C
D
20mV
10 s 5 s
control
0 Ca2+
FIGURE 8

5 10 15 20
Mean firing rate (Hz)
0.0
0.2
0.4
0.6
0.8
Output/input correlation0.0
0.2
0.4
0.6
AHP integral per spike
control0 C
a2+
ABC
FIG
UR
E9