finance count 2014 - agendaconsulting.co.uk
TRANSCRIPT

Volume 2.4Central Function CostsSector-Wide and Detailed Statistics Report
February 2014
Finance Count 2014Third Sector Financial Management Benchmarking


Finance Count 2014 Third Sector Financial Management Benchmarking Volume 2.4 – Central Function Costs
Sector-Wide and Detailed Statistics Report February 2014
Copyright in this publication is protected under the Copyright Designs and Patents Act 1988 (as amended from time to time) and is owned by Agenda Consulting Ltd. Neither the whole nor any part of this survey may be copied, reproduced, distributed or transmitted to a third party by any means whatsoever without first obtaining our consent in writing. Extracts from this publication may only be used or quoted with our prior permission (which is at our sole discretion) and provided we are fully credited. Disclaimer: This publication should not be relied upon as a substitute for specific advice concerning your organisation. Agenda Consulting Ltd accept no responsibility for any consequences and/or for any loss occasioned to your organisation (whether directly or indirectly) as a result of any person acting or refraining from acting as a result of any statement or opinion contained in this publication.
© Agenda Consulting 2014


Finance Count Third Sector 2014, Volume 2.4 Central Function Costs © Agenda Consulting 1
FOREWORD As charities continue to adapt to the “new normal” of the current challenging economic environment with its increasing pressures to do more with less, efficient and effective management of resources and finances is more important than ever. Finance Count offers the opportunity to compare your finance function with that of your peers. We hope that this study will give participating teams the knowledge and confidence to continue to develop their organisations and identify new areas for efficiencies and improvements, making them more sustainable in the long-term. These findings will give valuable insight into administrative processes and strategic decisions that have been taken around resources, pensions, outsourcing, business development, and working effectively with other teams. The results show that there are significant differences in performance between participants. This should give charities pause for thought on how well they are faring in some areas and what they might do to improve on measures where results are less favourable. The data from this survey is not necessarily representative of the sector nor of CFG members. However, we do believe that it will help you to review your finance function by learning from other organisations. We hope some will find useful insights in these results. Others will find reassurance that you’re on the right track. We hope that it will provide perspective for your resources planning and a better backdrop for the conversations you have with senior colleagues and trustees as you look for ways to continue to develop and improve. Caron Bradshaw
Chief Executive Officer, Charity Finance Group

Finance Count Third Sector 2014, Volume 2.4 Central Function Costs © Agenda Consulting
2
CONTENTS
FOREWORD ........................................................................................................................................... 1
1 INTRODUCTION .................................................................................................................................. 3
2 WHY NOT PARTICIPATE IN FINANCE COUNT? ............................................................................... 4
3 KEY FINDINGS .................................................................................................................................... 5
3.1 CENTRAL FUNCTION COSTS ..................................................................................................... 5
3.2 GOOD PRACTICE ....................................................................................................................... 10
4 STATISTICS TABLES ........................................................................................................................ 11
4.1 GENERAL INFORMATION .......................................................................................................... 12
4.2 CENTRAL FUNCTION COSTS ................................................................................................... 25
ANNEX A: DEFINITIONS OF MEASURES ........................................................................................... 35
ANNEX B: METHODOLOGY AND SAMPLE ......................................................................................... 37

Finance Count Third Sector 2014, Volume 2.4 Central Function Costs © Agenda Consulting 3
1 INTRODUCTION Finance Count 2014 This report – Finance Count 2014: Volume 2.4 Central Function Costs – is based on findings from the Finance Count 2014 Benchmarking Study. Finance Count is a financial management benchmarking study specifically tailored to the needs of the UK Third Sector. The study involved benchmarking the financial management of 57 medium and large Third Sector organisations in the UK (Annex B sets out the list of participants). The study was undertaken by Agenda Consulting in partnership with the Charity Finance Group, Sayer Vincent and VODG. The aims were to build a picture of financial management in the Third Sector and to support organisations in developing further their financial management policies and practices through enabling organisations to compare their performance with their selected peers and to pinpoint both their strengths and areas for development. Information in the study corresponds to activities and resources in the most recent complete financial year for which organisations have the required information; in most cases, this will be the financial year 2012-2013. This report
This report focuses on measures from the Finance Count 2014 study relating to the finance function. The report is organised into the following chapters:
Chapter 2 – Why Not Participate in Finance Count? describes the benefits of participating in the study as experienced by previous participants
Chapter 3 – Key Findings: sets out the key findings from the study on the topic transaction processing.
Chapter 4 – Statistics Tables: sets out, for each measure, a detailed table broken down by organisation size (income over the year) and sub sector showing lower quartile, median and upper quartile figures.
Annex A – Definitions of Measures: sets out the formulae used to calculate each measure in the report.
Annex B – Methodology and Sample: describes the sample in detail and the way in which we have analysed and presented the data.
Other publications in the Finance Count 2014 study The following publications are also available from our website:
Volume 2.1 – Transaction Processing
Volume 2.2 – Reporting & Control and Decision Support
Volume 2.3 – The Finance Function
Volume 2.5 – Public Service Delivery & Non-Charitable Trading

Finance Count Third Sector 2014, Volume 2.4 Central Function Costs © Agenda Consulting
4
2 WHY NOT PARTICIPATE IN FINANCE COUNT? We hope that you find this report valuable and that it provides you with useful benchmarking information against which to compare your own organisation. If so, we encourage your organisation to participate in the Finance Count study in the future, which involves completing the study questionnaire in respect to your own organisation. Participating in the Finance Count Study itself is by far the best way to gain the most benefit, both in the quality and breadth of the information you receive and cost effectiveness. In short, you pay less and get far, far more. By taking part your organisation enjoys a significant number of benefits which are not available to non-participants:
1. Sector Wide Reports – every report containing the sector-wide results from all participants in the study is included.
2. Your Own Organisation Scorecard – a detailed comparison of your organisation’s performance against your chosen peers and the whole sample on all measures in the study.
3. Access to a suite of online tools to examine your performance in more detail and illustrate
your performance graphically.
4. Ability to track your performance over time.
5. One-to-One Telephone Consultation with one of our team to help get the most out of the reports.
6. Access to a Good Practice Zone and Contacts from each organisation to share information
and best practice with others.
7. Invitation to a Training Session providing the opportunity to learn more about using all the reports effectively and to network with colleagues from other participating organisations.
To find out more about the study and how to participate, go to www.agendaconsulting.co.uk/benchmarking/finance_count or contact Brita Benson: Email [email protected] Phone 01865 263720

Finance Count Third Sector 2014, Volume 2.4 Central Function Costs © Agenda Consulting 5
3 KEY FINDINGS
3.1 CENTRAL FUNCTION COSTS In this section, we asked participants about central function costs in five functions:
Finance function
HR function
Information systems/information technology function
Estate management function
CEO’s office. One caveat is that there may be differing definitions of each function. Although we used the following definitions in the guidance notes to the questionnaire, participants may have interpreted these guidelines in different ways.
Finance: anyone with a role pertaining to: financial accounting, management accounting, sales ledger, purchase ledger, income processing, payroll, pensions, taxation, grant and funder reporting, treasury management, investment management, banking relationships, budgeting analysis and support.
HR function: anyone with a role/job title pertaining to: personnel/HR, recruitment, training and
management development, organisation development, compensation and benefits, health and
safety, employee relations, and HR policy.
IS/IT: anyone with a role pertaining to: software development and management, hardware management, support, website maintenance and development.
Estate Management: anyone involved in the provision of building and office accommodation, whether owned or leased including maintenance, repair and security.
CEO’s office: anyone working in the CEO’s office. We identified the following key performance indicators:
Cost of each function as a percentage of total expenditure;
Total cost of the function per organisation employee;
Function employees (FTE) as a percentage of total employees;
Staffing cost per function employee;

Finance Count Third Sector 2014, Volume 2.4 Central Function Costs © Agenda Consulting
6
Cost of each function as a percentage of total expenditure
Source: Tables 15.1.1, 15.2.1, 15.3.1, 15.4.1, 15.5.1, Base = 53-56
Key Findings:
The median cost of the finance function as a percentage of total expenditure is 2.4%. This is higher than in 2013 (1.9%).
The median cost of the HR function as a percentage of total expenditure is 4.5%. This is higher than in 2013 (1.4%).
The median cost of the information systems/IT function as a percentage of total expenditure is 1.9%. This is a slight increase since 2013 (1.5%).
The median cost of the estate management function is 1.7% of the total expenditure. This is a slight increase on the 2013 score (1.3%).
The median cost of the CEO’s office as a percentage of total expenditure is 1.8%. This is an increase since 2013 (0.7%).
There is significant variation between the quartiles for all of the functions. This is particularly evident in the HR function; for a quarter of organisations, the HR function costs 2.8% of total expenditure or less, and for a quarter it costs 7.5% or more.
1.7%
2.8%
1.1%
0.6%1.0%
2.4%
4.5%
1.9%1.7% 1.8%
3.9%
7.5%
2.6%
4.0%
2.9%
1.9%
1.4% 1.5%1.3%
0.7%
0.0%
1.0%
2.0%
3.0%
4.0%
5.0%
6.0%
7.0%
8.0%
Finance function HR function Informationsystems/informationtechnology function
Estate managementfunction
CEO's office
Figure 3.1 Cost of each function as a percentage of total expenditure (%)
Lower Quartile (25%) Median (50%) Upper Quartile (75%) 2013 Median (50%)

Finance Count Third Sector 2014, Volume 2.4 Central Function Costs © Agenda Consulting 7
Total cost of each function per organisation employee
Source: Tables 15.1.4, 15.2.4, 15.3.4, 15.4.4, 15.5.4, Base = 47-56
Key Findings:
At median, the total cost of the finance function per organisation employee is £1,940. This is an increase on the 2013 result (£1,315).
The median total cost of the HR function is £1,299 per organisations employee. This is an increase on the 2013 result (£1,001).
At median, the total cost of the information systems/IT function per organisation employee is £1,577. This is an increase since 2013 (£1,034).
At median, the total cost of the estate management function is £1,604 per organisation employee. This is an increase since 2013 (£828).
The median total cost of the CEO’s office is £1,492 per organisation employee. This is an increase since 21013 (£660).
All the functions have a significant range between the quartiles, particularly the estate management function; for a quarter of organisations, the cost of estate management is £331 or less per organisation employee and for a quarter it is £3,933 or more. This is probably because the scope of this function varies hugely between organisations within the sector.
£1,041
£747£873
£331
£681
£1,940
£1,299
£1,577 £1,604£1,492
£3,690
£2,041
£2,772
£3,933
£3,013
£1,315
£1,001 £1,034£828
£660
£0
£500
£1,000
£1,500
£2,000
£2,500
£3,000
£3,500
£4,000
£4,500
Finance function HR function Informationsystems/informationtechnology function
Estate managementfunction
CEO's office
Figure 3.2 Total cost of the function per organisation employee (FTE) (£)
Lower Quartile (25%) Median (50%) Upper Quartile (75%) 2013 Median (50%)

Finance Count Third Sector 2014, Volume 2.4 Central Function Costs © Agenda Consulting
8
Employees of each function as a percentage of total employees
Source: Tables 15.1.2, 15.2.2, 15.3.2, 15.4.2, 15.5.2, Base = 48-57
Key Findings:
At median, finance function employees make up 4.5% of participant organisations’ total employees (FTE). This is slightly more than 2013 (3.2%). This is more than any other function.
At median, HR function employees make up 2.3% of participant organisations’ total employees (FTE). This is similar to 2013 (1.9%).
At median, IT function employees make up 1.8% of participant organisations’ total employees (FTE). This is similar to 2013 (1.0%).
At median, estate management function employees make up 1.2% of participant organisations’ total employees (FTE). This is comparable to 2013 (1.1%).
At median, CEO’s office employees make up 1.6% of participant organisations total employees
(FTE). This is more than in 2013 (0.7%).
2.8%
1.6%
0.8%0.4%
0.8%
4.5%
2.3%
1.8%
1.2%1.6%
7.5%
2.8%
3.7%
2.8%
3.3%3.2%
1.9%
1.0% 1.1%0.7%
0.0%
1.0%
2.0%
3.0%
4.0%
5.0%
6.0%
7.0%
8.0%
9.0%
10.0%
Finance function HR function Informationsystems/informationtechnology function
Estate management CEO's office
Figure 3.3 function employees (FTE) as a percentage of total employees (FTE) (%)
Lower Quartile (25%) Median (50%) Upper Quartile (75%) 2013 Median (50%)

Finance Count Third Sector 2014, Volume 2.4 Central Function Costs © Agenda Consulting 9
Staffing cost per function employee
Source: Tables 15.1.4, 15.2.4, 15.3.4, 15.4.4, 15.5.4, Base = 47-56
Key Findings:
At median, the staffing cost of the finance function per finance employee is £35,339. This is
similar to the 2013 result (£34,523).
At median, the staffing cost of the HR function per HR employee is £37,392. This is slightly
higher than the 2013 result (£35,396).
At median, the staffing cost of the IT function per IT employee is £36,832. This is slightly higher
than the 2013 result (£37,721).
At median, the staffing cost of the estate management function per estate management
employee is £33,501. This is slightly higher than the 2013 result (£31,028).
At median, the staffing cost of the CEO’s office per employee is £71,167. This is slightly higher
than the 2013 result (£67,297).
Again, there is significant variation between the quartiles in each function.
£27,828 £31,000 £29,673£26,978
£56,473
£35,339£37,392 £36,832
£33,501
£71,167
£42,963£44,775
£43,264
£40,561
£86,667
£34,523 £35,396 £37,721£31,028
£67,297
£0
£10,000
£20,000
£30,000
£40,000
£50,000
£60,000
£70,000
£80,000
£90,000
Finance HR Informationsystems/informationtechnology function
Estate management CEO's office
Figure 3.4 Staffing cost per function employee (£)
Lower Quartile (25%) Median (50%) Upper Quartile (75%) 2013 Median (50%)

Finance Count Third Sector 2014, Volume 2.4 Central Function Costs © Agenda Consulting
10
3.2 GOOD PRACTICE In the study, participating organisations were asked to share any recent examples of good practice. For the open question in this topic, we show:
The written responses from 2014, in full, under the heading ‘2014 participant responses’.
Summaries of good practice based on responses from the 2014 and previous Finance Count studies, under the heading ‘Key points from past studies’.
Responses from the 2014 study have been attributed to each organisation. We encourage participants to make contact with each other to explore good practice further, by using the contact details available in the client area. GOOD PRACTICE IN CENTRAL FUNCTION COSTS (TABLE 15.99) 2014 Participant Responses:
We have established a full cost allocation system to attribute support costs to the main fundraising teams. As part of this process we are moving to a full accrual accounting system, including monthly depreciation.
Weekly Senior Management Team meetings; regular communication with organisation.
We allocate our support costs to other functions of the business based on our workforce (volunteers and staff) being the main cost driver.
Key points from past studies: Allocation of costs:
Consider how you allocate costs across the business, e.g. by number of staff/volunteers in the
function.
Allocate overhead costs for each function as closely as possible to get a true picture of the
costs, without becoming too focussed on the minute detail.
Capture data at departmental level to ensure accurate allocation of future costs.
Review cost allocation monthly.
Correct apportionment of overhead costs to activities/funding streams in order to demonstrate
full cost recovery has been applied.
Investment
Consider investing in systems and processes that support growth without increasing staffing
costs.
Consider investing in tools such as IT which allow people to work more efficiently.
Other
Centralise costs where possible.
Consider best value comparisons on everything more than £3k.

Finance Count Third Sector 2014, Volume 2.4 Central Function Costs © Agenda Consulting 11
4 STATISTICS TABLES This section sets out the detailed statistics tables for all measures in the Transaction Processing topic
as well as some general information about the sample.
Where the measure is numerical, a standard format has been applied. The columns used are:
Number of responses: this is the number of organisations that answered the question, as not all of the 57 participating organisations answered each question.
10%: this is the value below which 10% of the distribution lies.
Lower Quartile is the value below which 25% of the distribution lies, or, equivalently, above which 75% of the sample lies.
Median is the value below which and above which 50% of the distribution lies.
Upper Quartile is the value below which 75% of the distribution lies, or, equivalently, above which 25% of the sample lies.
90%: this is the value below which 90% of the distribution lies.
Where the measure is multi choice e.g. Yes/No, we have reported the percentage of participants with each answer. The above statistics are calculated for the following rows in each table:
Whole sample: based on the answers from all respondents.
Under £5m: based on the answers from those respondents with an income of less than £5m.
£5m – £10m: based on the answers from those respondents with an income between £5m - £10m.
£10m - £25m: respondents with an income between £10m - £25m.
£25m - £50m: respondents with an income between £25m - £50m.
Over £50m: respondents with an income of more than £50m
Sub-sectors: based on answers from those participants that work in specific sectors. Participants could choose up to three sectors to describe their work.
In some cases, percentages may not add up to 100 due to rounding differences. Measures with fewer than 5 responses are not shown in this report. Similarly, in each table, rows for which there were less than 5 responses have been taken out of this report.

Finance Count Third Sector 2014, Volume 2.4 Central Function Costs © Agenda Consulting
12
4.1 GENERAL INFORMATION
1.2 Income of organisation (£millions)
Number of Responses
Lowest (10%)
Lower Quartile (25%)
Median (50%)
Upper Quartile (75%)
Highest (90%)
Whole Sample 57 3.0 5.0 13.5 48.1 99.1
Income
Under £5m 15 1.6 2.3 3.3 4.1 4.6
£5m-£10m 12 5.2 5.6 7.1 8.5 9.4
£10m-£25m 7 13.3 14.9 16.3 20.4 23.1
£25m-£50m 9 28.2 29.4 31.9 39.0 42.0
Over £50m 14 58.7 65.8 97.3 138.3 199.3
Sector
Children/Young People 16 2.2 3.1 5.2 12.9 50.1
Economic/Community development/Employment 6 2.2 3.7 9.0 43.4 75.9
Education/ Training 20 2.5 4.0 6.3 29.8 96.6
Grant making 9 2.8 4.2 29.4 70.1 307.1
Health care/Medical research 17 3.0 6.3 9.8 39.0 80.6
Housing 10 4.1 5.1 7.3 36.5 67.9
International development 9 7.7 16.3 25.6 66.4 120.3
People with disabilities 8 4.0 8.3 26.6 35.5 60.2
Social care 11 4.2 6.9 9.8 31.4 53.5
Umbrella body/Trade association 5 2.0 2.6 3.7 4.1 4.2
Other 7 6.1 9.9 13.5 33.4 69.0
1.3.1 Percentage of income from individual donations and fundraising, legacies
and fundraising branches
Number of Responses
Lowest (10%)
Lower Quartile (25%)
Median (50%)
Upper Quartile (75%)
Highest (90%)
Whole Sample 57 0.0 0.3 11.2 54.0 76.5
Income
Under £5m 15 0.1 0.2 11.2 34.0 82.1
£5m-£10m 12 0.0 0.1 1.6 10.3 36.4
£10m-£25m 7 0.0 0.1 0.3 34.1 68.7
£25m-£50m 9 0.2 2.6 15.7 54.0 77.8
Over £50m 14 1.2 16.6 51.4 61.4 69.7
Sector
Children/Young People 16 0.1 2.1 18.6 62.7 76.9
Economic/Community development/Employment 6 0.3 1.4 5.1 17.5 32.8
Education/ Training 20 0.0 0.3 7.9 38.4 77.4
Grant making 9 0.0 3.5 27.4 76.7 83.4
Health care/Medical research 17 1.4 19.6 49.5 76.7 81.5
Housing 10 0.1 0.3 1.8 9.8 18.5
International development 9 0.0 0.1 8.9 59.4 62.3
People with disabilities 8 0.4 0.6 9.6 67.0 83.5
Social care 11 0.1 0.4 8.9 39.4 53.4
Umbrella body/Trade association 5 0.0 0.1 0.1 0.3 20.1
Other 7 0.0 0.0 0.1 1.4 28.5

Finance Count Third Sector 2014, Volume 2.4 Central Function Costs © Agenda Consulting 13
1.3.2 Percentage of income from companies and their staff, including payroll
giving and trusts and foundations
Number of Responses
Lowest (10%)
Lower Quartile (25%)
Median (50%)
Upper Quartile (75%)
Highest (90%)
Whole Sample 55 0.0 0.0 4.4 12.8 37.4
Income
Under £5m 15 0.0 1.5 7.6 29.4 59.1
£5m-£10m 11 0.0 0.0 0.0 6.2 10.3
£10m-£25m 6 0.0 0.5 7.8 14.9 15.9
£25m-£50m 9 0.0 0.1 1.4 5.0 13.4
Over £50m 14 0.0 0.0 4.5 11.7 27.2
Sector
Children/Young People 16 0.0 0.1 11.1 13.9 53.8
Economic/Community development/Employment 6 1.1 2.8 22.7 43.9 55.8
Education/ Training 19 0.0 0.8 5.0 12.6 47.2
Grant making 9 0.0 0.1 4.5 13.0 24.9
Health care/Medical research 16 0.3 2.6 7.1 13.1 15.1
Housing 10 0.0 0.0 0.0 8.8 41.5
International development 8 0.0 0.0 0.7 12.8 20.4
People with disabilities 8 0.0 1.7 4.5 7.8 13.0
Social care 10 0.0 0.4 3.4 10.9 19.6
Umbrella body/Trade association 5 0.0 0.0 0.2 5.1 9.6
Other 6 0.0 0.0 0.1 1.6 8.8
1.3.3 Percentage of income from statutory grants, service level agreements
with statutory bodies and contracts with statutory bodies
Number of Responses
Lowest (10%)
Lower Quartile (25%)
Median (50%)
Upper Quartile (75%)
Highest (90%)
Whole Sample 56 0.0 0.4 29.6 78.0 96.8
Income
Under £5m 15 0.0 0.0 0.0 62.8 85.5
£5m-£10m 12 0.3 20.3 43.7 68.3 95.6
£10m-£25m 6 0.7 21.4 90.0 98.9 99.7
£25m-£50m 9 0.0 0.8 63.7 93.4 95.3
Over £50m 14 0.4 7.1 25.0 34.7 75.7
Sector
Children/Young People 16 0.0 0.3 32.4 68.0 87.5
Economic/Community development/Employment 6 14.9 34.4 49.2 81.2 94.5
Education/ Training 20 0.0 0.0 11.9 54.1 80.1
Grant making 9 0.0 0.0 0.3 0.8 70.7
Health care/Medical research 17 0.0 0.0 0.9 33.7 62.7
Housing 10 22.8 27.0 50.8 86.3 96.5
International development 9 17.8 29.3 75.2 95.2 98.1
People with disabilities 8 0.0 11.9 64.6 81.6 95.2
Social care 10 18.7 23.7 41.7 77.1 94.0
Umbrella body/Trade association 5 0.0 0.0 0.0 78.9 85.5
Other 6 0.0 7.3 56.0 92.5 96.6

Finance Count Third Sector 2014, Volume 2.4 Central Function Costs © Agenda Consulting
14
1.3.4 Percentage of income from investments
Number of Responses
Lowest (10%)
Lower Quartile (25%)
Median (50%)
Upper Quartile (75%)
Highest (90%)
Whole Sample 57 0.0 0.2 0.6 1.5 4.7
Income
Under £5m 15 0.0 0.2 0.4 3.2 6.4
£5m-£10m 12 0.0 0.2 0.6 1.1 2.8
£10m-£25m 7 0.1 0.1 0.2 0.4 2.0
£25m-£50m 9 0.4 0.6 1.1 2.6 4.1
Over £50m 14 0.1 0.2 0.5 0.9 4.0
Sector
Children/Young People 16 0.0 0.1 0.5 1.8 4.0
Economic/Community development/Employment 6 0.1 0.2 0.4 0.7 1.1
Education/ Training 20 0.0 0.3 0.7 2.9 4.6
Grant making 9 0.4 0.5 2.1 6.3 20.1
Health care/Medical research 17 0.2 0.6 1.3 2.9 4.7
Housing 10 0.1 0.3 0.4 0.6 8.9
International development 9 0.0 0.0 0.1 0.1 0.2
People with disabilities 8 0.4 0.6 0.8 2.2 4.3
Social care 11 0.0 0.2 0.3 0.6 0.6
Umbrella body/Trade association 5 0.2 0.4 4.4 6.3 6.4
Other 7 0.0 0.1 0.2 0.6 1.0
1.3.5 Percentage of income from membership subscriptions
Number of Responses
Lowest (10%)
Lower Quartile (25%)
Median (50%)
Upper Quartile (75%)
Highest (90%)
Whole Sample 54 0.0 0.0 0.0 0.0 2.6
Income
Under £5m 15 0.0 0.0 0.0 0.0 19.2
£5m-£10m 11 0.0 0.0 0.0 1.1 16.1
£10m-£25m 5 0.0 0.0 0.0 0.0 0.0
£25m-£50m 9 0.0 0.0 0.0 0.0 4.4
Over £50m 14 0.0 0.0 0.0 0.0 0.1
Sector
Children/Young People 16 0.0 0.0 0.0 0.1 9.2
Economic/Community development/Employment 6 0.0 0.0 0.0 0.0 0.0
Education/ Training 19 0.0 0.0 0.0 1.1 32.5
Grant making 9 0.0 0.0 0.0 0.0 0.7
Health care/Medical research 15 0.0 0.0 0.0 0.0 1.4
Housing 10 0.0 0.0 0.0 0.0 1.6
International development 8 0.0 0.0 0.0 0.0 0.0
People with disabilities 8 0.0 0.0 0.0 0.0 0.0
Social care 10 0.0 0.0 0.0 0.0 0.0
Umbrella body/Trade association 5 0.0 0.1 2.7 30.1 37.4
Other 6 0.0 0.0 0.0 0.0 42.4

Finance Count Third Sector 2014, Volume 2.4 Central Function Costs © Agenda Consulting 15
1.3.6 Percentage of income from trading income not included above
Number of Responses
Lowest (10%)
Lower Quartile (25%)
Median (50%)
Upper Quartile (75%)
Highest (90%)
Whole Sample 55 0.0 0.3 3.2 11.4 21.1
Income
Under £5m 15 0.8 1.2 3.3 15.5 47.7
£5m-£10m 11 0.0 0.1 12.5 19.4 44.7
£10m-£25m 6 0.0 0.0 0.0 8.0 11.2
£25m-£50m 9 0.2 1.1 3.3 4.8 7.6
Over £50m 14 0.0 0.6 2.7 9.3 13.4
Sector
Children/Young People 16 0.0 0.2 2.4 3.5 11.2
Economic/Community development/Employment 6 0.0 0.0 1.9 9.0 15.8
Education/ Training 19 0.2 1.7 8.8 14.0 63.8
Grant making 9 0.1 0.7 1.3 4.8 23.6
Health care/Medical research 16 0.4 2.1 9.0 12.5 27.1
Housing 10 0.0 0.1 1.1 2.8 23.2
International development 8 0.0 0.0 2.3 4.1 7.5
People with disabilities 8 0.0 0.5 1.6 2.8 8.6
Social care 10 0.9 1.8 12.8 19.9 34.0
Umbrella body/Trade association 5 5.2 8.3 20.3 57.6 76.2
Other 6 0.0 0.1 1.6 11.4 57.1
1.3.7 Percentage of income from other income
Number of Responses
Lowest (10%)
Lower Quartile (25%)
Median (50%)
Upper Quartile (75%)
Highest (90%)
Whole Sample 56 0.0 0.1 1.0 3.7 15.7
Income
Under £5m 15 0.0 0.2 0.9 2.0 9.5
£5m-£10m 12 0.0 0.1 1.1 8.3 24.5
£10m-£25m 6 0.0 0.0 0.3 1.6 2.5
£25m-£50m 9 0.0 0.3 4.6 10.2 24.6
Over £50m 14 0.1 0.4 1.1 3.4 9.6
Sector
Children/Young People 16 0.1 0.5 1.5 3.4 17.6
Economic/Community development/Employment 6 0.0 0.0 0.4 2.8 3.8
Education/ Training 20 0.0 0.5 1.9 10.3 15.1
Grant making 9 0.6 1.0 2.2 10.2 24.6
Health care/Medical research 17 0.1 0.5 1.2 3.2 18.5
Housing 10 0.2 0.4 4.4 12.7 24.6
International development 9 0.0 0.0 0.0 0.4 3.6
People with disabilities 8 0.0 0.0 1.4 7.7 18.8
Social care 10 0.1 0.3 1.2 4.3 10.9
Umbrella body/Trade association 5 0.8 1.1 1.2 2.0 2.1
Other 6 0.0 0.0 0.0 0.0 0.9
Finance Count Third Sector 2014, Volume 2.4 Central Function Costs © Agenda Consulting
16
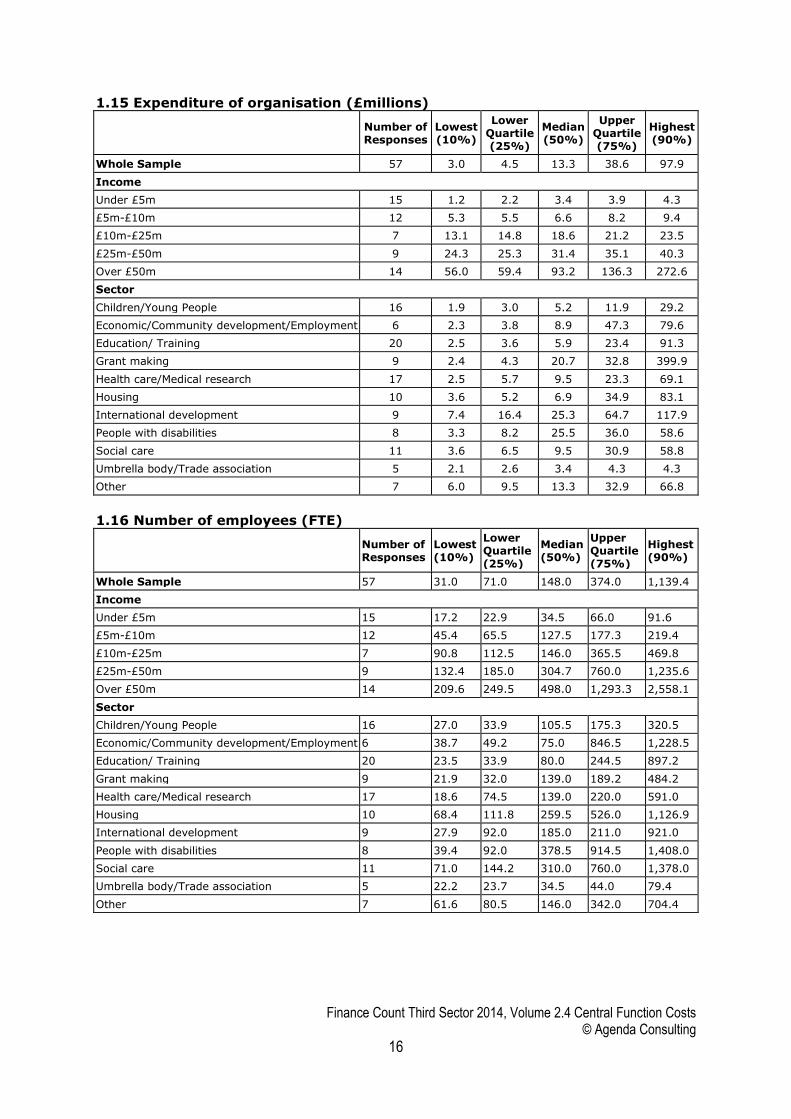
1.15 Expenditure of organisation (£millions)
Number of Responses
Lowest (10%)
Lower Quartile (25%)
Median (50%)
Upper Quartile (75%)
Highest (90%)
Whole Sample 57 3.0 4.5 13.3 38.6 97.9
Income
Under £5m 15 1.2 2.2 3.4 3.9 4.3
£5m-£10m 12 5.3 5.5 6.6 8.2 9.4
£10m-£25m 7 13.1 14.8 18.6 21.2 23.5
£25m-£50m 9 24.3 25.3 31.4 35.1 40.3
Over £50m 14 56.0 59.4 93.2 136.3 272.6
Sector
Children/Young People 16 1.9 3.0 5.2 11.9 29.2
Economic/Community development/Employment 6 2.3 3.8 8.9 47.3 79.6
Education/ Training 20 2.5 3.6 5.9 23.4 91.3
Grant making 9 2.4 4.3 20.7 32.8 399.9
Health care/Medical research 17 2.5 5.7 9.5 23.3 69.1
Housing 10 3.6 5.2 6.9 34.9 83.1
International development 9 7.4 16.4 25.3 64.7 117.9
People with disabilities 8 3.3 8.2 25.5 36.0 58.6
Social care 11 3.6 6.5 9.5 30.9 58.8
Umbrella body/Trade association 5 2.1 2.6 3.4 4.3 4.3
Other 7 6.0 9.5 13.3 32.9 66.8
1.16 Number of employees (FTE)
Number of Responses
Lowest (10%)
Lower Quartile (25%)
Median (50%)
Upper Quartile (75%)
Highest (90%)
Whole Sample 57 31.0 71.0 148.0 374.0 1,139.4
Income
Under £5m 15 17.2 22.9 34.5 66.0 91.6
£5m-£10m 12 45.4 65.5 127.5 177.3 219.4
£10m-£25m 7 90.8 112.5 146.0 365.5 469.8
£25m-£50m 9 132.4 185.0 304.7 760.0 1,235.6
Over £50m 14 209.6 249.5 498.0 1,293.3 2,558.1
Sector
Children/Young People 16 27.0 33.9 105.5 175.3 320.5
Economic/Community development/Employment 6 38.7 49.2 75.0 846.5 1,228.5
Education/ Training 20 23.5 33.9 80.0 244.5 897.2
Grant making 9 21.9 32.0 139.0 189.2 484.2
Health care/Medical research 17 18.6 74.5 139.0 220.0 591.0
Housing 10 68.4 111.8 259.5 526.0 1,126.9
International development 9 27.9 92.0 185.0 211.0 921.0
People with disabilities 8 39.4 92.0 378.5 914.5 1,408.0
Social care 11 71.0 144.2 310.0 760.0 1,378.0
Umbrella body/Trade association 5 22.2 23.7 34.5 44.0 79.4
Other 7 61.6 80.5 146.0 342.0 704.4

Finance Count Third Sector 2014, Volume 2.4 Central Function Costs © Agenda Consulting 17
1.17 Number of employees (headcount)
Number of Responses
Lowest (10%)
Lower Quartile (25%)
Median (50%)
Upper Quartile (75%)
Highest (90%)
Whole Sample 57 34 84 178 421 1,458
Income
Under £5m 15 18 27 38 87 120
£5m-£10m 12 48 74 160 198 270
£10m-£25m 7 100 120 159 401 533
£25m-£50m 9 152 185 321 1,210 1,434
Over £50m 14 216 265 570 1,735 3,769
Sector
Children/Young People 16 29 38 144 192 330
Economic/Community development/Employment 6 45 57 77 1,180 2,687
Education/ Training 20 27 38 95 326 1,243
Grant making 9 25 35 162 205 557
Health care/Medical research 17 22 89 166 237 651
Housing 10 95 139 305 662 1,791
International development 9 30 107 185 227 1,024
People with disabilities 8 42 99 487 1,299 1,635
Social care 11 89 169 380 1,003 3,624
Umbrella body/Trade association 5 26 27 38 84 140
Other 7 67 85 159 377 788
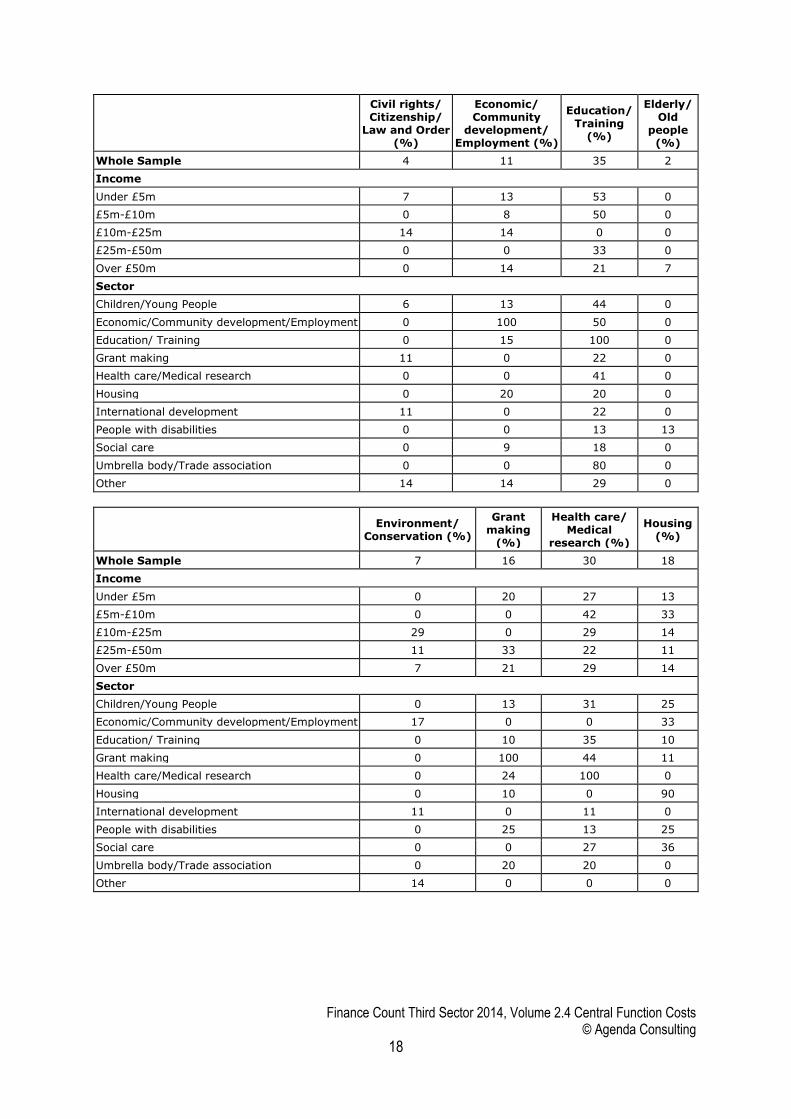
1.18 Analysis by sector
Number of Responses
Animal Welfare
(%)
Arts/
Culture (%)
Children/ Young People (%)
Whole Sample 57 2 2 28
Income
Under £5m 15 0 0 47
£5m-£10m 12 0 0 42
£10m-£25m 7 0 0 14
£25m-£50m 9 11 0 11
Over £50m 14 0 7 14
Sector
Children/Young People 16 0 0 100
Economic/Community development/Employment 6 0 0 33
Education/ Training 20 5 0 35
Grant making 9 0 11 22
Health care/Medical research 17 0 0 29
Housing 10 0 0 40
International development 9 0 0 22
People with disabilities 8 0 0 13
Social care 11 0 0 27
Umbrella body/Trade association 5 0 0 40
Other 7 0 0 0
Finance Count Third Sector 2014, Volume 2.4 Central Function Costs © Agenda Consulting
18
Civil rights/
Citizenship/
Law and Order (%)
Economic/
Community development/
Employment (%)
Education/
Training (%)
Elderly/
Old people
(%)
Whole Sample 4 11 35 2
Income
Under £5m 7 13 53 0
£5m-£10m 0 8 50 0
£10m-£25m 14 14 0 0
£25m-£50m 0 0 33 0
Over £50m 0 14 21 7
Sector
Children/Young People 6 13 44 0
Economic/Community development/Employment 0 100 50 0
Education/ Training 0 15 100 0
Grant making 11 0 22 0
Health care/Medical research 0 0 41 0
Housing 0 20 20 0
International development 11 0 22 0
People with disabilities 0 0 13 13
Social care 0 9 18 0
Umbrella body/Trade association 0 0 80 0
Other 14 14 29 0
Environment/
Conservation (%)
Grant making
(%)
Health care/
Medical research (%)
Housing (%)
Whole Sample 7 16 30 18
Income
Under £5m 0 20 27 13
£5m-£10m 0 0 42 33
£10m-£25m 29 0 29 14
£25m-£50m 11 33 22 11
Over £50m 7 21 29 14
Sector
Children/Young People 0 13 31 25
Economic/Community development/Employment 17 0 0 33
Education/ Training 0 10 35 10
Grant making 0 100 44 11
Health care/Medical research 0 24 100 0
Housing 0 10 0 90
International development 11 0 11 0
People with disabilities 0 25 13 25
Social care 0 0 27 36
Umbrella body/Trade association 0 20 20 0
Other 14 0 0 0

Finance Count Third Sector 2014, Volume 2.4 Central Function Costs © Agenda Consulting 19
International development
(%)
Mental Health (%)
People of a particular
ethnic or racial origin (%)
People with disabilities
(%)
Whole Sample 16 5 0 14
Income
Under £5m 7 0 0 13
£5m-£10m 8 8 0 8
£10m-£25m 29 29 0 14
£25m-£50m 11 0 0 33
Over £50m 29 0 0 7
Sector
Children/Young People 13 0 0 6
Economic/Community development/Employment 0 0 0 0
Education/ Training 10 0 0 5
Grant making 0 0 0 22
Health care/Medical research 6 0 0 6
Housing 0 10 0 20
International development 100 0 0 0
People with disabilities 0 25 0 100
Social care 18 18 0 18
Umbrella body/Trade association 0 0 0 0
Other 29 14 0 0
Religious/
Missionary (%)
Social care (%)
Sport/
Recreation (%)
Umbrella body/
Trade association (%)
Whole Sample 2 19 5 9
Income
Under £5m 0 20 7 33
£5m-£10m 0 25 17 0
£10m-£25m 0 29 0 0
£25m-£50m 0 11 0 0
Over £50m 7 14 0 0
Sector
Children/Young People 0 19 13 13
Economic/Community development/Employment 0 17 0 0
Education/ Training 0 10 0 20
Grant making 11 0 0 11
Health care/Medical research 0 18 0 6
Housing 10 40 30 0
International development 0 22 0 0
People with disabilities 0 25 0 0
Social care 0 91 9 0
Umbrella body/Trade association 0 0 0 100
Other 0 14 0 0

Finance Count Third Sector 2014, Volume 2.4 Central Function Costs © Agenda Consulting
20
Other (%)
Whole Sample 12
Income
Under £5m 0
£5m-£10m 17
£10m-£25m 43
£25m-£50m 11
Over £50m 7
Sector
Children/Young People 0
Economic/Community development/Employment 17
Education/ Training 10
Grant making 0
Health care/Medical research 0
Housing 0
International development 22
People with disabilities 0
Social care 9
Umbrella body/Trade association 0
Other 100
1.19 Participants by income band
Number of Responses % of Whole
Whole Sample 57 100
Income
Under £5m 15 26
£5m-£10m 12 21
£10m-£25m 7 12
£25m-£50m 9 16
Over £50m 14 25

Finance Count Third Sector 2014, Volume 2.4 Central Function Costs © Agenda Consulting 21
1.20 Net assets (£millions)
Number of Responses
Lowest (10%)
Lower Quartile (25%)
Median (50%)
Upper Quartile (75%)
Highest (90%)
Whole Sample 57 1.1 2.6 6.2 22.3 97.2
Income
Under £5m 15 0.6 1.0 1.9 3.9 11.6
£5m-£10m 12 1.6 2.5 4.8 6.1 8.5
£10m-£25m 7 3.3 4.4 9.7 15.5 17.1
£25m-£50m 9 4.6 22.3 33.2 65.1 118.2
Over £50m 14 6.8 15.4 31.7 120.5 149.0
Sector
Children/Young People 16 1.1 1.7 3.2 13.8 19.3
Economic/Community development/Employment 6 1.5 2.5 4.9 14.4 29.2
Education/ Training 20 1.1 1.8 8.6 35.1 71.8
Grant making 9 1.8 4.6 22.7 131.1 1,241.2
Health care/Medical research 17 0.9 1.6 8.6 15.9 72.4
Housing 10 1.7 3.0 6.8 15.6 588.9
International development 9 1.7 2.6 6.0 18.9 43.6
People with disabilities 8 2.4 4.2 8.0 29.7 54.6
Social care 11 1.9 3.1 6.2 16.7 25.9
Umbrella body/Trade association 5 0.3 0.5 11.1 11.9 12.9
Other 7 3.4 4.4 6.0 12.5 20.3
1.21 Income per employee FTE (£)
Number of Responses
Lowest (10%)
Lower Quartile (25%)
Median (50%)
Upper Quartile (75%)
Highest (90%)
Whole Sample 57 37,852 44,907 94,456 177,185 276,818
Income
Under £5m 15 31,225 45,025 93,384 157,096 206,050
£5m-£10m 12 38,445 41,878 50,325 98,853 112,628
£10m-£25m 7 44,343 48,892 122,887 136,687 158,373
£25m-£50m 9 37,930 44,412 104,611 205,980 223,602
Over £50m 14 53,822 71,985 224,979 316,031 423,997
Sector
Children/Young People 16 31,907 41,878 69,768 146,201 277,169
Economic/Community development/Employment 6 42,016 49,990 63,074 102,603 129,262
Education/ Training 20 38,407 55,469 79,496 133,416 213,875
Grant making 9 130,178 176,194 211,342 415,368 628,692
Health care/Medical research 17 47,436 53,035 122,887 211,342 262,847
Housing 10 28,025 31,749 43,914 56,259 142,960
International development 9 114,906 138,342 225,955 283,083 312,435
People with disabilities 8 39,903 44,408 58,388 107,316 179,356
Social care 11 29,415 43,948 48,714 55,904 64,362
Umbrella body/Trade association 5 30,197 37,015 119,616 174,816 175,643
Other 7 42,122 68,977 112,043 136,687 194,845

Finance Count Third Sector 2014, Volume 2.4 Central Function Costs © Agenda Consulting
22
1.22 Expenditure per employee FTE (£)
Number of Responses
Lowest (10%)
Lower Quartile (25%)
Median (50%)
Upper Quartile (75%)
Highest (90%)
Whole Sample 57 36,405 46,178 82,683 148,878 255,667
Income
Under £5m 15 32,020 43,384 78,268 127,128 173,755
£5m-£10m 12 34,928 41,133 48,387 93,858 119,789
£10m-£25m 7 43,586 49,647 127,375 143,139 157,128
£25m-£50m 9 37,076 46,178 82,683 148,878 189,736
Over £50m 14 57,205 71,972 156,887 282,277 537,449
Sector
Children/Young People 16 32,746 41,133 67,880 119,329 167,768
Economic/Community development/Employment 6 44,934 53,866 64,467 103,530 128,242
Education/ Training 20 36,419 52,123 77,237 125,651 163,278
Grant making 9 82,508 117,713 173,491 254,717 812,491
Health care/Medical research 17 46,347 52,469 106,752 148,878 198,344
Housing 10 27,491 30,943 43,385 52,889 165,572
International development 9 115,074 136,848 205,455 275,466 294,421
People with disabilities 8 39,250 44,246 58,747 79,600 134,933
Social care 11 28,009 42,983 48,886 54,358 65,873
Umbrella body/Trade association 5 30,496 37,883 124,174 161,183 173,755
Other 7 41,455 65,104 120,500 135,232 188,690
1.23 Asset value per employee FTE (£)
Number of Responses
Lowest (10%)
Lower Quartile (25%)
Median (50%)
Upper Quartile (75%)
Highest (90%)
Whole Sample 57 12,222 23,677 54,890 113,331 309,320
Income
Under £5m 15 9,247 26,460 62,754 131,019 458,089
£5m-£10m 12 13,296 27,790 35,335 64,670 94,308
£10m-£25m 7 15,648 23,314 37,822 84,401 119,912
£25m-£50m 9 18,730 23,199 54,411 239,180 440,452
Over £50m 14 16,034 31,775 63,926 151,235 239,384
Sector
Children/Young People 16 7,955 31,402 54,650 90,597 157,632
Economic/Community development/Employment 6 17,604 21,937 42,477 55,327 81,430
Education/ Training 20 18,519 32,785 56,673 178,278 403,039
Grant making 9 58,931 63,010 239,180 502,129 2,935,729
Health care/Medical research 17 20,850 36,910 65,503 177,038 353,110
Housing 10 11,779 16,459 21,222 37,075 1,287,344
International development 9 21,791 28,731 42,522 85,000 107,390
People with disabilities 8 18,506 26,563 49,026 58,321 60,756
Social care 11 12,275 17,374 29,161 40,172 65,503
Umbrella body/Trade association 5 5,549 10,349 392,029 502,129 515,255
Other 7 14,606 17,371 55,472 70,883 101,899

Finance Count Third Sector 2014, Volume 2.4 Central Function Costs © Agenda Consulting 23
1.24 Surplus/deficit as a % of income
Number of Responses
Lowest (10%)
Lower Quartile (25%)
Median (50%)
Upper Quartile (75%)
Highest (90%)
Whole Sample 57 -4.2 -2.2 1.9 7.1 14.4
Income
Under £5m 15 -3.2 -2.3 7.8 11.8 31.7
£5m-£10m 12 -0.5 0.4 3.7 6.5 7.5
£10m-£25m 7 -9.3 -2.5 0.1 1.7 1.9
£25m-£50m 9 -1.8 1.1 4.8 15.8 22.7
Over £50m 14 -8.7 -2.3 1.9 5.2 6.5
Sector
Children/Young People 16 -3.9 -2.4 1.6 7.6 27.8
Economic/Community development/Employment 6 -6.4 -2.8 -2.2 -1.0 0.6
Education/ Training 20 -3.8 -2.5 1.5 7.2 14.7
Grant making 9 -15.6 -3.4 10.5 29.6 49.6
Health care/Medical research 17 -0.8 3.4 7.1 15.8 44.3
Housing 10 -14.1 -1.8 1.2 4.6 6.7
International development 9 -0.9 0.1 2.6 4.2 7.1
People with disabilities 8 -1.1 0.6 3.3 8.3 22.6
Social care 11 -4.4 -1.1 3.4 6.3 9.1
Umbrella body/Trade association 5 -3.6 -3.4 -2.3 0.3 4.8
Other 7 -2.9 0.8 1.8 3.0 5.5
1.25 Average salary per employee (FTE) (£)
Number of Responses
Lowest (10%)
Lower Quartile (25%)
Median (50%)
Upper Quartile (75%)
Highest (90%)
Whole Sample 56 20,127 24,898 30,805 38,768 43,958
Income
Under £5m 15 19,015 22,736 31,859 38,624 43,738
£5m-£10m 12 19,905 23,816 30,677 37,777 39,633
£10m-£25m 7 25,575 27,445 39,120 45,437 49,875
£25m-£50m 9 23,083 24,903 26,173 30,660 36,672
Over £50m 13 23,378 27,770 30,949 37,579 40,271
Sector
Children/Young People 16 19,140 21,395 28,220 37,834 42,783
Economic/Community development/Employment 6 23,767 27,808 29,890 44,622 56,050
Education/ Training 20 22,506 26,424 32,185 39,538 45,921
Grant making 9 25,187 30,660 36,011 37,579 39,014
Health care/Medical research 16 25,909 28,346 34,440 38,768 42,801
Housing 10 15,558 19,248 27,209 30,238 38,906
International development 9 22,347 28,842 36,909 40,464 43,873
People with disabilities 8 21,986 25,466 29,347 33,913 38,551
Social care 11 15,874 23,231 26,857 30,521 32,869
Umbrella body/Trade association 5 20,242 24,230 40,468 45,918 45,940
Other 7 22,386 24,268 37,202 40,750 44,750

Finance Count Third Sector 2014, Volume 2.4 Central Function Costs © Agenda Consulting
24
1.26 Cost of staff salaries as a percentage of expenditure
Number of Responses
Lowest (10%)
Lower Quartile (25%)
Median (50%)
Upper Quartile (75%)
Highest (90%)
Whole Sample 56 13.0 28.2 45.2 55.8 63.4
Income
Under £5m 15 23.5 29.1 49.4 61.1 63.8
£5m-£10m 12 32.3 48.2 55.6 58.1 72.0
£10m-£25m 7 28.2 30.9 34.2 51.9 58.6
£25m-£50m 9 14.5 24.2 31.8 55.8 58.0
Over £50m 13 6.1 9.6 31.9 45.2 50.6
Sector
Children/Young People 16 21.7 31.4 49.7 57.7 71.0
Economic/Community development/Employment 6 36.0 41.3 53.1 55.4 56.8
Education/ Training 20 24.0 30.6 43.8 56.3 62.6
Grant making 9 5.0 12.0 22.2 25.4 35.4
Health care/Medical research 16 19.6 28.2 46.9 53.8 61.7
Housing 10 45.8 52.9 56.2 62.8 64.6
International development 9 9.2 10.5 18.0 28.9 33.3
People with disabilities 8 35.4 45.9 52.5 56.0 58.8
Social care 11 34.6 50.3 55.5 58.7 61.5
Umbrella body/Trade association 5 24.7 28.5 37.0 64.0 66.8
Other 7 21.7 31.9 34.2 50.2 58.4

Finance Count Third Sector 2014, Volume 2.4 Central Function Costs © Agenda Consulting 25
4.2 CENTRAL FUNCTION COSTS 15.1.1 Total cost of the finance function as a percentage of total expenditure
Number of Responses
Lowest (10%)
Lower Quartile (25%)
Median (50%)
Upper Quartile (75%)
Highest (90%)
Whole Sample 56 1.1 1.7 2.4 3.9 4.5
Income
Under £5m 15 2.3 3.1 4.0 4.4 5.9
£5m-£10m 12 1.7 1.9 2.8 3.9 5.1
£10m-£25m 7 1.8 2.1 2.7 3.2 3.6
£25m-£50m 9 1.4 1.5 1.9 2.2 3.0
Over £50m 13 0.8 0.9 1.2 1.8 2.1
Sector
Children/Young People 16 1.7 2.1 3.4 4.6 5.8
Economic/Community development/Employment 6 1.8 1.9 2.5 3.8 4.2
Education/ Training 20 1.4 1.9 2.4 4.1 5.7
Grant making 9 0.7 1.2 1.8 4.0 4.3
Health care/Medical research 16 1.0 1.6 2.5 4.0 4.8
Housing 10 1.4 1.8 2.3 3.2 3.5
International development 9 0.8 1.2 2.1 3.9 4.6
People with disabilities 8 1.4 1.5 2.0 3.7 3.9
Social care 11 1.7 2.0 3.3 3.9 4.6
Umbrella body/Trade association 5 1.8 2.0 2.7 3.0 7.5
Other 7 1.5 2.3 2.9 3.5 6.0
15.1.2 Finance employees (FTE) as percentage of total employees (FTE)
Number of Responses
Lowest (10%)
Lower Quartile (25%)
Median (50%)
Upper Quartile (75%)
Highest (90%)
Whole Sample 57 2.1 2.8 4.5 7.5 12.6
Income
Under £5m 15 3.2 4.4 6.3 10.4 17.1
£5m-£10m 12 2.2 3.0 3.3 4.8 8.4
£10m-£25m 7 2.0 2.8 5.3 8.4 10.3
£25m-£50m 9 1.9 2.4 2.7 5.5 7.7
Over £50m 14 2.0 2.9 3.8 8.2 11.4
Sector
Children/Young People 16 2.3 3.3 4.5 12.0 16.6
Economic/Community development/Employment 6 2.8 3.6 4.7 6.6 7.5
Education/ Training 20 2.4 3.0 4.7 6.5 15.6
Grant making 9 3.2 5.5 6.8 11.2 14.1
Health care/Medical research 17 1.7 3.0 4.7 6.0 17.0
Housing 10 2.0 2.2 3.1 3.9 5.3
International development 9 4.3 8.1 9.3 12.3 16.5
People with disabilities 8 1.9 2.3 3.0 6.9 7.2
Social care 11 1.4 2.1 3.1 3.8 6.0
Umbrella body/Trade association 5 2.5 2.8 5.2 6.3 11.2
Other 7 2.0 3.3 5.6 8.3 10.1

Finance Count Third Sector 2014, Volume 2.4 Central Function Costs © Agenda Consulting
26
15.1.3 Staffing cost per finance employee (FTE) (£)
Number of Responses
Lowest (10%)
Lower Quartile (25%)
Median (50%)
Upper Quartile (75%)
Highest (90%)
Whole Sample 56 23,221 27,828 35,339 42,963 48,114
Income
Under £5m 15 16,929 23,496 34,996 44,283 50,658
£5m-£10m 12 27,653 32,131 34,214 37,915 43,089
£10m-£25m 7 30,064 31,992 39,286 41,630 44,818
£25m-£50m 9 27,975 28,151 36,963 47,727 50,751
Over £50m 13 23,881 27,918 34,376 38,181 41,975
Sector
Children/Young People 16 17,151 22,444 34,830 40,364 46,013
Economic/Community development/Employment 6 26,318 35,125 40,450 44,882 45,881
Education/ Training 20 18,039 27,794 34,686 43,397 49,055
Grant making 9 27,707 34,010 36,963 43,125 47,564
Health care/Medical research 16 27,049 29,159 38,670 44,011 56,210
Housing 10 26,853 28,326 33,806 34,860 37,989
International development 9 17,752 25,601 32,248 43,744 49,919
People with disabilities 8 26,133 27,488 35,691 37,860 43,299
Social care 11 27,476 29,827 34,996 38,266 39,515
Umbrella body/Trade association 5 19,225 24,000 42,909 44,863 62,672
Other 7 29,282 31,992 32,935 41,964 46,948
15.1.4 Total cost of the finance function per organisation employee (FTE) (£)
Number of Responses
Lowest (10%)
Lower Quartile (25%)
Median (50%)
Upper Quartile (75%)
Highest (90%)
Whole Sample 56 827.4 1,041.1 1,939.5 3,689.6 5,094.8
Income
Under £5m 15 996.7 1,560.3 3,097.9 4,202.5 10,461.5
£5m-£10m 12 935.8 1,012.7 1,418.3 2,132.5 3,964.2
£10m-£25m 7 759.9 1,352.9 3,157.9 4,554.4 4,809.8
£25m-£50m 9 787.1 1,017.7 1,632.1 2,780.7 4,082.9
Over £50m 13 879.8 1,149.8 1,369.3 3,720.8 4,898.4
Sector
Children/Young People 16 833.8 1,008.1 1,946.6 4,387.9 9,866.1
Economic/Community development/Employment 6 1,210.9 1,378.1 1,734.1 2,318.5 3,401.7
Education/ Training 20 931.0 1,121.9 1,611.4 3,424.0 7,301.9
Grant making 9 1,826.6 2,780.7 3,189.6 3,679.2 5,049.3
Health care/Medical research 16 832.1 1,121.9 1,999.0 3,400.2 4,991.0
Housing 10 648.1 948.9 1,056.4 1,565.9 2,310.9
International development 9 1,522.2 2,220.2 4,416.3 4,934.3 7,126.5
People with disabilities 8 612.8 790.6 1,312.0 3,133.9 3,373.1
Social care 11 728.8 932.4 1,369.3 1,772.9 2,002.2
Umbrella body/Trade association 5 712.0 1,022.7 3,189.6 4,811.3 9,767.9
Other 7 961.5 1,637.2 2,500.0 4,658.2 7,367.8

Finance Count Third Sector 2014, Volume 2.4 Central Function Costs © Agenda Consulting 27
15.2.1 Total cost of the HR function as percentage of total expenditure
Number of Responses
Lowest (10%)
Lower Quartile (25%)
Median (50%)
Upper Quartile (75%)
Highest (90%)
Whole Sample 53 0.5 1.0 1.3 2.5 3.3
Income
Under £5m 12 0.7 0.9 1.1 2.0 3.9
£5m-£10m 12 0.5 0.9 2.0 3.1 3.4
£10m-£25m 7 1.2 1.3 1.5 2.6 3.0
£25m-£50m 9 0.7 0.8 1.7 2.1 2.9
Over £50m 13 0.3 1.0 1.2 1.8 2.6
Sector
Children/Young People 14 1.0 1.2 1.8 2.9 3.4
Economic/Community development/Employment 6 1.0 1.0 1.2 1.7 2.2
Education/ Training 19 0.6 1.0 1.7 2.3 3.6
Grant making 8 0.2 0.4 0.7 1.5 3.1
Health care/Medical research 15 0.5 0.9 1.1 3.0 3.3
Housing 10 0.9 1.6 2.0 2.8 3.3
International development 9 0.6 1.1 1.1 1.9 2.5
People with disabilities 8 0.7 1.3 1.7 2.6 2.9
Social care 11 1.1 1.9 2.6 3.1 3.4
Other 7 0.9 1.2 1.9 2.8 3.2
15.2.2 HR employees (FTE) as percentage of total employees (FTE)
Number of Responses
Lowest (10%)
Lower Quartile (25%)
Median (50%)
Upper Quartile (75%)
Highest (90%)
Whole Sample 52 1.1 1.6 2.3 2.8 4.3
Income
Under £5m 12 1.1 1.2 1.9 3.2 6.5
£5m-£10m 11 1.1 1.4 2.3 3.0 4.3
£10m-£25m 7 1.4 1.9 2.7 3.2 3.5
£25m-£50m 9 1.8 1.9 2.1 2.6 2.7
Over £50m 13 1.7 1.9 2.4 2.7 4.0
Sector
Children/Young People 14 1.2 1.6 2.4 3.4 4.5
Economic/Community development/Employment 6 1.0 1.4 2.0 2.3 2.5
Education/ Training 18 1.3 1.5 2.4 3.3 5.6
Grant making 8 1.8 2.1 2.5 2.7 2.8
Health care/Medical research 13 1.1 2.3 2.7 3.0 3.4
Housing 10 1.3 1.4 1.8 2.2 3.1
International development 9 2.5 2.7 3.8 4.5 5.6
People with disabilities 8 1.3 1.8 2.0 2.6 2.7
Social care 10 1.4 1.8 2.1 3.1 4.8
Umbrella body/Trade association 5 1.1 1.1 2.4 2.5 5.0
Other 7 1.4 1.7 2.2 2.6 3.4

Finance Count Third Sector 2014, Volume 2.4 Central Function Costs © Agenda Consulting
28
15.2.3 Staffing cost per HR employee (FTE) (£)
Number of Responses
Lowest (10%)
Lower Quartile (25%)
Median (50%)
Upper Quartile (75%)
Highest (90%)
Whole Sample 51 25,333 31,000 37,392 44,775 49,444
Income
Under £5m 11 24,162 28,167 37,114 38,742 56,000
£5m-£10m 11 18,623 30,493 35,697 41,098 46,000
£10m-£25m 7 28,740 32,011 43,000 47,091 50,588
£25m-£50m 9 25,930 34,399 39,286 44,893 48,006
Over £50m 13 29,346 33,304 37,486 41,279 47,173
Sector
Children/Young People 14 26,399 29,501 32,700 36,760 44,237
Economic/Community development/Employment 6 31,096 33,256 39,784 42,281 43,932
Education/ Training 18 22,157 31,224 36,461 43,510 49,000
Grant making 8 37,295 38,812 44,790 48,174 52,611
Health care/Medical research 13 21,045 35,697 44,686 47,750 55,579
Housing 10 25,216 25,883 30,142 38,797 42,606
International development 9 26,080 28,884 33,304 45,798 47,005
People with disabilities 8 26,118 32,368 38,662 40,582 46,896
Social care 10 26,063 30,799 32,241 35,099 40,500
Other 7 30,429 32,593 43,000 50,887 72,033
15.2.4 Total cost of the HR function per organisation employee (FTE) (£)
Number of Responses
Lowest (10%)
Lower Quartile (25%)
Median (50%)
Upper Quartile (75%)
Highest (90%)
Whole Sample 53 488.4 746.6 1,298.9 2,040.6 3,244.5
Income
Under £5m 12 482.0 487.0 905.7 2,100.1 2,334.1
£5m-£10m 12 307.0 734.3 1,140.2 1,513.5 2,334.9
£10m-£25m 7 631.1 1,102.5 1,629.2 2,692.1 3,835.1
£25m-£50m 9 755.3 806.4 1,211.0 1,388.0 1,668.1
Over £50m 13 860.5 1,287.2 1,404.2 2,296.3 3,284.9
Sector
Children/Young People 14 483.1 722.8 1,306.8 2,376.5 3,702.0
Economic/Community development/Employment 6 502.1 675.8 1,226.6 1,378.7 1,516.7
Education/ Training 19 442.3 748.3 1,302.1 1,682.4 2,771.0
Grant making 8 1,070.8 1,220.2 1,343.5 1,672.4 2,801.6
Health care/Medical research 15 353.0 890.8 1,449.8 2,019.2 3,290.5
Housing 10 654.4 709.5 841.6 1,262.0 1,467.9
International development 9 1,466.3 1,623.7 2,278.8 3,181.9 3,266.3
People with disabilities 8 654.5 768.0 967.9 1,229.9 1,570.4
Social care 11 567.3 776.5 1,404.2 1,577.5 2,040.6
Other 7 939.4 1,329.7 1,629.2 2,424.3 3,596.6

Finance Count Third Sector 2014, Volume 2.4 Central Function Costs © Agenda Consulting 29
15.3.1 Total cost of the information systems/information technology function
as percentage of total expenditure
Number of Responses
Lowest (10%)
Lower Quartile (25%)
Median (50%)
Upper Quartile (75%)
Highest (90%)
Whole Sample 52 0.7 1.1 1.9 2.6 3.5
Income
Under £5m 11 1.1 1.5 1.9 2.5 2.6
£5m-£10m 12 0.8 1.0 1.6 2.1 4.6
£10m-£25m 7 0.8 1.0 2.1 2.7 2.9
£25m-£50m 9 1.2 1.5 2.0 3.2 3.4
Over £50m 13 0.3 1.0 2.0 2.6 3.8
Sector
Children/Young People 14 0.8 1.6 2.0 2.8 4.6
Economic/Community development/Employment 6 1.9 1.9 2.2 2.6 3.1
Education/ Training 18 1.4 1.9 2.3 3.0 4.2
Grant making 8 0.2 0.9 1.4 2.4 3.8
Health care/Medical research 15 1.2 1.8 2.1 3.1 4.5
Housing 9 0.7 0.9 1.1 1.8 2.4
International development 9 0.3 0.5 1.0 2.0 2.4
People with disabilities 8 1.0 1.2 1.4 2.7 3.5
Social care 10 0.6 0.9 1.2 2.5 2.9
Other 7 0.8 0.9 1.8 2.9 4.0
15.3.2 Information systems/information technology employees (FTE) as
percentage of total employees (FTE)
Number of Responses
Lowest (10%)
Lower Quartile (25%)
Median (50%)
Upper Quartile (75%)
Highest (90%)
Whole Sample 53 0.0 0.8 1.8 3.7 4.8
Income
Under £5m 12 0.0 0.4 1.0 2.2 4.0
£5m-£10m 12 0.0 0.4 0.9 2.0 4.2
£10m-£25m 7 0.8 1.2 2.1 2.3 2.4
£25m-£50m 9 0.8 1.4 2.2 3.8 5.5
Over £50m 13 1.2 1.9 3.7 4.6 5.3
Sector
Children/Young People 14 0.0 0.2 0.9 1.8 5.4
Economic/Community development/Employment 6 0.4 0.9 1.6 1.9 2.1
Education/ Training 19 0.0 0.9 1.7 2.9 4.4
Grant making 8 3.0 3.3 4.2 5.0 5.7
Health care/Medical research 14 0.8 1.3 2.5 4.5 5.2
Housing 10 0.0 0.0 0.4 0.9 1.9
International development 9 0.9 1.4 2.2 4.0 5.9
People with disabilities 8 0.4 0.5 1.5 3.8 4.9
Social care 10 0.0 0.1 0.7 1.0 1.8
Umbrella body/Trade association 5 0.2 0.6 1.0 2.8 3.7
Other 7 1.2 1.4 2.2 3.6 4.7

Finance Count Third Sector 2014, Volume 2.4 Central Function Costs © Agenda Consulting
30
15.3.3 Staffing cost per information systems/information technology
employees (FTE) (£)
Number of Responses
Lowest (10%)
Lower Quartile (25%)
Median (50%)
Upper Quartile (75%)
Highest (90%)
Whole Sample 46 22,818 29,673 36,832 43,264 53,854
Income
Under £5m 8 19,690 22,600 34,298 41,817 48,087
£5m-£10m 9 15,852 30,500 38,763 40,000 44,020
£10m-£25m 7 24,628 27,763 32,266 49,583 66,138
£25m-£50m 9 26,661 30,807 40,110 42,857 46,416
Over £50m 13 29,320 31,274 35,401 43,662 56,072
Sector
Children/Young People 10 20,030 25,175 32,215 40,523 44,673
Economic/Community development/Employment 5 28,200 35,401 38,904 39,776 52,811
Education/ Training 16 18,610 25,760 39,340 44,175 48,634
Grant making 8 29,760 32,588 41,429 44,563 49,924
Health care/Medical research 14 19,877 31,420 39,313 48,350 56,046
Housing 6 22,595 27,434 30,083 34,175 39,531
International development 8 19,303 22,836 30,105 37,085 58,222
People with disabilities 8 28,774 29,686 37,999 40,278 41,634
Social care 7 26,358 27,813 32,266 37,082 39,258
Other 7 22,825 24,357 38,053 45,779 52,500
15.3.4 Total cost of the information systems/information technology function
per organisation employee (FTE) (£)
Number of Responses
Lowest (10%)
Lower Quartile (25%)
Median (50%)
Upper Quartile (75%)
Highest (90%)
Whole Sample 52 433.7 872.6 1,576.9 2,771.6 4,177.9
Income
Under £5m 11 569.3 662.9 1,205.7 2,304.9 3,064.3
£5m-£10m 12 338.4 488.5 838.5 1,696.6 4,452.1
£10m-£25m 7 397.7 783.3 1,584.4 3,237.8 4,223.4
£25m-£50m 9 1,055.1 1,324.5 1,859.7 2,697.9 3,377.3
Over £50m 13 1,285.7 1,464.8 1,868.0 3,934.8 5,455.7
Sector
Children/Young People 14 423.2 588.6 1,177.4 2,817.7 5,456.8
Economic/Community development/Employment 6 858.5 1,245.3 1,900.7 2,041.8 2,780.5
Education/ Training 18 743.0 1,058.5 1,798.6 2,889.6 4,341.4
Grant making 8 1,632.4 1,955.3 2,484.0 3,396.2 4,307.6
Health care/Medical research 15 669.3 1,029.6 2,365.3 3,915.0 4,501.9
Housing 9 246.8 329.3 471.9 1,800.0 1,910.0
International development 9 839.2 1,094.7 1,464.8 2,697.9 5,486.0
People with disabilities 8 405.4 549.3 1,471.6 2,016.5 2,812.5
Social care 10 248.5 320.0 572.2 1,407.7 1,612.7
Other 7 771.4 1,209.6 1,569.4 3,071.8 4,451.0

Finance Count Third Sector 2014, Volume 2.4 Central Function Costs © Agenda Consulting 31
15.4.1 Total cost of the estate management function as percentage of total
expenditure
Number of Responses
Lowest (10%)
Lower Quartile (25%)
Median (50%)
Upper Quartile (75%)
Highest (90%)
Whole Sample 47 0.1 0.6 1.7 4.0 5.9
Income
Under £5m 11 0.3 0.9 3.5 4.6 4.9
£5m-£10m 10 0.1 0.6 2.0 5.7 7.0
£10m-£25m 6 0.7 1.8 3.7 3.9 4.0
£25m-£50m 8 1.3 1.4 1.7 3.5 5.9
Over £50m 12 0.1 0.1 0.5 2.2 3.5
Sector
Children/Young People 13 0.7 0.8 1.4 4.3 4.6
Economic/Community development/Employment 6 0.5 1.2 3.2 4.3 7.6
Education/ Training 16 0.6 1.1 2.1 4.6 6.6
Grant making 6 0.0 0.1 1.1 2.6 3.7
Health care/Medical research 13 0.3 1.2 2.9 4.0 4.8
Housing 9 0.2 0.7 1.5 3.0 5.6
International development 8 0.2 0.5 0.8 3.7 4.4
People with disabilities 7 0.1 0.2 0.2 0.8 1.4
Social care 10 0.1 0.5 1.1 2.4 4.1
Other 6 1.0 1.4 2.7 3.9 5.3
15.4.2 Estate management employees (FTE) as percentage of total employees
(FTE)
Number of Responses
Lowest (10%)
Lower Quartile (25%)
Median (50%)
Upper Quartile (75%)
Highest (90%)
Whole Sample 48 0.1 0.4 1.2 2.8 4.7
Income
Under £5m 11 0.0 0.0 1.1 3.3 5.0
£5m-£10m 10 0.1 0.6 1.6 3.2 4.2
£10m-£25m 6 0.5 0.9 1.8 2.2 2.5
£25m-£50m 9 0.3 0.8 2.2 4.7 9.0
Over £50m 12 0.2 0.4 0.8 2.2 2.3
Sector
Children/Young People 13 0.1 0.3 1.1 3.3 4.8
Economic/Community development/Employment 6 0.8 1.1 1.7 2.2 3.6
Education/ Training 16 0.3 0.7 1.8 4.2 5.5
Grant making 7 0.0 0.3 2.3 3.8 4.7
Health care/Medical research 12 0.2 0.6 1.3 2.9 4.6
Housing 9 0.3 0.5 1.0 2.0 3.4
International development 8 0.3 0.4 2.0 2.1 2.3
People with disabilities 8 0.0 0.1 0.2 0.5 2.1
Social care 9 0.0 0.1 0.5 1.0 1.0
Other 6 1.2 2.1 2.2 3.7 4.3

Finance Count Third Sector 2014, Volume 2.4 Central Function Costs © Agenda Consulting
32
15.4.3 Staffing cost per estate management employee (FTE) (£)
Number of Responses
Lowest (10%)
Lower Quartile (25%)
Median (50%)
Upper Quartile (75%)
Highest (90%)
Whole Sample 43 23,889 26,978 33,501 40,561 44,770
Income
Under £5m 8 18,509 22,644 32,873 39,771 58,000
£5m-£10m 9 24,245 26,483 29,000 36,219 38,690
£10m-£25m 6 26,532 27,674 34,720 41,941 44,054
£25m-£50m 9 25,454 29,978 34,151 35,292 40,109
Over £50m 11 26,565 28,883 40,577 44,302 44,812
Sector
Children/Young People 12 19,737 23,674 32,117 36,505 42,534
Economic/Community development/Employment 6 23,018 30,726 35,417 39,487 42,789
Education/ Training 16 24,097 28,371 34,449 40,791 44,302
Grant making 5 27,769 28,336 35,292 40,000 42,400
Health care/Medical research 11 26,483 28,082 31,000 43,554 44,604
Housing 8 24,347 28,698 31,739 35,826 36,562
International development 7 25,939 29,833 38,439 40,989 42,785
People with disabilities 6 28,239 31,054 37,142 44,636 59,091
Social care 7 27,037 29,704 33,501 38,564 42,103
Other 6 24,722 25,391 29,471 41,094 44,500
15.4.4 Total cost of the estate management function per organisation employee
(FTE) (£)
Number of Responses
Lowest (10%)
Lower Quartile (25%)
Median (50%)
Upper Quartile (75%)
Highest (90%)
Whole Sample 47 132.2 330.9 1,604.3 3,933.2 5,700.2
Income
Under £5m 11 205.8 345.4 1,716.5 3,191.7 5,282.1
£5m-£10m 10 32.9 340.2 1,551.6 2,143.2 3,730.5
£10m-£25m 6 376.7 1,740.3 5,144.2 5,577.7 6,057.1
£25m-£50m 8 482.1 603.1 1,817.7 5,146.5 6,263.3
Over £50m 12 113.0 225.1 1,102.0 2,507.6 3,967.2
Sector
Children/Young People 13 291.6 651.2 1,344.3 2,070.1 4,976.9
Economic/Community development/Employment 6 519.5 964.6 1,966.7 3,538.1 4,582.7
Education/ Training 16 219.1 593.4 2,284.8 3,847.9 5,523.0
Grant making 6 110.6 358.2 1,852.5 4,446.5 5,100.1
Health care/Medical research 13 191.6 651.2 2,935.6 4,950.1 5,591.4
Housing 9 81.8 420.3 807.9 1,344.3 1,581.2
International development 8 231.2 1,263.6 2,067.5 5,365.1 6,754.8
People with disabilities 7 61.3 102.4 152.0 320.7 506.1
Social care 10 32.9 260.3 560.5 1,646.0 2,079.8
Other 6 1,056.4 1,720.9 3,539.2 5,212.6 5,522.4

Finance Count Third Sector 2014, Volume 2.4 Central Function Costs © Agenda Consulting 33
15.5.1 Total cost of the CEO's office as percentage of total expenditure
Number of Responses
Lowest (10%)
Lower Quartile (25%)
Median (50%)
Upper Quartile (75%)
Highest (90%)
Whole Sample 53 0.4 1.0 1.8 2.9 5.3
Income
Under £5m 14 2.5 2.7 3.5 5.8 9.0
£5m-£10m 11 1.5 2.1 2.7 3.8 5.0
£10m-£25m 7 1.1 1.2 1.7 1.8 2.2
£25m-£50m 8 0.8 0.9 1.3 1.7 2.1
Over £50m 13 0.3 0.3 0.4 0.7 1.2
Sector
Children/Young People 16 1.1 1.8 2.8 4.1 6.9
Economic/Community development/Employment 6 0.6 1.2 2.7 3.2 4.4
Education/ Training 19 0.7 1.5 2.7 4.9 7.9
Grant making 8 0.3 0.8 2.1 3.7 5.6
Health care/Medical research 15 1.1 1.4 1.9 4.4 7.9
Housing 10 0.7 1.6 2.2 2.6 3.0
International development 8 0.4 0.4 0.8 1.7 2.0
People with disabilities 7 0.6 1.3 2.0 2.9 5.9
Social care 11 0.7 1.4 2.0 3.1 4.4
Other 7 0.6 0.9 1.2 3.5 5.6
15.5.2 CEO's office employees (FTE) as percentage of total employees (FTE)
Number of Responses
Lowest (10%)
Lower Quartile (25%)
Median (50%)
Upper Quartile (75%)
Highest (90%)
Whole Sample 54 0.4 0.8 1.6 3.3 4.5
Income
Under £5m 14 1.9 2.2 3.4 6.3 9.2
£5m-£10m 11 0.7 1.4 1.5 3.3 4.4
£10m-£25m 7 1.0 1.3 1.4 2.5 3.0
£25m-£50m 9 0.2 0.5 0.7 1.1 2.5
Over £50m 13 0.2 0.4 0.8 1.7 2.0
Sector
Children/Young People 16 0.8 1.3 2.1 4.3 6.6
Economic/Community development/Employment 6 0.3 0.8 2.7 3.4 3.9
Education/ Training 19 0.4 0.8 2.2 4.3 8.8
Grant making 9 0.9 1.1 2.2 4.2 4.8
Health care/Medical research 14 0.7 1.2 1.8 3.8 8.7
Housing 10 0.6 0.8 1.4 2.0 3.0
International development 8 0.7 0.9 1.6 3.0 4.0
People with disabilities 8 0.2 0.5 1.1 1.9 3.5
Social care 10 0.4 0.6 1.4 1.8 3.0
Umbrella body/Trade association 5 1.9 3.4 4.2 8.7 9.1
Other 7 0.5 0.7 1.4 3.9 4.8

Finance Count Third Sector 2014, Volume 2.4 Central Function Costs © Agenda Consulting
34
15.5.3 Staffing cost per CEO's office employee (FTE) (£)
Number of Responses
Lowest (10%)
Lower Quartile (25%)
Median (50%)
Upper Quartile (75%)
Highest (90%)
Whole Sample 53 44,537 56,473 71,167 86,667 103,000
Income
Under £5m 13 56,706 63,853 83,872 88,500 95,061
£5m-£10m 11 44,380 57,667 63,450 79,669 97,820
£10m-£25m 7 39,522 53,224 55,421 79,319 95,565
£25m-£50m 9 43,411 69,327 71,199 124,879 125,913
Over £50m 13 45,804 59,696 68,698 85,100 91,792
Sector
Children/Young People 16 55,662 58,492 65,525 80,189 88,336
Economic/Community development/Employment 6 50,626 57,931 67,308 81,147 85,570
Education/ Training 19 54,026 61,509 71,199 84,737 98,456
Grant making 9 62,975 85,259 88,500 103,500 110,696
Health care/Medical research 14 55,606 62,139 77,419 85,075 87,528
Housing 10 34,089 42,480 53,484 63,752 80,695
International development 8 45,899 53,055 61,381 72,184 89,203
People with disabilities 8 36,697 44,036 79,500 93,659 104,438
Social care 10 42,933 44,576 48,490 56,163 65,543
Other 7 49,111 68,940 97,820 104,956 117,173
15.5.4 Total cost of the CEO's office per organisation employee (FTE) (£)
Number of Responses
Lowest (10%)
Lower Quartile (25%)
Median (50%)
Upper Quartile (75%)
Highest (90%)
Whole Sample 53 367.5 680.6 1,491.9 3,013.0 5,026.4
Income
Under £5m 14 1,008.9 1,878.4 2,659.2 6,919.7 10,287.9
£5m-£10m 11 540.5 774.2 1,493.9 2,677.0 5,099.0
£10m-£25m 7 662.1 871.2 1,491.9 2,454.4 3,405.8
£25m-£50m 8 331.8 512.3 910.5 1,850.5 2,637.8
Over £50m 13 309.7 318.8 862.5 1,332.2 2,066.7
Sector
Children/Young People 16 610.6 857.2 2,052.7 3,209.9 7,523.4
Economic/Community development/Employment 6 357.2 761.3 1,898.4 2,744.3 3,472.8
Education/ Training 19 352.2 802.4 1,938.3 4,917.6 9,846.4
Grant making 8 1,364.7 2,054.9 2,695.4 4,554.5 5,609.6
Health care/Medical research 15 672.9 1,155.2 1,854.1 3,417.4 8,860.9
Housing 10 526.0 564.7 826.0 1,879.1 2,337.3
International development 8 696.1 1,070.0 1,378.9 3,127.3 3,443.0
People with disabilities 7 343.3 461.7 810.6 1,768.2 4,284.5
Social care 11 395.6 501.1 931.8 1,830.5 2,262.2
Other 7 369.5 789.2 1,491.9 4,515.8 5,753.8

Finance Count Third Sector 2014, Volume 2.4 Central Function Costs © Agenda Consulting 35
ANNEX A: DEFINITIONS OF MEASURES Table Indicator Definition (numbers in brackets refer to the
questions in the questionnaire)
GENERAL INFORMATION
1.2 Income of organisation in last financial year Income (A4) in millions
1.3.1 - 1.3.7
Percentage of income from various sources Sources of income (A5A - G) divided by income (A4)
1.15 Expenditure of organisation in last financial year
Expenditure (A6)
1.16 Number of employees (FTE) Number of employees (FTE) (A7)
1.17 Number of employees (headcount) Number of employees (headcount)(A8)
1.20 Total net assets Total net assets (A10)
1.21 Income per employee (FTE) Income (A4) divided by number of employees (FTE) (A7)
1.22 Expenditure per employee (FTE) Expenditure (A6) divided by number of employees (FTE) (A7)
1.23 Asset value per employee (FTE) Total net assets (A10) divided by number of employees (FTE) (A7)
1.24 Surplus/deficit as a percentage of income Income minus expenditure(A4-A6) divided by income (A4)
1.25 Average salary per employee (FTE) The cost of staff salaries (D2) divided by number of employees (FTE) (A7)
1.26 Cost of staff salaries as a percentage of expenditure
The cost of staff salaries (D2) divided by expenditure (A6)
CENTRAL FUNCTION COSTS
15.1.1 Total cost of the finance function as percentage of total expenditure
Total costs of the finance function (Q2C) divided by expenditure (A6)
15.1.2 Finance employees (FTE) as percentage of total employees (FTE)
Number of employees in the finance function (FTE) (M1) divided by the number of employees (FTE)(A7)
15.1.3 Staffing cost per finance employee (FTE) Staff costs in the finance function (Q2A) divided by the number of employees in the finance function (FTE) (M1)
15.1.4 Total cost of the finance function per organisation employee (FTE)
Total costs of the finance function (Q2C) divided by number of employees (FTE) (A7)
15.2.1 Total cost of the HR function as percentage of total expenditure
Total cost of the HR function (Q4C) divided by expenditure (A6)
15.2.2 HR employees (FTE) as percentage of total employees (FTE)
Number of employees in the HR function (FTE) (Q3) divided by number of employees (FTE) (A7)
15.2.3 Staffing cost per HR employee (FTE) Staff costs of the HR function (Q4A) divided by the number
of employees in the HR function (FTE) (Q3)
15.2.4 Total cost of the HR function per organisation employee (FTE)
Total cost of the HR function (Q4C) divided by number of employees (FTE) (A7)
15.3.1 Total cost of the information systems/information technology function as percentage of total expenditure
Total costs of the IS/IT department (Q6C) divided by expenditure (A6)
15.3.2 Information systems/information technology employees (FTE) as percentage of total employees (FTE)
Number of IS/IT employees (FTE)(Q5) divided by the number of employees (FTE)(A7)
15.3.3 Staffing cost per information systems/information technology employees (FTE)
Staff cost of the IS/IT department (Q6A) divided by the number of IS/IT employees (FTE)(Q5)
15.3.4 Total cost of the information systems/information technology function per organisation employee (FTE)
Total costs of the IS/IT department (Q6C) divided by number of employees (FTE) (A7)
15.4.1 Total cost of the estate management function as percentage of total expenditure
Total cost of the estate management function (Q8C) divided by expenditure (A6)

Finance Count Third Sector 2014, Volume 2.4 Central Function Costs © Agenda Consulting
36
Table Indicator Definition (numbers in brackets refer to the questions in the questionnaire)
15.4.2 Estate management employees (FTE) as percentage of total employees (FTE)
Number of employees in the estate management function (FTE)(Q7) divided by the number of employees (FTE)(A7)
15.4.3 Staffing cost per estate management employee (FTE)
Staff cost of the estate management function (Q8A) divided by the number of employees in the estate management function (FTE)(Q7)
15.4.4 Total cost of the estate management function per organisation employee (FTE)
Total cost of the estate management function (Q8C) divided by number of employees (FTE) (A7)
15.5.1 Total cost of the CEO's office as percentage of total expenditure
Total cost of the CEO's office (Q10C) divided by expenditure (A6)
15.5.2 CEO's office employees (FTE) as percentage of total employees (FTE)
Number of employees in the CEO's office (FTE) (Q9) divided by the number of employees (FTE) (A7)
15.5.3 Staffing cost per CEO's office employee (FTE)
Staff cost of the CEO's office (Q10A) divided by number of employees in the CEO's office (FTE)(Q9)
15.5.4 Total cost of the CEO's office per organisation employee (FTE)
Total cost of the CEO's office (Q10C) divided by the number of employees (FTE) (A7)
15.99 Good practice in Central Function Costs Good practice in Central Function Costs. Do you have any particular examples of good practice from which other participants might learn? Please summarise briefly. (Q99)
Finance Count Third Sector 2014, Volume 2.4 Central Function Costs © Agenda Consulting 37
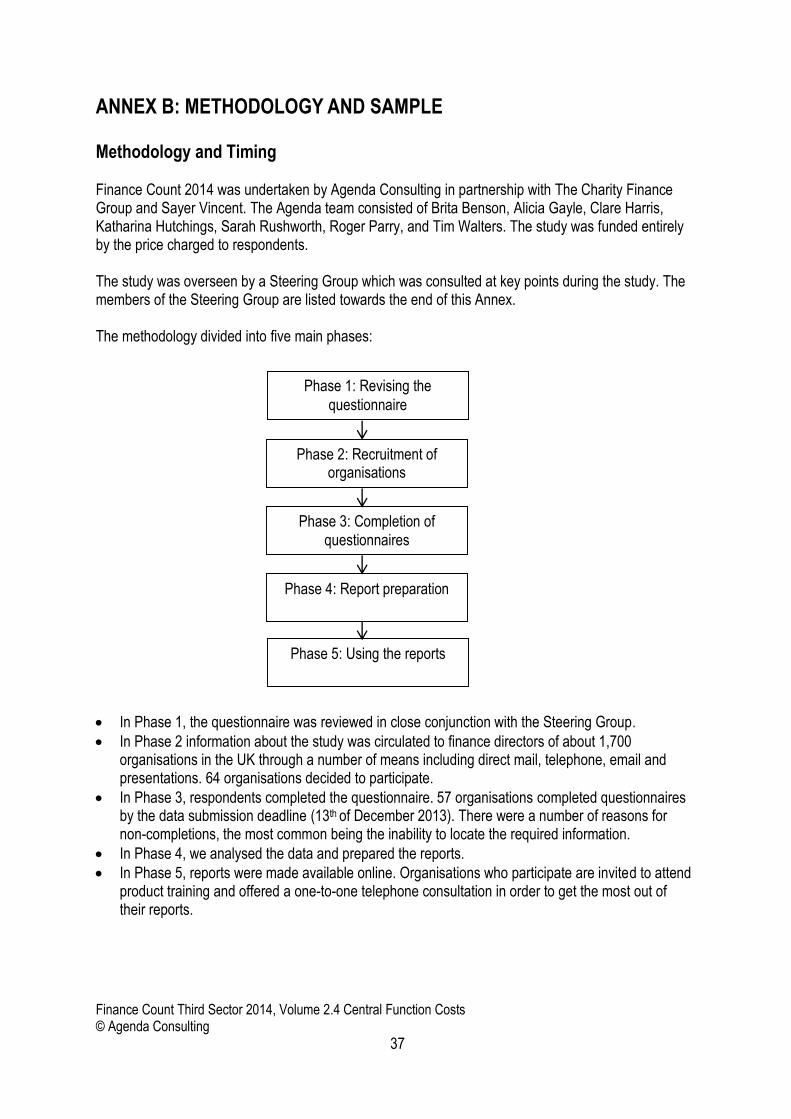
ANNEX B: METHODOLOGY AND SAMPLE
Methodology and Timing Finance Count 2014 was undertaken by Agenda Consulting in partnership with The Charity Finance Group and Sayer Vincent. The Agenda team consisted of Brita Benson, Alicia Gayle, Clare Harris, Katharina Hutchings, Sarah Rushworth, Roger Parry, and Tim Walters. The study was funded entirely by the price charged to respondents. The study was overseen by a Steering Group which was consulted at key points during the study. The members of the Steering Group are listed towards the end of this Annex. The methodology divided into five main phases:
In Phase 1, the questionnaire was reviewed in close conjunction with the Steering Group.
In Phase 2 information about the study was circulated to finance directors of about 1,700 organisations in the UK through a number of means including direct mail, telephone, email and presentations. 64 organisations decided to participate.
In Phase 3, respondents completed the questionnaire. 57 organisations completed questionnaires by the data submission deadline (13th of December 2013). There were a number of reasons for non-completions, the most common being the inability to locate the required information.
In Phase 4, we analysed the data and prepared the reports.
In Phase 5, reports were made available online. Organisations who participate are invited to attend product training and offered a one-to-one telephone consultation in order to get the most out of their reports.
Phase 2: Recruitment of organisations
Phase 3: Completion of questionnaires
Phase 4: Report preparation
Phase 1: Revising the
questionnaire
Phase 5: Using the reports

Finance Count Third Sector 2014, Volume 2.4 Central Function Costs © Agenda Consulting
38
Overview of the sample We do not contend that the sample of respondent organisations is representative of the sector as a whole, but it is a good sample about which a considerable amount of detailed information has been gathered, and we hope that it will contribute to financial management policy development in the Third Sector. 57 organisations participated in the study, and are listed towards the end of this report. Participants were self-selecting in that they chose to participate in the study. In aggregate:
Participants employed 74,342 staff (10,683 FTE staff).
The number of employees ranged from 7 to 4,000 FTE.
The median figure for headcount was 178 (148 FTE staff).
The median income was £13.5m.
Participants had combined total net assets of nearly £7 billion. Participants by size We defined size in terms of the income of the organisation. The median income for respondents in the study this year is £13.5 million. This is significantly lower than the median income of those participating in Finance Count 2012: £30m. The average organisation size is significantly smaller than the sample in the 2013 study. A number of Finance Count measures are influenced by economies of scale and therefore caution is required when considering 2014 results in relation to 2013 results; differences may not necessarily be reflective of a change in the Third Sector as a whole, but rather a change in the make up of the sample.
The median income per employee FTE is £94456 (Volume 2 Table 1.21).
The median expenditure per employee FTE is £82,683 (Volume 2 Table 1.22).
The median asset value per employee FTE is £54,890 (Volume 2 Table 1.23). The graph below illustrates the distribution of participants by size.
Source: Table 1.19, Base = 57
26%
21%
12%
16%
25%
Percentage of respondents by income band
Under £5m
£5m-£10m
£10m-£25m
£25m-£50m
Over £50m

Finance Count Third Sector 2014, Volume 2.4 Central Function Costs © Agenda Consulting 39
Participants by subsector We asked each participants to choose up to three subsectors which best describe their activities, from a list of 20. The numbers in the graph below therefore add up to more than the 57 participants because many organisation chose more than one category. The graph below shows the number of participants in each subsector.
Source: Table 1.18, Base = 57
0
2
2
2
2
4
5
5
7
9
11
12
14
16
16
18
19
27
28
30
0 5 10 15 20 25 30 35
People of a particular ethnic or racial origin
Animal Welfare
Arts/ Culture
Elderly/ Old people
Religious/ Missionary
Civil rights/ Citizenship/ Law and Order
Mental Health
Sport/ Recreation
Environment/ Conservation
Umbrella body/ Trade association
Economic/ Community development/ Employment
Other
People with disabilities
Grant making
International development
Housing
Social care
Education/ Training
Children/ Young People
Health care/ Medical research
Number of respondents in each subsector

Finance Count Third Sector 2014, Volume 2.4 Central Function Costs © Agenda Consulting
40
Acknowledgements
We are very grateful to the following for their support with the study:
Caron Bradshaw, CEO, Lindsay Derry, Head of Marketing and Communications and Katherine Smithson, Policy and Public Affairs Officer, at CFG;
Kate Sayer, Partner, at Sayer Vincent;
John Adams OBE, General Secretary at VODG;
Members of the Steering Group – their names are listed in Annex B;
Participating organisations.
Further details about our partners can be found later on in this report.

Finance Count Third Sector 2014, Volume 2.4 Central Function Costs © Agenda Consulting 41
Participating Organisations 57 organisations participated in the Finance Count 2014 Study. All whole sample figures are based only on these participants. Arthritis Research UK Prostate Cancer UK
Arts Council of England Railway Children
Ashgate Hospice Limited RNIB
Asthma UK Roffey Park
AVOW Royal College of Ophthalmologists
Breakthrough Breast Cancer Shaw Trust
British Red Cross Society Shelter
Certitude Spinal Research
CHICKS St Clare West Essex Hospice Care Trust
Children’s Link The Anthony Nolan Trust
Children’s Liver Disease Foundation The Aryshire Hospice Trust
Church Commissioners for England The Chartered Quality Institute
CLIC Sargent The Physiological Society
Compass UK The Blue Cross
Gingerbread The Connection at St Martin’s in the Fields
Great Ormond Street Hospital Children’s Charity The Institute of Cancer Research
International Alert The Tropical Health and Education Trust
International Institute for Environment and Development
The Woodland Trust The Young Foundation
Islamic Relief Worldwide Transparency International Secretariat e.V
Marie Curie Cancer Care Victim Support
MCCH Society War Child
Mental Health Matters WaterAid
Motability Watford and District YMCA
Muscular Dystrophy Campaign North Staffs YMCA
World Association of Girl Guides and Girl Scouts
Northern Ireland Association for Mental Health World Vision UK
Norwood Children and Families First WWF UK
Overseas Development Institute YMCA – London South West
Porchlight

Finance Count Third Sector 2014, Volume 2.4 Central Function Costs © Agenda Consulting
42
Steering Group Members
Organisation Name Job Title
Arthritis Research UK Karen Everett Director of Finance and Corporate Resources
Blue Cross Simon Hawkins Head of Finance
Brooke (The) Himali Fernando Accountant
Charity Finance Group Caron Bradshaw Chief Executive
Charity Finance Group David Membrey Deputy CEO
Charity Finance Group Katherine Smithson Policy Officer
Islamic Relief Javed Akhtar Finance Director
Marie Curie Cancer Care Andrew Whitehead Director of Finance
Muscular Dystrophy Campaign Judith Spencer-Gregson Head of Finance
Sayer Vincent Kate Sayer Partner
Turning Point Nick Swarbrick Chief Financial Officer
Wellcome Trust Sanger Institute Stephen Masson Head of Finance

Finance Count Third Sector 2014, Volume 2.4 Central Function Costs © Agenda Consulting 43
Sayer Vincent Sayer Vincent are leading auditors and advisors working solely for charities, not-for-profit organisations and social enterprises. Measured by audited charity income, we are a top ten UK accountancy practice and widely regarded as charity sector experts. Our work focuses on making charities more effective through improved infrastructure, reporting and governance. We help charities with mergers, systems implementations, tax issues and training. Charities appoint us as consultants, internal auditors or external auditors. We believe in a strong and effective voluntary sector. Since 1983 Sayer Vincent has been at the forefront of initiatives to improve charity effectiveness. We introduced Financial Leadership Awards in 2013 as well as establishing a training course Inspiring Financial Leadership jointly with CFG and Cass Business School. Contact: Kate Sayer, Partner, [email protected] Sayer Vincent 8 Angel Gate City Road LONDON EC1V 2SJ Phone: 020 7841 6360 Web: www.sayervincent.co.uk

Finance Count Third Sector 2014, Volume 2.4 Central Function Costs © Agenda Consulting
44
Charity Finance Group The Charity Finance Group (CFG) is the charity that champions best practice in finance management in the voluntary sector. Our training and development programmes enable finance managers to give the essential leadership on finance strategy and management that their charities need. Our growing membership of more than 2,000 members, representing 1,300 charities, means we are uniquely placed to challenge regulation, which threatens the effective use of charity funds. We are committed to supporting all those who work in charity finance. Our conferences and training are open to all, and our policy consultations, the results of sector surveys and our publications are widely available. CFG is represented on many committees and working parties established by professional bodies, government departments, regulators and not-for-profit committees. This enables us to give voice to the views of charity finance managers on issues that affect the effective management of charity funds, such as tax, investment, impact and regulation. Contact: Katherine Smithson, Policy Officer at [email protected] CFG Can Mezzanine 49-51 East Road London N1 6AH Phone: 0845 345 3192 Fax: 0845 345 3193 Email: [email protected] Web: www.cfg.org.uk

Finance Count Third Sector 2014, Volume 2.4 Central Function Costs © Agenda Consulting 45
Voluntary Organisations Disability Group (VODG) 6 Market Road London N7 9PW Contact: John Adams OBE, General Secretary Tel: 07917 670 509 Email: [email protected] Website: www.vodg.org.uk About the VODG
The VODG is the leading representative grouping of voluntary sector providers of social care services for adults with disabilities. Our members’ shared aim is to ensure that people with disabilities are supported in ways that they themselves define, our vision is: ‘Full choice and control for everyone with a disability.’ The VODG seeks to combine and harness the separate skills, experiences and knowledge of individual member organisations to challenge barriers, facilitate best practice and work with others in the exchange of learning. Our role is to shape the development of social care policy, to influence its implementation and to provide sector leading information and research. VODG members deliver more than £2 billion of services each year and believe that constructive engagement and fair negotiation between commissioners and providers, focused on the needs of people who rely on social care support, helps to build effective strategic alliances, enhances service design and is more likely to deliver positive outcomes. The VODG is a pan-disability organisation with excellent contacts in government and across all of the relevant social care agencies. We estimate that VODG members collectively support around a million disabled people and employ more than 75,000 staff. Members range from the largest disability organisations, including Mencap; Leonard Cheshire Disability; Scope; Dimensions; Sense and the National Autistic Society, through to smaller innovative organisations like VoiceAbility; KeyRing and Certitude. We believe that provider organisations have a unique role to play in supporting disabled people to live more fulfilling lives. VODG: Shaping lives, supporting excellence

Finance Count Third Sector 2014, Volume 2.4 Central Function Costs © Agenda Consulting
46
Agenda Consulting Successful organisations in the future will be those that maximise the capability and engagement of their people and make their organisations a great place to work. We are a people research agency that helps not for profit organisations drive forward this agenda. We undertake research to enable organisations to listen to and understand their people better:
Employee Surveys
Volunteer Surveys We provide consultancy expertise to develop people strategies and processes:
Reward
HR Strategy and Effectiveness
HR Consultancy
Organisational Change
Bespoke Benchmarking We run sector-wide benchmarking studies to provide hard evidence that supports decision making:
Third Sector HR Benchmarking – People Count Third Sector
Third Sector Finance Benchmarking – Finance Count
Volunteer Management Benchmarking – Volunteers Count
Law HR Benchmarking – People Count Law
Insurance People Benchmarking Our conferences aim to share good practice and provide inspiration for those leading change:
Third Sector Strategic People Conference
Third Sector Reward Conference
Third Sector Employee Engagement and Communications Conference To find out more about how we can help your organisation to achieve success through its people, please contact us: Agenda Consulting The Jam Factory 27 Park End Street Oxford OX1 1HU www.agendaconsulting.co.uk T: 01865 263720 F: 01865 791325


www.agendaconsulting.co.uk
Agenda ConsultingSuccessful organisations are those that maximise the capability and engagement of their people and make their organisations a great place to work.We are a people research consultancy that helps not for profit organisations drive forward this agenda.
We undertake research to enable organisations to listen to and understand their people better:• Employee Surveys
• Volunteer Surveys
We provide consultancy expertise to develop people strategies and processes:• Reward
• HR Strategy and Effectiveness
• HR Consultancy
• Organisational Change
• Bespoke Benchmarking.
We run sector-wide benchmarking studies to provide hard evidence that supports decision making:• Third Sector HR Benchmarking –
People Count Third Sector
• Third Sector Finance Benchmarking – Finance Count
• Volunteer Management Benchmarking –Volunteers Count
• Law HR Benchmarking – People Count Law
• Insurance People Benchmarking.
Our conferences aim to share good practice and provide inspiration for those leading change:• Third Sector Strategic People Conference
• Third Sector Reward Conference
• Third Sector Employee Engagement and Communications Conference.
To find out more about how we can help your organisation to achieve success through its people, please contact us:
Agenda ConsultingThe Jam Factory27 Park End StreetOxford OX1 1HU
T: 01865 263 720F: 01865 791 325