financial aid report 2014-15 - higher education · 2016-02-10 · state funded financial aid...
TRANSCRIPT
1
FINANCIAL AID REPORT 2014-15
DECEMBER 3, 2015
_________________________________________________________________
1560 Broadway, Suite 1600Denver, Colorado 80202(303) 862-3001
JOSEPH A. GARCIA, LIEUTENANT GOVERNOR

2
HIGHLIGHTS
Nearly 48% of all students who received financial assistance in FY 2015 (July 1, 2014-
June 30, 2015) received a Pell grant.
In FY2015, federal grant aid accounted for 32% of all grant aid in Colorado. Pell grants
alone accounted for 15.1% of total aid.
o In FY2015, the maximum Pell grant was $5,730.
o 15% of Colorado’s Pell grant recipients received the maximum award.
o The average Pell grant award was $3,369, up $50 from the prior year.
o The amount of Pell grants reported in the Department’s State Unit Record Data
Base (SURDS) has increased by 6% since FY2010. This increase can be
attributed to both changes enacted in the Federal program and the lingering
impact of the Great Recession on families throughout the state.
State funded financial aid comprised nearly 13% of all grant aid and more than 5% of all
aid, including federal loans.
o Total funding for state grant programs remained relatively constant during the
Great Recession, but as economic conditions and state funding improved, there
was a significant increase in FY 2014-15. The number of recipients of state
grants need-based grants increased by 8% in 2015, with the average award of
$1,632, $479 more than the average award in 2010.
Institutional grant aid comprises approximately 46% of all grant aid, or about 25% of all
financial aid, including loans.
o Institutional aid increased by 46% between FY2010 and FY2015.
o Institutional investment in student aid is the greatest at four year institutions, both
public and non-profit private.
The average cumulative loan debt at graduation from public four year institutions ranged
from $21,022 to $33,596. The average student loan debt for baccalaureate graduates was
$26,458 in 2014-2015.
o The average overall student loan debt for baccalaureate graduates from public
institutions in Colorado was $21,110 in 2014-15.
Table 1: Sources of Aid in Fiscal Year 2015
Type of Aid
Institutional 547,899,586
Federal 377,187,417
State 154,527,140
Loans 1,039,669,176
Other 89,523,266
Total 2,208,806,585
3
BACKGROUND
Student financial aid is an important resource that makes higher education accessible for students
with demonstrated financial need, typically those from low and middle-income households.
Importantly, for most students and families, the total costs associated with attending college go
well beyond tuition and fees. Housing, books and supplies, food, and transportation generally
add up to more than the cost of tuition and fees and must be factored in when determining the
funds needed to attend college.
The amount of aid a student receives is determined by: (1) aggregating all resources reasonably
available to cover college costs, (2) subtracting those resources from the total cost of attendance
at an institution, and then (3) attempting to put together a “package” of resources from multiple
sources to meet a particular student’s “need.”
Financial aid administrators package financial aid using a combination of federal, state,
institutional and private resources. The net price a student pays may be less at a school with
higher tuition rates depending on the student need and aid resources available. Students in low-
income and some middle-income families often qualify for federal Pell grants, which are often
the first funds included in many financial aid packages.
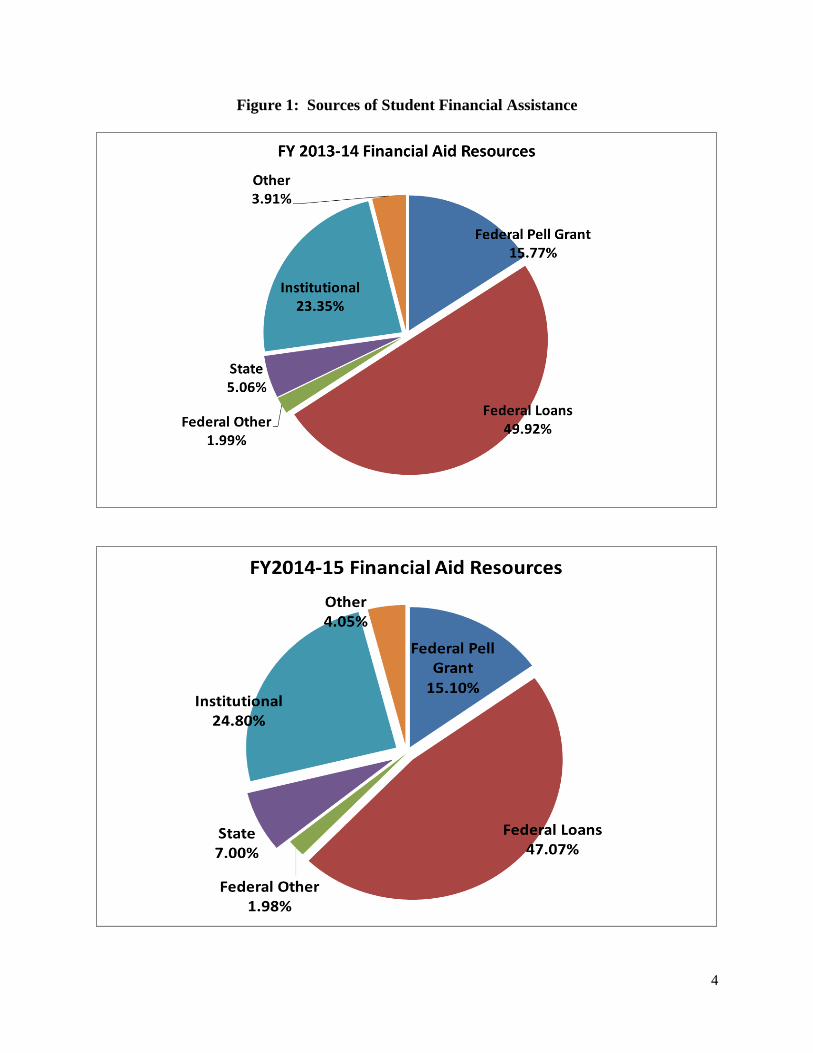
Federal student aid, anchored by the federal Pell grant program and various loan programs, is the
single largest source of aid for most students. In FY2015, federal grant aid accounted for 32%
of all grant aid in Colorado; Pell grants alone accounted for 15.1% of total aid. Most of the
federal aid programs require students to qualify under state and federal need-based aid
calculations based on household income. Institutional aid has grown significantly in the past few
years comprising approximately 46% of all grant aid, or about 25% of all financial aid, including
loans. State funded financial aid makes up 13% of total grant aid or about five% of all aid,
including loans.
Student loans continue to be an important financing source for many students. Through federally
supported programs—the William D. Ford Direct Loan program, the Federal Family Education
Loan program and the Perkins loan program (a federal-institution partnership)—the magnitude
of student loans has grown as more students borrow larger amounts of money to meet rising
college costs. Federal loans are now offered directly through the U.S. Department of Education.
Besides these federal programs, the private loan market – often with higher interest rates and
borrower credit qualification requirements – helps students meet education costs. Few data
sources track private loans or the number of parents who finance these costs through the use of
alternative sources - such as home equity credit lines, personal lines of credit, or borrow against
their retirement or insurance portfolios. In addition, credit cards play a role in helping parents
and students pay education expenses, although accurate and reliable data are not readily available
concerning how students use this option for college-related expenses.
4
Figure 1: Sources of Student Financial Assistance

5
If the loan packages offered to students—which have annual limits under federal law—do not
meet a student’s total costs of attendance, institutions may discount tuition or provide other
institution-based resources. Financial aid offices may also recommend parent loans (PLUS loans
not included in the table above) or private loans for students in this situation. Tables 11 and 13
at the end of this report show the cumulative debt of students graduating with associate and
baccalaureate degrees in Colorado over the past six years. Student debt load in Colorado is more
or less on par with the national average. Nonetheless, rising student debt remains an important
element for evaluating the costs of higher education.
DETERMINING NEED
Need is determined by subtracting a student’s expected family contribution (EFC) from total cost
of attendance. A student’s expected family contribution is primarily determined by estimating
total household income, adjusted for the number of family members; other financial assets
(student and family); age of the parents (for dependent students); and, the number of family
members in college. An EFC is the amount that a household is expected to contribute to cover
the cost of attending college, which typically includes tuition and fees, room and board, books
and supplies, and travel expenses for students who do not live in reasonable commuting distance.
If the cost to attend college exceeds the student’s expected family contribution, the student is
eligible for need-based financial aid. The difference between the student’s calculated need and
the amount of financial aid that he/she receives is considered the student’s demonstrated need.
TOTAL COSTS OF ATTENDANCE
- EXPECTED FAMILY CONTRIBUTION (EFC)
= DEMONSTRATED NEED
COLORADO FINANCIAL AID RESOURCES
A primary goal for the Governor, the Colorado Commission on Higher Education (CCHE), and
the Colorado Department of Higher Education (CDHE) for financial aid programs is to expand
student access to Colorado’s institutions of higher education. During the most recent economic
downturn, overall state funded financial aid was maintained at relatively consistent levels, and
substantial increased state investment was made the last two years As the economy recovers
from the downturn, increases to state aid and decreases in enrollment slightly improve the buying
power of state funded grant programs. The enrollment cycle is countercyclical; the demand for
higher education is greater during a downturn. The current data cycle reflects the natural
attrition that occurs as the economy recovers.
Colorado student financial aid is appropriated by the Colorado General Assembly and allocated
by the Colorado Commission on Higher Education to eligible public, private and proprietary
colleges and universities. Recipient institutions then package financial aid awards to individual
students. There are four types of state aid programs which are described below:
State-funded Grants: Most state financial aid is in the form of need-based grants.
Colorado’s undergraduate Completion Incentive Grant program and Colorado Graduate
Grant Program are designed to help provide critical financial support to resident students
with demonstrated need. Allocation policies for these grant programs are approved by
6
the Commission; funds are disbursed by financial aid officers at institutions pursuant to
CCHE policies at proprietary institutions and in accordance with governing board
approved guidelines at public and non-profit private institutions.
Work-based Aid: Work-study support allows students to earn financial aid while
attending college. It is considered a form of “self-help” assistance since the student is
earning money through employment in order to help meet his or her educational costs.
Colorado work-study allocations may be used for students without documented financial
need, but Colorado statutes require that not less than 70% of work-study funds are
awarded to students with demonstrated financial need (C.R.S. 23-3.3-401 (3)). Note: the
federal government also provides work-study funds to eligible students at colleges and
universities in the state.
State-funded Categorical and Entitlement Programs: There are two federal programs
requiring a matching state appropriation for participation: the Perkins Student Loan
Program and certain Health Profession Loans. Colorado provides matching funds so that
Colorado students may receive the benefits of these programs.
In addition, Colorado funds a Law Enforcement/POW/MIA Dependents Tuition
Assistance program, which is a tuition, fee, and room and board assistance program for
dependents of deceased or permanently disabled members of the National Guard, law
enforcement officers, firefighters, prisoners of war, or military personnel missing in
action who were residents of Colorado. Awards for these programs are based on
statutory guidelines.
Colorado also funds the Native American Tuition Assistance Program at Fort Lewis
College. This program is an entitlement program established pursuant to an agreement
with the federal government that allows any Native American student to attend Fort
Lewis College free from tuition expenses.
Table 1 below reflects changes in financial aid allocations in the Long Bill. While total state-
funded financial aid has essentially doubled--$75.9 million--over the last decade, the biggest
increases occurred in 2014-15 with a $40 million increase to state aid programs. In FY2015 the
state invested an additional $30 million in need-based aid, restored a state merit aid program at
$5 million, and grew work-study by an additional $5 million. The increase sets new peak
appropriation mark with an overall appropriation of $152 million in total state aid.

7
Table 1: State Funded Financial Aid Programs, 2005-2015
Analyses of Aid Appropriations
Over the past decade, state need-based aid grew substantially (see Table 1). Funding for need-
based grants reached its highest level in FY2015, at over $109 million, work-study increased by
$5 million, a greater investment than the federal work-study program, merit aid funding is
revived with $5 million and categorical aid increased to reflect actual spending of state funded
entitlement programs.
Categorical aid is divided among several different programs and received $16.3 million in
FY2015:
The Law Enforcement/POW/MIA Dependents Tuition Assistance program assists
dependents of deceased or permanently disabled military, law enforcement officers or
firefighters; the program appropriation increased to $672,000 in FY2015.
The Native American Tuition Assistance Program covers full tuition for Native American
students attending Ft. Lewis College. This program is the largest state categorical
program, both in total expenditures and year-over-year change; the FY2015 appropriation
for this program was $14,841,981.
In FY2015, the state’s National Guard Tuition Assistance Program received $800,000.
SOURCES OF FINANCIAL AID
Table 2 shows six-year historical expenditures across different financial aid categories. Total
financial aid expenditures for Colorado, including federal financial aid sources, institutional aid,
state aid and private financial aid resources, increased by over 7% from 2010 to 2015. This
Fiscal Year
Need-Based
Grants
Merit-
Based
Grants
Work-Based
Aid
Categorical
Programs
Total State
Aid
2004-2005 $45,935,202 $6,434,287 $15,003,374 $8,790,113 $76,162,976
2005-2006 $52,285,488 $1,500,000 $15,003,374 $10,005,122 $78,793,984
2006-2007 $60,096,963 $1,500,000 $14,884,300 $11,281,496 $87,762,759
2007-2008 $67,023,546 $1,500,000 $14,884,300 $11,766,432 $95,174,278
2008-2009 $74,294,146 $1,500,000 $16,612,357 $12,862,293 $105,268,796
2009-2010 $74,294,146 $0 $16,612,357 $13,025,841 $103,932,344
2010-2011 $74,144,146 $0 $16,612,357 $13,192,092 $103,948,595
2011-2012 $74,607,417 $0 $16,612,357 $13,111,524 $104,331,298
2012-2013 $73,798,891 $0 $16,432,328 $13,938,479 $104,169,698
2013-2014 $79,346,789 $0 $16,432,328 $15,686,230 $111,465,347
2014-2015 $109,346,789 $5,000,000 $21,432,328 $16,313,981 $152,093,098
Change 2010-2015 47.18% 0.00% 29.01% 25.24% 46.34%
Change 2005-2015 138.05% -22.29% 42.85% 85.59% 99.69%
8
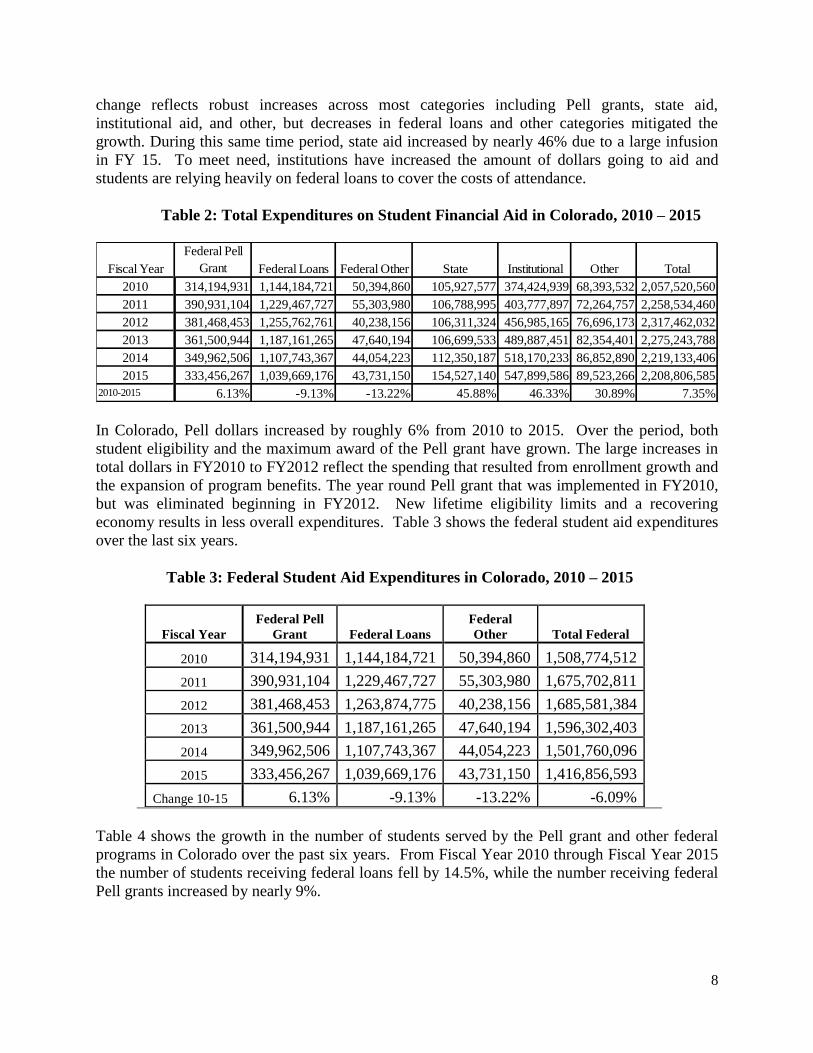
change reflects robust increases across most categories including Pell grants, state aid,
institutional aid, and other, but decreases in federal loans and other categories mitigated the
growth. During this same time period, state aid increased by nearly 46% due to a large infusion
in FY 15. To meet need, institutions have increased the amount of dollars going to aid and
students are relying heavily on federal loans to cover the costs of attendance.
Table 2: Total Expenditures on Student Financial Aid in Colorado, 2010 – 2015
In Colorado, Pell dollars increased by roughly 6% from 2010 to 2015. Over the period, both
student eligibility and the maximum award of the Pell grant have grown. The large increases in
total dollars in FY2010 to FY2012 reflect the spending that resulted from enrollment growth and
the expansion of program benefits. The year round Pell grant that was implemented in FY2010,
but was eliminated beginning in FY2012. New lifetime eligibility limits and a recovering
economy results in less overall expenditures. Table 3 shows the federal student aid expenditures
over the last six years.
Table 3: Federal Student Aid Expenditures in Colorado, 2010 – 2015
Fiscal Year
Federal Pell
Grant Federal Loans
Federal
Other Total Federal
2010 314,194,931 1,144,184,721 50,394,860 1,508,774,512
2011 390,931,104 1,229,467,727 55,303,980 1,675,702,811
2012 381,468,453 1,263,874,775 40,238,156 1,685,581,384
2013 361,500,944 1,187,161,265 47,640,194 1,596,302,403
2014 349,962,506 1,107,743,367 44,054,223 1,501,760,096
2015 333,456,267 1,039,669,176 43,731,150 1,416,856,593
Change 10-15 6.13% -9.13% -13.22% -6.09%
Table 4 shows the growth in the number of students served by the Pell grant and other federal
programs in Colorado over the past six years. From Fiscal Year 2010 through Fiscal Year 2015
the number of students receiving federal loans fell by 14.5%, while the number receiving federal
Pell grants increased by nearly 9%.
Fiscal Year
Federal Pell
Grant Federal Loans Federal Other State Institutional Other Total
2010 314,194,931 1,144,184,721 50,394,860 105,927,577 374,424,939 68,393,532 2,057,520,560
2011 390,931,104 1,229,467,727 55,303,980 106,788,995 403,777,897 72,264,757 2,258,534,460
2012 381,468,453 1,255,762,761 40,238,156 106,311,324 456,985,165 76,696,173 2,317,462,032
2013 361,500,944 1,187,161,265 47,640,194 106,699,533 489,887,451 82,354,401 2,275,243,788
2014 349,962,506 1,107,743,367 44,054,223 112,350,187 518,170,233 86,852,890 2,219,133,406
2015 333,456,267 1,039,669,176 43,731,150 154,527,140 547,899,586 89,523,266 2,208,806,585
2010-2015 6.13% -9.13% -13.22% 45.88% 46.33% 30.89% 7.35%
9
Table 4: Number of Students Receiving Federal Student Aid in Colorado
Fiscal Year
Federal Pell
Grant
Federal
Loans*
Federal
Other
Total Federal
2010 91,062 239,690 30,553 363,315
2011 111,757 268,526 28,982 411,276
2012 116,886 274,241 18,525 411,664
2013 110,210 242,548 22,236 377,007
2014 105,447 221,565 21,857 348,869
2015 98,973 204,845 20,174 323,992
Change 10-15 8.69% -14.54% -33.97% -10.82%
*Figures include number of total loans not necessarily number of students
Table 5 shows the average aid award per student in each of the federal student aid categories.
The average Pell Grant amount decreased in Fiscal Years 2010 and 2011, but increased
consistently from Fiscal Year 2012 to Fiscal Year 2015, reaching an average amount of $3,369.
The maximum Pell grant in FY2015 was increased to $5,730, with 15% of Colorado’s Pell Grant
recipients having received the maximum award. The average aid from other federal sources
increased slightly in FY2015 from a prior year low and the average federal loan amount
increased.
Table 5: Average Federal Student Aid Expenditures Per Student, 2010 - 2015
Fiscal Year
Federal Pell
Grant
Federal
Loans
Federal
Other
Total Federal
2010 3,450 4,774 1,649 9,873
2011 3,498 4,579 1,908 9,985
2012 3,264 4,609 2,172 10,044
2013 3,280 4,895 2,142 10,317
2014 3,319 5,000 2,016 10,334
2015 3,369 5,076 2,168 10,612
Change 10-15 -2.35% 6.32% 31.42% 7.49%
DISTRIBUTION OF STATE AID
Table 6 shows actual dollar expenditures over the past six years. Overall state aid increased by
12% over the six-year period. Need-based aid increased only slightly more, 12.8% and
categorical aid increased by nearly 53% over the period. Table 7 shows the number of students
receiving state aid from Fiscal Year 2010 to Fiscal Year 2015.

10
Table 6: Colorado State Student Aid Expenditures
Fiscal Year State Need-
Based Grant
State
Merit
State Work
Study
State
Categorical Total State
2010 71,787,421 0 17,869,597 11,272,403 100,929,421
2011 73,138,305 0 17,751,229 12,516,352 103,405,886
2012 74,202,707 0 17,691,519 14,325,880 106,220,106
2013 74,611,253 0 17,581,757 14,506,995
106,700,005
2014 79,062,605 0 17,166,587 16,120,995
112,350,187
2015 109,986,211 5,028,895 22,193,885 17,318,149
154,527,140
Change 10-15 53.21% n/a 24.20% 53.63% 53.10%
The number of students receiving state need based aid increased more than 8% since Fiscal Year
2010. The number of work-study recipients increased by 12%, and state-categorical grant
recipients increased by more than 47%.
Table 7: Number of Students Receiving State Financial Aid
Fiscal Year
State
Need-
Based State Merit
State Work
Study
State
Categorical Total State
2010 62,259 0 8,162 933 71,354
2011 71,676 0 8,123 1,082 80,881
2012 70,243 0 7,535 1,137 78,915
2013 66,055 0 7,699 1,250 75,004
2014
59,696 0 7,361 1,325
68,382
2015 67,385 4,580 9,138 1,377
82,480
Change 10-15 8.23% n/a 11.96% 47.59% 15.59%
As seen in Table 8, the average need based award increased by nearly 42% from Fiscal Year
2010 to 2015. Average award amounts increased across all categories. This is likely a result of
increased funding from the state.

11
Table 8: Average Award Per Student, by Type, 2010 - 2015
Fiscal Year State Need-
Based
State
Merit
State Work
Study
State
Categorical
2010 1,153 0 2,189 12,082
2011 1,020 0 2,185 11,568
2012 1,056 0 2,348 12,600
2013 1,130 0 2,284 11,606
2014 1,324 0 2,332 12,167
2015 1,632 1,098 2,429 12,577
Change 10-15 41.56% N/A 10.93% 4.10%
DISTRIBUTION OF INSTITUTIONAL AID
Institutional aid plays a significant role in financial aid packaging and has increased in
importance. Tables 9 and 10 show the growth in the amount of institutional aid for Colorado
institutions and the number of students receiving the aid during the first part of the decade. Total
institutional aid has increased by over 46% since Fiscal Year 2010. The total number of students
receiving institutional aid increased by 4.5% over the six year span. Institutional investment in
student aid is the greatest at four year institutions, both public and non-profit private.
Table 9: Institutional and Other Aid Expenditures, 2010-2015
Fiscal Year Institutional Aid Other Aid Total
2010 374,424,939 68,393,532 442,818,471
2011 403,777,897 72,264,757 476,042,654
2012 456,985,165 76,696,173 533,681,338
2013 489,887,451 82,354,401 572,241,852
2014 518,170,233 86,852,890 605,023,123
2015 547,899,586 89,523,266 637,422,852
Change 10-15 46.33% 30.89% 43.95%
Table 10: Number of Students Receiving Institutional and Other
Student Aid, 2010 – 2015
Fiscal Year Institutional Aid Other
Aid Total
2010 73,640 19,338 92,978
2011 72,664 19,521 92,185
2012 76,439 19,598 96,037
2013 77,615 20,017 97,632
2014 77,906 19,811 97,717
2015 77,593 19,612 97,205
Change 10-15 5.37% 1.42% 4.55%
12
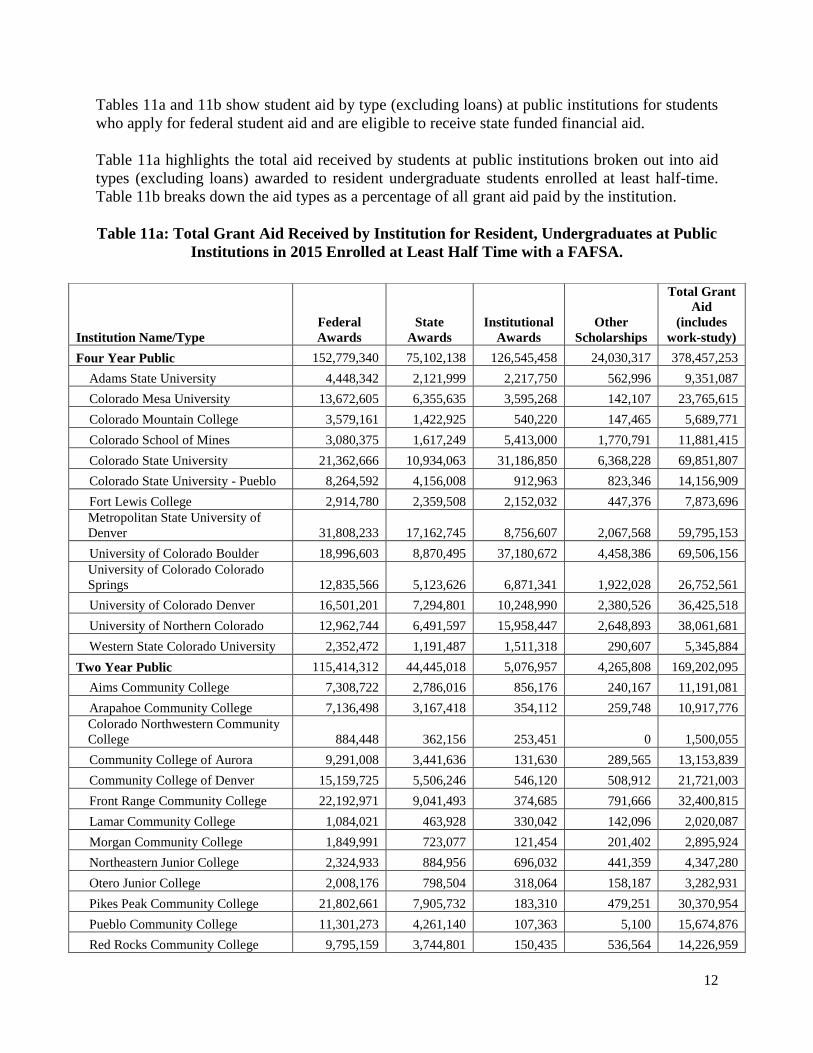
Tables 11a and 11b show student aid by type (excluding loans) at public institutions for students
who apply for federal student aid and are eligible to receive state funded financial aid.
Table 11a highlights the total aid received by students at public institutions broken out into aid
types (excluding loans) awarded to resident undergraduate students enrolled at least half-time.
Table 11b breaks down the aid types as a percentage of all grant aid paid by the institution.
Table 11a: Total Grant Aid Received by Institution for Resident, Undergraduates at Public
Institutions in 2015 Enrolled at Least Half Time with a FAFSA.
Institution Name/Type
Federal
Awards
State
Awards
Institutional
Awards
Other
Scholarships
Total Grant
Aid
(includes
work-study)
Four Year Public 152,779,340 75,102,138 126,545,458 24,030,317 378,457,253
Adams State University 4,448,342 2,121,999 2,217,750 562,996 9,351,087
Colorado Mesa University 13,672,605 6,355,635 3,595,268 142,107 23,765,615
Colorado Mountain College 3,579,161 1,422,925 540,220 147,465 5,689,771
Colorado School of Mines 3,080,375 1,617,249 5,413,000 1,770,791 11,881,415
Colorado State University 21,362,666 10,934,063 31,186,850 6,368,228 69,851,807
Colorado State University - Pueblo 8,264,592 4,156,008 912,963 823,346 14,156,909
Fort Lewis College 2,914,780 2,359,508 2,152,032 447,376 7,873,696
Metropolitan State University of
Denver 31,808,233 17,162,745 8,756,607 2,067,568 59,795,153
University of Colorado Boulder 18,996,603 8,870,495 37,180,672 4,458,386 69,506,156
University of Colorado Colorado
Springs 12,835,566 5,123,626 6,871,341 1,922,028 26,752,561
University of Colorado Denver 16,501,201 7,294,801 10,248,990 2,380,526 36,425,518
University of Northern Colorado 12,962,744 6,491,597 15,958,447 2,648,893 38,061,681
Western State Colorado University 2,352,472 1,191,487 1,511,318 290,607 5,345,884
Two Year Public 115,414,312 44,445,018 5,076,957 4,265,808 169,202,095
Aims Community College 7,308,722 2,786,016 856,176 240,167 11,191,081
Arapahoe Community College 7,136,498 3,167,418 354,112 259,748 10,917,776
Colorado Northwestern Community
College 884,448 362,156 253,451 0 1,500,055
Community College of Aurora 9,291,008 3,441,636 131,630 289,565 13,153,839
Community College of Denver 15,159,725 5,506,246 546,120 508,912 21,721,003
Front Range Community College 22,192,971 9,041,493 374,685 791,666 32,400,815
Lamar Community College 1,084,021 463,928 330,042 142,096 2,020,087
Morgan Community College 1,849,991 723,077 121,454 201,402 2,895,924
Northeastern Junior College 2,324,933 884,956 696,032 441,359 4,347,280
Otero Junior College 2,008,176 798,504 318,064 158,187 3,282,931
Pikes Peak Community College 21,802,661 7,905,732 183,310 479,251 30,370,954
Pueblo Community College 11,301,273 4,261,140 107,363 5,100 15,674,876
Red Rocks Community College 9,795,159 3,744,801 150,435 536,564 14,226,959

13
Trinidad State Junior College 3,274,726 1,357,915 654,083 211,791 5,498,515
Public Technical 2,437,957 790,551 238,703 20,050 3,487,261
Delta Montrose A.V.S. 342,605 83,589 0 10,400 436,594
Emily Griffith Technical College 1,302,668 371,971 234,350 9,650 1,918,639
Pickens Technical Center - Voc
Tech 792,684 334,991 4,353 0 1,132,028
Total 270,631,609 120,337,707 131,861,118 28,316,175 551,146,609

14
Table 11b: Percentage of Aid by Type at Public Institutions for All Aid Types
Excluding Loans
Institution Name/Type
Percentage of
Federal Grant
Aid
Percentage
of Awards
State
Percentage
of Awards
Institutional
Percentage
of Other
Scholarship
Four Year Public 40.37% 19.84% 33.44% 6.35%
Adams State University 47.57% 22.69% 23.72% 6.02%
Colorado Mesa University 57.53% 26.74% 15.13% 0.60%
Colorado Mountain College 62.91% 25.01% 9.49% 2.59%
Colorado School of Mines 25.93% 13.61% 45.56% 14.90%
Colorado State University 30.58% 15.65% 44.65% 9.12%
Colorado State University - Pueblo 58.38% 29.36% 6.45% 5.82%
Fort Lewis College 37.02% 29.97% 27.33% 5.68%
Metropolitan State University of Denver 53.20% 28.70% 14.64% 3.46%
University of Colorado Boulder 27.33% 12.76% 53.49% 6.41%
University of Colorado Colorado Springs 47.98% 19.15% 25.68% 7.18%
University of Colorado Denver 45.30% 20.03% 28.14% 6.54%
University of Northern Colorado 34.06% 17.06% 41.93% 6.96%
Western State Colorado University 44.01% 22.29% 28.27% 5.44%
Two Year Public 68.21% 26.27% 3.00% 2.52%
Aims Community College 65.31% 24.89% 7.65% 2.15%
Arapahoe Community College 65.37% 29.01% 3.24% 2.38%
Colorado Northwestern Community
College 58.96% 24.14% 16.90% 0.00%
Community College of Aurora 70.63% 26.16% 1.00% 2.20%
Community College of Denver 69.79% 25.35% 2.51% 2.34%
Front Range Community College 68.50% 27.91% 1.16% 2.44%
Lamar Community College 53.66% 22.97% 16.34% 7.03%
Morgan Community College 63.88% 24.97% 4.19% 6.95%
Northeastern Junior College 53.48% 20.36% 16.01% 10.15%
Otero Junior College 61.17% 24.32% 9.69% 4.82%
Pikes Peak Community College 71.79% 26.03% 0.60% 1.58%
Pueblo Community College 72.10% 27.18% 0.68% 0.03%
Red Rocks Community College 68.85% 26.32% 1.06% 3.77%
Trinidad State Junior College 59.56% 24.70% 11.90% 3.85%
Public Technical 69.91% 22.67% 6.84% 0.57%
Delta Montrose A.V.S. 78.47% 19.15% 0.00% 2.38%
Emily Griffith Technical College 67.90% 19.39% 12.21% 0.50%
Pickens Technical Center - Voc Tech 70.02% 29.59% 0.38% 0.00%
Grand Total 49.10% 21.83% 23.92% 5.14%

15
STUDENT DEBT
As college costs rise, many students use loans—mostly federal, but some private—to close the
gap between their ability to pay and the costs of attendance. Student debt is a discussion point
whenever higher education costs are discussed. Student loans are a worthy investment to help
offset higher education costs. The following discussion is about default rates. First according to
College Board, it is important to note that the loans in default are a small percentage of loan debt
and the loans are generally in smaller amounts. 9% of students who completed a degree
defaulted on their loans within two years, while 24% of students who stop out before earning a
credential defaulted within two years. Time to degree is critical in helping students manage debt.
Concurrent enrollment, credit for prior learning, and shortened degree programs provide ways
for students to reduce the time it takes them to complete. As students who complete are less
likely to default, it is important to help students finish degrees in a timely manner. The most
costly debt is debt that does not result in a degree or a credential.
The methodology for making the calculations in this section looks at all student completers in
2014-15 and uses the student unit record date (SURDS) for six years for a bachelor’s degree and
three years for an associate degree to capture loans reported in the data. The data excludes PLUS
loans. If a student must borrow, timely completion is the best way to keep debt low.
Generally speaking, the average student loan debt among graduates of Colorado’s colleges and
universities has risen in recent years, but the share of loans relative to other types of aid has
decreased. At Colorado public institutions, 71% of students graduated with debt and the average
debt is $25,509 for a bachelor’s degree, excluding payments made while in school or interest
accrued. 61% of student who earned an Associate’s degree used student loans to help finance
the costs. The average loan debt of a student with an associate’s degree is $13,762. Tables 12
and 13 show the average student loan debt for degree recipients who took loans by institution
and type of degree granted (either baccalaureate or associates) and amounts do not capture any
interest that may have been accrued while in school.
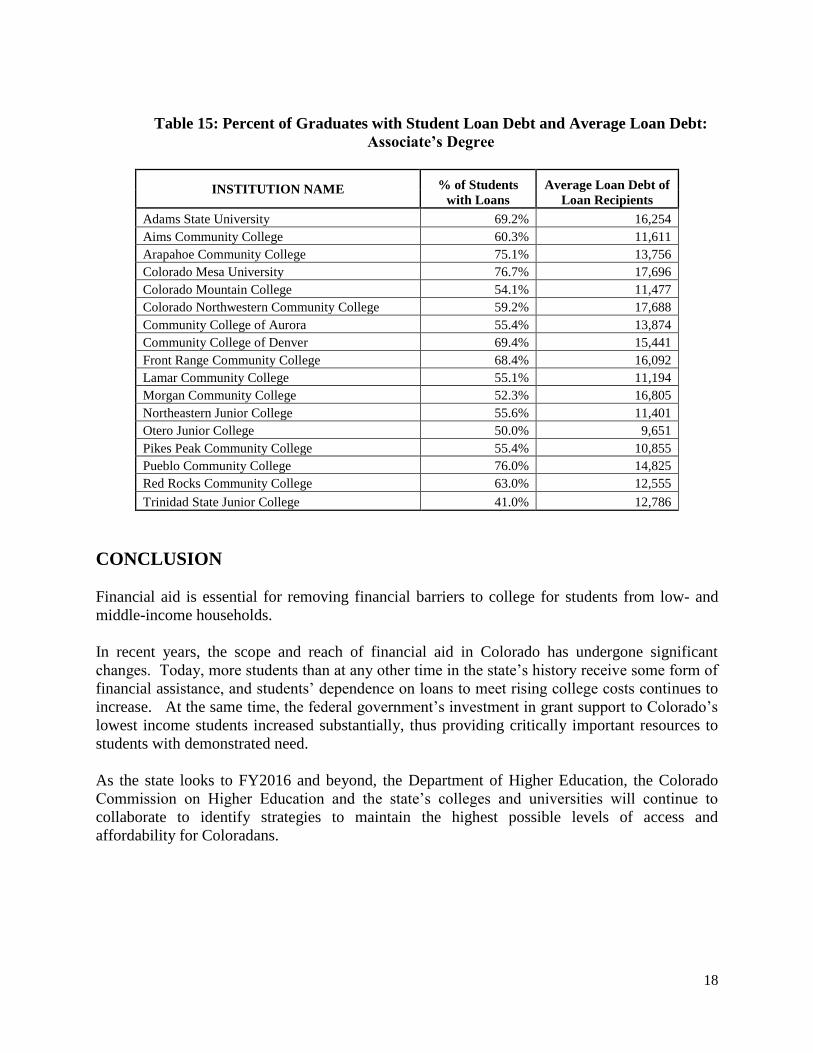
At the associate’s degree level, total average student loan debt ranged between $9,651 at Otero
Junior College to $17,688 at Colorado Northwestern Community College (Table 12). At the
baccalaureate level, average student loan debt ranged from $21,022 at Colorado Mountain
College to $33,596 at the Colorado School of Mines (Table 13).

16
Table 12: Average Student Loans Debt at Graduation: Associates Degree, 2010 – 2015
Institution 2010 2011 2012 2013 2014 2015 %
Change
Adams State University 11,782 17,692 16,502 17,358 15,644 16,254 37.96%
Aims Community College 9,918 11,053 11,596 12,267 12,295 11,611 17.07%
Arapahoe Community College 13,159 11,983 12,241 13,129 14,471 13,756 4.54%
Colorado Mesa University 14,112 15,040 17,291 16,708 18,605 17,696 25.40%
Colorado Mountain College 11,087 12,600 13,579 11,684 11,658 11,477 3.52%
Colorado Northwestern Community
College 16,404 15,111 18,770 19,865 18,258 17,688 7.83%
Community College of Aurora 12,496 13,245 13,690 15,802 13,552 13,874 11.03%
Community College of Denver 13,847 15,067 17,418 17,304 17,201 15,441 11.51%
Front Range Community College 12,148 14,608 16,374 16,162 16,040 16,092 32.47%
Lamar Community College 13,423 12,083 13,895 12,186 12,817 11,194 -16.61%
Morgan Community College 12,129 12,811 14,602 15,016 12,575 16,805 38.55%
Northeastern Junior College 9,660 10,862 10,571 10,605 10,564 11,401 18.02%
Otero Junior College 12,621 14,088 12,645 9,461 11,587 9,651 -23.53%
Pikes Peak Community College 11,450 12,949 12,617 11,711 11,175 10,855 -5.20%
Pueblo Community College 13,814 13,935 14,890 15,190 14,442 14,825 7.32%
Red Rocks Community College 11,734 13,154 13,999 16,418 15,176 12,555 7.00%
Trinidad State Junior College 11,984 14,136 13,546 12,900 11,952 12,786 6.69%
LOANS INCLUDED: Federal Stafford Loans Unsubsidized; Federal Perkins Loan; Federal Stafford Loans Subsidized; Federal Health
Profession Loans; Other Loans
NOTE: In this table, Average Students Loan Debt is calculated as the average loan amount per student only for students that have debt upon
graduation, not the average debt of all degree receiving students per institution.

17
Table 13: Average Student Loans Debt at Graduation: Baccalaureate Degree, 2010 - 2015
Institution 2010 2011 2012 2013 2014 2015 %
Change
Adams State University 20,804 21,462 23,636 24,621 25,205 26,308 26.46%
Colorado Mesa University 20,751 24,372 25,045 25,280 24,961 27,081 30.50%
Colorado Mountain College 15,045 16,170 21,022
Colorado School of Mines 26,013 29,213 30,987 31,023 31,783 33,596 29.15%
Colorado State University 21,370 22,857 23,902 25,156 25,661 25,565 19.63%
Colorado State University - Pueblo 21,955 23,414 24,060 23,267 23,552 25,741 17.24%
Fort Lewis College 17,081 19,729 20,948 21,667 21,767 23,624 38.31%
Metropolitan State University of
Denver 23,858 25,493 26,640 26,267 26,653 28,632 20.01%
University of Colorado - Boulder 20,662 23,125 24,485 25,173 25,362 26,519 28.35%
University of Colorado - Colorado
Springs 21,900 22,703 23,184 24,703 25,501 26,857 22.63%
University of Colorado at Denver 25,974 26,170 26,948 29,167 29,410 29,479 13.49%
University of Northern Colorado 20,714 22,052 24,224 25,001 25,563 25,859 24.84%
Western State Colorado University 20,915 19,728 20,794 22,953 23,387 23,672 13.18%
LOANS INCLUDED: Federal Stafford Loans Unsubsidized; Federal Perkins Loan; Federal Stafford Loans Subsidized;
Federal Health Profession Loans; Other Loans
NOTE: In this table Average Students Loan Debt is calculated as the average loan amount per student only for students that
have debt upon graduation, not the average debt of all degree receiving students per institution.
Table 14: Percent of Graduates with Student Loan Debt and Average Loan Debt:
Baccalaureate Degree
INSTITUTION NAME
% of
Students
with
Loans
Average Loan Debt
of Loan Recipients
Adams State University 76.5% 26,308
Colorado Mesa University 74.5% 27,081
Colorado Mountain College 63.2% 21,022
Colorado School of Mines 66.9% 33,596
Colorado State University 66.8% 25,565
Colorado State University - Pueblo 79.8% 25,741
CSU-Global Campus 82.1% 13,177
Fort Lewis College 67.9% 23,624
Metropolitan State University of Denver 78.9% 28,632
University of Colorado Boulder 57.8% 26,519
University of Colorado Colorado Springs 70.9% 26,857
University of Colorado Denver 70.0% 29,479
University of Northern Colorado 72.2% 25,859
Western State Colorado University 69.0% 23,672
18
Table 15: Percent of Graduates with Student Loan Debt and Average Loan Debt:
Associate’s Degree
INSTITUTION NAME % of Students
with Loans
Average Loan Debt of
Loan Recipients
Adams State University 69.2% 16,254
Aims Community College 60.3% 11,611
Arapahoe Community College 75.1% 13,756
Colorado Mesa University 76.7% 17,696
Colorado Mountain College 54.1% 11,477
Colorado Northwestern Community College 59.2% 17,688
Community College of Aurora 55.4% 13,874
Community College of Denver 69.4% 15,441
Front Range Community College 68.4% 16,092
Lamar Community College 55.1% 11,194
Morgan Community College 52.3% 16,805
Northeastern Junior College 55.6% 11,401
Otero Junior College 50.0% 9,651
Pikes Peak Community College 55.4% 10,855
Pueblo Community College 76.0% 14,825
Red Rocks Community College 63.0% 12,555
Trinidad State Junior College 41.0% 12,786
CONCLUSION
Financial aid is essential for removing financial barriers to college for students from low- and
middle-income households.
In recent years, the scope and reach of financial aid in Colorado has undergone significant
changes. Today, more students than at any other time in the state’s history receive some form of
financial assistance, and students’ dependence on loans to meet rising college costs continues to
increase. At the same time, the federal government’s investment in grant support to Colorado’s
lowest income students increased substantially, thus providing critically important resources to
students with demonstrated need.
As the state looks to FY2016 and beyond, the Department of Higher Education, the Colorado
Commission on Higher Education and the state’s colleges and universities will continue to
collaborate to identify strategies to maintain the highest possible levels of access and
affordability for Coloradans.