financial analysis; nutrition potential health benefits ... · virginia. victor l. fulgoni iii,...
TRANSCRIPT
Financial Analysis; Nutrition
Potential Health Benefits and Medical CostSavings From Calorie, Sodium, and Saturated FatReductions in the American DietTimothy M. Dall, MS; Victor L. Fulgoni III, PhD; Yiduo Zhang, PhD; Kristin J. Reimers, PhD;Patricia T. Packard, MS, RD; James D. Astwood, PhD
Abstract
Purpose. Model the potential national health benefits and medical savings from reduceddaily intake of calories, sodium, and saturated fat among the U.S. adult population.
Design. Simulation based on secondary data analysis; quantitative research. Measuresinclude the prevalence of overweight/obesity, uncontrolled hypertension, elevated cholesterol,and related chronic conditions under various hypothetical dietary changes.
Setting. United States.Subjects. Two hundred twenty-four million adults.Measures. Findings come from a Nutrition Impact Model that combines information from
national surveys, peer-reviewed studies, and government reports.Analysis. The simulation model predicts disease prevalence and medical expenditures under
hypothetical dietary change scenarios.Results. We estimate that permanent 100-kcal reductions in daily intake would eliminate
approximately 71.2 million cases of overweight/obesity and save $58 billion annually. Long-termsodium intake reductions of 400 mg/d in those with uncontrolled hypertension would eliminateabout 1.5 million cases, saving $2.3 billion annually. Decreasing 5 g/d of saturated fat intakein those with elevated cholesterol would eliminate 3.9 million cases, saving $2.0 billion annually.
Conclusions. Modest to aggressive changes in diet can improve health and reduce annualnational medical expenditures by $60 billion to $120 billion. One use of the model is to estimatethe impact of dietary change related to setting public health priorities for dietary guidance. Thefindings here argue that emphasis on reduction in caloric intake should be the highest priority.(Am J Health Promot 2009;23[6]:412–422.)
Key Words: Diet, Obesity, Uncontrolled Hypertension, High Cholesterol,Health Promotion, Chronic Conditions, Cost of Illness, Prevention Research.Manuscript format: research; Research purpose: intervention testing/programevaluation; Study design: nonexperimental; Outcome measure: overweight/obesity, hypertension, cholesterol, disease, medical costs; Setting: United States;Health focus: obesity, uncontrolled hypertension, high cholesterol; Strategy:improved diet; Target population: adults; Target population circumstances:overweight, uncontrolled hypertension, high cholesterol
INTRODUCTION
It is well documented that excessbody weight, hypertension, and hyper-lipidemia are major contributors to thenation’s skyrocketing medical costs.1–15
It is also well established that theseconditions can be modified or pre-vented by dietary changes.16–19 Whathas not been previously documented isthe impact that dietary changes wouldhave on reducing or eliminating theseconditions and on the magnitude oftheir contribution to the nationalhealth care burden.
Although clinical trials have demon-strated the beneficial effects of im-proved diet on overweight, high bloodpressure, and elevated cholesterol lev-els, studies of sufficient size andduration to properly assess the medicalsavings the nation would achieve havenot been done. Such a prospectivestudy may never be feasible because ofthe high cost and study design com-plexities. The U.S. medical researchdatabase does, however, encompassinvaluable resources that have definedthe risk of selected common medicaldisorders based on dietary intake aswell as the yearly per patient costs fortreating each of these conditions. Weutilized these resources to generate abest estimate of the individual costsavings for these three conditions aswell as the total savings that would berealized.
METHODS
Conceptual Model
We developed the Nutrition ImpactModel to estimate the potential health
Timothy M. Dall, MS, and Yiduo Zhang, PhD, are with The Lewin Group, Falls Church,Virginia. Victor L. Fulgoni III, PhD, is with Nutrition Impact, LLC, Battle Creek, Michigan.Kristin J. Reimers, PhD; Patricia T. Packard, MS, RD; and James D. Astwood, PhD, are withConAgra Food, Inc., Omaha, Nebraska.
Send reprint requests to Timothy M. Dall, MS, The Lewin Group, 3130 Fairview Park Dr, Suite 800,Falls Church, VA 22042; [email protected].
This manuscript was submitted September 30, 2008; revisions were requested December 18, 2008 and February 12, 2009; themanuscript was accepted for publication February 16, 2009.
Copyright E 2009 by American Journal of Health Promotion, Inc.0890-1171/09/$5.00 + 0
412 American Journal of Health Promotion

benefits of weight loss for obese andoverweight adults, of reduced bloodpressure for hypertensive adults, and ofdecreased low density lipoprotein cho-lesterol (LDL-C) for adults with ele-vated blood cholesterol. To establish abaseline, we used data from the 1999 to2004 National Health and NutritionExamination Survey (NHANES; N 5
17,061).20 The adult population wasdivided into 480 unique risk groupsacross five dimensions: age (18–44, 45–54, 55–64, 65–74, 75+); gender; fourweight categories defined19 using bodymass index (BMI)—normal weight(18.5 , BMI , 25), overweight (25 #
BMI , 30), obese class I (30 # BMI ,
35), and obese classes II and III (BMI§ 35); three blood pressure categoriesdefined16 using systolic (SBP) anddiastolic (DBP) blood pressure—nor-mal pressure (SBP , 120 mm Hg andDBP , 80 mm Hg), prehypertension(120 # SBP , 140 and 80 # DBP ,
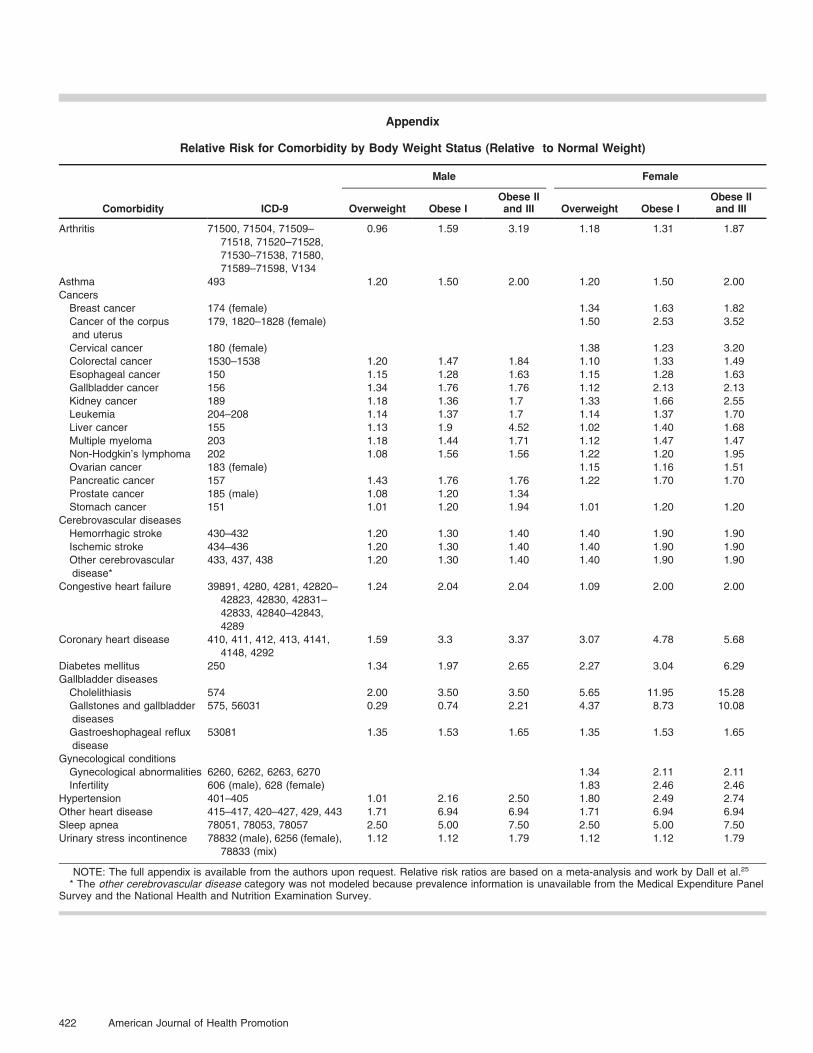
90), and hypertension (SBP § 140 orDBP § 90); and four cholesterol levelsdefined21 using LDL-C level—optimal(LDL-C , 100 mg/dL), near optimal(100 # LDL-C , 130), borderline high(130 # LDL-C , 160), and high (LDL-C § 160). Using data from NHANESand the 2000 to 2004 Medical Expen-diture Panel Survey (MEPS),22 weestimated the prevalence rates for anarray of chronic conditions (see Ap-pendix for diagnosis codes used toidentify these conditions) to establishthe health risk profile for each uniquerisk group at baseline.
Authoritative scientific reports andpeer-reviewed literature (describedbelow) were used to quantify therelationships between dietary changeand BMI, SBP/DBP, and LDL-C andbetween these same factors anddisease risk.18,23–27 We model alter-nate hypothetical scenarios associat-ed with improved nutritional intake.Each hypothetical scenario producesa new health equilibrium for thepopulation, suggesting what thehealthcare utilization would be forthe population with lower rates ofoverweight/obesity, hypertension,and high LDL-C.
The model does not indicate howlong it would take for the nation toreach a new health equilibrium; tobe conservative we choose to modelthe long-term health benefits of
improved nutritional intake. Inten-tional weight loss can improve orprevent many cardiovascular risks(e.g., type 2 diabetes, dyslipidemia,hypertension, and inflammation).Moreover, these metabolic benefitsare often found quickly after onlymodest weight loss (about 5% ofinitial weight) and continue to im-prove in a monotonic fashion withincreasing weight loss.26,28,29 Lifestyledietary and activity modifications,which resulted in modest (5%) weightloss, decreased the 4- to 6-year cu-mulative incidence of diabetes by asmuch as 50% in both men andwomen who were overweight or obeseand had impaired glucose toler-ance.30 Weight loss decreases serumLDL-C and triglyceride concentra-tions,26 with greatest relative im-provements reportedly occurringwithin the first 2 months of weightloss.31 Within only 1 year of weightloss, diabetes patients participating inclinical trails witnessed significantimprovement in hemoglobin A1c(HbA1c), SBP, DBP, triglycerides,and high density lipoprotein choles-terol.32 Numerous clinical trials havereported that weight loss (mostlythrough diet and exercise) is accom-panied by reduction in both SBP andDBP in a dose-response fashion.33
Despite the clear dose-response re-lationship between weight loss andreduction in cardiovascular risks, toour best knowledge, there is no con-sensus from prospective studies to dateon whether intentional weight lossincreases or decreases all-cause orcardiovascular mortality.34–36
Ultimately, the change in diseasecases that would occur with a de-fined dietary change was quantifiedby modeling the proportionalchange in baseline disease preva-lence rates for each unique riskgroup associated with collectivechange in body weight, blood pres-sure, and cholesterol levels. Theannual cost per disease case wasestimated by multivariate regressionanalysis using MEPS (See Appendixfor ordinary least squares regressionspecification and results used toestimate annual medical cost bycondition and age group). Theresulting disease rates and costs wereextrapolated to the 2007 U.S. popu-
lation by demographic group, andconverted to 2007 dollars usingthe consumer price index medicalcomponent.37
Assumptions
The parameters for the NutritionImpact Model were based on authori-tative peer-reviewed studies and analy-sis of widely used national databases.To our knowledge, there are noempirical studies that document achange in national medical costs re-sulting from a change in dietary habitsamong the general population. Ourmodel is based entirely on studies thatshow an association between change indiet and change in risk factors (bodyweight, blood pressure, and LDL-C),studies and original analysis that showan association between change in thesefactors and risk of chronic disease, andoriginal analysis that shows the associ-ation between presence of chronicdisease and annual medical expendi-tures.
Caloric intake and body weight. Usingestimates published in 2005 by theInstitute of Medicine (IOM), the im-pact of a sustained reduction in dailycaloric intake until a new weightequilibrium is reached was modeled.18
The IOM report contains equationsdescribing the estimated energy re-quirement (EER) for men and womenof a given age, weight, height, andphysical activity level (PAL) developedfrom data on total daily energy expen-diture measured by the doubly labeledwater technique.38
For male adults:
EER~662{ 9:53|agey
� �zPAL
| 15:91|weightkg
�
z539:6|heightmÞ
For female adults:
EER~354{ 6:91|agey
� �
zPAL| 9:36|weightkg
�
z726|heightmÞ
Reduced daily caloric intake belowthe EER results in weight loss, until anew equilibrium is reached in which
July/August 2009, Vol. 23, No. 6 413

EER equals the new daily caloricintake. Dividing caloric intake reduc-tion by the product of correspondingPAL and weight coefficients (15.91 formen and 9.36 for women) from theEER equations yields total weight lossfrom diet modification. (Equations 1.1-1.2; see Table 1). (see Appendix forthe mathematical derivation of thisrelationship and examples of associat-ed weight loss from reduced caloricintake.)
The IOM PAL coefficients (1.25 formale and 1.27 for female) associatedwith moderate physical activity wereutilized. These coefficients producemore conservative estimates of weightloss than would be obtained using low-activity (1.11 for male and 1.12 forfemale) or sedentary lifestyle (1.0 forboth genders) physical activity param-eters.
Sodium intake and blood pressure. Therelationship between sodium intakeand blood pressure used was 3.3/1.6 mm Hg SBP/DBP reduction re-sulting from a 100-mmol sodium re-duction.23 For comparison, a sensitivityanalysis was conducted using DASHdiet study estimates of a blood pressurereduction of 9.0/6.0 mm Hg for thepopulation aged 44 and under and8.0/3.8 mmHg for the populationaged 45 and over associated with a100 mmol sodium reduction.24
Saturated fat intake and LDL-C level. Thereduction in saturated fat intake wasmeasured by the reduction in energycontent from fat intake (9.25 kcal/g)as a percentage of total baseline energyintake. Averaging the results fromthree studies produces the responsecurve18 (Equation 1.3; see Table 1).
where bFL represents the impact ofchange in saturated fat intake on LDL-C. NHANES data on observed height,ideal weight (weight driven to a BMI of18–24.9 kg/m2), age, and gender topredict total energy intake for eachpopulation group using the EERequation from the IOM report wereused. In this model, the simulatedbenefit of reduced saturated fat intakeassumed a constant calorie intake andBMI while reducing LDL-C to below100 mg/dL.
Analysis
To model the change in prevalenceof chronic conditions associated withoverweight and obesity, we synthesizedthe peer-reviewed literature to estimatethe increased risk of comorbiditiesassociated with overweight and obesity.Using average body weight and thedisease relative risk ratios for eachweight category, we calculated per-centage reduction in disease risk pergram reduction in body weight. Usingthe above assumptions, the modelattributes a reduction of 0.68/0.34 mmHg and a 0.02 mmol/L (0.78 mg/dL)decrease in LDL-C for each kilogramof weight loss.26,27
We used findings reported by theJoint National Committee on Preven-tion, Detection, Evaluation, and Treat-ment of High Blood Pressure from ameta-analysis using mortality data toestimate the decline in disease riskassociated with improved blood pres-sure.16,39 To model the change incardiovascular disease risk associatedwith lower LDL-C, we used a relativerisk reduction in coronary heart dis-ease of about 30% for every 30 mg/dLreduction in LDL-C greater than100 mg/dL.17 We based the response
relationship between LDL-C and strokeon Law’s reported 20% reduction ofstroke cases for each 1 mmol/L(39 mg/dL) reduction in LDL-C causedby statin medication.40 We also usedLaw’s relationship to model changes inLDL-C on peripheral artery disease,because its prevalence rate attributableto LDL-C change is limited.
We used multivariate regressionanalysis (ordinary least squares) withdata from the 2000 to 2004 MEPS toestimate the average annual increase inmedical expenditures per case ofchronic conditions associated withexcess weight, hypertension, and highLDL-C. (See Appendix for regressionspecification and results.) Annual med-ical expenditures across all major healthcare delivery settings (excluding nursinghome care) comprise the dependentvariable; the explanatory variables in-clude age (in years), gender, and di-chotomous indicator variables (1 5 yes,0 5 no) indicating the presence of ahealth care visit during the previous yearwith a diagnosis code for a relevantchronic condition. We estimated sepa-rate regressions for each age group. Weinterpreted the regression coefficientsfor the chronic condition variables as theadditional annual medical cost associat-ed with having that comorbidity, con-trolling for other medical conditions.
RESULTS
National Costs of Overweight andObesity, Uncontrolled Hypertension, andElevated LDL-C
From the NHANES data we estimat-ed that of the 225 million adults in theUnited States in 2007, 74.7 million(33%) were overweight, 37.8 million
Table 1
For male adults Total Weight Reductionkg~Sustained Reduction in Daily Caloric Intakekcal
PAL|15:91(1:1)
For female adults Total Weight Reductionkg~Sustained Reduction in Daily Caloric Intakekcal
PAL|9:36(1:2)
DLDL mg=dlð Þ~bFL|DFat %energyð Þ~1:5|9:25kcal=g|DFatg
EER age,gender,height,weightð Þ
� �, (1:3)
414 American Journal of Health Promotion

(17%) were obese I, and 26.7 million(12%) were obese II or III (Table 2).Using the Nutrition Impact Model, weestimated that annual medical expen-ditures associated with eliminatingoverweight and obesity among adultswould be $169 billion, which is equiv-alent to approximately 9% of totalnational health care expenditures.Other studies have found that obesityalone is responsible for 3% to 9% ofnational health expenditures.3,5,13,41
Approximately 53% and 47% of thesavings are attributed to reduced med-ical costs among the currently obeseand the currently overweight, respec-tively. One-quarter of the medicalsavings comes from reducing preva-lence of coronary heart disease by 37%.
Applying NHANES sample data tothe U.S. population, 42 millionadults have uncontrolled hyperten-
sion. The potential saving associatedwith its elimination is $84.2 billion.Approximately half of the savingscome from reduced use of healthcare services directly associated withhypertension, with the remainderfrom reduced prevalence of cardio-vascular complications attributed tohypertension.
NHANES prevalence rates applied tothe U.S. population indicate that ap-proximately 36.7 million adults in theU.S. have high LDL-C levels, and that anadditional 30.8 million adults haveborderline high LDL-C. Savings of $21.5billion could be achieved by eliminatingall cases of elevated LDL-C, therebyreducing the prevalence of cerebrovas-cular disease, coronary heart disease,and other cardiovascular diseases.42
Although it is helpful to understandthe total cost of these conditions,
improved diet alone cannot eliminatethe three risk factors modeled. Thus,we simulated potential medical savingspotentially achievable via modest die-tary changes and also simulated moreaggressive dietary change that wouldmove the population closer to currentauthoritative dietary recommenda-tions.16–19
Potential National Health Benefits andMedical Cost Savings of CalorieIntake Reduction
We modeled a reduction in dailycaloric intake of 100 to 500 kcal belowcurrent estimated energy require-ments (Table 3). If all adults withabove normal weight permanentlyreduced daily caloric intake by100 kcal, then over a period of about4 years the prevalence of overweightand obesity would decline until a new
Table 2
Comorbidity Cases and Medical Costs Associated With Preventable Risk Factors
Total Cases in theUnited States (1000)
AverageAnnual Costper Case ($)
Cases Attributed to Risk Factor (1000)Total AttributedMedical Cost($1,000,000)
ExcessWeight
UncontrolledHypertension
HighCholesterol
Adult population modeled 224,669
Overweight 74,700 N/A 74,700 N/A*
Obese I 37,782 N/A 37,782 N/A*
Obese II and III 26,724 N/A 26,724 N/A*
High cholesterol 36,713 N/A 14,685 N/A*
Uncontrolled hypertension 42,080 922 16,832 42,080 38,798
Comorbidity
Arthritis 5797 5211 740 3855
Asthma 4597 2491 818 2037
Cancer 12,862 10,170 2299 23,384
Cerebrovascular disease 4224 9137 1309 1159 315 11,963
Congestive heart failure 6555 4226 1520 1318 6421
Coronary heart disease 11,893 10,338 4376 2091 1310 45,241
Diabetes 14,472 4326 4867 21,055
Esophagus/stomach disease 2921 2439 599 1461
Gallbladder disease 1088 9467 453 4292
Gynecological conditions 1896 454 412 187
Kidney, other urinary disease 1198 2084 117 243
Other cardiovascular disease� 5149 10,350 2128 741 487 22,027
Sleep apnea 5761 4330 2609 11,299
Overall medical costs
Total ($1,000,000) 168,985 84,241 21,472 192,263
Individuals at risk (1000) 139,206 42,080 36,713
Medical cost per person at risk, $ 1214 2002 585
NOTE: Estimates are rounded for presentation and might not add to totals. Some comorbidity cases are jointly attributed to multiple risk factors.Consequently, total potential savings from eliminating all cases of excess weight, uncontrolled hypertension, and high cholesterol is less than the sum oftotal medical costs associated with each individual risk factor. N/A indicates not available.
* Medical costs associated with obesity and high cholesterol are captured through the comorbidity estimates.� Category includes disease of pulmonary circulation, peripheral vascular disease, and other forms of heart disease.
July/August 2009, Vol. 23, No. 6 415
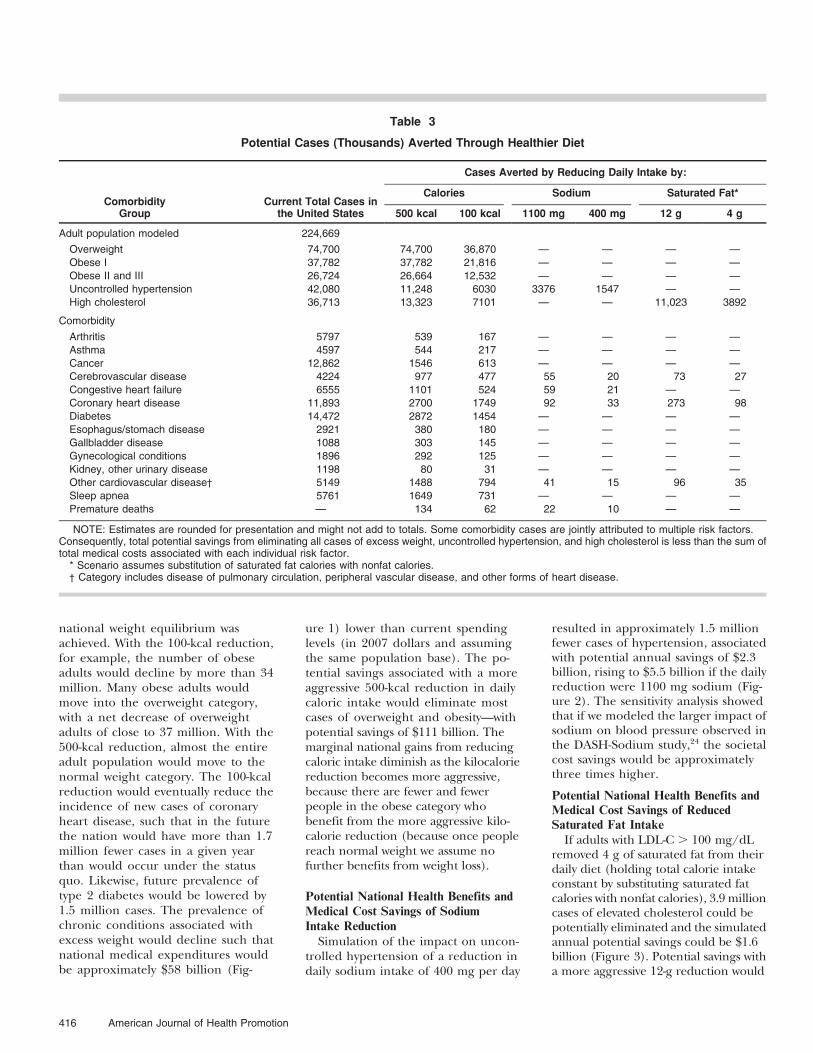
national weight equilibrium wasachieved. With the 100-kcal reduction,for example, the number of obeseadults would decline by more than 34million. Many obese adults wouldmove into the overweight category,with a net decrease of overweightadults of close to 37 million. With the500-kcal reduction, almost the entireadult population would move to thenormal weight category. The 100-kcalreduction would eventually reduce theincidence of new cases of coronaryheart disease, such that in the futurethe nation would have more than 1.7million fewer cases in a given yearthan would occur under the statusquo. Likewise, future prevalence oftype 2 diabetes would be lowered by1.5 million cases. The prevalence ofchronic conditions associated withexcess weight would decline such thatnational medical expenditures wouldbe approximately $58 billion (Fig-
ure 1) lower than current spendinglevels (in 2007 dollars and assumingthe same population base). The po-tential savings associated with a moreaggressive 500-kcal reduction in dailycaloric intake would eliminate mostcases of overweight and obesity—withpotential savings of $111 billion. Themarginal national gains from reducingcaloric intake diminish as the kilocaloriereduction becomes more aggressive,because there are fewer and fewerpeople in the obese category whobenefit from the more aggressive kilo-calorie reduction (because once peoplereach normal weight we assume nofurther benefits from weight loss).
Potential National Health Benefits andMedical Cost Savings of SodiumIntake Reduction
Simulation of the impact on uncon-trolled hypertension of a reduction indaily sodium intake of 400 mg per day
resulted in approximately 1.5 millionfewer cases of hypertension, associatedwith potential annual savings of $2.3billion, rising to $5.5 billion if the dailyreduction were 1100 mg sodium (Fig-ure 2). The sensitivity analysis showedthat if we modeled the larger impact ofsodium on blood pressure observed inthe DASH-Sodium study,24 the societalcost savings would be approximatelythree times higher.
Potential National Health Benefits andMedical Cost Savings of ReducedSaturated Fat Intake
If adults with LDL-C . 100 mg/dLremoved 4 g of saturated fat from theirdaily diet (holding total calorie intakeconstant by substituting saturated fatcalories with nonfat calories), 3.9 millioncases of elevated cholesterol could bepotentially eliminated and the simulatedannual potential savings could be $1.6billion (Figure 3). Potential savings witha more aggressive 12-g reduction would
Table 3
Potential Cases (Thousands) Averted Through Healthier Diet
ComorbidityGroup
Current Total Cases inthe United States
Cases Averted by Reducing Daily Intake by:
Calories Sodium Saturated Fat*
500 kcal 100 kcal 1100 mg 400 mg 12 g 4 g
Adult population modeled 224,669
Overweight 74,700 74,700 36,870 — — — —
Obese I 37,782 37,782 21,816 — — — —
Obese II and III 26,724 26,664 12,532 — — — —
Uncontrolled hypertension 42,080 11,248 6030 3376 1547 — —
High cholesterol 36,713 13,323 7101 — — 11,023 3892
Comorbidity
Arthritis 5797 539 167 — — — —
Asthma 4597 544 217 — — — —
Cancer 12,862 1546 613 — — — —
Cerebrovascular disease 4224 977 477 55 20 73 27
Congestive heart failure 6555 1101 524 59 21 — —
Coronary heart disease 11,893 2700 1749 92 33 273 98
Diabetes 14,472 2872 1454 — — — —
Esophagus/stomach disease 2921 380 180 — — — —
Gallbladder disease 1088 303 145 — — — —
Gynecological conditions 1896 292 125 — — — —
Kidney, other urinary disease 1198 80 31 — — — —
Other cardiovascular disease� 5149 1488 794 41 15 96 35
Sleep apnea 5761 1649 731 — — — —
Premature deaths — 134 62 22 10 — —
NOTE: Estimates are rounded for presentation and might not add to totals. Some comorbidity cases are jointly attributed to multiple risk factors.Consequently, total potential savings from eliminating all cases of excess weight, uncontrolled hypertension, and high cholesterol is less than the sum oftotal medical costs associated with each individual risk factor.
* Scenario assumes substitution of saturated fat calories with nonfat calories.� Category includes disease of pulmonary circulation, peripheral vascular disease, and other forms of heart disease.
416 American Journal of Health Promotion

eliminate approximately 30% of elevat-ed LDL-C cases and result in a potentialsavings of $4.3 billion.
DISCUSSION
The potential annual medical sav-ings from eliminating overweight andobesity is $169 billion, from eliminat-ing uncontrolled hypertension $84.2billion, and from eliminating elevatedLDL-C $21.5 billion. The expectedmedical cost savings benefit frommodest and aggressive dietary changealone was estimated at $58 billion and$111 billion for overweight/obesity(34% and 66% of the total nationalcost associated with excess weight),$2.3 billion and $5.5 billion for hyper-tension (2.7% and 6.5% of the totalnational cost associated with uncon-trolled hypertension), and $1.6 billionand $4.3 billion for elevated LDL-C(7.1% and 20% of the total nationalcost associated with high cholesterol).
Because of the interrelatedness ofrisk factors and conditions—for exam-ple, both obesity and hypertensionaffect heart disease—potential savings
from the combination of these dietaryinterventions is less than the sum ofthe individual savings that were mod-eled herein. That said, the sum of themodest and aggressive dietary inter-ventions totals $61.9 and $120.8 bil-lion, respectively, representing 3.4% to6.7% of the nation’s $1.8 trillion incurrent total health care expenditures.
Study LimitationsThis study attempted to reduce the
complex relationships between diet,clinical health measures, disease prev-alence, and health care use and costinto a manageable set of relationshipsthat can be quantified and analyzed toestimate the potential national benefitsof modest changes in diet. The pa-rameters for the Nutrition ImpactModel were based on authoritativepeer-reviewed studies and analysis ofwidely used national databases. Weidentified no studies in the literaturethat document changes in nationalmedical expenditures associated withdietary changes among the generalpopulation. Our model is based onstudies that show an association be-tween dietary change and change in
BMI, SBP/DBP, and LDL-C; studiesthat show an association between theseclinical measures and disease risk; andoriginal analysis that shows an associa-tion between disease presence andannual medical expenditures.
Although simulation models arepowerful tools for understandingcomplex sets of relationships and alsofor informing policy decisions, onemust understand the limitations ofmodeling and interpret the resultsaccordingly.
N This simulation model estimatespotential benefits by comparingestimates of current medical expen-ditures to hypothetical equilibri-ums. The model provides informa-tion on health and expendituresunder these different equilibriums,but does not tell us how long it willtake before these annual potentialsavings are realized.
N This modeled cost represents onlymedical expenses. This study ex-cludes intangible costs—e.g., nega-tive perception of appearance, painand suffering of people with chron-ic health problems, and reduced
Figure 1Potential Annual Medical Savings by Reducing Daily Caloric Intake
Note: Nutrition Impact Model simulation for the estimated 139 million overweight or obese adults in 2007.
July/August 2009, Vol. 23, No. 6 417

Figure 2Potential Annual Medical Savings by Reducing Daily Sodium Intake
Figure 3Potential Annual Medical Savings by Reducing Daily Saturated Fat Intake
Note: Nutrition Impact Model simulation for adults with uncontrolled hypertension and borderline hypertension in 2007.
Note: Nutrition Impact Model simulation for adults with LDL-C . 130 in 2007.
418 American Journal of Health Promotion
quality of life both for people withchronic conditions and for theirfamilies and friends. A companionarticle presents estimates of thenational productivity loss associatedwith obesity and hypertension, andof the potential for productivitygains through improved diet.43
N Parameter estimates from one studymight not be generalizable to pop-ulations different from the studypopulation.
N Because data used in the analysiscome from multiple sources, includ-ing original research and modelparameters obtained from the liter-ature, standard errors cannot becalculated for the cost/savings esti-mates. Consequently, we modelmultiple scenarios to show theimpact of key parameters (dailynutritional intake) and findingsfrom the literature. An extremescenario modeled—reducing caloricintake to the point that overweightand obesity are eliminated—providesan estimate of the current nationalcost of overweight and obesity. Theestimate is consistent with publishedestimates of the national cost ofobesity.
N Conservative assumptions were usedthroughout the analysis, so thereported potential benefits of im-proved diet are likely understated.For example, the estimate for un-controlled hypertension prevalencein this model is approximately halfthat of national estimates, whichtypically include individuals whoseblood pressure is under controlthrough the use of medication.44,45
Additionally, we modeled moremodest and presumably more feasi-ble sodium reductions than the 100-mmol (2300-mg) sodium reductiondescribed in the DASH study andthe Graudal review.23,24 Decreasing100 mmol from the average adults’dietary intake (NHANES 1999–2004average U.S. sodium intake foradults 19 and over is 3464 6
25 mg) would result in averagesodium intake of about only1164 mg/d.
N The saturated fat parameters usedin this model are based on clinicaltrials that isolate the impact ofreduced saturated fat intake hold-ing constant total daily intake of
calories. The LDL-C cost estimate isconservative because it excludes theimpact of reduced cholesterol ongeneral medical conditions not in-cluded in this study.44,46–50 Similarly,the estimated prevalence of elevatedLDL-C in this study is lower thannational estimates that include peo-ple whose LDL-C is below 160 butwho are taking cholesterol-loweringmedications.6
Policy and Research Implications
Although simulation modeling is notas rigorous as a well-designed clinicaltrial, there are several benefits to usingsimulation models in health research:(1) simulation modeling can combinethe best available information from themedical, public health, and economicliterature to model complex relation-ships that are more comprehensivethan those observed in individualstudies; (2) modeling the complete setof relationships allows one to betteridentify the major cost drivers; and (3)specific policies and recommendationscan be modeled, and the short-termand long-term implications better un-derstood. Perhaps of greatest value,such simulation modeling can providereliable estimates of long-term healthcare cost savings that are unlikely to beattainable through clinical trials, giventhe prohibitive costs and complexlogistics that such a national studywould require.
The dramatically greater impact ofreduced calorie intake, as comparedwith the impact of reduced intake ofsodium and saturated fats, identifiedhere is particularly noteworthy.Whereas the smallest reduction incalorie intake in our model, 100 kcal,could potentially produce annualcost savings of $58 billion, savingsfrom the largest and combined re-ductions for sodium (1100 mg) andfat (12 g) intake was only $9.8 bil-lion. At both the highest and thelowest change levels for all threenutrients, the economic impact ofreduced calorie intake was at least90% greater than that of reducedsodium and fat intake combined.These data should help guide futurepriorities for dietary recommenda-tions, namely, that a modest reduc-tion in calories (as little as 100 kcal
per day) results in the largest healthcare cost savings.
Areas for future research includeexploring the interaction of dietchange and exercise to improve
SO WHAT? Implications for Health
Promotion Practitioners
and Researchers
To our knowledge, this is the firstattempt to merge information froma number of robust databases thatwould generate reasonably accurateestimates of the medical savings thatwould accrue from modest reduc-tion of calories, sodium, and satu-rated fat in the American diet.Although reduced sodium and sat-urated fat intake are important, thedata presented here argue thatemphasis on a modest reduction indaily caloric intake has the highestpotential for improving health out-comes and reducing medical costs.If this assertion holds true, one keyimplication for practitioners, re-searchers, and policy makers is thatnutrition advice should emphasizesustained, modest caloric deficits foroverweight and obese Americans toachieve significant health benefits.
The health-promoting changesmodeled here can be achieved byimprovements in the dietary habitsof consumers and by changes in thenutritional content of food prod-ucts by suppliers and preparers.Making the case for improvingnutritional intake requires a com-parison of expected benefits toexpected costs. Examples of pecu-niary costs to improve nutritioninclude expenses to motivate, edu-cate, and enable consumers; ex-penses associated with environmen-tal changes to support dietarychange; and expenses for foodinnovation research to meet con-sumer demand. The intangible costassociated with improving nutri-tional intake is any perceived de-cline in consumer well-being byreducing consumption of calories,sodium, and saturated fats. Thisstudy seems to indicate that modestchanges in the nation’s diet havethe potential to reduce nationalmedical expenditures by tens ofbillions of dollars.
July/August 2009, Vol. 23, No. 6 419

health, modeling the potential short-term and long-term benefits of im-proved diet among children and ado-lescents, and modeling the potentialbenefits of other changes in diet—particularly those that would ensurethe adequate intake of a number ofnutritional factors thought to be linkedto disease prevention (e.g., daily intakeof fiber, calcium, antioxidants, vita-mins, and minerals). Longitudinalstudies are needed to better under-stand how quickly medical savings canbe achieved from improvements indiet.
Acknowledgments
The authors would like to acknowledge the contribution ofRobert P. Heaney, MD; David McCarron, MD; Gary Foster,PhD; and Robert Rubin, MD, who provided expert reviewand comment during development of the Nutrition ImpactModel and this manuscript. We would also like to thankMolly Reusser for her assistance in editing the manuscript.Funding for this study was provided by ConAgra Foods,Inc.
References
1. Allison DB, Zannolli R, Narayan KM. Thedirect health care costs of obesity in theUnited States. Am J Public Health.1999;89:1194–1199.
2. Anderson LH, Martinson BC, Crain AL, etal. Health care charges associated withphysical inactivity, overweight, and obesity.Prev Chronic Dis. 2005;2:A09.
3. Colditz GA. Economic costs of obesity andinactivity. Med Sci Sports Exerc. 1999;31(11suppl):S663–S667.
4. Finkelstein EA, Fiebelkorn IC, Wang G.National medical spending attributable tooverweight and obesity: how much, andwho’s paying? Health Aff (Millwood).2003;Suppl Web Exclusives:W3–W26.Available at: http://content.healthaffairs.org/cgi/reprint/hlthaff.w3.219v1.Accessed May 26, 2008.
5. Finkelstein EA, Ruhm CJ, Kosa KM.Economic causes and consequences ofobesity. Annu Rev Public Health.2005;26:239–257.
6. Mokdad AH, Ford ES, Bowman BA, et al.Prevalence of obesity, diabetes, andobesity-related health risk factors, 2001.JAMA. 2003;289:76–79.
7. Quesenberry CP, Caan B, Jacobson A.Obesity, health services use, and healthcare costs among members of a healthmaintenance organization. Arch Intern Med.1998;158:466–472.
8. Rosamond W, Flegal K, Friday G, et al.Heart disease and stroke statistics—2007update: a report from the American HeartAssociation Statistics Committee andStroke Statistics Subcommittee. Circulation.2007;115:e69–e171.
9. Rosamond W, Flegal K, Furie K, et al.Heart disease and stroke statistics—2008update: a report from the American HeartAssociation Statistics Committee and
Stroke Statistics Subcommittee. Circulation.2008;117:e25–e146.
10. Schmier JK, Jones ML, Halpern MT. Costof obesity in the workplace. Scand J WorkEnviron Health. 2006;32:5–11.
11. Thorpe KE, Florence CS, Howard DH,Joski P. The impact of obesity on risingmedical spending. Health Aff (Millwood).2004;Suppl Web Exclusives:W4–W6.Available at: http://content.healthaffairs.org/cgi/reprint/hlthaff.w4.480v1.Accessed May 26, 2008.
12. Wee CC, Phillips RS, Legedza AT, et al.Health care expenditures associated withoverweight and obesity among US adults:importance of age and race. Am J PublicHealth. 2005;95:159–165.
13. Wolf AM, Colditz GA. Current estimates ofthe economic cost of obesity in the UnitedStates. Obes Res. 1998;6:97–106.
14. Wyatt SB, Winters KP, Dubbert PM.Overweight and obesity: prevalence,consequences, and causes of a growingpublic health problem. Am J Med Sci.2006;331:166–174.
15. Zarraga IGE, Schwarz ERM. Impact ofdietary patterns and interventions oncardiovascular health. [review]. Circulation.2006;114:961–973.
16. Chobanian AV, Bakris GL, Black HR, et al.The seventh report of the Joint NationalCommittee on Prevention, Detection,Evaluation, and Treatment of High BloodPressure: the JNC 7 report. JAMA.2003;289:2560–2572.
17. Grundy SM, Cleeman JI, Merz CN, et al.Implications of recent clinical trials for theNational Cholesterol Education ProgramAdult Treatment Panel III Guidelines. J AmColl Cardiol. 2004;44:720–732.
18. Institute of Medicine. Energy. DietaryReference Intakes for Energy, Carbohydrate,Fiber, Fat, Fatty Acids, Cholesterol, Protein, andAmino Acids. Washington, DC: NationalAcademy Press; 2005:107–264.
19. The National Heart Lung and BloodInstitute, National Institute of Diabetesand Digestive and Kidney Diseases. Clinicalguidelines on the identification,evaluation, and treatment of overweightand obesity in adults. 1998;51S–209S,Available at: http://www nhlbi.nih gov/guidelines/obesity/ob_gdlns.htm.Accessed January 5, 2008.
20. Centers for Disease Control andPrevention (CDC), National Center forHealth Statistics (NCHS). National Healthand Nutrition Examination Survey Data.Hyattsville, Md: US Department of Healthand Human Services, Centers for DiseaseControl and Prevention, Public datasets1999–2000, 2001–2002, 2003–2004, and2005–2006, Available at: http://www.cdc.gov/nchs/nhanes.htm. Accessed May 26,2008.
21. National Cholesterol Education Program.Third report of the National CholesterolEducation Program (NCEP) Expert Panelon Detection, Evaluation, and Treatmentof High Blood Cholesterol in Adults(Adult Treatment Panel III) final report.Circulation. 2002;106:3143–3421.
22. Agency for Healthcare Research andQuality. The medical expenditure panelsurvey, Rockville, Md: US Department ofHealth and Human Services, Full yearconsolidated data file 2000, 2002, and2004. Available at: http://www.meps.ahrq.gov/mepsweb. Accessed May 26, 2008.
23. Graudal NA, Galloe AM, Garred P. Effectsof sodium restriction on blood pressure,renin, aldosterone, catecholamines,cholesterols, and triglyceride: a meta-analysis. JAMA. 1998;279:1383–1391.
24. Bray GA, Vollmer WM, Sacks FM, et al. Afurther subgroup analysis of the effects ofthe DASH diet and three dietary sodiumlevels on blood pressure: results of theDASH-Sodium Trial. Am J Cardiol.2004;94:222–227.
25. Dall T, Zhang Y, Chen YJ, et al. Costassociated with overweight and obesity,high alcohol consumption, and tobaccouse within the military health system’sTRICARE Prime enrolled population.Am J Health Promot. 2007;22:120–143.
26. Dattilo AM, Kris-Etherton PM. Effects ofweight reduction on blood lipids andlipoproteins: a meta-analysis. Am J ClinNutr. 1992;56:320–328.
27. MacMahon S, Cutler J, Brittain E, HigginsM. Obesity and hypertension:epidemiological and clinical issues. EurHeart J. 1987;8(suppl B):57–70.
28. Goldstein DJ. Beneficial health effects ofmodest weight loss. Int J Obes Relat MetabDisord. 1992;16:397–415.
29. Klein S, Burke LE, Bray GA, et al. Clinicalimplications of obesity with specific focuson cardiovascular disease: a statement forprofessionals from the American HeartAssociation Council on Nutrition, PhysicalActivity, and Metabolism: endorsed by theAmerican College of CardiologyFoundation. Circulation.2004;110:2952–2967.
30. Knowler WC, Barrett-Connor E, Fowler SE,et al. Reduction in the incidence of type 2diabetes with lifestyle intervention ormetformin. N Engl J Med.2002;346:393–403.
31. Wadden TA, Anderson DA, Foster GD.Two-year changes in lipids andlipoproteins associated with themaintenance of a 5% to 10% reduction ininitial weight: some findings and somequestions. Obes Res. 1999;7:170–178.
32. Pi-Sunyer X, Blackburn G, Brancati FL, etal. Reduction in weight and cardiovasculardisease risk factors in individuals with type2 diabetes: one-year results of the LookAHEAD trial. Diabetes Care.2007;30:1374–1383.
33. Neter JE, Stam BE, Kok FJ, et al. Influenceof weight reduction on blood pressure: ameta-analysis of randomized controlledtrials. Hypertension. 2003;42:878–884.
34. Poirier P, Giles TD, Bray GA, et al. Obesityand cardiovascular disease:pathophysiology, evaluation, and effect ofweight loss. Arterioscler Thromb Vasc Biol.2006;26:968–976.
35. Poobalan AS, Aucott LS, Smith WC, et al.Long-term weight loss effects on all causemortality in overweight/obese
420 American Journal of Health Promotion

populations. Obes Rev. 2007;8:503–513.
36. Simonsen MK, Hundrup YA, Obel EB, etal. Intentional weight loss and mortalityamong initially healthy men and women.Nutr Rev. 2008;66:375–386.
37. Day JC. Population Projections of the UnitedStates by Age, Sex, Race, and Hispanic Origin:1995 to 2050, US Bureau of the Census,Current Population Reports, P25-1130.Washington, DC: US Government PrintingOffice; 1996.
38. Schoeller DA, Ravussin E, Schutz Y, et al.Energy expenditure by doubly labeledwater: validation in humans and proposedcalculation. Am J Physiol.1986;250:R823–R830.
39. Lewington S, Clarke R, Qizilbash N, et al.Age-specific relevance of usual bloodpressure to vascular mortality: a meta-analysis of individual data for one millionadults in 61 prospective studies. Lancet.2002;360:1903–1913.
40. Law MR, Wald NJ, Rudnicka AR.Quantifying effect of statins on low densitylipoprotein cholesterol, ischaemic heartdisease, and stroke: systematic review andmeta-analysis. BMJ. 2003;326:1423.
41. Finkelstein EA, Fiebelkorn IC, Wang G.State-level estimates of annual medicalexpenditures attributable to obesity. ObesRes. 2004;12:18–24.
42. McMurray J. The health economics of thetreatment of hyperlipidemia andhypertension. Am J Hypertens.1999;12:99S–104S.
43. Dall T, Zhang Y, Fulgoni V, et al. Predictednational productivity implications ofcalorie and sodium reductions in theAmerican diet. Am J Health Promot.2009;23(6):423–430.
44. Muntner P, DeSalvo KB, Wildman RP, et al.Trends in the prevalence, awareness,treatment, and control of cardiovasculardisease risk factors amongnoninstitutionalized patients with ahistory of myocardial infarction and
stroke. Am J Epidemiol. 2006;163:913–920.
45. Wang TJ, Vasan RS. Epidemiology ofuncontrolled hypertension in theUnited States. Circulation. 2005;112:1651–1662.
46. Elliott WJ. The economic impact ofhypertension. J Clin Hypertens (Greenwich).2003;5(3 suppl 2):3–13.
47. Fischer MA, Avorn J. Economicimplications of evidence-based prescribingfor hypertension: can better care cost less?JAMA. 2004;291:1850–1856.
48. Degli EL, Valpiani G. Pharmacoeconomicburden of undertreating hypertension.Pharmacoeconomics. 2004;22:907–928.
49. Israili ZH, Hernandez-Hernandez R,Valasco M. The future of antihypertensivetreatment. Am J Ther. 2007;14:121–134.
50. Hodgson TA, Cai L. Medical careexpenditures for hypertension, itscomplications, and its comorbidities. MedCare. 2001;39:599–615.
July/August 2009, Vol. 23, No. 6 421
Appendix
Relative Risk for Comorbidity by Body Weight Status (Relative to Normal Weight)
Comorbidity ICD-9
Male Female
Overweight Obese IObese IIand III Overweight Obese I
Obese IIand III
Arthritis 71500, 71504, 71509–
71518, 71520–71528,
71530–71538, 71580,
71589–71598, V134
0.96 1.59 3.19 1.18 1.31 1.87
Asthma 493 1.20 1.50 2.00 1.20 1.50 2.00
Cancers
Breast cancer 174 (female) 1.34 1.63 1.82
Cancer of the corpus
and uterus
179, 1820–1828 (female) 1.50 2.53 3.52
Cervical cancer 180 (female) 1.38 1.23 3.20
Colorectal cancer 1530–1538 1.20 1.47 1.84 1.10 1.33 1.49
Esophageal cancer 150 1.15 1.28 1.63 1.15 1.28 1.63
Gallbladder cancer 156 1.34 1.76 1.76 1.12 2.13 2.13
Kidney cancer 189 1.18 1.36 1.7 1.33 1.66 2.55
Leukemia 204–208 1.14 1.37 1.7 1.14 1.37 1.70
Liver cancer 155 1.13 1.9 4.52 1.02 1.40 1.68
Multiple myeloma 203 1.18 1.44 1.71 1.12 1.47 1.47
Non-Hodgkin’s lymphoma 202 1.08 1.56 1.56 1.22 1.20 1.95
Ovarian cancer 183 (female) 1.15 1.16 1.51
Pancreatic cancer 157 1.43 1.76 1.76 1.22 1.70 1.70
Prostate cancer 185 (male) 1.08 1.20 1.34
Stomach cancer 151 1.01 1.20 1.94 1.01 1.20 1.20
Cerebrovascular diseases
Hemorrhagic stroke 430–432 1.20 1.30 1.40 1.40 1.90 1.90
Ischemic stroke 434–436 1.20 1.30 1.40 1.40 1.90 1.90
Other cerebrovascular
disease*
433, 437, 438 1.20 1.30 1.40 1.40 1.90 1.90
Congestive heart failure 39891, 4280, 4281, 42820–
42823, 42830, 42831–
42833, 42840–42843,
4289
1.24 2.04 2.04 1.09 2.00 2.00
Coronary heart disease 410, 411, 412, 413, 4141,
4148, 4292
1.59 3.3 3.37 3.07 4.78 5.68
Diabetes mellitus 250 1.34 1.97 2.65 2.27 3.04 6.29
Gallbladder diseases
Cholelithiasis 574 2.00 3.50 3.50 5.65 11.95 15.28
Gallstones and gallbladder
diseases
575, 56031 0.29 0.74 2.21 4.37 8.73 10.08
Gastroeshophageal reflux
disease
53081 1.35 1.53 1.65 1.35 1.53 1.65
Gynecological conditions
Gynecological abnormalities 6260, 6262, 6263, 6270 1.34 2.11 2.11
Infertility 606 (male), 628 (female) 1.83 2.46 2.46
Hypertension 401–405 1.01 2.16 2.50 1.80 2.49 2.74
Other heart disease 415–417, 420–427, 429, 443 1.71 6.94 6.94 1.71 6.94 6.94
Sleep apnea 78051, 78053, 78057 2.50 5.00 7.50 2.50 5.00 7.50
Urinary stress incontinence 78832 (male), 6256 (female),
78833 (mix)
1.12 1.12 1.79 1.12 1.12 1.79
NOTE: The full appendix is available from the authors upon request. Relative risk ratios are based on a meta-analysis and work by Dall et al.25
* The other cerebrovascular disease category was not modeled because prevalence information is unavailable from the Medical Expenditure PanelSurvey and the National Health and Nutrition Examination Survey.
422 American Journal of Health Promotion

A fusion of the best of science and the best of practice —
together, to produce the greatest impact.
Stay on top of the science and art of health promotion withyour own subscription to the American Journal ofHealth Promotion.
“ The American Journal of Health Promotion provides a forum for that rare commodity— practical and intellectual exchange between researchers and practitioners. ”
Kenneth E. Warner, PhDAvedis Donabedian Distinguished University Professor of Public HealthSchool of Public Health, University of Michigan
“ The contents of the American Journal of Health Promotion are timely, relevant, andmost important, written and reviewed by the most respected researchers in our field. ”
David R. Anderson, PhDVice Programs and Technology, StayWell Health Management
Definition of Health Promotion
“Health Promotion is the science and art of helping peoplechange their lifestyle to move toward a state of optimalhealth. Optimal health is defined as a balance of physical,emotional, social, spiritual and intellectual health. Lifestylechange can be facilitated through a combination of effortsto enhance awareness, change behavior and createenvironments that support good health practices. Of thethree, supportive environments will probably have thegreatest impact in producing lasting change.”
(O’Donnell, American Journal of Health Promotion, 1989, 3(3):5.)
DIMENSIONS OFOPTIMAL HEALTH
Subscribe today...ANNUAL SUBSCRIPTION RATES: (Good through 12/31/09)
Individual Institution
U.S. $99.95 $169.46
Canada and Mexico $108.95 $178.46
Other Countries $117.95 $187.46
CALL 800-783-9913 (U.S. ONLY) or 818-760-8520OR FIND US ON THE WEB AThttp://www.HealthPromotionJournal.com
Editor in Chief Michael P. O’Donnell, PhD, MBA, MPHAssociate Editors in Chief Jason E. Maddock, PhDDiane H. Morris, PhD, RDShirley A. Musich, PhDKerry J. Redican, MPH, PhD, CHES
SECTION EDITORSInterventionsFitness
Barry A. Franklin, PhDMedical Self-Care
Donald M. Vickery, MDNutrition
Karen Glanz, PhD, MPHSmoking Control
Michael P. Eriksen, ScDWeight Control
Kelly D. Brownell, PhDStress Management
Cary Cooper, CBEMind-Body Health
Kenneth R. Pelletier, PhD, MD (hc)Social Health
Kenneth R. McLeroy, PhDSpiritual Health
Larry S. Chapman, MPH
StrategiesBehavior Change
James F. Prochaska, PhDCulture Change
Daniel Stokols, PhDHealth Policy
Kenneth E. Warner, PhDPopulation Health
David R. Anderson, PhD
ApplicationsUnderserved Populations
Ronald L. Braithwaite, PhDHealth Promoting Community Design
Jo Anne L. Earp, ScDThe Art of Health Promotion
Larry S. Chapman, MPH
ResearchData Base
Troy Adams, PhDFinancial Analysis
Ron Z. Goetzel, PhDFrom Evidence-Based Practice to Practice-Based Evidence
Lawrence W. Green, DrPHQualitative Research
Marjorie MacDonald, BN, PhDMeasurement Issues
Shawna L. Mercer, MSc, PhD
ADfpSUB_09 9/11/08 11:16 AM Page 1