financial analysis: sizing up firm performancefaculty.baruch.cuny.edu/lwu/3000/chapter4.pdf · fin...
TRANSCRIPT

FIN 3000
Chapter 4
Financial Analysis
Liuren Wu
Overview
1. Why Do We Analyze Financial Statements
2. Common Size Statements – Standardizing Financial Information
3. Using Financial Ratios
4. Selecting a Performance Benchmark
5. The Limitations of Ratio Analysis
FIN3000, Liuren Wu2

Principles Used in this Chapter
Principle 1: Money has a Time Value. Financial statements typically ignore time value of money. Thus, financial
managers and accountants may view financial statements very differently.
Principle 2: There Is a Risk-Return Tradeoff. Financial statement analysis can yield important information about the
strengths and weaknesses of a firm’s financial condition. The analysts can use such information to infer the risk-return tradeoff in a firm.
Principle 3: Cash Flows Are the Source of Value. An important use of a firm’s financial statements involves analyzing past
performance as a tool for predicting future cash flows.
Principle 4: Market Prices Reflect Information. Financial statement analysis requires gathering information about a firm’s
financial condition, which is important to the valuation of the firm.
FIN3000, Liuren Wu3

Why Analyze Financial Statements?
An internal financial analysis might be done: To evaluate the performance of employees and determine their pay raises and bonuses.
To compare the financial performance of the firm’s different divisions.
To prepare financial projections, such as those associated with the launch of a new product.
To evaluate the firm’s financial performance in light of its competitors and determine how the firm might improve its operations.
A variety of firms and individuals that have an economic interest might also undertake an external financial analysis:
Banks and other lenders deciding whether to loan money to the firm.
Suppliers who are considering whether to grant credit to the firm.
Credit-rating agencies trying to determine the firm’s creditworthiness.
Professional analysts who work for investment companies considering investing in the firm or advising others about investing.
Individual investors deciding whether to invest in the firm.
FIN3000, Liuren Wu4
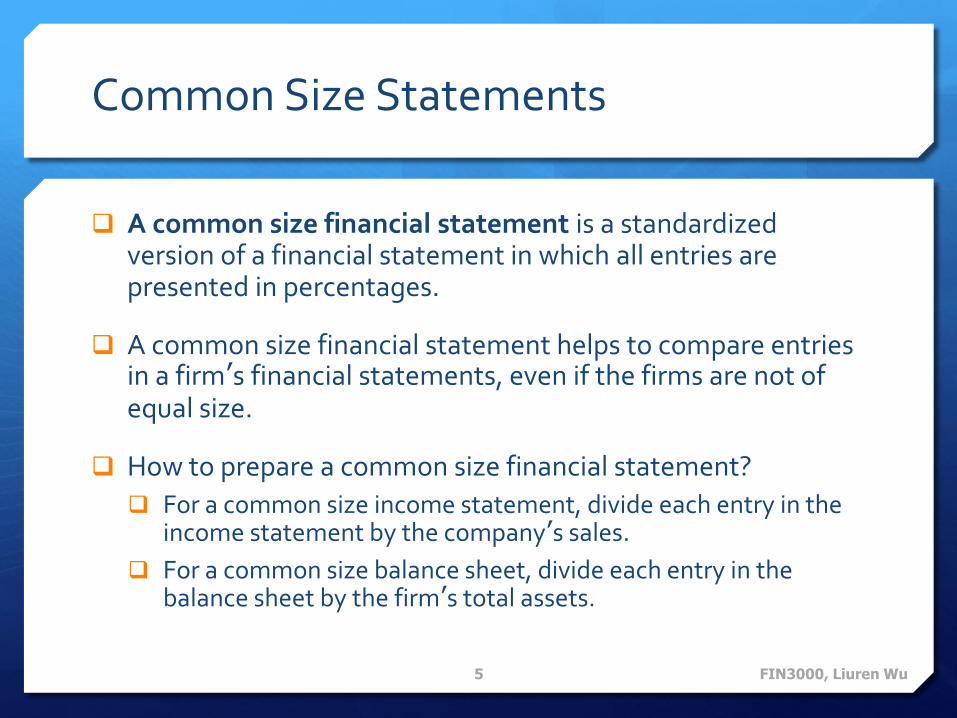
Common Size Statements
A common size financial statement is a standardized version of a financial statement in which all entries are presented in percentages.
A common size financial statement helps to compare entries in a firm’s financial statements, even if the firms are not of equal size.
How to prepare a common size financial statement?
For a common size income statement, divide each entry in the income statement by the company’s sales.
For a common size balance sheet, divide each entry in the balance sheet by the firm’s total assets.
FIN3000, Liuren Wu5

FIN3000, Liuren Wu6
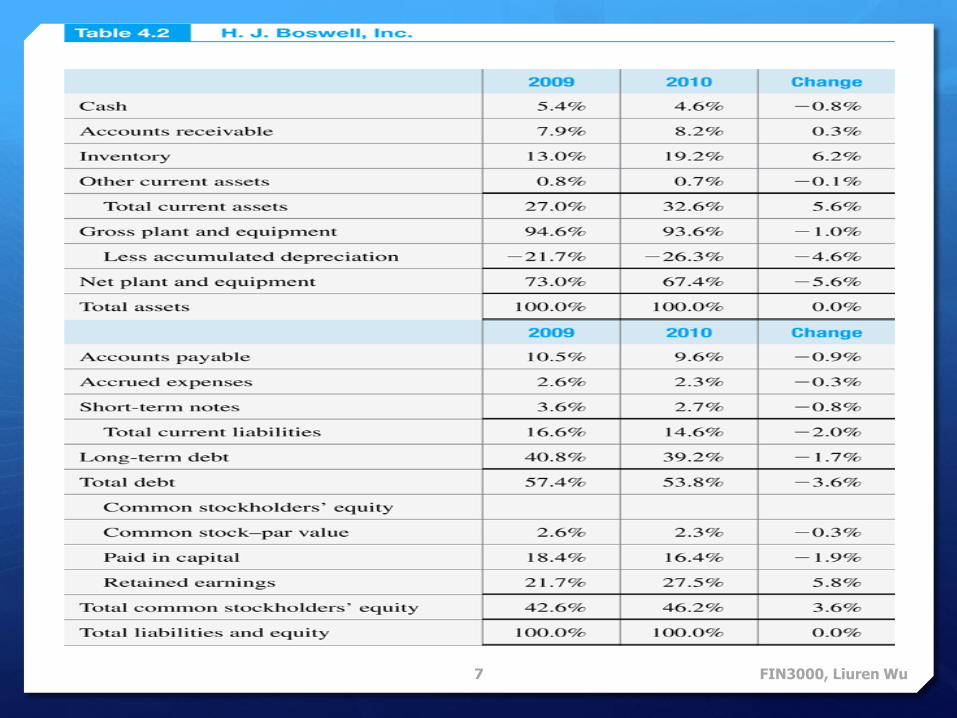
FIN3000, Liuren Wu7

Using Financial Ratios
Financial ratios provide a second method for standardizing the financial information on the income statement and balance sheet.
A ratio by itself may have no meaning. Hence, a given ratio is compared to: a) ratios from previous years – time series analysis; or
b) ratios of other firms in the same industry – cross-sectional analysis.
If the differences in the ratios are significant, more in-depth analysis must be done.
FIN3000, Liuren Wu8

Financial Ratios
Question Category of Ratios Used
1. How liquid is the firm? Will it be able to pay its bills as they become due?
Liquidity ratios
2. How has the firm financed the purchase of its assets?
Capital structure ratios
3. How efficient has the firm’s management been in utilizing it assets to generate sales?
Asset management efficiency ratios
4. Has the firm earned adequate returns on its investments?
Profitability ratios
5. Are the firm’s managers creating value for shareholders?
Market value ratios
FIN3000, Liuren Wu9

I. Liquidity Ratios
A firm is financially liquid if it is able to pay its bills on time. We can analyze a firm’s liquidity from two perspectives:① Overall or general firm liquidity: Comparing the firm’s current
assets to the firm’s current liabilities, e.g., [1] , [2] .
② Liquidity of specific current asset accounts: Examining how timely the firm’s primary liquid assets – accounts receivable and inventories – are converted into cash, e.g., [3]
, [4] , [5] , [6]
These ratios can all be computed from information on the balance sheet and the income statement
FIN3000, Liuren Wu10

[1]
Current Ratio: compares a firm’s current (liquid) assets to its current (short-term) liabilities.
Example: H.J. Boswell, Inc.
2009: $477.0/$292.5=1.63 times
2010: $643.5/$288.0=2.23 times
The firm had $1.63 in current assets for every $1 it owed in current liability. The current ratio improved in 2010 to 2.23 times as the current assets increased significantly in 2010.
FIN3000, Liuren Wu11

[2]
The overall liquidity of a firm is also analyzed by computing the Acid-Test (Quick) Ratio. This ratio excludes the inventory from current assets as inventory may not always be very liquid.
Example: H.J. Boswell, Inc.
2009: $(477.0-229.5)/$292.5=0.85
2010: $(643.5-378.0)/$288.0=0.92
The firm is clearly less liquid using quick ratio as the firm has only $0.85 in current assets (less inventory) to cover $1 in current liabilities. The quick ratio improved in 2010 to 0.92 times largely due to an increase in current assets.
FIN3000, Liuren Wu12
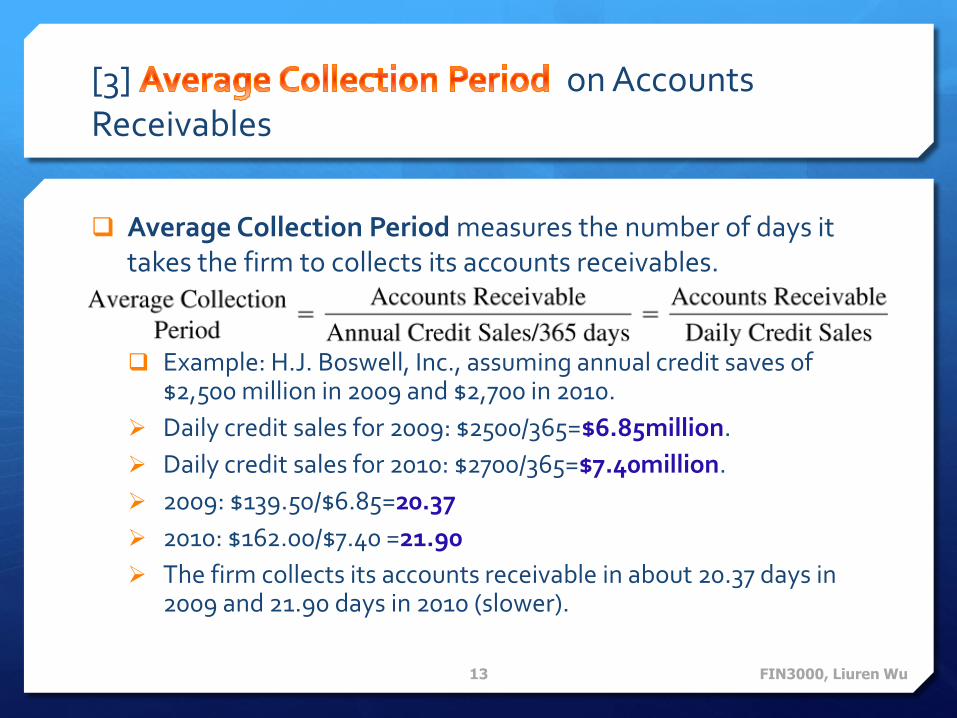
[3] on Accounts Receivables
Average Collection Period measures the number of days it takes the firm to collects its accounts receivables.
Example: H.J. Boswell, Inc., assuming annual credit saves of $2,500 million in 2009 and $2,700 in 2010.
Daily credit sales for 2009: $2500/365=$6.85million.
Daily credit sales for 2010: $2700/365=$7.40million.
2009: $139.50/$6.85=20.37
2010: $162.00/$7.40 =21.90
The firm collects its accounts receivable in about 20.37 days in 2009 and 21.90 days in 2010 (slower).
FIN3000, Liuren Wu13

[4]
Accounts Receivable Turnover Ratio measures how many times accounts receivable are “rolled over” during a year.
Example: H.J. Boswell, Inc., assuming annual credit saves of $2,500 million in 2009 and $2,700 in 2010.
2009: $2500/$139.50=17.92
2010: $2700/$162.00 =16.67
The firm’s accounts receivable turns over 17.92 times a year in 2009 and 16.67 times a year in 2010 (slower).
FIN3000, Liuren Wu14

[5]
Inventory turnover ratio measures how many times the company turns over its inventory during the year. Shorter inventory cycles lead to greater liquidity since the items in inventory are converted to cash more quickly.
Example: H.J. Boswell, Inc., assuming costs of goods sold in 2009=$1,980 million.
2009: $1980/$229.5=8.63
2010: $2025/$378.00 =5.36
The firm’s inventory turns over 8.63 times a year in 2009 and 5.36 times a year in 2010 (slower).
FIN3000, Liuren Wu15
[6]
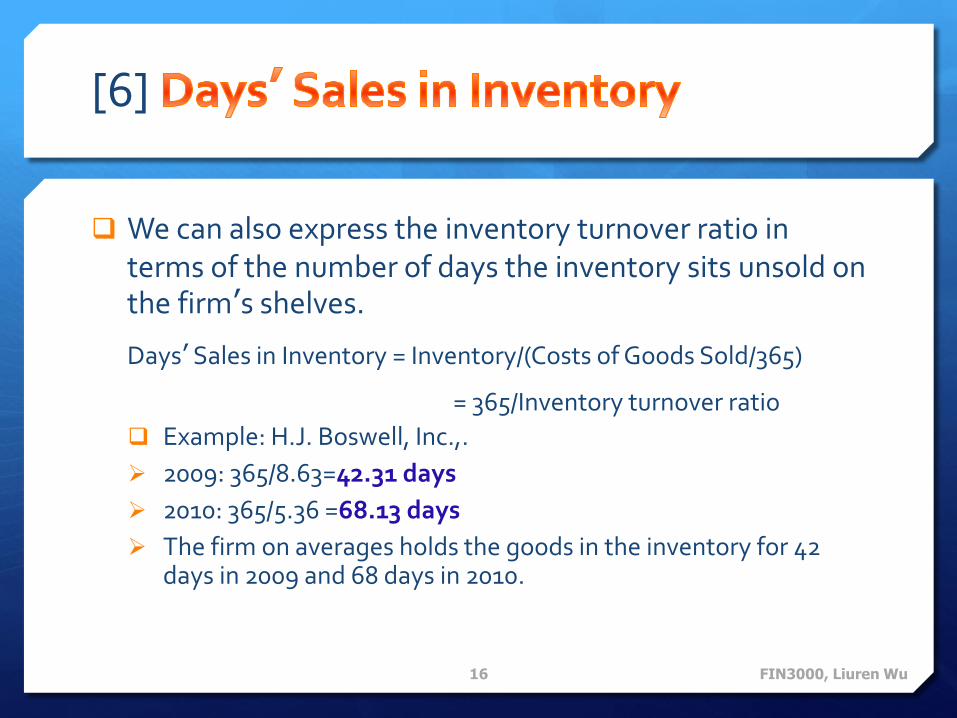
We can also express the inventory turnover ratio in terms of the number of days the inventory sits unsold on the firm’s shelves.
Days’ Sales in Inventory = Inventory/(Costs of Goods Sold/365)
= 365/Inventory turnover ratio
Example: H.J. Boswell, Inc.,.
2009: 365/8.63=42.31 days
2010: 365/5.36 =68.13 days
The firm on averages holds the goods in the inventory for 42 days in 2009 and 68 days in 2010.
FIN3000, Liuren Wu16
Can a Firm Have Too Much Liquidity?
A high investment in liquid assets will enable the firm to repay its current liabilities in a timely manner.
However, an excessive investments in liquid assets can prove to be costly as liquid assets (such as cash) generate minimal return.
FIN3000, Liuren Wu17
Checkpoint 4.1
Evaluating Dell Computer Corporation’s (DELL) Liquidity
You work for a small company that manufactures a new memory storage device. Computer giant Dell has offered to put the new device in their laptops if your firm will extend them credit terms that allow them 90 days to pay. Since your company does not have many cash resources, your boss has asked that you look into Dell’s liquidity and
analyze its ability to pay their bills on time using the following accounting information for Dell and two other computer firms (figures in thousands of dollars):
FIN3000, Liuren Wu18
Checkpoint 4.1
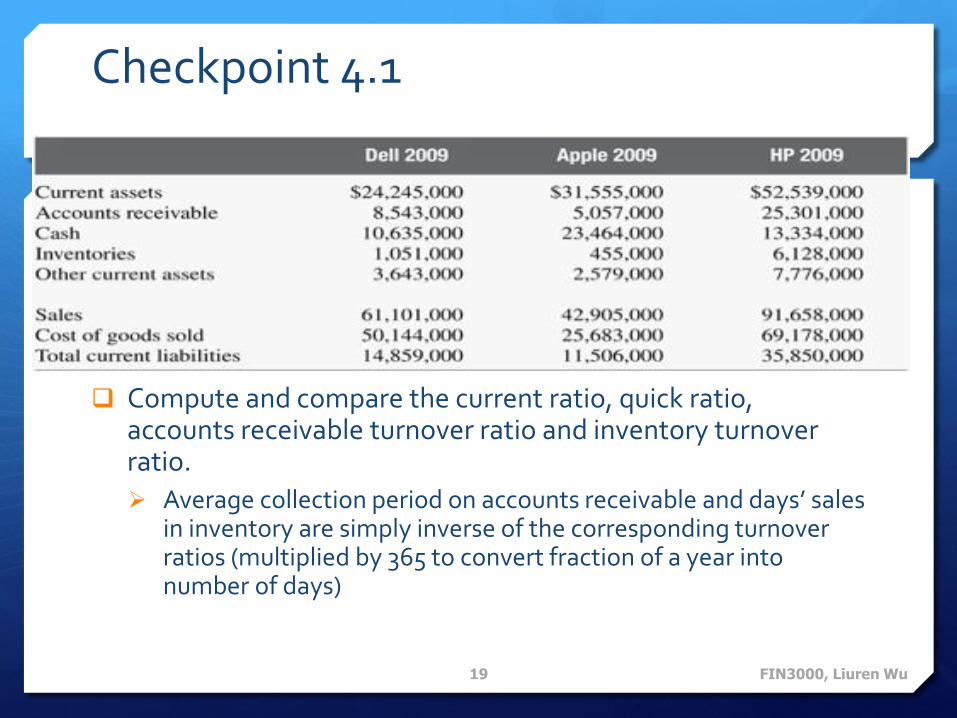
Compute and compare the current ratio, quick ratio, accounts receivable turnover ratio and inventory turnover ratio.
Average collection period on accounts receivable and days’ sales in inventory are simply inverse of the corresponding turnover ratios (multiplied by 365 to convert fraction of a year into number of days)
FIN3000, Liuren Wu19
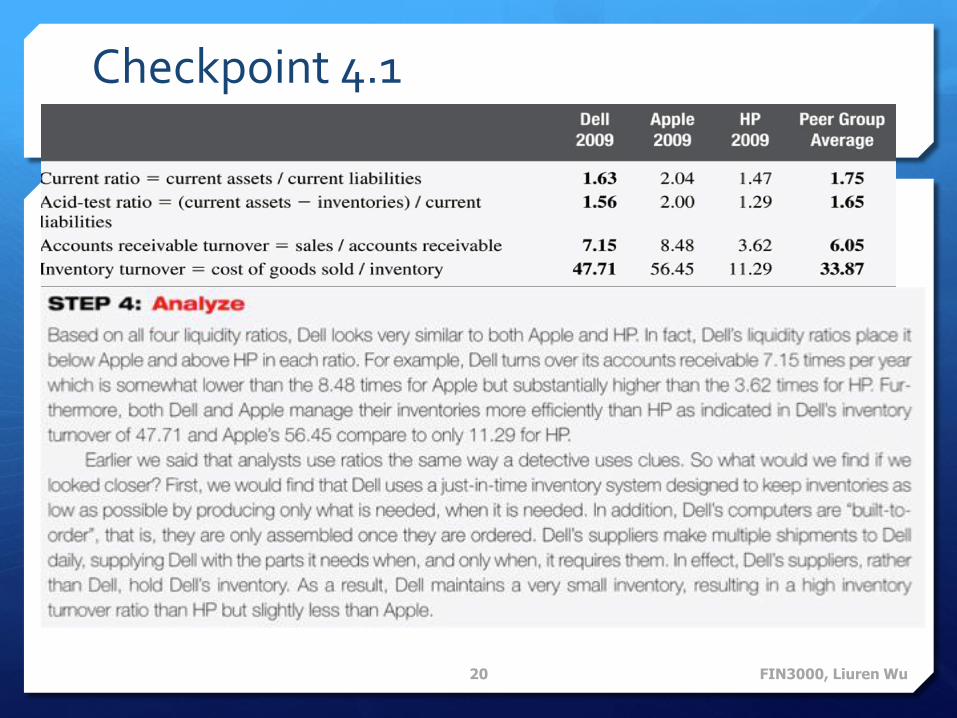
Checkpoint 4.1
FIN3000, Liuren Wu20
Checkpoint 4.1: Check Yourself
Calculate HP’s inventory turnover ratio and days’ sales in
inventory. Why do you think this ratio is so much lower than Dell’s inventory turnover ratio?
FIN3000, Liuren Wu21
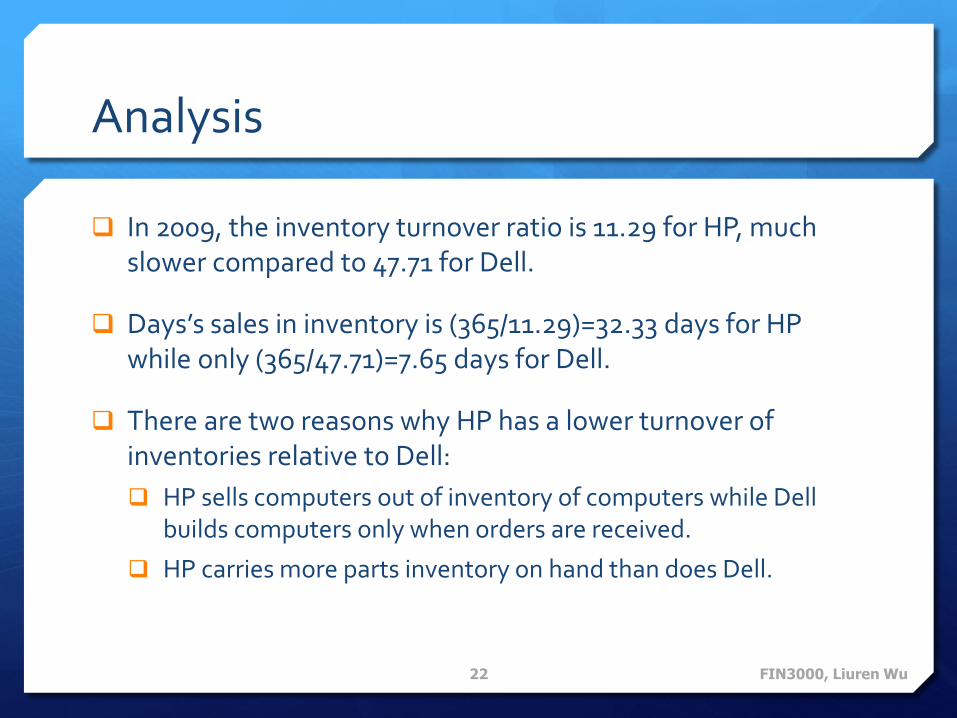
Analysis
In 2009, the inventory turnover ratio is 11.29 for HP, much slower compared to 47.71 for Dell.
Days’s sales in inventory is (365/11.29)=32.33 days for HP while only (365/47.71)=7.65 days for Dell.
There are two reasons why HP has a lower turnover of inventories relative to Dell:
HP sells computers out of inventory of computers while Dell builds computers only when orders are received.
HP carries more parts inventory on hand than does Dell.
FIN3000, Liuren Wu22
II. Capital Structure Ratios
Capital structure refers to the way a firm finances its assets.
Capital structure ratios address the important question: How has the firm financed the purchase of its assets?
We will use two ratios, [1] and [2] , to answer the question.
FIN3000, Liuren Wu23
[1]
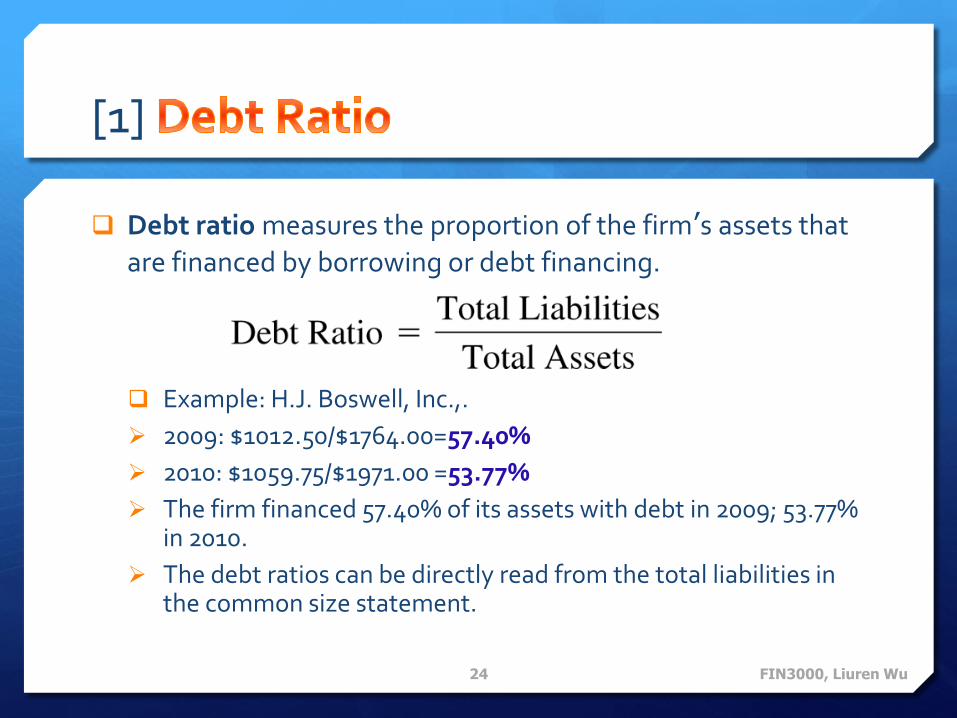
Debt ratio measures the proportion of the firm’s assets that
are financed by borrowing or debt financing.
Example: H.J. Boswell, Inc.,.
2009: $1012.50/$1764.00=57.40%
2010: $1059.75/$1971.00 =53.77%
The firm financed 57.40% of its assets with debt in 2009; 53.77% in 2010.
The debt ratios can be directly read from the total liabilities in the common size statement.
FIN3000, Liuren Wu24

[2]
Times Interest Earned Ratio (interest coverage ratio) measures the ability of the firm to service its debt or repay the interest on debt.
Example: H.J. Boswell, Inc.,.
2010: $382.50/$67.50 =5.67 times
The firm can pay its total interest expense 5.67 times or interest consumed 1/5.67th or 17.65% of its EBIT. Thus, even if the EBIT shrinks by 82.35% (100-17.65), the firm will still be able to pay its interest expense.
FIN3000, Liuren Wu25
Checkpoint 4.2
Comparing the Financing Decisions of Home Depot (HD) and Lowes Corporation (LOW)
You inherited a small sum of money from your grandparents and currently have it in a savings account at your local bank. After enrolling in your first finance class in business school you have decided that you would like to begin investing your money in the common stock of a few companies. The first investment you are considering is stock in either Home Depot or Lowes. Both firms operate chains of home improvement stores throughout the United States and other parts of the world.
In your finance class you learned that an important determinant of the risk of investing in a firm’s stock is driven by the firm’s capital structure, or how it has financed its assets.
In particular, the more money the firm borrows, the greater is the risk that the firm may become insolvent and bankrupt. Consequently, the first thing you want to do before investing in either company’s stock is to compare how they financed their investments.
Just how much debt financing have the two firms used?
FIN3000, Liuren Wu26
FIN3000, Liuren Wu27

FIN3000, Liuren Wu28

FIN3000, Liuren Wu29
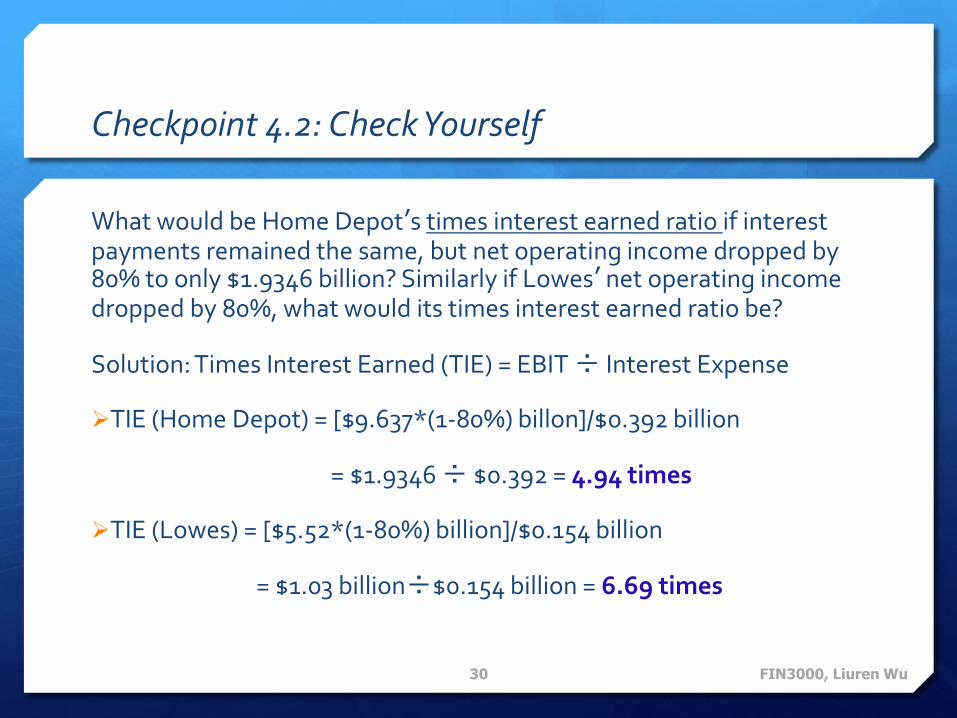
Checkpoint 4.2: Check Yourself
What would be Home Depot’s times interest earned ratio if interest payments remained the same, but net operating income dropped by 80% to only $1.9346 billion? Similarly if Lowes’ net operating income dropped by 80%, what would its times interest earned ratio be?
Solution: Times Interest Earned (TIE) = EBIT ÷ Interest Expense
TIE (Home Depot) = [$9.637*(1-80%) billon]/$0.392 billion
= $1.9346 ÷ $0.392 = 4.94 times
TIE (Lowes) = [$5.52*(1-80%) billion]/$0.154 billion
= $1.03 billion÷$0.154 billion = 6.69 times
FIN3000, Liuren Wu30
III. Asset Management Efficiency Ratios
Asset management efficiency ratios measure a firm’s
effectiveness in utilizing its assets to generate sales.
They are commonly referred to as turnover ratios as they reflect the number of times a particular asset account balance turns over during a year.
FIN3000, Liuren Wu31
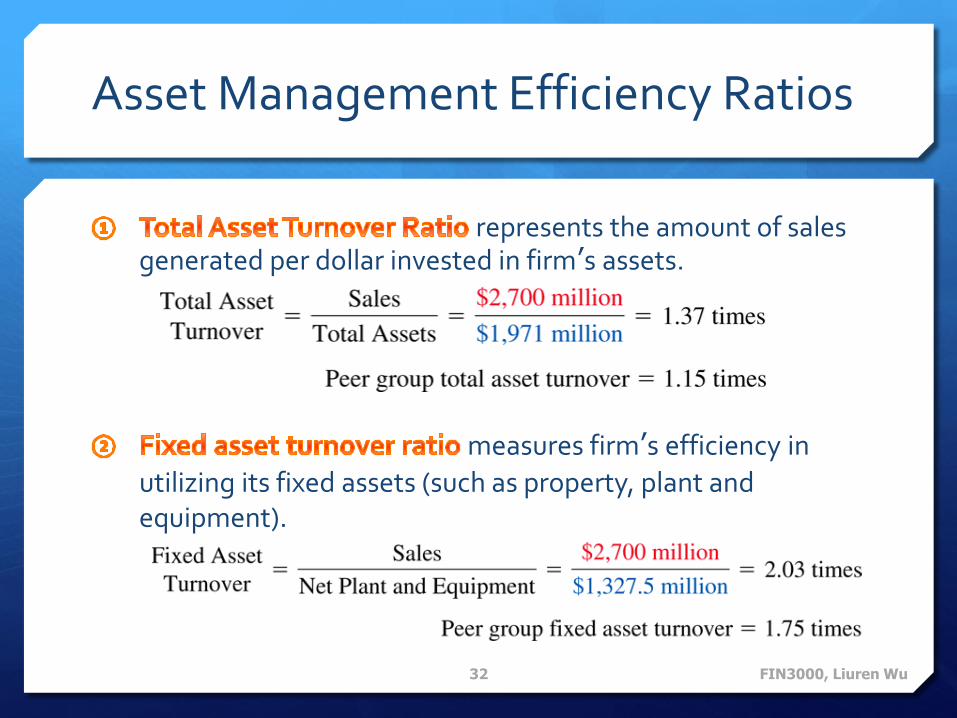
Asset Management Efficiency Ratios
represents the amount of sales generated per dollar invested in firm’s assets.
measures firm’s efficiency in
utilizing its fixed assets (such as property, plant and equipment).
FIN3000, Liuren Wu32
Asset Management Efficiency Ratios
We could similarly compute the turnover ratio for other assets.
We had earlier computed, similarly, the receivables turnover against credit sales and inventory turnover against costs of goods sold, which measure firm effectiveness in managing its investments in accounts receivables and inventories.
FIN3000, Liuren Wu33

Asset Management Efficiency Ratios for Boswell, Inc.
The following grid summarizes the efficiency of Boswell’s
management in utilizing its assets to generate sales in 2010.
FIN3000, Liuren Wu34
Turnover Ratio
Boswell Peer Group Assessment
Total Assets 1.37 1.15 Good
Fixed Assets
2.03 1.75 Good
Receivables 16.67 14.60 Good
Inventory 5.36 7.0 Poor

IV. Profitability Ratios
Profitability ratios address a very fundamental question: Has the firm earned adequate returns on its investments?
We answer this question by analyzing the firm’s profit margin, which predict the ability of the firm to control its expenses, and the firm’s rate of return on investments.
Two fundamental determinants of firm’s profitability and returns on investments are the following:
Cost Control
Is the firm controlling costs and earning reasonable profit margin?
Efficiency of asset utilization
Is the firm efficiently utilizing the assets to generate sales?
FIN3000, Liuren Wu35
[i] Profit margins
= Gross profits/Sales. It shows how well the firm’s management controls its expenses to generate profits.
=Operating income (EBIT)/Sales. It measures how much profit is generated from each dollar of sales after accounting for both costs of goods sold and operating expenses. It thus also indicates how well the firm is managing its income statement.
=Net income/Sales. It measures how much income is generated from each dollar of sales after adjusting for all expenses (including income taxes).
They can be directly read from the common size income statement as gross profit, EBIT, and net income.
For Bosewell, they are 25%, 14.17%, and 7.58%, respectively.
FIN3000, Liuren Wu36
[ii] Returns on investments
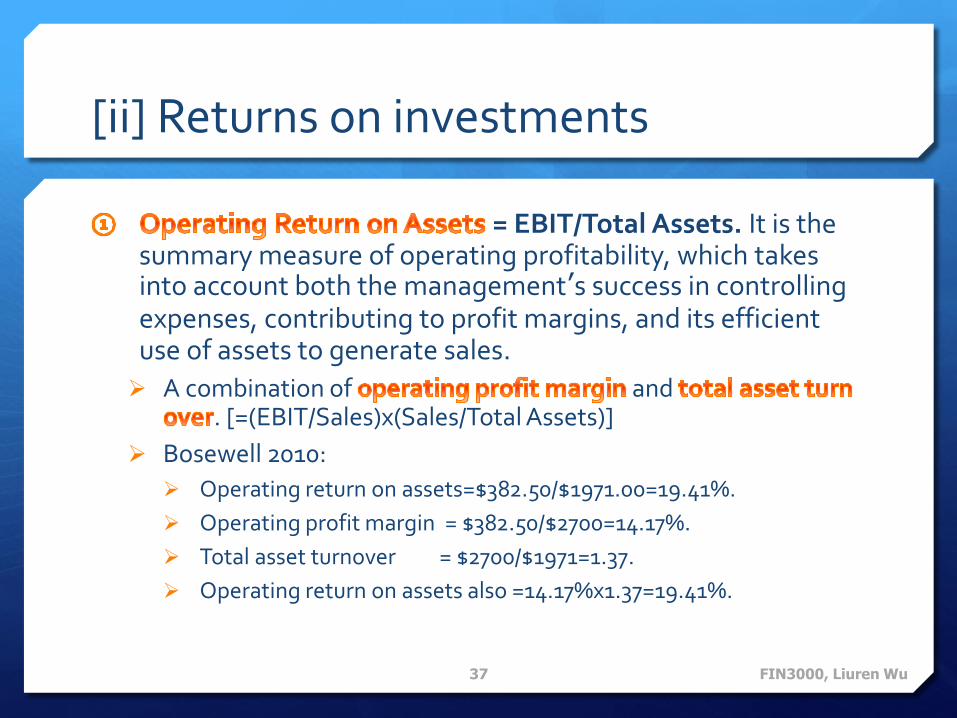
= EBIT/Total Assets. It is the summary measure of operating profitability, which takes into account both the management’s success in controlling expenses, contributing to profit margins, and its efficient use of assets to generate sales.
A combination of and . [=(EBIT/Sales)x(Sales/Total Assets)]
Bosewell 2010:
Operating return on assets=$382.50/$1971.00=19.41%.
Operating profit margin = $382.50/$2700=14.17%.
Total asset turnover = $2700/$1971=1.37.
Operating return on assets also =14.17%x1.37=19.41%.
FIN3000, Liuren Wu37
Return on the Owner’s Investment
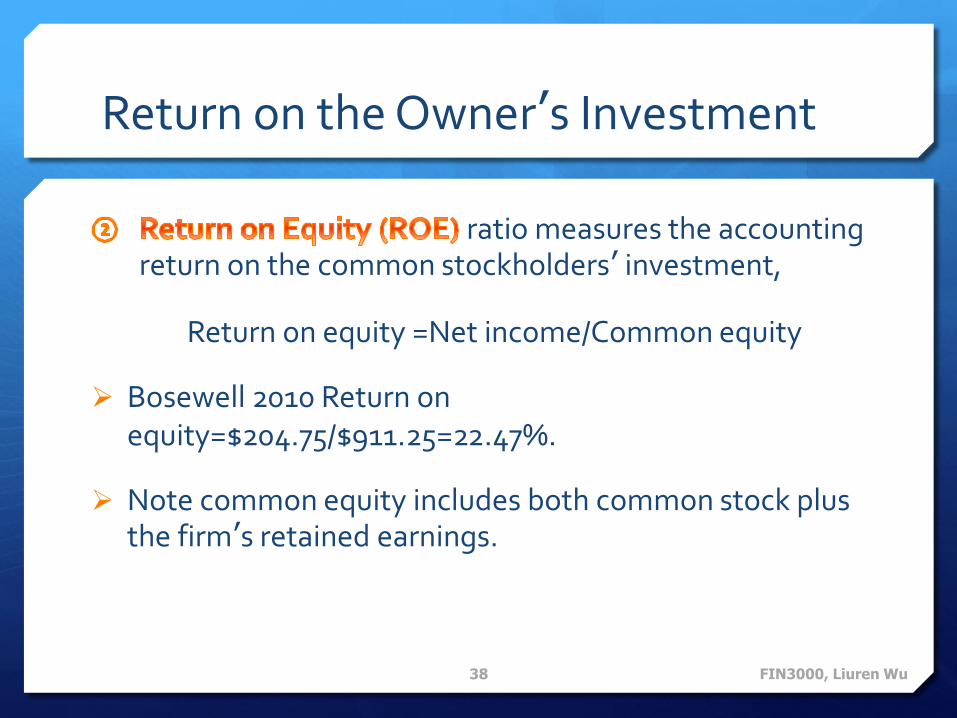
ratio measures the accounting return on the common stockholders’ investment,
Return on equity =Net income/Common equity
Bosewell 2010 Return on equity=$204.75/$911.25=22.47%.
Note common equity includes both common stock plus the firm’s retained earnings.
FIN3000, Liuren Wu38
Using the DuPont Method for Decomposing the ROE ratio
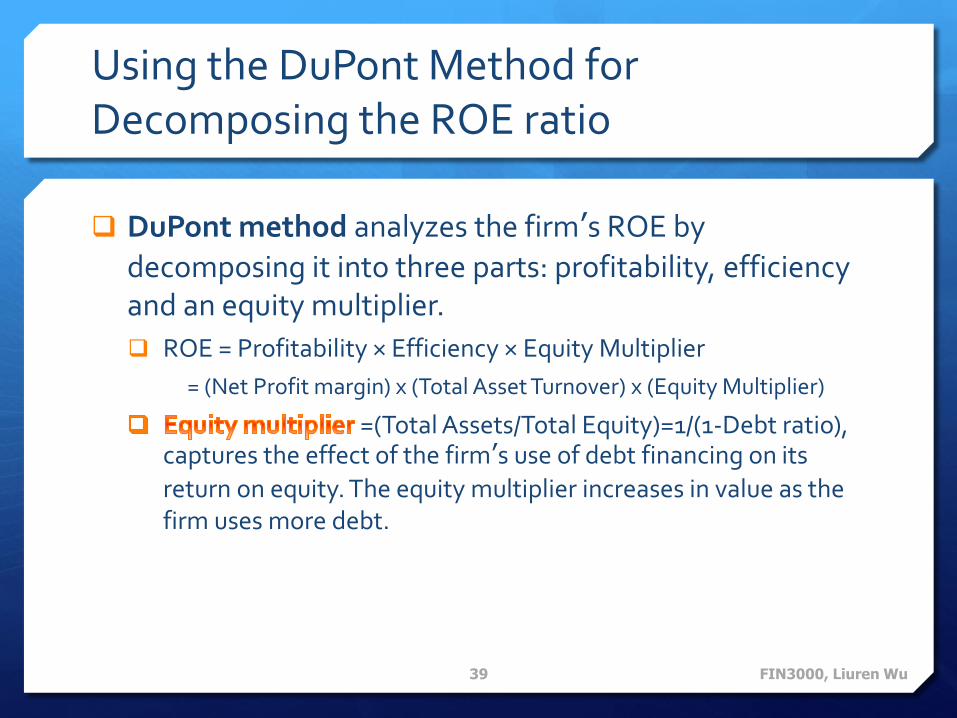
DuPont method analyzes the firm’s ROE by
decomposing it into three parts: profitability, efficiency and an equity multiplier.
ROE = Profitability × Efficiency × Equity Multiplier
= (Net Profit margin) x (Total Asset Turnover) x (Equity Multiplier)
=(Total Assets/Total Equity)=1/(1-Debt ratio), captures the effect of the firm’s use of debt financing on its
return on equity. The equity multiplier increases in value as the firm uses more debt.
FIN3000, Liuren Wu39

Decomposing Bosewell’s ROE
The following table shows why Boswell’s return on equity was higher than its peers.
The table suggests that Boswell had a higher ROE as it was able to generate more sales from its assets (1.37 versus 1.15 for peers) and used more leverage (2.16 versus 1.54).
FIN3000, Liuren Wu40
Return on Equity
Net Profit
Margin
Total Asset
Turnover
EquityMultiplier
H. J. Boswell, Inc.
22.5% 7.6% 1.37 2.16
Peer Group
18.0% 10.2% 1.15 1.54
Checkpoint 4.3
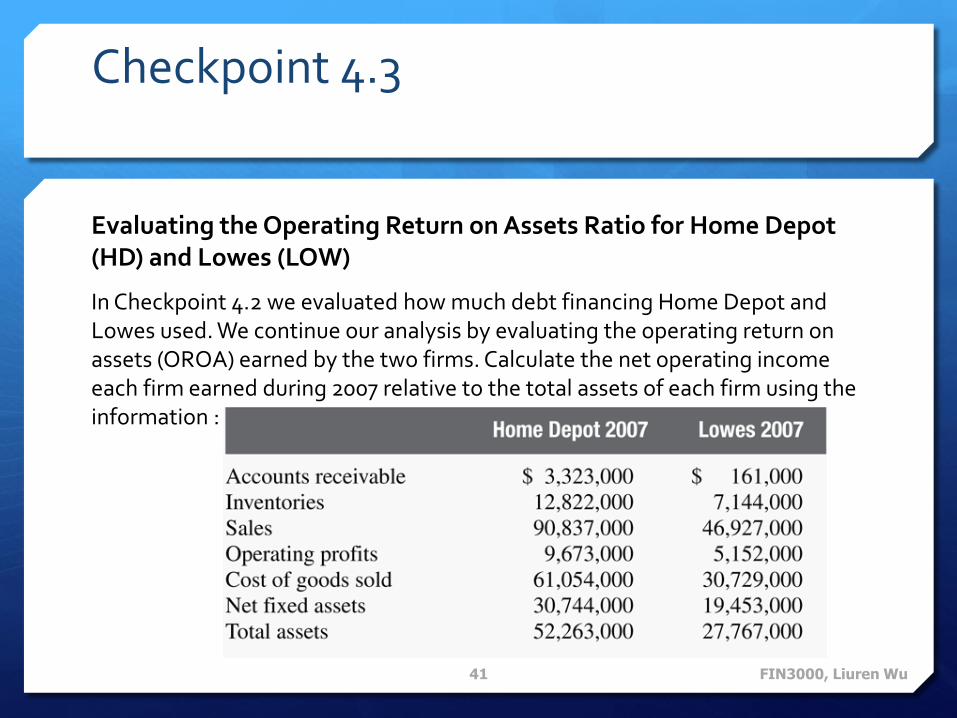
Evaluating the Operating Return on Assets Ratio for Home Depot (HD) and Lowes (LOW)
In Checkpoint 4.2 we evaluated how much debt financing Home Depot and Lowes used. We continue our analysis by evaluating the operating return on assets (OROA) earned by the two firms. Calculate the net operating income each firm earned during 2007 relative to the total assets of each firm using the information :
FIN3000, Liuren Wu41

FIN3000, Liuren Wu42

Checkpoint 4.3
FIN3000, Liuren Wu43
Checkpoint 4.3: Check Yourself
If Home Depot were able to raise its total asset turnover ratio to 2.5 while maintaining its current operating profit margin, what would happen to its operating return on assets?
FIN3000, Liuren Wu44
Solution
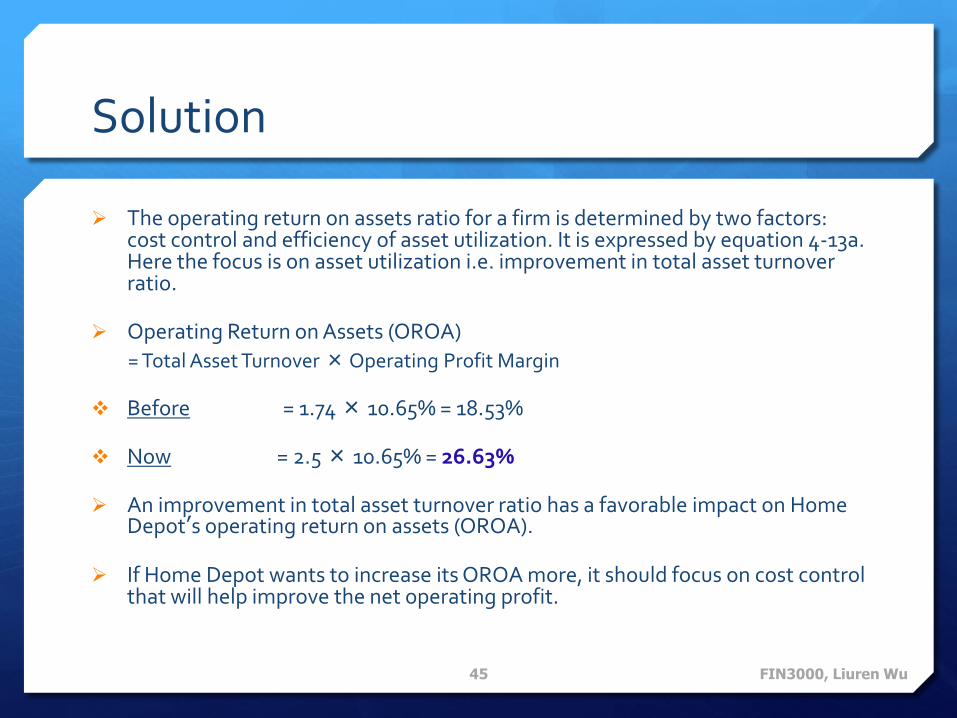
The operating return on assets ratio for a firm is determined by two factors: cost control and efficiency of asset utilization. It is expressed by equation 4-13a. Here the focus is on asset utilization i.e. improvement in total asset turnover ratio.
Operating Return on Assets (OROA)
= Total Asset Turnover ×Operating Profit Margin
Before = 1.74 × 10.65% = 18.53%
Now = 2.5 × 10.65% = 26.63%
An improvement in total asset turnover ratio has a favorable impact on Home Depot’s operating return on assets (OROA).
If Home Depot wants to increase its OROA more, it should focus on cost control that will help improve the net operating profit.
FIN3000, Liuren Wu45

V. Market Value Ratios
Market value ratios address the question, how are the firm’s
shares valued in the stock market?
=Market price per share/earnings per share, indicates how much investors are currently willing to pay for $1 of reported earnings.
=Market price per share/book value per share, measures the relation between the market value and the accumulated investment in the firm’s equity.
FIN3000, Liuren Wu46

Examples: Bosewell PE ratios
Bosewell 2010:
What will be the PE ratio for 2009 if we assume the firm’s stock was selling for $22 per share at a time when the firm reported a net income of $217.75 million, and the total number of common shares outstanding are 90 million? Earnings per hare (EPS)= $217.75 million ÷ 90 million = $2.42 PE ratio = $22 ÷ $2.42 = 9.09 The investors were willing to pay $9.09 for every dollar of earnings
per share that the firm generated.
FIN3000, Liuren Wu47
Bosewell market-to-book ratios
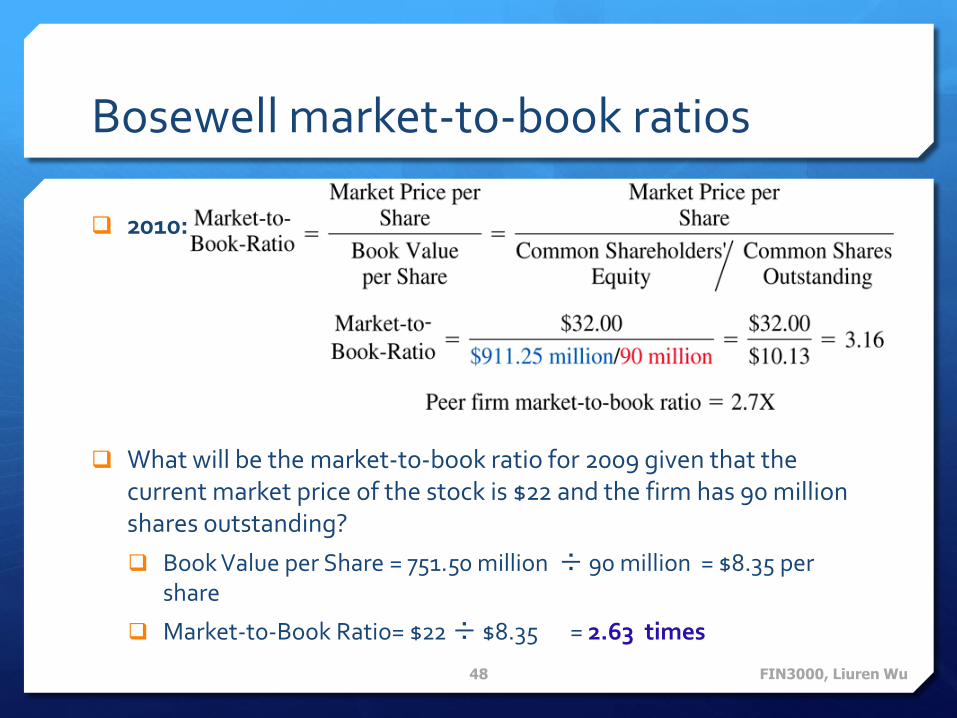
2010:
What will be the market-to-book ratio for 2009 given that the current market price of the stock is $22 and the firm has 90 million shares outstanding?
Book Value per Share = 751.50 million ÷ 90 million = $8.35 per share
Market-to-Book Ratio= $22 ÷ $8.35 = 2.63 times
FIN3000, Liuren Wu48
Checkpoint 4.4
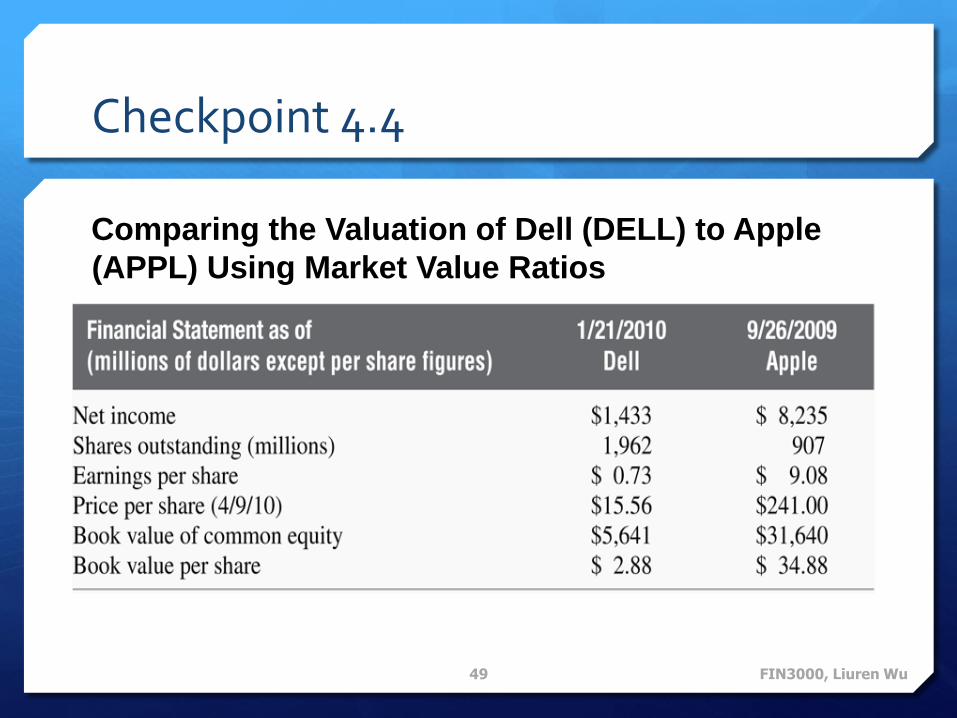
Comparing the Valuation of Dell (DELL) to Apple
(APPL) Using Market Value Ratios
The following information on Dell and Apple was gathered on April 9,
2010:
FIN3000, Liuren Wu49

Checkpoint 4.4
FIN3000, Liuren Wu50
Checkpoint 4.4: Check Yourself
What price per share for Dell would it take to increase the firm’s price-to-earnings ratio to the level of Apple?
FIN3000, Liuren Wu51

Step 2: Decide on a Solution Strategy
PE=Price/EPS Price=PE x EPS
Let PE=26.54 (Apple). EPS=0.73.
Price=26.53x0.73=19.47.
The price for Dell has to increase from 15.56 to 19.47 to match Apple’s PE ratio for the same earnings per share.
FIN3000, Liuren Wu52

Summing up the Financial Analysis of Boswell
Liquidity: With the exception of inventory turnover ratio, liquidity ratios were adequate to good. The next step will be to see how inventory management can be improved.
Financial Leverage: The firm uses more debt than its peers, which exposes the firm to a higher degree of financial risk or potential default on its debt in the future.
Profitability: H.J. Boswell had favorable net operating income despite lower profit margins, largely due to its higher asset turnover ratio. The return on equity was also higher than the peer group due to use of more debt.
Market Value Ratios: These ratios suggest that the market is pleased with the firm as indicated by higher stock valuations.
FIN3000, Liuren Wu53
Selecting a Performance Benchmark
There are two types of benchmarks that are commonly used:
1. Trend Analysis – involves comparing a firm’s financial
statements over time (time series analysis).
2. Peer Group Comparisons – involves comparing the subject firm’s financial statements with those of similar, or “peer”
firms. The benchmark for peer groups typically consists of firms from the same industry or industry average financial ratios. (Cross-sectional analysis).
FIN3000, Liuren Wu54
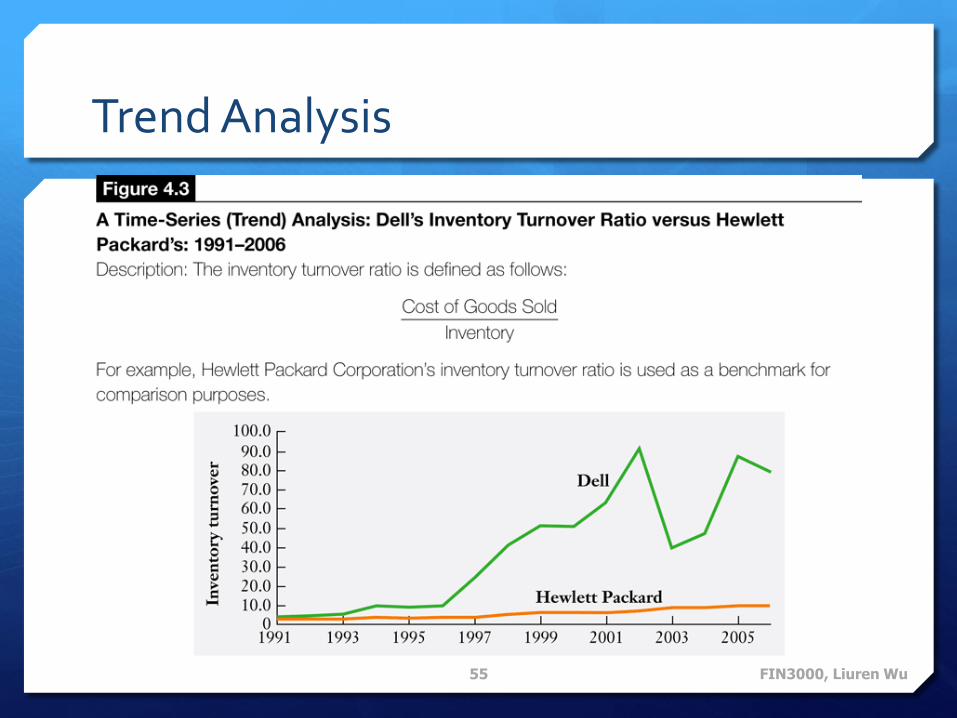
Trend Analysis
FIN3000, Liuren Wu55
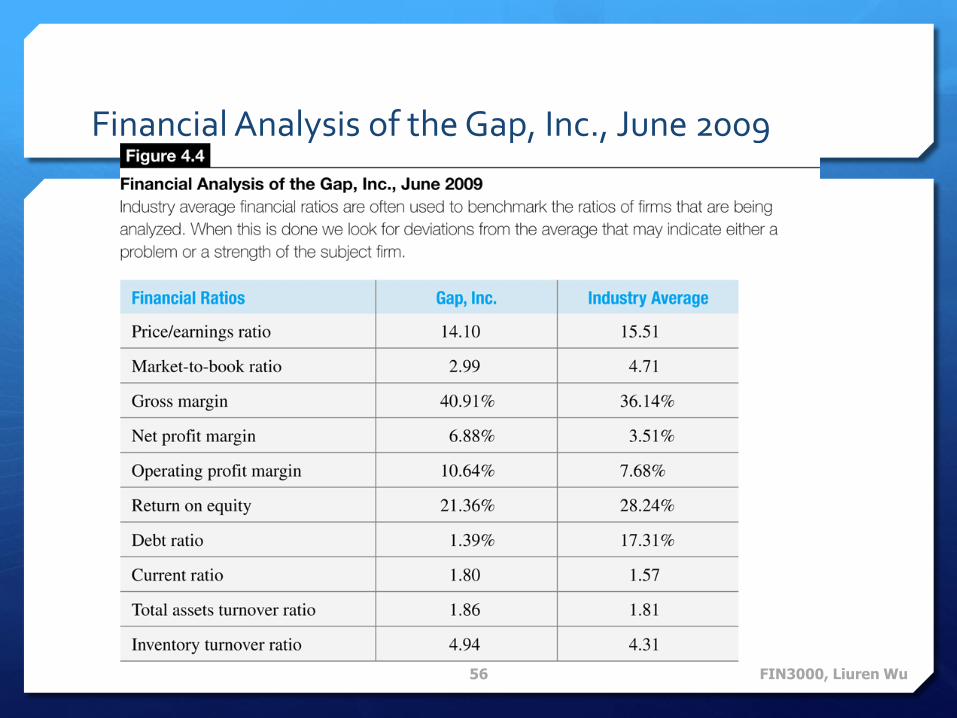
Financial Analysis of the Gap, Inc., June 2009
FIN3000, Liuren Wu56
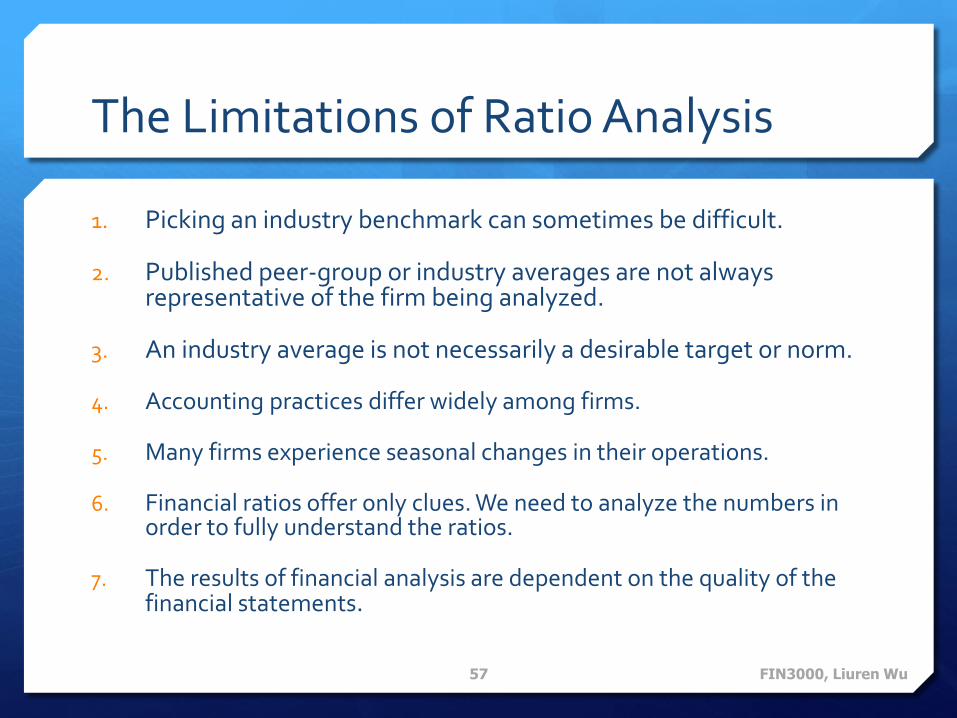
The Limitations of Ratio Analysis
1. Picking an industry benchmark can sometimes be difficult.
2. Published peer-group or industry averages are not always representative of the firm being analyzed.
3. An industry average is not necessarily a desirable target or norm.
4. Accounting practices differ widely among firms.
5. Many firms experience seasonal changes in their operations.
6. Financial ratios offer only clues. We need to analyze the numbers in order to fully understand the ratios.
7. The results of financial analysis are dependent on the quality of the financial statements.
FIN3000, Liuren Wu57
FIN3000, Liuren Wu58
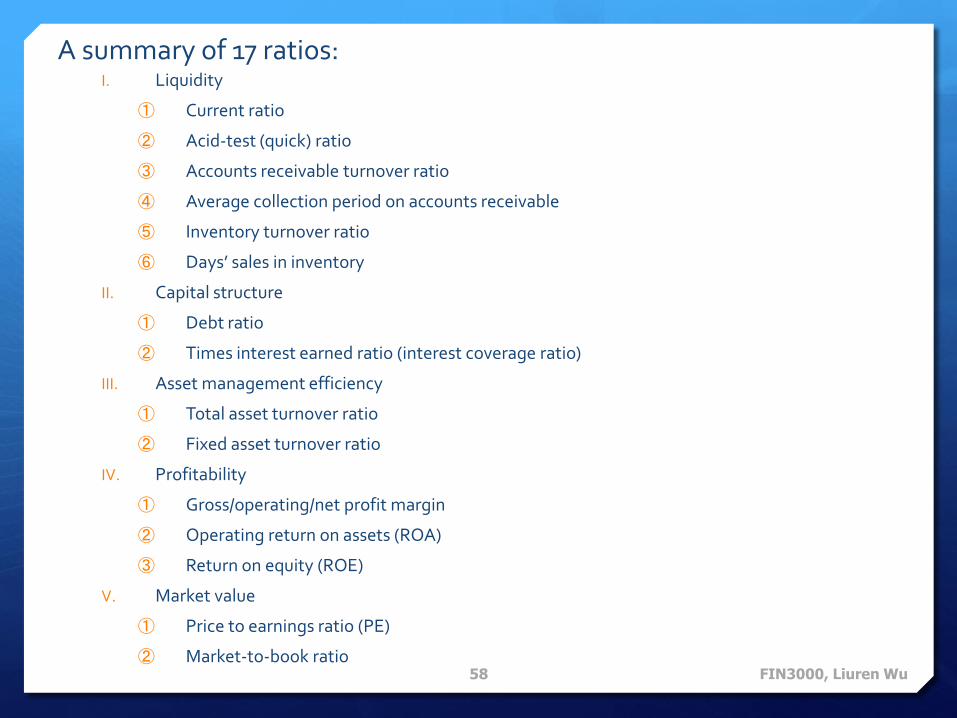
A summary of 17 ratios:I. Liquidity
① Current ratio
② Acid-test (quick) ratio
③ Accounts receivable turnover ratio
④ Average collection period on accounts receivable
⑤ Inventory turnover ratio
⑥ Days’ sales in inventory
II. Capital structure
① Debt ratio
② Times interest earned ratio (interest coverage ratio)
III. Asset management efficiency
① Total asset turnover ratio
② Fixed asset turnover ratio
IV. Profitability
① Gross/operating/net profit margin
② Operating return on assets (ROA)
③ Return on equity (ROE)
V. Market value
① Price to earnings ratio (PE)
② Market-to-book ratio