financial analysis thomas sabo vs pandora
TRANSCRIPT

1
Marie SANCHIS
Fashion Marketing and retailing Year 3
The 28th of March
Retail management With Finance
VS
Financial Analysis
Catriona Foxworthy-Bowers

2
Table of Content
Introduction
I. Thomas Sabo’s Financial Statement 2009/2010
II. Thomas Sabo’s Ratios
III. Thomas Sabo’s Financial Analysis
IV. Comparison Competitor
A) Pandora‟ s Financial statement 2011/2012
B) Pandora‟s Ratios
C) Comparison Competitor Analysis
Conclusion

3
Introduction After the intervention of Catriona Foxworthy-Bowers during two weeks for
the retail management with finance course. We are able to make a financial
analysis of different companies refer to their accounts. In the first part we
will present the financial analysis of Thomas Sabo „the concept of customize
your own jewelry”, one of the most important charms jewels seller in the
world. This is a German concept where the customer has to choose a simple
bracelet or necklace and add his prefer “charms” to the base.
For the comparison to a competitor in the second part we chose Pandora
who have approximately the same concept but in different form, a form of
pearl that you add to the base.
This analysis will be based on the study of ratios of these two companies.
This financial analysis will be useful to compare currant‟s year‟s
performances with the previous years in a company. Also that could help to
find how to improve the company competence in the future.
In a second way the comparison could be interesting to compare
performance of the business with other organization in the same activities
with Thomas Sabo biggest competitor.

4
I. Thomas Sabo’s Financial Statement

5

6
II. Thomas Sabo’s Ratios :
Gross profit percentage
Mark-up ratio
Net Profit Percentage
Current Ratio
Acid Test Ratio
Return on Capital employed
Inventory Turnover
2010 2009
Gross Profit
= 40.3%
= 33.8%
Mark up Ratio
= 67.5%
= 51%
Net Profit Percentage
= 17.4%
= 11.7%
Current Ratio
= 1.95
=1.76
Return on capital
employed
= 79%
= 66%

7
III. Thomas Sabo’s Financial Analysis:
After the reading of the financial statements and the calculating of the ratios,
we are able to make an analysis of the financial position on Thomas Sabo.
However this analysis will be based on the accountants of 2010 and 2009,
then there are not the most recently but the analysis still useful.
First of all the Gross profit is 40.3% of the sales in 2010 and 33.8% in 2009.
The gross Profit ratio represents the gross profit as a proportion of sales.
Higher is this percentage better it is for businesses.
This is a good increase (6.5%) who indicates that the sales grow up or the
cost fall. An increase in the percentage may also indicate a cheaper supplier
found or that Thomas Sabo is improved efficiency in the production process.
Then the Mark up ratio to measure percentage age added to cost of goods
sold to calculate selling price.
The mark up ratio put up between 2009 and 2010, from 51% to 67.5%, it
means that they made a better percentage of profit based on the cost of
goods sold. They marge on the product are better and they win more money
with this increase of 16.5%. Perhaps this increase could be justify like for
the gross profit ratio as an either cut of costs of production or an increase of
the selling price to customers.
The net profit of the company also increase of 5.7%. The net profit measure
profitability after consideration of all expenses (taxes, interest, …) In this
case, Thomas Sabo's‟ net profit is 17.4% in 2010 that is good because this
ratios increase and they win money after had sold their product. This is may
be because of a decrease of expenses compare to the last year.
The current ratio will be expected at 2:1, this ratio is uses to test the
company‟s liquidity and also its working capital position. In other words this
ratio measures the ability of a company to pay its current obligations using

8
current assets. Here the Thomas Sabo‟s ratio is 1.76 in 2009 and 1.96 in
2010 we see an increase of the ratio this is very good because Thomas Sabo
became closer to the ideal ratio. This means that the company has more
current assets than current liabilities. The company has more the ability of
generate cash from its receivables and by selling inventory than in 2009.
The last ratio is the return on capital employed; this is one of the most
important ratios if you want to know if you can invest in a company. It
measures the return on the money the investors have put into the company.
Again for this ratio Thomas Sabo getting better in 2010 with 79% compare to
66% in 2009. An increase of 13% who says how much profit we earn from
the investments the shareholders have made in their company.
To conclude this analysis, Thomas Sabo gets better in 2010 than in 2009,
they have to continue in this way, take care of the production cost, the sell
prices, the marge they take, how long they wait to pay their suppliers and to
have their money back.
9
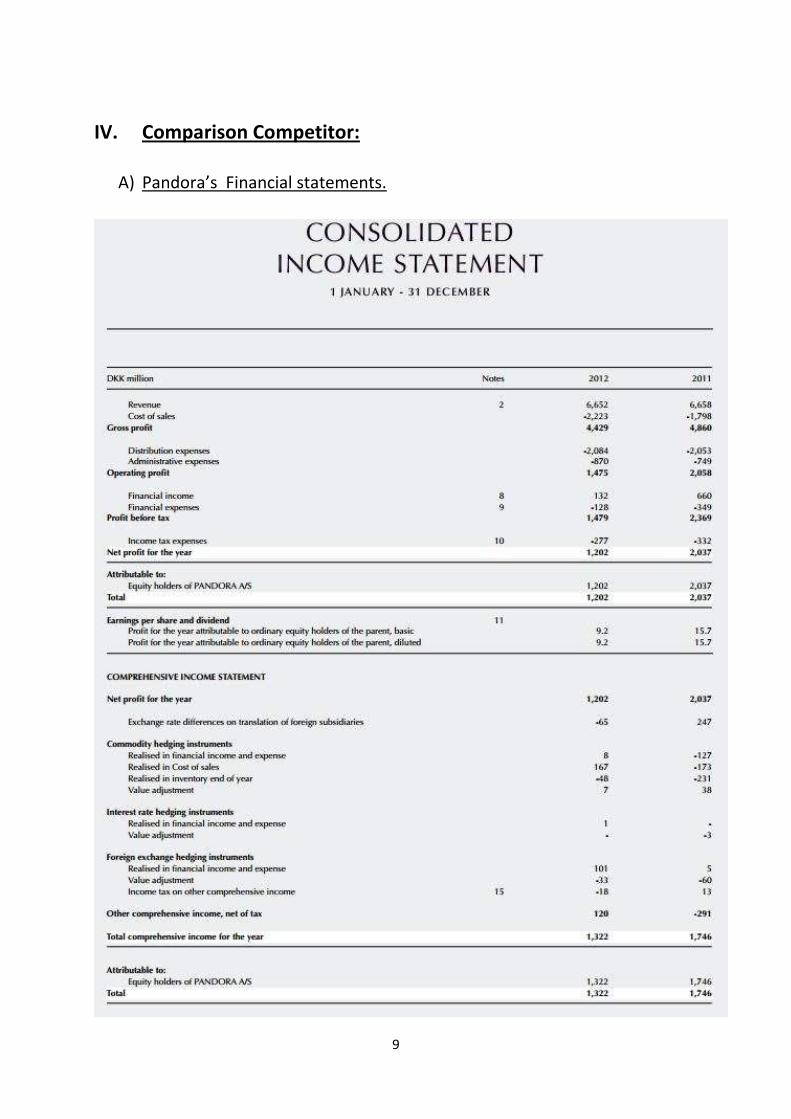
IV. Comparison Competitor:
A) Pandora’s Financial statements.

10

11

12
B) Pandora’s Ratios.
2012 2011
Gross Profit
= 66.6%
= 72.9%
Mark up Ratio
= 199.23%
= 270.3%
Net Profit Percentage
= 18%
= 30.5%
Current Ratio
=1.94
= 1.76
Acid Test Ratio
= 1.15
= 0.78
Return on capital employed
= 24.4%
= 43.8%
Inventory Turnover
= 216.4
= 326.6

13
C) Comparison Competitor analysis. After have made the Thomas Sabo accountants‟ analysis we are going to
compare Thomas Sabo to one of its most important competitor “Pandora”.
This company sells the same type of product, jewelers.
However we are going to compare the company but without the same year of
account 2009-2010 for Thomas Sabo and 2011-2012 for Pandora, we will
then don‟t forget the economy situation of the world these last few years and
say that perhaps Thomas Sabo and Pandora are not in prefect equality.
Nevertheless the comparison is still interesting to learn more about the
company‟s financial situations.
The first ratio considered is the Gross profit percentage, for Thomas Sabo
this percentage increase with the time but for Pandora it‟s a decrease of
13%. By the way Pandora has the best percentage with 66.6% in 2012 and
only 40.3% for Thomas Sabo in 2010. Pandora has a better management of
the production‟s cost or the best sell prices.
After the ratio noticed is the Mark up ratio with again a decrease in Pandora
and an increase in Thomas Sabo. That could say that there is a problem in
the selling price, Thomas Sabo has a better management of the prices than
Pandora.
The third ratio is the percentage of net profit. Pandora has always the same
problem with a big decrease and Thomas Sabo an increase however for this
ratio Pandora make more profit than Thomas Sabo. This shows how much
of each sales pound shows up as net income after all expenses are paid. In
the comparison here this means that Thomas Sabo has to take care of
manage their expenses. And Pandora is higher than Thomas Sabo in this
sector.
Then the current ratio, proof of company‟s liquidity, they both have
approximately the same with a general growth. They are both close to the

14
ideal ratio 2:1 because they have 1.95 and 1.94 for the most recent year.
This means that both have working capital it‟s really good but it could be a
disadvantage because they are very illiquid and would not be able to operate
under the conditions described. Its bills are coming due faster than its
generation of cash. They also can pay there bill in current assets.
To finish with the last ratio, the return on capital employed for Pandora fell
in 2012 with a decrease of 20% (43.8% in 2011 and 24.4% in 2012).
This ratio is now a little bit low (24.4%) the investment are not appropriate or
badly appropriate. For this sector Thomas Sabo is better with 79% in 2010
either an increase of 13%. With the condition of Pandora is doesn‟t give
confidence to the investors.
To conclude this analysis, Pandora has got the biggest decrease on the
margin ratios compare to Thomas Sabo, but they have better returns ratios
that perhaps mean that they want to take care of pay their bill or pay in
quickly to the detriment of their profit. In another hand, the data for
Pandora are more recent and with the economic crisis the Thomas Sabo ratio
don‟t fit well with the nowadays situation.
Conclusion
In conclusion we can see the importance of calculate the ratios based on the
company accounts and not only read the accounts. A financial analysis
would be really useful to reorganize a company, find different ways of
production or organization. Modify the company after analysis would be
optimizing the capacity of the company.