financial analytics model on valuation of companies
DESCRIPTION
Financial Data ModellingTRANSCRIPT

(Rs in Crs)
75.7 75.7 75.7263.74 266.83 281.19
0 0 00 0 0
339.44 342.53 356.89169.38 159.18 141.33
0.28 14.45 3.8169.66 173.63 145.13
0 1.49 1.45509.1 517.65 503.47
22.01 23.84 28.5112.89 14.09 15.62
0 0 09.12 9.75 12.89
0 0 00 1.48 0.04
277.25 258.35 258.35
60.81 65.61 74.27110.01 127.17 121.63
5.64 -0.92 -14.1456.35 4.1 2.85
232.81 195.96 184.61
8.99 9.8 23.851.37 0.11 0.2
10.36 9.91 24.05222.45 186.05 160.56
0 0 00.42 0.49 0.480.14 0.11 0.220.28 0.38 0.26
0 61.64 71.37509.1 517.65 503.4743.52 40.77 160.21
Industry :Diamond Cutting / Jewellery - Large
Year Mar 10 Mar 11 Mar 12 SOURCES OF FUNDS : Share Capital Reserves Total Equity Share Warrants Equity Application Money Total Shareholders Funds Secured Loans Unsecured Loans Total Debt Other Liabilities Total Liabilities APPLICATION OF FUNDS : Gross Block or Gross Fixed Assets Less : Accumulated Depreciation Less:Impairment of Assets Net Block Lease Adjustment Capital Work in Progress Investments Current Assets, Loans & Advances Inventories Sundry Debtors or A/cs Receivables Cash and Bank Loans and Advances Total Current Assets Less : Current Liabilities and Provisions Current Liabilities or A/cs Payable Provisions Total Current Liabilities Net Current Assets Miscellaneous Expenses not written off Deferred Tax Assets Deferred Tax Liability Net Deferred Tax Other Assets Total Assets Contingent Liabilities
http://www.capitaline.com

Mar-15 Mar-16 Mar-17 Mar-18 Mar-19
76.06 32.18 32.18 32.18 32.18 32.18 32.18298.72 345.26 411.37 490.44 555.52 649.59 776.37
0 0 0 0 0 0 00 0.04
374.78 377.44 443.55 522.62 587.70 681.77 808.55121.34 98.44
9.6 2.1130.94 100.54 75.22 87.59 98.11 69.50 104.82
1.27 1.25 1.23 1.23 1.22 1.15 1.1506.99 479.23 520.00 611.44 687.03 752.42 914.47
33.26 30.05 25.53 31.16 34.36 42.27 46.5917.81 20.27 22.08 23.92 26.05 28.54 31.43
0 015.45 9.78 3.45 7.24 8.31 13.73 15.16
0 00.03 0 0 0 0 0 0
214.94 212.28 200 210 220 230 240
87.42 92.14 65.30 81.63 102.03 127.54 159.4397.04 88.18 78.36 97.95 122.44 153.05 191.31
-40.35 -17.4 98.72 152.47 190.96 192.99 334.264.79 19.64 8.71 10.88 13.60 17.01 21.26
148.9 182.56 251.09 342.93 429.04 490.59 706.25
33.97 39.21 43.53 54.42 68.02 85.03 106.280.6 0.78 1.31 1.63 2.04 2.55 3.19
34.57 39.99 44.84 56.05 70.06 87.58 109.47114.33 142.57 206.25 286.88 358.97 403.01 596.78
0 00.63 0.69 0.69 0.69 0.75 0.49 0.710.47 0.66 0.63 0.49 0.38 0.23 0.310.16 0.03 0.06 0.2 0.37 0.26 0.4
162.08 114.57 110.24 107.12 99.37 105.42 62.13506.99 479.23 520.00 611.44 687.03 752.42 914.47171.51 61.35
Mar 13 Mar 14

(Rs in Crs)Mar-10 Mar-11 Mar-12
120.84 145.44 176.690 0 0
120.84 145.44 176.6910.1 15.73 14.47
-1.58 0.49 1.96129.36 161.66 193.12
112.33 131.09 165.3317.03 30.57 27.79
1.21 1.2 1.53EBIT 15.82 29.37 26.26
13.86 12.01 11.941.96 17.36 14.32
0 0.1 0.10 0 0
-0.18 -0.11 0.132.14 17.37 14.09
15.57 14.28 -0.27-13.43 3.09 14.36
0 -7.97 0-337.71 -335.57 -326.17
0 0 00 0 0
-335.57 -318.2 -312.080 0 00 0 00 0 0
0.68 5.48 4.44
93.2 98.79 106.05
Retained Earnings -13.43 3.09 14.36
Industry :Diamond Cutting / Jewellery - Large
Year INCOME : Sales Turnover Excise Duty Net Sales Other Income Stock Adjustments Total Income EXPENDITURE : Total Expenditure Operating Profit or EBITDA Depreciation
Interest Profit Before Tax / PBT Tax Fringe Benefit tax Deferred Tax Reported Net Profit Extraordinary Items Adjusted Net Profit Adjst. below Net Profit P & L Balance brought forward Statutory Appropriations Appropriations P & L Balance carried down Dividend Preference Dividend Equity Dividend % Earnings Per Share-Unit Curr Earnings Per Share(Adj)-Unit Curr Book Value-Unit Curr

Mar-13 Mar-14 Mar-15 Mar-16 Mar-17 Mar-18
249.13 348.270 0
249.13 348.27 435.34 544.17 680.21 850.27191.73 85.26 85.26 93.99 26.62 59.25
1.78 0.56 0.56 0.00 0.00 0.00442.64 434.09 521.16 638.16 706.83 909.52
402.39 366.58 326.50 408.13 510.16 637.7040.25 67.51 194.65 230.03 196.67 271.82
2.19 2.46 1.81 1.84 2.13 2.4938.06 65.05 192.85 228.19 194.54 269.3311.66 11.75 7.91 7.33 8.36 7.5426.40 53.30 184.94 220.86 186.19 261.78-0.08 0 64.73 77.30 65.17 91.62
0 0 0.00 0.00 0.00 0.000.1 0.14 0.14 0.15 0.15 0.16
26.38 53.16 120.07 143.41 120.87 170.008.85 3.23 4.23 5.98 6.77 7.56
17.53 49.93 115.84 137.43 114.10 162.440 0
-312.08 -285.70 00 47.39
-285.7 -279.930 0 46.34 54.97 45.64 64.980 3.39 3.39 3.39 3.39 3.390 0 0.00 0.00 0.00 0.00
8.23 15.47
121.42 134.84
17.53 46.54 66.11 79.07 65.07 94.08

Mar-19
1062.8491.88
0.001154.72
797.13357.59
2.89354.70
7.84346.86121.40
0.000.17
225.298.34
216.95
86.783.390.00
126.78

2010 2011 2012 2013 2014Beg. Of year Debt 169.66 173.63 145.13 130.94Addition to debt 3.97 0.00 0.00 0.00Payment of debt 0 28.5 14.19 30.4End of year debt 169.66 173.63 145.13 130.94 100.54
Average debt 171.65 159.38 138.04 115.74
Interest rate 0.06997 0.074915 0.084471 0.101521Interest paid 13.86 12.01 11.94 11.66 11.75
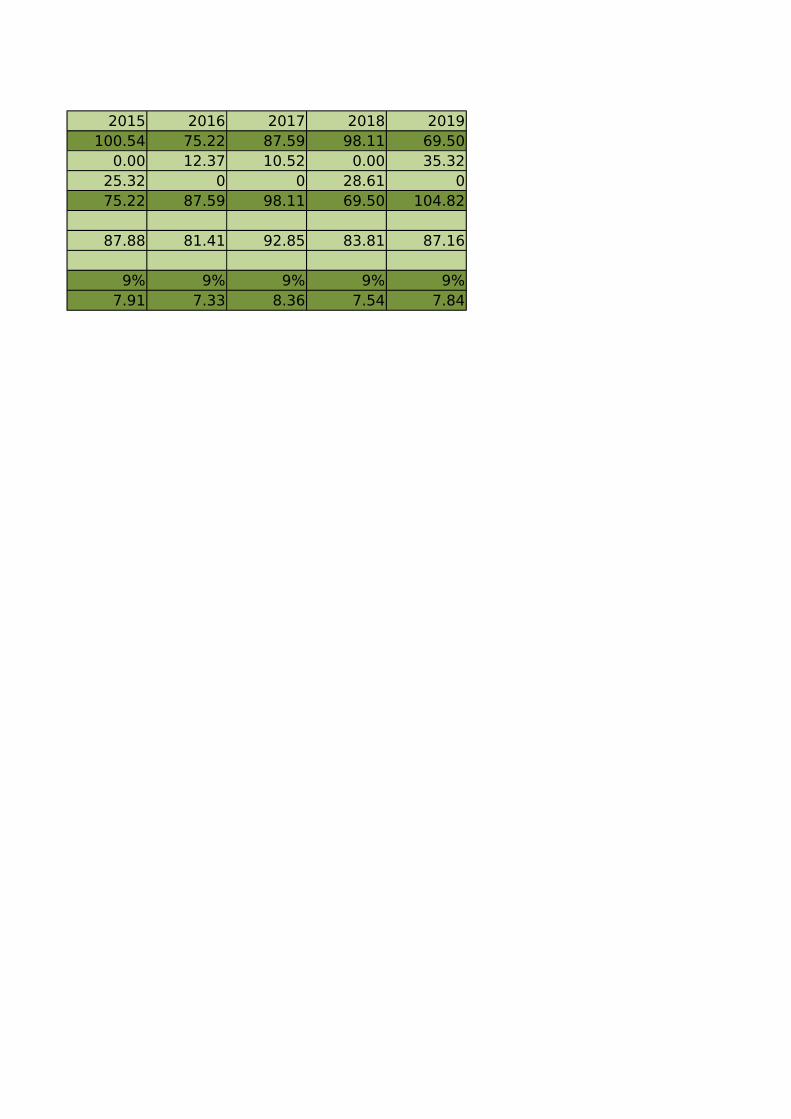
2015 2016 2017 2018 2019100.54 75.22 87.59 98.11 69.50
0.00 12.37 10.52 0.00 35.3225.32 0 0 28.61 075.22 87.59 98.11 69.50 104.82
87.88 81.41 92.85 83.81 87.16
9% 9% 9% 9% 9%7.91 7.33 8.36 7.54 7.84

Fixed Assets
2010 2011 2012 2013Beg. Of year Gross Fixed Assets 22.01 23.84 28.51Additions 1.83 4.67 4.75Assets sold/written off 0 0 0End of year Gross Fixed Assets 22.01 23.84 28.51 33.26
Average Gross Fixed Assets 22.93 26.18 30.89
Depreciation rate 0.052345 0.058453 0.070908Depreciation 1.21 1.2 1.53 2.19
Accumulated Depreciation 12.89 14.09 15.62 17.81

2014 2015 2016 2017 2018 201933.26 30.05 25.53 31.16 34.36 42.27
0 0 5.63 3.2 7.91 4.323.21 4.52 0 0 0 0
30.05 25.53 31.16 34.36 42.27 46.59
31.66 27.79 28.35 32.76 38.32 44.43
0.07771284 6.50% 6.50% 6.50% 6.50% 6.50%2.46 1.81 1.84 2.13 2.49 2.89
20.27 22.08 23.92 26.05 28.54 31.43
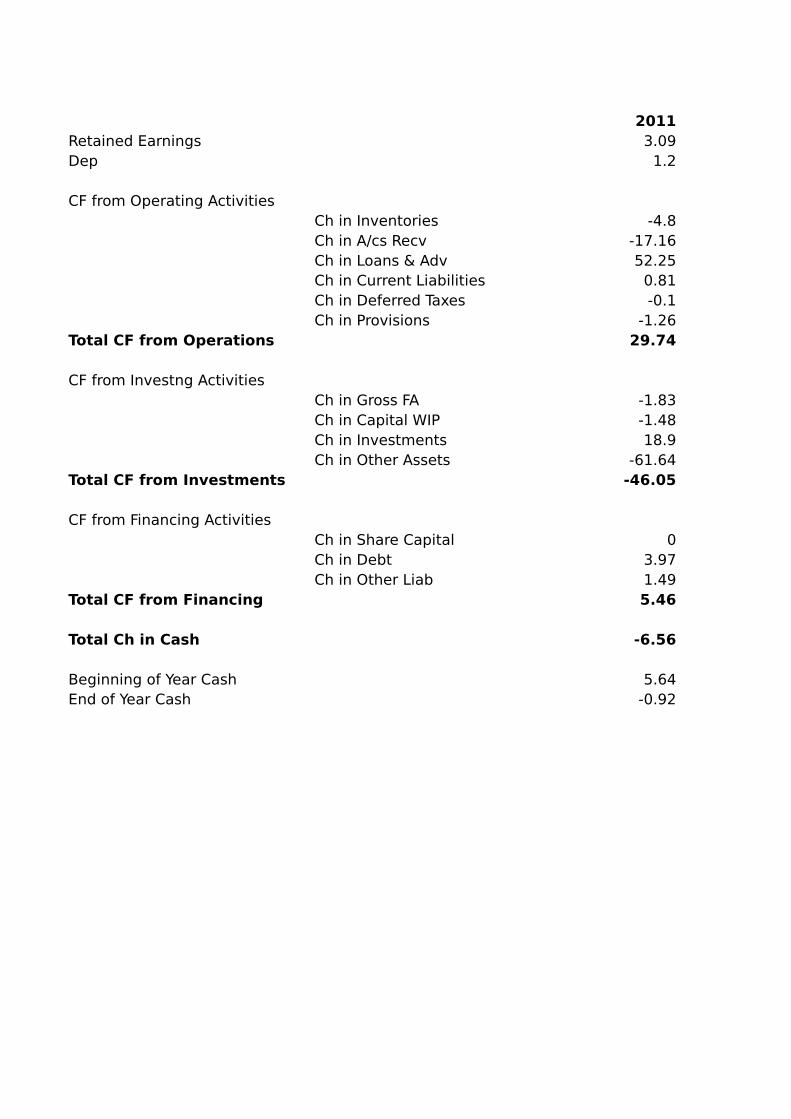
2011Retained Earnings 3.09Dep 1.2
CF from Operating ActivitiesCh in Inventories -4.8Ch in A/cs Recv -17.16Ch in Loans & Adv 52.25Ch in Current Liabilities 0.81Ch in Deferred Taxes -0.1Ch in Provisions -1.26
Total CF from Operations 29.74
CF from Investng ActivitiesCh in Gross FA -1.83Ch in Capital WIP -1.48Ch in Investments 18.9Ch in Other Assets -61.64
Total CF from Investments -46.05
CF from Financing ActivitiesCh in Share Capital 0Ch in Debt 3.97Ch in Other Liab 1.49
Total CF from Financing 5.46
Total Ch in Cash -6.56
Beginning of Year Cash 5.64End of Year Cash -0.92

2012 2013 2014 2015 2016 2017 2018 201914.36 17.53 46.54 66.11 79.07 65.07 94.08 126.78
1.53 2.19 2.46 1.81 1.84 2.13 2.49 2.89
-8.66 -13.15 -4.72 26.84 -16.33 -20.41 -25.51 -31.895.54 24.59 8.86 9.82 -19.59 -24.49 -30.61 -38.261.25 -1.94 -14.85 10.93 -2.18 -2.72 -3.40 -4.25
14.05 10.12 5.24 4.32 10.88 13.60 17.01 21.260.12 0.1 0.13 -0.03 -0.14 -0.17 0.11 -0.140.09 0.4 0.18 0.53 0.33 0.41 0.51 0.64
12.39 20.12 -5.16 52.41 -27.02 -33.77 -41.89 -52.64
-4.67 -4.75 3.21 4.52 -5.63 -3.20 -7.91 -4.321.44 0.01 0.03 0.00 0.00 0.00 0.00 0.00
0 43.41 2.66 12.28 -10.00 -10.00 -10.00 -10.00-9.73 -90.71 47.51 4.33 3.12 7.75 -6.05 43.29
-12.96 -52.04 53.41 21.13 -12.51 -5.45 -23.96 28.97
0 0.36 -43.88 0.00 0.00 0.00 0.00 0.00-28.50 -14.19 -30.40 -25.32 12.37 10.52 -28.61 35.32
-0.04 -0.18 -0.02 -0.02 0.00 -0.01 -0.07 -0.05-28.54 -14.01 -74.3 -25.34 12.37 10.51 -28.68 35.27
-13.22 -26.21 22.95 116.12 53.75 38.49 2.03 141.26
-0.92 -14.14 -40.35 -17.40 98.72 152.47 190.96 192.99-14.14 -40.35 -17.4 98.72 152.47 190.96 192.99 334.26

Interest rate 9%
Depreciation 6.50%
Growth in sales 25%
Other income
COGS 0.75 sales
Tax rate 35%
Dividends 40% Profits
Inventories 15% salesA/cs Recv 18% salesLoans&Adv 0.02 sales
A/cs Payables 10% salesProvisions 0.3% sales