financial constraints capital structure...
TRANSCRIPT

FINANCIAL CONSTRAINTS, CAPITAL STRUCTURE AND
DIVIDEND POLICY: EVIDENCE FROM JORDAN
A THESIS SUBMITTED FOR THE DEGREE OF DOCTOR OF PHILOSOPHY
BY
ALA’A ADDEN AWNI ABUHOMMOUS
SCHOOL OF SOCIAL SCIENCES
BRUNEL UNIVERSITY
I
ABSTRACT
The economic reforms in Jordan during the last two decades have highlighted and
promoted the role that non-financial firms play within the Jordanian economy. The
ability of firms to play this role is in major part determined by the structure of the
financial system in which they operate, and in particular whether this financial system
is able to make capital available efficiently to those firms that need it. Whether this is
the case can be investigated by analysing the impact of firm characteristics on some of
the most important financial decisions taken by these firms, and how these decisions
are influenced by the presence of market imperfections.
The thesis examines the relation between the financing and investment decisions,
where the effect of financial constraints on the firm’s investment decision is
investigated. In particular, this thesis focuses on how financial constraints affect
different firms by investigating the extent to which the reliance on internal cash flow
is affected by firm characteristics such as size, age, dividend payout ratio, and market
listing. We find that Jordanian firms are financially constrained, but that these
constraints do not appear to be related to firm characteristics. Further, results show
that Jordanian firms use debt rather than equity to finance their investment.
The second empirical chapter focuses on the main determinants of firms’ capital
structure. Here the results show that Jordanian firms follow the pecking order theory,
where profitability and liquidity have a negative impact on the level of debt. Size and
market to book value have a positive impact, supporting the view that there are
significant constraints on debt financing since indicators of the financial health of the
firms affect their capital structure ratio. There is also evidence that ownership
structure affects the firm’s access to debt.
The final empirical chapter examines the impact of firm characteristics on dividend
policy, and shows that profitability and market to book value have a positive impact
on dividend policy, implying that firms with better access to capital or credit pay
dividends. This implies that firms retain earnings in order to ensure that they have
sufficient capital to invest, confirming the initial result that Jordanian firms are
financially constrained. There is also evidence of the impact of ownership structure,
consistent with the predictions of agency cost theory, while institutional investors
appear to follow the prudent-man restrictions, being positively associated with firms
that pay dividends.

II
This thesis confirms the presence of market imperfections that have a significant
influence on the financial decisions taken by Jordanian firms. The consistent evidence
of the importance of retained earnings shows that these firms face substantial
constraints in terms of their access to external funds, despite the reforms to the
Jordanian financial system over the last two decades.

III
ACKNOWLEDGMENTS
First and foremost, I thank Allah for reasons too numerous to mention; successful
completion of this thesis being just one of them. I would like to take this opportunity
to express my deep appreciation to my supervisor, Dr. Bryan Mase, of the
department of Economics and Finance at Brunel University, for his constant
encouragement, guidance, time and invaluable help during the compilation of the
thesis. Without his astute suggestions and continual encouragement, this work could
not have been completed.
I am especially grateful to my wife, Islam Almajali, and son, Zainabdien, for their
motivation, support, encouragement and great deal of love and understanding during
the period of this research. It is certain that without their support it could not have
been done.
My Special thanks to my father Awni and my mother Munawwar for their support in
achieving this research. Also, I would like to thank all of my sisters: Ola, Rania, and
Nisreen for their encouragement. I am also grateful to my brothers: Azmi, Amer,
and Mahdi for their motivation and support. I would also like to acknowledge my
colleagues in Economics and Finance department at Brunel University who provided
me with support and suggestions throughout the process of my research.
Many thanks are due to my sponsor Mutah University for their financial support
during my PhD study.
Finally I would like to extend my thanks to all those unnamed who assisted me in
any way throughout the process of my PhD.

IV
TABLE OF CONTENTS
Abstract ................................................................................................................ I
Acknowledgments ............................................................................................. III
Table of Contents .............................................................................................. IV
List of Tables .................................................................................................. VIII
List of Figures ................................................................................................... IX
Chapter One ......................................................................................................... 1
Introduction ......................................................................................................... 1
1.1 MOTIVATION AND CONTRIBUTION ............................................................ 3
1.2 THESIS STRUCTURE, MAIN FINDINGS, AND POLICY IMPLICATIONS ............. 5
Chapter Two ...................................................................................................... 11
Jordan Economy, Capital and Banking Systems .............................................. 11
2.1 JORDAN ECONOMY ................................................................................. 11
2.1.1 Jordanian Economic Sectors ........................................................... 15
2.2 JORDAN BANKING SYSTEM ..................................................................... 17
2.3 JORDAN STOCK MARKET ........................................................................ 21
2.3.1 Legal Structure of Amman Stock Market ........................................ 25
2.4 JORDAN CORPORATE BOND MARKET ...................................................... 26
2.5 SUMMARY .............................................................................................. 26
Chapter Three .................................................................................................... 28
Financial Constraints on Corporate Investment .............................................. 28
3.1 INTRODUCTION ....................................................................................... 28
3.2 THE INVESTMENT CASH FLOW RELATIONSHIP ......................................... 29
3.2.1 Review of firm’s Characteristics and Investment-Cash Flow
Relationship ................................................................................................. 30
3.2.2 The Financial System and Investment Cash Flow Relationship ....... 34
3.2.3 Business Group and Investment Cash Flow Relationship ................ 36
3.2.4 Financial crisis and Investment Cash Flow Relationship ................. 38
3.3 MODELLING INVESTMENT ....................................................................... 38
3.3.1 Comments on Investment Models ................................................... 42

V
3.4 THEORETICAL FRAMEWORK AND HYPOTHESES DEVELOPMENT ................ 42
3.4.1 Financial Constraints and Market Listing ........................................ 43
3.4.2 Financial Constraints and Firm Size ................................................ 44
3.4.3 Financial Constraints and Firm Age ................................................ 45
3.4.4 Financial Constraints and Dividend Payout Ratio ........................... 45
3.5 MODEL DESIGN ...................................................................................... 46
3.5.1 Firm’s Characteristics and Investment-Cash Flow Sensitivities ....... 47
3.5.2 Method of Estimation ..................................................................... 48
3.6 DATA AND SAMPLE DESCRIPTION ........................................................... 50
3.7 SUMMARY STATISTICS ............................................................................ 50
3.8 RESULTS OF INVESTMENT-CASH FLOW SENSITIVITIES ............................. 51
3.8.1 Results of Investment-Cash Flow Sensitivity .................................. 51
3.8.2 Results of Financial Constraints and Market Listing ....................... 53
3.8.3 Results of Financial Constraints and Firm Size ............................... 54
3.8.4 Results of Financial Constraints and Firm Age ............................... 56
3.8.5 Results of Financial Constraints and the Dividend Payout Ratio ..... 57
3.9 CONCLUSION .......................................................................................... 58
Chapter Four ..................................................................................................... 60
Capital Structure Policy .................................................................................... 60
4.1 INTRODUCTION ....................................................................................... 60
4.2 MAIN CAPITAL STRUCTURE THEORY ...................................................... 60
4.2.1 The Modigliani-Miller Theorem ..................................................... 60
4.2.2 The Trade-Off Theory .................................................................... 61
4.2.3 The Pecking Order Theory .............................................................. 62
4.2.4 Agency Theory ............................................................................... 63
4.3 EMPIRICAL STUDIES ON CAPITAL STRUCTURE ......................................... 65
4.3.1 Capital Structure in Developed Countries ....................................... 65
4.3.2 Capital Structure in Developing Countries ...................................... 68
4.4 DETERMINANTS OF CAPITAL STRUCTURE IN JORDAN ................................ 69
4.4.1 Descriptive Statistics Analysis ........................................................ 70
4.5 MODEL DESIGN ..................................................................................... 75
4.6 THEORETICAL FRAMEWORK AND HYPOTHESIS DEVELOPMENT ................ 75
4.6.1 Firm Characteristics and Capital Structure ...................................... 76
4.6.2 Leverage and Tangibility of Assets ................................................. 76
VI
4.6.3 Leverage and Size of the Firm ........................................................ 76
4.6.4 Leverage and Growth Opportunities ............................................... 77
4.6.5 Leverage and Non-Debt Tax Shields ............................................... 78
4.6.6 Leverage and Liquidity ................................................................... 78
4.6.7 Leverage and Profitability ............................................................... 78
4.6.8 Leverage and Volatility .................................................................. 79
4.6.9 Leverage and Dividend Payout Ratio .............................................. 79
4.6.10 Leverage and Ownership Structure (Large Blockholders, Institutional Investors) ..................................................................................................... 80
4.7 RESULTS OF DETERMINANTS OF CAPITAL STRUCTURE ............................. 84
4.7.1 Results of Leverage and Assets Tangibility ..................................... 86
4.7.2 Results of Leverage and Firm Size .................................................. 86
4.7.3 Results of Leverage and Growth Opportunities ............................... 87
4.7.4 Results of Leverage and Non-Debt Tax Shield ................................ 87
4.7.5 Results of Leverage and Liquidity .................................................. 87
4.7.6 Results of Leverage and Profitability .............................................. 88
4.7.7 Results of Leverage and Earnings Volatility ................................... 88
4.7.8 Results of Leverage and Dividend Payout Ratio.............................. 88
4.7.9 Results of Leverage and Ownership Structure ................................. 88
4.8 TARGET CAPITAL STRUCTURE ................................................................ 89
4.9 RESULTS OF TARGET CAPITAL STRUCTURE MODEL ................................. 93
4.10 TESTS OF PECKING ORDER THEORY (SHYAM-SUNDER AND MYER’S
MODELS) .......................................................................................................... 95
4.10.1 Descriptive Analysis ....................................................................... 96
4.10.2 Model Design ................................................................................. 98
4.10.3 Pecking Order Model and Debt Capacity ...................................... 102
4.10.4 Pecking Order Model and Large Financial Deficit ........................ 108
4.11 CONCLUSION ........................................................................................ 110
Chapter Five .................................................................................................... 112
Dividend Policy in Jordan ............................................................................... 112
5.1 INTRODUCTION ..................................................................................... 112
5.2 MAIN DIVIDEND THEORIES ................................................................... 113
5.2.1 Miller and Modigliani Theorem (1961) ......................................... 113
5.2.2 Signalling Hypothesis ................................................................... 114
5.2.3 Agency Cost Theory ..................................................................... 115

VII
5.2.4 Lifecycle Theory .......................................................................... 116
5.3 EMPIRICAL STUDIES OF DIVIDEND POLICY ............................................ 116
5.3.1 Dividend Policy in Developed Countries ...................................... 117
5.3.2 Dividend Policy in Developing Countries ..................................... 120
5.4 THEORETICAL FRAMEWORK AND HYPOTHESIS DEVELOPMENT .............. 121
5.5 THE MAIN DETERMINANTS OF DIVIDEND POLICY .................................. 121
5.5.1 Dividend Policy and Profitability .................................................. 121
5.5.2 Dividend Policy and Growth Opportunities ................................... 122
5.5.3 Dividend Policy and Firm Size ..................................................... 123
5.5.4 Dividend Policy and Volatility ...................................................... 124
5.5.5 Dividend and Ownership Structure ............................................... 124
5.5.6 Dividend and Retained Earnings ................................................... 126
5.5.7 Measuring the Dividends Payments Variable ................................ 127
5.6 DESCRIPTIVE STATISTICS FOR DETERMINANTS OF DIVIDEND POLICY IN
JORDAN .......................................................................................................... 127
5.7 THE DETERMINANTS OF THE LIKELIHOOD TO PAY DIVIDENDS ............... 132
5.7.1 The Logistic Model ...................................................................... 133
5.8 MODEL DESIGN .................................................................................... 134
5.9 RESULTS OF THE DETERMINATIONS OF DIVIDEND POLICY ...................... 135
5.10 RESULTS OF DETERMINANTS OF DIVIDEND POLICY LOGIT MODEL ......... 136
5.10.1 Results of Dividend Policy and Profitability ................................. 137
5.10.2 Results of Dividend Policy and Growth Opportunities .................. 137
5.10.3 Results of Dividend Policy and Size ............................................. 138
5.10.4 Results of Dividend Policy and Earnings Volatility ....................... 138
5.10.5 Results of Dividend Policy and Blockholders Ownership .............. 139
5.10.6 Results of Dividend Policy and Institutional Investors .................. 139
5.10.7 Results of Dividend Policy and Retained Earnings ........................ 140
5.11 RESULTS OF THE DETERMINANTS OF THE AMOUNT OF DIVIDENDS (TOBIT
REGRESSION) .................................................................................................. 140
5.12 RESULTS OF DIVIDENDS WITH CLUSTERED STANDARD ERRORS ............. 143
5.12.1 Results of Dividend Policy (Logit Model with Clustered Standard Error) 143
5.12.2 Results of Dividend Policy (Tobit Model with Clustered Standard
Errors) 144
5.13 DIVIDEND POLICY AND TARGET ADJUSTMENT MODEL .......................... 150

VIII
5.13.1 Results of Target Dividend Ratio .................................................. 153
5.14 THE CONCLUSION ................................................................................. 155
Chapter Six ...................................................................................................... 157
Conclusion, Limitation, And Future Research ............................................... 157
6.1 CONCLUSION ........................................................................................ 157
6.2 FINANCIAL CONSTRAINTS ON THE FIRM’S INVESTMENT: ........................ 157
6.3 CAPITAL STRUCTURE POLICY................................................................ 158
6.4 DIVIDEND PAYOUT POLICY ................................................................... 158
6.5 LIMITATIONS OF THE RESEARCH: .......................................................... 159
6.6 FUTURE RESEARCH: ............................................................................. 159
References ........................................................................................................ 161
Appendix .......................................................................................................... 181
A.1 DATA COLLECTION PROCESS................................................................... 181
A.2 SELECTED FINANCIAL RATIOS FOR ALL FIRMS LISTED IN AMMAN STOCK
EXCHANGE. .................................................................................................... 186
LIST OF TABLES Table 2. 1 Main Economic Indicators of the Jordanian Economy ......................... 14
Table 2. 2 Jordanian Main Economic Sectors and their Relative Contribution to the
GDP ...................................................................................................................... 16
Table 2. 3 Indicators of Bank Soundness .............................................................. 18
Table 2. 4 Credit Facilities Extended by Jordanian Banks by Economic Activity 20
Table 2. 5 Main indicators for ASE ...................................................................... 21
Table 2. 6 Percentage of Foreign Shareholders in Listed Companies .................... 24
Table 2. 7 Aaverage Percentage of Ownership Structure in Listed Companies ..... 24
Table 3. 1 Summary Descriptive Statistics for Sample ......................................... 50
Table 3. 2 Correlation Matrix among Variables .................................................... 51
Table 3. 3 Results for Investment to Cash Flow Sensitivities ................................ 52
Table 3. 4 Results of Investment-Cash Flow Sensitivities and Market Listing ...... 53
Table 3. 5 Results for Investment-Cash Flow Sensitivities and Firm Size. ............ 55
Table 3. 6 Results for Investment Cash Flow Sensitivities and Firm Age ............. 56
Table 3. 7 Results for Investment Cash Flow Sensitivities and Dividend Policy ... 57
Table 4. 1 Common Size Balance Sheet for all Firms in the Sample ..................... 71
Table 4. 2 Summary of Descriptive Statistics ....................................................... 72
Table 4. 3 Pairwise Correlation Coefficients between Variables ........................... 74
Table 4. 4 Determinants of Capital Structure in Jordan ......................................... 85
Table 4. 5 Target Adjustment Model Results......................................................... 94
Table 4. 6 Pairwise Correlation Matrix ................................................................. 97

IX
Table 4. 7 Descriptive Statistics of Sample .......................................................... 97
Table 4. 8 Uses and Sources of Funds of Sample................................................. 98
Table 4. 9 Results from Shyam-Sunder and Myers’s Model ................................ 99
Table 4. 10 Results for Frank and Goyal Model .................................................. 101
Table 4. 11 Debt Capacity and Market Listing .................................................... 104
Table 4. 12 Debt Capacity and Firm Size ............................................................ 106
Table 4. 13 Debt Capacity and Firm Age ............................................................ 107
Table 4. 14 Debt Capacity and Dividends ........................................................... 108
Table 4. 15 Pecking Order Model and Large Financial Deficit ............................ 109
Table 4. 16 A Summary of Empirical Studies on the Determinants of Capital
Structure .............................................................................................................. 111
Table 5. 1 Times Series Examination of Dividend Policy by Jordanian Companies
............................................................................................................................ 128
Table 5. 2 Summary of Descriptive Statistics ..................................................... 129
Table 5. 3 Pairwise Correlation Coefficients among Variables ........................... 130
Table 5. 4 Test of Differences between Dividend Payer and Dividends Non Payers
Firms ................................................................................................................... 132
Table 5. 5 The Likelihood of the Firm to Pay Dividends Using Logit Regression
............................................................................................................................ 136
Table 5. 6 Results of Dividend Policy Using Tobit Regression ........................... 142
Table 5. 7 Results for the Logit Model with Clustered Standard Errors .............. 143
Table 5. 8 Results of Dividend Policy with the Tobit Regression Using Clustered
Standard Errors .................................................................................................... 144
Table 5. 9 Logit Results from Transformed Data ................................................ 148
Table 5.10 Results of marginal effects from the choice of paying dividend..........149
Table 5. 11 Results for the Target Dividend Payout Ratio ....................................154
LIST OF FIGURES
Figure 2. 1 Annual Growth Rate GDP .................................................................... 11
Figure 2. 2 Percentage of External Debt to GDP .................................................... 12
Figure 2. 3 Development of Total Exports, Imports and Trade Balance .................. 13
Figure 2. 4 GDP Breakdown by Economic Activity ............................................... 17
Figure 2. 5 Interest Rate in Banks ......................................................................... 19
Figure 2. 6 Total Credit and Deposit of Jordanian Banks ....................................... 19
Figure 2. 7 Market Capitalization of Listed Firms on ASE (2008) .......................... 22
Figure 2. 8 ASE General Free Float Weighted Price Index ..................................... 23
Figure 5. 2 Dividend Payout Ratio Time Series Analysis .................................... 129

Chapter One
1
CHAPTER ONE
INTRODUCTION
Jordan has undergone substantial economic changes since it started its economic
reforms at the beginning of the 1990s. The GDP growth rate of the Jordanian
economy averaged 6.6 percent for the period from 1999 to 2008. One of the most
important reform features were the privatisation of government enterprises and the
promotion of exports and foreign direct investment. A major improvement in the
Jordanian capital market began in 1997 when new legislation was introduced, and in
1999 Amman Stock Exchange (ASE) became the official stock market of Jordan. The
banking system in Jordan is well-developed, efficient, and profitable. The reform of
Jordan’s economy indicates the importance of the non-financial sector as a key factor
in the economy’s development. However, this development is strongly influenced by
firms’ investment and financing decisions.
In their seminal paper, Modigliani and Miller (1958) introduce modern finance
theory, where in a perfect world firms’ investment and financing decisions are
independent, and firm value is independent of its financing decision. The firm’s
investment rate is affected by the profitability of that investment, and external and
internal sources of funds are perfect substitutes. However, in reality the market is not
perfect and there are many factors that affect the firm’s financing decision, such as;
agency costs, transaction costs, taxes, and most importantly asymmetric information
between investors and firms. Since the development of the theoretical aspects of
corporate finance, a large number of studies have shown that imperfections in the
market affect the financing decision of the firm, and that internal and external finance
are not perfect substitutes.
As a result, alternative theories have been proposed to address this reality. For
instance, Myers and Majluf (1984) show that asymmetric information between firms
and external investors lead firms to use internal funds before external funds to finance
their investment. Market imperfections have a significant impact on the financing
decisions of firms, while the presence of asymmetric information makes the

Chapter One
2
investment and financing decisions become dependent on each other. Subsequently,
Fazzari, Hubbard, and Petersen (1988) show that internal funds are important
determinants of the firm’s capital expenditures, while other studies show that the
development of the financial system has a significant impact on the asymmetric
information and agency cost problems. Brown and Petersen (2009), for instance,
conclude that the financial constraints decline over time as improvements in the
financial system reduce the asymmetric information problem.
In Jordan, the banking system is well developed, although the financial market is still
developing. Therefore, credit facilities from banks play a key role in financing
Jordanian firms’ investment. Consequently, it is important to identify the impact of
market imperfections on the Jordanian firms’ capital structure behaviour. Several
theories attempt to explain corporate financing behaviour, including; trade off theory,
agency cost theory, and pecking order theory. While each theory explains
determinants of capital structure from a different perspective, they all rely on the
theme that market imperfections play an important role in the debt financing decision.
Research into capital structure policy has shown different results across different
countries, and over time (e.g Rajan and Zingales, 1995; Baker and Wurgler, 2002). In
addition, developing country shareholders may not have the ability to monitor
management’s decisions, and therefore, in the presence of a developed banking
system the shareholders may use debt as a tool to reduce the agency cost problem.
The decision to retain earnings or pay dividends is also highly affected by market
imperfections. In 1961 Miller and Modigliani introduce the irrelevance proposition of
dividends, showing that under market perfection, the firm’s dividend policy will not
affect firm value. However, factors such as transaction costs, tax, and agency costs are
likely to affect the firm’s choice to retain or pay dividends. Furthermore, in the
presence of a high cost of external funds and capital constraints, firms tend to retain
their earnings.

Chapter One
3
1.1 MOTIVATION AND CONTRIBUTION
Since 1990 the Jordan economy has witnessed many major reforms. The Jordanian
economy now is open, growing with a moderate inflation rate, and most government
enterprises have been privatised. The financial system is classified as a bank-based
system, the banking sector being well-developed and efficient. The banking system
plays a key role in the Jordanian economy, firms using bank debts to finance their
investment. The stock market is developing, and the ownership structure is highly
concentrated. The bond market is very shallow and less developed. These factors may
have implications on the firm’s financing decisions, which this research will
investigate in the subsequent chapters.
In the last two decades the Jordanian government has improved the efficiency of the
economic and financial system. However, these efforts have not been investigated in
depth, and current knowledge of the financing behaviour of Jordanian firms is quite
limited. This study is motivated by the large changes to the Jordanian economy and its
financial system, and intends to extend our knowledge of the financing behaviour of
firms listed on the ASE, and to the extent to which corporate finance theory can
explain this financing behaviour.
Jordanian firms depend mainly on the credit market to finance their investment, and
the relative cost and availability of this financing depends on the development of the
credit market and the relationship between firms and the fund providers. This
relationship influences the cost of finance, which in turn is affected by the degree of
asymmetric information between the firm and the creditors, where a high level of
asymmetric information restricts the firm’s ability to raise funds. The service and
industrial sectors play a key role in the Jordanian economy, so if firms face financing
restrictions, their ability to contribute to the economy will be adversely affected. This
is the motivation for this study of Jordanian firms.
The major providers of funds in Jordan are banks, equity issuance being less
frequently used, and the bond market is rarely used. However, the capital market is
still developing, and asymmetric information between investors and firms may
severely affect firms’ capital structure. These factors motivate the study of their
impact on capital structure policy.

Chapter One
4
Most Jordanian firms retain their dividends or pay a very low dividend, which
supports the view that Jordanian firms do not use dividends as a means of signalling
or reducing the asymmetric information problem. In bank-based markets, these
problems are reduced since the main providers of funds are banks. A close
relationship between firms and banks and high ownership concentration reduce these
problems. These are characteristics of the Jordanian market, and therefore motivate us
to explore dividend policy in Jordan.
The main aim of this research is to explore the financing choices of firms listed in the
Amman Stock Exchange in Jordan, and the interrelationship between the financing
and investing decisions. In addition, the research aims to explore the main
determinants of the financing decision or the capital structure decision. The research
investigates the main attributes encouraging firms to pay dividends, or the amount of
dividends paid.
By evaluating the financing decisions of Jordanian firms, this thesis contributes to our
understanding of the impact of market imperfections on developing market firms.
First, there is limited existing evidence on the presence of financial constraints in
emerging markets. This thesis fills the gap between the theoretical and empirical work
in this area by investigating the financial constraints on a sample of Jordanian firms.
This is the first attempt to assess this issue in Jordan, and uses market listing as a
classification criterion to distinguish between financially constrained and
unconstrained firms.
Second, this thesis models capital structure policy in Jordan, and tests whether the
capital structure theories are applicable to the Jordanian capital market. Further it
examines whether Jordanian firms have a target capital structure, and their speed of
adjustment toward this target. Recent developments of new models in capital
structure theory, especially pecking order theory (Shyam- Sunder and Myers, 1999;
Frank and Goyal, 2003 among others), have been tested using data from developed
countries, with few applications to data from developing countries. Thus, this thesis
aims to fill this gap by applying and testing these models in Jordan.
Third, this thesis models dividend policy in Jordan. Recent years have seen the
development of a new theory of dividend policy, the life cycle theory (DeAngelo et

Chapter One
5
al.,2006), but again the overwhelming majority of studies apply this theory to
developed countries. This thesis applies this new theory to from an emerging market
(Jordan).
1.2 THESIS STRUCTURE, MAIN FINDINGS, AND POLICY
IMPLICATIONS
This thesis consists of four additional chapters. Chapter 2 comprises a discussion of
the Jordanian economy, capital and money markets. There then follow three empirical
chapters investigating the financial decision making of the corporate sector in Jordan.
The first empirical chapter analyses the impact of financial constraints on corporate
investment in Jordan, and specifically the relationship between the financing and
investment decisions. The second empirical chapter analyses the main determinants of
firms’ capital structure policy in Jordan. This chapter assesses capital structure policy,
in the context of the main theories of capital structure, including agency cost theory,
trade off theory, and pecking order theory. The third empirical chapter investigates the
determinants of Jordanian firms’ dividend policy. The results from all empirical
chapters are based on a balanced panel of 85 non-financial firms listed on the Amman
Stock Exchange over the period from 1999-2008.
Chapter 2, Jordanian economy, capital and banking systems
This chapter presents the main indicators of the Jordanian economy, the main
economic sectors and their relative contribution to gross domestic product. This
chapter also outlines the main characteristics of the banking system in Jordan, and the
credit facilities of the banks to the main economic sectors. In addition, this chapter
presents the structure of the capital market in Jordan and the structure of the Amman
Stock Exchange. Finally, this chapter highlights how the Jordanian economy and its
banking and capital markets have provided the overall motivation for this study of the
financial decisions of Jordanian firms.
Chapter 3, financial constraints and corporate investment

Chapter One
6
The first empirical chapter examines the impact of market imperfections on the
financing decision of firms. This chapter aims to answer the following question “Are
Jordanian firms financially constrained?” The chapter analyses the impact of
asymmetric information on the ability of the firms to raise funds from external
sources. In addition, it examines whether the characteristics of firms affect the extent
of the asymmetric information between firms and fund providers. Studies of financial
constraints on firm investment use the sensitivity of the firm’s investment to internal
funds, as a measure of these constraints. The major challenge facing the empirical
literature is to find the firm characteristics that impound the unobservable financial
constraints and affect the ability of firms to raise funds from external markets.
Following a large body of empirical studies several segmenting variables have been
used in this study, including market listing, firm size, firm age, and dividend payout
ratio. To ensure a robust econometric analysis the general method of moments
(GMM) is used for the estimation.
The results from this chapter show that Jordanian firms are financially constrained, as
demonstrated by investment cash flow sensitivities that are positive and statistically
significant. Firms’ investment is affected by the availability of internally generated
funds, indicating that Jordanian firms face financing restrictions on their investment.
The sources of restriction come from; first, firms have to pay a relatively high cost of
external funds; second, fund providers do not provide firms with the required amount
of funds. The results also show that Jordanian firms use debt to finance their
investment, however, there is no evidence to support that firms use equity to finance
their investment.
The results also show that firm characteristics such as size, age, and dividend payout
are not factors associated with investment cash flow sensitivity. In addition, the
results do not support market listing as affecting investment cash flow sensitivities.
Overall, the results suggest market listing and firm characteristics are not particularly
useful criteria with which to capture the unobserved asymmetric information problem.
This chapter has several specific implications for policy in Jordan. Jordanian
policy makers have devoted significant efforts to establishing a strong economy.
However, to further enhance the growth of the economy and make full use of the
economic reforms that have been implemented, the Jordanian government should pay

Chapter One
7
closer attention to the sources of finance of firms’ investment. The empirical analysis
in this thesis shows that firm investment is strongly reliant on their internal cash flow.
Therefore, it is very important for Jordan to speed up both stock market development
and credit market efficiency in order to meet the demand of Jordanian firms for
financial resources. This study shows no evidence to support the either the firms’
characteristics or market listing as having a significant impact on the degree of firms’
financial constraints. Thus, the effort to reduce the restriction on sources of funds
should not focus on particular firms, or types of firms. In addition, the results suggest
that the Jordanian authorities should expand the choices of financing by improving the
functioning of the bond market, and enhancing this avenue as an alternative source of
financing.
Chapter 4, capital structure policy
The second empirical chapter focuses on the determinants of capital structure policy.
This chapter aims to answer four main questions; first, what are the determinants of
the financing behaviour in Jordan? Second, what is the explanatory power of the
existing mainstream capital structure theories for the Jordanian capital market? Third,
do Jordanian firms have a target capital structure ratio, and if so what is the speed of
adjustment toward this target? Fourth, do the newly developed models of capital
structure explain the financing decision in Jordan? This chapter uses OLS to
investigate the determinants of capital structure, and then applies GMM to estimate
target capital structure and the speed of adjustment toward this target.
The results show that firm size, growth opportunities, blockholders, and institutional
investors positively impact the debt ratio, while liquidity, profitability, and the
dividend payout ratio are negatively related. These results suggest the debt ratio of
Jordanian firms is significantly affected by the probability of bankruptcy (indicators
of healthy firms are large size and high market value), which supports trade off
theory. The results show that Jordanian banks are conservative in their lending policy,
preferring to provide loans to large firms, while small firms use the equity market or
internal funds, as suggested by pecking order theory. The results also support banks
preferring to lend to firms with high ownership concentration. It is not surprising that
in a small economy with a high ownership concentration, the relationship between
Chapter One
8
banks and firm owners affects the ability of firms to access debt. The banks rely on
these owners to effectively monitor the investment decisions in their firms.
The results are highly supportive of pecking order theory, where firms prefer to use
their internal funds before external sources of funds, and profitability and liquidity
have a negative impact on the debt ratio. The results show that Jordanian firms prefer
to use their internal funds, either because the cost of debt is prohibitive or banks
impose restrictive conditions on credit facilities. This supports the banking system as
operating on a commercial basis, where firms should meet many criteria before
receiving credit from banks. The banking sector offers loans to high quality firms, and
the relation between banks and owners affects the banks’ credit decisions.
Finally, the results in this chapter show that Jordanian firms have a target capital
structure and move relatively quickly toward this target. In the presence of a weak
bond market and an efficient banking system, the transaction cost related to bank
loans is relatively moderate, which encourages firms to adjust their debt ratio. The
results show that the Shyam-Sunder and Myers (1999), and Frank and Goyal (2003)
models of pecking order theory are not applicable for Jordanian firms. we estimate the
model for both large and small deficit firms, and take account of the impact of the
firm’s characteristics on its debt capacity.
Overall, the main capital structure theories can explain some of the major
determinants of the Jordanian firms’ capital structure, but we need to take into
account the particular characteristics of the institutional framework of the Jordanian
market when interpreting these findings.
The policy implications that emanate from this are; first, the Jordanian government
should reduce the obstacles on credit facilities for small firms and encourage banks to
provide finance to these firms. Since equity financing is very important for small
firms, the Jordanian government should seek to improve the functioning of the equity
market (as represented by the ASE), and ensure that it is a reliable and cost effective
source of finance for Jordanian firms. Second, since Jordanian firms follow pecking
order in their choice of finance, the Jordanian government should take further steps to
reduce the gap between firms and banks. Jordanian banks need to become more
involved in financing firms, and appreciate that their credit to firms is not just a tool

Chapter One
9
to make profit, but is also an important tool to support economic growth. Third,
ownership structure has a significant impact on the debt ratio, where banks prefer to
provide credit to firms with highly concentrated ownership. Thus, policy makers need
to enhance the ability of shareholders in firms with high ownership dispersion to
effectively monitor the firm’s use of borrowed funds. The results show that Jordanian
firms are able to move toward target capital fairly rapidly, however a reduction in the
transaction cost of financing might allow firms to move toward target more quickly.
Chapter 5, determinants of dividend policy
The third and final empirical chapter investigates the determinants of firms’ dividend
policy. This chapter aims to answer the following questions; first, what are the main
determinants of dividend policy behaviour in Jordan? Second, do Jordanian firms
have a target dividend ratio? Third, are the main theories of dividend policy
applicable to Jordanian firms? In this chapter the econometrics technique used are
Logit, to estimate the probability that the firm pays dividends, and Tobit, to estimate
the amount of dividend paid. We use GMM to estimate the firm’s target dividend
payout ratio.
The results show that the probability the firm will pay dividends is positively affected
by profitability, market to book value, institutional investors, retained earnings/total
equity ratio, while it is negatively affected by earnings volatility and blockholders.
The positive impact of profitability and firms with growth opportunities supports the
findings from the previous chapter that healthy firms enjoy better access to relatively
low-cost credit. The results also support the life cycle theory, where retained earnings
positively impact the payment of dividends, so mature firms are more likely to pay
dividends.
The impact of ownership structure on dividend policy shows that blockholders prefer
firms that do not pay dividends. This supports the agency cost theory, where closely
monitored firms use internal cash flow rather than external funds. In addition,
blockholders may consider their ownership as a long term investment, and reinvest
dividends in new projects. In contrast, institutional investors prefer to receive
dividends, which is consistent with the view that they regard dividends as indicators
Chapter One
10
of firms’ financial strength. Institutional investors act as short term investors rather
than owners of the company, and consequently are looking for current income rather
than future earnings. Finally the results show that Jordanian firms do not have a target
dividend ratio. The results also show that the same factors affect the amount of
dividends that firms pay.
There are several policy implications of firms’ dividend policy being affected by
firms’ characteristics; first, the Jordan authorities should improve the effectiveness
of credit and capital markets, because firms with high profitability and high market to
book value tend to pay dividends because they have better access to the capital market
than firms with low profitability and low market to book value; secondly, the
Jordanian authorities should give more attention to the agency cost problem, where
the agency cost is the major determinant of dividend policy. They need to support
shareholder rights, especially in firms with a low concentration of shareholders.
Finally, Jordanian authorities need to work to improve the disclosure and transparency
of firms, in order to reduce the role dividends play as a tool to control the firm’s
management.
Overall, the results from the three empirical chapters suggest that market
imperfections in Jordanian capital and credit markets have a major impact on the
financing decisions of non-financial firms. Thus the general policy implication is that
the equity market should improve, and the credit market represented by banks should
become more involved in financing firm investment. Finally, which is perhaps the
most important, is that the bond market needs to develop into a reliable source of debt
financing. As suggested by Herring and Chatusripitak (2000), development of the
bond market plays a key role in the financial development of an emerging market.
Chapter, 6: Conclusion and summary
This chapter provides a summary of the empirical findings of the thesis, identifies
limitations of the research, and presents avenues for future research.

Chapter Two
11
CHAPTER TWO
JORDAN ECONOMY, CAPITAL AND BANKING SYSTEMS
2.1 JORDAN ECONOMY
In 1946 Jordan gained its independence from the United Kingdom, marking a
transformation date for the Jordanian economy and policy. Stability of the economy
and politics has been the predominant characteristic of Jordan. Jordan is heavily
dependent on the banking sector, and to a lesser extent on the stock market sector,
and despite being located close to the largest producers of oil (Saudi Arabia and
Iraq), Jordan is not an oil producer. Figure 2.1 shows the growth rate of GDP for the
period from 1980 to 2009. During the late 1980s the Jordanian economy faced a
major financial crisis, which together with pressure from the Gulf War and the
collapse of the third largest bank in 1989, contributed to a substantial decline in
GDP. The large budget deficit in the late 1980s, combined with the Gulf War, forced
the Jordanian government to reschedule its debt and devalue the Jordanian dinar. At
the beginning of 1990, total external debt was more than 189% of GDP (total
external debt amounted to $8.3 billion in 1990). These factors forced the Jordanian
dinar to lose 10% of its real value at the beginning of 1990.
Figure 2. 1 Annual Growth Rate GDP
At the start of the 1990s, the Jordanian government undertook a number of major
financial reforms, and succeeded in reducing its external deficit and the external
-20
-10
0
10
20
30
GDP Growth (annual %) Jordan 1980-2009

Chapter Two
12
imbalance. The Jordanian economy started to recover, the GDP growth rate was 4%
on average from 1994 to 2002, and 7% from 2002 to 2009.
Figure 2. 2 Percentage of External Debt to GDP
As we can see in Figure 2.2, the percentage of external debt to GDP decreased from
190% in 1990 to 27% in 2008, demonstrating that the Jordanian government
successfully controlled its debt during the period. The reforms that were introduced
included: A privatisation process, during which the main economic sectors were
privatised, including utilities and natural resources (cement and phosphate): The
financial and economic sectors were liberalized; Jordan joined the World Trade
Organization (WTO) in 2000, and entered into several trade agreements with the
European Union in 2001, in 2001 Jordan entered a Free Trade Area Agreement
(FTA) with the US. In 1998 Jordan signed The Greater Arab Free Trade Agreement
(GAFTA), and in 2004 signed the Jordan-Singapore Free Trade Area Agreement. In
2007 Canada and Jordan signed Trade and Investment Agreements, while Jordan
entered The Jordan Euro-Mediterranean Association Agreement in 2002.
Since October 1995, the Jordanian dinar has been fixed at 1 dinar =1.41044 U.S
dollars. However, a significant the main weakness of the Jordanian economy is that
it depends on grants from other countries to fill the gap in the financial deficit, so
that any fluctuation in the level of grants will affect the Jordanian economy. By the
end of 2010 “‘the total grants committed reached US$ 782.192M by the US, EU,
Japan, China, Canada, UN, France, Korea, Arab Fund for Economic and Social
0
0.5
1
1.5
2
Percentage of External Debt to GDP

Chapter Two
13
Development, the Islamic Development Bank, and others”. (Jordan investment
Board. 1
Table 2.1 shows that the average growth rate of GDP has been 6% over the period
2000 to 2009, which shows that the Jordanian economy has been strong. In addition,
the average GDP per capita increased from $1764 in 2000 to $4027 in 2009, which
confirms that the economic reforms in the late 1990s and 2000 improved the income
per capita in Jordan.
The inflation rate is moderate for the period from 2000 to 2007, however during
2008 the inflation rate rose to 14.9% due to increased world oil prices. As we can
see, the growth rate of GDP decreased from 7.23% to 5.48% and the inflation rate is
-0.68%, indicating that the Jordanian economy during 2009 slowed due to the global
financial crisis, which affected the Jordanian economy and increased oil prices. The
openness of the Jordanian economy increased foreign direct investment from 242
million in 2001 to 2,354 million in 2009. The increase in foreign direct investment
reflects the confidence of foreign investors in the Jordanian economy. In addition,
this reflects that the Jordanian economy provides a good investment opportunity.
Jordanian exports are 53% of total GDP, which indicates the importance of exports
to the Jordanian economy.
Figure 2. 3 Development of Total Exports, Imports and Trade Balance
1 Available at: http://jordaninvestment.com/IIS/PoliticalAndEconomicProfile/tabid/291/language/en-US/Default.aspx
-
5,000
10,000
15,000
20,000
25,000
1997 1998 1999 2000 2001 2002 2003 2004 2005 2006 2007 2008 2009
Development of Total Exports, Imports and Trade Balance ( $ Million )
Trade balance Total Imports Total Exports

Chapter Two
14
Table 2. 1 Main Economic Indicators of the Jordanian Economy 1997 1998 1999 2000 2001 2002 2003 2004 2005 2006 2007 2008 2009
GDP (current US$) millions
7,248
7,914
8,151
8,464
8,980
9,584
1,020
11,411
12,588
15,057
17,110
21,971
23,820
GDP growth (annual %)
3.31
3.01
3.39
4.24
5.27
5.79
4.18
8.56
8.12
8.11
8.18
7.23
5.48
GDP per capita (current US$)
1,625
1,721
1,742
1,764
1,826
1,902
1,975
2,157
2,326
2,719
3,022
3,797
4,027
GDP per capita growth (annual
%)
0.20
-0.09
1.56
1.70
2.70
3.26
1.64
5.97
5.69
5.66
5.79
4.92
3.20
Inflation, consumer prices
(annual %)
3.04
3.09
0.61
0.67
1.77
1.83
1.63
3.36
3.49
6.25
5.39
14.93
-0.68
Foreign direct investment, net
(current US$) millions
361
310
154
904
242
224
550
918
1,821
3,682
2,574
2,813
2,354
Foreign direct investment, net
inflows (% of GDP)
4.98
3.92
1.94
10.79
3.05
2.49
5.36
8.21
15.76
23.54
15.32
12.87
10.19
Total reserves (includes gold,
current US$) millions
2,435
1,988
2,770
3,441
3,174
4,116
5,365
5,446
5,461
6,982
7,924
8,918
12,135
Exports of goods and services
(current US$)
3,568
3,544
3,529
3,538
3,781
4,544
4,829
5,955
6,634
8,111
9,279
12,415
10,929
Exports of goods and services
(% of GDP)
49
45
43
42
42
47
47
52
53
54
54
57
46
Source: World bank data base

15
Exports increased from $3,535 million in 2000 to $10,929 million in 2009,
confirming the success of the Jordanian openness policy. However, the trade deficit
is still a major problem for the Jordanian economy, which requires more investment
in order to increase exports and reduce the deficit. The main exports are clothes,
crude potash, pharmaceuticals, vegetables, and crude Phosphates2.
“ In 2010, a new income tax law has been issued by which nearly 85% of employees
wages in the public and private sectors were exempted from income tax for those
whose wages don't exceed 12,000 JD's/ year / person and 24,000 JD's for the main
provider regardless of the number of family numbers.
1. The tax percentages is 7% on any amount exceeds the first 12,000 and 14%
on anything above that.
2. As for the income corporate tax, the amount is as follows:
3. 30% on banks and financial companies.
4. 24% on communication companies, mediation and financial exchange.
5. 14% on rest types of companies including industrial and commercial.”
(Jordan Investment Board, 2013)
2.1.1 Jordanian Economic Sectors
This section shows the main economic sectors in Jordan and their relative
contribution to Jordanian GDP. Table 2.2 shows that in Jordan there are two main
sectors, the commodity producing sector and the services sector. On average,
Jordan’s commodity producing sector contributes nearly 31.5% of GDP, and the
growth rate in 2008 was 8.1%. The main dominant sub-sector is the manufacturing
sector, its relative contribution amounting to 18.9% with a growth rate in 2008 of
5.1%. This shows the importance of the industrial sector to the Jordanian economy.
The reason for the high growth in this sector is due to Jordan’s trade agreements
with the largest markets in the world, which enables Jordanian firms to take
advantage of this opportunity and export to these markets (the share of exports is as
2 Source : http://www.jordanexporters.org/market-intelligence/trade-statistics
16
follows: North America countries 16%, other Arab countries 24%, Asian non-Arab
countries 33%).
The numbers of registered industrial businesses in 2008 were 1,335 (Source, Central
Bank of Jordan (CBJ) 2011). The construction sector contributes 4.5% to GDP with
a growth rate of 13.4% in 2008. The main investment in this sector is in new houses.
During the last twenty years Jordan has faced two main immigration waves from
neighbouring countries. In the first Gulf war (1990-1991) more than half a million
Jordanian people returned from Kuwait and Iraq. The second major immigration
wave occurred during the second Gulf war in 2003 when more than one million Iraqi
citizens entered Jordan. The relative contribution of Mining and Quarrying to GDP
is 2.6% and the growth rate for 2008 was 35.8%. This supports the Jordanian
government’s attitude to invest more in mining and exploring the natural resources
in Jordan. It is notable that the mining and utility sectors in Jordan are owned by the
private sector.
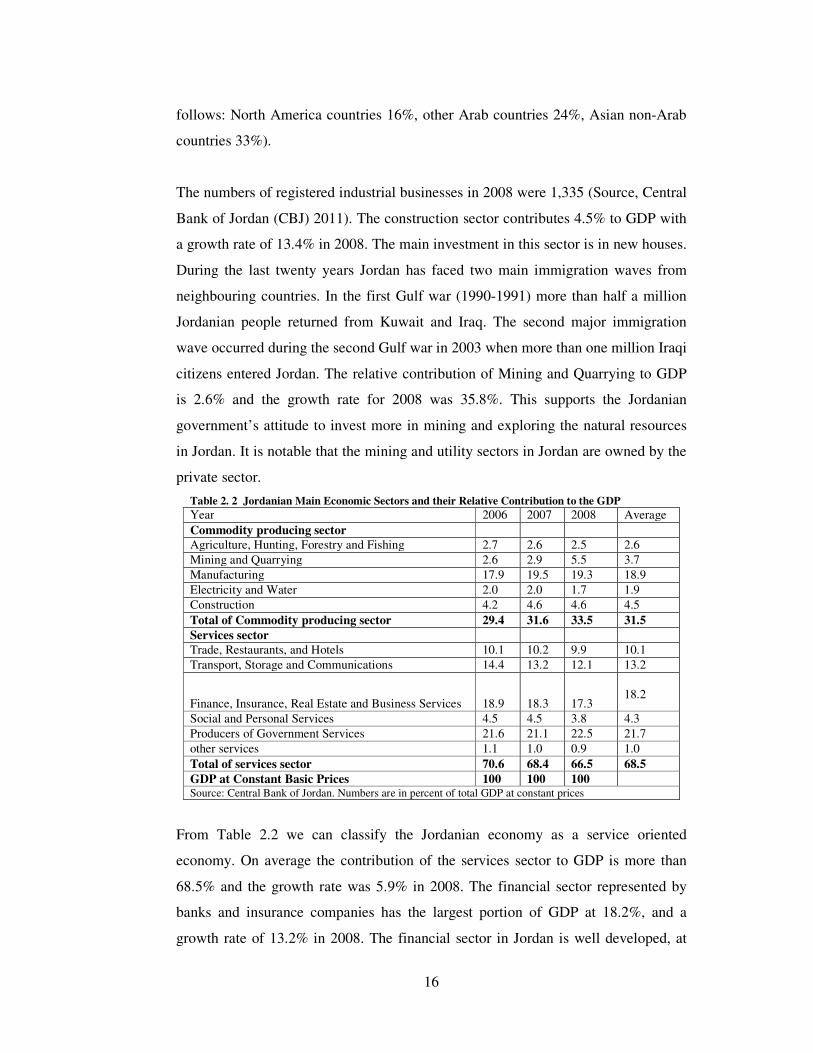
Table 2. 2 Jordanian Main Economic Sectors and their Relative Contribution to the GDP
Year 2006 2007 2008 Average Commodity producing sector Agriculture, Hunting, Forestry and Fishing 2.7 2.6 2.5 2.6 Mining and Quarrying 2.6 2.9 5.5 3.7 Manufacturing 17.9 19.5 19.3 18.9 Electricity and Water 2.0 2.0 1.7 1.9 Construction 4.2 4.6 4.6 4.5 Total of Commodity producing sector 29.4 31.6 33.5 31.5
Services sector Trade, Restaurants, and Hotels 10.1 10.2 9.9 10.1 Transport, Storage and Communications 14.4 13.2 12.1 13.2
Finance, Insurance, Real Estate and Business Services 18.9 18.3 17.3
18.2
Social and Personal Services 4.5 4.5 3.8 4.3 Producers of Government Services 21.6 21.1 22.5 21.7 other services 1.1 1.0 0.9 1.0 Total of services sector 70.6 68.4 66.5 68.5
GDP at Constant Basic Prices 100 100 100 Source: Central Bank of Jordan. Numbers are in percent of total GDP at constant prices
From Table 2.2 we can classify the Jordanian economy as a service oriented
economy. On average the contribution of the services sector to GDP is more than
68.5% and the growth rate was 5.9% in 2008. The financial sector represented by
banks and insurance companies has the largest portion of GDP at 18.2%, and a
growth rate of 13.2% in 2008. The financial sector in Jordan is well developed, at

the end of 2009 there were 21 banks, and 28 insurance companies licensed to
practice insurance services. The tourist
hotels contribute 10% of GDP with a growth rate of 10.1%. Figure 2.4
main economic sectors and their relative contribution to GDP
Figure 2.
2.2 JORDAN BANKING
This section outlines the main characteristics of the banking system in Jordan, and
the relation between the banking system and the different economic sectors. The
banking sector in Jordan is dominated by the Central
operating in Jordan are regulated and supervised by the CBJ subject to the CBJ
Law No. 23 of 1971, the Banking Law No.28 of 2000, and the circulations and
instructions issued by the CBJ. Banks are licensed by the CBJ as public
shareholding companies with a minimum capital of JD 40 million
In 1930, the first Jordanian bank
21 banks operating in Jordan
with total assets equal to
HSBC bank was the first foreign bank authorized to work in Jordan.
banks are owned by the private sector. In addition, the banking sector in Jordan is
very concentrated, 70% of total assets of Jordanian banks being held by three banks,
and the degree of competition between the banks is very low (
and Peira (2010))4.
3 The foreign banks are: HSBC Bank Middle
National Bank of Kuwait, Banque Audi SAL/Saradar Audi Group, BLOM Bank.4 Demirgüç-Kunt, A. and Peira, M. (2010) “A Framework for Analysing Competition in the Banking Sector: Application to the Case of Jordan”, World Bank Policy Research Working Paper
Finance, Insurance,
Real Estate
Social and Personal
Government Services
Other services
1%
17
the end of 2009 there were 21 banks, and 28 insurance companies licensed to
practice insurance services. The tourist sectors represented by trade, restaurants, and
hotels contribute 10% of GDP with a growth rate of 10.1%. Figure 2.4
main economic sectors and their relative contribution to GDP.
Figure 2. 4 GDP Breakdown by Economic Activity
ANKING SYSTEM
This section outlines the main characteristics of the banking system in Jordan, and
the relation between the banking system and the different economic sectors. The
banking sector in Jordan is dominated by the Central Bank of Jordan (CBJ).
operating in Jordan are regulated and supervised by the CBJ subject to the CBJ
Law No. 23 of 1971, the Banking Law No.28 of 2000, and the circulations and
instructions issued by the CBJ. Banks are licensed by the CBJ as public
shareholding companies with a minimum capital of JD 40 million”(Kanadeh, 2008)
first Jordanian bank was established (the Arab Bank), and there are
ing in Jordan, 15 local and 8 foreign banks3 with 606 branches and
l assets equal to 30 JD billion at the end of 2009 (source, CBJ).
HSBC bank was the first foreign bank authorized to work in Jordan. All Jordanian
banks are owned by the private sector. In addition, the banking sector in Jordan is
, 70% of total assets of Jordanian banks being held by three banks,
and the degree of competition between the banks is very low (see, Demirgüç Kunt
Bank Middle East LTD, Egyptian Arab Land Bank, Rafidain Bank, Citibank N.A., Standard Chartered Bank,
National Bank of Kuwait, Banque Audi SAL/Saradar Audi Group, BLOM Bank. Kunt, A. and Peira, M. (2010) “A Framework for Analysing Competition in the Banking Sector: Application to
World Bank Policy Research Working Paper No 5499.
Agriculture
3%
Mining and Quarrying
4%
Manufacturing
19%
Electricity and Water
2%
Construction
4%
Trade, Restaurants,
and Hotels
10%
Transport and
Communications
13%
Finance, Insurance,
Real Estate
18%
Social and Personal
Services
4%
Government Services
22%
the end of 2009 there were 21 banks, and 28 insurance companies licensed to
sectors represented by trade, restaurants, and
hotels contribute 10% of GDP with a growth rate of 10.1%. Figure 2.4 shows the
This section outlines the main characteristics of the banking system in Jordan, and
the relation between the banking system and the different economic sectors. The
Bank of Jordan (CBJ). “Banks
operating in Jordan are regulated and supervised by the CBJ subject to the CBJ
Law No. 23 of 1971, the Banking Law No.28 of 2000, and the circulations and
instructions issued by the CBJ. Banks are licensed by the CBJ as public
”(Kanadeh, 2008).
), and there are now
with 606 branches and
9 (source, CBJ). In 1949
All Jordanian
banks are owned by the private sector. In addition, the banking sector in Jordan is
, 70% of total assets of Jordanian banks being held by three banks,
see, Demirgüç Kunt
East LTD, Egyptian Arab Land Bank, Rafidain Bank, Citibank N.A., Standard Chartered Bank,
Kunt, A. and Peira, M. (2010) “A Framework for Analysing Competition in the Banking Sector: Application to

18
In addition to the banking sector, there are other financial institutions that support
and complement the banking system. These financial institutions provide non-
banking financial services as follows: The Deposit Insurance Corporation, which
encourages saving by providing confidence in the Jordanian banking system by
insuring the deposits of banks located in Jordan; The Jordan Loan Guarantee
Corporation, which provides loan guarantees for small and medium enterprises. The
Jordan Mortgage Refinance Company, which improves the mortgage market by
meeting the housing needs of low-income segments of the population through
refinancing of their home loans. However, a major weakness of the financial system
is the absence of financial adviser companies.
The main indicators of banking soundness in Table 2.35 show that the banking sector
in Jordan has an average risk-weighted capital adequacy ratio in 2007 of 19%, which
reflects a healthy state and complies with international capital adequacy
requirements and prudential norms (Basel minimum requirement 8%). The ratio of
non-performing loans (measuring the percentage of default or close to default), is
4.2 % which is a very good indicator. The other ratios show the sound profitability
of the banking sector.
Table 2. 3 Indicators of Bank Soundness
2000 2004 2005 2006 2007 Risk-weighted capital adequacy ratio 19.4 17.8 21.4 21.4 18.8 Non-performing loans (in percent of total loans) 14.6 10.3 6.6 4.3 4.2 Return on Assets 0.3 1.1 2.0 1.7 1.6 Return on Equity 4.4 13.1 20.9 15.0 12.2 Loans to GDP ratio (in percent of GDP) 75.8 76.5 86.6 97.6 100.6
Sources: World bank data base. All numbers in percent.
Al-Fayoumi and Abuzayed (2009) compare the main indictors of the Jordanian
Banking sector with the banking sectors in six Arab countries (Lebanon, Saudi
Arabia, Bahrain, UAE, and Egypt). By the end of 2007, the capital adequacy ratio
(the ratio of total capital over total assets) for Jordan was 18.08%, while the average
for all other countries was 9.16%, showing strong evidence that the Jordanian banks
have a good financial position. The management quality indicator, measured by the
cost to income ratio, is in the middle of the distribution and shows the operating
efficiency of the banks. The profitability ratio (Return on Assets ratio of 1.65%)
5This table from IMF working paper link : http://www.imf.org/external/pubs/cat/longres.aspx?sk=22304.0, taken from Central Bank of Jordan .
19
shows that Jordan is performing better than Lebanon and Egypt. The major strength
of the Jordanian banking sector is; providing a wide range of financial products and
financial services; following international banking standards regarding capital
adequacy requirements and prudential norms; showing a very healthy ratio of non-
performing loans.
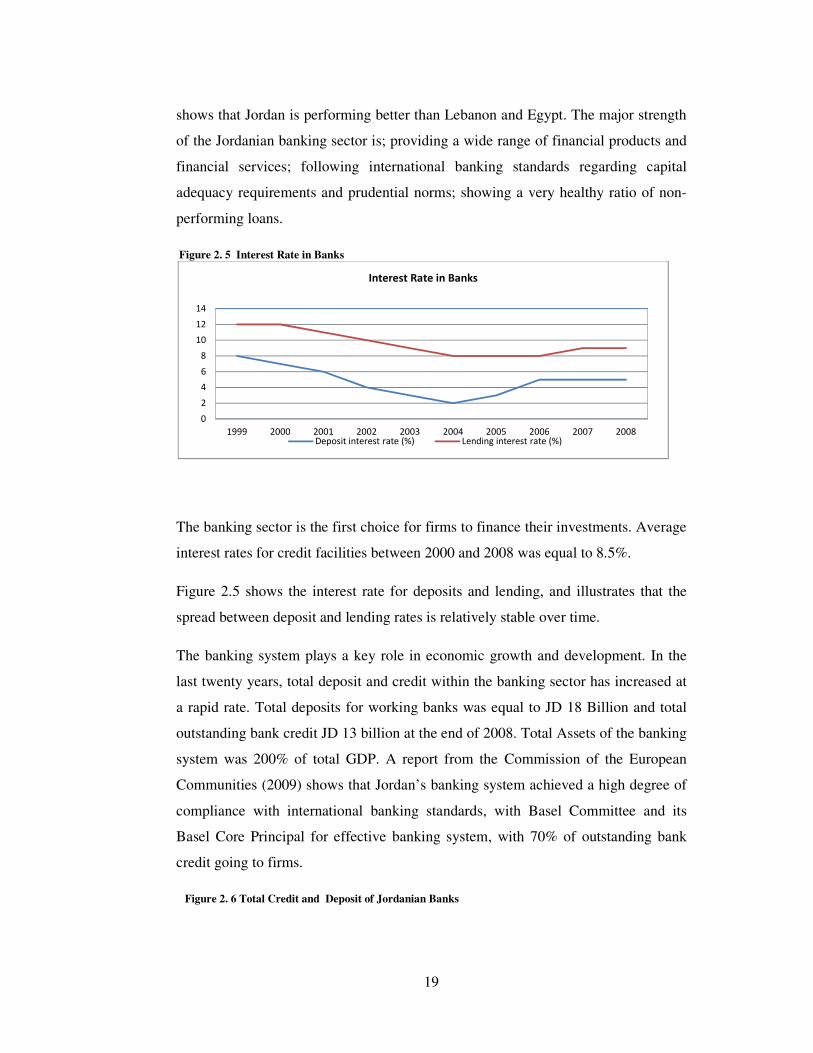
Figure 2. 5 Interest Rate in Banks
The banking sector is the first choice for firms to finance their investments. Average
interest rates for credit facilities between 2000 and 2008 was equal to 8.5%.
Figure 2.5 shows the interest rate for deposits and lending, and illustrates that the
spread between deposit and lending rates is relatively stable over time.
The banking system plays a key role in economic growth and development. In the
last twenty years, total deposit and credit within the banking sector has increased at
a rapid rate. Total deposits for working banks was equal to JD 18 Billion and total
outstanding bank credit JD 13 billion at the end of 2008. Total Assets of the banking
system was 200% of total GDP. A report from the Commission of the European
Communities (2009) shows that Jordan’s banking system achieved a high degree of
compliance with international banking standards, with Basel Committee and its
Basel Core Principal for effective banking system, with 70% of outstanding bank
credit going to firms.
Figure 2. 6 Total Credit and Deposit of Jordanian Banks
0
2
4
6
8
10
12
14
1999 2000 2001 2002 2003 2004 2005 2006 2007 2008
Interest Rate in Banks
Deposit interest rate (%) Lending interest rate (%)

20
Source: Central Bank of Jordan
Jordanian banks play a key role in promoting economic growth through utilising
national savings to finance deficit units and different economic sectors. Table 2.4
shows the credit facilities provided by Jordanian banks to the major economic
sectors. The general trade sector uses the largest amount of credit facilities with a
total of $4.5 billion in 2009 and growing at 10% in 2009. This sector includes trade,
restaurants and hotels, and contributes 10% to GDP.
Table 2. 4 Credit Facilities Extended by Jordanian Banks by Economic Activity
Years 2000 2001 2002 2003 2004 2005 2006 2007 2008 2009
Agriculture 180 149 145 139 160 156 199 220 296 326
Mining and
Quarrying 142 110 134 110 110 80 60 93 68 85
Manufacturing 964 1027 1114 1130 1262 1384 1541 1901 2253 2300
General trade ,
Restaurants,
and Hotels 1787 1942 2008 2115 2295 2490 2977 3794 4602 5109
Construction 1050 1028 1079 1134 1344 1639 2201 2738 3233 3641
Transport and
Communicatio
ns 189 186 231 235 245 310 410 497 522 639
Trade,
Restaurants,
and Hotels 219 241 245 244 218 255 275 361 517 603
Public services
and utilities 338 460 493 492 697 781 899 1035 1227 1282
Financial
Services 215 213 197 188 137 248 341 550 617 612
Source, Central Bank of Jordan. Numbers are in US$ million
However, Jordanian banks may follow a restrictive credit policy. The main reason
for this is the geographical location of Jordan, being located in an unstable political
0
5,000
10,000
15,000
20,000
1993 1994 1995 1996 1997 1998 1999 2000 2001 2002 2003 2004 2005 2006 2007 2008
Total Deposit Outsatanding Banks Credit
Total Credit & Deposit of Jordanian Banks in JD millions

21
region. Jordan shares a border with Iraq, and this may encourage Jordanian banks to
become more cautious when they consider providing loans.
2.3 JORDAN STOCK MARKET
“ASE has become one of the region’s most transparent and efficient stock markets,
which has increased its attractiveness for foreign and domestic investors” Martin
and Saadi-Sedik (2006), which shows that the strong performance of the ASE has
had a positive impact on the Jordanian economy.
The Jordan stock market was established in 1978. The main aim of the Jordan stock
market is to establish a formal mechanism for firms to raise capital and for people to
exchange and trade financial securities on Jordanian firms. In 1978 the total market
capitalization of listed firms was equal to JD 286 million. In the last ten years the
market capitalization of listed firms increased substantially. Table 2.5 shows the
main figures of the ASE. The market capitalization for firms listed in the ASE
increased from JD 3.5 billion in 2000 to JD 26 billion at the end of 2008, or 226.3%
of the GDP, which indicates the growing importance of the Jordanian companies to
the economy, and makes Jordan one of the largest emerging equity markets relative
to GDP in the world. The major improvement in the Jordanian stock market was
in1997, when the Jordanian government issued a new law called the Financial
Securities Law, and Amman Stock Exchange (ASE) became the official Jordanian
financial market.
Table 2. 5 Main indicators for ASE Year Number of Listed
Companies Market Capitalization (JD million)
Value Traded (JD million)
Market Capitalization / GDP (%)
Dividend Yield Ratio (%)
2000 163 3,509.60 334.70 58.40 3.61
2001 161 4,476.40 668.70 71.50 2.74
2002 158 5,029.00 950.30 80.40 3.23
2003 161 7,772.80 1,855.20 116.8 2.42
2004 192 13,033.80 3,793.20 184.7 1.72
2005 201 26,667.10 16,871.00 326.6 1.61
2006 227 21,078.20 14,209.90 233.9 2.33
2007 245 29,214.20 12,348.10 289 1.84
2008 262 25,406.30 20,318.00 226.3 2.51
Source: ASE market Information available on:http://www.ase.com.jo/en/node/536

22
The financial sector is the biggest sector in Jordan, with a market capitalization
amounting to JD 15.5 billion or 61% of the total market, followed by the industrial
sector with JD 6.3 billion , or 25% of the total market, followed by the services
sector with JD 3.7 billion or 14% of the total market. Figure 2 shows the market
capitalization for the main sectors in ASE.
Figure 2. 7 Market Capitalization of Listed Firms on ASE (2008)
Amman Stock Exchange Indices:
The ASE uses three methodologies to calculate the market index. The aim of using
different methodologies is to measure stock price movements more accurately. An
Unweighted Price Index was the first index used in Amman Financial Market
(AFM) in 1980. Data from 38 firms was used to construct the Unweighted Price
Index.
1- Unweighted Price Index: All stocks included in the index have similar weights,
and the market value of the firm does not affect the weight given for stock price.
2- Market Capitalization Weighted Price Index: this index comprises the most liquid
100 firms, and gives an indication of the change in total market value, since the most
liquid 100 firms equal 90% of market value.
3- Free Float Weighted Price Index: this index uses the market value of stock
available for trading instead of the total number of stock outstanding. This method is
not biased by large firms with shares that are not available for trading.
The ASE uses a price index weighted by the market capitalization of free float as
a calculation method to measure the performance of stock market, limiting the
effect of large market capitalization companies.
Financial
61%Services
14%
Industry
25%

23
The ASE stock Index increased from 1090 point in 2002 to 4260 point in 2005,
reflecting the importance of the ASE as a stock market. In addition, market
capitalization increased over the same period from JD 5,029 million in 2002 to
26,667 million in 2005. However, during 2006 the ASE stock index dropped by
29.3%. The main reason for the sharp drop in the ASE stock index in 2006 was the
establishment of 26 new companies and the increase in capital of listed companies.
During 2006 the capital of firms in ASE increased from JD 3.0 billion to JD 4.6
billion. The drop in the ASE stock index in 2006 reflects that the ASE may suffer
from a liquidity problem and increasing the number of new firms and new capital for
existing firms may lead to a decline in market liquidity, as a consequence stock
prices dropped, leading the ASE index to fall.
In 2007 the ASE stock index started to recover and achieved a 36% increase
comparing with 2006. The paid in capital of companies listed in the ASE increased
from JD 4.6 billion to JD 5.4 billion. In addition, 18 new firms listed on ASE. In
2008 the total value of traded stock and bonds in ASE amounted to JD 20.3 billion,
compared with JD13.1 billion in 2007. The Jordan stock market is performing
well and the global crisis in 2007-2008 has had a limited effect on ASE
compared with other regional countries. During 2008 the ASE index dropped by
25%, the Egypt stock index dropped of 56%, and the Dubai Stock market index
dropped by 70%.
Figure 2. 8 ASE General Free Float Weighted Price Index
Table 2.6 shows the percentage of foreign investors in listed companies in the ASE
between the period 2000 to 2008 in all listed firms, services, and industrial sectors.
There has been a 14.1% increase in the number of foreign investors since the
establishment of the ASE in 2008. In addition, the percentage of foreign investors
increased by 142% for the services sector and 75% for the industry sectors. The
0
1000
2000
3000
4000
5000
2002 2003 2004 2005 2006 2007 2008 2009
ASE General Free Float Weighted Price Index (point)
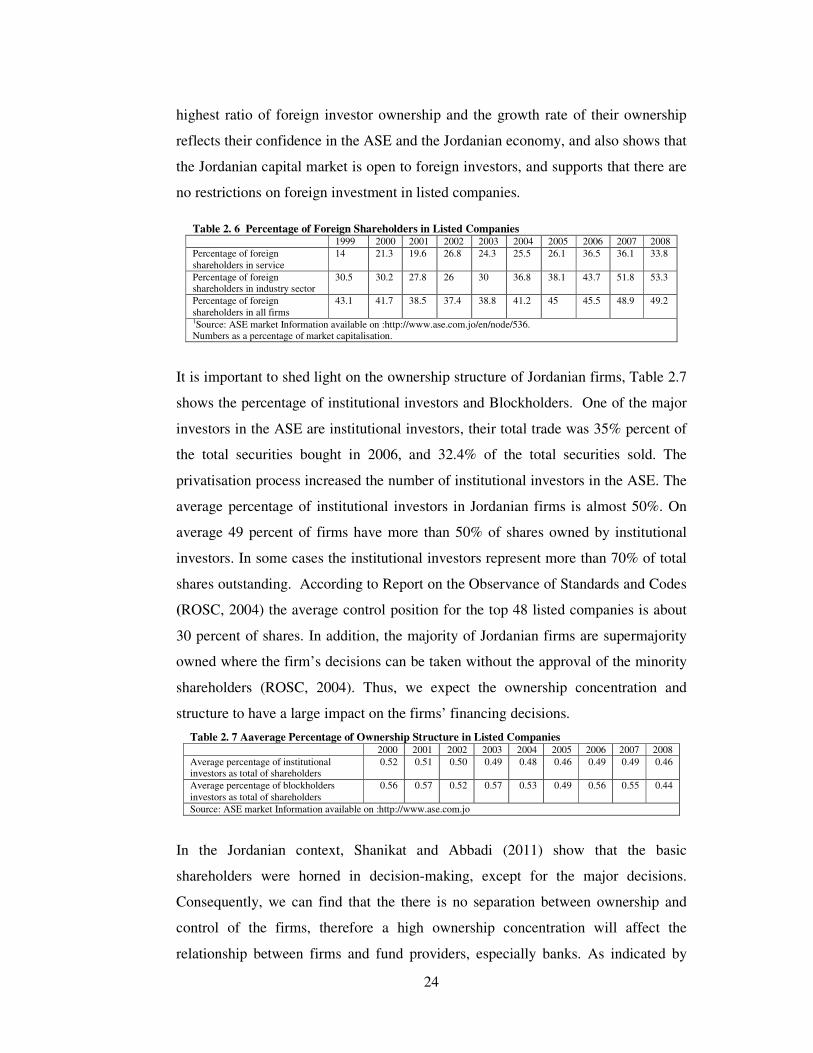
24
highest ratio of foreign investor ownership and the growth rate of their ownership
reflects their confidence in the ASE and the Jordanian economy, and also shows that
the Jordanian capital market is open to foreign investors, and supports that there are
no restrictions on foreign investment in listed companies.
Table 2. 6 Percentage of Foreign Shareholders in Listed Companies
1999 2000 2001 2002 2003 2004 2005 2006 2007 2008 Percentage of foreign shareholders in service
14 21.3 19.6 26.8 24.3 25.5 26.1 36.5 36.1 33.8
Percentage of foreign shareholders in industry sector
30.5 30.2 27.8 26 30 36.8 38.1 43.7 51.8 53.3
Percentage of foreign shareholders in all firms
43.1 41.7 38.5 37.4 38.8 41.2 45 45.5 48.9 49.2
1Source: ASE market Information available on :http://www.ase.com.jo/en/node/536. Numbers as a percentage of market capitalisation.
It is important to shed light on the ownership structure of Jordanian firms, Table 2.7
shows the percentage of institutional investors and Blockholders. One of the major
investors in the ASE are institutional investors, their total trade was 35% percent of
the total securities bought in 2006, and 32.4% of the total securities sold. The
privatisation process increased the number of institutional investors in the ASE. The
average percentage of institutional investors in Jordanian firms is almost 50%. On
average 49 percent of firms have more than 50% of shares owned by institutional
investors. In some cases the institutional investors represent more than 70% of total
shares outstanding. According to Report on the Observance of Standards and Codes
(ROSC, 2004) the average control position for the top 48 listed companies is about
30 percent of shares. In addition, the majority of Jordanian firms are supermajority
owned where the firm’s decisions can be taken without the approval of the minority
shareholders (ROSC, 2004). Thus, we expect the ownership concentration and
structure to have a large impact on the firms’ financing decisions.
Table 2. 7 Aaverage Percentage of Ownership Structure in Listed Companies
2000 2001 2002 2003 2004 2005 2006 2007 2008 Average percentage of institutional investors as total of shareholders
0.52 0.51 0.50 0.49 0.48 0.46 0.49 0.49 0.46
Average percentage of blockholders investors as total of shareholders
0.56 0.57 0.52 0.57 0.53 0.49 0.56 0.55 0.44
Source: ASE market Information available on :http://www.ase.com.jo
In the Jordanian context, Shanikat and Abbadi (2011) show that the basic
shareholders were horned in decision-making, except for the major decisions.
Consequently, we can find that the there is no separation between ownership and
control of the firms, therefore a high ownership concentration will affect the
relationship between firms and fund providers, especially banks. As indicated by

25
Centre for International Private Enterprise (2003) most of the investors in emerging
markets, including Jordan, are short term investors rather than owners of the firms.
Thus, we expect banks to take this point into account when they provide credit for
firms, where they prefer to lend to firms with a high ownership concentration.
2.3.1 Legal Structure of Amman Stock Market
Jordan Government issued Article 72 of the No. 76 of 2002. This law defined the
structure of ASE, trading rules, and type of securities traded on ASE. The ASE is
divided into a primary and secondary market.
1- Primary Market: This is the market that deals with new issuance of securities for
existing and new firms. Securities issued in the primary market in ASE are: stocks,
corporate bonds, treasury bills, and treasury bonds.
2- Secondary market: This is the market where issued securities are bought and sold
in accordance to Securities laws. The secondary market is divided into the First
Market and the Second Market. According to Jordan Securities law definitions of
first and second market are:
1. Second Market: That part of the Secondary Market through which trading takes place in
securities that are governed by special listing requirements, in accordance with the ASE Securities
law. Companies listed in second market are:
• All new companies that want to trade their shares on Amman Stock Exchange.
• Companies that transferred to second market from the first market because of any of the
following cases occurred, according to Article 8 in Securities law :
A- If the Net Shareholders' Equity decreased to less than 75% of the paid-in capital.
B- If the Company accounts show losses in the last three fiscal years.
C- If the Company's Free Float ratio shares drop to less than the end of its fiscal year by:
1. 5% if its paid-in capital is 50 million Jordanian Dinars or more.
2. 10% if its paid-in capital is less than 50 million Jordanian Dinars.
D- If the number of company shareholders drops to less than 75 by the end of its fiscal year.
E- If the days of trading on company shares over the last twelve months drop to less than the
minimum set. The minimum days of trading in the Company shares must not be less than 20% of
overall trading days over the last twelve months.
F- If the percentage of traded free float drops during the last twelve months to less than 10% at the
end of its fiscal year.

26
2. First Market: That part of the Secondary Market through which trading takes place in
securities that are governed by special listing requirements, in accordance with Securities law. The
requirements to transfer from the second market and listing on first market in accordance to
Securities law No.76 article 7 are:
A- The company must be listed for a full year at least on the Second Market.
B- The company's Net Shareholders' Equity must not be less than 100% of the paid-in capital.
C- The company must make net pre-tax profits for at least two fiscal years out of the last three years
preceding the transfer of listing.
D- The company's (Free Float) to the subscribed shares ratio by the end of its fiscal year must not be
less than:
1. 5% if its paid-in capital is 50 million Jordanian Dinars or more.
2. 10% if its paid-in capital is less than 50 million Jordanian Dinars.
E- The number of Company shareholders must not be less than 100 by the end of its fiscal year.
F- The minimum days of trading in the Company shares must not be less than 20% of overall trading
days over the last twelve months, and at least 10% of the Free Float shares must have been traded
during the same period.
Accordance to article 9 in Amman Securities law: the listing of a Company's shares shall be
transferred from the Second Market to the First Market, and form the First Market to the Second
Market, once during the year, upon the provision of the financial statements to the ASE.
2.4 JORDAN CORPORATE BOND MARKET
The total market value of bonds in the ASE is very low. The value traded in 2008
was JD 0.6 million with 427 bonds, which indicates the limited impact of the bond
market on the growth of firms and Jordan’s economy. At the end of year 2008 only
7 firms have issued bonds with a total market value amounting to JD 82 million.
2.5 SUMMARY
This chapter highlights the main characteristics of the Jordanian economy and its
banking and capital market, and shows their relationship with the various economic
sectors. Since 1999 the Jordan economy has witnessed many major reforms. The
Jordanian economy now is open to other economies, growing, has a normal inflation
rate, and most of the government enterprises have been privatised. However, the
trade deficit is very high due to high energy costs. The financial system is classified
as a bank-based system where the banking sector is well-developed, efficient and

27
working on a commercial basis. The banking system plays a key role in the
Jordanian economy, where firms using bank debts for their investment. The stock
market is still in a developing process, and the major development started after
1999, while ownership of firms remains concentrated. The bond market is very
shallow and needs more development. As aforementioned, the services and
industrial sectors are very important to Jordanian economic growth. These factors
are likely to have significant implications for firms’ financing decisions, which this
research will investigate in the subsequent chapters.

Chapter Three
28
CHAPTER THREE
FINANCIAL CONSTRAINTS ON CORPORATE
INVESTMENT
3.1 INTRODUCTION
One of the most important decisions taken by firms is the investment decision.
Analysing the investment decision has been at the core of much research in finance.
This research has focused on the factors that affect the investment decision, and in
particular whether firms are prevented from making otherwise worthwhile
investments by the availability of finance. Based on the standard investment model,
in the presence of perfect capital markets, the firm’s investment decision should
depend only on the desired or required rate of return, which means that the firm’s
investment decision should not be affected by the financing decision. Notably, the
availability of internal finance, whether it is cash flow or current profit, must not be
seen to affect the firm’s investment decision. The investment model should capture
the investment opportunity of a firm, whilst the inclusion of internal finance
variables should not yield any significant relation with the amount invested at any
particular point in time. If any internal finance variables are significant when
included in the investment equation, then this can be taken to show the presence of
financial constraints on firm investment (see Kadapakkam et al., 1998).
In the presence of market imperfections, internal and external finance will no
longer be perfect substitutes for each other. The firm will be unable to separate the
investment decision from the financing decision because the method of financing
will influence the cost of financing, and thereby influence the investment that the
firm can make. The firm is therefore regarded as being financially constrained
when the firm’s spending on investment is affected by the availability of internal
finance. Alternatively, we can define a financially constrained firm as one where
the cost of external finance (new shares or debt) is greater than the cost of internal

Chapter Three
29
finance, thus leading the firm to face a financing hierarchy in its source of funds. It
is likely that imperfections in the financial market in ASE will create financial
restrictions on a Jordanian firm’s investment, and thereby create a disparity
between the cost of external finance and the cost of internal finance (see
Kadapakkam et al., 1998).
There has been an extensive debate in the literature as to why the cost of external
finance might be different from the cost of internal finance. Many articles have
justified the difference in terms of the presence of transaction costs, taxation costs
and bankruptcy costs. Others have justified this difference by the presence of
asymmetric information between the insiders and outsiders of the firm,
emphasising the issues of adverse selection and moral hazard, which lead to an
increase in external costs and the discouragement of financing firm investment
from outside sources. The result is that firms will prefer internal sources of funds
because they are less costly, and in extreme cases internal funds might be the only
source of funds available to the firm.
In general terms, the investment and financing decisions are no longer independent
if the cost of financing is dependent on the source of that financing. More
specifically, it means that not only is the investment decision dependent on the
financing decision, but that the investment decision taken by the firm can be a way
of investigating the presence of financing constraints. A large amount of research
has investigated this relationship between the financing and investment decisions
by analysing the relationship between firm investment or capital expenditure and
firm cash flows. The presence, and extent, of a relationship between investment
and cash flow is a measure of the financial constraints on a firm’s investment, and
is referred to as the investment-cash flow sensitivity. If a firm’s investment is
sensitive to its cash flow, then this suggests that the firm is constrained from
investing by raising capital from external sources.
3.2 THE INVESTMENT CASH FLOW RELATIONSHIP
An early analysis of the potential impact of asymmetric information between the
firm and its external supplier of funds was presented by Myers and Majluf (1984).

Chapter Three
30
They developed the notion that as a result of this asymmetric information, firms
would choose to rely on internal funds to finance new investment, and once these
internal funds had been utilised, they would then revert to external sources of
funds, with debt being preferred to equity. This was developed further by
Greenwald et al., (1984), who argue that it is the availability of debt, and not the
cost of debt, that limits firms from investing in new positive net present value
projects. Moreover, the information problem between investors and the firm would
decrease if the investors know the methods the business will utilise to invest their
money.
The importance of the availability of internal funds has lead many papers to
examine the relationship between a firm’s investment and the availability of
internal funds. An early example of this was conducted by Fazzari et al., (1988),
who subsequently found that there is a positive relationship between firm
investment and cash flow. The major contribution of this particular paper can be
seen from two different perspectives: The first one is the addition of a cash flow
variable to the investment model in order to measure directly the financial
constraints on firm investment. The second contribution is the grouping of firms
into two depending on whether they can be classified as constrained or
unconstrained. The classification criteria include factors such as the payout ratio,
firm size or firm age. Following classification, the model is tested on each group
separately with the cash flow coefficient being compared between the two groups.
They find that investment in firms with a high dividend retention ratio, or
equivalently a low payout ratio, is more sensitive to the availability of internal cash
flow. They interpret this result as demonstrating that these firms are more
financially constrained as a result of their payout policy.
The next section summarises the main literature that has evaluated the factors that
affect the firm’s investment cash-flow sensitivity.
3.2.1 Review of firm’s Characteristics and Investment-Cash Flow
Relationship
A number of studies have examined the impact of the firm’s characteristics on the
relationship between investment and cash flow. The main idea is that the firm’s

Chapter Three
31
unique characteristics may influence the extent of the asymmetric information
problem between the firm’s management and investors, which in turn affects the
wedge between the cost of external funds and the cost of internal funds. An
alternative perspective has been developed by agency cost theory, which predicts a
positive relation between a firm’s investment and its cash flow, Jensen and
Meckling (1976). Here, the agency problem is one where the firm’s managers have
an incentive to overinvest in order to increase the personal benefits they can
acquire from empire building. Agency costs refer to any costs that the firm’s
owners have to pay in order to ensure that the firm’s managers make optimal
decisions on behalf of the firm’s owners. Therefore, the main challenge for most
researchers is to identify the firm characteristics that can be used as classification
criteria to reflect the degree of asymmetric information and/or agency cost (i.e. the
characteristics that help to explain the reasons for the wedge between the cost of
external and internal funds). Fazzari et al., (1988) confirmed that firm
characteristics do appear to affect the sensitivity of investment to cash flow.
A number of studies have since been conducted to examine this relationship, using
different firm characteristics or using different data sets. For example, Gilchrist and
Himmelberg (1995) use different classification criteria to identify firms facing
financial constraints, including commercial paper issuance, bond ratings and firm
size. The impact of firm size on the investment – cash flow sensitivity has also
been examined explicitly by Kadapakkam et al., (1998). They argue that large
firms should be less affected by the availability of internal cash flow because they
are well-known to investors and lenders, and have less asymmetric information.
However, their results show that corporate investment is affected by the availability
of cash flow. In contrast to their expectations, they find that large firms’
investments are more sensitive to the availability of internal cash flow, and they
interpret this result by concluding that internal cash flow is less costly than funds
from external sources. Large firms’ investment will be affected by cash flow
because they have the flexibility and ability to reschedule their investment until the
availability of this cash flow. However, Rauh (2006) finds that small and medium
firms are more financially constrained.

Chapter Three
32
This analysis is extended by Cleary (1999), who investigates the relationship
between firm investment and cash flow, taking into consideration the financial
status of the firm and its effect on the firm’s ability to borrow. Cleary measures
firm financial status using several financial ratios (liquidity, leverage, profitability,
and growth), and expects that firms with strong creditworthiness will pay a lower
premium on money borrowed from banks, and should be classified as being less
constrained. However, Cleary finds that firms with high creditworthiness depend to
a greater extent on internal cash flow when financing their investments, whilst
investment-cash flow sensitivity is lower in those businesses with low
creditworthiness rating. Cleary interprets this finding from the perspective of free
cash flow theory, whereby the firm’s managers increase firm spending on
investment in response to the availability of free cash flow.
Alternatively, characteristics of the firm’s ownership might be important factors in
influencing investment-cash flow sensitivity. Goergen and Renneboog (2001)
consider the impact of ownership concentration, and suggest that the presence of a
large block shareholder will decrease the liquidity constraints on firm investment
by reducing the problem of asymmetric information, while at the same time reduce
the overinvestment problem by monitoring and controlling managers’ use of free
cash flow. Their results confirm that the presence of block shareholders lowers the
investment - cash flow sensitivity. A similar finding with respect to institutional
shareholders has been found by Attig et al., (2012). They show that the degree to
which firms rely on internally generated cash flow to fund their investments is
reduced as the investment horizon of institutional investors increases. Finally, Firth
et al., (2008) investigate the impact of bank ownership, and find that state-owned
banks impose fewer lending restrictions on firms with a high level of state
ownership in their capital. This shows that the relationship between banks and
firms decreases the restriction on external finance.
The focus on firm characteristics has been extended by Bhagat et al., (2005), who
examine the relationship between investment and cash flow for distressed firms,
where distressed firms are those that cannot meet their obligations using internal
cash flow. Their results show that investment-cash flow sensitivity in distressed
firms depends on the type of distressed firm. Distressed firms with profits yield a

Chapter Three
33
positive relationship between investment and cash flow, whereas those with
operating losses yield a negative relationship. Bhagat et al., argue that the negative
relationship is due to the impact of external financing. Specifically, firms with an
operating loss finance their investment from external finance, and in particular
from external equity. The hypothesis is that external equity investors are willing to
finance firm investment in distressed firms in the expectation of better future
conditions, and because of limited liability they are prepared to invest in these
riskier firms.
A different approach has been taken by Beck et al., (2006), who examine the
determinants of financial obstacles on firm investment through a survey of over
10,000 firms in 80 countries. Their results show that the age and size of the firm,
and the type of ownership, affect the financial obstacles to firm investment. Smaller
firms face more financial constraints than larger firms, thus indicating that large
firms suffer less from asymmetric information and have a greater access to external
sources of funds. In addition, they find that financial system development decreases
the financial obstacles on firm investment.
The type of asset held by the firm may also be important. Almeida and Campello
(2007) find that investment in firms with a high tangibility of assets is not affected
by changes in internal funds. Asset tangibility affects the sensitivity of investment
to cash flow in financially constrained firms, but does not affect it in financially
unconstrained firms. The theoretical basis behind this proposed relationship relates
back to what is referred to as the credit multiplier, which means that the firm can
extend its credit ability by holding more tangible assets. The results support the
hypothesis that investments in firms with high asset tangibility are unaffected by
changes in internal funds.
Lyandres (2007) obtains similar results for the impact of firm age on the
investment - cash flow sensitivity. Mature firms have a lower sensitivity between
investment and cash flow because they suffer less from asymmetric information.
As a result the cost of external finance is lower, and they have greater access to the
external market.
Chapter Three
34
3.2.2 The Financial System and Investment Cash Flow Relationship
In contrast to the research focusing on firm characteristics, an alternative approach
has been to examine how the financial system might affect the extent of
asymmetric information and agency costs. Here research has considered how
differences in the structure or development of financial systems will affect the
wedge between the cost of internal and external finance. A potentially important
aspect of financial systems is whether they are bank-based systems or market-based
systems. Firms in bank-based systems should be less financially constrained
because their close relationship with banks can reduce the moral hazard and
asymmetric information problems. Banks can effectively monitor the firm’s uses of
funds (Petersen and Rajan, 1997). On the other hand, the asymmetric information
problem increases in a market-oriented financial system, leading to an additional
cost premium from utilising external funds to finance firm investment.
Consistent with this, there is evidence of a closer relationship between firms and
creditors represented by banks in the German financial system, which subsequently
leads to less asymmetric information between firms and suppliers of funds
(Audretsch and Elston, 2002). This reduces liquidity constraints on firm
investment, particularly among small firms when compared to the financial
constraints on small firms in Anglo-Saxon countries with market-based financial
systems. As a result, firms depend more on debt financing from banking to finance
their new investment. Similar results were obtained by Bond et al., (2003), who use
firm datasets for Belgium, France, Germany, and the United Kingdom. The results
highlight a positive and significant impact of cash flow upon firm investment
within the UK, but notably a less important role in France, Germany, and Belgium.
The results also indicate that the market-oriented financial system within the UK
does not work as effectively in terms of providing firms with the required amount
of funds.
These findings were confirmed by Mizen and Vermeulen (2006), who find that
investment-cash flow sensitivities amongst UK firms are greater than German
firms owing to the greater asymmetric information in a market-financed system.
They extend previous studies by examining the impact of creditworthiness, and
find that investment-cash flow sensitivities are lower in firms with high

Chapter Three
35
creditworthiness (measured by sales growth and net profit margin). These results
are consistent with the theory that firms with a healthy and good financial position
have better access to external finance. However, Aggarwal and Zong (2006) find
that investment in unconstrained firms in market-based countries is less affected by
the availability of internal cash flow compared with constrained firms. On the other
hand, investment in unconstrained firms amongst bank-based countries is more
affected by the availability of internal cash flow compared with constrained firms.
This analysis is extended by Becker and Sivadasan (2010) using data from 21
European countries. They find that investment-cash flow sensitivity is lower in
more developed countries, such as Switzerland, compared with less developed
countries, such as Italy and Hungary, as a result of the reduction in market
imperfections in a well developed financial system. Baum et al., (2011) also find
that the firm’s financial constraints can be reduced by the structure and the
development of the financial system. They show that firms in bank-based markets
are less financially constrained than firms in market-based countries, confirming
that bank-based systems ease the obstacles to external sources of fund because the
relationship between firms and banks reduces the asymmetric information problem
due to the banks’ monitoring of the firm’s activities.
Other research has examined the impact of the development of the financial system
over time on the financial constraints on firm investment. Financial system
development should improve firm access to external finance as it leads to fewer
imperfections in the market, measured by transaction costs, agency problems and
asymmetric information. Love (2003) confirms that financial development reduces
financial constraints on firm investment, firms in developing countries having
greater financial constraints. Laeven (2003) argues that financial liberalisation
decreases financial constraints more for small firms than for large firms. Similar
results are also obtained by Bhaduri (2005) and Ghosh (2006), who find evidence
that improving the financial system will decrease the firm’s investment sensitivity
to cash flow, as a result of improved access to external finance. Bhaduri argues that
small and young firms face more financial constraints before and after financial
liberalisation, and that the financial constraints are greater after liberalisation
because of the withdrawal of government support. Similarly, Baum et al., (2011)
Chapter Three
36
find that financial development reduces financial constraints, because the
strengthening of financial institutions enables firms to access funds at a lower cost.
Brown and Petersen (2009) extend this by examining the impact of the equity and
debt finance channels on the investment cash flow sensitivities. They find that the
improvement of the equity market in the US during the last two decades has
decreased the financial constraints on US firms. The major improvements being;
the establishment of NASDAQ in 1971 and the creation of the National Marking
System; the rise of mutual funds playing a key intermediary between firms and
households; and the inclusion of a wider range of investments in fund portfolios.
There is a general consensus that improvements in financial markets lead to a
decrease in financial constraints on firm investment, because improvements in
capital markets lead to fewer market imperfections and the increased use of
external equity finance. Brown and Petersen include new equity and new debt
issuance to control for the availability of external finance in investment cash flow
sensitivities. Using data for US non-financial firms between 1970 and 2006, they
find that the investment cash flow relationship is also affected by the changing
composition of firms’ investment between physical and R&D, and the increasing
importance associated with the equity market. The relationship between firm
investment and physical expenditure disappears over time, which is consistent with
their finding that firms’ spending on physical expenditures declines over time in
favour of R&D expenditures. On the other hand, the result shows the increasing
impact of internal cash flow on R&D expenditure, which is in line with firms’
spending on R&D increasing over time as a portion of total investment.
3.2.3 Business Group and Investment Cash Flow Relationship
Some research has suggested that the financial constraints on firm investment may
be reduced if the firm belongs to a business group. They provide evidence that the
business group provides firms within the group with funds, reduces their need for
external funds and decreases the investment cash flow sensitivity. Hoshi et al.,
(1991) explore this in the context of the relationship between firm investment and
internal funds, taking into account firm membership in a group of firms, in this
case a Keiretsu. The results support the view that the relationship between firms

Chapter Three
37
and banks has an impact on firm investment, firms belonging to a Keiretsu group
being less financially constrained. This confirms that the Keiretsu provides a strong
link for member firms to raise debt from financial institutions. Similar results of a
reduction in investment-cash flow sensitivities for firms belonging to a corporate
group were found by Deloof (1998) for firms belonging to corporate groups in
Belgium. Finally Gorodnichenko et al. (2009) study the investment-cash flow
sensitivity of firms from German Konzerns, where a Konzern is “a group of
affiliated companies consolidated under unified leadership of a ruling company”.
They show that small firms in Konzerns have a lower sensitivity of investment to
cash flow than firms that do not belong to a business group. Thus, different types of
business group play an important role in allowing firms to reduce the sensitivity of
investment to cash flow, and therefore reduce the financial constraints on corporate
investment.
In the context of developed banking systems and the underdevelopment of capital
markets, Fohlin and Iturriaga (2010) investigate the impact of the bank-firm
relationship on financial constraints for firm investment in Spain. They suggest that
a close relationship between firms and banks will decrease investment cash flow
sensitivities because banks provide firms with the required amount of liquidity.
They present two indicators of the bank-firm relationship; the amount of bank
equity ownership in firm capital, implying that the bank will be a creditor and an
investor in the firm at the same time; and the amount of bank debt to total debt,
where firms with a high ratio of bank debt to total debt will be closer to the bank.
In contrast to expectations, the bank-firm relationship has little impact on
investment-cash flow sensitivities, whereas it is lower in firms with large block
shareholders. This implies that the bank’s relationship with the firm is not a perfect
substitute for supervision by large stakeholders, and that firms face an agency cost
problem. Firm managers increase the firm’s size by investing in new projects, even
though such projects are not profitable, and banks cannot effectively monitor these
investment decisions.

Chapter Three
38
3.2.4 Financial crisis and Investment Cash Flow Relationship
Recently some empirical papers have investigated the impact of the financial crisis
on the financial constraints on firms’ investment. During the financial crisis, the
ability and willingness of financial institutions to lend to firms declined, which lead
to an increase in interest rates and a reduced readiness to take risks by providing
firms with funds. Duchin et al., (2010) find that during the financial crisis firm
investment declined significantly, with financially constrained firms being affected
more than financially unconstrained firms. These results support the finding by
Campello et al., (2010) who use survey analysis to show that during the financial
crisis cuts to capital expenditure by financially constrained firms are more severe
than for unconstrained firms. Financially constrained firms were heavily reliant on
internal cash flow during the financial crisis because they have limited access to the
capital markets.
3.3 MODELLING INVESTMENT
Four main testable models have been used to describe firm investment and the
impact of financial constraints. The four models are the neoclassical model, the
sales accelerator model, Tobin’s Q model, and the Euler model (see Goergen and
Renneboog, 2001)
• Neoclassical Model
The neoclassical model was pioneered by Jorgenson (1963), and assumes that firm
investment is determined by the cost of capital. The main argument in this model
implies that firms invest in capital stock if the return on the investment exceeds the
cost of the investment; therefore, the investment equation is as follows:
Firm investment level = function of (cost of capital, cash flow, other variables).
� ����,� � � � ���� ��,� � � ���� ��,��� � � ���� ��,� � ��,� eq. 3.1
Where I represents firm investment, CK represents the cost of capital. In this
model the main aim of the firm is to reach the optimal capital stock in the current
period, thus we can consider desired investment as a change towards the optimal

Chapter Three
39
stock of capital. Jorgenson assumes that the firm will move towards the optimal
stock of capital with a delay. Delivery lags mean that some investment goods
ordered in the current period are delivered in the next period. Considering
investment as a continuous process, we can consider that investment at time t is the
sum of the proportion of the current and the past desired investment which is
delivered at time t, indicating that the cost of capital in the current period and past
period determine the actual investment in time t.
CF represents internal cash flow, which is the variable used to measure the
financial constraint on firm investment, and K is the capital stock. This model
suffers from the difficulty of establishing the firm’s cost of capital.
• Sales Accelerator Model
A widely used model is the sales accelerator model proposed by Abel and
Blanchard (1986), which states that increasing firm sales leads to increasing firm
investment. They introduce an autoregressive model to measure the relationship
between firm investment and sales. In this model, long-run firm investment is a
function of expected future profitability measured by the sales accelerator.
Financial constraints on firm investment exist when a relationship is established
between cash flow and firm investment.
Firm investment level = function of (Sales, cash flow, other variables).
� ����,� � � � �����,� � � �����,��� � � ���� ��,� � ��,� eq. 3.2
where I represents firm investment, S represents firm sales or output as a measure
of future profitability and growth opportunities. CF represents net income plus
depreciation, and is used to measure the financial constraints on firm investment. K
is the lagged net fixed assets.
Laeven (2000) use the sales accelerator model to explore the impact of
liberalisation (deregulation of government controls on interest rates, the removal of
barriers to banking sector entry) on the financial constraints on firm investment.
The sales variable is used as a proxy for investment, and cash flow as a
measurement of financial constraints. The results point to firm investment being

Chapter Three
40
sensitive to the availability of internal cash flow. In addition, firm sensitivities to
cash flow decrease with financial reform and liberalisation. Bhaduri (2005) applied
the model to firm investment in India. The results support the sales accelerator
model, internal cash flow having a positive and significant impact on firm
investment. He found that small and young firms face more financial constraints
than larger and older firms.
• Tobin’s Q Model
The Q Model was presented by Tobin (1969) and extended by Hayashi (1982).
This model implies that future firm investment and profitability can be captured by
the Q value, where Q is equal to the market value of equity and debt divided by the
replacement cost of firm’s capital stock. The model was used by Fazzari, Hubbard
and Petersen (1988), who included the ratio of cash flow to the investment equation
in order to measure financial constraints on firm investment and capture market
imperfections. This model assumes that, in the presence of perfect markets, firm
investment depends only on Q; in other words, cash flow should not affect firm
investment, otherwise market imperfections exist and the firm faces liquidity
constraints.
Firm investment level = function of (Q value, cash flow, other variables).
� ����,� � � � ��,� � � ���� ��,� � ��,� eq. 3.3
where I represents firm investment in fixed assets at the end of period, the Q value
is used as a proxy of investment opportunities. CF represents net income before
extraordinary items plus depreciation, and measures the financial constraints on
firm investment. K is the beginning of period replacement cost of firm capital
stock. In addition, in the presence of adjustment costs to investment, the lagged
value of investment is included to control for the persistence of the investment-
capital ratio that is assumed to be in the data (see, Carpenter and Guariglia, 2008,
Rousseau and Kim, 2008; Brown and Petersen, 2009). As noted by Eberly et al.,
(2012) ‘the best predictor of the current investment at the firm level is lagged
investment’, so including lagged investment will improve the ability of the Q model
to capture investment behaviour.

Chapter Three
41
• Euler Model
An alternative to the Q model for estimating firm investment is the Euler Equation
model presented by Abel (1980) and applied by Bond and Meghir (1994a, 1994b).
An Euler model is derived from the forward-looking dynamic program of a first-
order maximisation conditions, however, when panel data is used and we have
short time series the model is estimated with backward terms and future
expectations. where the firm maximises its value which is a function of the capital
stock from the previous period. The current rate of investment depends on last
period’s investment and the marginal product of capital. If we assume a 2-period
model, then the firm makes its investment decision by comparing the marginal
benefits generated from a unit of capital at time t with the discounted value of the
marginal costs of the investment at time t+1. The advantage of the Euler model is
that it controls for expectational influences on the investment decision (see Bond et
al., 2003), with the previous rate of investment and cash flow playing a crucial role
on current investment. The model assumes the absence of financial constraints:
Current investment level = function of (lagged investment level, cash flow, sales,
other variables).
� ����,� � � � � ����,��� � � � ����,���� � � �����,� � � ���� ��,� � � �����,� � ��,�
eq. 3.4
Bond and Meghir (1994b) show that, in the absence of financial constraints, the
variable coefficients must be as follows ( � � 1, � � �1, � � 0, and � � 0.).
In order for investment to follow its optimal path, all the above restrictions must be
met. I i,t-1 represents the lagged rate of investment, which should have a positive
relationship with the dependent variable because the firm cannot cancel a capital
expenditure commitment. $�,���� represents the squared lagged rate of investment,
and measures the deviation of the current optimal rate of investment from current
actual capital stock. Y represents firm output, and accounts for the impact of
imperfect competition. CF measures the sensitivity of the firm’s investment to
internal cash flow. In the absence of financial constraints, this coefficient must be
negative, which means that a higher level of cash flow implies lower net marginal

Chapter Three
42
costs, which in turn leads to lower expected investment. D represents firm debt,
and captures bankruptcy costs and the tax advantages of debt. All variables are
scaled by the beginning of period replacement cost of firm capital stock K.
3.3.1 Comments on Investment Models
Each of the four investment models has some limitations and shortcomings that
affect their reliability to estimate investment. The neoclassical model lacks the
ability to include any forward-looking variables (Goergen and Renneboog, 2001),
which means that the model does not have the ability to forecast the firm’s future
investment opportunities. It simply shows the main determinants of firm
investment. The sales accelerator model suffers from the same problem, where the
firm’s sales have no expectation regarding the firm’s future growth opportunities.
This model assumes that firm sales grow alongside firm investment, and may not
have any expectational power in relation to future growth opportunities (Goergen
and Renneboog, 2001). Whilst the Euler model includes lagged investment, it is a
fairly restrictive model that again does not incorporate a proxy for the firm’s future
growth opportunities. The use of the Euler model is more appropriate for unquoted
firms where we cannot use the market value as a proxy for investment
opportunities. The model may also be more applicable when estimated over a
relatively long period of time, as it is able to pick up changes in individual firms’
financial positions alongside fluctuations in the economic environment
(Schiantarelli, 1996). The Euler model is therefore not regarded as being well
suited to estimating models of firm investment (Oliner et al., 1995). As a result, the
overwhelming majority of the literature has applied variations of the Q model to
estimate firm investment.
3.4 THEORETICAL FRAMEWORK AND HYPOTHESES
DEVELOPMENT
The impact of the availability of internal finance and external finance on firm
investment is a central issue in the context of corporate finance. Modigliani and
Miller (1958) show that, in a perfect world, the firm’s investment decisions are
independent of the financing decisions, and that the firm must invest only if the

Chapter Three
43
return on the investment is greater than the cost of capital. Recent literature finds
that investment decisions are related to financing decisions because most firms
operate in imperfect markets owing to transaction costs, asymmetric information,
tax costs and agency costs. Myers and Majluf (1984) argue that, in the presence of
perfect markets, external investors have all the information regarding the firm’s
investments, whilst external finance would be a perfect substitute for internal
finance. Firm investment will not be affected by the availability of internal finance,
while in the presence of asymmetric information and transaction costs firms will
face a pecking order, leading to a financing hierarchy. Accordingly, a firm will use
its internal finance before external finance and will prefer debt to equity. The firm
cannot separate the investment decision from the financing decision, owing to the
external source of funds not being a perfect substitute for internal source of funds.
A firm can be defined as financially constrained when investment spending is
affected by the availability of internal funds or the change in internal cash flow.
Alternatively, a firm can be defined as financially constrained when it faces a
financing hierarchy, or follows a financing pattern consistent with the pecking
order hypothesis, where firms utilise internal funds first, and prefer debt to equity
financing. The model in Eq. 3.5 below will therefore be estimated, to test whether
there is any relationship between firm investment and internal cash flow, and
therefore whether firms face constraints on their investment.
H1: All else equal, firms listed in ASE are not financially constrained and therefore
the cash flow coefficient is not significantly different from zero.
3.4.1 Financial Constraints and Market Listing
ASE provides us with a unique opportunity to measure the financial constraints on
firm investment. The ASE secondary market is divided into two markets; the first
market and the second market. Firms listed in the first market are in general firms
in a good financial position, are well known, have a normal free float volume, and
are assumed to be less financially constrained. On the other hand, firms listed in the
second market have suffered from losses, have low free float volume, and are
assumed to be financially constrained and restricted from the credit market. This
listing classification provides us with the opportunity to test whether there are any
Chapter Three
44
differences in financial constraints between those firms listed in the first market
and those listed in the second.
Further, if we can establish any differences in financial constraints between the
firms in the two markets, we can then conclude that the suppliers of funds take into
consideration the financial position of the firm; therefore, they will increase or
decrease financial restrictions on the supply of funds for firms, depending on the
firm’s financial position. In addition, if the firms listed in the second market are
more financially constrained than the first-market firms, one can conclude that the
Amman Stock Exchange successfully discriminates between healthy and less
healthy firms.
H2: All else equal, firms listed in the second market are more financially
constrained than firms listed in the first market, so investment-cash flow
sensitivities will be higher in the second market.
3.4.2 Financial Constraints and Firm Size
One of the most important factors that might affect asymmetric information and
agency costs is firm size. Smaller firms face greater asymmetric information
problems and are assumed to be financially constrained for several reasons: First,
small firms are less able to increase their capital from new issues because of
transaction costs - flotation and underwriting costs decrease proportionately with
the value of the issue (Devereux and Schiantarelli, 1990). Second, large firms may
have a low probability of bankruptcy because they are more diversified and provide
better collateral (Bhaduri, 2005; Kadapakkam et al., 1998), and so large firms may
have better access to debt than small firms: Third, small firms have more
asymmetric information between insiders and outsiders because they are followed
by fewer analysts (Kadapakkam et al., 1998). All of these factors increase the cost
of external sources of finance for small firms, and therefore small firms will face
financial constraints and depend more heavily on their internal sources of finance.
There is evidence that small firms are more financially constrained than large
firms, as shown by Arslan et al., (2006) and Duchin et al., (2010), although other
researchers find that the investment cash flow sensitivity is greater in large firms,

Chapter Three
45
Kadapakkam et al., (1998), Cleary (2006) and Chang et al., (2007). To examine the
effect of firm size, two definitions of size will be used: total assets and the value of
sales. Firms below the sample median will belong to small firms, and firms above
will be classified as large firms; this classification criterion is similar to that of
Kadapakkam et al., (1998), and Duchin et al., (2010).
H3: All else equal, small firms are more financially constrained than large firms,
so investment-cash flow sensitivities will be higher for small firms.
3.4.3 Financial Constraints and Firm Age
It is often argued that young firms are more likely to face a high asymmetric
information problem since outsiders have insufficient data and a short interaction
record with the young firms to evaluate their performance (Guariglia, 2008).
Mature firms are more likely to have lower degrees of asymmetric information
since outsiders know more about the firm. In addition, more mature firms have a
repeated relationship with creditors, which reduces the asymmetric information
between firm and creditors, Schaller (1993). Mature firms have better access to
external financing with lower costs of external financing (Bhaduri, 2005 and
Lyandres, 2007). Brown and Petersen (2009) argue that the age of the firm is
negatively correlated with asymmetric information, and costs of external financing
decrease with firm age, where age is calculated as the point at which the firm is
established. With this in mind, firms were selected into mature and young firms by
splitting the sample at the median of the firm age. The model is estimated for the
entire sample by including the interaction term (cash flow with group dummy)
comprising a dummy variable set to 1 for mature firms and a value of 0 for young
firms.
H4: All else equal, young firms are more financially constrained than mature
firms, so investment-cash flow sensitivities will be higher for young firms.
3.4.4 Financial Constraints and Dividend Payout Ratio
Fazzari et al., (1988) argue that firms with a low payout ratio are more financially
constrained because they expect to face a high cost of external financing. Fazzari et
al., (1988) find that investment cash flow sensitivities are higher for low payout
Chapter Three
46
firms. In contrast, Cleary (2006), Arslan et al., (2006) and Chang et al., (2007) find
that the investment cash flow sensitivity is less for low payout firms. Following
D’Espallier et al., (2008) and Campello et al., (2010), we classify firms into
dividend-paying and non-dividend-paying firms. Accordingly, dividend-paying
firms were split from non-dividend-paying firms on an annual basis. The model is
estimated for the entire sample by including the interaction term (cash flow with
group dummy) comprising a dummy variable set to 1 for dividend-paying firms
and a value of 0 for non-dividend-paying firms.
H4: All else equal, non-paying dividends firms are more financially constrained
than dividend-paying firms, so investment-cash flow sensitivities will be higher
among non dividend paying firms.
3.5 MODEL DESIGN
In the presence of perfect markets, a firm’s current investment must be affected by
the firm’s expected future profitability (Fazzari et al., 1988; Kadapakkam et al.,
1998; Cleary, 1999; Bhagat et al., 2005; and Brown and Petersen, 2009).
Therefore, in the investment equation the equity market-to-book value is used as a
proxy to control for expected future profitability (i.e. investment growth
opportunities) (see, Cleary, 2006 and Allayannis and Mozumdar, 2004). The cash
flow variable is included in the investment equation to measure the financial
constraints on firm investment. A large and positive coefficient for cash flow
means that firms respond to the availability of cash flow by increasing investment
(Fazzari et al., 1988, Bond et al., 2003; Laeven, 2003; Bhagat et al., 2005; Cleary,
2006; Duchin et al., 2010). In the presence of an adjustment cost of investment, the
lagged value of investment is included to the Q model to control for the persistence
of the investment-capital ratio that is assumed to be in the data (see, Carpenter and
Guariglia, 2008, Rousseau and Kim, 2008; Brown and Petersen, 2009). Including
the lagged value of investment will improve the ability of the Q model to model
investment behaviour.
Following Brown and Petersen (2009), Rousseau and Kim (2008), and Ismail et al.,
(2010), we use the dynamic model of investment; the lagged investment to net

Chapter Three
47
fixed assets implies that it may be easier for the firm to continue investment at
some fraction of the previous period’s ratio, due to the presence of adjustment costs
of investment (Brown and Petersen, 2009). Finally, we control for external sources
of finance by adding new debt and new equity issuance to the model. Therefore, the
model is estimated as follows:
� ����,� � � � � ����,��� � � �%&��,� � � ���& ��,� � � �'�� ��,� � � �'(� ��,� � )� � � � *�,� eq. 3.5
Where I is the firm’s investment, represented by the change in the level of net fixed
assets, and defined as {(Net Fixed Asset in year t)–(Net Fixed Asset in year t-
1)+(Depreciation for year t)} see, Miguel and Pindado (2001); K is net fixed assets;
M is the market value of outstanding common equity; B is the book value of
common equity (see, Cleary, 1999); CF represents net income after tax plus
depreciation, which is used to measure financial constraints on firm investment.
ND measures cash flow from new debt, equal to net increase in total debt, and this
is equal to the net increase from year t-1 to year t in {(Total liabilities in year t) –
(Accounts Payable in year t) – (Other Liabilities in year t)}; NE measures new cash
flow as a result of raising capital, and is equal to {(Increase in Paid in Capital from
year t-1 to year1) + (Issuance Premium in year t)}; λt is year dummies which control
for year fixed effects, i is a firm specific effects, and ei,t is the random error term.
3.5.1 Firm’s Characteristics and Investment-Cash Flow Sensitivities
In order to examine whether the investment-cash flow sensitivities are different
between the firms that are assumed to be financially constrained or unconstrained,
we interact the dummy variable with cash flow6, where the dummy variable is set
to 1 if the firm is assumed to be unconstrained, and 0 otherwise.
To determine whether the investment-cash flow sensitivity is affected by the firm’s
characteristics, we estimate an augmented version of equation (3.6), where β6
distinguishes the impact of firm characteristics on investment-cash flow
sensitivities.
6 A similar methodology is used by Duchin et al., ( 2010).

Chapter Three
48
0 $12�,� � � � 0 $12�,��� � � 0342�,� � � 0561 2�,� � � 0781 2�,� � � 0791 2�,� � : 8 ; 0561 2�,� � )� � � � *�,� �< 3.6
D is a dummy variable that captures one of our interested criterion to be tested. To
recap, the criteria are as follows: i) Market listing ii) Firm size iii) Firm age iv)
Firm dividend policy.
3.5.2 Method of Estimation
This study uses panel data estimation to examine the research problem. As in many
studies, for example, (Laeven, 2003; Love, 2003; Ghosh, 2006; Rousseau and Kim,
2008; and Brown and Petersen, 2009) this study uses the Generalised Methods of
Moments method. This method helps us to overcome the endogeneity problem,
which might arise because cash flow, new debt, new capital, the market to book
value, and investment may be simultaneously determined (see, Brown and Petersen
2009). Because the OLS estimator would yield inappropriate results if there is
endogeneity of the model variables, we use the GMM estimator. One approach is
the first-difference Generalised Methods of Moments (GMM) estimator developed
by Arellano and Bond (1991). The differenced-GMM enables us to remove the
time invariant firm characteristic (unobserved individual effect) by taking the first
difference of the variables. In addition, the differenced-GMM controls for possible
endogeneity problems where the differences are instrumented by lagged levels of
the regressors, where valid instruments are not correlated with the error term in the
equation. (Blundell and Bond, 1998) documented that, even if the instruments are
not correlated with the error term, differenced-GMM may perform poorly when the
time dimension of the panel data is relatively small, and the series are persistent,
especially if the instruments are only weakly correlated with the endogenous
explanatory variables. The second approach is the System-GMM. Arellano and
Bover (1995) and Blundell and Bond (1998) extend the differenced-GMM
estimator and introduced another estimator, “derived from estimation of a system of
two simultaneous equations, one in levels (with lagged first differences of the right-
hand side variables as instruments) and the other in first differences (with lagged

Chapter Three
49
levels of the right-hand side variables as instruments)” Alessandrini et al.(2006)
The System-GMM estimator treats this system as a single-equation estimation
problem.
The estimator is called System-GMM because it combines the moment conditions
for the differenced model with those for the levels model. Blundell and Bond
(1998) show that System-GMM is less biased and has more precision, especially
when we have small samples. In the presence of heteroskedasticity and serial
correlation, the two-step System-GMM is more efficient than one-step System-
GMM. “The estimated asymptotic standard errors of the efficient two-step robust
System-GMM estimator are severely downward biased in small samples, and thus
we correct for this bias using the method proposed by Windmeijer (2005)” (see,
Fiordelisi et al. (2011). Blundell and Bond (1998) use all right-hand side variables
in the model lagged twice or more as instruments. However, in this study the
number of cross sections is small, so to avoid the problem of too many instruments
relative to the sample size7, we will use certain lags instead of all available lags for
the instruments. Therefore, we use the second lag of the right-hand side variables in
Eq. 3.5 as valid instruments.8 In addition, System-GMM solves the endogeneity
problem because of the lagged value of the dependent variable (see the following
chapter for more explanation of this issue).
For consistent estimation and in order to avoid misspecification, the System-GMM
estimator requires that the error εi,t to be serially uncorrelated. Specifically, the εi,t
are serially uncorrelated when the ∆εit are correlated with ∆εi,t-1, but not correlated
with ∆εi,t-k for k ≥2. Therefore, the System-GMM estimator is consistent if there is
no second order serial correlation. To check for serial correlation, we will test first
order serial correlation (AR 1) and second order serial correlation (AR 2), under the
null hypotheses there is no serial correlation. The instruments used in the System-
GMM estimator will be valid only if there is no correlation between instruments
and error term. To check the validity of the instruments we use the Hansen-J
statistic, which tests the over-identifying restrictions, under the null hypothesis that
the instruments are uncorrelated with the error term (i.e. instruments are valid).
7 In all regressions the number of instruments is lower than the number of cross sections. 8 I use STATA 11 for all of the estimates.
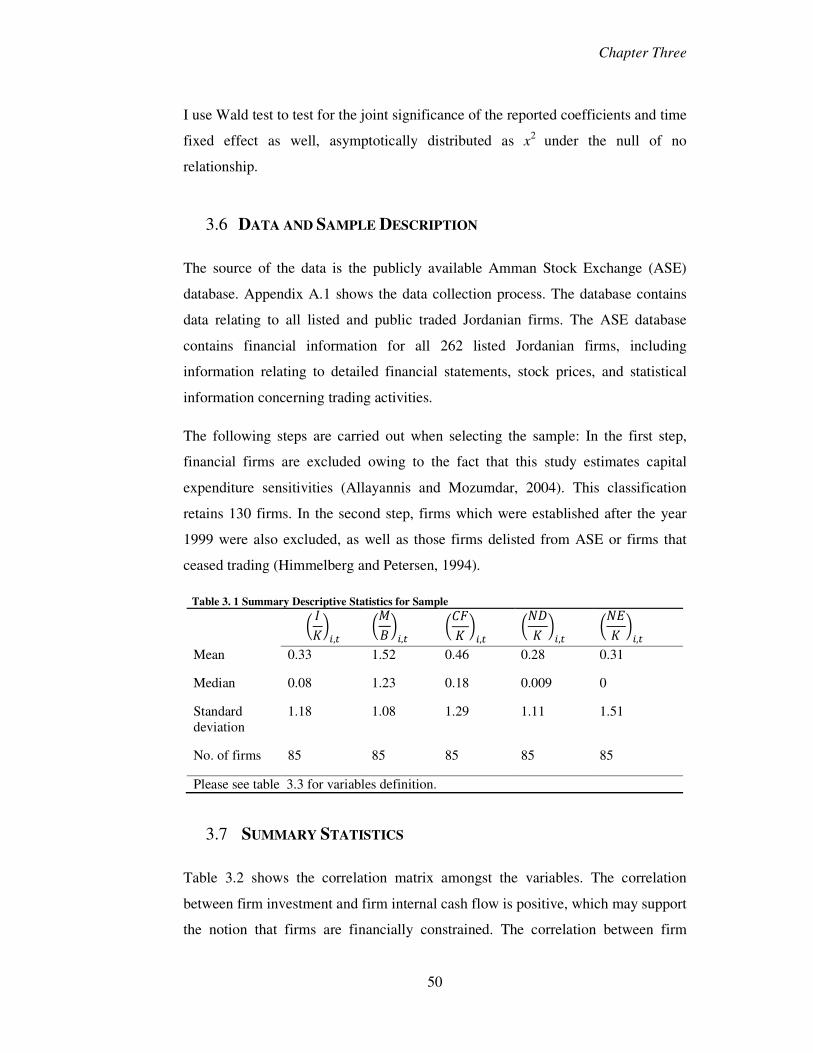
Chapter Three
50
I use Wald test to test for the joint significance of the reported coefficients and time
fixed effect as well, asymptotically distributed as x2 under the null of no
relationship.
3.6 DATA AND SAMPLE DESCRIPTION
The source of the data is the publicly available Amman Stock Exchange (ASE)
database. Appendix A.1 shows the data collection process. The database contains
data relating to all listed and public traded Jordanian firms. The ASE database
contains financial information for all 262 listed Jordanian firms, including
information relating to detailed financial statements, stock prices, and statistical
information concerning trading activities.
The following steps are carried out when selecting the sample: In the first step,
financial firms are excluded owing to the fact that this study estimates capital
expenditure sensitivities (Allayannis and Mozumdar, 2004). This classification
retains 130 firms. In the second step, firms which were established after the year
1999 were also excluded, as well as those firms delisted from ASE or firms that
ceased trading (Himmelberg and Petersen, 1994).
Table 3. 1 Summary Descriptive Statistics for Sample
0 $12�,� 0342�,� 0561 2�,� 0781 2�,� 0791 2�,� Mean 0.33 1.52 0.46 0.28 0.31
Median 0.08 1.23 0.18 0.009 0
Standard deviation
1.18 1.08 1.29 1.11 1.51
No. of firms 85 85 85 85 85
Please see table 3.3 for variables definition.
3.7 SUMMARY STATISTICS
Table 3.2 shows the correlation matrix amongst the variables. The correlation
between firm investment and firm internal cash flow is positive, which may support
the notion that firms are financially constrained. The correlation between firm

Chapter Three
51
investment and market-to-book value is positive, thus indicating the ability of the
market to predict firm future growth opportunities. The new debt variable has the
largest correlation coefficient with investment, which indicates the importance of
the Jordanian banking system in terms of providing firms with required funds. The
positive value between investment and equity indicates the importance of the
equity market in providing firms with funds. In addition, the correlation matrix
shows no evidence of high correlation between the independent variables.
Table 3. 2 Correlation Matrix among Variables
0 $12�,� 0342�,� 0561 2�,� 0781 2�,�
0342�,� 0.10*
0561 2�,� 0.27* 0.0083
0781 2�,� 0.61* 0.09* 0.24*
0791 2�,� 0.32* 0.16* 0.27* 0.38*
Please see table 3.3 for variables definition. *Significant level at the 1 percent level.
3.8 RESULTS OF INVESTMENT-CASH FLOW SENSITIVITIES
3.8.1 Results of Investment-Cash Flow Sensitivity
Table 3.3 reports the regression results from Equation 3.5 in all firms. All the
specifications pass the Hansen-J statistics test for Over-Identifying Restrictions,
confirming that the instruments can be considered valid. The results show that the
J-statistics are statistically insignificant at least at ten percent level. The Arellano-
Bond tests for serial correlation - if the model is well specified we expect to reject
the null of no first order serial correlation (AR 1), and fail to reject the hypothesis
of no second order serial correlation (AR 2).
The market-to-book value is used to control for expected future profitability and
unobservable investment opportunity. The market-to-book value is found to be
positive but not statistically significant. The lagged value of investment is positive
and statistically significant, which indicates a positive and significant degree of

Chapter Three
52
persistence and therefore the presence of adjustment costs, which shows the
relationship between current investment and lagged investment.
Table 3. 3 Results for Investment to Cash Flow Sensitivities
Dependent variable : � ����,� Independent variables
Model 1
0 $12�,��� 0.118** (2.36)
0342�,� 0.033 (1.18)
0561 2�,� 0.101* (1.87)
0781 2�,� 0.231** (2.20)
0791 2�,� 0.132 (1.24)
Arellano-Bond AR(1) test-p.value 0.00 Arellano-Bond AR(2) test-p.value 0.38 OIR J-test p-value 0.32 Wald test (df) 4.44 (6) Wald test 1 (df) 42.32 (5) F statistics (df) 5.08 (10) Where I is the firm’s investment, represented by the change in the level of net fixed assets, and defined as {(Net Fixed Asset in year t)–(Net Fixed Asset in year t-1)+(Depreciation for year t)}; K is net fixed assets; M is the market value of outstanding common equity; B is the book value of common equity ; CF represents net income after tax plus depreciation; ND measures cash flow from new debt, equal to net increase in total debt, and this is equal to the net increase from year t-1 to year t in {(Total liabilities in year t) – (Accounts Payable in year t) – (Other Liabilities in year t)}; NE measures new cash flow as a result of raising capital, and is equal to {(Increase in Paid in Capital from year t-1 to year1) + (Issuance Premium in year t)}. The two-step GMM estimator is employed in the analysis with robust standard errors that are adjusted using the finite sample correction of Windmeijer (2005). The Hansen J-test of over-identifying restrictions (OIR) for the GMM estimators: the null hypothesis is that instruments used are not correlated with residual and so the over-identifying restrictions are valid. AR (1) is Arellano-Bond test for first-order serial correlation in the first-differenced residual, asymptotically distributed as N (0, 1) under the null of no serial correlation. AR (2) is Arellano-Bond test for second-order serial correlation in the first-differenced residual, asymptotically distributed as N (0, 1) under the null of no serial correlation. Wald is Wald test of the joint significance of the time dummies; Wald 1 is a Wald test of the joint significance of the reported coefficients, asymptotically distributed as x2 under the null of no relationship. t-statistics in parentheses. Applying a two-tailed test, the asterisk ***, **, and * denotes that the coefficients are statistical significance at 1%, 5%, and 10% level, respectively.

Chapter Three
53
The cash flow coefficient is positive and statistically significant (at 10%) but in all
other estimations the cash flow coefficient is statistically significant at 5%, which
indicates the importance of internal cash flow on firm investment. The results
suggest that Jordanian firms are financially constrained, and are consistent with the
findings of (Fazzari et al., 1988; Arslan et al., 2006; Ratti et al., 2008; and Brown
and Petersen, 2009). The results support the view that the asymmetric information
problem increases the wedge between the cost of external and internal funds.
Table 3.3 also shows that the new debt coefficient is positive and statistically
significant (at 5%), highlighting the importance of debt financing on firm
investment for Jordanian firms. The result is consistent with the findings of Brown
and Peterson (2009). Furthermore, the positive impact of the new debt coefficient
emphasises the importance of debt in reducing firms’ dependency on internal funds
to finance their investment. However, Table 3.3 also shows that the new equity
issuance coefficient is positive but not statistically significant.
3.8.2 Results of Financial Constraints and Market Listing
Table 3. 4 Results of Investment-Cash Flow Sensitivities and Market Listing
Dependent variable : � ����,� Independent Variables
Model 2
0 $12�,��� 0.112** (2.44)
0342�,� 0.031 (1.16)
0561 2�,� 0.133** (2.04)
0781 2�,� 0.239*** (2.21)
0791 2�,� 0.155* (1.65)
63 ; 0561 2�,� -0.014 (-0.71)
Arellano-Bond AR(1) test-p.value 0.000 Arellano-Bond AR(2) test-p.value 0.371 OIR J-test p-value 0.300 Wald test (df) 4.50 (7) Wald test 1 (df) 68.70 (6) F statistics (df) 6.08 (11) See Table 3.3 for tests and variables definitions. The two-step GMM estimator is employed in the analysis with robust standard errors that are adjusted using the finite sample correction of Windmeijer (2005).

Chapter Three
54
In Table 3.4, we investigate the investment-cash flow sensitivity further, by testing
whether this sensitivity is different between the two markets. we interact market
listing (FM) with cash flow, setting the dummy variable to 1 if the firm is listed in
the first market, and 0 if the firm is listed in the second market. To determine
whether investment-cash flow sensitivity is affected by market listing, we use Eq.
(3.6) for the estimations.
In Table 3.4, Model 2 shows the results of the interaction between cash flow and
market listing (63 > �561 �?,@). The negative coefficient of the interaction term
suggests that financial constraints for firms listed in the first market are less than
for those listed in the second market. However, the results show that the coefficient
of the interaction term is not statistically significant. Hence, the null hypothesis of
the investment-cash flow sensitivity being different between the two markets is
rejected. Overall, the results do not confirm that market listing affects the financial
constraints on a firm’s investment, which suggests that market listing may not be
used as a useful criterion to differentiate between financially constrained and
financially unconstrained firms.
3.8.3 Results of Financial Constraints and Firm Size
Table 3.5 presents the results of investment-cash flow sensitivity for different sized
firms. Firms were selected according to their size based on sales (Model 3), and
total assets (Model 4). Using sales as a classification criterion, Model 3 includes a
term that interacts cash flow with “large firms” (ABC� ; ���� ��,�). Large is a dummy
set to 1 if the firm is larger than the sample median, and 0 otherwise. We use Eq.
(3.6) for the estimations. In Model 3 the coefficient of (ABC� ; ���� ��,�) is not
statistically significant at any conventional level. Thus, we find no evidence to
support firm size as a useful criterion to differentiate between financially
constrained and financially unconstrained firms. Model 4 shows the results when
firm assets are used as a classification criterion. Again, the results show that the
coefficient of the interaction term is not statistically significant. Hence, the null
hypothesis that investment-cash flow sensitivities are different between large and

Chapter Three
55
small firms is soundly rejected. We cannot conclude that large firms are less
financially constrained than small firms.
These results are consistent with the findings of Gilchrist and Himmelberg (1995)
and Duchin et al., (2010). However, the results are not consistent with the findings
of Arslan et al., (2006) and Cleary (2006), who find that firm size is an important
factor in explaining financial constraints on firms.
Table 3. 5 Results for Investment-Cash Flow Sensitivities and Firm Size.
Dependent variable : � ����,� Independent Variables
Model 3 Model 4 0 $12�,���
0.121*** (2.61)
0.121*** (2.65)
0342�,� 0.04 (1.59)
0.032 (1.11)
0561 2�,� 0.112** (2.11)
0.139** (2.49)
0781 2�,� 0.232** (2.29)
0.241** (2.23)
0791 2�,� 0.124 (1.26)
0.154 (1.46)
ABC� ; 0561 2�,� -0.033 (-0.53)
-0.066 (-1.17)
Arellano-Bond AR(1) test-p.value 0.000 0.000 Arellano-Bond AR(2) test-p.value 0.348 0.37 OIR J-test p-value 0.343 0.319 Wald test (df) 5.12(6) 4.40(6) Wald 1 test (df) 88.16(6) 61.23(6) F statistics (df) 8.73 (11) 6.83(11) See Table 3.3 for tests and variables definitions. Model 3 uses firm’s total sales as a measure of size and model 4 uses firm’s total assets as measure of size. The two-step GMM estimator is employed in the analysis with robust standard errors that are adjusted using the finite sample correction of Windmeijer (2005).

Chapter Three
56
3.8.4 Results of Financial Constraints and Firm Age
Table 3. 6 Results for Investment Cash Flow Sensitivities and Firm Age
Dependent variable : � ����,� Independent variables
Model 5
0 $12�,��� 0.110** (2.32)
0342�,� 0.038 (1.25)
0561 2�,� 0.080** (2.21)
0781 2�,� 0.200** (2.02)
0791 2�,� 0.120 (1.16)
3@DB� ; 0561 2�,� 0.064 (1.07)
Arellano-Bond AR(1) test-p.value 0.000 Arellano-Bond AR(2) test-p.value 0.354 OIR J-test p-value 0.295 Wald test (df) 4.39 (6) Wald 1 test (df) 15.16 (6) F statistics (df) 10.42 (11) See Table 3.3 for tests and variables definitions. The two-step GMM estimator is employed in the analysis with robust standard errors that are adjusted using the finite sample correction of Windmeijer (2005).
Table 3.6 presents the estimation results for investment cash flow sensitivities for
groups formed based on firm age. Model 5 includes a term that interacts cash flow
with ‘Mature firms’ 03@DB� ; �561 �?,@2, where Mature is a dummy variable set to 1
if the firm age is higher than the sample median and 0 otherwise. We use eq. (3.6)
for the estimations.
The coefficient of 3@DB� ; ���� ��,� is not significant. Thus there is no evidence to
confirm that firm age affects the investment-cash flow sensitivity, and by extension
the asymmetric information problem. Hence, the null hypothesis of the investment-
cash flow sensitivity being different for mature and young firms is rejected.

Chapter Three
57
3.8.5 Results of Financial Constraints and the Dividend Payout Ratio
Table 3. 7 Results for Investment Cash Flow Sensitivities and Dividend Policy
Dependent variable : � ����,� Independent variables
Model 6 0 $12�,��� 0.122*** (2.65)
0342�,� 0.032 (1.11)
0561 2�,� 0.131** (2.49)
0781 2�,� 0.241** (2.23)
0791 2�,� 0.151 (1.46)
8$E ; 0561 2�,� -0.066 (-1.17)
Arellano-Bond AR(1) test-p.value 0.000 Arellano-Bond AR(2) test-p.value 0.370 OIR J-test p-value 0.319 Wald test (df) 5.12 (6) Wald 1 test (df) 88.40 (6) F statistics (df) 8.73 (11) See Table 3.3 for tests and variables definitions. The two-step GMM estimator is employed in the analysis with robust standard errors that are adjusted using the finite sample correction of Windmeijer (2005).
Model 6 shows the results for dividend-paying and non-dividend-paying firms.
Model 6 includes the interaction term cash flow interacted with a dividend-paying
dummy, DIV. The dummy variable is set to 1 if firm i is dividend paying in year t,
and 0 if the firm is non-dividend-paying in year t. we use Eq. (3.6) for the
estimations.
The negative coefficient of the interaction term suggests that financial constraints
are less severe in dividend-paying firms, however, the interaction term is not
statistically significant. There is therefore no evidence that non-dividend-paying
firms are more financially constrained than dividend-paying firms, and there is no
support for the hypothesis that firms that maintain their dividend can expect to face
restrictions on external sources of finance, contrary to the findings of Fazzari et al.
(1988).
Chapter Three
58
3.9 CONCLUSION
The principal aim of this chapter has been to examine whether Jordanian firms are
financially constrained, using data from listed non-financial firms for the period
2000 to 2008. In addition, this chapter tests if aspects of the firm’s characteristics
affect the degree of these financial constraints, as measured by the sensitivity of the
firm’s investment to internal cash flow. The results show that Jordanian firms are
financially constrained, the cash flow coefficient being both positive and
statistically significant for the complete sample of firms. For all firms in the
sample, the results suggest that cash flow has a positive impact on firm investment,
which supports the existence of financial restrictions on firm investment.
The results also show that external sources of funds have a major impact on firm
investment. Specifically, debt affects firm investment, although there is no
evidence that Jordanian firms use equity issuance to finance their investment. This
indicates that Jordanian firms depend primarily on external sources of funding to
finance their investments. However, external providers of funds do not provide
firms with all the funds they need to finance their investments, and external sources
of funds are more costly than internal ones. As a result, firms in Jordan can be
classified as being financially constrained.
According to Jordanian Securities law, listed firms must be classified into one of
two markets. The first market is where firms with a strong financial position are
traded, and the second market is where firms with a weak financial position are
traded. This suggests that market listing might be a useful criterion to discriminate
between constrained and unconstrained firms. Thus, firms listed in the first market
are likely to be less financially constrained than those listed in the second market.
The results in this chapter suggest that market listing is not a useful criterion to
discriminate between constrained and unconstrained firms, since the results do not
support that firms listed in the second market are more financially constrained than
firms listed in the first market. This finding is not consistent with our a priori
hypothesis.
In addition, to test the impact of the firm’s characteristics on the asymmetric
information environment that the firm may face, and which will affect the

Chapter Three
59
investment-cash flow sensitivity, several classification criteria have been used in
this study. These criteria are the firm’s size, age and dividend-payout ratio. The
results do not provide evidence to support the expectation that firm size affects the
investment-cash flow sensitivity. Further, the results do not support the view that
the age of the firm can be a useful criterion to differentiate between financially
constrained and financially unconstrained firms. Finally, we do not support the
dividend-payout ratio being a useful criterion to discriminate between financially
constrained and financially unconstrained firms, the results showing that
investment-cash flow sensitivities are not different between dividend paying and
non dividend paying firms.
Overall, the results suggest that the firm’s market listing and other specific
financial characteristics are not useful criteria to capture the unobserved
asymmetric information problem. A possible reason for the findings of an absence
of significant effects of firm characteristics is that these characteristics are more
important for the providers of equity capital rather than debt. Given the result for
the new equity variable, it is possible that the financial market in Jordan is at a
stage of development where firm characteristics do not yet influence lending
decisions, and therefore do not impact on the firms’ financial constraints. Instead,
the results appear to be indicating that in Jordan, the banking system is relatively
well-developed but the financial market is less well-developed.

Chapter Four
60
CHAPTER FOUR
CAPITAL STRUCTURE POLICY
4.1 INTRODUCTION
This chapter investigates the determinants of the firm’s capital structure choice in a
developing country. The main aim of this study is to determine which of the main
capital structure hypotheses (the trade off, agency cost, and the pecking order) better
explain the capital structure choice in Jordanian firms traded in the Amman Stock
Exchange (ASE). Based on panel data, the results show that the capital structure
choice of Jordanian firms appear to follow pecking order theory, where firms’
profitability and liquidity have a negative relation with the leverage ratio. In
addition, the results show that firm leverage has a positive relationship with firm
size and growth opportunities. Confirming findings of other literature the results
show that Jordanian firms have a target leverage ratio and move toward this target
quickly. In addition, in this chapter we examine the pecking order model, and test
the firm’s debt capacity and financial constraints.
4.2 MAIN CAPITAL STRUCTURE THEORY
4.2.1 The Modigliani-Miller Theorem
In their seminal paper, Modigliani and Miller (1958) present the first modern
corporate finance theory, which stated that the firm’s capital structure would not
affect the firm’s overall market value. Modigliani and Miller assume that the firm
will pay a perpetual amount of cash flow to investors, and that the company’s cash

Chapter Four
61
flows are divided between bondholders and shareholders. Therefore, the expected
cash flow that a firm pays is unrelated to the capital structure of the firm, and the
value of the firm is the sum of the market value of its common shares and the market
value of the debt. Notably, it is assumed that the capital market is perfect, meaning
that investors have full access to all information related to the firm’s value, and do
not pay any costs to either buy or sell securities. This allows investors to utilise
homemade leverage, thus enabling them to increase their leverage if the firm fails to
meet the amount of risk they desire. Moreover, they can eliminate any unwanted
leverage that the firm employs. Therefore, firm value is not affected by the leverage
employed in its capital structure.
However, in the presence of the market imperfections (for example, transaction
costs, taxes, bankruptcy costs, asymmetric information, and agency conflict), it is
recognised that firms may prefer various sources of finance over others, and that the
firm’s capital structure will be relevant to its overall value. In order to overcome
market imperfections, the firm will attempt to choose the capital structure
components that maximise its value. There are many authors who propose theories
to explain the firm’s capital structure in the context of an imperfect market;
however, the main two theories attempting to describe the financing behaviour of
firms in the presence of market imperfections are the trade-off theory and the
pecking order theory. Firstly, the trade-off theory balances between the costs and
benefits of leverage, whilst the pecking order theory implies that adverse selection
encourages firms to utilise internal cash flow over external sources of finance. The
following two sections provide a full discussion of these two theories.
4.2.2 The Trade-Off Theory
The trade-off theory implies that the firm will balance the costs and advantages of
leverage. Kraus and Litzenberger (1973) developed a model where “the value of the
levered firm is equal to the value of the unlevered firm plus the present value of the
tax advantage after deducting the costs of bankruptcy”. According to Myers (1984),
the firm’s optimal balance of leverage is established by balancing the advantages of
debt (represented by interest tax shields) against the cost of debt (represented by
bankruptcy costs). The trade-off theory implies that each firm sets its optimal target

Chapter Four
62
leverage ratio and accordingly moves towards this target. The sum of the present
value of benefits from the interest tax shield and the present value of costs from
bankruptcy determine the optimal leverage ratio for the firm. These bankruptcy costs
occur when the firm fails to meet its obligations to creditors (Haugen and Senbet
(1978)). Bankruptcy costs include direct and indirect costs: the direct costs include
legal, court fees, and lost management time; indirect costs occur before the
bankruptcy of the firm, and include costs resulting from disruption of firm business,
such as disruption of firm-customer relationships, disruption of the firm-supplier
relationship, and lost investment opportunities.
One of the earliest studies supporting the trade-off theory was conducted by Bradley
et al., (1984), who found that firms set optimal capital structure based on balancing
between the tax advantage from debt and debt-related costs (financial distress cost).
They show that:
1- Firm leverage level is inversely related to financial distress costs.
2- Greater non-debt tax shield decreases the firm leverage level.
3- Firm leverage level is inversely related to firm earnings volatility owing to
higher earnings volatility implying a higher present value of distress costs.
4.2.3 The Pecking Order Theory
The pecking order theory of capital structure implies that the first choice of finance
for firms is internal cash flow, followed by debt, and equity is the last resort (Myers
(1984)). According to this theory, there is no optimal capital structure owing to the
first and last preferences of funds representing two types of equity (i.e. internal cash
flow and equity). Myers and Majluf (1984) developed a model where the presence
of asymmetric information between managers and external investors leads to the
creation of a ranking for sources of funds. The firm’s managers know the true value
of the firm’s assets, whilst external investors can only guess at the true value.
However, the firm’s managers act in the interests of the existing shareholders. If the
firm finances a new project by selling equity, external investors will undervalue the
new issuance because they expect it will be in favour of existing shareholders.
Myers and Majluf (1984) and Myers (1984) show that firms will prefer internal cash

Chapter Four
63
flow to finance their investment for two reasons: First, the cost of using external
sources of funds, such as issuance costs and administrative costs, and under-pricing
the new securities; second, the cost of passing up a positive net present value project
owing to asymmetric information cost prevents the firm from relying on external
funds. Accordingly, the firm will build up reserves from internal cash flow to avoid
passing up positive NPV projects.
Myers (1984) argues the firm must reduce the difference between the true and
market value. The true value is the value of new shares when investors acquire
inside information released from the firm’s managers to the market. Myers proposes
the following rule that firm managers must follow in their financing decisions:
“issue the safest possible securities; strictly speaking, securities whose future value
change least when the manager’s inside information is revealed to the market”.
Building on this argument, Myers further indicates that the debt has the minimum
differences between the true and market value compared with equity. As a result, the
firm will prefer debt to equity if external funds are required. Pecking order theory
predicts that leverage and profitability are negatively related since a more profitable
firm will have access to internal cash flow.
4.2.4 Agency Theory
Jensen and Meckling (1976) present agency costs as the main determinants of firm
capital structure. An agency relationship exists because the firm owners delegate
corporate decisions to the managers (the agent). If the firm’s agent is a utility
maximiser, i.e. if they use the firm’s resources in their own interests, the firm’s
owners will expect the agent will make decisions that could harm the owners and the
company. Accordingly, firm owners will pay some costs to prevent the agent from
making decisions which are not in the interests of the owners. These agency costs
include:
1- Monitoring costs: the amount the firm must pay to monitor the agent’s
decisions, in addition to any incentives paid to the agent.
2- Bonding expenditure: any expenditure that the firm’s owners pay to the agent
to encourage him or her to make the right decisions concerning the firm’s

Chapter Four
64
investment, or to otherwise prevent them from taking any actions that harm
the firm’s interests.
Jensen and Meckling emphasise the impact of outside equity financing on agency
costs, highlighting that, as the firm uses more external equity, new equity holders
will spend more money to monitor agent behaviour. The costs associated with
outside equity financing are referred to as agency costs of equity. If the firm utilises
debt financing, the agency costs related to debt financing include:
1- Monitoring costs: including the provisions that bondholders may use to
constrain some of the firm management’s decisions, such as paying
dividends and issuing new debt. Bondholders impose these provisions to
protect themselves from the reallocation of money from bondholders to
equity holders.
2- Bankruptcy costs: if the firm issues debt, the firm is obligated to pay a fixed
payment to the debt-holders. If the firm fails to meet its current obligations,
the firm will be made bankrupt. The higher the amount of debt, the higher the
probability the firm will become bankrupt, and the higher the required rate of
return.
Where external funds have an agency cost, then when the owners identify a
profitable investment opportunity, but internal cash flow is insufficient to finance
this, the firm will suffer an opportunity loss. Firm owners must draw a comparison
between the costs of opportunity loss and agency costs of external funds. External
funds will be used as long as agency costs are less than the benefit from the
investment opportunity. The marginal costs of debt are less than the marginal costs
of equity, and so the optimal capital structure will be achieved by balancing these
costs.

Chapter Four
65
4.3 EMPIRICAL STUDIES ON CAPITAL STRUCTURE
4.3.1 Capital Structure in Developed Countries
One of the earliest papers to examine the determinants of firm debt level was
conducted by Titman and Wessels (1988). They use firm attributes as determinants
of the firm debt ratio, including collateral value of assets, non-debt tax shield,
growth, uniqueness, industry classification, size, volatility, and profitability. Titman
and Wessels argue that firms with a high level of collateral will use it to issue more
debt, but the results do not support this argument. Further, they find no evidence of
non-debt tax shields impacting on firm leverage. They find a negative relationship
between debt and product uniqueness, implying that this is a measure of risk and
difficulty in raising capital. Firms producing machines and equipment have low debt
ratios because of higher liquidation costs, while small firms prefer to borrow from
banks rather than issue long term debt because they pay higher issuance costs. In
line with pecking order theory, more profitable firms depend on internal cash flow.
However, there is no evidence of a relation between either earnings volatility and
growth opportunities and the firm’s debt ratio.
Bennett and Donnelly (1993) examine the cross-sectional determinants of capital
structure in non-financial UK companies. They find a negative relation between debt
and the non-debt tax shield, and a positive relation between tangibility of assets and
leverage. In line with Titman and Wessels (1988), they find no evidence of a relation
between growth opportunities and debt, while small firms rely more on bank loans
and internally generated cash. Finally, highly profitable firms have higher internal
cash flow and lower borrowing, and as expected, there is a negative relation between
profitability and leverage. Rajan and Zingales (1995) broaden the analysis of the
determinants of capital structure choice across the G-7 (Canada, France, Germany,
Italy, Japan, United Kingdom, and United States). They focus on four factors that
might determine capital structure (tangibility, growth, size, and profitability). Their
results show that the debt level has a positive relation with tangibility of assets in all
countries, a negative relationship with growth opportunities, and a positive
relationship with size. Finally, they find that leverage is negatively related with
profitability because the firm prefers using internal cash flow rather than more costly

Chapter Four
66
external funds. The main limitation of Rajan and Zingales (1995) is that they only
use four proxies to measure the main determinants of the capital structure choice,
and exclude other variables such as non-debt tax shields.
Ozkan (2001) finds that growth opportunities, non-debt tax shields, liquidity, and
profitability have a negative impact on firm leverage in the UK, while the size of the
firm impacts positively on firm leverage.
A number of studies have since examined the capital structure decision in other
developed countries. Miguel and Pindado (2001) investigate the impact on the
capital structure decision of firm characteristics in Spain. They find non-debt tax
shields and debt are negatively related, possibly because non-debt tax shields are
larger in Spain than in the US. Second, the financial distress cost and debt are
inversely related, because the higher the financial distress costs mean the higher the
probability of bankruptcy. Third, the cash flow variable has a negative relationship
with debt, which supports pecking order theory. Moh’d et al., (1998) argue that
institutional investors will play a key role in monitoring the firm’s decisions, and
will be a substitute for the disciplinary role of debt in firm financing behaviour.
Their results support this, since there is a negative relationship between firm debt
and the ownership percentage of institutional investors. Gaud et al., (2005) explore
the main determinants of capital structure of Swiss firms. They find a positive
relation between both tangibility and firm size, and firm leverage, while profitability
and growth are negatively related to debt.
Antoniou et al., (2008) examine the capital structure decision separately for market-
based and bank-based countries, arguing that the legal and financial systems
influence the capital structure choice. They argue that firms in bank-oriented
economies firms have more leverage than market-oriented economies, while they
have lower transparency and investor protection than market-oriented economies.
The results show the following: Profitability is negatively related to the leverage in
all sample countries except Japan: Growth opportunities and debt are negatively
related in all countries except the US. The strongest negative relation is found in
Germany, which has the highest blockholders ratio which decreases the cost of
monitoring the firm. The UK and Japan have the highest inverse relationship
Chapter Four
67
between growth and leverage which suggests that high information asymmetries
lead to high debt agency costs in these countries. Tangibility of firm assets and
leverage are positively related in all countries, except the US. Creditors appear to
use the firm’s assets as collateral since the relation in the bank-based countries is
higher than in market-based countries. Finally, the size of the firm and leverage are
positively related in all countries except the US.
An alternative view is that firms do not have an optimal capital structure, Baker and
Wurgler (2002). They argue that firms will increase equity finance when the market
value of the stock is higher than the book value and past market values. They find
that market timing affects the capital structure of the firm, and that firms with a low
debt ratio issue equity when the market value of the stock is high.
Several papers have examined the firm’s adjustment to a target debt ratio. Ozkan
(2001) uses a partial adjustment model where the firm sets a long term optimal debt
ratio and adjusts current debt toward this ratio. He finds that firms adjust their debt
ratio toward the optimal debt ratio, but the adjustment process is not perfect because
the firm will balance between the costs of adjusting toward target, and the cost of
being away from target. Miguel and Pindado (2001) show that the adjustment speed
toward target of Spanish firms is higher than the adjustment speed of US firms.
They interpret this as a consequence of the structure of the Spanish financial market,
where firms depend more on bank loans while US firms depend more on the bond
market, so firms in Spain face lower transaction costs to adjust toward the optimal
capital structure. A less developed bond market in Spain decreases the agency cost
of debt because the banking sector is the main source of debt. Gaud et al., (2005)
argue that Swiss firms adjust towards their target more slowly than firms in the UK,
US, Germany and France. The main reason for the slow adjustment process is the
relatively easy credit available from cantonal banks, which are granted on subjective
rather than objective criteria. Banks grant firms with low cost loans without taking
into account the firm’s risk level. They conclude it is not costly for Swiss firms to be
in disequilibrium, and so firms have a slow adjustment process.
Finally, Graham and Harvey (2001) survey CFO’s in the US and Canada to test the
trade off and pecking order theories. They find no evidence that supports firm’s debt
Chapter Four
68
policy being affected by personal taxes or the costs of distress, and weak evidence
that firms have a target debt ratio. They do find that credit ratings and earnings
volatility play an important role in firms’ debt policy. Overall, there is some support
for both theories, since most firms do not issue equity because they believe their
stock is undervalued, and that such issues are greater where asymmetric information
is more pronounced.
4.3.2 Capital Structure in Developing Countries
The analysis of the capital structure decision has been applied to a variety of
developing countries. In general, the results for firms in developing countries are
similar to those for developed countries. Profit is negatively related to leverage, and
tangibility of assets is positively related to leverage (Booth et al., (2001)). However,
there is clear evidence also that bank finance is particularly important to firms in
developing countries. For example, a survey of firms in Indonesia by Ang et al.,
(1997) finds that firms prefer to use bank loans before retained earnings because the
credit market is very active, they have a good relationship with banks, and are able
to negotiate the cost of debt and debt covenants.
In Thailand, the results show non-debt tax shields, market to book ratio, return on
assets, profitability, and size are negatively correlated to debt level, while the
tangibility of assets is positively related to debt (Wiwattanakantang (1999)).
Consistent with agency theory, a high percentage of family ownership impacts
positively on the leverage ratio. A high level of debt leads to an increase in their
ownership percentage and reduces the probability of takeover.
Trade-off theory’s prediction of the tax advantage of debt has been examined
explicitly by Al-Sakran (2001) in Saudi Arabia. Here firms pay taxes (Zakat) only
on the total net worth. The amount paid for Zakat will be the same if the firm uses
debt or equity financing. Therefore, the advantage of a tax shield of debt will be
minimised. They find no correlation between the debt ratio and tax, confirming that
firms do not benefit from using debt to reduce the tax paid. There is also a positive
relation between government ownership percentage and the debt level, consistent
with creditors having greater confidence that these firms will pay back their debts.

Chapter Four
69
In Turkey, Gonenc (2003) finds a positive relation between profitability and growth,
which he explains by the possibility that banks use firm’s profitability as a measure
of firm performance and whether to lend, as shown by a positive relation between
leverage and profitability. Their results also show a negative relation between
tangibility and the debt ratio. This is confirmed by Caglayan and Sak (2010) for
Turkish banks, and by Pandey and Chotigeat (2004) for Malaysian firms.
There is evidence consistent with trade off theory, there being several studies
documenting a positive relationship between size and the leverage ratio (see Gonenc
(2003) for Turkish firms, and Pandey and Chotigeat (2004) for Malaysian firms).
This is also supported by Yu and Aquino (2009) and Caglayan and Sak (2010) for
Philippine firms and Turkish banks respectively. However, there is mixed evidence
in support of pecking order theory. Gonenc (2003) finds there is a negative relation
between leverage and growth opportunities, while there is no relation for Malaysian
firms (Pandey and Chotigeat (2004)), and evidence of a positive relation for Turkish
banks (Caglayan and Sak (2010)). Yu and Aquino (2009) argue that pecking order
theory will be unable to explain the financing hierarchy of Philippine firms because
they tend to be family owned and very reliant on equity.
Finally, Ang et al., (1997) also examined pecking order theory by surveying firms
in Indonesia. They find that the firms in their sample use retained earnings because
it has the lowest cost among the alternative financing sources.
4.4 DETERMINANTS OF CAPITAL STRUCTURE IN JORDAN
The following section aims to answer the following questions: Firstly, what are the
determinants of the financing behaviour in Jordan? Secondly, whether the capital
structure theories are applicable to the Jordanian capital market? Thirdly, are
Jordanian firms have target capital structure ratio?
In order to answer the above questions, this section shows the sample characteristics,
common size balance sheet, descriptive statistics, variables, hypothesis
development, and results.

Chapter Four
70
4.4.1 Descriptive Statistics Analysis
Table 4.1 shows the different sources and uses of firm resources in Jordanian firms.
The first step in studying the impact of leverage on firm capital structure is to define
what we mean by leverage. The leverage term depends on what is our purpose of
analysis. Rajan and Zingales (1995) show that if we want to test the impact of
agency cost on firm capital structure the best measure is to use the ratio of the stock
of debt to firm value. If our objective is to measure the ability of the firm to meet its
fixed payment, the most appropriate measure of leverage is interest coverage ratio.
They argue that total liabilities to total assets is a good measure because it will show
the default risk in the near future. But this indicator will overstate leverage because
it contains accounts payable, which is representative of transaction purposes. Rajan
and Zingales also suggest that total debt (long term debt plus short term debt) will be
more suitable to measure the firm leverage.
Table 4.1 shows that Jordanian firms are funding 23% of their total assets from debt
(i.e. Credit Banks, Short Term Loans, Accrued Part of Long Term Loans, Long
Term Loans, and Corporate Bonds). This ratio illustrates the importance of debt in
Jordanian firms’ capital structure. The largest source of funds is long term debt,
which suggests that firms use long term debt to fund their investment, and therefore
match long term fixed assets with long term debt.
The proportion of the long term debt is relatively constant over time. We can see
from the table that the credit banks ratio is increasing over time, rising from 3.4 in
year 2000 to 9.5 in year 2008, which represents the importance of credit banks on
funding firm assets. Furthermore, total fixed assets decrease from 49.2 in 2000 to
35.2 in 2008, which indicates that Jordanian firms use more intangible assets in their
operations, and demonstrates that Jordanian firms use less tangible assets as
collateral for debt.

Chapter Four
71
Table 4. 1 Common Size Balance Sheet for all Firms in the Sample
Balance sheet for all firms in the sample for the years 2000-2008. The value of each item is calculated as the sum of all firms averaged by total assets for all firms in each year. The sample contains non-financial firms listed in the Amman Stock Exchange.
ASSETS 2000 2001 2002 2003 2004 2005 2006 2007 2008 Average Cash on Hand & at Banks 7.3 7.0 7.4 8.8 11.8 12.4 13.5 10.9 11.0 10.0 Account Receivables 12.4 10.3 10.9 10.6 10.4 12.7 11.1 12.0 14.5 11.7 Short Term Investments 0.1 0.2 0.2 0.3 0.5 2.6 1.6 1.2 0.7 0.8
Inventory 11.6 11.8 12.6 11.2 11.9 7.3 11.6 11.5 11.4 11.2 Other Current Assets 5.3 5.8 5.7 7.0 6.3 12.8 8.8 10.9 9.5 8.0 Total Current Assets 36.7 35.1 36.8 37.8 40.9 47.8 46.6 46.5 47.1 41.7 Long Term Investments 6.1 7.6 8.0 9.0 10.3 10.3 10.8 11.2 9.9 9.3 Total Fixed Assets 49.2 49.1 48.2 46.4 39.7 34.4 35.0 34.8 35.2 41.3
Other Assets 8.0 8.2 7.0 6.8 9.1 7.5 7.6 7.5 7.8 7.7
Total Assets 100 100 100 100 100 100 100 100 100 100 LIABILITIES & OWNERS EQUITY
LIABILITIES Accounts and Notes Payable 14.4 12.7 12.6 13.4 9.8 8.4 9.3 8.0 9.8 10.9
Credit Banks 3.4 3.5 3.6 2.9 4.4 5.6 6.2 9.8 9.5 5.4 Short Term Loans 1.2 1.2 1.4 1.3 1.3 1.3 1.4 2.1 3.1 1.6 Accrued Part of Long Term Loans 1.8 2.7 2.6 3.3 3.7 2.6 2.7 1.4 2.4 2.6 Other current Liabilities 3.9 3.3 2.8 1.4 1.7 1.0 1.7 1.8 1.8 2.1 Total Current Liabilities 24.7 23.4 22.9 22.5 20.8 18.9 21.3 23.1 26.6 22.7 Long Term Loans 10.5 11.2 11.5 10.0 10.2 9.0 10.8 12.7 10.2 10.7 Corporate Bonds 4.8 3.3 4.4 4.2 4.9 3.7 1.5 1.1 0.4 3.1 Other Liabilities 8.2 8.2 8.6 8.9 11.9 12.1 10.3 6.6 6.4 9.0 Total Liabilities 48.2 46.1 47.5 45.6 47.8 43.6 44.0 43.5 43.6 45.5 Total Shareholders equity 51.8 53.9 52.5 54.4 52.2 56.4 56.0 56.5 56.4 54.5 Total Liabilities & shareholders Equity 100 100 100 100 100 100 100 100 100 100 Total Number of firms 85 85 85 85 85 85 85 85 85
Source: Amman Stock Exchange, Author calculations.

Chapter Four
72
Table 4. 2 Summary of Descriptive Statistics
This table shows the summary of descriptive statistics for the variables used in the
estimation. The data from 85 non financial Jordanian firms listed on the Amman Stock
Exchange (ASE) with complete observations for the period 2000-2008. Leverage is the ratio
of total debt to total book value of assets where total debt is measured by total liabilities
minus accounts payable and other liabilities. Assets Tangibility is the ratio of book value of
tangible fixed assets to the book value of total assets. Size is the natural log of total assets.
Growth Opportunities is measured by the ratio of market to book value of equity. Non-debt
Tax Shields is measured by the ratio of annual depreciation expenses to the book value of
total assets. Liquidity is measured by the ratio of current asset to current liabilities.
Profitability is the ratio of net operating income to book value of total assets. Earning
Volatility is measured by the absolute value of the changes in net income. Dividend Payout Ratio is the ratio of dividends to net income. Blockholders is measured by the sum of all
large external shareholders that own more than 5% of the stock in each firm. Institutional
Investors is measured by the ratio the sum of all shares held by institutions to the total
number of shares.
Mean Median Minimum Maximum Std. Dev.
Leverage 0.197 0.157 0.0089 0.770 0.155
Assets Tangibility 0.384 0.351 0.00006 0.977 0.253
Size 16.565 16.447 12.516 20.587 1.341
Growth Opportunities 1.528 1.23 0.112 9.898 1.08 Non-debt Tax Shields 0.034 0.030 0.005 0.217 0.025
Liquidity 2.711 1.797 0.028 15.563 2.491
Profitability 0.036 0.033 -0.431 0.496 0.089 Earnings Volatility 1.268 0.662 0.008 9.713 1.721
Dividend Payout Ratio 0.373 0.001 0.0023 5.172 0.519
Blockholders 0.545 0.583 0 0.983 0.216
Institutional Investors 0.492 0.485 0.0001 0.9085 0.252
No. of firms 85
Table 4.3 shows the correlation coefficients between the variables. Debt is positively
correlated with tangibility and firm size, implying firms that increase their
investment in fixed assets may be able to use these assets as collateral to issue new
debt. Also, large firms use debt financing, suggesting they have better access to
credit markets. In addition, the positive relation between debt and non-debt tax
shields may be a result of firms with high tangibility having greater depreciation. On

Chapter Four
73
the other hand, debt is negatively correlated with liquidity implying firms use
internal cash flow to finance investment. Likewise, debt has a negative correlation
with profitability. Debt and the dividend payout ratio are negatively correlated,
indicating that firms that pay dividends are less dependent on debt. We also find that
debt has a negative correlation with blockholders and institutional investors.
Tangibility of firm assets has a negative correlation with size, growth opportunities,
liquidity, profitability, earnings volatility, dividend payout ratio, and blockholders.
This suggests firms with substantial fixed assets have fewer investment
opportunities. Firms with high tangibility may suffer from a low rate of profitability,
because they have less flexibility to replace old equipment. The negative correlation
between assets tangibility and liquidity may support the argument that firms with a
high fixed assets ratio suffer from a shortage of liquidity. Blockholders also has a
negative correlation with asset tangibility.
The size of the firm is positively correlated with growth opportunities, profitability,
liquidity, and institutional investors. This suggests large firms are more profitable
and have good investment opportunities, leading to a healthy financial position, as is
clear from the positive correlation with the liquidity ratio. Moreover, the positive
correlation with institutional investors suggests that institutional investors prefer to
invest in larger firms.
To determine whether the variables in the study are collinear or not, we use the
correlation matrix. Table 4.3 show that the correlation between variables is not high
and this suggests that there is no significant collinearity problem.
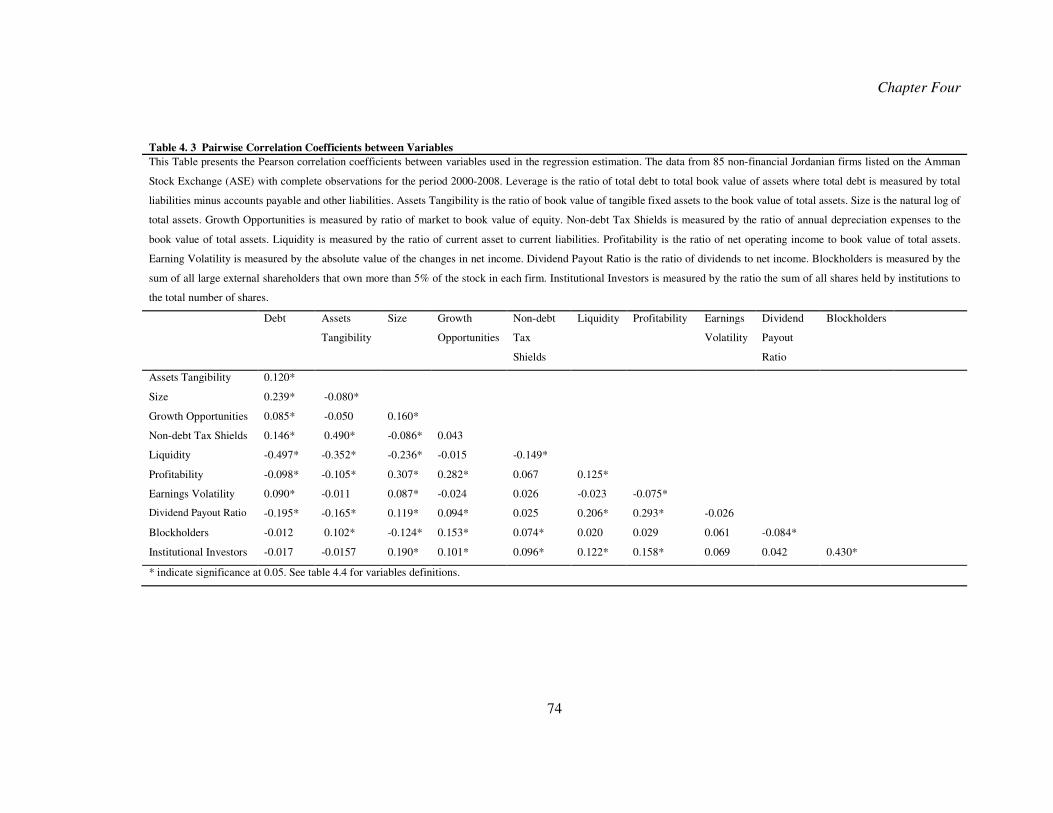
Chapter Four
74
Table 4. 3 Pairwise Correlation Coefficients between Variables
This Table presents the Pearson correlation coefficients between variables used in the regression estimation. The data from 85 non-financial Jordanian firms listed on the Amman
Stock Exchange (ASE) with complete observations for the period 2000-2008. Leverage is the ratio of total debt to total book value of assets where total debt is measured by total
liabilities minus accounts payable and other liabilities. Assets Tangibility is the ratio of book value of tangible fixed assets to the book value of total assets. Size is the natural log of
total assets. Growth Opportunities is measured by ratio of market to book value of equity. Non-debt Tax Shields is measured by the ratio of annual depreciation expenses to the
book value of total assets. Liquidity is measured by the ratio of current asset to current liabilities. Profitability is the ratio of net operating income to book value of total assets.
Earning Volatility is measured by the absolute value of the changes in net income. Dividend Payout Ratio is the ratio of dividends to net income. Blockholders is measured by the
sum of all large external shareholders that own more than 5% of the stock in each firm. Institutional Investors is measured by the ratio the sum of all shares held by institutions to
the total number of shares.
Debt Assets
Tangibility
Size Growth
Opportunities
Non-debt
Tax
Shields
Liquidity Profitability Earnings
Volatility
Dividend
Payout
Ratio
Blockholders
Assets Tangibility 0.120*
Size 0.239* -0.080*
Growth Opportunities 0.085* -0.050 0.160*
Non-debt Tax Shields 0.146* 0.490* -0.086* 0.043
Liquidity -0.497* -0.352* -0.236* -0.015 -0.149*
Profitability -0.098* -0.105* 0.307* 0.282* 0.067 0.125*
Earnings Volatility 0.090* -0.011 0.087* -0.024 0.026 -0.023 -0.075*
Dividend Payout Ratio -0.195* -0.165* 0.119* 0.094* 0.025 0.206* 0.293* -0.026
Blockholders -0.012 0.102* -0.124* 0.153* 0.074* 0.020 0.029 0.061 -0.084*
Institutional Investors -0.017 -0.0157 0.190* 0.101* 0.096* 0.122* 0.158* 0.069 0.042 0.430*
* indicate significance at 0.05. See table 4.4 for variables definitions.
Chapter Four
75
4.5 MODEL DESIGN
A large body of capital structure studies use the ordinary least square (OLS)
estimates with panel data to test the capital structure theories, (see Rajan and
Zingales, 1995; Moh’d et al., 1998; Wiwattanakantang, 1999; Booth et al., 2001;
Bevan and Danbolt, 2002; Chen 2003; Gonenc, 2003; Bharath, et al., 2009; Qureshi,
2010; Abe do Jong et al., 2008; Degryse et al., 2012). As explained in section (4.5),
firm debt will be affected by firm specific characteristics. We investigate the main
determinants of capital structure using the following model:
8�F@�,� G � �HI7�,� � �JK�,� � �L3/4N�,�� � HJ�,� � �A��,� � :OP�,� � QERA�,� � S8$E�,� � T4A1�,� � �G$7J�,� � )� � � � *�,� �<. 4.1
Where Debti,t is the ratio of total debt to total book value of assets, where total debt
is measured by total liabilities minus accounts payable and other liabilities. TANi,t
(asset tangibility) is the ratio of the book value of tangible fixed assets to the book
value of total assets. SZi,t (firm size) is the natural log of total assets. (M/B)i,t
(growth opportunities) is measured by the ratio of the market to book value of
equity. NTSi,t (non-debt tax shields) is measured by the ratio of annual depreciation
expenses to the book value of total assets. LQi,t (liquidity) is measured by the ratio
of current assets to current liabilities. PRi,t (profitability) is the ratio of net operating
income to the book value of total assets. VOLi,t (earning volatility) is measured by
the absolute value of the changes in net income. DIVi,t (dividend payout ratio) is the
ratio of dividends to net income. BLKi,t (blockholders) is measured by the sum of all
large external shareholders owning more than 5% of each firm. INSi,t (institutional
investor) is measured by the ratio of the sum of all shares held by institutions to the
total number of shares.
4.6 THEORETICAL FRAMEWORK AND HYPOTHESIS DEVELOPMENT

Chapter Four
76
4.6.1 Firm Characteristics and Capital Structure
Based on the capital structure theories, firm characteristics affect firms’ capital
structure, as identified by Titman and Wessels (1988), Rajan and Zingales (1995),
and Booth et al., (2001) among others. They suggest a number of characteristics that
will affect capital structure, although it is likely that the determinants will vary
across country and over time. For example, Booth et al., (2001) state that “Knowing
the country of origin is usually at least as important as knowing the size of the
independent variables for both the total and long term book-debt ratios”. Therefore,
it is very important to know the economic and market factors that might affect the
firm’s financing decision.
4.6.2 Leverage and Tangibility of Assets
Tangibility of assets is measured by the ratio of book value of tangible fixed assets
to the book value of total assets, Rajan and Zingales (1995). Higher tangibility
increases the collateral that the firm can use to secure debt. According to trade off
theory, the firm’s collateral decreases distress costs. Furthermore, higher tangibility
reduces the ability of the firm’s shareholders to change the structure of the firm’s
assets (i.e. replace the secure assets with high risk assets) and this leads to a decrease
in the agency cost of debt. Consequently, agency cost theory and trade off theory
predict a positive relation between tangibility of assets and leverage ratio (see, Frank
and Goyal 2008). Tangibility of assets has been found to have a significant impact
on firm leverage, as shown by Bennett and Donnelly (1993), Flannery and Rangan
(2006), and Chang and Dasgupta (2009). The common prediction is that β1 > 0, we
hypothesise that:
H1: All else equal, the tangibility of firm assets will positively affect firm leverage.
4.6.3 Leverage and Size of the Firm
Firm size is most often measured by the logarithm of the book value of total assets
(see Antonio et al., 2008). The rationale behind using firm size as a determinant of
capital structure is that large firms are more diversified and have a lower probability
of bankruptcy (see Titman and Wessels 1988). The cost of borrowing will be less in
Chapter Four
77
large firms, which is consistent with the trade off theory. On the other hand, pecking
order theory predicts a negative relation between leverage and firm size, because
large firms have a good reputation and have a long relationship with fund providers,
reducing the adverse selection problem. As a result, large firms will be able to raise
capital from the equity market with low cost. The size of firm has been found to
positively affect firm leverage (e.g. Hovakimian et al., 2004 and Antoniou et al.,
2008). we expect that β2 > 0, we hypothesise that:
H2: All else equal, firm size will positively affect firm debt.
4.6.4 Leverage and Growth Opportunities
Growth opportunities are measured by the market to book ratio of equity following
Cleary (1999) and Gonenc (2003). From a theoretical perspective, the amount of
debt issued will be negatively related to growth opportunities (Myers (1977)). This
is known as the debt overhang problem, where firms with high debt will not invest,
because any new investment will benefit the creditors, not the shareholders. Trade
off theory predicts an inverse relationship between debt and growth opportunities,
because the value of growth opportunities (i.e. new investment) will be very low
where the firm enters bankruptcy (Gaud et al., 2005). In growth firms, the agency
cost of debt will be greater because shareholders will be able to invest in risky
assets, to the benefit of shareholders. Also the creditors’ ability to monitor firms’
asset substitution (i.e. where they invest in risky projects) will be more difficult (see
Frank and Goyal, 2008). Pecking order theory predicts a positive relation with
growth opportunities as high growth firms will need more additional finance for
their investments, and this means additional debt rather than equity. The evidence
regarding the relationship between growth opportunities and leverage is not
conclusive. Some studies find a negative relationship, Frank and Goyal (2003),
Rajan and Zingales (1995), Gaud et al., (2005), while others find a positive
relationship, Bevan and Danbolt (2002) Gonenc (2003), Chen (2004), and Pandey
and Chotigeat (2004). The usual prediction is that the β3 < 0, we hypothesise that:
H3: All else equal, firm growth opportunities are negatively related to firms’
leverage ratio.

Chapter Four
78
4.6.5 Leverage and Non-Debt Tax Shields
Firm’s investment in tangible or intangible assets may produce tax benefits by
reducing the amount of tax paid, benefits that are unrelated to the source of funds.
DeAngelo and Masulis (1980) show that non-debt tax shields that appear in financial
statements substitute the benefits of a tax reduction from interest expenses on debt.
Consequently, an inverse relation will exist between non-debt tax shields and
leverage. On the other hand, the existence of higher non-debt tax shields (i.e.
depreciation expenses) is a result of a high level of tangible assets (see Barclay et
al., 1995). Based on this argument, we might find a positive relation between non-
debt tax shields and leverage, Ozkan (2001). Following Titman and Wessels (1988)
and Ozkan (2001), the non-debt tax shields are measured by the ratio of annual
depreciation expenses to the book value of total assets. The usual prediction is that
β4 < 0, we hypothesise that:
H4: All else equal, there is a negative relationship between non-debt tax shields and
debt.
4.6.6 Leverage and Liquidity
Liquidity is measured by the ratio of current asset to current liabilities. Higher
liquidity will help the firm to finance their investment from internal funds, and
decrease the amount of debt, Ozkan (2001). Therefore, a negative relationship
between liquidity and the debt ratio will exist. we expect that β5 < 0, we hypothesise
that:
H5: All else equal, the liquidity ratio has a negative effect on the firm’s debt ratio.
4.6.7 Leverage and Profitability
Pecking order theory states firms will use internal cash flow before external funds
(debt and equity issuance). The main source of internal cash flow is retained
earnings. Higher profitability leads to greater internally generated cash flow, and so
profitable firms should have a lower leverage ratio. Consequently, we expect a
negative relationship between profitability and debt ratio, Rajan and Zingales
(1995), Flannery and Ragan (2006), and Chang and Dasgupta (2009). Following
Chapter Four
79
Leary and Roberts (2005) and Lemmon et al., (2008), we measure firm profitability
by the net operating income over the book value of total assets. On the other hand, a
high level of profitability could decrease the probability of bankruptcy and distress
costs. Therefore, a positive relationship may exist between profitability and
leverage. The usual prediction is that β6 < 0, we hypothesise that:
H6: All else equal, Profitability of the firm will have a negative impact on the level
of the firm’s debt.
4.6.8 Leverage and Volatility
Graham and Harvey (2001) show that one of the important factors that affects firm
capital structure is earnings volatility. Trade off theory predicts firms with a high
probability of bankruptcy will have a low level of debt. A higher volatility of
earnings will lead to a higher probability that the firm will not be able to pay its
debt, so firms with high earnings volatility will have a low leverage ratio (see Harris
and Raviv (1991), Fama and French (2002) and Antoniou et al., (2008)). Following
Leary and Roberts (2005), we measure the volatility of earnings by the absolute
value of the change in net income. we expect to find that β7 < 0, we hypothesise that:
H7: All else equal, volatility of firm earnings will have a negative effect on the
firm’s debt.
4.6.9 Leverage and Dividend Payout Ratio
The dividend payout ratio is another factor that may affect firm leverage. From an
agency and transaction cost point of view, firms with a high payout ratio will have
lower agency costs of equity, which encourages firms to use more equity financing
Rozeff (1982). There should be an inverse relationship because paying dividends is
a signal of an expected increase of future earnings and this leads to a decrease in the
cost of equity financing (Antoniou et al., (2008)). The typical measure of the
dividend payout ratio is the ratio of dividends to net income. The usual prediction is
that β8< 0, we hypothesise that:

Chapter Four
80
H8: All else equal, the dividend payout ratio will inversely impact on firm leverage.
4.6.10 Leverage and Ownership Structure (Large Blockholders, Institutional
Investors)
The relationship between leverage and ownership structure is rarely discussed in the
literature, even though it represents an important factor affecting capital structure.
Jensen (1986) argues that firms will use debt to reduce the agency cost of free cash
flow. The free cash flow problem arises when managers use free cash flow to invest
more than would be optimal, increasing the resources that they control, and
increasing their bonuses, as bonuses relate to the firm’s growth and size. Debt can
control unnecessary spending. Large blockholders who monitor managerial
investment decisions can fulfil some of the role, resulting in a reduction in the free
cash flow problem and the agency cost premium of equity (Schiantarelli, 1996 and
Shleifer and Robert, 1997). If blockholders decrease monitoring costs we can expect
a negative relationship between blockholders and the leverage level, Bathala et al.,
(1994). On the other hand, Brailsford et al., (2002) argue that blockholders will
monitor the firm’s management, and the firm’s management will not be able to use
firm debt for their own interests. Consequently, they predict a positive relationship
between firm leverage and the level of blockholders. Following Chen and Steiner
(1999), we measure blockholders as the sum of all large shareholders owning more
than 5% of each firm. Consequently, a negative relationship will exist between
blockholders and the leverage ratio, we expect to find that β9 < 0.
H9: All else equal, large blockholders will have a negative effect on the firm’s
leverage ratio.
Institutional investors have the skills to monitor both firm performance and
managers’ decisions. Hence, institutional investors will be a good substitute for the
role of leverage and reduce the agency cost problem, Bathala et al., (1994) and
Crutchley et al., (1999). Therefore, there should be a negative impact of institutional
investors on firm debt. we define institutional investors as the sum of all shares held
by institutions, to the total number of shares outstanding. The common prediction is
that β10 < 0, we hypothesise that:

Chapter Four
81
H10: All else equal, the number of institutional investors will be negatively related
to the firm’s leverage ratio.
Econometric specification:
In this chapter we use a balanced panel to estimate the model above9. Thus we use
repeated observations on the same firm for several time periods. In this section we
use OLS (Ordinary Least Square) the definition of OLS according to Cameron and
Trivedi (2009) is “the estimator that minimizes the sum of squared errors”. In OLS
we assume that each disturbance is independent of all of the others. Thus, the error
term in εit are assumed to be independent draws from an identical distribution (i.i.d).
In panel data, we have the pooled, fixed effects and random effects models. Pooled
OLS (cross section) specifies constant coefficients, so that
V�� � W�� � D�� eq. 4.2
where i = 1, 2, ..., N, t = 1, 2, ..., T, W�� is a 1 × k vector of regressors and β is a K ×
1 vector of coefficients to be estimated.10This model assumes that the regressors are
uncorrelated with the error, where the error captures differences over time and
individuals. Thus, we can estimate the model using OLS. We group the data over i
and t into one regression of NT observations. However, pooled OLS is inconsistent
because if we have unobserved individual-specific effect that lead the error term to
correlate over time for a given individual. Therefore we control for this correlation
by including a dummy variable for each firm (i.e. we have some unobserved
individual heterogeneity that may correlate with the regressors and should be
included in the model, otherwise the omitted variables problem will arise). To
overcome this problem, we can use the fixed effects or random effects models that
allow each firm to have a different intercept term that captures the unobserved
individual-specific effect across firms but does not vary over time (i.e. time
invariant), so
V�� � � W�� � *�� eq. 4.3
In equation 4.3, we view the error in equation (4.2) uit = �+ εit , where εit is i.i.d
over i and t. � are random variables that capture unobserved heterogeneity. In the
9 The discussion of this section is based on Cameron and Trivedi (2009) 10 WY is a row vector consist of all of the independent variables.
Chapter Four
82
fixed effect model � is an observed random variable that is permitted to correlate
with the observed regressors xit , in this model xit do not correlate with εit. The
random effect model assumes that the � (i.e. the unobservable firm effect) is purely
random and distributed independently of the regressors xit and εit is i.i.d so the
random effect model is V�� W�� � L� � *��N, we estimate the random effect
using the Generalized Least Square (GLS) technique. To estimate the fixed effect
model, we can use Least Square Dummy Variable (LSDV) or within estimator,
where in the LSDV we use OLS with N individual dummy variables to control for
unobserved individual effects. If N is not too large relative to than in the time series
an alternative and simpler way to compute the within estimator is by LSDV. Since
LSDV uses many dummy variables for large N, alternatively we can use the within
estimator. A within estimator does not need dummy variables, but it uses deviations
from group means, so we take the average over time of equation 4.3 yields VZ� � � W[� � *[� . Subtracing this from yit in equation 4.3 yields the within model: V�� � VZ� LW�� � W[� N � L*�� � *[�N Pooled OLS is inconsistent if the true model is the fixed effects model, since pooled
OLS ignores the individual dummies that capture the unobserved specific-individual
effect that should be included in the model. To identify which empirical
methodology is most appropriate – pooling, random effect, or fixed effect, we
should use some statistical test. To test if we have individual-specific effects, we can
use the Lagrangian Multiplier (LM) test (Breusch and Pagan, 1980). LM tests for the
presence of individual-specific random effects against the null hypothesis
assumption of i.i.d errors. If the null hypothesis is rejected, the pooled regression
model is not appropriate, and we have significant differences across units. If we fail
to reject the null hypothesis we conclude that random effects is not appropriate, and
there are no significant differences across units11.
The second step is to decide between the fixed effect and random effect models. We
use the Hausman specification test (Hausman 1978), “the test is used to test for
orthogonality of the common effects and the regressors” (Green, 2003). Under the
null hypothesis that the individual-specific effects �are uncorrelated with the 11 I use STATA version 11 to estimate all regressions.

Chapter Four
83
regressors in the model. If we reject the null hypothesis, the fixed effect is preferred
to the random effect. The Hausman test is based on the following hypotheses:
H0: �is uncorrelated with X, H1 : �is correlated with X,
The test-statistics : Under the null hypothesis, if the individual specific effects L�N are uncorelated with the explanatory variables Xit, the random effects is consistent and efficient, the
fixed effects esimtator is consistent, but not efficient. Under the alternative
hypothesis, if the individual specific effects �are correlated with covaraites Xit are correlated with covaraites Xit , the fixed effect is consistent and efficient but the
random effects is inconsistent (see, Green, 2003 and Heineck, 2004). So, “under the
null hypothesis, the two estimates should not differ systematically, and the test can
be based on the difference”, (Green, 2003. p576).
The Hausman statistic is distributed as χ2 and is computed as
Hausman Test = [ q fe- q rer′[Vfe- Vrer��[ q fe- q rer ~ χs���
Under the null hypothesis, Hausman test is asymptotically distributed as chi � squared with k-1 degrees of freedom. We use the estimated covariance matrices of the slope
estimator in the fixed effect model (within model) and the estimated covariance
matrix in the random effects model, excluding the constant term.
Where, q fe is the coefficient vector from the fixed effect estimator . q reis the coefficient vector from the random effect estimator. Vfe is the covariance matrix of the fixed effect estimator. Vreis the covariance matrix of the random effect estimator.

Chapter Four
84
4.7 RESULTS OF DETERMINANTS OF CAPITAL STRUCTURE
In order to examine the impact of firm characteristics on firm leverage for Jordanian
firms, eq. 4.1 is estimated using OLS methodology with panel data. Capital structure
policy may be different between firms, because each firm may have unique
characteristics. i capture these differences across firms. The market and
macroeconomics conditions might affect all firms in the market at one point in time,
but these conditions will vary from year to year, λt capture these time-variant market
conditions. Examples of market factors include interest rates and inflation. To
choose which empirical methodology is most suitable , the Lagrangian Multiplier
test is used under the null hypothesis that the individual effect, i, is zero. The
results show that the chi-square statistic is equal to 706.5. Thus the null hypothesis is
rejected at the 1% significance level. To compare between the fixed effect and
random effect models, based on the Hausman test the null hypothesis is rejected at
the 1% significance level. Thus, the results in Table 4.4 are from the fixed effect
regression.

Chapter Four
85
Table 4. 4 Determinants of Capital Structure in Jordan
Using OLS regression using equation 4.1, the table provides the regression results for the determinants of
capital structure, The data from 85 non financial Jordanian firms listed on the Amman Stock Exchange (ASE)
with complete observations for the period 2000-2008. t-statistics are in parenthesis below the coefficient
estimates, the Lagrangian Multiplier test (LM test) is used to test the random effect model versus the pooling,
the Hausman specification test is used to test the fixed-effect model versus the random effect model. Wald is
Wald test of the joint significance of the time dummies; Wald 1 is a Wald test of the joint significance of the
reported coefficients, asymptotically distributed as x2 under the null of no relationship. Applying a two-tailed
test, the asterisk ***, **, and * denotes that the coefficients are statistical significance at 1%, 5%, and 10%
level, respectively. The results are based on two tailed Where Debti,t is the ratio of total debt to total book value
of assets, where total debt is measured by total liabilities minus accounts payable and other liabilities. TANi,t
(asset tangibility) is the ratio of the book value of tangible fixed assets to the book value of total assets. SZi,t
(firm size) is the natural log of total assets. (M/B)i,t (growth opportunities) is measured by the ratio of the
market to book value of equity. NTSi,t (non-debt tax shields) is measured by the ratio of annual depreciation
expenses to the book value of total assets. LQi,t (liquidity) is measured by the ratio of current assets to current
liabilities. PRi,t (profitability) is the ratio of net operating income to the book value of total assets. VOLi,t
(earning volatility) is measured by the absolute value of the changes in net income. DIVi,t (dividend payout ratio)
is the ratio of dividends to net income. BLKi,t (blockholders) is measured by the sum of all large external
shareholders owning more than 5% of each firm. INSi,t (institutional investor) is measured by the ratio of the
sum of all shares held by institutions to the total number of shares.
Independent variables
TANi,t -0.025 (-0.51)
SZi,t 0.041*** (2.75)
(M/B)i,t 0.014** (2.03)
NTSi,t 0.139 (0.48)
LQi,t -0.018*** (-6.27)
PRi,t -0.219*** (-2.78)
VOLi,t 0.002 (1.20)
DIVi,t -0.017** (-2.09)
BLKi,t 0.170*** (3.44)
INSi,t 0.074* (1.81)
R2 0.25 No. of firms 85 LM test-chi2 (df) 706.50( 1) Hausman test -chi2 (df) 49.0 (8) Wald test (df) 3.17(8) Wald test 1 (df) 10.22 (10) F statistics (df) 7.60 (18)

Chapter Four
86
4.7.1 Results of Leverage and Assets Tangibility
The results in Table 4.4 show no evidence that tangibility of assets affects firm
leverage. While there is no obvious explanation why tangibility is not significant,
some researchers obtain similar findings, Titman and Wessels (1988), Gaud et al.,
(2005), Wiwattanakantang (1999), Rajan and Zingales (1995) for Italian firms, and
Antonio et al., (2008) for US firms. The results suggest creditors do not consider the
firm’s fixed assets when they provide loans, possibly because the collateral value in
Jordan is low and would be difficult for the creditors to sell if the firm went
bankrupt. The only providers of debt to firms in Jordan are banks. Jordanian banking
law restricts Jordanian banks from engaging in industry, commerce, or services
excluding financial activities12, and they are not allowed to keep any real estate
acquired as a settlement of debt for more than two years13. This means the
liquidation cost of the firm’s tangible assets may be high, and so banks do not use
these assets as a source of collateral, and do not adjust the cost of loans to firms
accordingly.
4.7.2 Results of Leverage and Firm Size
The proxy of firm size, measured by the log of total assets, is statistically significant
at the 1% level. In light of the results, large firms have more debt in their capital
structure. This supports trade off theory, where the firm employs more debt as the
cost of debt is low, and large firms have better access to credit markets because they
face lower bankruptcy costs. Small firms reduce their debt, because they are more
exposed to bankruptcy costs. The results reject the hypothesis that firm size is a
negative proxy for the information asymmetry problem (Gaud et al., 2005). This
hypothesis argued that large firms have a low level of asymmetric information,
enhancing their ability to raise capital from the equity market and reducing their
debt. These results are consistent with the findings of Booth et al., 2003; Bennett
12 Jordan Banking Law No. 28 of 2000 article 40. 13 Jordan Banking Law No. 28 of 2000 article 40.

Chapter Four
87
and Donnelly, 1993; Antoniou et al., 2008; Flannery and Rangan, 2006; and
Hovakimian et al., 2004.
4.7.3 Results of Leverage and Growth Opportunities
The regression results show that the coefficient of growth opportunities is positive
and significant at a 5% level. Chen (2004) finds similar results for a sample of listed
Chinese firms, arguing that industrial or service firms in developing countries use a
low level of technology, and have low growth opportunities, because they have large
amounts of fixed assets and few intangible assets such as research and development,
patent, trademarks, and goodwill. This finding is consistent with Myer’s (1977)
argument, that firms with a high level of intangible assets use less debt. Therefore,
growth firms with a low level of intangible assets will use debt to finance their
investment opportunities. Recall Jordanian firms operate at a low technology level
with few competitors, and growth opportunities will be investment in tangible
assets. As a result, creditors will be confident the firm will not use borrowed money
to invest in risky assets, and this reduces the agency cost of debt. A positive relation
has also been found by Gonenc (2003) for firms in Turkey and Pandey and
Chotigeat (2004) for firms in Malaysia.
4.7.4 Results of Leverage and Non-Debt Tax Shield
The proxy for non-debt tax shields, depreciation expenses over total assets, is
positive but not significant. There is therefore no evidence to support the presence of
a substitution effect of non-debt tax shields. This result is similar to findings by
Wijst and Thurik (1993).
4.7.5 Results of Leverage and Liquidity
Liquidity has a significant negative relationship with the leverage ratio, the
estimated coefficient being significant at a 1% level. Firms that have more liquidity
employ less debt in their capital structure, supporting the pecking order theory,
where firms prefer internal cash flow to external sources of finance. This finding
supports the studies by Ozkan (2001) and Jong et al., (2008).

Chapter Four
88
4.7.6 Results of Leverage and Profitability
Firm profitability has a negative impact on firm leverage. The variable measured by
net operating income to the book value of total assets is significant at a 1% level.
This is consistent with pecking order theory, since firms with high profitability use
more retained earnings and less debt in their capital structure. Both profitability and
liquidity have an inverse relationship with the debt ratio, supporting the argument
that Jordanian firms prefer to use internal funds rather than debt. These results are
consistent with previous studies by Booth et al., 2001; Lemmon et al., 2008;
Flannery and Ragan, 2006; Pandey and Chotigeat, 2004; and Rajan and Zingales,
1995.
4.7.7 Results of Leverage and Earnings Volatility
According to trade off theory, firms with high risk will have a low amount of debt.
Here firm risk is approximated by earnings volatility. The results find no statistical
relation and therefore are not consistent with the theory. A similar result was found
by Titman and Wessels, 1988; Booth et al., 2001; Wiwattanakantang, 1999; Pandey
and Chotigeat, 2004; Chen, 2004; Leary and Roberts, 2005; and Lemmon et al.,
2008.
4.7.8 Results of Leverage and Dividend Payout Ratio
The results show an inverse impact of the dividend payout ratio on the debt ratio,
statistically significant at 5%. This result may suggests firms with a higher payout
ratio take advantage of a lower cost of equity financing and use more equity in their
capital structure, consistent with the findings reported by Chen and Steiner (1999)
and Rozeff (1982).
4.7.9 Results of Leverage and Ownership Structure
The coefficient for the proxies of blockholders and institutional investors are
positive and significant. These results are inconsistent with the argument that
suggests there should be a negative relationship if institutional investors and large
blockholders are a substitute for debt. Here, the results are consistent with the
argument that the firm uses leverage due to active monitoring from blockholders and

Chapter Four
89
institutional investors. In other words, creditors can be confident that the firm will
use debt effectively. The positive relation between institutional investors and debt is
consistent with Crutchley et al., (1999), while the positive relationship between
blockholders and leverage is consistent with Brailsford et al., (2002).
4.8 TARGET CAPITAL STRUCTURE
In the previous section, we estimated firm leverage using a set of explanatory
variables. Trade off theory implies that each firm has a target capital structure and
adjust their leverage toward this target. However, the target ratio is determined by
the firm’s specific characteristics. The firm must balance between being off target,
and the cost of adjusting. If the adjustment process is costly, the firm’s speed of
adjustment may be slow. For example, one of the costs that firms face is the
transaction cost associated with issuing new debt (see Miguel and Pindado 2001).
The firm’s target capital structure is determined by the explanatory variables
discussed in the previous section. Therefore, the model for the optimal target debt
ratio (Debt *) can be written as follows:
Debt�,�; ∑ ssw� Ws,�,� � ��,� eq. 4.4
Where x is a vector of explanatory variables K, and x kit represents the explanatory
variable k for firm i in time t . Ten explanatory variables that determine the target debt
ratio are (asset tangibility, size, growth opportunities, non-debt tax shields, liquidity,
profitability, earnings volatility, dividend payout ratio, blockholders, and
institutional investors). ei,t is the error term assumed to be serially uncorrelated, with
zero mean. Following Ozkan (2001), Miguel and Pindado (2001) and Antoniou et
al., (2008), the adjustment process towards the optimal capital structure can be
written as follows:
Debt�,� � Debt�,��� )LDebt�,�; �Debt�,���N eq. 4.5
Alternatively equation (4.5) can be written to find the actual debt level as:
Debt�,� )Debt�,�; � L1 � )NDebt�,��� eq. 4.6

Chapter Four
90
Where Debti,t and Debt i,t-1 are the actual debt for year t and year t-1, respectively. Debt�,�; is the target debt ratio, where 0 < λ < 1, the coefficient λ measure the firm’s
speed of adjustment toward its target. If λ =1, then 8�F@��; = Debt it-1 and the
transaction cost that the firm pays to adjust toward its target is minimal, and the
adjustment toward target debt occurs without cost, or the cost of being away from
target is very high, and the firm is always at its target Debt. On the other hand, if
λ=0, then Debt it = Debt it-1 which means that transaction costs are very high, and
there is no adjustment toward target debt (Ozkan, 2001). Substitution of equation
(4.4) into equation (4.6) gives
Debt�,� L1 � )NDebt�,��� � ) ∑ ssw� Ws,�,� � )��,� eq. 4.7
which can be written as :
Debt�,� GDebt�,��� � ∑ ssw� Ws,�,� � *�,� eq. 4.8
where α0 =1-λ, αk = βk, and εi,t = λei,t
The dynamic capital structure model will be estimated to determine if Jordanian
firms have a target debt ratio, and to measure the speed of adjustment toward the
optimal debt ratio. The leverage adjustment model will be as follows:
8�F@�,� G � �HI7�,� � �JK�,� � �L3/4N�,�� � HJ�,� � �A��,� � :OP�,� � QERA�,� � S8$E�,� � T4A1�,� � �G$7J�,� � )� � � � *�,� �<. 4.9
See section 4.6 for variables definition. To estimate equation 4.9 we use the
difference-GMM estimator proposed by Arrelano and Bond (1991). This estimator
addresses the problem of estimating a dynamic capital structure model, which is
likely to suffer from the problem arising from the presence of unobserved
individual-specific effect and a lagged dependent variable. To illustrate this,
consider the simple dynamic model as follows:
V�� V���� � W�� � ��� Where:
��� � � *��

Chapter Four
91
Where i=1,…,N cross section units and t=1,…,T time periods. The disturbance term
has two components, � is an unobserved firm-specific effect, and the idiosyncratic
shock *��. In this model, the lagged value V���� may correlate with the individual-
specific effect which creates the problem of endogeneity. To solve this problem, we
can estimate the model in first-differences. Then we obtain,
∆V�� ∆V���� � ∆W�� � ∆*�� By taking first differences, the � will be removed from the equation14. However,
the OLS estimator still suffers from correlation between ∆V���� and ∆*�� . In this
case use of GMM is required for two reasons. First, ∆V���� is correlated with ∆*�� , because the ∆yit-1 = yit-1- yit-2 is correlated with ∆εit = εit- εit-1, due to the correlation
between yit-1 and εit-1 . At the same time ∆εit is uncorrelated with ∆yit-k for k≥2.
Therefore, we use lagged variables as instruments, where we can
use V���� as an instrument for L V�����V����N. Arrelano and Bond (1991) proposed
the difference-GMM estimator where they use additional lags of the dependent
variable as instruments, for example V���� z{ V���� might be used as instruments.
In the presence of heteroskedasticity and serial correlation, the two-step differenced-
GMM is more efficient than the one-step differenced-GMM.
The estimated asymptotic standard errors of the efficient two-step robust
differenced-GMM estimator are severely downward biased in small samples. we
correct the standard errors for this bias using the method proposed by Windmeijer
(2005), (see Roodman, a2009; page 11). A number of capital structure studies use
the differenced-GMM model to examine the partial adjustment model (see, Ozkan,
2001; Gaud et al., 2005; Gonzales and Gonzales, 2008; Florackis and Ozkan, 2009).
Gonzales and Gonzales (2008) note that differenced-GMM is useful to study
dynamic capital structure for three reasons:
1- “The unobserved firm-specific effect will be eliminated by taking the first
difference of the variable.
14 The unobserved individual-specific effect (i) is eliminated because ��,����,��� =L���N �L *?,@� *?,@�1N.

Chapter Four
92
2- The autoregressive process in the data, since the lagged value of leverage is
included to capture the dynamic nature of the capital structure decision.
3- The possibility of endogeneity between the variables in the model”.
The appropriateness of this approach is reinforced by the likelihood that shocks
affecting the firm’s leverage decisions will be the same across all the explanatory
variables, Ozkan (2001). In addition, Gaud et al., (2005) treat all the independent
variables as endogenous since all the variables are based upon accounting values and
these are likely to be determined simultaneously.
For consistent estimation and to avoid misspecification, the GMM estimator requires
that the error εi,t to be serially uncorrelated. Specifically, the εi,t are serially
uncorrelated when the ∆εit are correlated with ∆εi,t-1, but not correlated with ∆εi,t-k for
k ≥2. Therefore, the GMM estimator is consistent if there is no second order serial
correlation. To check for serial correlation, we test first order serial correlation (AR
1) and second order serial correlation (AR 2). The instruments used in the GMM
estimator will be valid only if there is no correlation between the instruments and
error term. A standard specification check for two-step differenced-GMM is the
Hansen (1982) J -test. Hansen statistics test the over-identifying restrictions, under
the null hypothesis that the instruments are uncorrelated with the error term.
We should also bear in mind that the differenced-GMM may suffer from a weak
instruments problem. When the dependent variable and independent variables are
persistent over time, the lagged value of these variables are weak instruments for the
regression equation in differences since they are less correlated with subsequent
changes. Blundell and Bond (1998) suggest using system-GMM, which imposes
additional moment restrictions to solve the weak instruments problem. However, the
main problem of system-GMM is that the standard errors may be severely
downward biased when the instrument count is high (see, Roodman, b2009).
System-GMM may not be reliable here since there are 11 explanatory variables and
assuming that the firm’s characteristics are endogenous for 9 years, the number of
instruments may be greater than the number of cross sections, leading to inconsistent
results. Applying system-GMM on the partial adjustment model of debt, however,
the number of instruments is 160 if two lags are used as instruments, which is higher

Chapter Four
93
than the number of cross sections (85 firms). Because the number of firms is limited,
we cannot apply system-GMM and this caveat needs to be kept in mind while
interpreting these results. To keep the number of instruments below the number of
the cross section we use the second lag of the independent variables as instruments.
4.9 RESULTS OF TARGET CAPITAL STRUCTURE MODEL
We present the results for the equation (4.9) in Table (4.5). The specification tests
show the model is valid. The Hansen test of overidentification restriction does not
reject the null at any conventional level of significance. The Hansen test p-value
(0.374) means we accept the validity of the instruments, since the instruments are
uncorrelated with the error term. The test for serial correlation shows no evidence of
second order serial correlation (AR 2). Time dummies are included to control for
macroeconomic factors that can affect firms’ leverage decision, and which may vary
from year to year.
The results show that the coefficient of the lagged value of leverage is positive and
significant at the 1% level. The coefficient of adjustment value λ (1-a1) is 0.745.
This suggests that Jordanian firms need 1.34 years to adjust their leverage towards
target, which is a relatively fast speed of adjustment. Jordanian firms have a target
leverage and quickly adjust their leverage toward this target, consistent with the
findings of Ozkan (2001) and Miguel and Pindado (2001). The speed of adjustment
is a trade off between the cost of transactions to adjust current leverage toward the
target, and the cost of being in disequilibrium away from the target, and will be
inversely related to transaction costs.
A speed of adjustment of 0.745 implies that low transaction costs encourage
Jordanian firms to adjust their leverage towards target. The results are consistent
with the main source of debt for Jordanian firms coming from private banks, and
that firms rarely use bonds to raise capital. For instance, in Jordan only 7 firms
issued bonds in 2008. The transaction cost related to bank loans is low, which
encourages firms to adjust their capital. The result is consistent with Miguel and

Chapter Four
94
Pindado (2001) who find similar results for Spanish firms. In short, the absence of
an effective bond market and the presence of credit banks mean the transaction cost
of adjustment is low and Jordanian firms adjust their leverage quickly.
Table 4. 5 Target Adjustment Model Results
The Table reports the regression results for target adjustment model, using Arellano and Bond’s (1991) first-differencing GMM, .The data from 85 non financial Jordanian firms listed on the Amman Stock Exchange (ASE) with complete observations for the period 2000-2008. See Table 3.3 for tests and variables definitions. The two-step GMM estimator is employed in the analysis with robust standard errors that are adjusted using the finite sample correction of Windmeijer (2005). The Hansen J-test of over-identifying restrictions (OIR) for the GMM estimators: the null hypothesis is that instruments used are not correlated with residual and so the over-identifying restrictions are valid. AR (1) is Arellano-Bond test for first-order serial correlation in the first-differenced residual, asymptotically distributed as N (0, 1) under the null of no serial correlation. AR (2) is Arellano-Bond test for second-order serial correlation in the first-differenced residual, asymptotically distributed as N (0, 1) under the null of no serial correlation. Time dummies included in the regression. t-statistics in parentheses. Applying a two-tailed test, the asterisk ***, **, and * denotes that the coefficients are statistical significance at 1%, 5%, and 10% level, respectively. The dependent variables is Leverageit Independent variable GMM- first difference 8�F@�,��� 0.255***
(2.59)
TANi,t -0.11 (-1.23)
SZi,t 0.034 (0.81)
(M/B)i,t 0.018** (2.01)
NTSi,t 0.099 (0.16)
LQi,t -0.022** (-2.32)
PRi,t -0.306** (-2.21)
VOLi,t 0.001 (0.18)
DIVi,t -0.008 (-0.43)
BLKi,t 0.065 (0.59)
INSi,t -0.088 (-0.90)
Arellano-Bond AR(1) test-p.value 0.001
Arellano-Bond AR(2) test-p.value 0.590
OIR J-test p.value 0.374
Wald (df) 19.43(7)
Wald 1 (df) 46.41(11)
F statistics (df) 103.5(16)
See table 4.4 for variables definitions.
To compare the results of the determinants of capital structure in Jordan using
dynamic GMM and a static OLS model, we should take into account that we have

Chapter Four
95
now included the lagged value of the dependent variable. This lagged dependent
variable in the adjustment model will absorb some of the variation in the dependent
variables that is found when estimating a static OLS model, see Gonzalez and
Gonzalez (2008). To examine this hypothesis, we run the partial adjustment model
using fixed-effect OLS. The results show that firm size, institutional investors, and
payout ratio are not significant at 5%, which confirms that including the lagged
dependent value absorbs some of the variation in the dependent variables. Thus the
results from using dynamic models based on OLS and differenced-GMM are the
same regarding the significance of the variables; however, the Blockholders ratio is
significant in dynamic OLS but not significant in dynamic GMM.
4.10 TESTS OF PECKING ORDER THEORY (SHYAM-SUNDER
AND MYER’S MODELS)
Pecking order theory implies there is no target or optimal leverage ratio, and that
asymmetric information is the main determinant of firms’ leverage15 ratio. The firm
will use internal sources of funds followed by debt and equity financing
respectively. Shyam-Sunder and Myers (1999) develop a model where the firm’s
debt level correlates with the internal financial deficit. They argue that if internal
funds are not sufficient, and pecking order theory holds, the firm’s debt level will
respond to fluctuations of the financial deficit that the firm faces. They measure the
financial deficit “as the sum of dividend payments, capital expenditures, net increase
in working capital and the current portion of long term-debt, minus operating cash
flow”. According to their model, we can test pecking order theory by estimating:
∆ 8�F@�,� � |} 8�~ �,� � *�,� eq. 4.10
Pecking order implies that |} = 1, since the firm’s first choice to finance the
financial deficit is debt. Using data from 157 non-financial US firms over the period
1971 to 1989, they obtain a coefficient of the financial deficit of 0.75 with R2 equal
to 0.68. They argue this supports the ability of the model to describe firm financing
behaviour. However, their results may be biased, because they are based on a sample
15 The terms “debt” and “leverage” are used interchangeably.

Chapter Four
96
consisting only of large firms. One can also question whether we can apply this
model to firms in emerging markets.
Frank and Goyal (2003) overcome the biased sample in Shyam-Sunder and Myers
(1999) by examining a wider sample of 768 US nonfinancial firms between 1971
and 1998. Their results do not support pecking order theory. Frank and Goyal
expand the Shyam-Sunder and Myers model by disaggregating the financial deficit
term. They argue that the financial deficit may explain the change in net debt issue,
but not in the way that is proposed by pecking order theory. Therefore, if we
disaggregate the financial deficit, the information content of the individual
components will be better able to explain pecking order theory. They propose the
following specification to test pecking order theory:
∆ 8�F@�,� � � 58�,�� � 59�,� � �∆ �5I�,� � � 56�,� � *�,� eq. 4.11
Where ∆ Debt i, t is the new issuance of debt (gross debt issue) or change in debt
ratio. CD is the cash dividends, CE is the capital expenditure, WCA is the Working
Capital, and CF is the Cash flow. )� is the year dummies, � is the firm specific effect.
In the following sections, we empirically examine pecking order theory on firms
listed in Amman Stock Exchange (ASE), using Shyam-Sunder and Myers’s model
and Frank and Goyal’s model. Section 4.10.1 presents a descriptive analysis and
correlation matrix between the variables. Section 4.10.2 presents the model
development and econometric specification, and main results of the models.
4.10.1 Descriptive Analysis
Table 4.6 shows the correlation matrix between all variables in the study. The
financial deficit and capital expenditure are positively correlated with new debt. This
suggests firms use debt to finance their financial deficit and capital expenditure. The
proxy of cash dividends and new debt is negatively correlated, which suggests that
firms with a high dividend ratio issue less debt.
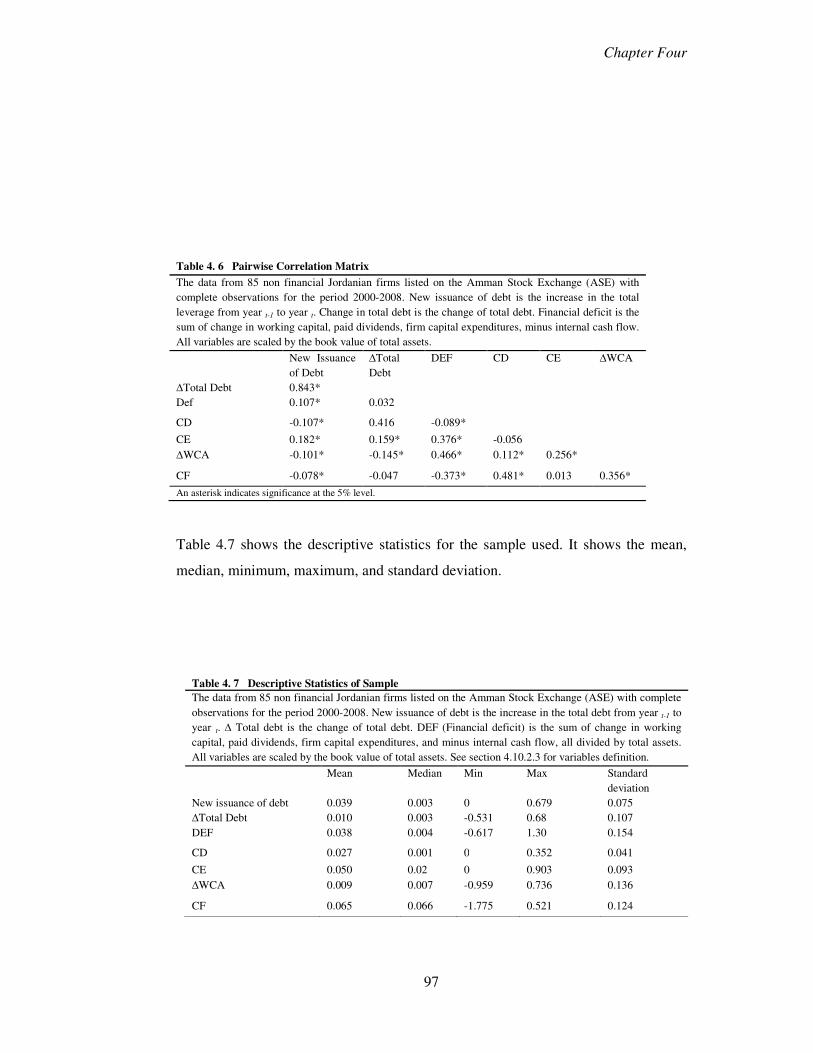
Chapter Four
97
Table 4. 6 Pairwise Correlation Matrix
The data from 85 non financial Jordanian firms listed on the Amman Stock Exchange (ASE) with
complete observations for the period 2000-2008. New issuance of debt is the increase in the total
leverage from year t-1 to year t. Change in total debt is the change of total debt. Financial deficit is the
sum of change in working capital, paid dividends, firm capital expenditures, minus internal cash flow.
All variables are scaled by the book value of total assets.
New Issuance
of Debt
∆Total
Debt
DEF CD CE ∆WCA
∆Total Debt 0.843*
Def 0.107* 0.032
CD -0.107* 0.416 -0.089*
CE 0.182* 0.159* 0.376* -0.056
∆WCA -0.101* -0.145* 0.466* 0.112* 0.256*
CF -0.078* -0.047 -0.373* 0.481* 0.013 0.356*
An asterisk indicates significance at the 5% level.
Table 4.7 shows the descriptive statistics for the sample used. It shows the mean,
median, minimum, maximum, and standard deviation.
Table 4. 7 Descriptive Statistics of Sample
The data from 85 non financial Jordanian firms listed on the Amman Stock Exchange (ASE) with complete
observations for the period 2000-2008. New issuance of debt is the increase in the total debt from year t-1 to
year t. ∆ Total debt is the change of total debt. DEF (Financial deficit) is the sum of change in working
capital, paid dividends, firm capital expenditures, and minus internal cash flow, all divided by total assets.
All variables are scaled by the book value of total assets. See section 4.10.2.3 for variables definition.
Mean Median Min Max Standard
deviation
New issuance of debt 0.039 0.003 0 0.679 0.075
∆Total Debt 0.010 0.003 -0.531 0.68 0.107
DEF 0.038 0.004 -0.617 1.30 0.154
CD 0.027 0.001 0 0.352 0.041
CE 0.050 0.02 0 0.903 0.093
∆WCA 0.009 0.007 -0.959 0.736 0.136
CF 0.065 0.066 -1.775 0.521 0.124

Chapter Four
98
Table 4.8 shows the corporate cash flow and main sources and uses of funds for the
sample. Most items are consistent over time. The largest item of uses of funds is
capital expenditure, with an average amount equal to 0.051, demonstrating the
importance of investment in fixed assets for Jordanian firms. In addition, it may
indicate that capital expenditure consumes a large amount of the firm’s funds. In
addition, it is notable that the two external sources of funds are similar (net equity
and net debt).
Table 4. 8 Uses and Sources of Funds of Sample
This Table shows sources of funds and uses of funds. The data from 85 non financial Jordanian firms listed on
the Amman Stock Exchange (ASE) with complete observations for the period 2000-2008. New issuance of debt
is the increase in the total debt from year t-1 to year t. Change in total debt is the change of total debt. Financial
deficit is the sum of change in working capital, paid dividends, firm capital expenditures, and minus internal
cash flow. All variables are scaled by the book value of total assets. The Table is similar to table 2 of Frank and
Goyal (2003). See section 4.10.2.3 for variables definition.
2001 2002 2003 2004 2005 2006 2007 2008 Average
CD 0.028 0.026 0.025 0.031 0.027 0.028 0.029 0.026 0.027
CE 0.051 0.043 0.054 0.066 0.055 0.046 0.040 0.050 0.051
∆WCA 0.009 0.000 0.003 0.009 0.049 -0.022 0.018 0.010 0.009
CF 0.064 0.064 0.058 0.087 0.089 0.056 0.065 0.043 0.066
DEF
0.025 0.005 0.025 0.018 0.042 -0.004 0.022 0.043 0.022
New Debt Issues
0.024 0.034 0.031 0.045 0.035 0.053 0.043 0.054 0.040
New Equity
Issuance
0.015 0.018 0.046 0.073 0.055 0.034 0.051 0.017 0.038
Total External
Financing
0.038 0.052 0.077 0.118 0.090 0.087 0.094 0.071 0.078
4.10.2 Model Design
4.10.2.1 Pecking Order and Shyam-Sunder and Myers’s Model
In the first step we employ the Shyam-Sunder and Myers (1999) model to test the
pecking order theory for listed Jordanian firms between 2000 and 2008. Following
their methodology, we use ordinary least squares (OLS) with panel data. The model
is as follows:
∆ 8�F@�,� � |} 8�~ �,� � )� � �� *�� �<. 4.12
Where the dependent variable ∆ Debt i,t represents the change in the total debt to
total assets ratio, or new issuance of debt for firm i in year t. New issuance of debt
(gross debt issue) is net increase of total debt16 from year t-1 to year t. The second
16 Total debt is (Total liabilities in year t) – (Accounts Payables in year t) – (Other Liabilities in year t)

Chapter Four
99
measure of ∆ Debt i,t is the change in total debt, measured by total debt in year t
minus total debt in year t-1. Net increase in debt and change in debt level are divided
by total assets to minimise a heteroskedasticity effect. The 8�~ �,� LFinancial deficit)
is the sum of change in working capital, paid dividends, firm capital expenditure,
minus internal cash flow. Working capital in year t is the difference between current
assets and current liabilities at year t and year t-1 for each firm, ∆ Working capital is
the change in working capital between year t and year t-1. The paid dividends are the
paid dividends for year t. Internal cash flow is the net income plus depreciation for
year t. Capital expenditure is the fixed assets in year t minus the fixed assets in year
t-1 plus depreciation in year t. λt represents a year dummy, i is the firm specific
effect, and ei,t represents the error term. we expect βpo to equal 1.
H1, All else equal, there is a positive relation between leverage (debt) ratio and the
firm’s deficit.
4.10.2.2 Results of Shyam-Sunder and Myers’s Model
Table 4. 9 Results from Shyam-Sunder and Myers’s Model
Using OLS regression, the table provides the regression results testing the Pecking order theory based on Shyam-Sunder and Myers (1999) model. The following equation is estimated: ∆ 8�F@�� � |� 8�~ �,� � )� � � �*�� eq.4.12 The data from 85 non financial Jordanian firms listed on the Amman Stock Exchange (ASE) with complete observations for the period 2000-2008. ∆ Debt i,t = Change in the total debt to total assets ratio, or new issuance of debt for firm i in year t . Def i,t is the sum of change in working capital, paid dividends, firm capital expenditures, and minus internal cash flow, all divided by total assets. Standard errors are heteroskedasticity-robust and clustered by firm. t-statistics are in parenthesis below the coefficient estimates. Applying a two-tailed test, the asterisk ***, **, and * denotes that the coefficients are statistical significance at 1%, 5%, and 10% level, respectively. Dependent Variable
(A) New issuance of debt
(b) ∆Debt ratio
Independent Variable
8�~�,� 0.048* (1.80)
0.023 (0.56)
R2 0.028 0.031
No. of firms 85 85 LM test-chi2 (df) 17.73(1) 0.7(1)
Hausman test -chi2 (df) 1.48(1) 0.01(1)
Wald test (df) 18.71(7) 29.89(7)
Wald test 1 (df) 3.92(1) 0.58(1)
F statistics (df) 22.02(8) 33.26(8)
Panel (A) in Table (4.9) shows the regression result for new issuance of debt. The
majority of the results show that the random effect is the most appropriate
specification since the hausman test is insignificant. we therefore report only the
results of the random effect specification (although the results using pooled, random,
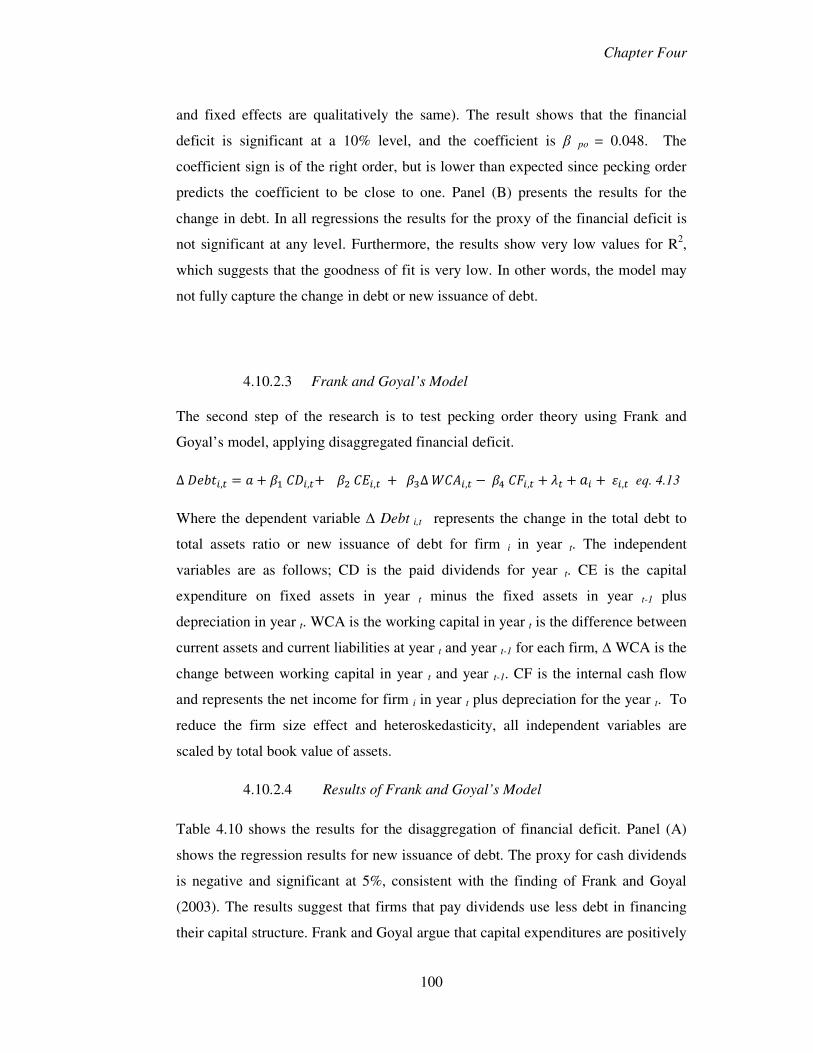
Chapter Four
100
and fixed effects are qualitatively the same). The result shows that the financial
deficit is significant at a 10% level, and the coefficient is β po = 0.048. The
coefficient sign is of the right order, but is lower than expected since pecking order
predicts the coefficient to be close to one. Panel (B) presents the results for the
change in debt. In all regressions the results for the proxy of the financial deficit is
not significant at any level. Furthermore, the results show very low values for R2,
which suggests that the goodness of fit is very low. In other words, the model may
not fully capture the change in debt or new issuance of debt.
4.10.2.3 Frank and Goyal’s Model
The second step of the research is to test pecking order theory using Frank and
Goyal’s model, applying disaggregated financial deficit.
∆ 8�F@�,� � � 58�,�� � 59�,� � �∆ �5I�,� � � 56�,� � )� � � � *�,� eq. 4.13
Where the dependent variable ∆ Debt i,t represents the change in the total debt to
total assets ratio or new issuance of debt for firm i in year t. The independent
variables are as follows; CD is the paid dividends for year t. CE is the capital
expenditure on fixed assets in year t minus the fixed assets in year t-1 plus
depreciation in year t. WCA is the working capital in year t is the difference between
current assets and current liabilities at year t and year t-1 for each firm, ∆ WCA is the
change between working capital in year t and year t-1. CF is the internal cash flow
and represents the net income for firm i in year t plus depreciation for the year t. To
reduce the firm size effect and heteroskedasticity, all independent variables are
scaled by total book value of assets.
4.10.2.4 Results of Frank and Goyal’s Model
Table 4.10 shows the results for the disaggregation of financial deficit. Panel (A)
shows the regression results for new issuance of debt. The proxy for cash dividends
is negative and significant at 5%, consistent with the finding of Frank and Goyal
(2003). The results suggest that firms that pay dividends use less debt in financing
their capital structure. Frank and Goyal argue that capital expenditures are positively
Chapter Four
101
related to debt. The results support this argument, the capital expenditure coefficient
is positive and with the predicted sign. These findings support the pecking order
theory. The proxy for the change in working capital and internal cash flow is not
significant. Panel (B) shows the regression results for change in the debt ratio. All
the results are the same as for new debt issuance, except the cash dividends
coefficient becomes insignificant. However, the models’ power to explain firms’
debt behaviour is weak, the R2 range from just 1% to 5%.
Table 4. 10 Results for Frank and Goyal Model
Using OLS regression with panel data, the table provides the regression results testing pecking order
theory based on Frank and Goyal’s (2003) model. The following equation is estimated: ∆ 8�F@�,� � � 58�,�� � 59�,� � �∆ �5I�,� � � 56�,� � )� � � � *�,� �<. 4.13 The data from 85 non financial Jordanian firms listed on the Amman Stock Exchange (ASE) with
complete observations for the period 2000-2008. Standard errors are heteroskedasticity-robust and
clustered by firm. Wald is a Wald test of the joint significance of the reported coefficients,
asymptotically distributed as x2 under the null of no relationship. Applying a two-tailed test, the
asterisk ***, **, and * denotes that the coefficients are statistical significance at 1%, 5%, and 10%
level, respectively. Where the dependent variable ∆ Debt i,t represents the change in the total debt to
total assets ratio or new issuance of debt for firm i in year t. The independent variables are as follows;
CD is the paid dividends for year t. CE is the capital expenditure on fixed assets in year t minus the
fixed assets in year t-1 plus depreciation in year t. WCA is the working capital in year t is the
difference between current assets and current liabilities at year t and year t-1 for each firm, ∆ WCA is
the change between working capital in year t and year t-1. CF is the internal cash flow and represents
the net income for firm i in year t plus depreciation for the year t. all independent variables are scaled
by total book value of assets.
(A) (B) Dependent variable
New Issuance of Debt ∆ Debt
Independent variables
58�,� -0.152** (-2.30)
-0.034 (-0.37)
59�,� 0.127** (2.54)
0.155** (2.41)
∆ �5I�,� -0.018 (-0.642)
-0.080 (-1.48)
56�,� -0.018 (-0.642)
0.0005 (0.01)
R2 0.05 0.05 No. of firms 85 85 Year Dummies yes yes LM test-chi2 (df) 13.62(1) 0.16 (1)
Hausman test -chi2 (df) 4.45(4) 7.32(4)
Wald test (df) 19.62(7) 28.03(7)
Wald test 1 (df) 27.74(4) 16.01 (4)
F statistics (df) 40.42(11) 43.53(11)

Chapter Four
102
4.10.3 Pecking Order Model and Debt Capacity
Pecking order theory implies that firms use internal cash flow followed by debt, and
equity is the last resort. As aforementioned in section (4.10), Shyam-Sunder and
Myers’ (1999) model assumes that the financing deficit should be matched by a
change in corporate debt. Therefore, if pecking order theory holds, the slope
coefficient of the financial deficit should be close to one. However, this model
ignores the possibility that the firm’s financing behaviour of the firm will be
affected by other factors beyond the firm’s choices, where firms with similar
financial needs face different constraints to issue debt. Recent studies show that the
firm’s ability to raise funds from the debt market would affect the pecking order
coefficient in Shyam-Sunder and Myers’ model. Studies by Lemmon and Zender
(2010) and Abe de Jong et al., (2010) and Bulan and Yan (2010) find that the
pecking order model performs better if we account for a firm’s debt capacity; debt
capacity refers to the ability of the firm to issue debt in the market. Thus, firms with
low restrictions to raise funds from the debt market could cover their financial
deficit with debt, so the pecking order coefficient should reflect their financing
behaviour better than firms with higher restrictions. To test if the firms are
constrained by their debt capacity, they use the firm’s characteristics and bond rating
to differentiate between constrained and unconstrained firms.
They propose that the pecking order coefficient is higher for unconstrained firms
since they have good access to relatively low-cost borrowing. So, they finance their
financial deficit by issuing debt. Their higher debt capacity might arise because of
less asymmetric information with the market. On the other hand, the financing
behaviour for firms that face financing restrictions should be different because they
cannot issue debt easily, and they avoid using debt because they are concerned about
their debt capacity. The results show that unconstrained firms do use debt to satisfy
their external financing needs, the pecking order coefficient being larger than for
constrained firms (Lemmon and Zender, 2010).
The aim of this section is to test the pecking order model, accounting for a firm’s
debt capacity using the firm’s market listing and characteristics (size, age and
dividend policy). Unconstrained firms should have larger pecking order coefficients
than constrained firms (i.e. βPO to be close to 1).

Chapter Four
103
In order to measure whether firms face financing constraints in the external financial
market, we use the same measures as in section (3.4) in Chapter Three , where we
assumed that large firms should have good access to the debt market and can easily
use debt without concern for debt capacity. Mature firms have a close relationship
with lenders and they should have greater debt capacity than young firms. Dividend
paying firms are expected to have better access to the debt market than non-dividend
paying firms. In Jordan there are the first and second markets, where first market
firms are more profitable, stable and less constrained with a greater debt capacity.
Consequently, the null hypothesis is that unconstrained firms are less likely to be
concerned over debt capacity, are more likely to use debt to finance their deficit, and
are better able to obtain loans on better terms than constrained firms.
We divide the sample into two groups, giving four classification criteria:
1- Market listing; first market and second market firms, where firms listed in the
first market are unconstrained firms.
2- Firm size; classified by total assets and total sales. Firms above or below the
sample median belong to large or small firms, respectively. Large firms are assumed
to be financially unconstrained.
3- Age of the firm; classified by the point at which the firm is established. Firms
above or below the sample median are classified as mature and young firms,
respectively. Mature firms are assumed to have good access to the debt market and
are therefore unconstrained.
4- Dividend policy: firms are split by the payout ratio, Firms above or below the
median are classified as high or low payout firms, respectively. For robustness, we
use dividend paying and non-dividend paying firms as another criterion.
4.10.3.1 Debt capacity and market listing
This section applies the Shyam-Sunder and Myers model to test pecking order for
firms most likely to be constrained by their debt capacity17. To compare my results
with other studies we use the change of debt as the dependent variable. The pecking
17 All of the results in this section are based on random effect estimation. In unreported robustness tests, the results from pooled or fixed effect are very similar to those reported here.

Chapter Four
104
order model should perform better for unconstrained firms because they can issue
debt more easily than constrained firms. The first measure is market listing, where
firms listed in the first market are assumed to have good access to the debt market
and use debt to finance their financial deficit.
In Table 4.11 the results for both first and second market do not support pecking
order theory, the coefficient for both of them is significantly lower than one18. The
results also show that the estimated coefficient on the deficit variable is statistically
significant for first market firms and not statistically significant for second market
firms. The estimated coefficient for first market firms is 0.109, showing that first
market firms issue debt to finance part of their financial deficit. However, there is
no evidence that change in debt due to financial deficit is statistically different
between the two groups, the t-statistic for the difference is not significant (the
interaction variable is 1.21, and t* = 0.72). So, the null hypothesis that debt capacity
18 The Wald test of null hypothesis that � = 1 is rejected for both first and second market firms (p-value = 0.000)
Table 4. 11 Debt Capacity and Market Listing
The following equation is estimated: ∆ 8�F@�� � |� 896 �,� � )� � � � *�� eq. 4.11 . Where ∆ 8�F@�,� is the change in the total debt to total assets ratio, DEFi,t is the financial deficit to total assets, Standard errors are heteroskedasticity-robust and clustered by firm. t-statistics are in parenthesis below the coefficient estimates. See Table 4.9 for variables definition.
Dependent Variable
∆Debt it
Independent Variable First market Second market
Constant -0.006 (-0.54)
-0.004 (-0.15)
DEFi,t 0.109** (2.45)
0.015 (0.20)
R2 0.08 0.11 Year dummies yes yes No. of firms 35 22 LM test-chi2 (df) 9.15(1) 1.29(1) Hausman test -chi2 (df) 0.05(1) 0.23(1) Wald test (df) 18.23(7) 35.85(7) Wald test 1 (df) 6.02(1) 0.2(1) F statistics (df) 27.45(8) 35.95(8)
Chapter Four
105
has a different impact on the financing behaviour of the two groups is rejected 19.
The results suggest that first market firms use debt to finance their financial deficit
and are less concerned about their debt capacity.
4.10.3.2 Debt capacity and firm size
Large firms should less restricted in issuing debt because they have a better relation
with the credit market, and they have a lower probability of bankruptcy because they
are more diversified and provide better collateral. Small firms tend to use less debt
since they would be more likely to liquidate if they are in financial distress. Thus,
small firms are more likely to be constrained by their debt capacity. Thus, the
pecking order model should perform better for large firms and the pecking order
coefficient should be close to one.
Table 4.12 shows that the pecking order coefficient is significantly lower than 1 for
both large and small size firms20,21. The results show that the financial deficit
coefficient is statistically significant for large firms 0.117 and insignificant for small
firms -0.03. The difference in the estimated financial deficit variable between the
two groups is significant (the interaction variable is 1.67, and t* = 2.23), so the null
that the slope coefficient between the two groups is the same is rejected.
19 To test if the deficit variable is statistically different between firms in first and second market, I pool the observations from two groups, and use a group dummy variable (set to 1 for first market firms and 0 for second market firms) as well as an interaction variable (financial deficit interacted with group dummy). A t-test of the interaction term variable then yields the statistical significance of the differences in the estimated sensitivities for the two groups. I refer to this test by t. For robustness,
I use the t-test for the differences that is calculated as t*= (V� � V�N ���� � ��� where y1 and y2 are the coefficient of financial deficit variable for first market and second market respectively and J�� z{ J�� are the standard errors on the coefficients, I refer to this test by t*. I use the same methodology for all other estimations in this section. 20 For robustness, I use firm sales as a proxy for firm size, the results are qualitatively similar, so the results are not reported. 21 The Wald test of the null hypothesis that �� =1 is rejected for both large and small firms (p-value = 0.000)
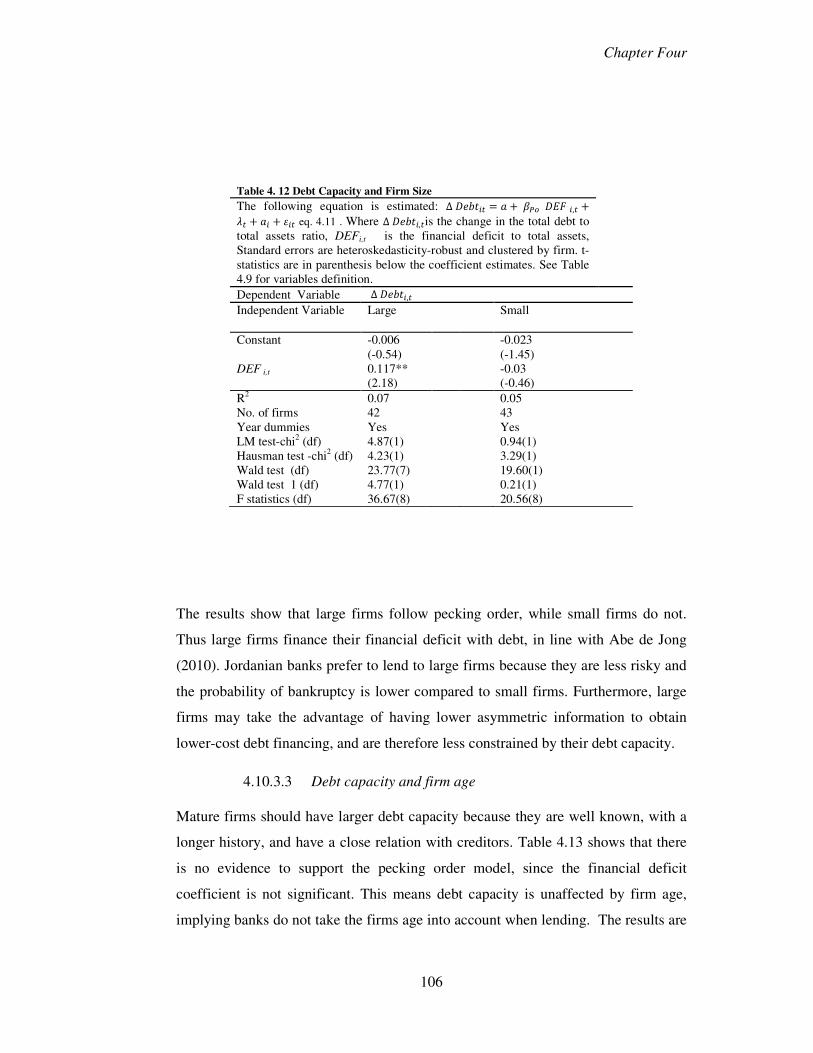
Chapter Four
106
The results show that large firms follow pecking order, while small firms do not.
Thus large firms finance their financial deficit with debt, in line with Abe de Jong
(2010). Jordanian banks prefer to lend to large firms because they are less risky and
the probability of bankruptcy is lower compared to small firms. Furthermore, large
firms may take the advantage of having lower asymmetric information to obtain
lower-cost debt financing, and are therefore less constrained by their debt capacity.
4.10.3.3 Debt capacity and firm age
Mature firms should have larger debt capacity because they are well known, with a
longer history, and have a close relation with creditors. Table 4.13 shows that there
is no evidence to support the pecking order model, since the financial deficit
coefficient is not significant. This means debt capacity is unaffected by firm age,
implying banks do not take the firms age into account when lending. The results are
Table 4. 12 Debt Capacity and Firm Size
The following equation is estimated: ∆ 8�F@�� � |� 896 �,� �)� � � � *�� eq. 4.11 . Where ∆ 8�F@�,�is the change in the total debt to total assets ratio, DEFi,t is the financial deficit to total assets, Standard errors are heteroskedasticity-robust and clustered by firm. t-statistics are in parenthesis below the coefficient estimates. See Table 4.9 for variables definition. Dependent Variable ∆ 8�F@�,� Independent Variable Large Small
Constant -0.006
(-0.54) -0.023
(-1.45) DEF i,t 0.117**
(2.18) -0.03
(-0.46) R2 0.07 0.05 No. of firms 42 43 Year dummies Yes Yes LM test-chi2 (df) 4.87(1) 0.94(1) Hausman test -chi2 (df) 4.23(1) 3.29(1) Wald test (df) 23.77(7) 19.60(1) Wald test 1 (df) 4.77(1) 0.21(1) F statistics (df) 36.67(8) 20.56(8)

Chapter Four
107
in contrast with those of Bulan and Yan (2010), who find that mature firms follow
the predictions of pecking order closer than young firms.
4.10.3.4 Debt capacity and dividends
Firms with a high payout ratio should be less financially constrained because they
expect to finance their financial deficit from financial markets. Their debt capacity
will have less of an impact on their decision to issue debt. Table 4.14 shows no
support for this hypothesis. The pecking order model fails to describe the financing
behavior for either high or low dividend paying firms, the coefficient being
insignificant for both22.
22 I repeated the analysis for dividend paying firms and non-dividend paying firms the results are qualitatively similar. The results are not reported here.
Table 4. 13 Debt Capacity and Firm Age
The following equation is estimated: ∆ 8�F@�,� � |� 896 �,� �)� � � � *�,� eq. 4.11 . Where ∆ 8�F@�,�is the change in the total debt to total assets ratio, DEFi,t is the financial deficit to total assets, Standard errors are heteroskedasticity-robust and clustered by firm. t-statistics are in parenthesis below the coefficient estimates. See Table 4.9 for variables definition. Dependent Variable ∆ 8�F@�,� Independent Variable Mature Young
Constant -0.004
(-0.35) 0.024
(-0.023) DEF i,t 0.048
(1.06) 0.024
(0.32) R2 0.04 0.03 No. of firms 42 43 LM test-chi2 (df) 0.11 (1) 0.14 (1) Hausman test -chi2 (df) 0.01(1) 0.11 (1) Wald test (df) 1.13 (1) 0.1 (1) Wald test 1 (df) 31.25 (7) 15.64 (7) F statistics (df) 38.06 (8) 19.82 (8)
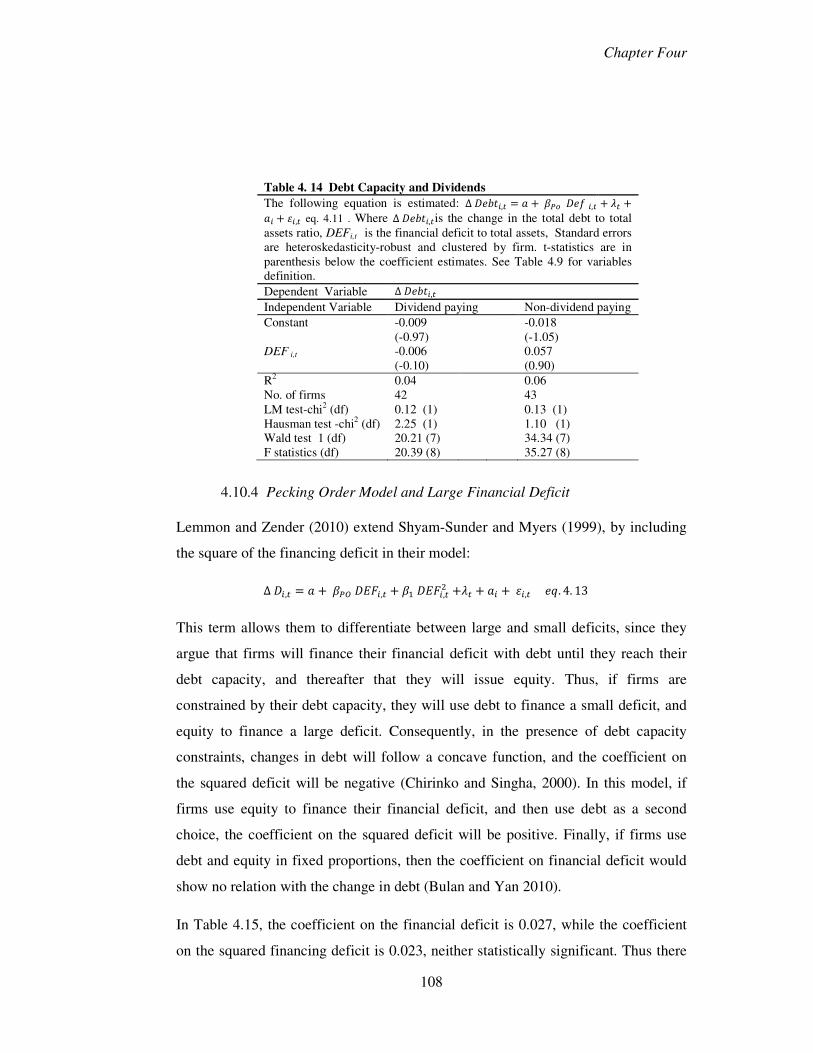
Chapter Four
108
4.10.4 Pecking Order Model and Large Financial Deficit
Lemmon and Zender (2010) extend Shyam-Sunder and Myers (1999), by including
the square of the financing deficit in their model:
∆ 8�,� � |} 896�,� � � 896�,�� �)� � � � *�,� �<. 4. 13 This term allows them to differentiate between large and small deficits, since they
argue that firms will finance their financial deficit with debt until they reach their
debt capacity, and thereafter that they will issue equity. Thus, if firms are
constrained by their debt capacity, they will use debt to finance a small deficit, and
equity to finance a large deficit. Consequently, in the presence of debt capacity
constraints, changes in debt will follow a concave function, and the coefficient on
the squared deficit will be negative (Chirinko and Singha, 2000). In this model, if
firms use equity to finance their financial deficit, and then use debt as a second
choice, the coefficient on the squared deficit will be positive. Finally, if firms use
debt and equity in fixed proportions, then the coefficient on financial deficit would
show no relation with the change in debt (Bulan and Yan 2010).
In Table 4.15, the coefficient on the financial deficit is 0.027, while the coefficient
on the squared financing deficit is 0.023, neither statistically significant. Thus there
Table 4. 14 Debt Capacity and Dividends
The following equation is estimated: ∆ 8�F@�,� � |� 8�~ �,� � )� �� � *�,� eq. 4.11 . Where ∆ 8�F@�,�is the change in the total debt to total assets ratio, DEFi,t is the financial deficit to total assets, Standard errors are heteroskedasticity-robust and clustered by firm. t-statistics are in parenthesis below the coefficient estimates. See Table 4.9 for variables definition. Dependent Variable ∆ 8�F@�,� Independent Variable Dividend paying Non-dividend paying Constant -0.009
(-0.97) -0.018
(-1.05) DEF i,t -0.006
(-0.10) 0.057
(0.90) R2 0.04 0.06 No. of firms 42 43 LM test-chi2 (df) 0.12 (1) 0.13 (1) Hausman test -chi2 (df) 2.25 (1) 1.10 (1) Wald test 1 (df) 20.21 (7) 34.34 (7) F statistics (df) 20.39 (8) 35.27 (8)

Chapter Four
109
is no support that this model captures the financing behaviour of Jordanian firms.
Finally, we apply the Lemmon and Zender model to the analysis of financial
constraints and debt capacity among different type of firms. In particular we
repeated the analysis from section 4.10.3 using equation 4.13. The results are
qualitatively the same as the results in that section, and therefore we do not report
them here.
Overall, the results in this section provide limited support for pecking order theory.
In particular, there is no consistent evidence that the Shyam-Sunder and Myers
model can capture the financing behaviour of Jordanian firms. The model predicts
that firms should finance their financial deficit using debt financing as their first
choice. It is possible that its inability to capture the financing behaviour of Jordanian
firms is that there are hidden costs of issuing debt or hidden associated benefits of
issuing equity (Chirinko and Singha, 2000). Alternatively, the results show that
Jordanian firms do not have a particular preference for issuing equity or debt, and
that as a result they are issued in proportions that are comparable to their initial state.
As a result, the financial deficit has no impact on the change in debt ratio. Jordanian
Table 4. 15 Pecking Order Model and Large Financial Deficit
The following equation is estimated: ∆ 8�F@�,� � � 8�~ �,� � � 8�~� �,� � )� � � � *�,� eq. 4.13 . Where ∆ 8�F@�,�is the change in the total debt to total assets ratio, DEFi,t is the financial deficit to total assets, Standard errors are heteroskedasticity-robust and clustered by firm. t-statistics are in parenthesis below the coefficient estimates. See Table 4.9 for variables definition. Dependent Variable ∆ in Debt ratio ∆D it Independent Variables Constant -0.014
(-1.51)
DEFi,t 0.027 (0.55)
DEF2
i,t 0.023 (0.23)
R2 0.03 No. of firms 85 LM test-chi2 (df) 0.06 (1) Hausman test -chi2 (df) 1.48 (2) Wald test (df) 0.60 (2) Wald test 1 (df) 30.7 (7) F statistics (df) 34.71 (9)
Chapter Four
110
capital structure is therefore determined not only by the financial deficit, but by the
other factors discussed in section 4.7.
4.11 CONCLUSION
This chapter examines the main determinants of the capital structure choice by
Jordanian firms, and in so doing also examines the main theories that have been
proposed for firms’ capital structure decisions. The chapter also examines the
dynamic nature of leverage, whether Jordanian firms have a target capital structure
and then measures the speed of adjustment towards this target. In addition, the
chapter examines the implications of pecking order theory explicitly by applying
Shyam-Sunder and Myers’s (1999) and Frank and Goyal’s (2003) models. The
analysis uses panel data for 85 firms listed on the Amman stock exchange over the
period 2000-2008. The main findings are the following:
1. The results show a negative relation between profitability and firm leverage,
which is consistent with the predictions of pecking order theory. The negative
relation suggests that firms’ first recourse is to internal cash flow, followed by
external sources of funds.
2. Regression results may also support the pecking order theory, where liquidity
has a negative impact on the debt ratio. This suggests that firms with high
liquidity prefer to use their internal funds before borrowing from external
sources.
3. In light of the results, it would appear that large firms tend to have more debt
in their capital structure. The positive relationship between debt and firm size
seems to support the trade off theory, where the firm is predicted to employ
more debt if the firm’s cost of debt is low and it has good access to the credit
markets.
4. In contrast to expectation, growth opportunities and non-debt tax shields show
a positive relation with firm debt. However, the results find inconclusive
evidence to support the firm’s ownership structure having an impact on the
firm’s leverage ratio.

Chapter Four
111
5. The results show that Jordanian firms have a target debt ratio, and adjust their
leverage quickly to move toward this target.
6. Finally, the results present inconclusive and very limited evidence to support
that we can test pecking order theory in Jordan by using Shyam-Sunder and
Myer’s model or Frank and Goyal’s model.
Table 4. 16 A Summary of Empirical Studies on the Determinants of Capital Structure
Independent variable Positive relation with debt Negative relation with debt No relation with debt
Assets tangibility Frank and Goyal (2003),
Rajan and Zingales (1995),
Chen (2004)
Gonenc(2003) Gaud et al., (2005), Bennett
and Donnelly (1993),
Titman and Wessels (1988),
Bevan and Danbolt (2002),
Huang and Ritter (2009),
Firm size Frank and Goyal (2003),
Gonenc(2003), Rajan and
Zingales (1995),
Wiwattanakantang (1999),
Rajan and Zingales (1995)
for Germany, Gaud et al.,
(2005), Chen (2004)
Ozkan (2001)
Growth opportunities Gonenc(2003), Chen
(2004), Pandey and
Chotigeat (2004),
Bevan and Danbolt (2002)
Frank and Goyal (2003),
Rajan and Zingales (1995),
Gaud et al., (2005),
Wiwattanakantang (1999)
Bennett and Donnelly
(1993), Titman and Wessels
(1988), Bevan and Danbolt
(2002)
Non-debt tax shield Moh'd et al., (1998) Miguel and Pindado (2001),
Bennett and Donnelly
(1993), Wiwattanakantang
(1999)
Titman and Wessels (1988),
Chen (2004)
Liquidity Ozkan (2001),
Profitability Frank and Goyal (2003),
Gonenc(2003), Rajan and
Zingales (1995), Gaud et al.,
(2005), Ozkan (2001), Chen
(2004)
Volatility Bennett and Donnelly
(1993)
Titman and Wessels (1988),
Antoniou et al., (2008),
Chen (2004)
Dividend payout ratio Crutchley et al., (1999), Rozeff(1982), Chen and
Steiner (1999)
Antoniou et al. (2008),
Blockholders Brailsford et al., (2002)
Institutional investors Crutchley et al., (1999) Gonenc(2003)
Presence of target leverage
ratio
Miguel and Pindado (2001), Frank and Goyal (2003), Ozkan (2001), Huang and Ritter
(2009), Antoniou et al., (2008), Lemmon et al. (2008), Flannery and Rangan (2006), Gaud
et al., (2005)

Chapter Five
112
CHAPTER FIVE
DIVIDEND POLICY IN JORDAN
5.1 INTRODUCTION
One of the most important decisions for any firm’s management is the dividend
payment decision. Managers need to be vigilant and careful when making the
decision concerning whether or not to pay dividends, as well as the amount of
dividends. Many researchers have attempted to establish theories and empirically
test the main determinants of the dividend payout decision. Most have found that the
firm’s characteristics and market structure are the most important factors affecting
the dividend policy; however, there is no consensus on the main determinants of
dividend policy as researchers utilise data from different countries and sometimes
different time spans for the same country, as well as use different statistical
methodologies.
Most of the studies to examine dividend policy have been carried out in developed
countries, although some researchers have considered dividend behaviour in
developing countries. The differences between developed and developing countries
may help to change our perspective on dividend behaviour in developing countries.
More specifically, the Jordan case presents at least four main factors motivating the
study of dividend policy. First, in Jordan, there are no taxes on dividends and capital
gains, which makes Jordan different from most other countries. Second, in Jordan,
the capital market relies on the banking sector, which means that the relationship
between creditors and firms is close, which may affect the asymmetric information
and agency cost problems. Third, there is a highly concentrated ownership structure.
Fourth, according to Jordanian Companies Law, Jordanian firms are not permitted to
pay dividends if they have any losses or have accumulated losses during a specific
year.

Chapter Five
113
This chapter considers the main dividend policy theories, including agency cost,
signalling, and free cash flow. In addition, lifecycle theory is considered, owing to
the fact that this framework incorporates the impact of the firm’s financial age.
Dividend policy in Jordan is investigated as follows; first, the main determinants
affecting the probability of dividend payment using Logit regression are
investigated; second, the main determinants known to affect the amount of dividends
that firms pay are analysed through the use of the Tobit model; third, standard errors
are rectified using two statistical methodologies (Fama and MacBeth, 1973;
Petersen, 2009); fourth, the dynamic nature of the dividends are analysed through
the application of Lintner’s model, with examination concerning whether there is
any stickiness of dividends, as proposed by Lintner (1956); and finally, whether or
not there is any target payout ratio is established, as well as whether firms follow a
dividend smoothing pattern. We apply the GMM method to estimate the target
payout ratio, as suggested by Arellano and Bond (1991).
5.2 MAIN DIVIDEND THEORIES
5.2.1 Miller and Modigliani Theorem (1961)
Miller and Modigliani (1961) introduce the irrelevance proposition of dividend
policy, showing that, under certain conditions, the firm’s dividend policy will not
affect the firm value, and further emphasising that the only relevant decision that
will affect firm value is the firm’s overall investment decisions. They argue that a
firm’s dividends represent the residual between firm investments and firm earnings,
and prove that investors will offset the firm’s dividend decision by selling the firm
stock if the firm retains dividends, or reinvest the dividends if the firm distributes
dividends; this is referred to as homemade dividends. Consequently, the firm’s
dividend policy should be irrelevant, and the firm’s investors will not pay a higher
price for firms that follow a certain dividend policy.

Chapter Five
114
One of the most important conditions Miller and Modigliani assume for dividend
policy to be irrelevant to firm value is that the capital market is perfect, which
means:
1. All investors have costless access to all information related to the operation
and value of the firm, with the firm’s management and investors holding the
same information regarding the firm’s future earnings;
2. There are no transaction costs or brokerage fees on trading the firm’s shares,
with the tax remaining the same on the capital gain and dividends from the
firm’s shares; and
3. The investors are rational, meaning that the investors prefer more wealth to
less, where increases in wealth derive from cash payment from shares or an
increase in the market value of shares.
As these conditions are unlikely to hold, we can expect the firm’s dividend policy to
affect the firm’s value for the following reasons:
1. The tax effect: In real life, tax is different between capital gains and dividend
payments, and it is expected that some investors will prefer dividends over
capital gains, and vice versa. However, capital gains are often taxed less than
dividends.
2. Transaction costs: These are incurred when receiving dividends, but are
lower than when trading the shares.
3. Agency costs: Many studies show that managers have better information
concerning the firm’s overall value than investors. Thus, we expect that some
uses of dividends include reducing the asymmetric information problem
between managers and investors. Countries with weak minority investors’
protection pay more dividends to reduce agency-related problems, Ferris et
al., (2009).
5.2.2 Signalling Hypothesis
The signalling theory implies that the firm’s management with superior information
uses dividends to communicate a good signal/impression to market participants
Chapter Five
115
concerning the current and future earnings of the firm (see Bhattacharya (1979),
Miller and Rock (1985), Ambarish et al.,(1987) and John and Williams (1985))
Private information is revealed to the market when the firm pays regular dividends,
or imposes a cut in dividends (an indicator that future earnings are declining),
Accordingly, firms will try to avoid a cut in dividends, explaining dividend
stickiness. Some studies have established a significant impact in relation to changing
dividends payments on firm stock returns, which confirms that changes in dividend
policy affect firm value (Aharony and Swary, 1980; Asquith and Mullins, 1983;
Benartzi, et al. 1997; Allen et al., 2000; Koch and Sun, 2004; Dong et al., 2005;
Jensen et al., 2010; Fuller and Blau, 2010). However, some studies find weak
evidence to support the signalling theory (Barclay et al., 1995; Brav et al., 2005; Li
and Zhao, 2008).
5.2.3 Agency Cost Theory
The agency cost theory implies that the separation of firm ownership from
management could create problems owing to there being differences between the
priorities of the managers and shareholders. According to agency theory, managers
utilise the firm’s resources to increase resources under their control. In many firms,
managers’ bonuses are positively related to the profitability and size of the firm. In
large firms, it is easier for managers to hide unjustified consumption of the firm’s
resources (Kalay and Lemmon, 2008), so managers invest beyond optimal
investment levels (the overinvestment problem). Easterbrook (1984) argues that
dividends play a key role in reducing agency problems between shareholders and
management. Furthermore, increasing the amount of dividends reduces the amount
of internal cash flow that managers can use to fund new investments, thus increasing
their dependency on external sources of capital. A higher frequency of using
external finance increases the external monitoring on managers’ investment
decisions.
Jensen (1986) supports the agency cost theory, and accordingly presents the free
cash flow theory, arguing that free cash flow can be utilised to reduce agency costs.
Free cash flow represents the cash flow available to the firm after funding all
positive net present value investments, and which the managers will be tempted to
Chapter Five
116
invest in negative net present value projects and increase the resources under their
control. Managers believe that the larger the firm, the greater the discretionary funds
available to them to consume, and so they will seek to build an empire rather than
maximising the firm’s value for the benefit of the shareholders. This suggests that
firms with free cash flow will suffer more from the conflict between shareholders
and managers. Managers encourage firms to reduce the free cash flow available,
either through paying dividends or increasing the firm’s debt and committing the
firm to pay debt interest.
5.2.4 Lifecycle Theory
The lifecycle theory of dividends suggests mature firms are better positioned to pay
dividends because they have accumulated internal cash flow and have good access
to external finance, DeAngelo et al., (2006). The lifecycle stage of the firm provides
a good indication of the firm’s ability to pay dividends. In the early stages of the
firm’s life, the firm has many investment opportunities, external finance is costly,
and low profitability. Small, low-profit firms with high investment opportunities pay
lower dividends, Fama and French (2001). DeAngelo et al., (2006) propose using
the amount of retained earnings as a proxy for the stage of the firm’s lifecycle,
which in turn will provide them the capacity to pay dividends.
5.3 EMPIRICAL STUDIES OF DIVIDEND POLICY
This section is divided into two; the first presents the main studies concerned with
dividend policy in developing countries, the second section focuses on developing
countries. The main reason for this distinction is that there are many differences in
dividend policy between developed and developing countries. For instance, the
institutional environment, such as the close relationship between banks and firms in
developing countries, has a significant impact on dividend policy, Aivazian et al.,
(2003a). Consequently, the main theories of dividends which seek to explain
dividend policy in developed countries, may not provide a comprehensive
explanation for dividend policy in developing countries owing to such theories
assuming that creditors have imperfect monitoring of the firm’s operations.
Chapter Five
117
5.3.1 Dividend Policy in Developed Countries
In general, there is strong evidence that firm characteristics play an important role in
determining whether or not a firm pays dividends, Fama and French (2001). This
evidence has then been used to support one or other of the above theories for the
payment of dividends. For example, Barclay, Smith and Watts (1995) find that firms
with high investment opportunities have a relatively lower dividend payment, and
vice versa. They also highlight a significant negative relationship between dividend
payout and growth opportunities, and a positive relationship with the size of the
firm. These results are consistent with dividends helping to mitigate firm
overinvestment and the free cash flow problem. Similar results relating to growth
opportunities and firm size were found by Fama and French (2001), Denis and
Osobov (2008), Eije and Megginson (2008) for firms across the EU, and Renneboog
and Trojanowski (2010) for UK firms. Denis and Osobov (2008) and Renneboog
and Trojanowski (2010) also find that dividend-paying firms are relatively more
profitable, suggesting firms reduce the resources under managers’ control to avoid
any growth of the firm beyond the optimum.
An alternative view is that firms pay dividends to attract institutional investors.
Institutional investors prefer to invest in dividend payers because they have a tax
advantage over individual investors, but also because dividends increase the value of
the firm by reducing information asymmetries, Allen et al., (2000). The presence of
institutional investors leads to the effective monitoring of the managers’ decisions,
and subsequently reduces agency problems. They show that firms utilise dividend
policy to signal firm quality to the market through the use of ownership clientele
effects. An ownership clientele effect is supported by Grinstein and Michaely
(2005), who find that institutional investors prefer dividend-paying firms over non-
dividend-paying firms. However, institutional investors show no preference between
firms that pay low dividends and those that pay high dividends, and have no impact
on the dividend payout ratio. Desai and Jin (2011) also explore the relation between
institutional shareholder tax characteristics and firm payout ratio, and argue that
some institutional shareholders will be averse to dividends. They find that the
proportion of dividend-averse institutional shareholders is negatively related to the
probability of the firm to initiate dividends.

Chapter Five
118
The importance of ownership and its impact on the agency problem is further
highlighted by Khan (2006), who finds that a higher ownership concentration leads
to a reduction in the payout ratio. Close monitoring by blockholders overcomes the
asymmetric information between managers and shareholders, and offsets the need
for dividends. Barclay et al., (2009) also investigate the relationship between
dividend payment and ownership concentration, and find that the amount of
dividends, or the propensity to pay dividends, is not affected by the corporate
blockholders’ ownership ratio.
The catering theory of dividends proposes simply that firms pay dividends when
investors put a stock price premium on dividend payers. Thus managers cater to
investor demand, which means that firms follow the market trend in terms of
whether or not to pay dividends, Baker and Wurgler (2004). They measure the
dividend premium by the difference between the average market-to-book value of
dividend payers and non-payers. They show that the dividend paying decision is
affected by the dividend premium. This is supported by Ferris et al., (2006) for the
UK, who show that managers have responded to a declining demand by investors for
dividends, and accordingly reduced the amount of dividends paid. Similarly,
Renneboog and Trojanowski (2010) argue that tax, and the tax treatment of
dividends, has had an important impact on the dividend decision of UK firms. They
argue that changes in the propensity to pay dividends in the UK can be related to
changes in the tax treatment of dividends, supporting the argument that firms cater
to investors’ preferences when making their dividend decision. However, based on
wider international evidence, Denis and Osobov (2008) find no evidence to support
a catering effect on dividend policy.
An important development in research on dividend policy has been the
establishment of the lifecycle theory of dividends. This theory proposes that mature
and established firms are more likely to pay dividends, since the dividend decision is
influenced directly by the proportion of retained earnings in the firm’s capital,
DeAngelo, DeAngelo and Stulz (2006). They argue that the earned/contributed
capital ratio measured by retained earnings to total equity is a valid proxy for the
lifecycle of the firm, which describes the degree to which a firm uses internal or
external sources of finance. Furthermore, they argue that firms with a high

Chapter Five
119
percentage of retained earnings to total equity are more likely to pay dividends. This
is because such firms have cumulated large profits over the years. Firms are less
likely to pay dividends when the firm’s equity is contributed rather than earned,
because this type of firm requires capital and is likely to have more investment
opportunities. They also show that the probability of the firm to pay dividends is
positively related to profitability and the size of the firm, and negatively related to
the firm’s growth opportunities. A number of recent papers have supported the
lifecycle theory to explain dividend policy, Denis and Osobov (2008), Brockman
and Unlu (2009), Chay and Suh (2009) and Coulton and Ruddock (2011).
Chay and Suh (2009) provide evidence to support the lifecycle theory, confirming
that earned/contributed capital has a positive impact on the amount of dividends
paid. However, they do not find evidence to support the notion that growth
opportunities have an impact on the amount of dividends paid. Coulton and
Ruddock (2011) test the lifecycle theory in Australia, and find that size and
profitability of the firm positively affect the probability of paying dividends, while
growth opportunities have a negative impact on the dividend payment decision.
There is also evidence of the importance of cash flow uncertainty on the dividend
decision. Chay and Suh (2009) show that cash flow uncertainty has a negative
impact on the amount of dividends firms pay, since they may expect the internal
cash flow will decline in the future. In addition, external sources of funds are more
costly for firms with a high volatility of cash flow, which subsequently leads to
additional financial costs. Firms with high cash flow uncertainty will rely more on
internal cash flow, and will accordingly pay fewer dividends. However, Eije and
Megginson (2008) are unable to confirm this result for firms across the European
Union, finding that there is no link between firms’ income risk and the likelihood
they will pay dividends.
Brockman and Unlu (2009) examine the impact of creditor rights on the dividend
decision, arguing that creditor rights will affect the agency costs between the
creditors and shareholders. Using data for firms from 52 different countries, the
results show that creditors’ rights have a positive impact on both the probabilities
and the amount of dividends paid, by reducing the agency conflict between
Chapter Five
120
shareholders and creditors. From the same perspective, Ferris et al., (2009) explore
the impact of legal protection to minority shareholders on the firm dividend policy.
The results support the argument that firms in countries with low investor protection
are more likely to pay dividends to substitute the poor legal protection to
shareholders.
Finally, research has examined dividend payout policy by surveying investors or
firms. Dong et al., (2005) surveyed individual Dutch investors, and find that they
prefer dividend payers because the cost of selling stock is greater than the cost of
cash dividends. Their results show that investors regard dividends as a signal of
future firm profitability, but do not support the free cash flow theory because they
do not consider dividends are a tool to reduce the overinvestment problem. Brav et
al., (2005) surveyed US executives, and found they assign the same importance to
paying dividends as investing in positive net present value projects. This contradicts
the argument that dividends are residual cash flow, and therefore does not support
the free cash flow theory that dividends play a role in imposing self discipline on
managers. However, the survey did suggest quite strongly that dividend paying
firms have a target payout ratio.
5.3.2 Dividend Policy in Developing Countries
Aivazian et al., (2003a) investigate the main determinants of dividend policy in
developing markets, and how this contrasts with that in developed countries. They
consider the impact of business risk, size, tangibility, return on equity (ROE),
market-to-book value, and debt ratio on dividend policy in 8 developing countries.
Some results are similar to those for developed markets, including the positive
relation with firm profitability, (see also Naceur et al., (2006) for Tunisian firms and
Huang et al., (2010) for Chinese firms). Consistent with dividend signalling, they
find a negative relation between the dividend payout ratio and earnings volatility,
which shows that firms with a high volatility of earnings prefer not to pay dividends.
They also consider the issue of access to external finance. Large firms, or those with
high asset tangibility, should have better access to external finance, and therefore
should be more willing to pay dividends. While results do not support this

Chapter Five
121
conjecture, Huang et al., (2010) do find a positive relation between firm size and the
payout ratio for Chinese firms.
Dividend policy in Tunis, where the market is dominated by the banks and
ownership is highly concentrated, is investigated by Naceur et al., (2006). Both of
these institutional characteristics imply close monitoring of management and a
reduction in the agency cost of equity, and in turn a lower payout ratio. However,
they find no link between ownership concentration and firms’ dividend policy. A
similar analysis has also been applied to non-financial firms in China (Huang et al.,
2010). Their results highlight that firms with high-growth opportunities tend to pay a
lower dividend, or choose not to pay dividends at all, demonstrating that firms use
internal cash flow because the cost of internal cash flow is lower than the cost of
external finance.
5.4 THEORETICAL FRAMEWORK AND HYPOTHESIS DEVELOPMENT
This section outlines the theoretical framework that identifies the main determinants
of dividend policy, and how we can test the dividend policy theories. In this section,
relationships between dividends and profitability, growth opportunities, firm size,
volatility, ownership structure, and retained earnings will be discussed, together with
how these relate to the dividend policy theories.
5.5 THE MAIN DETERMINANTS OF DIVIDEND POLICY
5.5.1 Dividend Policy and Profitability
The greater the firm’s profitability, the more cash available for managers to spend;
therefore, we expect that more profitable firms will be more likely to pay dividends
to reduce the agency costs of free cash flow, as proposed by Easterbrook (1984) and
Jensen (1986). Furthermore, firms with a high profitability ratio will have better
access to low-cost external financing because investors utilise profitability as one
indicator of the firm’s financial health and accordingly reduce the premium required
on capital. This reduces the need for internal sources of finance, as the firm will rely
more on external sources of finance because it has the ability to repay the debt.
Consequently, firms with high profitability show a greater likelihood to pay

Chapter Five
122
dividends and have a higher payout ratio, as found by Fama and French (2001),
Aivazian et al., (2003a), Denis and Osobov (2008), and Brockman and Unlu (2009).
The typical measure for firm profitability is the net operating income divided by
total assets (see Desai and Jin, 2011; Perris et al.,2009; Barclay, 2009; Coulton and
Ruddock, 2011).
H1 A: All else equal, the profitability of the firm increases the probability the firm
will pay dividends, supporting the free cash flow hypothesis and agency cost
problem.
H1 B: All else equal, the profitability of the firms increases the size of dividend,
which supports the free cash flow hypothesis and agency cost problem.
5.5.2 Dividend Policy and Growth Opportunities
Firms with high growth opportunities would have lower dividend payments since
new investment will consume large amounts of internally generated cash, which has
a lower cost compared with external funds. Firms with high growth opportunities
have profitable uses for their internal cash flows, and therefore pay smaller
dividends. Rozeff (1982) and Mayers and Majluf (1984) argue that the firm’s
investment policy will significantly affect its dividend policy because the costs
associated with the external sources of finance will create competition between
investment opportunities and dividend payments. Importantly, this argument is also
supported by the findings of many researchers (see Fama and French, 2001;
DeAngelo et al., 2006; Brockman and Unlu, 2009; Ferris et al., 2009; Chay and Suh,
2009; Fuller and Blau, 2010). Moreover, Barclay et al., (1995) argue that firms with
low investment opportunities will pay high dividends to reduce any overinvestment
problem. On the other hand, however, firms with high investment opportunities will
have lower dividends payment to protect themselves from the underinvestment
problem since the cost of external sources of finance may prevent the company from
investing in projects with positive net present value. Therefore, a negative
relationship will exist between growth opportunities and dividends. Following
Aivazian et al., (2003a), Naceur et al., (2006), and Chay and Suh (2009), market
value of equity over the book value of equity is used as a proxy for growth
opportunities.

Chapter Five
123
H2 A: All else equal, there is a negative impact of growth opportunities on the
probability of the firm to pay dividends.
H2 B: All else equal, the growth opportunities variable has a negative effect on the
amounts of dividends that the firms pay.
5.5.3 Dividend Policy and Firm Size
Fama and French (2001) show that large firms pay more dividends than small firms,
highlighting that the total assets of dividend-paying firms is more than eight times
that of non-paying firms. Many researchers suggest that large firms will have better
access to the capital market since large firms are well known, have long-standing
relations with investors, are more diversified, and have a lower probability of
bankruptcy (see Fama and French, 2001; Aivazian et al., 2003a; Denis and Osobov,
2008; Eije and Megginson, 2008; Brockman and Unlu, 2009). Thus, the cost of
external of finance will be lower for large firms.
In large firms, the resources under the firm’s management are significant, which
implies difficulties for shareholders to monitor managers’ investment decisions,
Shareholders will seek to reduce the agency costs of free cash flow by encouraging
firms to pay dividends, thereby increasing the interaction between the firm’s
management and the capital market. Following Barclay et al., (2009), Chay and Suh
(2009), Brockman and Unlu (2009), Jensen et al., (1992), and Gugler and Yurtoglu
(2003), the natural logarithm of the book value of total assets will be used as a proxy
for firm size.
H3 A: All else equal, there is a positive impact of firm size on the probability the
firm will pay dividends, and this supports the agency cost and asymmetric
information problem.
H3 B: All else equal, there is a positive relation between firm size and the amount of
dividends paid, and this supports the agency cost and asymmetric information
problem.

Chapter Five
124
5.5.4 Dividend Policy and Volatility
Firms with high earnings volatility will have a low propensity to pay dividends for
two reasons; first, if the signalling model holds, firms with fluctuating earnings will
pay a higher cost to replace the internal funds used to maintain the level of dividends
when earnings decline (see Aivazian et al., 2003a). In the case of Jordan,
maintaining dividends in years of losses is difficult owing to the fact that Jordanian
firms are not allowed to pay dividends if they have losses for the current year or
have otherwise accumulated losses from previous years. Second, firms with
fluctuating earnings are regarded as being more risky than those with lower earnings
fluctuations. Therefore, firms with fluctuating earnings will reduce dividend
payments, and instead will accumulate internal cash flows to finance their
investment. Importantly, this also overcomes the problem of utilising costly external
finance, or of foregoing positive net present value investments (see Fama and
French, 2002; Chay and Suh, 2009).
This argument is supported by Eije and Megginson (2008), who find that income
risk as measured by variability of net income negatively affects the probability of
paying dividends. Consequently the absolute value of the change in annual net
income is used as a proxy for earnings volatility (see Leary and Roberts (2005)).
H4 A: All else equal, there is a negative impact of the firm’s earnings volatility on
the likelihood that the firm will pay dividends.
H4 B: All else equal, earnings volatility has a negative relationship with the amount
of dividends paid.
5.5.5 Dividend and Ownership Structure
Ownership concentration reduces the agency costs of equity because large
shareholders have the ability and incentive to monitor managers’ decisions due to
the economies of scale in monitoring costs (see Shleifer and Vishny, 1986). This is
recognised as being consistent with the argument Jensen and Meckling (1976) and
Easterbrook (1984), and accordingly the firm’s ownership structure has an important
impact on the firm’s dividend decisions.

Chapter Five
125
Denis and Serrano (1996) show that blockholders actively monitor the manager’s
performance and provide useful control efforts. In countries with low protection of
shareholders rights, minority shareholders will prefer to receive dividends in order to
get a return on their investment and accordingly reduce the possibility of insider
expropriation by reducing the resources under the insider control (see La Porta et al.,
2000). Therefore, it is expected that a negative relationship will be established
between dividend and the percentage of shares owned by blockholders. Following
Barclay et al., 2009, the proxy for blockholder ownership is the sum of shares held
by corporate blockholders who own more than 5% of the firm’s shares.
The above argument also holds for institutional investors, because institutional
investors have the ability to reduce agency costs since they have the required skills
to monitor the firm’s management (Jensen and Meckling, 1976). Therefore,
institutional shareholders will reduce agency cost problems, and dividends will not
be used as a tool to reduce the agency problem.
On the other hand, the tax preference hypothesis and the tax clientele effect predict a
positive relationship between dividend payout and institutional investors because
institutional investors have a tax advantage in regard to dividends. However, this is
unlikely to be the case in Jordan since all shareholders do not pay tax on dividends.
Nevertheless, Grinstein and Michaely (2005) and Allen et al., (2000) argue that tax
preferences are not the only reason for institutional investors to prefer dividend-
paying firms. The prudent man rule encourages institutional investors to invest in
firms that pay dividends (see, also, Renneboog and Trojanowski (2010))
Overall, it is expected there will be a negative relationship between dividend
payment and institutional investors. Following Grinstein and Michaely (2005),
Moh’d et al., (1995), and Li and Zhao (2008), the ratio of common stock held by
institutions to total shares outstanding is used as a proxy for institutional investors.
1- Blockholders
H5.1 A: All else equal, there will be a negative impact of blockholders’ ownership
on the likelihood the firm will pay dividends, and this will support the agency cost
theory.

Chapter Five
126
H5.1 B: All else equal, a higher proportion of stock owned by blockholders will
reduce the amount of dividends paid.
2- Institutional Investors
H5.2 A: All else equal, there will be a negative relation between institutional
investors’ ownership and the probability the firm will pay dividends.
H5.2 B: All else equal, the percentage ownership by institutional investors has a
negative impact on the amount of dividends paid.
5.5.6 Dividend and Retained Earnings
De Angelo et al., (2006) state that mature, established firms will have a large ratio of
retained earnings to total equity (and total assets), and further emphasise that the
ratio of retained earnings will be a good proxy for the life stage of the firm. In the
early stage of the firm’s life, the firm will have a small cumulative profit, and will
accumulate cash flow to finance growth opportunities since the costs (e.g. agency
costs) of retained cash flow will be lower than the costs of the external sources of
finance (e.g. flotation costs and asymmetric information). On the other hand, mature
firms will have a large cumulative profit and therefore tend to pay dividends because
they have the ability to generate cash flow that is sufficient for paying dividends and
financing the growth opportunities of the firm.
As shown by De Angelo et al., (2006), Denis and Osobov (2008), Ferris et al.,
(2008), Eije and Megginson (2008) and Brockman and Unlu (2009), it is expected
that a positive relationship will be found between earned/contribute capital and
dividends. Notably, the proportion of retained earnings to total equity will be used as
a proxy to measure the Lifecycle Effect. For a robustness check, the retained
earnings to total assets will be used.
H6 A: All else equal, there is a positive relation between retained earnings and the
probability of the firm to pay dividends, and this will test the Lifecycle Theory.
H6 B: All else equal, there is a positive impact of retained earnings on the amount
of dividends paid, and this will test the Lifecycle Theory.

Chapter Five
127
5.5.7 Measuring the Dividends Payments Variable
In this study, two main proxies are implemented for the firm’s dividend policy; the
amount of dividends and the likelihood of paying dividends.
The first proxy is the total amount of dividends in year t divided by net income in the
same year23; this proxy will measure the amount of dividends paid to the
shareholders. Following Barclay (2008) and Moh’d et al., (1995), the dividend
payout will be as follows:
8?�?{�z{ �V�D@ ��B{z?z 8?zB ��Dz@ �~ {?�?{�z{���B{z?z 8?zB ��Dz@ �~ z�@ ?z����
The second proxy will measure the firm’s likelihood to pay dividends; thus, the
dependent variable will take a value of 1 if the firm pays dividends in year t and a
value of 0 if the firm does not pay dividends in year t 24 (see Ferris et al., 2006; Eije
and Megginson, 2008; Li and Zhao, 2008).
5.6 DESCRIPTIVE STATISTICS FOR DETERMINANTS OF DIVIDEND
POLICY IN JORDAN
Table 5.1 shows the descriptive statistics of the dividend policy over the sample
period. The Table shows that, when considering the percentage of the firms that pay
dividends, the range is between 38% and 52%, with the percentage of firms paying
dividends increasing from 40% in 2000 to 52% in 2004, before subsequently
declining to 38% in 2008.
For example, Fama and French (2001) find that the number of firms paying
dividends in the US declined to less than 21% in 1999 compared to 66.5% in 1978.
Denis and Osobov (2008) further state that the proportion of firms paying dividends
declined over time in Canada, France, Germany, Japan, the UK and the US for the
23 The Jordanian Companies Law No. 22 of 1997 And its amendments article 186 paragraph A mentioned that
‘The Public Shareholding Company may not distribute any dividends to its shareholders except from its
profits,and after settling the rotated losses of the previous years.’ Therefore, no negative observations will exist
if we use the ratio of dividends to net income as a measure of the amount of dividends. 24 Firm year observations with zero dividends will take a value of zero.
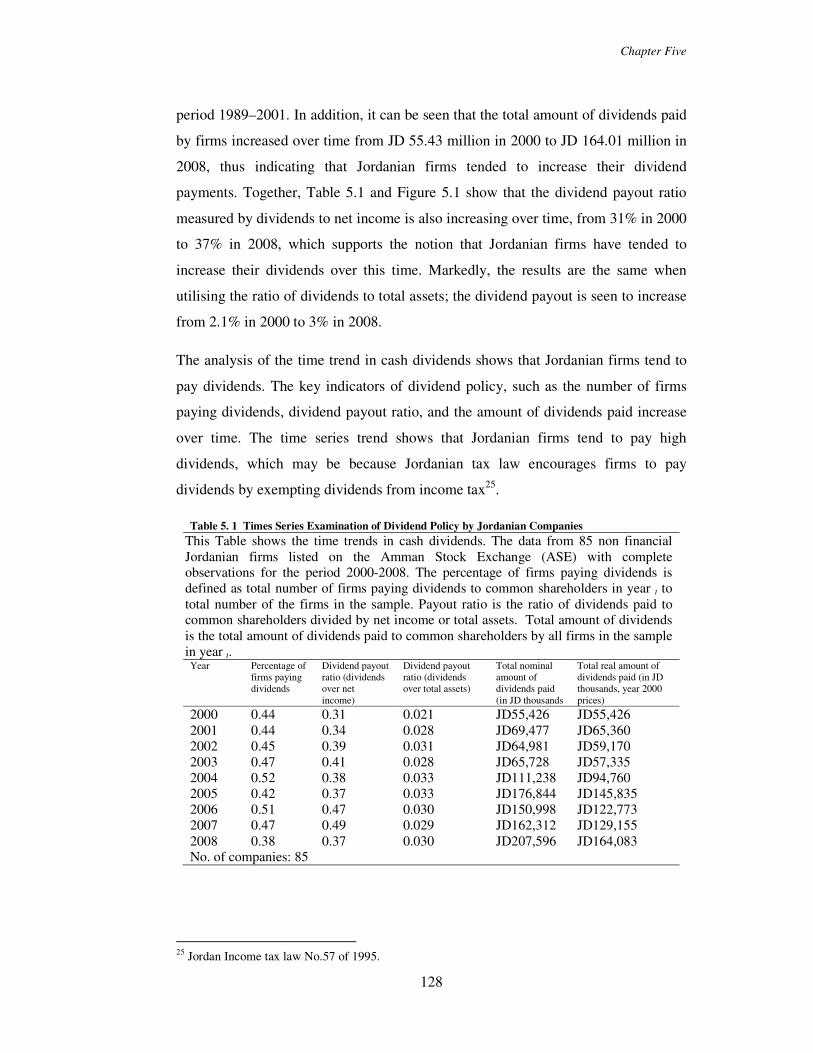
Chapter Five
128
period 1989–2001. In addition, it can be seen that the total amount of dividends paid
by firms increased over time from JD 55.43 million in 2000 to JD 164.01 million in
2008, thus indicating that Jordanian firms tended to increase their dividend
payments. Together, Table 5.1 and Figure 5.1 show that the dividend payout ratio
measured by dividends to net income is also increasing over time, from 31% in 2000
to 37% in 2008, which supports the notion that Jordanian firms have tended to
increase their dividends over this time. Markedly, the results are the same when
utilising the ratio of dividends to total assets; the dividend payout is seen to increase
from 2.1% in 2000 to 3% in 2008.
The analysis of the time trend in cash dividends shows that Jordanian firms tend to
pay dividends. The key indicators of dividend policy, such as the number of firms
paying dividends, dividend payout ratio, and the amount of dividends paid increase
over time. The time series trend shows that Jordanian firms tend to pay high
dividends, which may be because Jordanian tax law encourages firms to pay
dividends by exempting dividends from income tax25.
Table 5. 1 Times Series Examination of Dividend Policy by Jordanian Companies
This Table shows the time trends in cash dividends. The data from 85 non financial Jordanian firms listed on the Amman Stock Exchange (ASE) with complete observations for the period 2000-2008. The percentage of firms paying dividends is defined as total number of firms paying dividends to common shareholders in year t to total number of the firms in the sample. Payout ratio is the ratio of dividends paid to common shareholders divided by net income or total assets. Total amount of dividends is the total amount of dividends paid to common shareholders by all firms in the sample in year t. Year Percentage of
firms paying dividends
Dividend payout ratio (dividends over net income)
Dividend payout ratio (dividends over total assets)
Total nominal amount of dividends paid (in JD thousands
Total real amount of dividends paid (in JD thousands, year 2000 prices)
2000 0.44 0.31 0.021 JD55,426 JD55,426 2001 0.44 0.34 0.028 JD69,477 JD65,360 2002 0.45 0.39 0.031 JD64,981 JD59,170 2003 0.47 0.41 0.028 JD65,728 JD57,335 2004 0.52 0.38 0.033 JD111,238 JD94,760 2005 0.42 0.37 0.033 JD176,844 JD145,835 2006 0.51 0.47 0.030 JD150,998 JD122,773 2007 0.47 0.49 0.029 JD162,312 JD129,155 2008 0.38 0.37 0.030 JD207,596 JD164,083 No. of companies: 85
25 Jordan Income tax law No.57 of 1995.
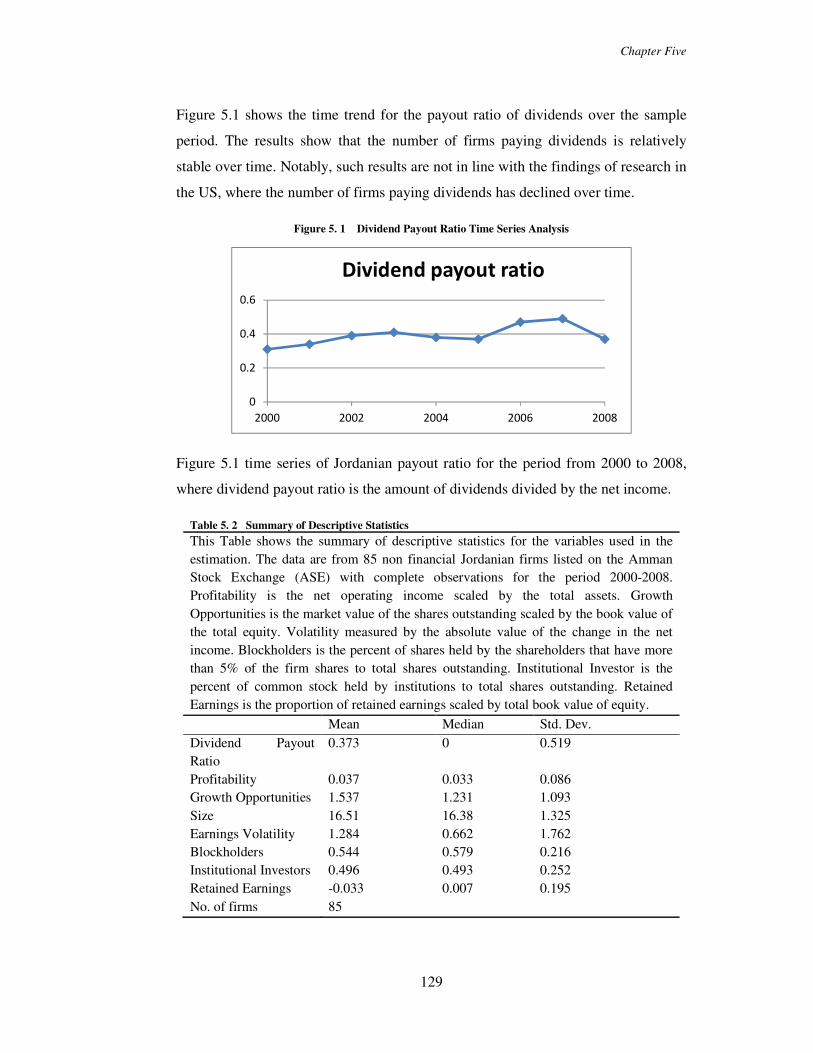
Chapter Five
129
Figure 5.1 shows the time trend for the payout ratio of dividends over the sample
period. The results show that the number of firms paying dividends is relatively
stable over time. Notably, such results are not in line with the findings of research in
the US, where the number of firms paying dividends has declined over time.
Figure 5. 1 Dividend Payout Ratio Time Series Analysis
Figure 5.1 time series of Jordanian payout ratio for the period from 2000 to 2008,
where dividend payout ratio is the amount of dividends divided by the net income.
Table 5. 2 Summary of Descriptive Statistics
This Table shows the summary of descriptive statistics for the variables used in the
estimation. The data are from 85 non financial Jordanian firms listed on the Amman Stock Exchange (ASE) with complete observations for the period 2000-2008.
Profitability is the net operating income scaled by the total assets. Growth
Opportunities is the market value of the shares outstanding scaled by the book value of the total equity. Volatility measured by the absolute value of the change in the net
income. Blockholders is the percent of shares held by the shareholders that have more
than 5% of the firm shares to total shares outstanding. Institutional Investor is the
percent of common stock held by institutions to total shares outstanding. Retained
Earnings is the proportion of retained earnings scaled by total book value of equity.
Mean Median Std. Dev.
Dividend Payout
Ratio
0.373 0 0.519
Profitability 0.037 0.033 0.086 Growth Opportunities 1.537 1.231 1.093
Size 16.51 16.38 1.325
Earnings Volatility 1.284 0.662 1.762 Blockholders 0.544 0.579 0.216
Institutional Investors 0.496 0.493 0.252
Retained Earnings -0.033 0.007 0.195
No. of firms 85
0
0.2
0.4
0.6
2000 2002 2004 2006 2008
Dividend payout ratio

Chapter Five
130
Table 5.3 shows the correlation between the variables in the study. The payout ratio
has a positive correlation with profitability, implying that when firm profitability
increases, dividends increase as well, so firms with high profitability are more able
to pay dividends from internal sources of funds. Furthermore, firm size is positively
related to the payout ratio, owing to the fact that large firms may have better access
to the external market and are therefore not as reliant on internal funds. Furthermore,
there is a positive relation between payout ratio and institutional investors, which
shows that institutional investors prefer to invest in firms that pay dividends,
because dividends are an indicator of the financial health of the firm. In addition,
there is a positive relationship between payout ratio and retained earnings, which
suggests that firms with a large amount of retained earnings are more able to pay
dividends, which supports the Lifecycle Theory. On the other hand, the payout ratio
is negatively correlated with volatility because firms with net income volatility
prefer not to pay dividends as it is difficult for them to maintain the payment of
dividends in the future, and they will be less able to raise funds from external
sources of finance.
Table 5. 3 Pairwise Correlation Coefficients among Variables
This table presents the Pearson correlation coefficients between variables used in the regression estimation. The data from 85 non financial Jordanian firms listed on the Amman Stock Exchange (ASE) with complete observations for the period 2000-2008. Payout ratio is the amount of paid dividends to net income. Profitability is the net operating income scaled by the total assets. Growth Opportunities is the market value of the shares outstanding scaled by the book value of the total equity. Volatility is measured by the absolute value of the change in the net income. Blockholders is the percent of shares held by shareholders that have more than 5% of the firm shares to total shares outstanding. Institutional Investor is the percent of common stock held by institutions to total shares outstanding. Retained Earnings is the proportion of retained earnings scaled by total book value of equity. Payout
Ratio Profitability Growth
Opportunities Size Earnings
Volatility
Blockholders Institutional Investors
Profitability 0.302* Growth Opportunities
0.126* 0.260*
Size 0.124* 0.295* 0.174* Earnings Volatility
-0.121* -0.147* -0.046 -0.026
Blockholders -0.08* -0.030 0.121* -0.132* 0.091* Institutional Investors
0.045 0.113* 0.092* 0.194* 0.021 0.436*
Retained Earnings
0.160* 0.360* -0.277* 0.280* -0.046 -0.096* 0.032
* Indicate significance at 0.05.

Chapter Five
131
Table 5.4 shows the mean and the median for the variables by classifying firms into
dividend-paying and non-dividend-paying. Tests for a difference in mean and
difference in median (Wilcoxon) between dividend-payers and non-payers are
significant at the 1% level for all variables.
The following results show the different characteristics between dividend-payers
and non-payers. First, the descriptive statistics shows that the profitability of
dividend-payers is higher than that of the non-payers: The difference is 8% in
favour of dividend-paying firms, which suggests that more profitable firms pay
more dividends. Second, the growth opportunities variable shows that dividend-
paying firms have a higher mean and median than non-dividend-paying firms,
which is not consistent with the view that firms with high-growth opportunities are
less likely to pay dividends. Third, dividend-payers are larger than non-payers.
Fourth, the mean and median of earnings volatility is higher for non-payers than
dividend-payers. The difference in mean is 0.53, which suggests that firms with a
high fluctuation in earnings tend not to pay dividends because it is difficult for
them to maintain paying dividends in the future. Fifth, dividend-payers have fewer
shares owned by blockholders. The difference in mean is 4.7%, which highlights
that blockholder investors are a good substitute for dividends in reducing agency
costs. Sixth, dividend-payers are larger than non-payers in terms of institutional
investors, suggesting that institutional investors prefer to invest in firms that pay
dividends, or otherwise that the institutional investors drive the firm to pay
dividends. Seventh, dividend-payers have a higher mean and median of retained
earnings than non-payers, which is in line with Lifecycle Theory, and suggests that
firms with a large amount of retained earnings tend to pay dividends because they
have fewer growth opportunities and more internal cash flow to pay dividends.
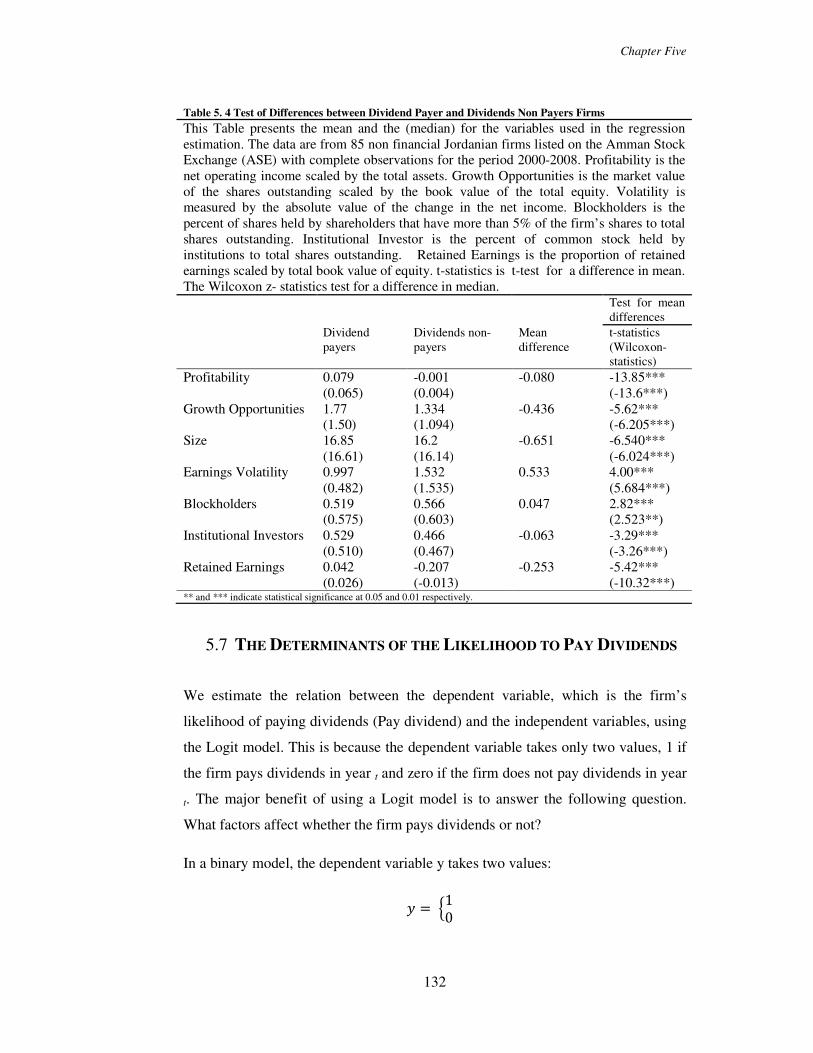
Chapter Five
132
Table 5. 4 Test of Differences between Dividend Payer and Dividends Non Payers Firms
This Table presents the mean and the (median) for the variables used in the regression estimation. The data are from 85 non financial Jordanian firms listed on the Amman Stock Exchange (ASE) with complete observations for the period 2000-2008. Profitability is the net operating income scaled by the total assets. Growth Opportunities is the market value of the shares outstanding scaled by the book value of the total equity. Volatility is measured by the absolute value of the change in the net income. Blockholders is the percent of shares held by shareholders that have more than 5% of the firm’s shares to total shares outstanding. Institutional Investor is the percent of common stock held by institutions to total shares outstanding. Retained Earnings is the proportion of retained earnings scaled by total book value of equity. t-statistics is t-test for a difference in mean. The Wilcoxon z- statistics test for a difference in median. Test for mean
differences
Dividend payers
Dividends non-payers
Mean difference
t-statistics (Wilcoxon-statistics)
Profitability 0.079 (0.065)
-0.001 (0.004)
-0.080 -13.85*** (-13.6***)
Growth Opportunities 1.77 (1.50)
1.334 (1.094)
-0.436 -5.62*** (-6.205***)
Size 16.85 (16.61)
16.2 (16.14)
-0.651 -6.540*** (-6.024***)
Earnings Volatility 0.997 (0.482)
1.532 (1.535)
0.533 4.00*** (5.684***)
Blockholders 0.519 (0.575)
0.566 (0.603)
0.047 2.82*** (2.523**)
Institutional Investors 0.529 (0.510)
0.466 (0.467)
-0.063 -3.29*** (-3.26***)
Retained Earnings 0.042 (0.026)
-0.207 (-0.013)
-0.253 -5.42*** (-10.32***)
** and *** indicate statistical significance at 0.05 and 0.01 respectively.
5.7 THE DETERMINANTS OF THE LIKELIHOOD TO PAY DIVIDENDS
We estimate the relation between the dependent variable, which is the firm’s
likelihood of paying dividends (Pay dividend) and the independent variables, using
the Logit model. This is because the dependent variable takes only two values, 1 if
the firm pays dividends in year t and zero if the firm does not pay dividends in year
t. The major benefit of using a Logit model is to answer the following question.
What factors affect whether the firm pays dividends or not?
In a binary model, the dependent variable y takes two values:
V �10�

Chapter Five
133
When y=1 the probability of occurrence for the dependent variables y is pi, whereas
the alternative outcome that the probability of y will not occur is 1- pi.
If the probability of occurrence pi depends on a function of independent variable
x �β, where x is a K x 1 vector of independent variables which influence y, and β is
the vector of coefficients associated with the independent variables x. Thus, the
conditional probability for the regression of binary outcome model is:
O� 9L� 1|X�N FLx�β′N The Logit model is used to compute the functional form of the cumulative
distribution function FLx�β′N. 5.7.1 The Logistic Model
The functional form of the FLx�β′N under the Logit model is known as the
cumulative logistic distribution, and has the form of
O� 9L�?@ 1|X��N FL ��� N ��� ��L ��� �N eq.5.1
To ease the computation, we can write the above equation in the following form
O� ��� ����� � ���� �
�� � ��� � eq. 5.2
Where Ρi is the probability that y =1, then the probability of not paying dividends is
(1- Ρi), So,
1 � O� 11 � e��� � . Thus O�1 � O� 1 � e��� � 1 � e���� � e��� �
Here |��� |� is the odds ratio in favour of paying dividends, it measures the
probability of the firm to pay dividends relative to the probability that it will not
pay dividends. If we take the natural log of this ratio, we obtain
L� ln 0 O�1 � O�2 ���

Chapter Five
134
The left hand side of the equation can vary between minus and plus infinity as O� varies between zero and one. The coefficient on the independent variables
(contained in X) represents a change in the log-odds of paying dividends for one
unit change in the underlying variable.
5.8 MODEL DESIGN
In section 5.9, we present the Logit model, and we show that the relationship
between the dependent and the independent variable will be as follows:
V��; ′ ��� � D?@ �<. 5.3 ? 1,2, ….,n and t = 1,2 …. T
Where V* is an unobserved variable, Xit is a set of explanatory variables which
influence V*, and D is the residual. The decision to pay dividends takes the value 1
and not paying takes the value 0. Although V* is not observed, we observe y
(Goergen et al., 2005):
y = 0 if V* = 0,if the firm does not pay dividends in year t y = 1 if V* > 0, if the firms pay dividends in year t To be consistent with a large body of dividend policy literature (See, Fama and
French, 2001; DeAngelo et al., 2006; Denis and Osobov (2008), Hoberg and
Parbhala, 2009; and Brockman and Unlu (2009); Coulton and Ruddock, 2011,
Desai and Jin, 2011), we estimate a Logit regression using Fama and Macbeth
(1973) statistical methodology. This methodology “is convenient and conservative
way to account for potential cross-correlation in residual” (see Desai and Jin,
2011). According to the Fama and Macbeth statistical methodology, we calculate
the coefficient of the independent variable by running the regression for each year
separately and take the average of the coefficients for all years, and the t-statistics
are calculated as the average coefficient divided by its standard error (i.e. “the time-
series standard deviation of the regression coefficient divided by the square root of
the number of years in the period”) - “time-series averages of the coefficient are
used to draw inference, using the time-series standard errors of the average
slopes”, Desai and Jin, 2011.
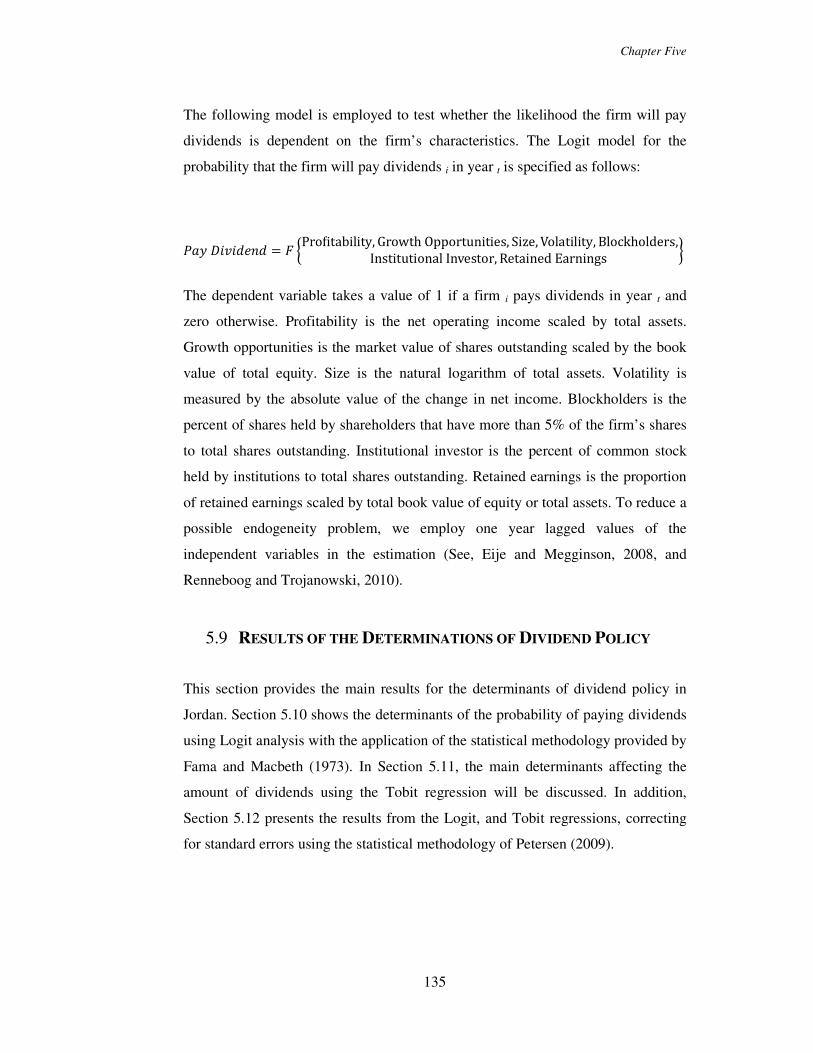
Chapter Five
135
The following model is employed to test whether the likelihood the firm will pay
dividends is dependent on the firm’s characteristics. The Logit model for the
probability that the firm will pay dividends i in year t is specified as follows:
OV 8?�?{�z{ 6 �Profitability, Growth Opportunities, Size, Volatility, Blockholders,Institutional Investor, Retained Earnings « The dependent variable takes a value of 1 if a firm i pays dividends in year t and
zero otherwise. Profitability is the net operating income scaled by total assets.
Growth opportunities is the market value of shares outstanding scaled by the book
value of total equity. Size is the natural logarithm of total assets. Volatility is
measured by the absolute value of the change in net income. Blockholders is the
percent of shares held by shareholders that have more than 5% of the firm’s shares
to total shares outstanding. Institutional investor is the percent of common stock
held by institutions to total shares outstanding. Retained earnings is the proportion
of retained earnings scaled by total book value of equity or total assets. To reduce a
possible endogeneity problem, we employ one year lagged values of the
independent variables in the estimation (See, Eije and Megginson, 2008, and
Renneboog and Trojanowski, 2010).
5.9 RESULTS OF THE DETERMINATIONS OF DIVIDEND POLICY
This section provides the main results for the determinants of dividend policy in
Jordan. Section 5.10 shows the determinants of the probability of paying dividends
using Logit analysis with the application of the statistical methodology provided by
Fama and Macbeth (1973). In Section 5.11, the main determinants affecting the
amount of dividends using the Tobit regression will be discussed. In addition,
Section 5.12 presents the results from the Logit, and Tobit regressions, correcting
for standard errors using the statistical methodology of Petersen (2009).
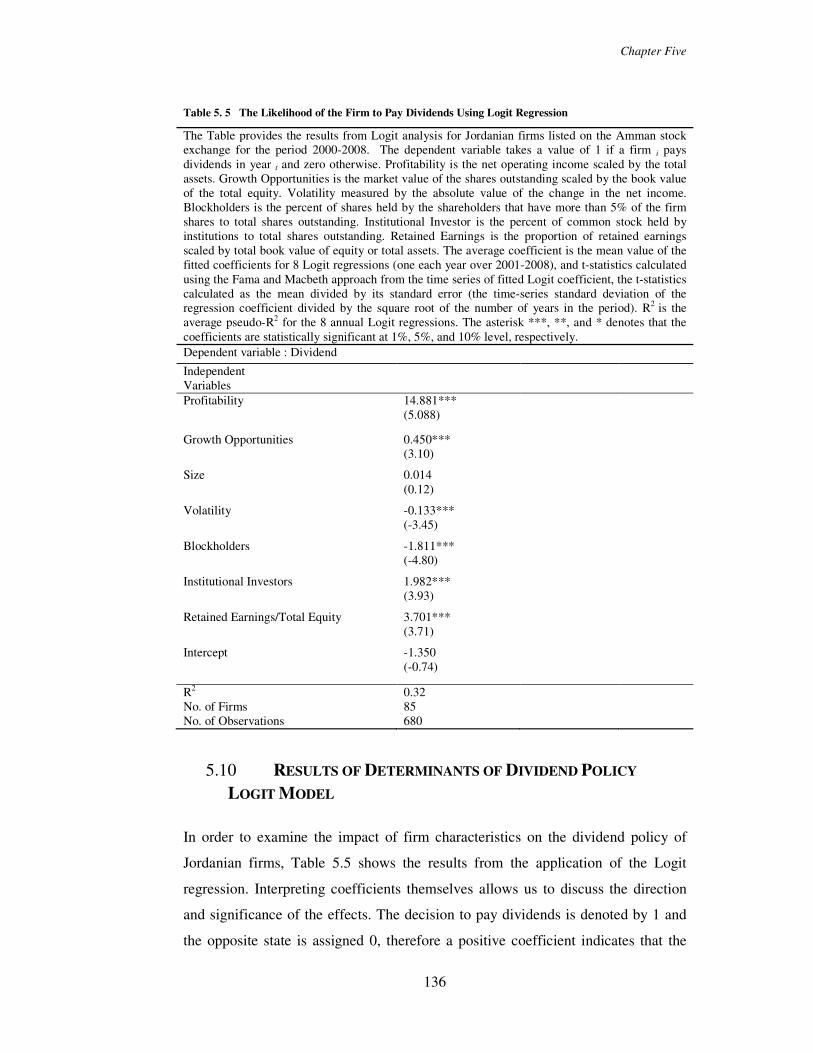
Chapter Five
136
Table 5. 5 The Likelihood of the Firm to Pay Dividends Using Logit Regression
The Table provides the results from Logit analysis for Jordanian firms listed on the Amman stock exchange for the period 2000-2008. The dependent variable takes a value of 1 if a firm i pays dividends in year t and zero otherwise. Profitability is the net operating income scaled by the total assets. Growth Opportunities is the market value of the shares outstanding scaled by the book value of the total equity. Volatility measured by the absolute value of the change in the net income. Blockholders is the percent of shares held by the shareholders that have more than 5% of the firm shares to total shares outstanding. Institutional Investor is the percent of common stock held by institutions to total shares outstanding. Retained Earnings is the proportion of retained earnings scaled by total book value of equity or total assets. The average coefficient is the mean value of the fitted coefficients for 8 Logit regressions (one each year over 2001-2008), and t-statistics calculated using the Fama and Macbeth approach from the time series of fitted Logit coefficient, the t-statistics calculated as the mean divided by its standard error (the time-series standard deviation of the regression coefficient divided by the square root of the number of years in the period). R2 is the average pseudo-R2 for the 8 annual Logit regressions. The asterisk ***, **, and * denotes that the coefficients are statistically significant at 1%, 5%, and 10% level, respectively. Dependent variable : Dividend
Independent Variables
Profitability 14.881*** (5.088)
Growth Opportunities 0.450*** (3.10)
Size 0.014 (0.12)
Volatility -0.133*** (-3.45)
Blockholders -1.811*** (-4.80)
Institutional Investors 1.982*** (3.93)
Retained Earnings/Total Equity 3.701*** (3.71)
Intercept -1.350 (-0.74)
R2 0.32 No. of Firms No. of Observations
85 680
5.10 RESULTS OF DETERMINANTS OF DIVIDEND POLICY
LOGIT MODEL
In order to examine the impact of firm characteristics on the dividend policy of
Jordanian firms, Table 5.5 shows the results from the application of the Logit
regression. Interpreting coefficients themselves allows us to discuss the direction
and significance of the effects. The decision to pay dividends is denoted by 1 and
the opposite state is assigned 0, therefore a positive coefficient indicates that the
Chapter Five
137
independent variable is positively correlated with the firm’s decision to pay a
dividend, and a negative coefficient indicates that the independent variable is
negatively correlated with the firm’s decision to pay a dividend.
5.10.1 Results of Dividend Policy and Profitability
Table 5.5 shows that the firm’s propensity to pay dividends is positively related to
firm profitability, and is statistically significant at a 1% level. The results suggest
that firms with a high profitability will tend to pay dividends. Importantly, such
results are consistent with the free cash flow hypothesis, which suggests that
profitable firms tend to pay dividends in order to reduce the cash flow under the
control of the managers. Importantly, the results are also consistent with the
hypothesis that firms with high profitability have better access to low-cost external
sources of funds; hence, they are more likely to pay dividends than less profitable
firms. Similar results are found by Fama and French (2001), DeAngelo, DeAngelo
and Stulz (2006), and Eije and Megginson (2008).
5.10.2 Results of Dividend Policy and Growth Opportunities
The results in Table 5.5 show that shareholders are more likely to receive dividends
from firms that have high growth opportunities; however, the results are
inconsistent with expectations that assume that the growth opportunities variable
has a negative impact on the firm’s dividend policy.
The results are inconsistent with the findings of Fama and French (2001), but
consistent with Aivazian, Booth and Cleary (2003a), who emphasise a positive
relationship between dividends and growth opportunities in a sample of developing
countries. They argue that the market-to-book value may be indicative of a higher
cash flow ratio resulting from the present value of existing investment
opportunities, and might reflect the current performance of the firm. Naceur et al.,
(2006) also point out the positive results for a sample from Tunisia. Chay and Suh
(2009) state that investment opportunities do not affect dividend policy in
Australia, Canada and Japan; however, the results may be inconclusive owing to

Chapter Five
138
the robustness regression, which shows that growth opportunities are not
significant at a 5% level.
5.10.3 Results of Dividend Policy and Size
As can be seen in Table 5.5, there is no evidence to support the firm propensity to
pay dividends being related to firm size. The coefficient on firm size is positive but
not significant; therefore, it would appear that our results do not support the
hypothesis that shareholders in large firms use dividends to reduce the agency cost
of free cash flow, and force the firm’s management to use external sources of
funds.
The results are consistent with pecking order theory, where all sizes of firms prefer
to use internal rather than external sources of finance. The results are inconsistent
with the findings of Fama and French (2001), but consistent with Aivazian, et al.,
(2003a), who state that there is no relationship between dividend policy and firm
size in some developing countries.
5.10.4 Results of Dividend Policy and Earnings Volatility
Table 5.5 shows that the probability of paying dividends is negatively related to
earnings volatility. The coefficient on earnings volatility is negative and
statistically significant at a 1% level. The result supports the signalling model
because it is difficult for the firm to maintain dividends when earnings decline,
since if the firm stops paying dividends, the value of the firm will suffer. This is
supported by the fact that Jordanian firms are not allowed to pay dividends during
years of losses because Jordanian Companies Law prevents firms from paying any
dividends if they have net losses at the end of the year. The results also support the
argument that firms with fluctuating earnings are more financially constrained and
also tend to accumulate cash flow through retained earnings in order to reduce the
need for costly external cash. The results are consistent with findings of Eije and
Megginson (2008) and Chay and Suh (2009) for developed countries. In addition,
Aivazian, Booth and Cleary (2003a) find similar results for some developing
countries.
Chapter Five
139
5.10.5 Results of Dividend Policy and Blockholders Ownership
As we can see in Table 5.5, the probability the firm will pay dividends is negatively
related to the amount of shares owned by blockholders. The results are consistent
with expectation, and are significant at a 1% level, which suggests that firms with a
large amount of shares owned by blockholders are less likely to pay dividends. The
result also supports the agency cost theory, which stipulates that firms with close-
monitoring shareholders use internal cash flow more than external cash.
The results also imply that blockholders are a good substitute for dividends in
reducing the agency cost of management, providing close monitoring of
management’s performance. If we take into account that Jordan is one of the
developing countries where shareholders may not be fully protected by law, the
results then support that low protection of shareholders’ rights encourages firms
with a low number of blockholders to pay dividends (i.e. firms that may suffer
from agency costs because of weak monitoring by shareholders). This is consistent
with the findings of Khan (2006) and Renneboog and Trojanowski (2010).
5.10.6 Results of Dividend Policy and Institutional Investors
As shown in Table 5.5, the likelihood of dividend payments is positively related to
the institutional investor variable. The coefficient of the institutional investor
variable is positive and statistically significant from zero at a 1% level. This is not
consistent with the expectation that institutional investors decrease the probability
that the firm will pay dividends. While the tax preferences model predicts a
positive relation between dividend payment and institutional investors, the results
cannot be explained in the context of tax preferences as dividends in Jordan are tax-
exempt for all shareholders. However, the results are nevertheless consistent with
Grinstein and Michaely (2005), who state that institutional investors prefer to
invest in dividend-paying firms rather than non-paying firms owing to the prudent-
man rule. Importantly, this confirms the results of Del Guercio (1996), who finds
that investment managers in banks tend to invest in firms that pay dividend
‘prudent stocks’ because dividends can be considered as one of the characteristics
of a high-quality investment. It would appear that the institutional clienteles effect

Chapter Five
140
may go some way towards explaining the positive impact of institutional investors
on the probability of paying dividends, where institutional investors prefer to invest
in firms that pay dividends because they assume that this is one of the attributes of
high-quality investments. Jordan is a developing country where finding financial
advisors and financial analysts is not easy and likely to be costly, so managers
prefer to use simple indicators (i.e. dividend paying firms) to support their
investment decision. Institutional investors act as short term investors rather than
owners of the company, and consequently are looking for current income rather
than future earnings. Hence, they prefer to have dividends rather than wait until the
firm reinvest the retained earnings in profitable investment opportunities.
5.10.7 Results of Dividend Policy and Retained Earnings
As shown in Table 5.5, the likelihood of dividend payments is positively and
significantly related to retained earnings, as expected. This strongly supports the
Lifecycle Theory, which postulates that firms with a high level of retained earnings
are more likely to pay dividends. The financial age26 of the firm, as measured by
the earned versus contributed capital of the firms, strongly explains the probability
of paying dividends. The results are consistent with the findings of De Angelo et
al., (2006), Denis and Osobov (2008), and Chay and Suh (2009). The results also
are qualitatively similar when estimating the regression using the ratio of retained
earnings to total assets as a measure of Lifecycle Theory; this proxy measures the
amount of assets funded by the retained earnings.27
5.11 RESULTS OF THE DETERMINANTS OF THE AMOUNT OF
DIVIDENDS (TOBIT REGRESSION)
We now turn to estimating the impact of firm characteristics on the amount of
dividends paid. In Jordan, many firms do not pay dividends so the value of the
dependent variable would be zero, and using Ordinary Least-Squares (OLS)
regression will give inconsistent results owing to the sample containing many
observations with zero values. A sample in which information on the dependent
variable is available for some observations is known as censored sample (see
Cameron, 2009, p. 521). In this study many observations of the dependent variable
26 This term used for the first time by Eije and Megginson(2008) 27 Results not reported.

Chapter Five
141
are zero or positive, so the data are censored in the lower tail of the distribution
(left side). The pooled Tobit model is as follows for the amount of dividends paid:
V��; � W��, � ��� Where the observed variable yit is related to latent variable y* through the observation
rule
V �V; ?~ V; � 00 ?~ V; ¬ 0� The following model is employed to test the impact of the firm attributes on the
amount of dividends. The Tobit model for the amount that the firm pays in
dividends i in year t is specified as follows:
8?�?{�z{ P@?� 6 �Profitability, Growth Opportunities, Size, Volatility, Blockholders,Institutional Investor, Retained Earnings « The dependent variable is the dividend payout ratio and is calculated by the amount
of dividends divided by the net income for firm i in year t. Profitability is the net
operating income scaled by total assets. Growth Opportunities is the market value
of the shares outstanding scaled by the book value of total equity. Size is the
natural logarithm of total assets. Volatility is measured by the absolute value of the
change in net income. Blockholders is the percentage of shares held by the
shareholders that have more than 5% of the firm’s shares to total shares
outstanding. Institutional investor is the percentage of common stock held by
institutions to total shares outstanding. Retained Earnings is the proportion of
retained earnings scaled by total book value of equity or total assets. In order to
reduce an endogeneity problem, a one-year lagged value of all the independent
variables was used in the estimation (see Eije and Megginson, 2008; Renneboog
and Trojanowski, 2010).
The dependent variable in Table 5.6 is the dividend amount measured by the cash
dividend divided by net income. As we can see in Table 5.6, the results from the
determinants of the amount of dividend are qualitatively similar to those from the
determinants of the probability of dividend payment.

Chapter Five
142
The results support the notion that the profitability has a strong and significant
impact on the amount of dividends; second, the growth opportunities variable has a
positive and significant impact on the amount of dividends; third, the size of the
firm has a positive impact but is not statistically significant; fourth, earnings
volatility has a strong negative impact on the amount of dividends; fifth, the
amount of shares owned by blockholders has a negative and significant impact on
the amount of paid dividends; sixth, the results support that institutional investors
have a strong positive impact on the amount of dividends, and the results from
institutional investors also indicate that the institutional investor not only affects
the probability of the firm to pay dividends, as shown in the Logit analysis, but
also the amount of dividends paid. This positive impact of institutional investors is
not consistent with Grinstein and Michaely (2005), who argue that institutional
investors prefer fewer dividends.
Table 5. 6 Results of Dividend Policy Using Tobit Regression
The average coefficient is the mean value of the fitted coefficients for 8 Tobit regressions (one each year over 2001-2008), and t-statistics calculated using the Fama and Macbeth approach from the time series of fitted Tobit coefficient, the t-statistics calculated as the mean divided by its standard error (the time-series standard deviation of the regression coefficient divided by the square root of the number of years in the period). The asterisk ***, **, and * denotes that the coefficients are statistically significant at 1%, 5%, and 10% level, respectively. See Table 5.5 for Variables definition. Dependent variable : Dividend payout ratio
Independent variables
Profitability 3.93*** (5.79)
Growth Opportunities 0.06*** (2.42)
Size 0.012 (0.34)
Volatility -0.06*** (-3.7)
Blockholders -0.7*** (-5.53)
Institutional Investors 0.65*** (3.70)
Retained Earnings/Total Equity 1.58*** (4.47)
Intercept -0.199 (-0.32)
R2 0.21
No. of Firms No. of Observations
85 680

Chapter Five
143
5.12 RESULTS OF DIVIDENDS WITH CLUSTERED STANDARD
ERRORS
Since we use panel data, Petersen (2009) point out that the Fama-MacBeth standard
errors may understate the standard errors when the panel data contains a firm effect
and year effect. “Petersen (2009) approach correctly adjusts the standard errors to
account for both time and firm dependence.” (See Rubin and Smith, 2009). So, for
a robustness check we estimate the Logit and Tobit models with clustered standard
errors by both firm and year, which are robust to within firm and within time
correlation. This is called the two dimensional clustered standard errors (i.e.
standard errors that are clustered by firm and year). Many recent researchers in
dividend policy use two dimensions standard errors, such as Denis and Osobov
(2008), Ferris et al., (2009b), and Rubin and Smith (2009).
5.12.1 Results of Dividend Policy (Logit Model with Clustered Standard
Error)
Table 5. 7 Results for the Logit Model with Clustered Standard Errors
The likelihood of the firm to pay dividends using Logit regression with clustered standard errors. The asterisk ***, **, and * denotes that the coefficients are statistically significant at 1%, 5%, and 10% level, respectively. See table 5.5 for Variables definition. Dependent variable : Dividends
Independent Variables
Profitability 13.942*** (4.12)
Growth Opportunities 0.254* (1.76)
Size 0.049 (0.34)
Volatility -0.122** (-2.08)
Blockholders -1.600*** (-2.63)
Institutional investors 1.630*** (2.76)
Retained Earnings/ Total Equity 2.670*** (2.63)
Intercept -1.620 (-0.68)
No. of Firms No. of Observation
85 680

Chapter Five
144
Table 5.7 shows the regression results from a Logit analysis with clustered standard
errors, the results of which are qualitatively similar to those from the Logit
regression using the statistical method provided by Fama and Macbeth (1973).
However, the results show that the growth opportunities variable is significant at a
10% level.
5.12.2 Results of Dividend Policy (Tobit Model with Clustered Standard
Errors)
Table 5.8 shows the regression results from the Tobit analysis with two-
dimensional clustered standard errors corrected for both time and firms
dependences; the results are qualitatively similar to those of the Tobit regression
utilising the Fama and Macbeth (1973) statistical methodology. However, the
growth opportunities coefficient shows no statistically significant impact on the
amount of dividends paid.
Table 5. 8 Results of Dividend Policy with the Tobit Regression Using Clustered Standard
Errors
The asterisk ***, **, and * denotes that the coefficients are statistically significant at 1%, 5%, and 10% level, respectively. See Table 5.5 for Variables definition. Dependent variable : Dividend payout ratio
Independent Variables
Profitability 2.930*** (3.87)
Growth Opportunities 0.050 (1.11)
Size -0.021 (-0.61)
Volatility -0.050*** (-2.62)
Blockholders -0.630*** (-3.97)
Institutional Investors 0.462** (2.04)
Retained Earnings/Total equity 1.770*** (3.51)
Intercept 0.340 (0.38)
No. of Firms No. of Observations
85 680

Chapter Five
145
• Fixed Effect Logit
For the fixed effect model, we control for any possible unobserved heterogeneity
by adding an individual-specific effect to equation 5.3
OB�F L� 1L�V{?�?{�z{NN e����� � 1 � e ����� �
Where � is the firm specific effect, this equation indicates that η� and β are
unknown parameters of the model. In finite T the number of parameters � increases with N, in case of panel data, � cannot be consistently estimated, this is
known as the incidental parameters problem. For estimation of a binary variable in
panel data with non linear regression, Chamberlain (1980) suggests maximizing the
conditional likelihood function:
A¯ °OB'�w� ±���, ���, … . . ��³� ´µ���³�
�w��
For the Logit model, he showed that ∑ ���³��w� is a minimum sufficient statistic
for �. Thus, by conditioning on ∑ ������w� we can sweep away the �28. To test for
individual fixed effects, the Hausman test could be used based on the difference
between Chamberlain’s conditional maximum likelihood model and the usual Logit
maximum likelihood. Usual Logit maximum likelihood is consistent and efficient
only under the null of no individual specific effect and inconsistent under the
alternative. Chamberlain’s conditional maximum likelihood model is consistent
whether the null is true or not, but not inefficient under the null (see Baltagi, 2005:
page 211).29
In order to test for firm specific effects one can use a Hausman-type test based on
the difference between fixed effect Logit and usual Logit model30 . The Hausman
test statistics χ2 (12.89) is not significant p-value (0.08) so the null that the
intercepts are homogeneous is not rejected.
In addition, there are some problems that should be addressed when using fixed-
effect Logit:
28 “For nonlinear panel data model, it is not possible to get rid of the � by taking differences or performing the Within transformation” Baltagi, 2005: page 234. 29 Note that we lost 36% of our sample (30 firms out of 85).

Chapter Five
146
1- The research question in this chapter is what are the determinants of dividend
policy in Jordan? However, in fixed effect Logit estimation including firms fixed
effects would reduce the sample size as it will drop all firms that pay dividends and
do not pay dividends for all periods, since these firms will not contribute to the
conditional likelihood. This would mean deleting a large amount of available
information since more than 36% of the firms would drop out, and consequently
we could not generalise the research findings. In addition, limiting the sample of
firms that change their dividend policy would produce a biased sample. Kim and
Maddala, 1992 argue that excluding firms that do not pay dividends may create a
biased sample. Deshmukh (2003, p 353) states that “if firms find it optimal to not
pay dividends, then their exclusion from any empirical analysis may create a
selection bias in the sample, resulting in biased and inconsistent estimates of the
underlying parameters. In such cases, generalizations about corporate dividend
policy may be inappropriate”. The same thing will occur if we exclude firms that
pay dividends all the time. This will create a biased sample because those firms
may find that their optimal dividend policy is to pay dividends all the time. This
study investigate the main determinants of dividend policy, and this should include
firms that pay dividends and do not pay dividends all the time, as well as those
firms that change their dividend policy31.
In most similar studies, the main aim is to examine the main determinants of
dividend policy. Hence, there is enough evidence that excluding the data or the
number of firms from the sample cannot help to identify an appropriate answer to
the above question. Furthermore, excluding these firms from the proposed
estimation will prevent a comparison with similar previous studies. One of the
main objectives in this study is to test the Life Cycle Theory. This theory implies
that firms with high retained earnings to total equity tend to pay dividends more
than firms with low retained earnings to total equity. DeAngelo et al., (2006) find
that “the proportion of firms that pay dividends is high when the ratio of the earned
to total common equity is high and falls with decline in this ratio, reaching near-
zero levels for firms with negligible retained earnings”. In their regression, they
31 It is notable that it is very rare to use a fixed-effect Logit model in dividend policy studies.
Chapter Five
147
build their results using data from all firms without excluding any firm32. So, if we
drop firms that never paid dividends or paid dividends all the time, we will not be
able to test the life cycle theory correctly because we will exclude these firms. we
find that the common factor among the majority of the excluded firms is the
retained equity ratio, 26 firms are excluded with consistently positive or negative
retained earnings. Therefore it is precisely the firms that are excluded that the life
cycle theory has been developed to explain their dividend behaviour. Moreover,
excluding these firms from our analysis would not help us to examine other
dividend policy theories such as the agency cost theory, since firms with high
profitability are more likely to pay dividends all the time to reduce the agency cost
of free cash flow.
Consequently, a sample bias from excluding these firms from our sample will lead
to an inappropriate test of dividend policy. Overall, all dividend policy theories
investigate the dividend behaviour of all the firms in the sample, because the aim is
to understand what the factors are that affect the firm’s dividend policy in Jordan.
If we want to test the theories and compare the results with findings of other
researchers, we need to include all the firms. In a similar study Denis and Osobov
(2008) use the Fama and MacBeth (1973) approach, and show that in the presence
of time effects or firm effects using the methodology of Petersen (2009) will be a
good robustness check. We follow their approach and apply this methodology.
2- Fixed effect Logit estimates use only within- individual differences, so if the
independent variable has little variation over time for each firm, then the fixed
effect estimator will not be very efficient and will have large standard errors (see,
Allison 2009). If the variation of the covariate is between variation rather than
within variation, Cameron and Trivedi (2009, p 607) state that “FE estimator will
not be very efficient because they rely on the within variation. Also fixed effect
parameter estimates may differ considerably from the other estimator if the within
and between variation tell different stories”. This study examines the impact of
ownership structure on dividend policy, the ownership structure may vary between
firms but not within the firm itself. The decision to change the percentage of
ownership is difficult and may take a long time for blockholders and institutional
32 It is notable that in their estimations they use Logit with Fama MacBeth (1973) methodology.

Chapter Five
148
investors. To test this proposition, we calculated the within and between variation
for blockholders and institutional investors. For Blockholders regressor the
between variation is 0.1705 and within variation is 0.0994. For Institutional
investors regressor the between variation is 0.215 and the within variation is
0.0917. For the size regressor, the between variation is 1.005 and the within
variation is 0.500. Consequently, we expect the fixed effect Logit will not be
efficient and may not be applicable for this study.
For robustness check, in order to control for year effect we transformed the data.
That is transforming the variables into deviations from time means (i.e. the mean
across the N individual firms for each period) (see Bond et. al 2001). The results
are qualitatively same as in Table 5.5. Table 5.9 shows the results from the
transformed data, where we control for year effect by using transformed data. In
addition, we used the normalised ratio to transform the data, the results are
qualitatively similar.
Table 5. 9 Logit Results from Transformed Data
The Table provides the results from Logit analysis for Jordanian firms listed in Amman stock exchange for the period 2000-2008. The results in panel 1 are based on Logit model with Fama MacBeth methodology and transformed de-meaned data. The results in panel 2 based on Logit model with transformed data based on
normalized ratio, for firm i in year t the normalized ratio individual observation = L¸��� ¸[�N¹º� , where rit is the
firm observation in year t , and B[� is the mean value for all firms year t, ��� is the standard error for all observations in year t alone. Panel 3 is Logit model based on demeaned data where the variables transform into deviations from time means. Dependent variable : Dividend
Independent variables
1 2 3
Profitability 14.909*** (5.09)
0.120*** (7.00)
13.570*** (6.94)
Growth Opportunities 0.452*** (3.10)
0.0342** (2.53)
0.330*** (2.66)
Size 0.014 (0.12)
0.01 (0.87)
0.05 (0.66)
Volatility -0.136*** (-3.45)
-0.023*** (-3.06)
-0.110** (-2.10)
Blockholders -1.811*** (-4.81)
-0.037*** (3.06)
-1.631** (-3.09)
Institutional Investors 1.981*** (3.93)
0.042*** (3.34)
1.570*** (3.41)
Retained Earnings/Total Equity 3.701*** (3.71)
0.091*** (3.13)
2.450*** (3.53)
R2 0.25 0.257 0.26 No. of Firms No. of Observation
85 680
85 680
85 680

Chapter Five
149
Marginal Effect
Table 5.10 Results of marginal effects from the choice of paying dividend
Dependent variable: dividend indicator (1 if the firm pay dividend and 0 otherwise). The results for Logit model. The asterisk ***, **, and * denotes that the coefficients are statistically significant at 1%, 5%, and 10% level, respectively. See Table 5.5 for Variables definition. Dependent variable : Dividend payout ratio
Independent Variables
Profitability 0.030*** (6.93)
Growth Opportunities 0.008** (2.52)
Size 0.002 (0.87)
Volatility -0.005** (-2.26)
Blockholders -0.009*** (-3.07)
Institutional Investors 0.010*** (3.34)
Retained Earnings/Total equity 0.022*** (3.18)
No. of Firms No. of Observations
85 680
In table 5.9 we show the results from Logit after control for year effects, Table 5.10
reports the marginal effects obtained from the choice-to pay dividends evaluated at
the mean values of each independent variable. First, the results show that the
profitability of the firm has a significantly positive effect on dividend payouts. A 1%
increase in the firm profitably ratio raises the probability of dividend payouts only by
about 0.03 percentage points. Second, size of the firm is insignificant. Third, Growth
opportunities, institutional investors, and Retained earnings ratio has positive and
significant impact on dividend payouts. Finally, Volatility and Blockholders have
negative and significant impact on the probability of the firm to pay dividends.
The positive impact of profitability and firms with growth opportunities supports the
findings from the previous chapter that healthy firms enjoy better access to relatively
low-cost credit. The results also support the life cycle theory, where retained
earnings positively impact the payment of dividends,

Chapter Five
150
The impact of ownership structure on dividend policy shows that blockholders
prefer firms that do not pay dividends, this supports the agency cost theory. In
contrast, institutional investors prefer to receive dividends, which is consistent with
the view that they regard dividends as indicators of firms’ financial strength.
Institutional investors act as short term investors rather than owners of the
company, and consequently are looking for current income rather than future
earnings.
5.13 DIVIDEND POLICY AND TARGET ADJUSTMENT MODEL
In this section, the empirical model that examines the adjustment of dividends
toward a target dividend policy or the optimal dividend policy is discussed. Lintner
(1956) proposes the Partial Adjustment Model, which sees firms adjust their
dividend smoothly toward a target dividend payout ratio.
Lintner (1956) argues that, ‘the belief on the part of many managements that most
stock-holders prefer a reasonably stable rate and that the market puts a premium
on stability or gradual growth in rate-were strong enough that most managements
sought to avoid making changes in their dividend rates that might have to be
reversed within a year or so’. Lintner further states that firms change dividends
toward the target in a gradual way (partial adjustment) in order to reduce the
adverse shareholders’ reactions relating to a changing dividend. In addition, he
argues that current earnings is the most important factor affecting the rate of
dividends, and also determines the target payout ratio; this is because the firm’s
management believes that shareholders expect that dividends increase if earnings
increase, and may therefore accept the cut in dividends if the earnings decrease;
therefore, we can see that there is stickiness between previous rates of dividend
payout and current dividends, and the change in dividends follows a smoothing
pattern rather than radical changes.
The asymmetric information between firm’s management and investors affects the
adjustment process of dividends. In markets with higher asymmetric information,

Chapter Five
151
the adjustment process is slow towards the optimal target payout ratio because
investors may consider any change in dividend policy as a signal about future
earnings. On the other hand, markets with a low asymmetric information problem
show a quicker adaptive process toward target payout ratio owing to investors
being fully informed about the firm. From another perspective, the dividends
payment is used to reduce the agency cost problem; therefore, we can expect that
investors in markets with a high agency problem use dividends to reduce the
agency cost problem.
In bank-based markets, the asymmetric information problem and agency cost
problem are lower since the main provider of funds is banks. A close relationship
between the company and the banks reduces these problems. In addition, banks
may have access to private information and have the ability to monitor the firm’s
activities; therefore, using dividends as a signalling device to reduce the agency
cost problem will be lower in the bank based market (see Aivazian et al., 2003b).
In Jordan, the bond market is very thin, with most listed companies rarely using it
to raise funds. The main characteristic of the financial market in Jordan is that
banks are the main providers of debt for firms. In addition, the banking sector in
Jordan is developed and working well on a commercial basis, banks providing
loans based on firm performance (see Aivazian et al., 2003b); therefore, a close
relationship between firms and banks encourages stable dividend payments, and
dividend smoothing is not important for signalling future earnings or reducing
agency cost problems.
H0: The Lintner model holds, and the current dividend payments are highly
sensitive to past dividend payments, and highly sensitive to current earnings.
To test the above argument, the Lintner’s model is implemented. This model
suggests that all companies have a target payout ratio and move toward this target
gradually, with the current earnings (Ear) affecting the target payout ratio (Div*).
Following Lintner’s argument—which states that the most important determinant
of a change in the dividend policy is the current earnings—we note the impact of
earnings on the target payout ratio as follows:

Chapter Five
152
Div*it = riEari,t eq. 5.4
where ri represents the optimal payout ratio, and means that firm i has a target
amount of dividends (Div*) in year t related to earnings (Ear).
In any given year, the adjustment process towards the optimal dividend payout of
the firm only partially moves to the target dividend level; thus, the change from the
dividend payout from year t-1 to year t will be as follows:
8?��,� � 8?��,��� ��L8?��,�; � 8?��,���N eq. 5.5
where c equals the ‘speed of adjustment coefficient’.
Alternatively, Equation 5.5 can be written to find the actual dividend payout as:
8?��,� ��8?��,�; � L1 � ��N8?��,��� eq. 5.6
where Divi,t and Divi,t-1 are the actual Div for year t and year t-1, respectively. Div*it
is the firm target dividend ratio. Where 0 < c < 1, the coefficient c measures the
firm speed toward its target. If the c =1, then Div*it = Divit-1 and the transaction cost
that the firm pays to adjust toward its target dividend payout is zero and the
adjustment toward target dividends occurs without cost and the firm is always at its
target. On the other hand, if c=0, then Div it = Divit-1 which means that the
transaction cost that the firm pays to adjust towards target is too high, and there is
no adjustment. Now a substitution of equation (5.4) into equation (5.6) gives
8?��,� L1 � ��N8?��,��� � ��B� 9B�,� � ��,� eq. 5.7
which can be alternatively written as :
8?��,� �8?��,��� � � 9B�,� � ��,� eq. 5.8
where β1 =1-c represents the speed of adjustment, β2 =ciri, and εit is the error term.
The equation shows that the current dividend payout ratio is a function of the

Chapter Five
153
lagged value of the payout ratio and the current earnings per share.33 In this case
the target payout ratio is related to the firm’s earnings is β2/(1-c). Using Ordinary
Least Squares (OLS) estimator for the above equation provides a biased estimation
since the lagged value of the dependent variable is included in the model. The fixed
and random OLS estimators are inconsistent and biased in dynamic panel data
model (see Baltagi 2005).34
5.13.1 Results of Target Dividend Ratio
Table 5.11 shows the regression results for Lintner’s model; the Lagrange
Multiplier test shows that the pooled model is more appropriate than the random
effect model. The null hypothesis in the LM test is that variances across firms is
zero. This is, no significant difference across firms. The p-value from LM is
insignificant at any conventional level, here we failed to reject the null and
conclude that random effects is not appropriate. This is, not significant differences
across firms is found.
When the OLS estimator is used, the speed of adjustment (1- c) is between 78%
and 90%; however, in the fixed effect model, the lagged dividends variable is not
significant at any conventional level. The inconsistency of the OLS estimation may
suggest that OLS may give incorrect results. In addition, the lagged value of the
dividend payout is not significant in the GMM estimation35. Because the lagged
value of the dividend payout is not significant, the results may not support the path-
dependence in payout policies. The target dividend payout ratio equals 19.54% (i.e.
0.17/(1-0.13)) which is lower than the sample average (i.e. 37.3% (see Table 5.2).
This suggests that Jordanian firms do not change their current payout ratio towards
a long-run optimal payout ratio. The results are similar to the findings of Naceur et
al., (2006), who state that Tunisian firms do not adjust their current dividend
payout ratio towards the long-term target dividend payout ratio since the lagged
value of the dividends is not statistically significant from zero.
33 Following Aivazian et al., (2003b) I use the current earnings per share as a measure of earnings. 34 For more details regarding this issue please refer to section 4.6 from chapter 4. 35 For GMM estimators, the p- value of the Sargan test and the (AR 1) and (AR 2) statistics appear not to reject the null of instrument validity and correct model specification. Please see chapter 4 section 4.6 for more details about this issue.

Chapter Five
154
Table 5. 11 Results for the Target Dividend Payout Ratio
Regression analysis for Lintner’s model. Regression analysis for dividends, test for regression for all firms in sample. Using OLS regression and GMM first differences, the table provides the regression results for dividends sensitivities, for Jordanian firms for the period 2000-2008, all variables are defined in section 5.13. The dependent variable is dividend payout ratio and calculated by the amount of dividends divided by the net income for firm i in the year t .Earnings per share is the net income divided by number of shares outstanding at the end the year. Standard errors are heteroskedasticity-robust and clustered by firm. T-statistics are in parenthesis below the coefficient estimates, the Lagrangian Multiplier test (LM test). Wald is a Wald test of the joint significance of the reported coefficients, asymptotically distributed as x2 under the null of no relationship. Serial Correlation (AR 1) is a test for first-order serial correlation, asymptotically distributed as N(0,1) under the null on no first-order serial correlation. Serial Correlation (AR 2) is a test for second-order serial correlation, asymptotically distributed as N(0,1) under the null on no second-order serial correlation. OIR is Sargan test for-over-identifying restrictions under the null of valid instruments. The asterisk ***, **, and * denotes that the coefficients are statistical significance at 1%, 5%, and 10% level, respectively. Dependent variable : Dividend Payout ratio
Independent Variables
Pooling
OLS Random effect
Fixed Effect
GMM-first difference
Lagged Dividends 0.216*** (3.22)
0.209*** (3.21)
0.091 (1.23)
0.130 (1.22)
Earnings Per Share 0.521*** (4.19)
0.472*** (3.68)
0.191*** (3.51)
0.171** (1.96)
LM test 2.66 Wald 116*** 14.09*** 5.48*
OIR J-test p-value 0.43
Arellano-Bond AR(1) test-
p.value
-2.35**
Arellano-Bond AR(1) test-
p.value
-0.63
R2 0.70 0.24 0.30 n.a
Speed of Adjustment 78.4% 79.1% 90.9% 87%
Target Payout 66.4% 59.4% 20.8% 19.5%
No. of Firms 85 85 85 85
To compare the results with other findings, we can state the following findings
from other researchers who examine Lintner’s Model. Aivazian et al., (2003b) use
a sample of US firms and find that the speed of adjustment is between 12.2% and
24.9%. In addition, the results in Table 5.10 are not consistent with the findings of
Aivazian et al., (2003b), who find that the lagged value of dividend payout is
39.4% and statistically significant at 1%. However, their results may not be
consistent because they estimate the regression using OLS on the sample of pooled
data, and they note that using a relatively small sample size might lead to this

Chapter Five
155
result. However, here the sample is twice as large. Renneboog and Trojanowski
(2010) find that the speed of adjustment for firms in the UK is between 73% and
63%.
The results in Table 5.10 show that Jordanian firms do not utilise the current
dividend as a signal about their expectation for future earnings. The results also
show that there is no stickiness of dividends, and that current dividends are
independent of past dividends. This supports the view that there is no dividend
smoothing towards a target dividend payout ratio.
5.14 THE CONCLUSION
In this chapter, the main determinants of dividend policy for Jordanian firms have
been analysed and the main theories of dividend policy examined. Some of the
results are similar to those from either developed or developing countries, whilst
some are different from these countries. The main reasons for these differences are
the legal and institutional structure of the Jordanian market. For instance, in Jordan,
there are no taxes on dividends or capital gains, the firms cannot pay dividends if
they have any losses or accumulated losses in that year, and the financial market is
bank-centric. All of these factors contribute to the results being different from
previous researchers.
In this chapter, different estimation methodologies have been applied. In order to
estimate the probability that the firm pays dividends, the Logit estimator was
utilised alongside the statistical methodologies of Fama and MacBeth (1973) and
Petersen (2009) to correct for standard errors. Furthermore, the Lintner’s model to
test for stickiness of dividends and to test whether there is a target dividend payout
ratio was also estimated. The main findings are the following:
1. Regression results may support the free cash flow hypothesis, where the
probability of paying dividends and the amount of dividends are positively
related to the profitability of the firm. The results support the existing
findings from developed and developing countries.

Chapter Five
156
2. The results suggest that firm size is not an important factor to affect the
dividend payout ratio. The results also highlight that earnings volatility has
a negative impact on the firm’s overall ability to pay dividends. The results
provide some evidence to support the positive impact of growth
opportunities on the dividend payout ratio.
3. The regression results suggest the impact of ownership structure on dividend
policy. On the one hand, blockholders negatively impact the probability of
paying dividends and the amount of dividends. The results may support that
poor legal protection for small investors leads them to encourage firms to
pay dividends. The results also support that institutional investors follow the
prudent-man rule and positively impact the dividend payout ratio.
4. The results show evidence to support the Lifecycle Theory. Firms with a
large amount of retained earnings relative to total equity or total assets are
more likely to pay dividends and pay a larger amount of dividends. This
emphasises the importance of the firm’s financial age on its dividend
policy.
5. The results show no evidence to support Lintner’s model, where the
lagged value of dividends has no significant impact on current dividends.
Importantly, the regression results suggest that Jordanian firms have no
long-term target payout ratio. This indicates that there is no stable dividend
payout policy for Jordanian firms. In addition, there is no evidence to
support dividend smoothing, since firms change their dividend payout
policy without taking into consideration the past pattern of the payout ratio.

Chapter Six
157
CHAPTER SIX
CONCLUSION, LIMITATION, AND FUTURE RESEARCH
This chapter summarises the main findings of all previous chapters. In addition, the
limitations and suggested future research areas are provided.
6.1 CONCLUSION
This thesis provides an extensive and comprehensive review of the main financing
theories, and empirically tests these theories on firms listed on the Amman Stock
Exchange (ASE). In general, the results show that the firm’s characteristics factors
have an effect on the firm’s management decisions concerning the capital structure
and dividends policy. The results also show that the asymmetric information in the
capital market has an effect on main decisions regarding raising capital or paying
dividend.
6.2 FINANCIAL CONSTRAINTS ON THE FIRM’S INVESTMENT:
This research provides new evidence which does not support the notion that the
financing and investment decisions are separable, as proposed by Modigliani and
Miller. This research shows that asymmetric information may increase the costs of
external financing where firms with high asymmetric information have more
investment-internal cash flow sensitivities. The research uses different criterion to
divide firms into two groups of firms: the first group comprise firms with lower
asymmetric information, and which are assumed to be less financially constrained
than the second group. The market structure of Amman Stock Exchange (ASE)

Chapter Six
158
offers a great opportunity to divide firms into financially constrained firms and
financially unconstrained firms. The ASE is divided into two markets: the first
market firms are those which are considered to be profitable, healthy, and have
normal free float volume; the second market includes those firms that have
experienced losses or suffered from losses for three consecutive years, and which
also have low free float volume. The results show inconclusive evidence to support
that the market listing, dividend policy, size, and age of the firms are useful to
discriminate between financially constrained and financially unconstrained firms.
6.3 CAPITAL STRUCTURE POLICY
Chapter Five results show that firms listed in the Amman Stock Exchange face
various financial restrictions; therefore, Chapter Six of the research explores the
main factors affecting the firm’s decisions concerning the shape of the firm’s
capital structure. This research creates a model based on the main capital structure
theories (Pecking Order Theory, Trade-off Theory, and Agency Cost Theory) to
explain the relationship between the firm’s characteristics and capital structure. The
results show evidence to support the Pecking Order Theory since the profitability
and liquidity have negative impacts on the firm’s leverage. Moreover, the size of
the firm has a positive impact on the leverage ratio, which supports the Trade-off
Theory. The research supports the target adjustment model, where the results show
that the firms set target leverage ratio and move toward this target in the short time.
6.4 DIVIDEND PAYOUT POLICY
Chapter Seven of this research analyses those firm attributes that determine the
dividend policy in Jordan. The model includes the main factors representing the
main explanatory theories (Signalling, Agency Cost, Free Cash Flow, and
Lifecycle) of dividend policy. The result shows that the dividend policy in Jordan
is influenced by the same factors affecting dividend policy in developed countries.
The results further support the Free Cash Flow hypothesis since the profitability
has a positive impact on the dividend payment. Furthermore, the results support the

Chapter Six
159
Lifecycle Theory, as there is a positive impact of retained earnings ratio on the
likelihood of paying dividend and amount of dividends. Furthermore, the results
support the impact of Agency Cost where firm capital structure affects the dividend
policy.
The results garner inconclusive evidence to support that the firm size impacts
dividend policy. In addition, the results show that Jordanian firms do not target
dividend payout ratio.
6.5 LIMITATIONS OF THE RESEARCH:
The main limitation of this research is that it depends on data based on financial
statements; data from financial statements may not represent all factors that
influence the financing decisions. For example, regarding financing decisions, the
management may be affected by human characteristics, such as attitudes,
experience, and knowledge; therefore, the study may need to conduct survey
analysis so as to investigate the impacts associated with management
characteristics on financing decisions.
Another limitation of this study is that it depends on annual data. The utilisation of
annual data may reduce the ability of the research to have the most accurate results
regarding the financings decisions because, as is known, the financing decision is a
continuous process, and we need to know and understand those factors that affect
this decision according to each timespan as opposed to waiting at the end of the
year. For instance, the use of quarterly data may give us more robust results
concerning the relationship between the variables in the study.
6.6 FUTURE RESEARCH:
The results of this research depend mainly on data from financial statements. As is
known, there are various limitations relating to financial statement data; however,
the research holds the belief that the use of surveys and personal interviews with
firm management and market investors may augment the current results and

Chapter Six
160
accordingly provide a clear understanding of the financing theories and their
applications. For example, conducting a survey and personal interviews with
investors may provide the main factors that cause them to impose various
restrictions on providing firms with funds. Furthermore, this may help to establish
the relationship between the investment and financing decisions, which can be
achieved if managers are asked about those factors affecting decisions.
In addition, the main factors affecting the capital structure decisions are examined,
which can also be achieved by interviewing the managers, investors and banks.
Finally, the results of the dividend policy decision can be augmented if the
managers and inventors show their opinions regarding the firm’s dividend policy.
161
REFERENCES
References
Abel, A.B. 1980, "Empirical Investment Equations: An Integrative Framework",
Carnegie-Rochester Conference Series on Public Policy, vol. 12, pp. 39-91.
Abel, A.B. and Blanchard, O.J. 1986, "The Present Value of Profits and Cyclical
Movements in Investment", Econometrica, vol. 54, no. 2, pp. 249-273.
Aggarwal, R. and Zong, S. 2006, "The Cash Flow–Investment Relationship:
International Evidence of Limited Access to External Finance", Journal of
Multinational Financial Management, vol. 16, no. 1, pp. 89-104.
Aharony, J. and Swary, I. 1980, "Quarterly Dividend and Earnings Announcements
and Stockholders' Returns: An Empirical Analysis", The Journal of
Finance, vol. 35, no. 1, pp. 1-12.
Aivazian, V., Booth, L. and Cleary, S. 2003a, "Do Emerging Market Firms Follow
Different Dividend Policies From U.S. Firms?", Journal of Financial
Research, vol. 26, no. 3, pp. 371-387.
Aivazian, V., Booth, L. and Cleary, S. 2003b, "Dividend Policy and the
Organization of Capital Markets", Journal of Multinational Financial
Management, vol. 13, no. 2, pp. 101-121.
Alessandrini,P., Presbitero, Andrea, F., and Zazzaro, A., 2006, " Banks, Distances
and Financing Constraints for Firms, Universita Politecnica delle Marche
Economics Working Paper No. 266
Al-Fayoumi, N. and Abuzayed, B. 2009 , "Assessment of the Jordanian banking
sector within the context of GATS agreement", Banks and Bank Systems,
vol. 4, no 2, pp. 69-79.
Allayannis, G. and Mozumdar, A. 2004, "The Impact of Negative Cash Flow and
Influential Observations on Investment–Cash Flow Sensitivity Estimates",
Journal of Banking and Finance, vol. 28, no. 5, pp. 901-930.

162
Allen, F., Bernardo, A.E. and Welch, I. 2000, "A Theory of Dividends Based on
Tax Clienteles", The Journal of Finance, vol. 55, no. 6, pp. 2499-2536.
Al-Sakran A. S., (2001) "Leverage Determinants in the Absence of Corporate Tax
System: The Case of Non-Financial Publicly Traded Corporations in Saudi
Arabia", Managerial Finance, vol. 27 no. 10/11, pp.58 - 86.
Almeida, H. and Campello, M. 2007, "Financial Constraints, Asset Tangibility, and
Corporate Investment", Review of Financial Studies, vol.20 no. pp.1429-
1460.
Ambarish, R., John, K. and Williams, J. 1987, "Efficient Signaling with Dividends
and Investments", The Journal of Finance, vol. 42, no. 2, pp. 321-343.
Ang, J.S., Fatemi, A. and Tourani-Rad, A. 1997, "Capital Structure and Dividend
Policies of Indonesian Firms", Pacific-Basin Finance Journal, vol. 5, no. 1,
pp. 87-103.
Antoniou, A., Guney, Y. and Paudyal, K. 2008, "The Determinants of Capital
Structure: Capital Market-Oriented versus Bank-Oriented Institutions",
Journal of Financial and Quantitative Analysis, vol. 43, no. 1, pp. 59-92.
Arellano, M. and Bond, S. 1991, "Some Tests of Specification for Panel Data:
Monte Carlo Evidence and an Application to Employment Equations", The
Review of Economic Studies, vol. 58, no. 2, pp. 277-297.
Arellano, M. and Bover, O. 1995, "Another look at the instrumental variable
estimation of error-components models", Journal of Econometrics, vol. 68,
no. 1, pp. 29-51.
Arslan, Ö., Florackis, C. and Ozkan, A. 2006, "The Role of Cash Holdings in
Reducing Investment–Cash Flow Sensitivity: Evidence From A Financial
Crisis Period in An Emerging Market", Emerging Markets Review, vol. 7,
no. 4, pp. 320-338.
Asquith, P. and Mullins, D.W., Jr. 1983, "The Impact of Initiating Dividend
Payments on Shareholders' Wealth", The Journal of Business, vol. 56, no. 1,
pp. 77-96.

163
Attig, N., Cleary, S., El Ghoul, S. & Guedhami, O. 2012, "Institutional Investment
Horizons and the Cost of Equity Capital", Financial Management, , pp. no-
no. (Forthcoming issue)
Audretsch, D.B. and Elston, J.A. 2002, "Does Firm Size Matter? Evidence on The
Impact of Liquidity Constraints on Firm Investment Behavior in Germany",
International Journal of Industrial Organization, vol. 20, no. 1, pp. 1-17.
Baker, M. and Wurgler, J. 2002, "Market Timing and Capital Structure", The
Journal of Finance, vol. 57, no. 1, pp. 1-32.
Baker, M. and Wurgler, J. 2004, "A Catering Theory of Dividends", The Journal of
Finance, vol. 59, no. 3, pp. 1125-1165.
Baltagi, B.H. 2005, Econometric Analysis of Panel Data, 3rd edn, John Wiley &
Sons Ltd.
Barclay, M.J., Holderness, C.G. and Sheehan, D.P. 2009, "Dividends and
Corporate Shareholders", Review of Financial Studies, vol. 22, no. 6, pp.
2423-2455.
Barclay, M.J. and Smith, C.W.,Jr. 1995, "The Maturity Structure of Corporate
Debt", The Journal of Finance, vol. 50, no. 2, pp. 609-631.
Barclay, M.J., Smith, C.W. and Watts, R.L. 1995, "The Determinants of Corporate
Leverage and Dividend Policies", Journal of Applied Corporate Finance,
vol. 7, no. 4, pp. 4-19.
Bathala, C.T., Moon, K.P., Rao, R.P., 1994, "Managerial Ownership, Debt Policy,
and the Impact of Institutional Holdings: An Agency Perspective", The
Journal of the Financial Management Association, vol. 23, no. 3, pp. 38-50.
Baum, C.F., Schäfer, D. and Talavera, O. 2011, "The impact of the financial
system’s structure on firms’ financial constraints", Journal of International
Money and Finance, vol. 30, no. 4, pp. 678-691.
Beck, T., Demirgüç-Kunt, A., Laeven, L. and Maksimovic, V. 2006, "The
Determinants of Financing Obstacles", Journal of International Money and
Finance, vol. 25, no. 6, pp. 932-952.
164
Becker, B. and Sivadasan, J. 2010, "The Effect of Financial Development on the
Investment Cash Flow Relationship: Cross-Country Evidence from
Europe", The B.E. Journal of Economic Analysis & Policy, vol. 10(1),
pages 43.
Benartzi, S., Michaely, R. and Thaler, R. 1997, "Do Changes in Dividends Signal
the Future or the Past?", The Journal of Finance, vol. 52, no. 3, 1997, pp.
1007-1034.
Bennett, M. and Donnelly, R. 1993, "The Determinants of Capital Structure: Some
UK Evidence", The British Accounting Review, vol. 25, no. 1, pp. 43-59.
Bevan, A. A., and Danbolt, J. 2002, "Capital Structure and its Determinants in the
United Kingdom–A Decompositional Analysis", Applied Financial
Economics, 12(3), pp.159–170.
Bhaduri, S.N. 2005, "Investment, Financial Constraints and Financial
Liberalization: Some Stylized Facts from A Developing Economy, India",
Journal of Asian Economics, vol. 16, no. 4, pp. 704-718.
Bhagat, S., Moyen, N. and Suh, I. 2005, "Investment and Internal Funds of
Distressed Firms", Journal of Corporate Finance, vol. 11, no. 3, pp. 449-
472.
Bhattacharya, S. 1979, "Imperfect Information, Dividend Policy, and "The Bird in
the Hand" Fallacy", The Bell Journal of Economics, vol. 10, no. 1, pp. 259-
270.
Blundell, R. and Bond, S. 1998, "Initial conditions and moment restrictions in
dynamic panel data models", Journal of Econometrics, vol. 87, no. 1, pp.
115-143.
Bond, S., Elston, J.A., Mairesse, J. and Mulkay, B. 2003, "Financial Factors and
Investment in Belgium, France, Germany, and the United Kingdom: A
Comparison Using Company Panel Data", The review of economics and
statistics, vol. 85, no. 1, pp. 153-165.
Bond, S. and Meghir, C. 1994a, "Dynamic Investment Models and the Firm's
Financial Policy", The Review of Economic Studies, vol. 61, no. 2, pp. 197-
222.

165
Bond, S. and Meghir, C., 1994b. "Financial Constraints and Company Investment"
Fiscal Studies" 15, 1–18.
Bond, S., Anke, H., and Jonathan, T., 2001, “GMM Estimation of Empirical
Growth Models”, mimeo, September 2001.
Booth, L., Aivazian, V., Demirguc-Kunt, A. and Maksimovic, V. 2001, "Capital
Structures in Developing Countries", The Journal of Finance, vol. 56, no. 1,
pp. 87-130.
Bradley, M., Jarrell, G.A. and Kim, E.H. 1984, "On the Existence of an Optimal
Capital Structure: Theory and Evidence", The Journal of Finance, vol. 39,
no. 3, Papers and Proceedings, Forty-Second Annual Meeting, American
Finance Association, San Francisco, CA, December 28-30, 1983, pp. 857-
878.
Brailsford, T.J., B.R. Oliver, and S.L.H. Pua, 2002, "On the Relation between
Ownership Structure and Capital Structure", Journal of Accounting and
Finance 42, 1-26.
Brav, A., Graham, J.R., Harvey, C.R. and Michaely, R. 2005, "Payout Policy in the
21st Century", Journal of Financial Economics, vol. 77, no. 3, pp. 483-527.
Breusch, T.S. and Pagan, A.R. 1980, "The Lagrange Multiplier Test and its
Applications to Model Specification in Econometrics", The Review of
Economic Studies, vol. 47, no. 1, Econometrics Issue, pp. 239-253.
Brockman, P. and Unlu, E. 2009, "Dividend Policy, Creditor Rights, and The
Agency Costs of Debt", Journal of Financial Economics, vol. 92, no. 2, pp.
276-299.
Brooks, C. 2009, Introductory Econometrics for Finance, 2nd edn, Cambridge
University Press.
Brown, J.R. and Petersen, B.C. 2009, "Why has the Investment-Cash Flow
Sensitivity Declined so sharply? Rising R&D and equity market
developments", Journal of Banking and Finance, vol. 33, no. 5, pp. 971-
984.

166
Bulan, T. and Yan, Z. 2010, "Firm Maturity and the Pecking Order Theory",
International Journal of Business and Economics, vol. 9, no. 3, pp. 179-
200.
Çağlayan, E. and Şak N. 2010, "The Determinants of Capital Structure: Evidence
from the Turkish Banks", Journal of Money, Investment and Banking, , no.
15, pp. 57-65.
Cameron, A.C. and Trivedi, P.k. 2009, Microeconometrics Using Stata, 1st edn, A
Stata Press Publication.
Campello, M., Graham, J.R. and Harvey, C.R. 2010, "The Real Effects of Financial
Constraints: Evidence From A Financial Crisis", Journal of Financial
Economics, vol. 97, no. 3, pp. 470-487.
Carpenter, R.E. & Guariglia, A. 2008, "Cash flow, investment, and investment
opportunities: New tests using UK panel data", Journal of Banking &
Finance, vol. 32, no. 9, pp. 1894-1906.
CENTRAL BANK OF JORDAN (1999-2009). Annual Reports for the period from
1999-2009. Research Department, Amman, Jordan.
Centre for International Private Enterprise (CIPE) and Global Corporate
Governance Forum (2003) Corporate Governance in Morocco, Egypt,
Lebanon and Jordan (Washington, DC: CIPE).
Chamberlain, G. 1980, "Analysis of Covariance with Qualitative Data," Review of
Economic Studies, vol. 47, no. 1, pp. 225-238.
Chang, X. and Dasgupta, S. 2009, "Target Behavior and Financing: How
Conclusive Is the Evidence?", The Journal of Finance, vol. 64, no. 4, pp.
1767-1796.
Chang, X., T. Tan, G. Wong, and H. Zhang, 2007, "Effects of Financial Constraints
on Corporate Policies in Australia", Accounting and Finance, vol. 47, no.
1, pp 85-108.
Chay, J.B. and Suh, J. 2009, "Payout Policy and Cash-Flow Uncertainty", Journal
of Financial Economics, vol. 93, no. 1, pp. 88-107.
Chen, C.R. and Steiner, T.L. 1999, "Managerial Ownership and Agency Conflicts:
A Nonlinear Simultaneous Equation Analysis of Managerial Ownership,

167
Risk Taking, Debt Policy, and Dividend Policy", Financial Review, vol. 34,
no. 1, pp. 119-136.
Chen, J.J. 2004, "Determinants of Capital Structure of Chinese-Listed Companies",
Journal of Business Research, vol. 57, no. 12, pp. 1341-1351.
Chirinko, R.S. and Singha, A.R. 2000, "Testing static tradeoff against pecking
order models of capital structure: a critical comment", Journal of Financial
Economics, vol. 58, no. 3, pp. 417-425.
Cleary, S. 2006, "International Corporate Investment and the Relationships
between Financial Constraint Measures", Journal of Banking and Finance,
vol. 30, no. 5, pp. 1559-1580.
Cleary, S. 1999, "The Relationship between Firm Investment and Financial Status",
The Journal of Finance, vol. 54, no. 2, pp. 673-692.
Coulton, J.J. and Ruddock, C. 2011, "Corporate Payout Policy in Australia and A
Test of the Life-Cycle Theory", Accounting and Finance, vol. 51, no. 2, pp.
381-407.
Crutchley, C.E., Jensen, M.R.H., Jahera, J.S. and Raymond, J.E. 1999, "Agency
Problems and the Simultaneity of Financial Decision Making: The Role of
Institutional Ownership", International Review of Financial Analysis, vol.
8, no. 2, pp. 177-197.
DeAngelo, H. and Masulis, R.W. 1980, "Optimal Capital Structure under
Corporate and Personal Taxation", Journal of Financial Economics, vol. 8,
no. 1, pp. 3-29.
DeAngelo, H., DeAngelo, L. and Stulz, R.M. 2006, "Dividend Policy and the
Earned/Contributed Capital Mix: A Test of the Life-Cycle Theory", Journal
of Financial Economics, vol. 81, no. 2, pp. 227-254.
Degryse, H., de Goeij, P., and Kappert, P. (2012). “The impact of firm and industry
Characteristics on small firms’ capital structure”, Small Business
Economics, vol. 38, no. 4, pp. 431 - 447.
De Jong, A., Verbeek, M. and Verwijmeren, P. 2010, "The Impact of Financing
Surpluses and Large Financing Deficits on Tests of the Pecking Order
Theory", Financial Management, vol. 39, no. 2, pp. 733-756.
168
De Jong, A., Kabir, R. & Nguyen, T.T. 2008, "Capital structure around the world:
The roles of firm- and country-specific determinants", Journal of Banking
& Finance, vol. 32, no. 9, pp. 1954-1969.
Del Guercio, D. 1996, "The Distorting Effect of the Prudent-Man Laws on
Institutional Equity Investments", Journal of Financial Economics, vol. 40,
no. 1, pp. 31-62.
Deloof, M. 1998, "Internal Capital Markets, Bank Borrowing, and Financing
Constraints: Evidence from Belgian Firms", Journal of Business Finance
and Accounting, vol. 25, no. 7, pp. 945-968.
Demirgüç-Kunt, A. and Peira, M. 2010 “A Framework for Analysing Competition
in the Banking Sector: Application to the Case of Jordan”, World Bank
Policy Research Working Paper No 5499.
Denis, D.J. and Osobov, I. 2008, "Why Do Firms Pay Dividends? International
Evidence on the Determinants of Dividend Policy", Journal of Financial
Economics, vol. 89, no. 1, pp. 62-82.
Denis, D.J. and Serrano, J.M. 1996, "Active Investors and Management Turnover
Following Unsuccessful Control Contests", Journal of Financial
Economics, vol. 40, no. 2, pp. 239-266.
Desai, M.A. and Jin, L. 2011, "Institutional Tax Clienteles and Payout Policy",
Journal of Financial Economics, vol. 100, no. 1, pp. 68-84.
Deshmukh, S. 2003, "Dividend Initiations and Asymmetric Information: A Hazard
Model", Financial Review, vol. 38, no. 3, pp. 351-368.
D'Espallier, B., Vandemaele, S. and Peeters, L. 2008, "Investment-Cash Flow
Sensitivities or Cash-Cash Flow Sensitivities? An Evaluative Framework
for Measures of Financial Constraints", Journal of Business Finance and
Accounting, vol. 35, no. 7&8, pp. 943-968.
Devereux, M., and F. Schiantarelli. 1990, "Investment Financial, Factors, and Cash
Flow: Evidence from UK Panel Data", in R. G. Hubbard (ed.), Asymmetric
Information Corporate Finance and Investment, Chicago: University of
Chicago Press, 279–306.

169
Dong, M., Robinson, C. and Veld, C. 2005, "Why Individual Investors Want
Dividends", Journal of Corporate Finance, vol. 12, no. 1, pp. 121-158.
Duchin, R., Ozbas, O. and Sensoy, B.A. 2010, "Costly External Finance,
Corporate Investment, and the Subprime Mortgage Credit Crisis", Journal
of Financial Economics, vol. 97, no. 3, pp. 418-435.
Easterbrook, F.H. 1984, "Two Agency-Cost Explanations of Dividends", The
American Economic Review, vol. 74, no. 4, pp. 650-659.
Eberly, J., Rebelo, S. & Vincent, N. 2012, "What explains the lagged-investment
effect?", Journal of Monetary Economics, vol. 59, no. 4, pp. 370-380.
Eije, H. and Megginson, W.L. 2008, "Dividends and Share Repurchases In the
European Union", Journal of Financial Economics, vol. 89, no. 2, pp. 347-
374.
Fama, E.F. and French, K.R. 2002, "Testing Trade‐Off and Pecking Order
Predictions about Dividends and Debt", Review of Financial Studies, vol.
15, no. 1, pp. 1-33.
Fama, E.F. and French, K.R. 2001, "Disappearing Dividends: Changing Firm
Characteristics or Lower Propensity to Pay?", Journal of Financial
Economics, vol. 60, no. 1, pp. 3-43.
Fama, E.F. and MacBeth, J.D. 1973, "Risk, Return, and Equilibrium: Empirical
Tests", The Journal of Political Economy, vol. 81, no. 3, pp. 607-636.
Fazzari, S.M., Hubbard, R.G., Petersen. 1988, "Financing Constraints and
Corporate Investment", Brookings Papers on Economic Activity, vol. 1988,
no. 1, pp. 141-195.
Ferris, S.P., Sen, N. and Unlu, E. 2009, "An International Analysis of Dividend
Payment Behavior", Journal of Business Finance and Accounting, vol. 36,
no. 3-4, pp. 496-522.
Ferris, S., Sen, N. and Yui, H. 2006, "God Save the Queen and Her Dividends:
Corporate Payouts in the United Kingdom", The Journal of Business, vol.
79, no. 3, pp. 1149-1173.

170
Fiordelisi, F., Marques-Ibanez, D. & Molyneux, P. 2011, "Efficiency and risk in
European banking", Journal of Banking & Finance, vol. 35, no. 5, pp.
1315-1326.
Firth, M., Lin, C. and Wong, S.M.L. 2008, "Leverage and Investment under A
State-Owned Bank Lending Environment: Evidence from China", Journal
of Corporate Finance, vol. 14, no. 5, pp. 642-653.
Flannery, M.J. and Rangan, K.P. 2006, "Partial Adjustment Toward Target Capital
Structures", Journal of Financial Economics, vol. 79, no. 3, pp. 469-506.
Florackis, C. And Ozkan, A. 2009, "Managerial incentives and corporate leverage:
evidence from the United Kingdom", Accounting & Finance, vol. 49, no. 3,
pp. 531-553.
Fohlin, C., Iturriaga F.J.L. 2010, "Bank Relationship, Ownership Concentration
and Investment Patterns of Spanish Corporate Firms", Johns Hopkins
University mimeo.
Frank, M.Z., and Goyal, V.K. 2008, "Trade off and Pecking Order Theories of
Debt" In: Eckbo, E: Handbook of corporate finance: Empirical corporate
finance, vol. 2, Handbooks in finance series, Chapter 12, Elsevier.
Frank, M.Z. and Goyal, V.K. 2003, "Testing the Pecking Order Theory of Capital
Structure", Journal of Financial Economics, vol. 67, no. 2, pp. 217-248.
Fuller, K. and Blau, B.M. 2010, "Signaling, Free Cash Flow and “Nonmonotonic”
Dividends, Financial Review, vol. 45, no. 1, pp. 21-56.
Gaud, P., Jani, E., Hoesli, M. and Bender, A. 2005, "The Capital Structure of Swiss
Companies: an Empirical Analysis Using Dynamic Panel Data", European
Financial Management, vol. 11, no. 1, pp. 51-69.
Ghosh, S. 2006, "Did Financial Liberalization Ease Financing Constraints?
Evidence from Indian Firm-Level Data", Emerging Markets Review, vol. 7,
no. 2, pp. 176-190.
Gilchrist, S. and Himmelberg, C. P. 1998, "Investment, Fundamentals and
Finance", NBER Working Paper 6652.

171
Gilchrist, S. and Himmelberg, C.P. 1995, "Evidence on the Role of Cash Flow for
Investment", Journal of Monetary Economics, vol. 36, no. 3, pp. 541-572.
Goergen, M. and Renneboog, L. 2001, "Investment Policy, Internal Financing and
Ownership Concentration in the UK", Journal of Corporate Finance, vol. 7,
no. 3, pp. 257-284.
Gonenc, H. 2003, "Capital Structure Decisions Under Micro Institutional Settings:
The Case of Turkey", Journal of Emerging Market Finance, vol. 2, no. 1,
pp. 57-82.
González, V.M. and González, F. 2008, "Influence of bank concentration and
institutions on capital structure: New international evidence", Journal of
Corporate Finance, vol. 14, no. 4, pp. 363-375.
Gorodnichenko, Y., Schaefer, D. and Talavera, O. 2009, "Financial constraints and
continental business groups: Evidence from German Konzerns", Research
in International Business and Finance, vol. 23, no. 3, pp. 233-242.
Graham, J.R. and Harvey, C.R. 2001, "The Theory and Practice of Corporate
Finance: Evidence from the Field", Journal of Financial Economics, vol.
60, no. 2-3, pp. 187-243.
Greene, William H. (2003) "Econometric Analysis", Pearson; 4th edition (2003)
Greenwald, B., Stiglitz, J.E. and Weiss, A. 1984, "Informational Imperfections in
the Capital Market and Macroeconomic Fluctuations", The American
Economic Review, vol. 74, no. 2, Papers and Proceedings of the Ninety-
Sixth Annual Meeting of the American Economic Association, pp. 194-199.
Grinstein, Y. and Michaely, R. 2005, "Institutional Holdings and Payout Policy",
The Journal of Finance, vol. 60, no. 3, pp. 1389-1426.
Gugler, K. and Yurtoglu, B.B. 2003, "Corporate Governance and Dividend Pay-
Out Policy in Germany", European Economic Review, vol. 47, no. 4, pp.
731-758.
Guariglia, A., 2008. "Internal Financial Constraints, External Financial Constraints,
and Investment Choice. Evidence from a Panel of UK Firms". Journal of
Banking and Finance, vol. 32, pp. 1795–1809.
172
Hansen, L. P., 1982. " Large sample properties of generalized methods of moments
estimators". Econometrica, vol. 50, pp. 1029-1054.
Harris, M, and Raviv, A. 1991. "The theory of capital structure". Journal of
Finance, vol. 46, no 1, pp 297–355.
Haugen, R.A. and Senbet, L.W. 1978, "The Insignificance of Bankruptcy Costs to
the Theory of Optimal Capital Structure", The Journal of Finance, vol. 33,
no. 2, pp. 383-393.
Hausman, J.A. 1978, "Specification Tests in Econometrics", Econometrica, vol. 46,
no. 6, pp. 1251-1271.
Hayashi, F. 1982, "Tobin's Marginal q and Average q: A Neoclassical
Interpretation", Econometrica, vol. 50, no. 1, pp. 213-224.
Heineck, G. 2004, "Do Catholic women with non-smoking husbands earn less in a
second job? – Assorted topics in empirical labor economics". unpublished
dissertation, Bamberg University. Available at: http://www.ub.uni-
bamberg.de/elib/volltexte/2004/3/GH-Chap-2.pdf (Accessed: 10 September,
2011)
Herring, R. and Chatusripitak, N. (2001): The Case of the Missing Market: The
Bond Market and Why it Matters for Financial Development, Wharton
Financial Institutions Centre Working Paper. University of Pennsylvania.
Himmelberg, C.P. and Petersen, B.C. 1994, "R & D and Internal Finance: A Panel
Study of Small Firms in High-Tech Industries", The review of economics
and statistics, vol. 76, no. 1, pp. 38-51.
Hoberg, G. and Prabhala, N.R. 2009, "Disappearing Dividends, Catering, and
Risk", Review of Financial Studies, vol. 22, no. 1, pp. 79-116.
Hoshi, T., Kashyap, A. and Scharfstein, D. 1991, "Corporate Structure, Liquidity,
and Investment: Evidence from Japanese Industrial Groups", The Quarterly
Journal of Economics, vol. 106, no. 1, pp. 33-60.
Hovakimian, A., Hovakimian, G. and Tehranian, H. 2004, "Determinants of Target
Capital Structure: The Case of Dual Debt and Equity Issues", Journal of
Financial Economics, vol. 71, no. 3, pp. 517-540.

173
Hovakimian, G. and Titman, S. 2006, "Corporate Investment with Financial
Constraints: Sensitivity of Investment to Funds from Voluntary Asset
Sales", Journal of Money, Credit and Banking, vol. 38, no. 2, pp. 357-374.
Huang, J.J., Shen, Y. and Sun, Q. 2010 "Nonnegotiable Shares, Controlling
Shareholders, And Dividend Payments in China", Journal of Corporate
Finance, vol. 17, no. 1, pp. 122-133
Huang, R. and Ritter, J.R. 2009, "Testing Theories of Capital Structure and
Estimating the Speed of Adjustment", Journal of Financial and
Quantitative Analysis, vol. 44, no. 2, pp. 237-271.
International Monetary Fund Available: http://www.imf.org/external/index.htm
Ismail, M.A., Ibrahim, M.H., Yusoff, M. and Zainal, M.-. 2010, "Financial
constraints and firm investment in Malaysia: An investigation of
investment-cash flow relationship", International Journal of Economics and
Management, vol. 4, no. 1, pp. 29-44.
Jensen, G.R., Lundstrum, L.L. and Miller, R.E. 2010, "What Do Dividend
Reductions Signal?", Journal of Corporate Finance, vol. 16, no. 5, pp. 736-
747.
Jensen, G.R., Solberg, D.P. and Zorn, T.S. 1992, "Simultaneous Determination of
Insider Ownership, Debt, and Dividend Policies", Journal of Financial and
Quantitative Analysis, vol. 27, no. 02, pp. 247.
Jensen, M.C. 1986, "Agency Costs of Free Cash Flow, Corporate Finance, and
Takeovers", The American Economic Review, vol. 76, no. 2, pp. 323-329.
Jensen, M.C. and Meckling, W.H. 1976, "Theory of the Firm: Managerial
Behavior, Agency Costs and Ownership Structure", Journal of Financial
Economics, vol. 3, no. 4, pp. 305-360.
John, K. and Williams, J. 1985, "Dividends, Dilution, and Taxes: A Signaling
Equilibrium", The Journal of Finance, vol. 40, no. 4, pp. 1053-1070.
Jordan Investment Borad. Available:
http://jordaninvestment.com/IIS/PoliticalAndEconomicProfile/tabid/291/lan
guage/en-US/Default.aspx [Accessed July, 15, 2012,]

174
http://jordaninvestment.com/BusinessandInvestment/Taxation/tabid/85/language/en
-US/Default.aspx. (Accessed, July,10, 2012)
Jordan Exporter Organization, Available.: http://www.jordanexporters.org/
[Accessed July, 17, 2012]
Jorgenson, D.W. 1963, "Capital Theory and Investment Behavior", The American
Economic Review, vol. 53, no. 2, Papers and Proceedings of the Seventy-
Fifth Annual Meeting of the American Economic Association, pp. 247-259.
Kadapakkam, P., Kumar, P.C. and Riddick, L.A. 1998, "The Impact of Cash Flows
and Firm Size on Investment: The International Evidence", Journal of
Banking and Finance, vol. 22, no. 3, pp. 293-320.
Kalay, A., Lemmon, M., 2008, "Payout policy", In: Eckbo, E. (Ed.), Handbook of
Corporate Finance: Empirical Corporate Finance, vol. 2. Elsevier Science,
Amsterdam.
Kaplan, S.N. and Zingales, L. 1997, "Do Investment-Cash Flow Sensitivities
Provide Useful Measures of Financing Constraints? ", Quarterly Journal of
Economics, vol. 112, no. 1, pp. 169-215.
Kandah, A., 2008, " The Banking System in Jordan" Association of Banks in
Jordan, Avilable at:
http://www.abj.org.jo/AOB_Images/633638871969606250.pdf (Accessed,
July, 22, 2012,)
Khan, T. 2006, "Company Dividends and Ownership Structure: Evidence from UK
Panel Data", The Economic Journal, vol. 116, no. 510, pp. 172-189.
Kim, B., and G. Maddala (1992),"Estimation and Specification Analysis of Models
of Dividend Behavior Based on Censored Panel Data", Empirical
Economics, vol. 17, no.1 111-124.
Koch, A.S. and Sun, A.X. 2004, "Dividend Changes and the Persistence of Past
Earnings Changes", The Journal of Finance, vol. 59, no. 5, pp. 2093-2116.
Kraus, A. and Litzenberger, R.H. 1973, "A State-Preference Model of Optimal
Financial Leverage", The Journal of Finance, vol. 28, no. 4, pp. 911-922.
175
La Porta, R., Lopez-de-Silanes, F., Shleifer, A. and Vishny, R. 2000, "Investor
Protection and Corporate Governance", Journal of Financial Economics,
vol. 58, no. 1-2, pp. 3-27.
La Porta, R.L., Lopez-De-Silanes, F., Shleifer, A. and Vishny, R.W. 1997, "Legal
Determinants of External Finance", The Journal of Finance, vol. 52, no. 3,
Papers and Proceedings Fifty-Seventh Annual Meeting, American Finance
Association, New Orleans, Louisiana January 4-6, 1997, pp. 1131-1150.
Laeven, L. 2000,"Does Financial Liberalization Relax Financing Constraints on
Firms", The World Bank, Policy Research Working Paper Series. No. 2467.
Laeven, L. 2003, "Does Financial Liberalization Reduce Financing Constraints?",
Financial Management, vol. 32, no. 1, pp. 5.
Lang, L., Ofek, E. and Stulz, R. 1996, "Leverage, Investment, and Firm Growth",
Journal of Financial Economics, vol. 40, no. 1, pp. 3-29.
Leary, M.T. and Roberts, M.R. 2005, "Do Firms Rebalance Their Capital
Structures?", The Journal of Finance, vol. 60, no. 6, pp. 2575-2619.
Leland, H.E. 1994, "Corporate Debt Value, Bond Covenants, and Optimal Capital
Structure", The Journal of Finance, vol. 49, no. 4, pp. 1213-1252.
Lemmon, M.L., Roberts, M.R. & Zender, J.F. 2008, "Back to the Beginning:
Persistence and the Cross-Section of Corporate Capital Structure", The
Journal of Finance, vol. 63, no. 4, pp. 1575-1608.
Lemmon, M.L. and Zender, J.F. 2010, "Debt Capacity and Tests of Capital
Structure Theories", Journal of Financial and Quantitative Analysis, vol.
45, no. 05, pp. 1161.
Li, K. and Zhao, X. 2008, "Asymmetric Information and Dividend Policy",
Financial Management, vol. 37, no. 4, pp. 673-694.
Lintner, J. 1956, "Distribution of Incomes of Corporations among Dividends,
Retained Earnings, and Taxes", The American Economic Review, vol. 46,
no. 2, pp. 97-113.

176
Love, I. 2003, "Financial Development and Financing Constraints: International
Evidence from the Structural Investment Model", The Review of Financial
Studies, vol. 16, no. 3, pp. 765-791.
Lyandres, E. 2007, "Costly External Financing, Investment Timing, and
Investment–Cash Flow Sensitivity", Journal of Corporate Finance, vol. 13,
no. 5, pp. 959-980.
Martin, P. and Saadi-Sedik, T. 2006. "The Jordanian Stock Market--Should You
Invest in it for Risk Diversification or Performance?," IMF Working Papers
06/187, International Monetary Fund.
Merton H. Miller and Modigliani, F. 1961, "Dividend Policy, Growth, and the
Valuation of Shares", The Journal of Business, vol. 34, no. 4, pp. 411-433.
Merton H. Miller and Rock, K. 1985, "Dividend Policy under Asymmetric
Information", The Journal of Finance, vol. 40, no. 4, pp. 1031-1051.
Miguel, A. and Pindado, J. 2001, "Determinants of Capital Structure: New
Evidence from Spanish Panel Data", Journal of Corporate Finance, vol. 7,
no. 1, pp. 77-99.
Milton Harris and Raviv, A. 1991, "The Theory of Capital Structure", The Journal
of Finance, vol. 46, no. 1, pp. 297-355.
Mizen, P. and Vermeulen, P. 2005, "Corporate Investment and Cash Flow
Sensitivity: What Drives the Relationship?", European Central Bank
Working Papers, no. 485.
Modigliani, F. and Merton H. Miller 1958, "The Cost of Capital, Corporation
Finance and the Theory of Investment", The American Economic Review,
vol. 48, no. 3, pp. 261-297.
Moh'd, M.A. and Perry, L.G. 1995, "An Investigation of the Dynamic Relationship
between Agency Theory and Dividend Policy", Financial Review, vol. 30,
no. 2, pp. 367.
Moh'd, M.A., Perry, L.G. and Rimbey, J.N. 1998, "The Impact of Ownership
Structure on Corporate Debt Policy: A Time-Series Cross-Sectional
Analysis", Financial Review, vol. 33, no. 3, pp. 85.

177
Myers, S.C. 1984, "The Capital Structure Puzzle", The Journal of Finance, vol. 39,
no. 3, Papers and Proceedings, Forty-Second Annual Meeting, American
Finance Association, San Francisco, CA, December 28-30, 1983, pp. 575-
592.
Myers, S.C. 1977, "Determinants of Corporate Borrowing", Journal of Financial
Economics, vol. 5, no. 2, pp. 147-175.
Myers, S.C. and Majluf, N.S. 1984, "Corporate Financing and Investment
Decisions When Firms Have Information That Investors Do Not Have",
Journal of Financial Economics, vol. 13, no. 2, pp. 187-221.
Naceur, S., Goaied, M. and Belanes, A. 2006, "On the Determinants and Dynamics
of Dividend Policy", International Review of Finance, vol. 6, no. 1, pp. 1-
23.
OECD (2004), "OECD principles of corporate governance", available at:
www.oecd.org/dataoecd/32/18/31557724.pdf.
Oliner, S., Rudebusch, G. and Sichel, D. 1995, "New and Old Models of Business
Investment: A Comparison of Forecasting Performance", Journal of Money,
Credit and Banking, vol. 27, no. 3, pp. pp. 806-826.
Ozkan, A. 2001, "Determinants of Capital Structure and Adjustment to Long Run
Target: Evidence from UK Company Panel Data", Journal of Business
Finance and Accounting, vol. 28, no. 1, pp. 175-198.
Pandey, I.M. and Chotigeat, T. 2004, " Theories of Capital Structure: Evidence
from an Emerging Market", Studies in Economics and Finance, vol. 22, no.
2, pp. 1-19.
Petersen, M.A. 2009, "Estimating Standard Errors in Finance Panel Data Sets:
Comparing Approaches", Review of Financial Studies, vol. 22, no. 1, pp.
435-480.
Petersen, M.A., and Rajan R.G., 1997, "Trade credit: Theories and evidence",
Review of Financial Studies, vol 10, pp. 661–691
Qureshi, M.A. 2010, "Does Pecking Order Theory Explain Leverage Behaviour in
Pakistan?", Applied Financial Economics, vol. 19, no. 17, pp. 1365-1370.
178
Rajan, R.G. and Zingales, L. 1995, "What Do We Know about Capital Structure?
Some Evidence from International Data", The Journal of Finance, vol. 50,
no. 5, pp. 1421-1460.
Ratti, R.A., Lee, S. and Seol, Y. 2008, "Bank Concentration and Financial
Constraints on Firm-Level Investment in Europe", Journal of Banking and
Finance, vol. 32, no. 12, pp. 2684-2694.
Rauh, J.D. 2006, "Investment and Financing Constraints: Evidence from the
Funding of Corporate Pension Plans", The Journal of Finance, vol. 61, no.
1, pp. 33-71.
Renneboog, L. and Trojanowski, G. 2010 "Patterns in Payout Policy and Payout
Channel Choice", Journal of Banking and Finance, vol. 35, no 6, pp. 1477-
1490.
Report on the Observance of Standards and Codes (ROSC) (2004), ‘‘Corporate
governance country assessment’’, Jordan, available at:
www.worldbank.org/ifa/jor_rosc_cg.pdf
Roodman, D. a2009. "How to do xtabond2: An introduction to difference and
system GMM in Stata," Stata Journal, StataCorp LP, vol. 9, no 1, pp. 86-
136, March.
Roodman, D. b2009. "A Note on the Theme of Too Many Instruments," Oxford
Bulletin of Economics and Statistics, Department of Economics, University
of Oxford, vol. 71, no 1, pp. 135-158, 02.
Rousseau, P.L. and Kim, J.H. 2008, "A flight to Q? Firm investment and financing
in Korea before and after the 1997 financial crisis", Journal of Banking and
Finance, vol. 32, no. 7, pp. 1416-1429.
Rozeff, M.S. 1982, "Growth, Beta and Agency Costs as Determinants of Dividend
Payout Ratios", Journal of Financial Research, vol. 5, no. 3, pp. 249.
Rubin, A. and Smith, D.R. 2009, "Institutional Ownership, Volatility and
Dividends", Journal of Banking and Finance, vol. 33, no. 4, pp. 627-639.
Schaller, H. 1993, "Asymmetric Information, Liquidity Constraints, and Canadian
Investment", The Canadian Journal of Economics, vol. 26, no. 3, pp. pp.
552-574.

179
Schiantarelli, F., 1996, "Financial Constraints and Investment: Methodological
Issues and International Evidence", Oxford Review of Economic Policy, 12,
70-89.
Şen, M. and Oruc, E. 2008, "Testing of Pecking Order Theory In ISE (Istanbul
Stock Exchange Market)", International Research Journal of Finance and
Economics, , no. 21, pp. 1450-2887.
Shanikat, M and Abbadi, SS 2011, "Assessment of Corporate Governance in
Jordan: An Empirical Study" Australasian Accounting Business and
Finance Journal, vol.5, no.3,pp93-106.
Shleifer, A. and Vishny, R.W. 1997, "A Survey of Corporate Governance", The
Journal of Finance, vol. 52, no. 2, pp. 737-783.
Shleifer, A. and Vishny, R.W. 1986, "Large Shareholders and Corporate Control",
The Journal of Political Economy, vol. 94, no. 3, Part 1, pp. 461-488.
Shyam-Sunder, L. and C. Myers, S. 1999, "Testing Static Tradeoff against Pecking
Order Models of Capital Structure", Journal of Financial Economics, vol.
51, no. 2, pp. 219-244.
The Income Tax Law no. 57 of 1995, Jordan.
The Jordanian Banking Law No. 28 of 2000 article 40.
The Jordanian Companies law No. 22 of 1997.
Titman, S. and Wessels, R. 1988, "The Determinants of Capital Structure Choice",
The Journal of Finance, vol. 43, no. 1, pp. 1-19.
Tobin, J. 1969, "A General Equilibrium Approach to Monetary Theory", Journal of
Money, Credit and Banking, vol. 1, no. 1, pp. 15-29.
Wijst Van der, N. and Thurik, R. 1993, "Determinants of Small Firm Debt Ratios:
An Analysis of Retail Panel Data", Small Business Economics, vol. 5, no. 1,
pp. 55-65.
Wilcoxon, F. 1945, "Individual Comparisons by Ranking Methods", Biometrics
Bulletin, vol. 1, no. 6, pp. pp. 80-83.
180
Windmeijer, F. 2005, "A finite sample correction for the variance of linear efficient
two-step GMM estimators", Journal of Econometrics, vol. 126, no. 1, pp.
25-51.
Wiwattanakantang, Y. 1999, "An Empirical Study on the Determinants of the
Capital Structure of Thai Firms", Pacific-Basin Finance Journal, vol. 7, no.
3-4, pp. 371-403.
World Bank Data Base. http://data.worldbank.org/ [2012, June/ 8]
Yu, D.D. and Aquino, R.Q. 2009, "Testing Capital Structure Models on Philippine
Listed Firms", Applied Economics, vol. 41, no. 15, pp. 1973 - 1990.

Appendix
181
APPENDIX
A.1 DATA COLLECTION PROCESS
All data used for regression in this research are obtained from Amman Stock
Exchange (ASE) web site36. ASE website provides data for all of listed firms in
ASE, for example the web site includes data such as financial statements, financial
ratios, stock prices, trading statistics, etc37.
The data collection process as following:
1- I exclude all of financial firms.
2- I exclude all firms that merged or spilt during the sample period.
3- I exclude all of firms that bankrupted or delisted from the index during the
period38.
ASE website provides an excel sheet file for each firm, this file contains all of
financial statements (balance sheet, income statement, and cash flow statement )
for the all period in a unified form for all firms as following. So, each item of the
financial statements have same cell of excel sheets for all of firms in the sample.
For example, cell B65 contains the operating revenues for year 2008. Thus, cell
B65 in all of excel files for the other firms contains the operating revenues for year
2008. And cell C65 for year 2007 and the same thing for all year.
36The link for Amman Stock exchange web site is : http://www.ase.com.jo/ 37 I would like to thank Dr. Tareq Mashoka for his help in this section. 38 One may argue that the survivorship bias may exist. However, this is not the case in this research because there are very few companies bankrupted or delisted from the index during the sample period.

Appendix
182
To copy the data without any human error I use Visual Basic for Applications
(VBA). This method allowed me to avoid any error relating to data collection
process (i.e. copy the data from the excel files and place it in one common file). For
example, If I want to collect the operating revenues for all firms the steps will be as
follows:
I download all of excel files for the firms in the sample from ASE, the total number
of downloaded excel files equal to 85 files.
I save all of excel files in one folder.

Appendix
183
I open new excel file and open the VBA window and I wrote the following
command

Appendix
184
In this way the programme collect all data that we want from all firms and place
them in one common file. In this example the VBA open the excel file sheet for the
first firm and copy the data from cell B65 to cell J65, which covers the period from
year 2000 to year 2008 and paste them in the new excel file sheet. The second step
is that the programme close the first excel file for the first firm and open the excel
file for the second firm and do the same things above, and so on until it collect the
data from the last firm. After that the programme close itself and the new excel
sheet will be as following:

Appendix
185
The above method gives us the confidence that all data in this research collected
with accuracy. In addition, this method saves the time because it collects the data
quickly.

Appendix
186
A.2 SELECTED FINANCIAL RATIOS FOR ALL FIRMS LISTED IN
AMMAN STOCK EXCHANGE.
Some selected financial ratios for all sample firms, average for the period
2000/2008:
Financial Ratios
Turnover Ratio % 105.75
Earning Per Share (JD) 0.11
Dividend Per Share (JD) 0.09
Book Value Per Share (JD) 2.19
Price Earnings Ratio (Times) 69.82
Dividend Yield % 1.89
Dividends Per Share to Earning Per Share % 32.03
Price to Book Value (Times) 1.70
Gross Margin % 18.35
Margin Before Interest and Tax % 20.20
Profit Margin % 14.83
Return on Assets % 2.42
Return on Equity % -3.39
Debit Ratio % 28.90
Equity Ratio % 71.10
Interest Coverage Ratio (Times) 16.66
Total Assets Turnover (Times ) 0.57
Fixed Assets Turnover (Times) 2.78
Working Capital Turnover (Times) 4.40
Current Ratio (Times) 2.45
Working Capital (JD) 8263952