financial disclosure visual field interpretation in glaucoma handouts/danica... · visual field...
TRANSCRIPT
1
VISUAL FIELD INTERPRETATION IN
GLAUCOMA
Danica J. Marrelli, OD, FAAO
University of Houston College of Optometry
Financial Disclosure
I have received speaking and/or consulting fees from:
• Aerie Pharmaceutical
• Alcon Laboratories
• Allergan
• Carl Zeiss Meditec
Visual Field Interpretation
• Methods of Data Presentation
• Systematic Strategy for Interpreting Visual Field / Recognizing Visual Field Loss
• Diagnostic Criteria for Glaucoma
• Classification of Visual Field Loss
• Detecting Progression of Visual Field Loss
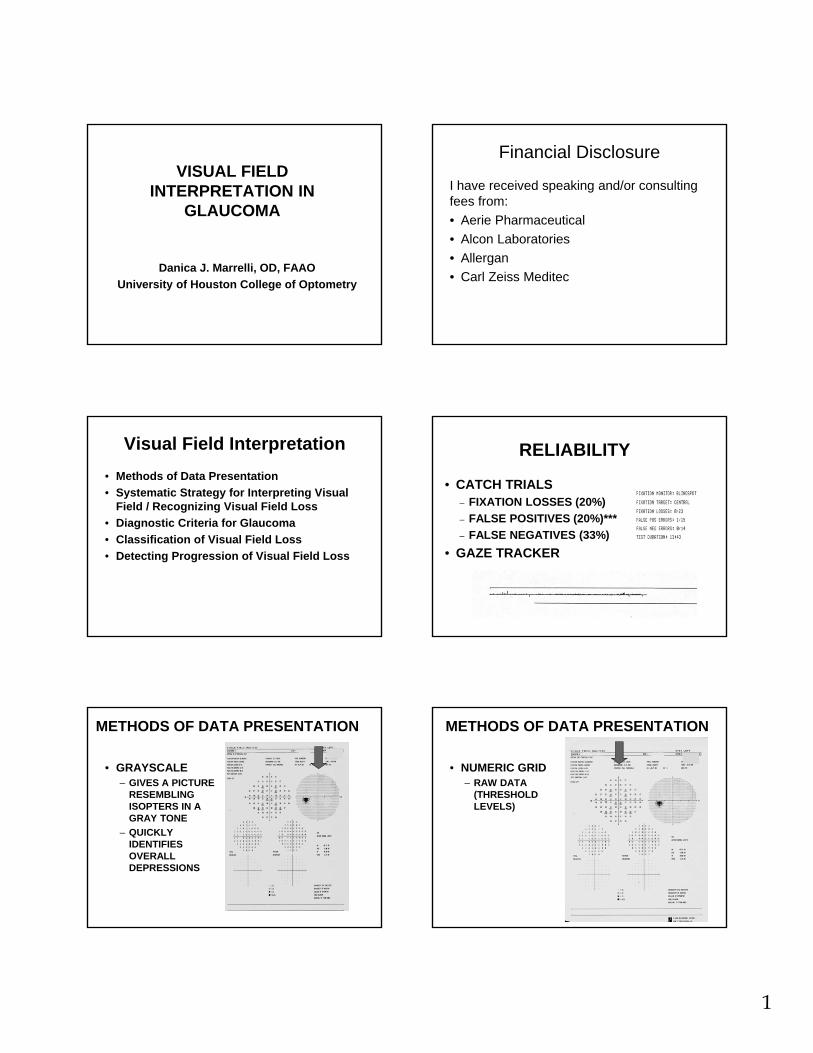
RELIABILITY
• CATCH TRIALS– FIXATION LOSSES (20%)
– FALSE POSITIVES (20%)***
– FALSE NEGATIVES (33%)
• GAZE TRACKER
METHODS OF DATA PRESENTATION
• GRAYSCALE– GIVES A PICTURE
RESEMBLING ISOPTERS IN A GRAY TONE
– QUICKLY IDENTIFIES OVERALL DEPRESSIONS
METHODS OF DATA PRESENTATION
• NUMERIC GRID– RAW DATA
(THRESHOLD LEVELS)

2
METHODS OF DATA PRESENTATION
• TOTAL DEVIATION PLOT– DIFFERENCE BETWEEN
PATIENT’S RESPONSES AND AGE-MATCHED NORMAL POPULATION
• TOTAL DEVIATION PROBABILITY PLOT– SIGNIFICANCE OF THE
TOTAL DEVIATION PLOT
METHODS OF DATA PRESENTATION
• PATTERN DEVIATION– ADJUSTS THE TOTAL
DEVIATION FOR THE OVERALL HEIGHT OF THE HILL OF VISION
– CAN BE ADJUSTED UP OR DOWN
• PROBABILITY PLOT
METHODS OF DATA PRESENTATION
• GLOBAL INDICES– SINGLE NUMBER
REPRESENTATIONS OF THE VISUAL FIELD
– OVERALL GUIDELINES TO HELP ASSESS FIELD
– PROBABILITY VALUES GIVEN WHEN NUMBERS REACH SIGNIFICANT VALUES

3
GLOBAL INDICES• MEAN DEVIATION (MD)
– HEIGHT OF THE HILL OF VISION COMPARED TO AGE-MATCHED NORMALS
• PATTERN STANDARD DEVIATION (PSD)– DEGREE TO WHICH THE SHAPE OF THE
VISUAL FIELD DIFFERS FROM REFERENCE FIELD
– DOES NOT CHANGE WITH MEDIA
Glaucoma Hemifield Test
• Mirror Image Analysis Compares Superior to Inferior Field– Within Normal Limits
– Borderline
– Outside Normal Limits
– Abnormally High Sensitivity
– General Reduction In Sensitivity
What’s the VFI???
INTERPRETATION OF THE AUTOMATED VISUAL FIELD
• RELIABILITY– MUST KNOW WHETHER OR NOT THE
DATA YOU ARE ANALYZING IS RELIABLE
• FIXATION LOSSES (20%)
• FALSE POSITIVES (20%)
• FALSE NEGATIVES (33%)
4
RECOGNIZING VISUAL FIELD DEFECTS
• GRAYSCALE: NOT APPROPRIATE FOR MAKING DIAGNOSIS
• MUST CONCENTRATE PRIMARILY ON THE DEVIATION PLOTS AND GLOBAL INDICES, SOME ATTENTION TO RAW (THRESHOLD) DATA
RECOGNIZING VISUAL FIELD DEFECTS
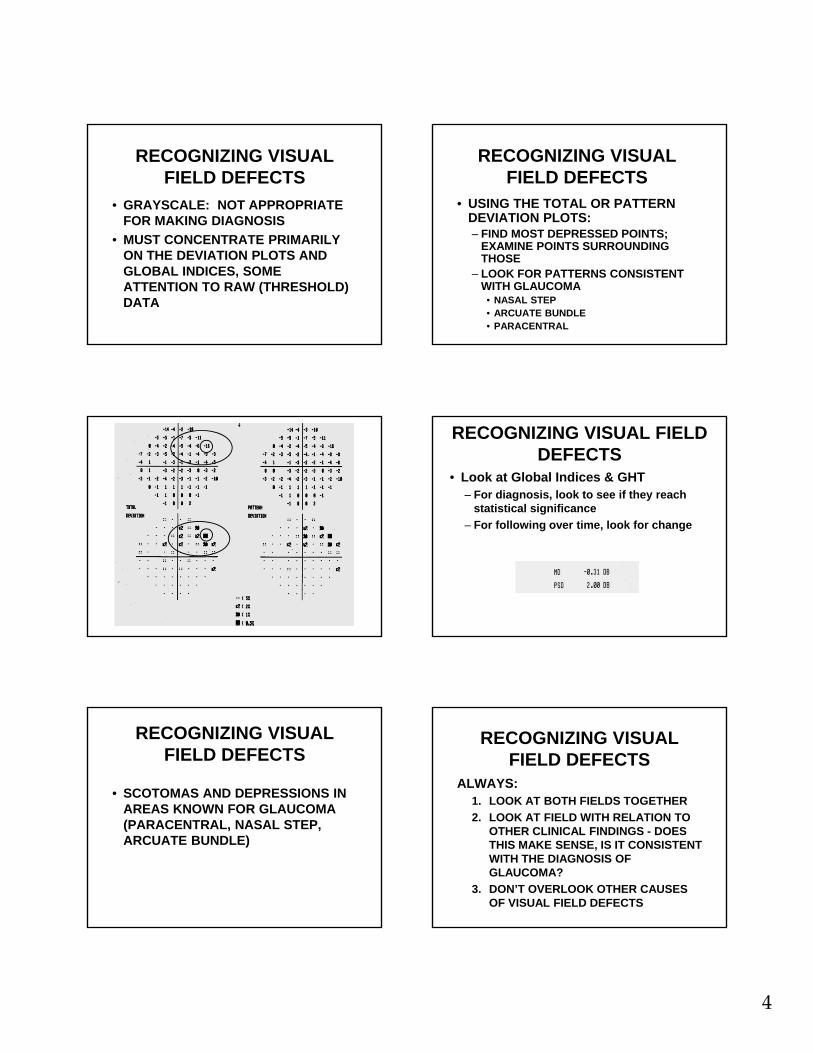
• USING THE TOTAL OR PATTERN DEVIATION PLOTS:– FIND MOST DEPRESSED POINTS;
EXAMINE POINTS SURROUNDING THOSE
– LOOK FOR PATTERNS CONSISTENT WITH GLAUCOMA
• NASAL STEP• ARCUATE BUNDLE• PARACENTRAL
RECOGNIZING VISUAL FIELD DEFECTS
• Look at Global Indices & GHT– For diagnosis, look to see if they reach
statistical significance
– For following over time, look for change
RECOGNIZING VISUAL FIELD DEFECTS
• SCOTOMAS AND DEPRESSIONS IN AREAS KNOWN FOR GLAUCOMA (PARACENTRAL, NASAL STEP, ARCUATE BUNDLE)
RECOGNIZING VISUAL FIELD DEFECTS
ALWAYS:1. LOOK AT BOTH FIELDS TOGETHER
2. LOOK AT FIELD WITH RELATION TO OTHER CLINICAL FINDINGS - DOES THIS MAKE SENSE, IS IT CONSISTENT WITH THE DIAGNOSIS OF GLAUCOMA?
3. DON’T OVERLOOK OTHER CAUSES OF VISUAL FIELD DEFECTS

5
Look At Both Fields Together Look At Both Fields Together
LOOK AT FIELD WITH RELATION TO OTHER CLINICAL FINDINGS
LOOK AT FIELD WITH RELATION TO OTHER CLINICAL FINDINGS
Predict the Visual Field…

6
Predict the VisualField…
KEY POINTS TO INTERPRETATION
• MAKE SURE YOU ARE LOOKING AT TRUSTWORTHY DATA
• WILL PROBABLY TAKE 3-4 TESTS TO ACHIEVE APPROPRIATE BASELINE
• MAKE SURE IT MAKES SENSE WITH OTHER CLINICAL FINDINGS
STRATEGY DECISIONS
• 30-2 vs. 24-2
• Size III vs. Size V
• 24-2 vs. 10-2
• SITA-Standard vs. SITA-Fast (vs. Threshold or FastPac)
30-2 versus 24-2 24-2 versus 10-2
7
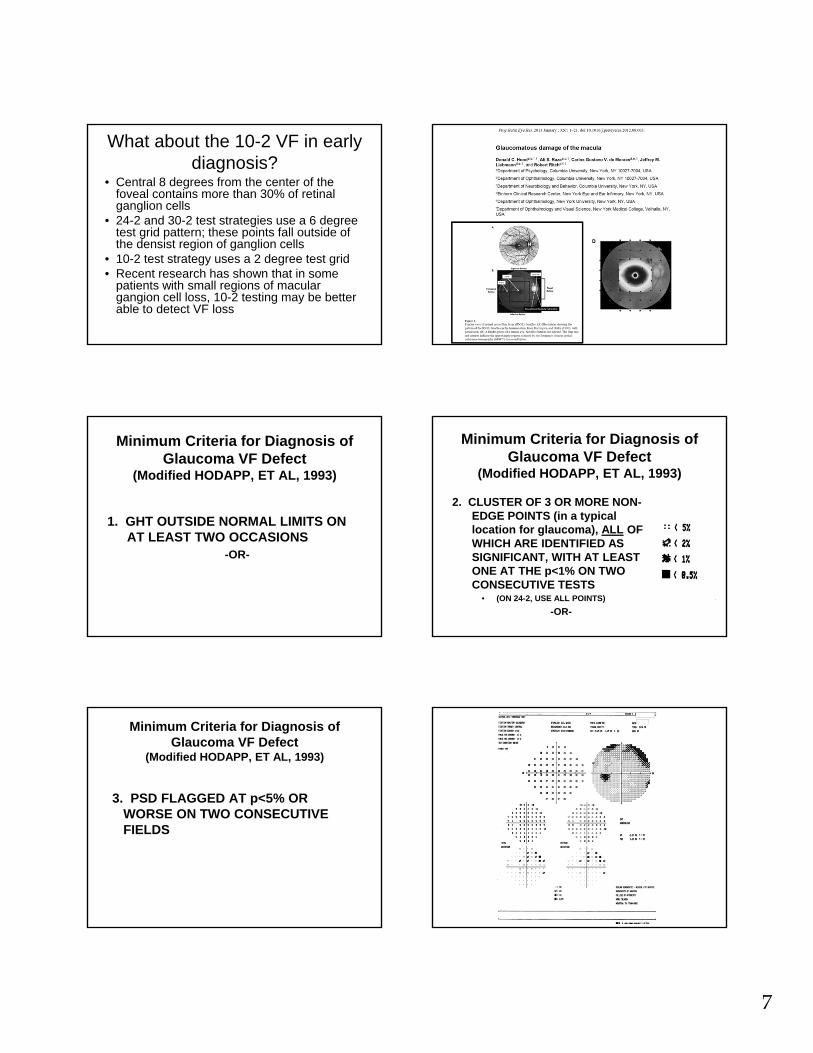
What about the 10-2 VF in early diagnosis?
• Central 8 degrees from the center of the foveal contains more than 30% of retinal ganglion cells
• 24-2 and 30-2 test strategies use a 6 degree test grid pattern; these points fall outside of the densist region of ganglion cells
• 10-2 test strategy uses a 2 degree test grid• Recent research has shown that in some
patients with small regions of macular gangion cell loss, 10-2 testing may be better able to detect VF loss
Minimum Criteria for Diagnosis of Glaucoma VF Defect
(Modified HODAPP, ET AL, 1993)
1. GHT OUTSIDE NORMAL LIMITS ON AT LEAST TWO OCCASIONS
-OR-
Minimum Criteria for Diagnosis of Glaucoma VF Defect
(Modified HODAPP, ET AL, 1993)
2. CLUSTER OF 3 OR MORE NON-EDGE POINTS (in a typical location for glaucoma), ALL OF WHICH ARE IDENTIFIED AS SIGNIFICANT, WITH AT LEAST ONE AT THE p<1% ON TWO CONSECUTIVE TESTS
• (ON 24-2, USE ALL POINTS)
-OR-
Minimum Criteria for Diagnosis of Glaucoma VF Defect
(Modified HODAPP, ET AL, 1993)
3. PSD FLAGGED AT p<5% OR WORSE ON TWO CONSECUTIVE FIELDS

8
1.
2.
3.
1.
2.
3.
CLASSIFICATION OF FIELD LOSS (Modified from Hodapp, et al)
• MILD (all 3 criteria must be met):
• FOR 24-2 SITA STANDARD– MD DEPRESSED BY <-5dB AND
– ON PD PLOT, <25% (14) POINTS ARE DEPRESSED BELOW THE 5% SIGNIFICANCE LEVEL and fewer than half of those points are depressed below the 1% LEVEL AND
– NONE OF CENTRAL FOUR POINTS HAS SENSITIVITY OF <20dB
14 points flagged5 points at 1% or worse
CLASSIFICATION OF VISUAL FIELD LOSS
• MODERATE (24-2 Sita)– MD -5dB TO -10dB OR
– ON PD PLOT, <50% (14-28) POINTS ARE DEPRESSED BELOW 5% LEVEL, OR 8-16 POINTS ARE BELOW THE 1% LEVEL OR
– CENTRAL POINTS BETWEEN 10-20dB IN ONE HEMIFIELD (NO POINTS IN CENTRAL 5 DEGREES WITH <10dB)

9
Moderate Loss
14 total9 below 1%
Moderate Loss
18 total 10 at 1% level
Moderate Loss
18 total9 at 1%
CLASSIFICATION OF VISUAL FIELD LOSS
• SEVERE (24-2 Sita)– MD DEPRESSED BY MORE THAN -10dB OR
– ON PD PLOT, GREATER THAN 50% (28) POINTS ARE DEPRESSED BELOW 5% OR MORE THAN 16 POINTS ARE BELOW THE 1% LEVEL OR
– BOTH HEMIFIELDS IN THE CENTRAL 5 DEGREES HAVE <20dB OR
– ANY POINT IN THE CENTRAL 5 DEGREES HAS A VALUE <10dB
Severe Loss
20 total17 at 1%
Severe Loss
22 total18 at 1%

10
13 points3 points <1%
INTERPRETATION TEMPLATE
• LOOK AT RELIABILITY
• LOOK AT CENTRAL LEVELS
• FOR VARIATIONS OF >4dB ACROSS HORIZONTAL MIDLINE NASALLY
• TOTAL / PATTERN DEVIATION PLOT -MOST DEPRESSED POINT AND SURROUNDING POINTS
• GLOBAL INDICES (MD, PSD, GHT, VFI)
FOR THE RECORD• ICD-10
• Specific test performed (24-2 SS)
• Statement with respect to reliability
• Statement with respect to location, size, density, and pattern of the defect
• Statement that correlates other examination findings with this visual field
• Statement about stability/progression (or words “BASELINE”)
• (Statement about how these results influence your management) ???
• Interpretation:– H40.11X3(POAG)
– 24-2 SS
– Reliable
– Severe loss: Large, dense inferior arcuate with small dense superior paracentraldefect, c/w superior notch and inferior thinning of ONH
– Baseline test
– Aggressive therapy indicated
• Interpretation:– H40.11X1
– 24-2 SS
– Reliable
– Mild loss: Small, shallow inferior nasal step/partial arcuate c/w superior>inferior thinning of ONH
– Baseline test
– Initiate therapy

11
Detecting Progression
• Glaucoma: A chronic, progressivedisease of retinal ganglion cells that results in characteristic optic nerve and retinal nerve fiber layer changes and corresponding visual field loss
Glaucoma Progression
“Once the diagnosis of glaucoma has been made, the MOST IMPORTANT remaining question is whether the disease is stable and the therapy/compliance are sufficient, or whether the disease is progressive and the therapy in relation to the life expectancy has to be intensified.”
Progression of Glaucoma, World Glaucoma Association, 2011 Kugler Publications
Progression of Glaucoma
“Although most glaucoma patients will show some evidence of progression if followed long enough, the rate of deterioration can be highly variable among them. While most patients progress slowly, others have aggressive disease with fast deterioration which can eventually result in blindness or substantial impairment unless appropriate interventions take place.”
WGA Consensus Statements on Structure & Function
• Both ON structure and function should be evaluated for detection of progression
• Currently, no specific test can be regarded as the perfect standard for determination of progression
• Progression detected by functional means will not always be corroborated using structural tests, and vice-versa
WGA Consensus Statements
• The use of standard automated perimetry as the sole method for detection of change may result in failure to detect or underestimation of progression in eyes with early glaucoma damage.
• Progressive structural changes are often but not always predictive of future development of or progression of functional deficits in glaucoma.
12
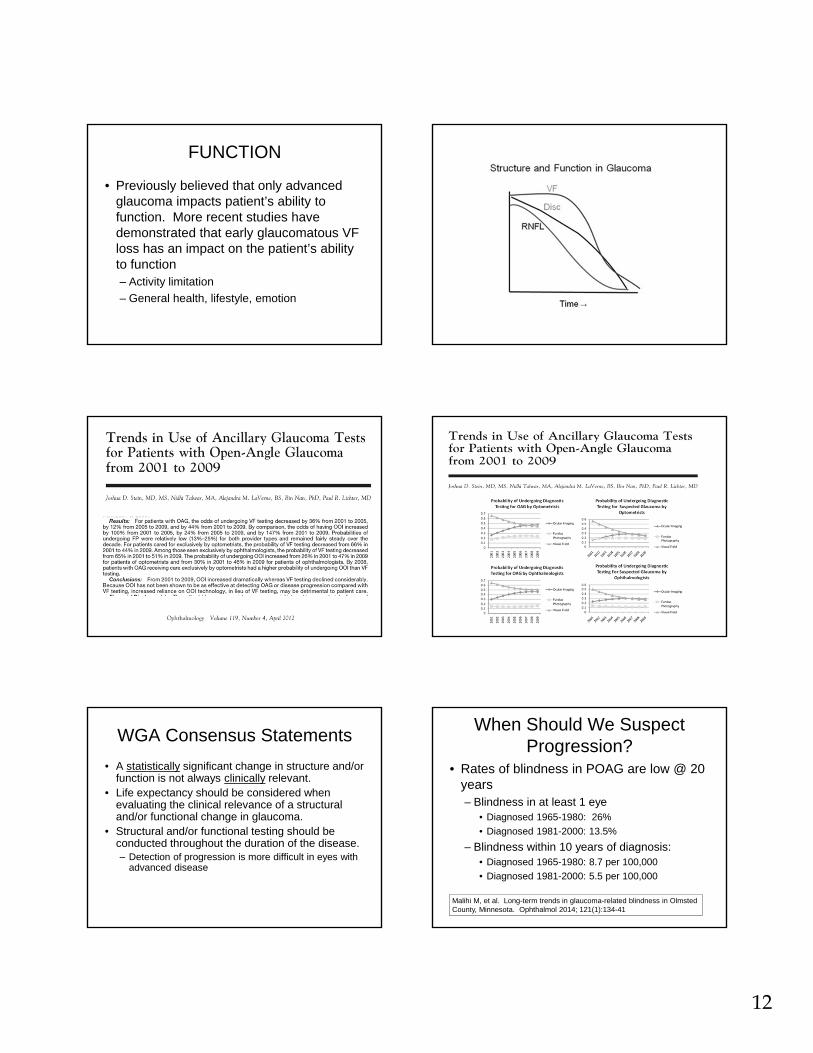
FUNCTION
• Previously believed that only advanced glaucoma impacts patient’s ability to function. More recent studies have demonstrated that early glaucomatous VF loss has an impact on the patient’s ability to function– Activity limitation
– General health, lifestyle, emotion
WGA Consensus Statements
• A statistically significant change in structure and/or function is not always clinically relevant.
• Life expectancy should be considered when evaluating the clinical relevance of a structural and/or functional change in glaucoma.
• Structural and/or functional testing should be conducted throughout the duration of the disease.– Detection of progression is more difficult in eyes with
advanced disease
When Should We Suspect Progression?
• Rates of blindness in POAG are low @ 20 years – Blindness in at least 1 eye
• Diagnosed 1965-1980: 26%
• Diagnosed 1981-2000: 13.5%
– Blindness within 10 years of diagnosis:• Diagnosed 1965-1980: 8.7 per 100,000
• Diagnosed 1981-2000: 5.5 per 100,000
Malihi M, et al. Long-term trends in glaucoma-related blindness in OlmstedCounty, Minnesota. Ophthalmol 2014; 121(1):134-41

13
Risk Factors for Progression
• Clinical risk factor assessment in glaucoma serves two roles:1. Prognostic information
2. A basis for disease management
• Risk factor assessment should take into account
1. The strength of the risk factor
2. The practicality & potential harm of reducing that risk factor
Risk Factors for Progression• Higher mean IOP
– Higher IOP fluctuations
• Thinner CCT in patients with higher baseline IOP
• Presence of pseudoexfoliation
• Presence of disc hemorrhage
• Older age
• Lower ocular perfusion pressure
• Advanced visual field at presentation
• Family history of glaucoma (1st degree relative)
IDENTIFYING VISUAL FIELD PROGRESSION
• Much more difficult than detecting loss
• Background of dynamic “noise”
• No algorithm uniformly agreed upon for detecting change
• Three main changes:– Deepening of defect
– Enlargement of defect
– New defect
IDENTIFYING PROGRESSION
• Long-term fluctuation– The single biggest problem in determining
progression
– Deeper defects: more long term fluctuation
– More advanced glaucoma: more long term fluctuation, more fatigue
IDENTIFYING PROGRESSION Progression of VF

14
Functional Progression - WGA
• Standard white-on-white automated perimetry (SAP) covering at least 24° is preferred
• Decisions on progression should NOT be made by comparing only the most recent VF with the one before.
• Suspected progression should be confirmed with repeat testing.
Frequency of VF Exams
• Baseline Data – first 2 years– At least 2 reliable VF within the first 6 months
• 3 within first 6 months when there is a high likelihood of visual disability
– At least 2 further VF within the next 18 months
– VF testing should be repeated sooner than scheduled if possible progression is identified
– SIX VF within the first 2 years allows the clinician to identify rapid progression
Frequency of VF Exams
• Follow-up data (after first 2 years)– Frequency of testing should be based on the
risk of clinically significant progression (based on extent of damage, life expectancy)
– In low- and moderate- risk patients, VF should be at least once per year
• Sooner if possible progression seen on VF –OR-on other clinically relevant observations
– In high risk patients, subsequent VF should be at least 2 per year
VF Progression: EA vs TA
• Event analysis (EA): change from baseline greater than a predefined threshold based on test-retest variability according to the level of damage
• Trend analysis (TA): rate of change over time; significance is determined by both the magnitude of change and the variability of the measurement

15
Event Analysis
Trend Analysis
Event Analysis
VF Progression: EA vs TA
• In general, event analysis is used for follow-up when fewer VF are available– When suspected progression is identified, at
least TWO further tests should confirm that
• In general, trend analysis (rate) is used later in the follow up (later than 2 years)
Functional Progression - WGA
“Use available software support. Subjective judgment of VF printouts is unreliable and agreement among clinicians is poor.”
GUIDED PROGRESSION ANALYSIS (GPA)
• Humphrey Field Analyzer– Based on results of GLAUCOMA patients
from mild to advanced disease
– Patients took 12 different visual field tests within a 4 week period
– Developed a model for what is “expected” test-test variation for patients with glaucoma
GPA
• Uses 2 baseline exams (any strategy)– Follow up tests must be SITA-Standard or SITA-Fast
(all same strategy)
• Symbols used on Follow Up Tests– Open Triangles– Half Triangles
• Messages– Possible Progression– Likely Progression
• Rate of Progression

16
Elements of GPA 1-Page Summary Report
•VFI (Trend Analysis)
•Baseline Tests
•Today’s VF (Event Analysis) The VFI Regression Plot
• VFI plotted against age• Extrapolates rate of change up to 5 years
HFA GPA VFI Summary - Interpretation at a Glance
The VFI Bar• historical and
projected VFI loss
Loss to date
Projected future loss 100%
HFA GPA VFI Summary - Interpretation at a
Glance
Sample: Progression Detected

17
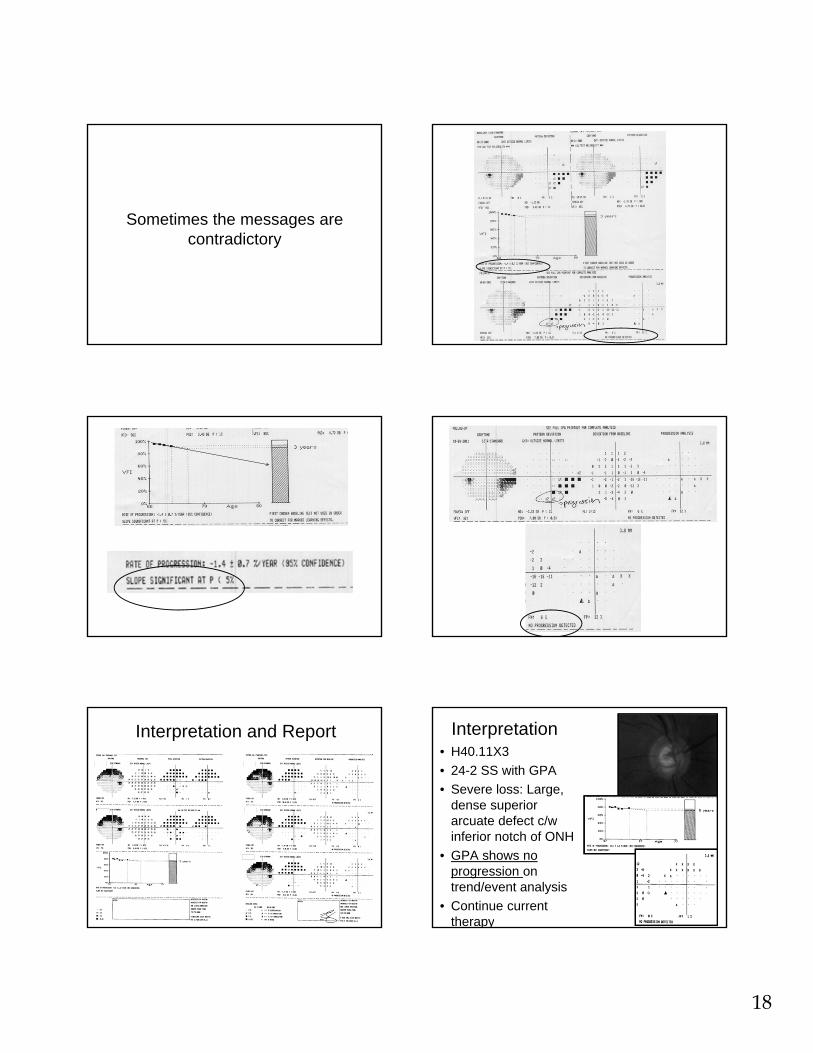
Sample: High LTF, No progression
18
Sometimes the messages are contradictory
Interpretation and Report Interpretation• H40.11X3
• 24-2 SS with GPA
• Severe loss: Large, dense superior arcuate defect c/w inferior notch of ONH
• GPA shows no progression on trend/event analysis
• Continue current therapy

19
Functional Progression - WGA
• Do not rely on VF reliability indices
• Stick with the same test throughout the follow-up period
• In advanced glaucoma, there may be a benefit to testing using a 10-2 strategy in a minority of patients.
Pearls for VF Progression –Event Analysis
• About 5% chance that a single point will fall outside the expected change on a single test– Much less likely that same point will do the
same in a subsequent test
– If point is in same region of VF as existing defect – much more likely to be “real” change
– Point in central 10 degrees exceeding expected change is much more likely to be “real” change
Alternatives to GPA• Non-parametric Analysis (MD, VFI, PSD)
– 3 baseline VF
– Suspected progression:• 1 field with MD worse than lowest MD of baseline
tests
– Possible progression:• 2 consecutive fields with MD worse than lowest
MD of baseline tests
– Likely progression:• 3 consecutive fields with MD worse than lowest
MD of baseline tests
>/= 3 >/= 3 >/= 3
1 field with MD worse than lowest of 3 baseline VF
2 consecutivefields with MD worse than lowest of 3 baseline VF
3 consecutivefields with MD worse than lowest of 3 baseline VF
SuspectedProgression
PossibleProgression
LikelyProgression
GPA
NPA
NPA can also be applied to PSD (for MDup to ~ -10dB) and/or to VFI
BASELINE
Follow-Up 1:No SuspectedProgression
Follow-Up 2:SuspectedProgression
Follow-Up 3:PossibleProgression

20
Alternatives to GPA
• Deepening of existing scotoma at 2+ points by 10+dB
• Expansion of 2+ points adjacent to baseline scotoma by 10+dB
• New scotoma– 2 or more adjacent points with p<1% on PD
probability plot
• Change of 1 point in central 10° of 10+dB in a previously normal location
Example
Drawbacks of GPA
• Cannot be used in advanced glaucoma
• Trend analysis may not be able to detect progression in patients with smaller paracentral scotomas (often limited to a single point)
21
22
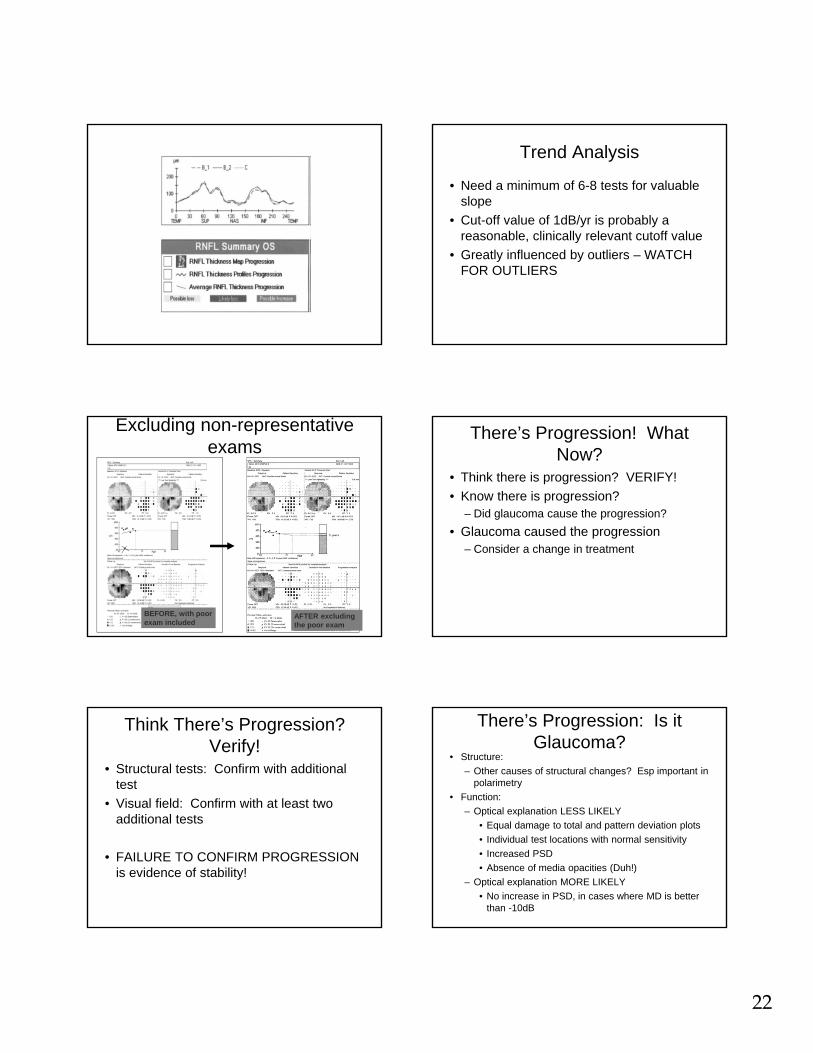
Trend Analysis
• Need a minimum of 6-8 tests for valuable slope
• Cut-off value of 1dB/yr is probably a reasonable, clinically relevant cutoff value
• Greatly influenced by outliers – WATCH FOR OUTLIERS
Excluding non-representative exams
AFTER excluding the poor exam
BEFORE, with poor exam included
There’s Progression! What Now?
• Think there is progression? VERIFY!
• Know there is progression?– Did glaucoma cause the progression?
• Glaucoma caused the progression– Consider a change in treatment
Think There’s Progression? Verify!
• Structural tests: Confirm with additional test
• Visual field: Confirm with at least two additional tests
• FAILURE TO CONFIRM PROGRESSION is evidence of stability!
There’s Progression: Is it Glaucoma?
• Structure:
– Other causes of structural changes? Esp important in polarimetry
• Function:
– Optical explanation LESS LIKELY
• Equal damage to total and pattern deviation plots
• Individual test locations with normal sensitivity
• Increased PSD
• Absence of media opacities (Duh!)
– Optical explanation MORE LIKELY
• No increase in PSD, in cases where MD is better than -10dB

23
Glaucoma Caused the Progression: Now What?
• Factors to Consider:– Compliance
– Glaucoma Stage
– Rate of progression/ time to “event”
– Location of scotoma
– Life expectancy of patient
– Patient preference
– Potential impact of next therapeutic step
New Baseline!!
• Every time a target IOP is adjusted or there is a significant change in the therapy, the tests need to be re-baselined – Last 2 tests that determined/confirmed
progression can be the new baseline exams
– Frequency of testing needs to increase again
Thoughts on Treatment• ASSESS COMPLIANCE!!!!
– Poor compliance: • Important conversation regarding compliance
• Emphasize importance of compliance
• May or may not need to lower target IOP
• Consider laser trabeculoplasty or surgery
– Good compliance:• Lower target IOP
• Added medication
• Laser trabeculoplasty or surgery
Thank you for your attention!
Questions?Email me: