financial exclusion and the geography of bank and building ... · measured ‘as the crow flies’....
TRANSCRIPT

1
Financial exclusion and the geography of bank and building
society branch closure in Britain
Andrew Leyshon*, Shaun French,* and Paola Signoretta**,
*School of Geography
University of Nottingham
Nottingham NG7 2RD
UK
([email protected], [email protected])
**Department of Geography
University of Sheffield
Winter Street
Sheffield
S10 2TN
April 2008

2
Financial exclusion and the geography of bank and building
society branch closure in Britain
Abstract
Financial exclusion refers to those processes by which individuals and households face
difficulties in accessing financial services, and is a product of broader social processes
such as neo-liberalization and financialization. Economic geography was an important
catalyst in developing research into processes of financial exclusion in the 1990s,
focusing initially on the geographies of physical access . This research was motivated by
a concern with the equity effects of financial systems, and identifiying a general process
of branch closure across industrial economies. This paper contains an analysis of the
changing geographies of bank and building society closure in Britain between 1995-2003
and reveals that closures continue to be disproportionately concentrated within poorer
areas. Despite this, the geography of financial infrastructure has been written out of UK
financial exclusion policy. The paper concludes by arguing that policy needs to take
greater account of the geography of retail financial services production and consumption,
particularly through the concept of the financial ecology.
Key words: Retail financial services industry, financial exclusion and inclusion, bank and
building society branches, public policy.

3
Financial exclusion and the geography of bank and building
society branch closure in Britain
I Introduction
In April 2005 customers of the HSBC bank in the former mining village of
Ogmore Vale, near Bridgend in South Wales were informed that their local branch was
to close within three months (Figure 1). The closure, part of the latest round of
‘network streamlining’ undertaken by the bank, was of the last bank branch in the village
and triggered the by-now familiar feelings of abandonment which have afflicted so many
communities across Britain. The inhabitants of Ogmore Vale, already reeling from two
generations of economic setbacks following the decline of the coal industry, were
understandably distressed by the decision, and concerned about the consequences of the
closure for the future of village as a whole. HSBC’s closure represented an economic
evaluation of the future of the community that was anything but positive. There was
particular concern that those on lower incomes and with limited mobility would now
have to travel much further to access branch services. Customers were justifiably put out
by the advice that, following the closure, they should ‘visit the nearest branch in
Pontycymer, less than three miles away’ (Walne, 2005). Viewed from an office in
London such advice seems sensible enough; as the crow flies, Ogmore Vale and
Pontycymer are about three miles apart. However, on the ground, the advice seems less
sensible; Ogmore Vale and Pontycymer may be located only three miles away from one
another in geographical space, but they are located within different valleys, the Ogmore
and Garw respectively. The urban population of the south Wales coalfield is laid out in
north-south ribbons, aligned with the river valleys within which pits were sunk into the
coal deposits below. As a result, the main roads and railways flow north to south,

4
following the rivers down to the coast and the ports that once shipped coal to
international markets. Therefore, while it is possible to travel between Ogmore Vale and
Pontycymer, to do so requires a journey of over six miles and involves navigating a
winding and hazardous B-road that creeps over the watershed that separates the two
valleys; buses are infrequent and there is no direct route as the journey cuts against the
grain of the north-south logic of the coalfield transport system (Figure 2). What might
appear in principle to be a straightforward three-mile journey becomes far more
problematic and time-consuming when the geographies and (im)mobilities of place are
taken into account.
-- Figures 1 and 2 about here --
The closure of HSBC in Ogmore Vale is but one recent footnote in a much
longer story of bank and building society branch rationalisation that has, over the past 20
years or so, seen the number of branches in Britain shrink by almost a third. As a
consequence Ogmore Vale and many other communities like it have been left without a
permanent bank or building society branch and have had to cope with the everyday
ramifications of financial abandonment. While such stories continue to arouse passions
within the local communities affected, financial infrastructure withdrawal is no longer the
political issue that it once was. In large part this is because branch closure is perceived to
have been solved as a political and practical problem in the early 2000s through the
development of basic bank accounts, the enrolment of the Post Office to provide
Universal Banking Services, and through a particular geographical framing of the
problem of access to financial services which has set space against place (French et al.,
2008). In the case of Ogmore Vale, the local, everyday contingencies of travelling the
more than six miles by way of winding B-road to reach Pontycymer (that is, place) are at
once displaced by HSBC’s insistence that the nearest branch is actually a distance of less
5
than three miles (as the crow flies) (that is, space). This insistence must be understood in
the context of the geographical politics of financial exclusion, and the manner in which
exclusion has come to be officially defined as a distance of more than four miles to the
nearest bank branch in areas like Ogmore Vale1.
The closure of branches is the most visible expression of processes of financial
exclusion and inclusion that are part of an ongoing renegotiation of the contract between
the citizen and the state. The post-war welfare model has waned with social insurance
becoming less significant with the commodification and privatisation of welfare
provision. In particular, responsibility for short-term income smoothing and long-term
financial security has been abandoned by the state and passed over firmly to the citizen
and the retail financial services sector. This new financial landscape has been forged by
at least two inter-related processes. First, the re-regulation of financial services has been
in the vanguard of processes of neo-liberalisation which have swept across market based
economies over the past 30 years or so. Initially, processes of neo-liberalism were
associated with the ‘roll back’ of the state (Peck and Tickell, 2002), as markets were
subject to processes of re-regulation to make them more open and competitive. The UK
financial system was remade in successive waves of regulatory reform from the late 1970s
onwards (Moran, 1991, 2003), and the financial services industry continues to be a key
bell weather for ongoing regulatory change. In particular, the Conservative government’s
neo-liberal programme of regulatory reform in the 1980s dismantled long standing
‘structural’ forms of industry regulation, which encouraged risk-aversion and ensured that
different retail financial markets remained institutionally distinctive, in favour of a more
1 In geographical terms, physical financial exclusion in the UK officially exists when the nearest bank branch is more than one mile away in urban areas, and more than four miles away in rural ones (French et al., 2008). This distance has been widely interpreted by banks, as in the case of Ogmore Vale, as being measured ‘as the crow flies’. This is notwithstanding a belated and long overdue change to the voluntary Banking Code, made on the advice of its independent reviewer, to make clear that from 2005 the distance should be measured ‘by road, not as the crow flies’ (Kempson, 2004, page 5; BBA, 2005).
6
‘prudential’ regulatory framework designed to encourage competition (Gardener and
Molyneux, 1990). Subsequently, neo-liberalisation has proceeded through new policies by
which states have sought to gradually abrogate responsibility for many areas of social life
which are now left to the market and to the agency of individuals and households. This
includes greater financial responsibility, and expectations of higher levels of financial
capability (French and Kneale, 2008). This has had the impact of generating significant
new markets for the financial services industry. Second, the process of neo-liberalization
has been accompanied by an empowering of financial markets, which has led some
commentators to argue that contemporary life is increasingly subject to a process of
financialization (Froud et al., 2000, Froud et al., 2001, Sinclair, 2005). Financialization is
seen to have agency at a range of scales, including higher levels of instability within the
economic system as a whole (2000b, Dore, 2000a) and pressure exerted on corporations
by capital markets (Sinclair, 2005). However, significantly, the process of financialization
also increasingly has uneven social impacts as it works its way through the financial
system and differentially connects individuals and households to wider financial
processes (Froud et al, 2005). In particular, retail consumers have been connected to
global financial markets as debt repayments are pooled and securitized to create
investment products that are sold to international investment institutions (Leyshon and
Thrift, 2008). In turn, securitization, and financialization more generally, has been
enabled by rapid innovations in information communication technologies, developments
which have also driven the emergence of telephony- and Internet-based retail financial
services delivery channels, the centralization of processing tasks, as well as the
replacement of traditional face-to-face systems of risk assessment and management with
sophisticated, at-a-distance credit scoring (Bailey and French, 2005; Burton et al., 2004;
French et al., 2005; French and Leyshon, 2004; Leyshon and Thrift, 1999; Marron, 2007;
Richardson et al., 2000). Taken together these developments have, since the late 1980s,
7
enabled banks and building societies to downgrade the role of the branch and
encouraged the rationalization of branch networks as a means of tightening control over
credit and risk, and to reduce costs.
This paper considers one aspect of the contemporary landscape of financial
exclusion and inclusion, the changing geography of bank and building society branches in
Britain. It does so because we argue that an understanding of the fate of the branch
provides an important lens through which to examine the wider terrain of financial
exclusion. The branch is a crucial material, symbolic and political expression of the
connection between financial institutions and their customers, and as such its geography
matters. More particularly, this paper reports on the findings of research undertaken by
the authors, the aims of which were two fold. First, to map, through the construction of
a dedicated geographical information system, the branch networks of the four largest
banks, the ten largest recently converted building societies, and the ten largest existing
building societies for the years 1995 and 2003, and to assess the changing size and
geography of these networks during this time. Second, to conduct an interview survey of
representatives of the firms in question, together with relevant industry bodies and
consumer organizations, to better understand the processes driving and shaping branch
rationalization programmes. Seventeen semi-structured, in-depth interviews were
conducted with: seven of the top 10 building societies; three of the top four banks; two
of the top 10 converted building societies; four leading industry bodies, and; a financial
consumer organization.
The remainder of the paper is divided into four parts. In part II we review
research which, over the last 10 years or so, has focused on the geographical dynamics of
retail financial services branches. Part III provides an analysis of the changing geography
of bank and building society branches in Britain between 1995 and 2003, and considers
8
the implications of our findings for debates concerning the role of branch closure in
processes of financial exclusion. In particular, our findings suggest that, in contrast to
other recent work in this area, net change in branch networks has generally been greatest
in more deprived and ethnically diverse areas and lowest in more affluent ones. In part
IV we then go onto identify four processes that help explain the geographical dynamics
of bank and building society branches in Britain. Part V concludes the paper.
II Branch networks and financial exclusion: A critical review
The branches of retail financial services institutions have been the subject of
academic work since at least the early 1990s. This work has been of two main kinds.
First, the branch has figured strongly in work from a broadly political economy
perspective, which has been concerned with the equity effects of financial systems; that
is, the distribution of financial outcomes – both positive and negative – across the
population as a whole. Second, the branch has featured in academic research from a
spatial modelling tradition, which has analysed the reorganisation of branch networks
against normative expectations of efficiency and optimisation. We will now briefly deal
with each of these kinds of work in turn.
The political economy of the retail financial services branch
Research on retail financial services branches from a political economy tradition
emerged out of concern with the equity effects of the restructuring of the financial
services sectors upon communities and localities. The range of issues captured by this
work, and in particular that which has focused on bank branch closure, have been
succinctly summarised by Argent (2002, page 319):
Individuals are forced to travel further to access face-to-face banking services, or
make arrangements for others to do their banking for them … businesses

9
experience increased costs and inconvenience in doing their own banking, and
often notice a loss of local trade as residents shop and conduct other business in
the nearest town with a branch; and the community suffers through the loss of
local employment and the out-migration of skilled bank staff and their families.
Work on such issues has now been conducted within a number of advanced economies,
the catalyst for studies of this kind was the research undertaken by economists Gary
Dymski and John Veitch on the financial dynamics of the Los Angeles economy (Dymski
and Veitch, 1992, 1996). Against a background of the neo-liberal reform of the US
banking system, and the potent racial politics of the Los Angeles metropolitan area, they
sought to illustrate the role of retail banking in the everyday construction of uneven
development in the urban environment. This initial foray into the socio-economic
consequences of financial dynamics and financial infrastructure was highly influential in
the emergence of a geographical literature on ‘financial exclusion’ in the UK in the mid-
1990s (Leyshon and Thrift, 1995, Leyshon and Thrift, 1993, Leyshon and Thrift, 1996).
Financial exclusion was understood as a process by which certain individuals, households
and communities were denied access to the financial system. This work was initially
concerned with closure of bank and building society branches – financial infrastructure
withdrawal – influenced as it was by the material evidence of large numbers of branch
closures taking place against the background of regulatory reform and a more
competitive market (Leyshon and Thrift, 1994). Empirical research on the
reorganisation of bank and building society branch networks in Great Britain between
1989 and 1995 revealed that almost one in five (19 per cent) of bank and building society
branches open in 1989 were closed by 1995. In addition, 16 per cent of bank branches
10
were downgraded to sub-branches over the period.2 Parallel research that focused on
the branch networks of building societies alone (Marshall et al., 1997, Marshall et al.,
2000, Willis et al., 2001) identified similar processes, but also noted a distinctive regional
dimension to building society branch closures which were concentrated ‘predominantly
in the north and west of the country’ (Marshall et al, 1997, page 286).
By the late 1990s, work which focused on the reorganisation of retail financial
services branches was also being undertaken in economies such as Canada (Bowles,
2000) and Australia (Argent, 2002). Bowles focused on the impact of large scale mergers
upon the rural branch networks of Canadian banks, and discovered that 75% of rural
communities in his case study province of British Columbia were classified as either
being ‘moderately’ or ‘highly’ vulnerable to closures according to a Bank Closure
Vulnerability Index (Bowles, 2000, page 33). Meanwhile, Argent revealed that the
number of bank branches in Australia declined by over 20% between 1981 and 1998
(Argent, 2002, page 319). Both studies confirmed Leyshon and Pollard’s (2000)
proposition that the wave of bank branch closures sweeping industrialised economies
was the product of an international process of learning, and the adaptation of a set of
industrial and organisational ‘conventions’ of how to manage change within the retail
financial services sector. Moreover, Bowles and Argent also revealed that the outcomes
of such conventions vary over space and, in particular, according to the nature of the
institutional context in which they unfold. Thus, in both Canada and Australia, the
existence of a richer and more varied ‘financial ecology’ – such as a vibrant credit union
sector, for example – lessened the impact of bank branch closure compared to
economies such as the UK which has a notoriously thin and centralised mix of financial
institutions (Pratt, 1998, Leyshon et al., 2004).
2 The description ‘sub-branch’ was applied to branches that were tied to other larger branches and not directly included in the clearing system. It denotes branches with fewer functions and less independent
11
Modelling the retail financial services branch network
A second body of work focusing on the geography of financial services branches
emerged from a more applied, modelling tradition. While it would be too strong to argue
that this work is part of the newly emerging insurgent and progressive quantitative
analytical movement (Sheppard, 2001, Plummer and Sheppard, 2001), the work is
informed at least in part by the concerns raised in the 1990s over financial exclusion. For
example, Morrison and O’Brien locate their development of a site location model for a
New Zealand bank firmly within the financial exclusion literature (Morrison and O'Brien,
2001). Bank branch closure in New Zealand proceeded quickly during the 1990s, as the
number of branches fell by over 34% between 1993 and 1998 alone (page 306).
Morrison and O’Brien argue that accounts of the geographical location methods used by
the banking industry are missing from extant accounts of financial exclusion but are
significant because ‘these methods have an important role in enhancing our
understanding of how customers are affected by branch closures, quite apart from the
direct use banks may make of them’ (page 304). In their model, Morrison and O’Brien
assume that banks will base their branch closure decisions on current transaction levels
alone. The absence of social considerations from the parameters of such models means
that the closure of branches can have regressive effects on levels of access to bank
branches. However, Morrison and O’Brien recognise it ‘would take an ideological shift
for banks in New Zealand (either singly or jointly) to take into consideration these
distributional impacts just for the sake of being socially responsible’ (ibid.), even though
they would be of interest to public bodies and agencies concerned with issues of financial
and social exclusion. They conclude by arguing that the closure of branches, on the
grounds of transactions at least, has the capacity to exacerbate financial exclusion.
control.

12
A second example of this kind of study also transfers techniques more usually
applied to analysis of store location to a study of the financial services sector (Birkin et
al., 2002). This model, developed as part of a study to optimise the efficiencies of
mergers and acquisitions within the UK retail financial services sector, also includes an
analysis of the distribution of bank branches and the geography of bank branch closures.
A key argument running through their analysis is that the decisions made by banks and
other financial institutions in planning closures, after mergers and acquisitions where
institutions close branches to realise efficiency savings, are rather crude and simplistic.
Like Morrison and O’Brien, Birkin et al. consider work on financial exclusion in their
analysis, which they see as bringing a regulatory context into focus that retail financial
institutions, at least in the UK, have to take into account in the restructuring of their
branch networks, due to the government’s interest in social and financial exclusion since
1997. However, they point out that evidence to support the argument frequently made
in the financial exclusion literature that the propensity for bank branch closures is highest
in low income areas and lowest in high income areas is equivocal at best. Thus, at a
national level, they find no correlation between the patterns of existing branches and the
socio-demographic characteristics of the population, although at a less aggregated spatial
scale – derived from a study of Sheffield – there was evidence of lower levels of
provision within less affluent areas, but this was counterbalanced by evidence of low
provision in some affluent areas too. Similarly, they argue, the relationship between
social status and branch closure is equally equivocal. An analysis of branch closures
between 1998 and 2000 revealed that while evidence can be found for high rates of
branch closures in the poorest of areas, ‘there are [also] localities where the same rate of
reduction has occurred, but in areas where almost 80% of the population are in the
higher social groups’ (Birkin et al., 2002, page 309). However, Birkin et al were able to
point to a marked urban-rural divide both in branch provision with the ‘urban residential
13
population … twice as well served as their rural counterparts’ (page 305), although the
rate of closure between the two areas was almost identical between 1998 and 2000.
Therefore, work on the geography of bank branch closures has argued that the
process has significant impacts, not least because branch closure is a physical
manifestation of financial exclusion that draws attention to its uneven geographical
incidence. As such, and as Marshal (2004) has argued, it reveals the ‘interlocking nature
of financial exclusion where many of the factors associated with exclusion are intimately
tied up with the dynamics of the local economy, and the ways in which local labour and
housing markets work to segregate the disadvantaged spatially’ (page 244). However,
despite its geographical lineage academic work on financial exclusion has more recently
downplayed the importance of space and place. For example, in a review of the financial
exclusion literature, Devlin (2005) goes so far as to argue that it ‘is apparent that the
debate surrounding financial exclusion has moved on markedly from it initial focus on
location-based exclusion’ (page 77). In turn, the dilution of concern with geography in
such debates has taken place against the background of the gradual erasure of the
problem of physical access to financial services as a political issue (French et al, 2008)
and an increase in the volume and diversity of work in the field of financial exclusion.
There has indeed been a significant growth in work of financial exclusion since
the mid 1990s, much of it from non-geographers. One of the most important sites for
the production of such work has been the Personal Finance Research Centre (PFRC) at
the University of Bristol. The work undertaken by the PFRC has produced a large
number of studies of the social consequences of financial exclusion in recent years, and
this output is significant for at least three reasons. First, for its close attention to the
processes of financial exclusion, which has been revealed as more nuanced and
variegated than hitherto believed. While the earliest geographical studies were concerned
14
in the main which what might be described as ‘access exclusion’, it is now recognised that
to this must be added at least four additional forms of financial exclusion: ‘condition
exclusion’, ‘price exclusion’, ‘marketing exclusion’, and ‘self-exclusion’ (Kempson and
Whyley, 1999). Secondly, this body of research is significant because it has suggested
that the impact of branch closure on financial exclusion is, at best, negligible. In
particular, Kempson and Jones (2000, page 46) estimated ‘that only 1.5 to 2 per cent of
the total population in Britain lives so far from a bank branch that it poses them real
difficulties’. (We shall return to this important intervention later in the paper). Third,
and finally, this research is significant because not only is it policy-focused but it has also
become influential within the process of making policy on financial exclusion. And in
doing so, the limited consideration of space and place within such reports has been
echoed within government policy towards financial exclusion more generally; that is,
branch closure and the form of access exclusion that accompanies it is not a subject that
policy should primarily address.
However, as has been argued elsewhere (French et al, 2008), the erasure of bank
and building society closure from UK financial exclusion policy is a classic example of
regulatory capture, whereby the industry has been able to bend policy objectives to its
own interests so that branch closure has been written out as a legitimate policy concern.
Moreover, as we shall illustrate in the next part of the paper, the geography of bank and
building society branches still matters, notwithstanding the arguments that have been
made elsewhere, because there is a link between rate of closure and the socio-economic
characteristics of areas; branches are being closed at a faster rate in poorer areas than
they are in more affluent areas.
15
III. The Changing Geography of British Bank and Building Society
Branch Networks, 1995-2003
This part of the paper presents the findings of research which updated to 2003 an
earlier study which mapped the changing geography of bank and building society
branches between 1989 and 1995. The data confirmed that the branch networks of both
banks and building societies had been in a continuous process of decline since at least the
late 1980s. This decade and a half of branch network shrinkage was initially triggered by
problems sown by financial services firms during the mid- to late-1980s as they adjusted
to increased levels of competition following the re-regulation of the sector. But it has
also been a product of the growth of new distribution methods which now supplement
the branch as a channel for the sale and purchase of retail financial products and services,
and subsequent changes in the ways in which many customers access retail financial
services.
Despite the relative decline in the strategic importance of the branch to banks
and building societies, and the marginalisation of the branch within financial exclusion
policy within the UK, the branch has been identified as an important bulwark against
financial exclusion within policy documents by the government itself (PAT 14/HM
Treasury, 1999). Initiatives such as the basic bank account and the decision to pay social
benefits into bank accounts have confronted banks with a significant dilemma. That is,
how to address the Government’s insistence that low income customers (who rely upon
branch networks) are served while at the same time seeking to adjust to a changing
competitive landscape, which is driving branch closure and relocation?
Intended to enable the ‘unbanked’ to take a first step into the mainstream retail
financial system, ‘Basic bank accounts [were designed to] allow the same banking
transactions that are available to current account holders (deposits can be made and
16
direct debits instructed) but other services are restricted, so withdrawals are only
permitted if enough funds are available, debit card availability is limited and chequebooks
are never offered’ (Midgley, 2005, page 278). However, as the government admits in a
recent policy document on financial exclusion,
the basic transaction costs for low-income customers are higher because they are
heavier users of branches, making them even less likely to generate profits for the bank.
Therefore, most banks do not see basic bank accounts as a commercial
opportunity (HM Treasury, 2004, page 29, emphasis added).
This dilemma also confronts building societies, because some of the largest societies are
also involved in the delivery of basic bank accounts and even those societies not offering
basic bank accounts will be affected because of the potential for additional enquiries at
branches and call centres. Moreover, the pressure to close branches is particularly
problematic for building societies because, by their very nature, they are organizations
that ‘have long taken the challenges of financial exclusion very seriously; most societies
began in response to their members being excluded from affordable housing finance’
(Dayson, 2004, page 8).
The changing size of bank and building society branch networks between 1989-
1995 and 1995-2003 is illustrated in Table 1. During the period 1989-2003 banks closed
36% of their branches. In comparison, the closure rate for building societies was less
than half that of banks, with 17% of branches closed, while the top ten converted
building societies closed 22% of their branches over the same period. And etween 1995-
2003, banks closed 22% of their branches, compared to 19% of converted building
societies and 5% of building societies branches. Comparison of yearly average closure
rates for the period 1989-1995 and 1995-2003 reveals further marked institutional
differences. Whereas the average yearly rate of closure for former building societies
17
quadrupled from 0.6% per annum between 1989-1995 to 2.4% per annum between
1995-2003, and decreased only marginally for banks from 3.0% per annum between
1989-1995 to 2.8% between 1995-2003, the closure rates for building societies more than
halved during the same period, falling from 2.1% per annum between 1989-1995 to just
0.6% between 1995 to 2003. As we shall discuss later, an important explanation for such
unevenness in branch rationalisation is corporate governance: public limited companies
are under greater external financial pressures to reduce costs and improve profits.
*** Tables 1, 2 and 3 about here ***
However, during our interviews, several senior managers in banks suggested that
since 2000-2001 large scale bank branch rationalisation had effectively been put on hold.
Although closures have continued to take place since 2000-2001, respondents suggested
that they were mostly the result of ‘natural wastage’, citing the end of property leases,
problems with making individual branches compliant with the Disability Discrimination
Act and other procedural reasons for closure, rather than formal rationalisation
programmes. Nevertheless, evidence also emerged during the research that from 2005
onwards some banks began to introduce small-scale, phased closure programmes which
went beyond natural wastage. Branch rationalisation emerged as an important
contemporary concern for building societies which, in comparison to banks, had
generally made smaller reductions in their branch networks.
The changing geography of bank and building society branches can be assessed in
a number of ways. For example, it is possible to analyse the rate of closure between 1995
and 2003 by Standard Region for Great Britain (Table 2). It reveals that higher than
average rates of closure were experienced in the South West, North West, Yorkshire and
Humberside, and Northern regions. Thus, while the majority of regions with higher than
average rates of branch closure are outside the more prosperous Southern economy of

18
Britain, regions such as Scotland and Wales experienced lower than average rates of
closure, while the South West – for the most part an economically buoyant regional
economy, if one excludes the extreme South West of the region – has one of the highest
rates of closure. While the regional context is important, analyses at this scale are too
sweeping and fail to take account of sub-regional geographical differences that influence
decisions about the viability of branches.
An alternative measure is to analyse bank branch closure against a metric of social
wellbeing, such as the Index of Multiple Deprivation. This data, collected at ward level,
is a composite index based on levels of: income; employment; health deprivation and
disability; education, skills and training; housing, and; geographical access to services. An
analysis of bank and building society branch closure by wards classified into deciles of
the Index of Multiple Deprivation is presented in Table 3. It reveals that there is a broad
relationship between branch closure and the relative depravation of wards, with the
highest rate of branch rate closure experienced in the most deprived wards decile, while
the lowest rate of closure was experienced in the third least deprived wards decile. The
average rate of closure in the five most deprived ward deciles was 21%, compared to only
16.8% in the five least deprived ward deciles. While this analysis draws attention to a
potential relationship between levels of deprivation and branch closure it strips out all
other geographical context that might explain the process.
For this reason we will now focus on an analysis of bank and building society
branch closure measured against the geodemographic characteristics of census wards.
Wards were classified using the Office of National Statistics (ONS) 2001 Area
Classification of ‘supergroups’ (see Table 4 for a definition of supergroups; (to see a map
of all UK wards by ONS supergroups go to:
http://www.statistics.gov.uk/about/methodology_by_theme/area_classification/wards/
19
downloads/wards_supergroups.pdf) see also Vickers and Rees, 2007, for a review of the
methodology used to create the output area classification). We adopted this form of
geographical aggregation for the following reasons. First, the project was in part
longitudinal, and utilised data originally collected during the 1990s which considered the
changing geography of bank and building society branches between 1989 and 1995
(Leyshon and Thrift, 1997). This project had also used utilised geodemographic
classifications as the spatial index of branch network change consistent with an attempt
to develop a reverse location model that would be able to predict future branch closures
by attempting to simulate the branch location decisions being taken by banks and
building societies. This was predicated upon at least three factors: proximity to that
institution’s own branches; proximity to competitor institutions’ branches, and; the
geodemographic characteristics of the local area. Clearly, such a model is not without its
limitations, given that financial institutions enrich geodemographic data with their own
proprietary customer and product data. However, the fact that geodemographic
understandings of space are prevalent within contemporary business location decisions
provides a justification for their use in this analysis.
*** Tables 4 about here ***
Table 5 shows the rate of branch closure by ONS supergroup. The mean rate of
branch closure across all areas between 1995 and 2003 was 20%. However, rates of net
closure varied between the supergroups, with five supergroups having closure rates
higher than average, while three experienced below average closure rates. The areas with
branch closure rates higher than average were ‘urban’ in type. The highest rate of branch
closure (-23.6%) was experienced in Multicultural metropolitan areas, and above average
rates of branch closure were also found in the following supergroup categories: Prospering
20
metropolitan (-22.4%), Traditional manufacturing (-22.3%), Built up areas (-22.3%) and Student
communities (21.2%).3
Multicultural metropolitan areas – mainly located in Greater London and Lancashire
– , traditional manufacturing areas, and built-up areas all share higher than average levels of
unemployment. Prospering metropolitan areas, mainly to be found in London and other
major cities, and student communities, spread throughout England and Wales, and the south
west of Scotland, are characterised by a high proportion of one person households.
*** Table 5 about here ***
*** Table 6 about here ***
Multicultural metropolitan areas are characterised by, amongst other things,
higher than average levels of unemployment rates and a far higher than average
proportion of people identifying themselves as Black, Indian, Pakistani or
Bangladeshi. Prospering metropolitan areas are concentrated in London, and include
wards located in other large cities such as Manchester and Glasgow. Defining
characteristics of these areas compared to the national average include a high
population density, plus a high proportion of one person households, flats,
residents born outside the UK, people with a higher education qualification and,
ironically, people who work in the finance industry. Traditional manufacturing areas
are concentrated in the traditional manufacturing belt of Britain, the south of
Scotland, northern England and parts of Wales. A typical area is the Longbridge
ward in Birmingham. As in the case of multicultural metropolitan areas, traditional
manufacturing wards are characterised by unemployment rates far above the
3 Due to the low numbers of branch openings in the Accessible Countryside supergroup the margin of error was such that these data were considered to be insufficiently robust for analysis. Therefore, Accessible Countryside areas have not been considered in this paper. The data is presented in Table 3 for information purposes only.
21
national average, but also an unusually high proportion of people working in
routine occupations, rented public and terraced housing. Built-up Areas, as defined
by the ONS, are mainly concentrated in Scotland, but also includes areas in parts of
Wales and England. These are areas of relative poverty, with the following
variables being far higher than the national average: (non-pensioner) one-person
households; unemployed people; household spaces rented from the public sector;
people of a working age suffering from limiting long-term illness; and people who
are separated or divorced. Finally, student communities are distributed throughout
England, parts of Wales, and the south west of Scotland. Places such as Fishergate
in York, Westgate in Canterbury are the most typical wards in this supergroup.
Variables with a proportion far above the national average include: households
with one person (who is not a pensioner); people with a higher education
qualification; people who are students; household spaces rented from the private
sector.
At the opposite end of the spectrum were areas which had lower than average
rates of branch closure between 1995 and 2003: these areas were suburbs and small towns (-
16.9 per cent), coastal and countryside (-17.0 per cent) and industrial hinterlands (-18.6 per
cent). Thus, in contrast to those areas that suffered higher than average, which were
urban in character, the areas that experienced lower than average rates of closure were
mainly small towns, suburban and rural areas. Moreover, the three geodemographic
areas with closure rates below the national average have no socioeconomic variables that
are far below, or indeed far above the national average. They can, therefore, be
considered for all intents and purposes to be ‘Middle England’; that is, archetypical
middle class areas, albeit ones that extend beyond England into Scotland, Wales and
Northern Ireland. The suburbs and small towns supergroup is comprised of three sub-

22
groups: suburbs, prospering suburbs and commuter suburbs, and is widely distributed
throughout England and Scotland (see Figure 3). Places such as Wootton in Bedford,
Bishop’s Stortford All Saints and Sawbridgeworth in East Hertfordshire are typical wards
in this supergroup. Coastal and countryside wards are evenly located throughout the UK,
apart from the south east of England, where they are mainly absent. The third and final
supergroup with a lower than average closure rate was industrial hinterlands, comprising
two sub-groups, ‘out of town housing’ and ‘industrial’ areas. Industrial hinterland wards
are concentrated in south Wales, southern Scotland and northern England, are again
characterised by a large number of socioeconomic variables close to the national average.
Industrial hinterland areas were probably less affected by branch closure it due to the fact
that these areas had already been pruned of most of their branches during the first wave
of closure in the period 1989 to 1995.
How do these findings compare with the research that has previously been
conducted on branch closure? While it is difficult to make exact comparisons, it is clear
that bank branch closure rates in Britain during the 1990s have been at least comparable
to those of Australia (Argent, 2002) and New Zealand (Morrison and O’Brien, 2001);
that is, similar Anglo-American, neo-liberalised economies. However, the one notable
exception in this regard, at least since 2000, appears to be the United States itself. As we
shall discuss in more detail later, a growing body of anecdotal evidence suggests that US
banks have been opening branches at a growing rate throughout the 2000s, although it is
not clear whether such openings have led to an increase in the net stock of branches.
While the contraction of branch networks of bank and building societies in
Britain in the face of aggressive rationalisation programmes since the late 1980s is
accepted by researchers and policymakers alike, the assumption that branch closure
programmes are disproportionately concentrated in deprived areas has been more
23
recently questioned. As we have seen, Birkin et al. (2002) failed to find a clear link
between closure and low income, while the findings of Kempson and Jones (2000) have
been widely used to question the correlation between financial exclusion and branch
closure in deprived areas. In contrast, our findings provide stronger evidence to support
the contention that net change in branch networks has generally been greatest in more
deprived and ethnically diverse areas, and lowest in more affluent ones. With regard to
the impact of branch closure on the communities in question, our research suggests that
on the whole it is indeed the most vulnerable communities that bear the brunt of branch
rationalisation programmes and as such we would argue that at the very least there is a
need to look again at current conventions which assume a weak link between closure and
financial exclusion. This reconsideration is all the more urgent given that our research
also found that competitive pressures in retail financial services, in the wake of neo-
liberal regulatory reform and deepening financialization, continue to drive banks, and to a
lesser extent building societies, to ever more actively reposition their branch assets away
from underperforming toward more lucrative geographical markets. It also urgent for
two further reasons. First, and as we shall make clear later, the role of the Post Office as
a cornerstone of financial exclusion policy is increasingly open to question. This is due
not only to growing contradictions within its assigned role in the wake of the contraction
of branch networks as a solution to the problem of geographical access, but also in terms
of underwriting what Midgley (2004) has argued are constrained and particularistic forms
of inclusion. Second, and equally important, the assumption that financial exclusion is
only weakly related to branch closure is also contestable. While the research of
Kempson and Jones (2000) has been mobilised to help erase branch closure as political
problem, a closer reading of their work reveals that is more equivocal than has hitherto
been acknowledged in policy circles. The detail of the Banking Without Branches report
highlights the very real problems that emerge in the wake of financial services

24
infrastructure withdrawal (French et al. 2008). In particular, attention to the findings of
the eight in-depth case studies Kempson and Jones conducted – rather than merely the
findings of the large scale questionnaire survey, which was widely reported at the time –
reveals evidence of significant problems of access in the three most deprived areas, “with
about a quarter of the people interviewed saying that the bank branch was difficult to use
or they relied on someone else to do their banking for them” (Kempson and Jones, 2000,
page 51). Similarly, a more recent comprehensive study of the processes and effects of
financial exclusion in the deprived, West End area of Newcastle-upon-Tyne discovered
that a majority of the multiple money problems identified by local people “related to
issues concerning bank and building society provision in the study area” (Fuller et al.
2006, page 265). More specifically, these problems reflected the fact that “large scale
withdrawal of (primarily) bank branch infrastructure … has occurred since 1983 in areas
of [the] West End, amounting to a 69 per cent loss in bank and building society branch
provision” (Fuller et al., 2006, page 265).
In contrast to the received position on the impact of branch closure, the work of
Fuller et al. (2006) and a more considered reading of Kempson and Jones (2000)
provides evidence to suggest that branch closure is indeed a significant issue for
vulnerable communities in precisely the kinds of areas we identify as experiencing the
highest rates of net closure. Moreover, the case of the closure of the HSBC branch in
Ogmore Vale, with which we introduced the paper, highlights the disjuncture that now
exists between dominant understandings of financial exclusion in industry and policy
circles, and the realities of branch closure as experienced on the ground. This disjuncture
has much to do with the way in which financial inclusion policy - as currently scripted -
serves to underplay local effects by setting space (financial exclusion measured in terms
of absolute distance from the nearest branch) against place (local accounts and material

25
experiences of financial exclusion). In so doing not only does financial exclusion policy
serve to de-legitimise the sorts of local problems that are made visible by in-depth, case
study research, but more generally it serves to neutralise the problem of location based
exclusion and the legitimacy of thinking about financial exclusion geographically (French
et al. 2008). However, as Marshall (2004) has stressed and Fuller et al. (2006) make clear
the relationship between branch closure and financial exclusion cannot simply be read
off from the measurement of absolute distance to the next or nearest remaining branch;
rather, it will depend on the interlocking of local economic, social, and political
geographies. The local dynamics of physical topography, road network and limited
public transport provision have conspired in the case of Ogmore Vale to greatly
exacerbate the detrimental impact of branch closure for a community already struggling
to cope with economic decline. Similarly, in offering an explanation of the much higher
incidence of problems of access in the three most deprived areas studied, Kempson and
Jones (2000) also cite the problems of local public transport and the make up of the
populations of the areas in question, in particular, a high concentration of people who
find travel difficult – the elderly, women with young children, and those with disabilities,
etc.. Critically then, not only does it appear that the poorest and most vulnerable
communities are experiencing the highest rates of net branch closure, but these studies
provide evidence to suggest that it is these very same communities for which the impact
of branch closure is most severe.
IV. Explaining branch closure.
An analysis of the findings of the second strand of our research, semi-structured
interviews with leading representatives of financial services firms, industry bodies and
consumer organizations, makes it possible to identify at least four inter-related processes
that have an influence on the changing geography of bank and building society branches
26
in Britain. These are: corporate governance; branch closure policy; new socio-economic
geographies, and; new distribution channels. We will now discuss each factor in turn.
Corporate governance: As we have seen, rates of branch closure are, on average, higher for
public limited companies than for mutually owned organisations. A good illustration of
the impact that governance has upon branch networks are those former building
societies that gave up mutuality during the mid-1990s and/or were taken over by public
companies. Between 1989 and 1995, as building societies, these organisations closed on
average less than 4% of their branch offices. However, between 1995 and 2003, the
period during which demutuality was at its peak, these organisations closed over 20% of
their branches4. Overall, the rate of closure among converted building societies
approached that of traditional retail banks. Conversely, the rate of branch closure among
building societies slowed over the period; the 10 largest building societies closed almost
20% of their branches between 1989 and 1995, the rate of closure falling to below 7%
between 1995 and 2003 (Table 1). One interpretation of the faster rate of closure –
frequently put forward by opponents of branch closure such as the Campaign for
Community Banking Services (CCBS) – is that public companies are under more
pressure to make the costs savings that branch closures can deliver as they are driven by
the necessity of producing value for shareholders.
[Bank A has]… thrown a lot of money at technology in branches, … [and] when I
go and speak to them they say, ‘Well we’re giving it … 18 months; if it doesn’t
work, we might have to do something different, because the analysts and the media
crawling all over our figures and saying you’ve got to get a bigger performance’.
[Bank B] are … a global bank, but the UK’s cost income ratio is totally out of sync’
with the rest of the group. They say they pick up 33% of the costs in the UK, but
27
only deliver 25% of the profit … they’ve got to do something about it, which is
why they have embarked on a [new] branch closure programme. (Derek French,
Chair, Campaign for Community Banking Services, Interview, 2005)
Such pressures, some of our respondents argued, led to banks closing not merely
branches that were losing money, but also profitable branches although, crucially, not
sufficiently profitable for them to remain open. For example: consider this exchange
with an executive of a UK bank:
Interviewee: Every branch that we closed was actually making money, but
wasn't making enough money, so your return on your investment wasn't high
enough
Interviewer: … so they were all profitable then?
Interviewee: They were all profitable, there wasn't any that were losing any
money. But you may only make … a couple of hundred thousand pounds a year
on one of those units whereas really you should be talking about making a couple
of million pounds a year. So we closed down a unit where we were making
£200,000 and we opened a unit where we're making £2 million and you do 10 of
them and you're increasing your profit by £80 million in a year.
(Converted Building Society A, Interview, 2005)
Many Building Societies, meanwhile, are seeking to exploit their organisational
structure by revaluing their branches and even using them as part of a marketing strategy
that enables them to be differentiated from banks. As one respondent put it:
Building societies are closing branches at a much slower rate than banks. [T]he
general view amongst building societies is that the branch network is valuable for
4 Only two of these organisations increased the size of the branch networks over the period, although in the case of the at least one of these this was mainly due to the incorporation of the branches of a smaller organisation

28
member relations … customers value the personal contact. That’s not universally
so but it tends to be the case that building societies … keep their branches open
for both financial and non-financial reasons. There are some societies who say …
it’s a sort of badge of honour that they would not close a branch, particularly if it’s
the last branch in a community … (Industry Organisation B, Interview, 2005).
However, as the figures illustrate, building societies have been engaged in a long run
process of branch reduction, albeit at a slower rate, as they struggle to reconcile being
mutually owned organisations within a highly competitive market for retail financial
services. Moreover, we recognise that there are significant variations within each of these
categories, and that some banks, for example, have closed relatively few branches in the
2000s (see below).
Branch closure policies: There exists a more or less general convention of evaluation that
banks and building societies use to assess the performance of their branches. Branch
performance is continuously assessed, usually as part of a formal annual review. The
failure of a branch to meet its targets initiates a series of interventions. These range from
discussions with branch management about such failures, through new investments
and/or the installation of a new management team, to the closure of the branch. The
level of intervention will depend on two main factors: first, the perceived nature of the
local market – that is, its prospect of supporting a successful branch – which is assessed
with the help of what are known as ‘branch planning services’, which are provided by
market research companies such as CACI, and GIS tools, which are provided by a range
of consultancies, and; second, the perceived deficiencies of the branch in question.
However, the vigour with which such interventions are pursued varies markedly from
institution to institution. As indicated above, the likelihood of closure is on average
greater for public limited companies than for building societies. However, as alluded to
29
below, there was evidence from interviews that, despite the accelerating rate of branch
closure since 1995, many banks are also now beginning to reconsider the value of their
branches. Such reconsideration can be partially explained by the very fact that banks, in
particular, have been able to shed the rump of their worst performing branches.
However, two other factors emerged which help to explain the relative renaissance of the
branch. The first is a belated recognition of its continued importance, not only in spite
off, but because of the growth of at-a-distance forms of delivery and the consequent
commoditisation of simple retail financial products, particularly as part of a competitive
strategy for maximising the cross-selling of high value products (see, for example,
KPMG, 2006):
branches [are] an opportunity for cross-selling other products and certainly if you
go into bank branches they’re quite different to how they use to be and they are
very much more a sort of financial services supermarket rather than somewhere
you just get your money out or whatever … But I think the customer service
element and the competition now is such that … [banks] can not afford to tell
their customers, ‘Sorry we’re closing your branch’, you know, ‘Like it or lump it’
… they have to offer … multi-channel delivery. (Industry Organisation A,
Interview, 2005)
Thus, there is a belated recognition of the opportunities branches offer for the creation
of ‘sticky places’ (Markusen, 1996) in increasingly ‘slippery’ retail financial space . The
ability of branches to anchor financial institutions to geographically rooted assets was
graphically illustrated by the catastrophic failure of Northern Rock in 2007. The former
Building Society turned ‘mortgage bank’ sought to grow its retail business despite its
relatively limited branch network by accessing funds available on wholesale banking
markets which were transformed into mortgages and their repayments securitized and
30
sold off to investors. When the inter-bank market all but ground to halt in the summer
of 2007 as the full consequences of the US sub-prime mortgage crisis became clear, the
bank’s principal mode of funding dried up, causing it to fail and being nationalized by the
UK government. Northern Rock had grown rapidly since its conversion to a bank in the
late 1990s, and made much of its innovative business model, which enabled it to capture
a share of the UK mortgage market that was much larger than would have been possible
through the recycling of its branch-based retail desposits alone. However, as liquidity
evaporated from the inter-bank market, its retail base was unable to support the bank’s
commitments (which was of course exacerbated by the first run on a UK bank since the
19th century, as the remaining branches that it did have were besieged by customers
looking to withdraw cash as the news of the bank’s insolvency were made public).
The second and related factor is the powerful discursive influence of an ongoing
branch renaissance in the United States (The Economist, 2004). Just as previous
innovations in retail financial services have rapidly migrated across the Atlantic (Leyshon
and Pollard, 2000) so the de novo branch phenomena in the US (Council on Financial
Competition, 2007) has influenced thinking on branches in Britain:
Interviewee: The States are opening branches at a phenomenal level … 2,000
over the last three or four years … I don't think we'll get to that [level] but they're
just opening branches … you know, these prefab things.
Interviewer: So why are they doing that?
Interviewee: Because … compared to the UK, I think they're underbanked. But
I think banking – it's like sheep really – everybody followed each other on the
Internet banking, closed branches, the Internet coming in, ‘Oh shit we're wrong
there’! Now we're concentrating on branches again and I think in the [United]

31
States it's, ‘God they're opening branches! So we'll [British banks] open branches!’
(Bank C, Interview, 2005)
While it would be naïve to think that the large scale branch closure programmes that
characterised the late 1990s and early 2000s are now entirely a thing of the past – the
announcement of large scale closures by the Clydesdale in 2005, for example, cautions
against reaching such a conclusion – previous predictions of the imminent demise of the
branch should be considered as somewhat premature.
New socio-economic geographies: Many financial institutions are dealing with the legacy effects
of earlier rounds of branch network construction. Most of Britain’s leading financial
institutions have regional origins (Pratt, 1998), which means that many still have branch
networks which are heavily skewed towards their region of origin. Therefore, over the
past 10-15 years or so banks, but especially building societies, have been faced with the
uncomfortable task of closing numerous branches within regions with which they are, or
have traditionally been, associated. This has produced significant negative reputational
effects in some cases. A number of building society representatives admitted to being
reluctant to close unprofitable ‘local’ branches as the negative publicity they would
generate, especially given the perceived conflicts with mutuality status, would more than
outweigh the potential economic savings:
As a building society we have some emotional-type issues and some mutuality-
type issues about how aggressive you can be in driving down costs through the
branch network, because we rely on our membership to support us … In
[Society’s home City] … we have 14 branch offices … which is a pretty
impressive offering of branch representation … And you go back to the
mutuality debate and the conversions [building society de-mutualisations] and
one of our lines, which is absolutely true, is that if we were a bank we'd be closing

32
all these branches, there's no way that we'd have 14 branches in [home City] as a bank.
And [banks have] demonstrated it that they are closing branches where we are
maintaining our presence (Building Society C, Interview, 2005, emphasis added).
It was clear that this Chief Executive would have liked to rationalise the number of local
branches, but did not want to incur the local reputational damage such a closure
programme would generate. Nevertheless, changes in the social and economic
geographies of British society have meant that for many financial institutions, a
significant number of their branches are ‘in the wrong place’. For them, closure
programmes are part of a geographical restructuring exercise that seeks to ensure that
their branch networks reflect these new social and economic geographies. This involves
redirecting their assets away from economically struggling communities, where aggregate
demand is falling, and towards new, more prosperous communities, where market
opportunities are greater. As one senior manager responsible for his bank’s branch
networks put it,
… the social and economic geography of [some places have] changed absolutely
fundamentally, and yet as a bank one is expected still to be there because it’s
actually always been there … it’s a bit like a Post Office … people are very
emotionally attached to it. And certainly sometimes when we … have [undertaken]
closures … people living in particular places can see … life kind of ebbing away
from their town, and almost when the bank goes that’s the final [straw]. And it isn’t
the bank that’s killed the town, the town is actually now fulfilling a different
function, and activity is now elsewhere. And so to me it would seem absolutely
perverse to expect that 1,500 plus branches would always stay in exactly the same
place because life, the community, the geography, is changing so rapidly … In
33
many respects … we’re so far behind this curve that actually there’s some catching
up to do. (Bank B, Interview, 2005)
There is some evidence to back up claims that the geography of branches lags behind
that of population. For example, Table 4 compares the share of population and branches
by geodemographic supergroup. Significantly, the areas that experienced below average
rates of branch closure – that is, Suburbs and small towns, Coastal and countryside and Industrial
hinterlands – remained underrepresented in their share of branches given their share of the
population as a whole. Meanwhile, many of the more urban areas that experienced
higher than average rates of bank branch closure between 1995 and 2003 had a much
larger than expected share of total branch networks given their share of the total
population. However, it is important to note that this over-representation in urban areas
is to some extent explained by the proximity of these areas to city centres which contain
many branches that also serve geographically distributed populations, rather than just the
populations that live closest to them. A further reason why Suburbs and small towns remain
underrepresented in their share of branches is the inability of financial services firms to
open in these locations due to planning restrictions. As a representative a leading
building society pointed out:
At the moment we’re looking at certain locations where we’d love to … open a
branch, if we could actually find a location that we could buy. There are certain
areas [where] we’ve been banging our heads trying to find suitable sites … So it’s
not a case of not wanting to be in those places … [we can’t open a branch] unless
another financial institution closes in that area; the zoning and the local council
don’t want too many financial [branches] in the streets, so [if] a café or a restaurant
[closes], you’ve got to get it reclassified to be able to open it as a financial

34
institution, which means physically there’s a limit to where you can go (Building
Society E, Interview, 2005)
Therefore, although the geography of net branch closures was uneven between 1995-
2003, these differences may have been even greater had not local planning regulations
prevented financial services firms from opening branches in many small towns and
suburban locations.
*** Table 4 about here ***
Use of branches and new distribution channels: The accelerating rate of branch closure after
1995 was influenced by the normalisation of new distribution channels introduced to the
retail financial services sector and changes in the ways in which customers used branches.
The use of the telephone as a distribution channel was developed within the British retail
financial services industry during the 1980s and became common-place during the 1990s.
From the late 1990s onwards, the Internet became an additional distribution channel for
retail financial products (French et al. 2004). Both these developments were frequently
cited in interviews with key informants in bank and building societies as factors which
not only mitigated any negative social and economic consequences of branch closures,
but also partly contributed to closures in that it took business away from the branch.
Indeed, some institutions reported a steady fall in the volume of business through
branches, with one even issuing a ‘use or lose it’ challenge to its customers in regards to
some of its branches. But the ability to use the telephone and Internet to mitigate the
impact of branch closure is highly uneven across the population as a whole, as there are
cost and cultural barriers to the use of these media among many financial services
customers; for such people, they are not a direct substitute for face-to-face contact with
staff in a branch.
35
Perhaps the most significant new distribution channel for financial services has
been neither the telephone nor the Internet but the partial integration of the Post Office
into the British financial services industry. As part of a campaign against financial
exclusion, the government marshalled the Universal Banking Agreement with the 16
largest banks and the largest building society, which required these institutions to
introduce Basic Bank Accounts for low income customers (French et al, 2008; Midgley,
2005). To facilitate the availability of such accounts to poorer communities, particularly
those that might have been affected by earlier rounds of bank branch closures, such
services were made available at Post Offices. Moreover, under further government
pressure, some leading retail banks and building societies – have signed distribution deals
with the Post Office to provide counter services for their regular personal customers.
However, during interviews, the growing integration of the Post Office with the
retail financial system was identified as problematic, in at least two regards. Firstly, it was
cited by some respondents as a potential factor in driving further bank branch closures.
As one respondent argued:
It does cost the banks significant amounts of money to make an arrangement with
the Post Office and so they do it on a competitive basis, where they think their
customers will really value it. But, you know, if I were a bank who had made that
investment … I’d be looking at my branch network [because] there is an obvious
read-across there [for potential closures]. (Industry Organisation A, Interview,
2005).
That is, banks could see Post Office branches as effective substitutes for their own
branches, which could be taken into account in future rounds of branch closure. This
might not matter if such services were universally available at Post Offices, given their
current geographical distribution and the fact that the Post Office network is made up of
36
approximately 14,500 outlets. However, the Post Office is itself undergoing a radical
branch closure programme, a programme that has reduced its network down from
18,400 branches in 1999 (Midgley, 2005), with a further loss of 2,500 branches by 2009
announced in May 2007. Moreover, some banks and building societies refuse to allow
the Post Office to distribute their products on competition grounds.
The reason for this is the second problem, which is the emergence of the Post
Office as a direct competitor to banks and building societies following the introduction
of Post Office-branded financial products as part of a joint venture with the Bank of
Ireland. Our research suggests that this development has deterred some banks and
building societies from signing full distribution deals with the Post Office:
… the Post Office is another area where we take grief because we haven't entered
into agreement and again, you know, why should we allow our customers to go
into Post Offices? Yes it might be convenient for some people but we've got a
large network, but also now you expose customers to Bank of Ireland products!
… [Bank C] customer go[es] in, does a transaction, [then is asked] would you like
a Bank of Ireland savings product? (Bank C, Interview, 2005)
This form of opposition to sharing counter services with competitors is pervasive within
the retail financial services sector, due to the strong commitment to branches as
expressions of their brand and service culture. It was echoed by the almost universal
hostility expressed in interviews to the idea of the ‘white label’, or shared, branch which
has been proposed by the Campaign for Community Banking Services (CCBS). The
CCBS have proposed that, following the closure of the last branch within a community, a
white label branch be established to act as a transaction agent for banks and building
societies, in much the way that the Post Office acts currently for those financial
institutions with which it has a distribution deal (see

37
http://www.communitybanking.org.uk/report_whitelabel.htm). However, during our
discussions, it emerged that banks and building societies were uneasy with such a
proposal as it would represent a loss of control over their products at the point of
distribution. The strength of this opposition suggests that both the idea of the white
label branch and the extension of the Post Office’s role as a transaction agent is likely to
be highly problematic and not entered into voluntarily by the banking and building
society industries.
V Conclusions
One of the defining features of academic and policy debate on financial exclusion
over the past few years has been the relative absence of considerations of space and
place, despite the fact that such considerations underpinned the developmet of the
concept in the mid 1990s. Understanding the geography of access to mainstream retail
financial services within contemporary societies remains as essential as ever, not least
because many economic exchanges are now mediated via financial institutions through
direct transfers between accounts. Without access to the financial system, individuals
and households may find it more difficult and expensive to pay bills, while the lack of
access to products such as insurance denies them the opportunity to shield against risk.
In this sense, having access to a full range of financial services at a competitive price may
be taken to indicate ‘financial citizenship’ (Dymski, 2005). And having local physical
access to a financial institution remains important here because not only are the
populations of the most vulnerable communities some of the least mobile and most
reliant on the vagaries of local public transport systems (Kempson and Jones, 2000), but
they are also likely to experience much greater money problems than ‘prime’ customers
which are best rectified by direct engagement with financial services providers, and
include: problems with direct debits and bank charges; problems with the availability or
38
otherwise of credit; problems with the cost of credit; and repayment problems (Fuller et
al. 2006). Branches also remain important because, as is implicitly recognised by the
decision to re-evaluate the role of the branch by banks and building societies alike, face-
to-face contact remains significant for providing advice. Moreover, physical access to a
local branch remains important not least because of the problems associated with
alternative distribution channels and these include: the problem of getting physical access
to free, as opposed to fee-charging, ATMs; the costs and limitations of Internet and
telephone banking, and; the problem of Post Office rationalization, concern over the
impact of which is such that, at the time of writing, Essex County Council have
announced their intention to consider taking over the running of fifteen Post Office
branches in the county earmarked for closure, for example (BBC News, 2008).
Findings from the research reported in this paper has keenly illustrated how the
branch networks of bank and building societies in Britain have been in decline since at
least the late 1980s. In this regard Britain is not alone, for studies of bank branch closure
in similar neo-liberalised economies, in particular Australia and New Zealand, have
shown comparable rates of decline. However, there is some evidence to suggest that in
contrast to these countries the US has undergone a surprising process of recent bank
branch expansion. Moreover, the US de novo branch phenomenon has, together with
efforts to increase revenue from cross-selling, helped to kindle a re-evaluation of the
strategic role of branches in Britain. While in the early 21st century there has been a
recent respite in branch rationalisation programmes, building society and especially bank
branch networks are likely to continue to shrink over the medium term as a result of
continued competition and pressures to lower costs and increase revenues.
Our research also found that the geography of closures has been uneven, with
higher than average net closures taking place in predominantly less affluent urban areas.
More affluent non-urban locations have, for the most part experienced lower than

39
average closure rates. The difference in closure rates would have been greater if not for
the proximity of many poor urban areas to city centres where bank and building society
branches serving wider populations are located and the impact of local planning
regulations which have acted to restrict the number of financial services branches on the
high streets of more affluent suburbs and small towns. Against a background of overall
decline, we anticipate a further reduction in the share of bank and building society
branches located within less affluent urban areas and a relative increase in the proportion
within suburban areas and small towns. Thus, while we found evidence to partly support
Birkin et al.’s (2002) findings that many affluent areas are underrepresented in their
relative share of overall branches, our study also identified a clear relationship between
branch closure and the socio-economic makeup of geographical areas.
In spite of the disappearance of considerations of space and place, and of branch
closure from contemporary debates around financial exclusion, we argue that the equity
effects of branch rationalisation programmes are indeed socially and geographically
uneven. As such, the assumption that only a weak relationship exists between branch
rationalisation and processes of financial exclusion should, at the very least, be re-
evaluated. The process of financial exclusion is a product of a broader bifurcation of the
market for retail financial services. Socio-technologies such as credit scoring systems sort
‘prime’ from ‘sub-prime’ customers on behalf of financial institutions. Prime customers
– mainly, middle and high income individuals – are actively pursued by retail financial
services firms, and may be described as financially ‘super-included’, benefiting from
intense competition between institutions for their business. Sub-prime customers,
meanwhile, have low to moderate incomes and/or financial assets and are either
excluded from mainstream financial marketing campaigns for new products or are denied
access to services if they apply. In turn, the geography of prime and sub-prime financial
markets follows established geographies of income and wealth, which we have shown is

40
also broadly reflected in the changing geography of bank and building society branch
networks. For the most part prime retail financial customers may be found in affluent
urban and suburban areas, whereas sub-prime markets are concentrated in areas of low
and moderate income, typically in inner-city areas (and in Britain, at least, on public
sector housing estates). In the absence of mainstream financial services, which continue
to close branches in such areas, a host of specialist sub-prime or ‘fringe’ retail financial
institutions ply their trade (Burton et al. 2004; Leyshon et al. 2004, 2006).
Not only are the effects of branch rationalisation uneven, but we found that rates
of branch network decline also differ markedly with respect to banks and building
societies. An important causal factor in producing such a marked difference are different
regimes of corporate governance and the fact that, in contrast to mutually owned
institutions, public limited companies are under greater pressure from shareholders to
reduce costs and improve profits. The dramatic increase in net rates of closure
characteristic of former building societies that have converted to plc status provides
striking evidence of the impact of corporate governance. While building societies do not
have to deal with shareholder pressure, mutuality does confer a need for greater
sensitivity to the demands of members, thus making it more difficult for building
societies to reconfigure their branch networks in response to socio-economic
geographical change.
As well as new socio-economic geographies and corporate governance, two other
factors help explain branch rationalisation. First, organisational policy toward closure,
which has ebbed and flowed over time. Second, the emergence of new distribution
channels and, in particular, the unintended consequences of the enrolment of the Post
Office as a cornerstone of financial exclusion policy. While the development and
delivery of Universal Banking Services through the Post Office helped serve to
successfully offset political and public disquiet over branch closure in the late 1990s and

41
early 2000s, the extension of the neo-liberal logic of competition to the Post Office has
starkly revealed the contradictions of financial exclusion policy. On the one hand, we
suggest that the Post Office may drive further branch cuts as it becomes considered an
effective substitute for permanent branch provision. On the other hand, the Post Office
network is itself increasingly subject to far reaching processes of rationalisation. Its
attempt to raise revenue through the introduction of its own branded financial services in
2005 has deterred some banks and building societies from entering into a third party
distribution agreement, as well as alienating those institutions that are already signed up
to the deal.
We wish to conclude by returning again briefly to the story of bank branch
closure in Ogmore Vale. The decision by HSBC to close its branch in the village can
now be better understood in the context of the changing socio-economic geography of
South Wales and pressure from shareholders to maximise returns and cut costs. It can
also be understood as the desire to reposition the bank’s assets in pursuit of the most
lucrative ‘prime’ customers in order to maximise the opportunities to cross-sell higher
margin financial services; it was a branch in the ‘wrong place’. In turn, the decision is
likely to have been influenced by considerations of current organisational and industry
thinking on the strategic role of the branch, socio-technologies of branch performance,
and by HSBC’s attitude toward the Post Office and its decision to offer only limited
access to its services at Post Offices, unlike its competitors such as Barclays and Lloyds
TSB. However, the long term impact on local communities like Ogmore Vale is harder
to gauge. Our research suggests that it is less affluent areas that are shouldering a
disproportionate share of net branch closure. Moreover, these are communities for
whom branch closure can have a much more detrimental impact than has to date been
presumed by financial exclusion policymakers (Fuller et al., 2006), and that are already
marked by constrained opportunity and choice and more likely to be exposed to the
42
purveyors of more expensive financial services. The case of Ogmore Vale also reveals
some of the limitations of the spatial imaginary currently deployed within the industry
and among policy makers in seeking to understand the impact of branch closure and of
processes of financial exclusion. While the debate around financial exclusion over the
past decade or so has led to a grudging recognition among practitioners and policymakers
of the relationship between financial exclusion and geographical space, it is now
imperative that the relationship between financial exclusion and place is properly
recognised. Ogmore Vale, and the hundreds of other communities like it that have lost
financial representation may no longer register as important places to the mainstream
financial services industry, but their populations still have to negotiate their lives through
financial intermediation of one kind or another. An understanding of the financial
dynamics of marginal financial ecologies, and in particular how they reproduce
themselves, is clearly a matter of pressing concern.
Acknowledgements
The research presented in this paper was made possible by Economic and Research
Council Funding (RES-000-22-0686). Earlier versions of this paper were presented at
the Financial Services Research Forum in Canary Wharf, the New Economic
Geographies Research Workshop Series at the University of Nottingham, the Oxford
Centre for the Environment, and the Department of Geography, UCL. We are grateful
for the helpful comments made on all of these occasions and by three anonymous
referees. The usual disclaimers apply.

43
References
ARGENT, N. (2002) A global model or a scaled-down version?: geographies of convergence and divergence in the Australian retail banking sector. Geoforum, 33, 315-334.
BAILEY, N. & FRENCH, S. (2005) ‘The locational dynamics of financial services in regional cities’ in N. Buck, I. Gordon, A. Harding and I. Turok (eds) Changing Cities: Rethinking Urban Competitiveness, Cohesion and Governance, Basingstoke, Palgrave
BBC NEWS (2008) 'Council bids to run post offices', 8th March, 2008 (available at http://news.bbc.co.uk/1/hi/uk/7284758.stm; last accessed 9th March 2008).
BIRKIN, M., CLARKE, G. & DOUGLAS, L. (2002) Optimising spatial mergers: commercial and regulatory perspectives. Progress in Planning, 58, 229-318.
BOWLES, P. (2000) Assessing the impact of proposed bank mergers on rural communities: A case study of British Columbia. Social Indicators Research, 51, 17-40.
BURTON, D., KNIGHTS, D., LEYSHON, A., ALFEROFF, C. & SIGNORETTA, P. (2004) Making a market: the UK retail financial services industry and the rise of the complex sub-prime credit market. Competition & Change, 8, 3-25.
DEVLIN, J. (2005) A detailed study of financial exclusion in the UK. Journal of Consumer Policy, 28, 75-108.
DAYSON K, (2004) Improving Financial Inclusion: the hidden story of how building societies serve the financially excluded, London; The Building Societies Association (available at http://www.bsa.org.uk/Information/IndustryPDFs/8332291104.pdf; last accessed 9th January 2006).
COUNCIL ON FINANCIAL COMPETITION (2007) A Branch Renaissance: Repositioning the Branch in a Multichannel World, Washington, DC, Council on Financial Competition
DORE, R. (2000) Stock Market Capitalism: Welfare Capitalism: Japan and Germany versus the Anglo-Saxons, Oxford, Oxford University Press.
DYMSKI, G. (2005) Financial globalization, social exclusion and financial crisis. International Review of Applied Economics, 19, 439-457.
DYMSKI, G. A. (2006) Targets of opportunity in two landscapes of financial globalization. Geoforum, 37, 307-311.
DYMSKI, G. A. & VEITCH, J. M. (1992) Race and the financial dynamics of urban growth: LA as Fay Wray. Working Paper 92-21, Department of Economics, University of California, Riverside, CA.
DYMSKI, G. A. & VEITCH, J. M. (1996) Financial transformation and the metropolis: booms, busts and banking in Los Angeles. Environment and Planning A, 28, 1233-1260.
FRENCH, S., CREWE, L., LEYSHON, A., WEBB, P. & THRIFT, N. (2004) Putting e-commerce in its place. In D Power and A J Scott (eds) Cultural Industries and the Production of Culture (pp. 54-71). London: Routledge
FRENCH , S. & KNEALE, J. (2008) 'Excessive Financialisation: Insuring Lifestyles and Everyday Geographies of Social Excess', Society & Space, forthcoming,
FRENCH, S. & LEYSHON, A. (2004) ‘The new, new financial system? Towards a conceptualisation of financial reintermediation’, Review of International Political Economy, 11(2): 263-288

44
FRENCH, S., LEYSHON, A. & SIGNORETTA, P. (2008) 'All gone now': The material, discursive and political erasure of bank and building society branches in Britain. Antipode, 40(1): 79-101
FROUD, J., HASLAM, C., JOHAL, S. & WILLIAMS, K. (2000) Shareholder value and financialization: consultancy promises, management moves. Economy and Society, 29, 80-110.
FROUD, J., JOHAL, S., HASLAM, C. & WILLIAMS, K. (2001) Accumulation under conditions of inequality. Review of International Political Economy, 8, 66-95.
FULLER, D., MELLOR, M., DODDS, L. & AFFLECK, A. (2006) Consulting the Community: Advancing financial inclusion in Newcastle upon Tyne, UK. International Journal of Sociology and Social Policy 26(5/6):255-271
GARDENER, E. P. M. & MOLYNEUX, P. (1990) Changes in Western European Banking, London, Unwin Hyman.
KEMPSON, E. & JONES, T. (2000) Banking Without Branches. London, British Bankers Association.
KEMPSON, E. & WHYLEY, C. (1999) Kept In Or Opted-Out? Understanding and combating financial exclusion, Bristol, Policy Press.
KPMG (2006) Retail Banking: A Critical Moment. Zurich: KPMG International LEYSHON, A., BURTON, D., KNIGHTS, D., ALFEROFF, C. & SIGNORETTA, P.
(2004) Towards an ecology of retail financial services: understanding the persistence of door-to-door credit and insurance providers. Environment and Planning A, 36, 625-645.
LEYSHON, A. & POLLARD, J. (2000) Geographies of industrial convergence: the case of retail banking. Transactions of the Institute of British Geographers, 25, 203-220.
LEYSHON, A., SIGNORETTA, P., KNIGHTS, D., ALFEROFF, C. & BURTON, D. (2006) Walking with moneylenders: The ecology of the UK home-collected credit industry. Urban Studies, 43, 161-186.
LEYSHON, A. & THRIFT, N. (1993) The Restructuring of the UK Financial Services Industry in the 1990s - a Reversal of Fortune. Journal of Rural Studies, 9, 223-241.
LEYSHON, A. & THRIFT, N. (1994) Access to Financial Services and Financial Infrastructure Withdrawal - Problems and Policies. Area, 26, 268-275.
LEYSHON, A. & THRIFT, N. (1995) Geographies of Financial Exclusion - Financial Abandonment in Britain and the United-States. Transactions of the Institute of British Geographers, 20, 312-341.
LEYSHON, A. & THRIFT, N. (1996) Financial exclusion and the shifting boundaries of the financial system. Environment and Planning A, 28, 1150-1156.
LEYSHON, A. & THRIFT, N. (1999) Lists come alive: electronic systems of knowledge and the rise of credit-scoring in retail banking. Economy and Society, 28, 434-466.
LEYSHON, A. & THRIFT, N. (2007) 'The capitalisation of everything: the future of finance and capitalism', Theory, Culture and Society (forthcoming)
MARSHALL, J. N. (2004) Financial institutions in disadvantaged areas: A comparative analysis of policies encouraging financial inclusion in Britain and the United States. Environment and Planning A, 36, 241-261.
MARSHALL, J. N., RICHARDSON, R., RAYBOULD, S. & COOMBES, M. (1997) The transformation of the British building society movement: Managerial divisions and corporate reorganization, 1986-1997. Geoforum, 28, 271-288.
MARSHALL, J. N., WILLIS, R., COOMBES, M., RAYBOULD, S. & RICHARDSON, R. (2000) Mutuality, de-mutualization and communities: the implications of branch network rationalization in the British building society industry. Transactions of the Institute of British Geographers, 25, 355-377.

45
MIDGLEY, J. (2005) Financial inclusion, universal banking and post offices in Britain. Area 37(3):277-85
MARRON, D. (2007) ‘Lending by numbers’: credit scoring and the constitution of risk within American consumer credit, Economy and Society, 36 (1): 103-133
MORAN, M. (2003) The British Regulatory State: high modernism and hyper-innovation, Oxford, Oxford University Press.
MORRISON, P. S. & O'BRIEN, R. (2001) Bank branch closures in New Zealand: the application of a spatial interaction model. Applied Geography, 21, 301-330.
PECK, J. A. & TICKELL, A. (2002) Neoliberalizing space. Antipode, 34, 380-404. PLUMMER, P. & SHEPPARD, E. (2001) Must emancipatory economic geography be
qualitative? Antipode, 33, 194-199. PRATT, D. J. (1998) Re-placing money: the evolution of branch banking in Britain.
Environment and Planning A, 30, 2211-2226. RICHARDSON, R., BELT, V. & MARSHALL, N. (2000) Taking calls to Newcastle: the
regional implications of the growth in call centres. Regional Studies, 34, 357-369. SHEPPARD, E. (2001) Quantitative geography: representations, practices, and
possibilities. Environment and Planning D-Society & Space, 19, 535-554. SINCLAIR, T. (2005) The New Masters of Capital: American bond rating agencies and the politics
of creditworthiness, Ithaca, N.Y., Cornell University Press. THE ECONOMIST (2004) ‘Branching out’, February 19th VICKERS, D & Rees, P, (2007) Creating the UK National Statistics 2001 output area
classification, J. R. Statist. Soc. A, 170 (2), 379–403 WALNE, T. (2005) Greed-driven HSBC has betrayed us all ... The Mail on Sunday.
London. WILLIS, R., MARSHALL, J. N. & RICHARDSON, R. (2001) The impact of 'branchless
banking' on building society branch networks. Environment and Planning A, 33, 1371-1384.
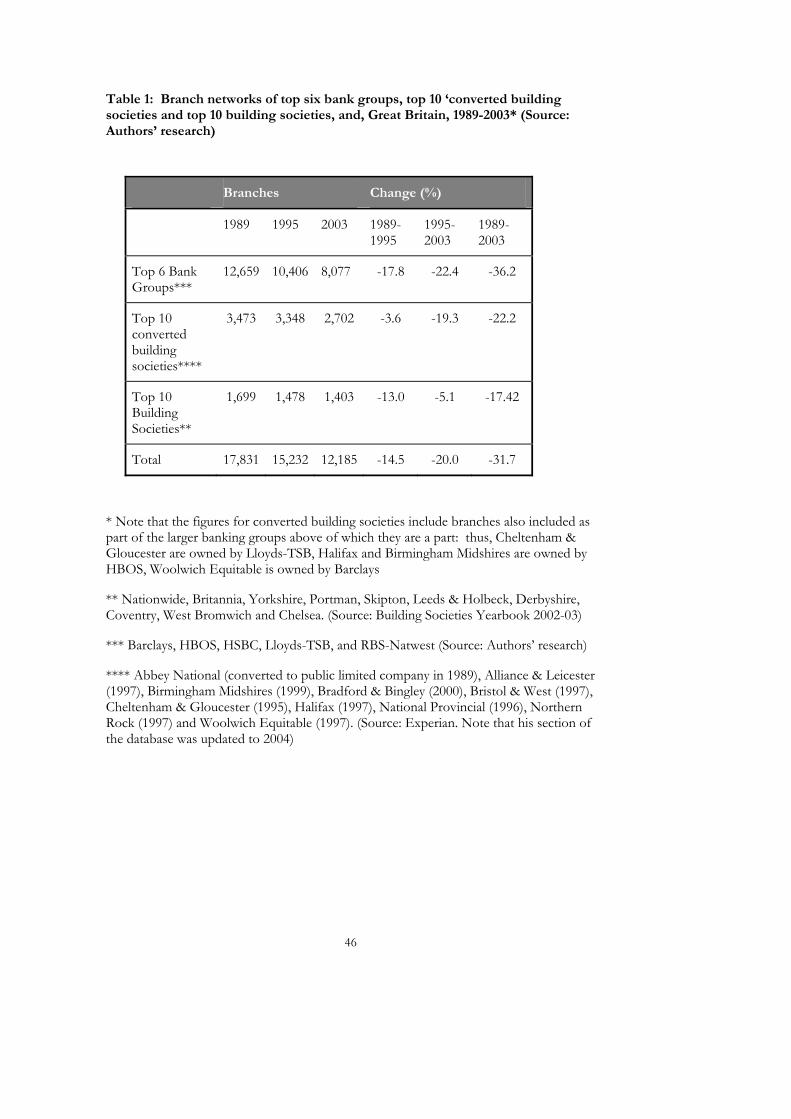
46
Table 1: Branch networks of top six bank groups, top 10 ‘converted building societies and top 10 building societies, and, Great Britain, 1989-2003* (Source: Authors’ research)
Branches Change (%)
1989 1995 2003 1989-1995
1995-2003
1989-2003
Top 6 Bank Groups***
12,659 10,406 8,077 -17.8 -22.4 -36.2
Top 10 converted building societies****
3,473 3,348 2,702 -3.6 -19.3 -22.2
Top 10 Building Societies**
1,699 1,478 1,403 -13.0 -5.1 -17.42
Total 17,831 15,232 12,185 -14.5 -20.0 -31.7
* Note that the figures for converted building societies include branches also included as part of the larger banking groups above of which they are a part: thus, Cheltenham & Gloucester are owned by Lloyds-TSB, Halifax and Birmingham Midshires are owned by HBOS, Woolwich Equitable is owned by Barclays
** Nationwide, Britannia, Yorkshire, Portman, Skipton, Leeds & Holbeck, Derbyshire, Coventry, West Bromwich and Chelsea. (Source: Building Societies Yearbook 2002-03)
*** Barclays, HBOS, HSBC, Lloyds-TSB, and RBS-Natwest (Source: Authors’ research)
**** Abbey National (converted to public limited company in 1989), Alliance & Leicester (1997), Birmingham Midshires (1999), Bradford & Bingley (2000), Bristol & West (1997), Cheltenham & Gloucester (1995), Halifax (1997), National Provincial (1996), Northern Rock (1997) and Woolwich Equitable (1997). (Source: Experian. Note that his section of the database was updated to 2004)

47
Table 2: Bank and building society closures by standard region, 1995-2003 Source: Authors’ research)
Region Total
branches 1995
Net change
1995-2003
Net change
(%) South East 4937 -945 -19.14East Anglia 536 -100 -18.66South West 1631 -373 -22.87West Midlands 1268 -230 -18.14East Midlands 920 -176 -19.13North West 1517 -359 -23.67Yorkshire and Humberside 1138 -238 -20.91North 726 -166 -22.87Scotland 1271 -214 -16.84Wales 894 -166 -18.57Total 14838 -2967 -20.00

48
Table 3: Branch closures and openings by banks, converted building societies and building societies, by Index of Multiple Deprivation, England, 1995-2003 (source: Authors’ research)5
IMD 2000 – Deciles Total branches 1995
Net change Net change (%)
Not assigned 2 0 0 10% most deprived wards 2308 -576 -25.0 Second most deprived 1663 -336 -20.2 Third most deprived 1526 -320 -21.0 Forth most deprived 1168 -250 -21.4 Fifth most deprived 1403 -278 -19.8 Fifth least deprived 1072 -218 -20.3 Forth least deprived 926 -168 -18.1 Third least deprived 729 -108 -14.8 Second least deprived 865 -164 -19.0 10% least deprived wards 1011 -183 -18.1 12673 -2601 -20.5
5 The Index of Multiple Deprivation 2000 (IMD 2000) is a ward level Index, made up of six ward level domain Indices (www.statistics.gov.uk) namely: • Income, • Employment, • Health Deprivation and disability, • Education, Skills and training, • Housing • Geographical Access to Services The overall IMD 2000 has two strands of data: • The Index of Multiple Deprivation Score; • The Rank of the Index of Multiple Deprivation. The bigger the IMD 2000 score, the more deprived the ward is. However, caution should be used when interpreting the results. Due to the exponential distribution, a ward with a score of 60 is not twice as deprived as a ward with a score of 30. The 8414 wards in England are ranked: a rank of 1 identifies the most deprived ward and a rank of 8414 the least deprived. Ranks rather than scores should be used to compare the position of a ward in the national (England) context.
For the present analysis the Rank of the Index of Multiple Deprivation by ward was used because the aim was to identify the most deprived wards in GB and the use of the rank rather than the domain score made this possible. The IMD2000 was preferred for the present analysis for two main reasons. The first is that the index is available at the ward level. This makes the analysis of deprivation comparable with the analysis of closure even if the IMD 2000 is based on the 1998 boundaries. The second reason is that the IMD2000 better captures the social changes which took place between 1995 and 2003, the period of interest for the branch closure analysis

49
Table 4: Definitions of ONS geo-demographic area classification ‘supergroups’ (source: http://www.statistics.gov.uk/about/methodology_by_theme/area_classification/wards/cluster_summaries.asp)
‘Supergroup’
‘Supergroup’ number
Groups Subgroup % of UK Population
Industrial Hinterlands 1 Industrial Areas Industrial Areas A 4.7%
Industrial Areas B 6.2%
Out of Town
Housing Out of Town Housing A 4%
Out of Town Housing B 4.6%
Traditional Manufacturing
2 Built-up Manufacturing
Built-up Manufacturing 4%
Transitional Economies
Transitional Economies A 4.3%
Transitional Economies B 3.3%
Built-up Areas 3 Built-up Areas Built-up Areas A 1.7%
Built-up Areas B 1.6%
Prospering Metropolitan 4
Prospering Metropolitan
Prospering Metropolitan A 2.8%
Prospering Metropolitan B 0.91%
Student Communities 5 Student
Communities Student Communities A 1.1%
Student Communities B 3.4%
Student Communities C 0.4%
Multicultural Metropolitan
6 Multicultural Areas Multicultural Areas 3.1%
Inner City
Multicultural Inner City Multicultural 3.6%
Suburbs and Small Towns
7 Suburbs Suburbs A 7.8%
Suburbs B 6.4%
Prospering Suburbs Prospering Suburbs 3.5%
Commuter Suburbs Commuter Suburbs A 5.5%
Commuter Suburbs B 4.4%
Coastal and Countryside 8
Countryside Countryside A 2.5%
Countryside B 4.5%
Senior Communities Senior Communities 2.7%
Out of Town
Manufacturing Out of Town Manufacturing 6.8%
Northern Ireland
Countryside Northern Ireland Countryside 0.91%
Accessible Countryside 9 Accessible
Countryside Accessible Countryside 5.1%
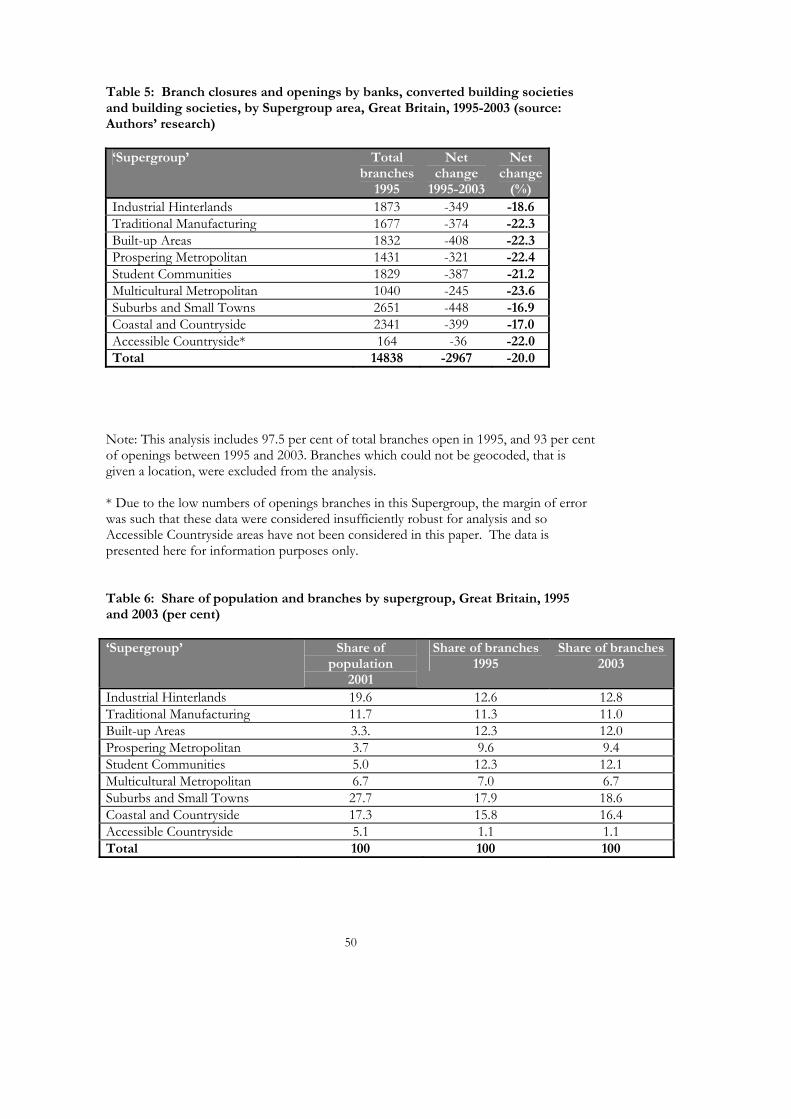
50
Table 5: Branch closures and openings by banks, converted building societies and building societies, by Supergroup area, Great Britain, 1995-2003 (source: Authors’ research) ‘Supergroup’ Total
branches 1995
Net change
1995-2003
Net change
(%) Industrial Hinterlands 1873 -349 -18.6 Traditional Manufacturing 1677 -374 -22.3 Built-up Areas 1832 -408 -22.3 Prospering Metropolitan 1431 -321 -22.4 Student Communities 1829 -387 -21.2 Multicultural Metropolitan 1040 -245 -23.6 Suburbs and Small Towns 2651 -448 -16.9 Coastal and Countryside 2341 -399 -17.0 Accessible Countryside* 164 -36 -22.0 Total 14838 -2967 -20.0
Note: This analysis includes 97.5 per cent of total branches open in 1995, and 93 per cent of openings between 1995 and 2003. Branches which could not be geocoded, that is given a location, were excluded from the analysis. * Due to the low numbers of openings branches in this Supergroup, the margin of error was such that these data were considered insufficiently robust for analysis and so Accessible Countryside areas have not been considered in this paper. The data is presented here for information purposes only. Table 6: Share of population and branches by supergroup, Great Britain, 1995 and 2003 (per cent) ‘Supergroup’ Share of
population 2001
Share of branches 1995
Share of branches 2003
Industrial Hinterlands 19.6 12.6 12.8 Traditional Manufacturing 11.7 11.3 11.0 Built-up Areas 3.3. 12.3 12.0 Prospering Metropolitan 3.7 9.6 9.4 Student Communities 5.0 12.3 12.1 Multicultural Metropolitan 6.7 7.0 6.7 Suburbs and Small Towns 27.7 17.9 18.6 Coastal and Countryside 17.3 15.8 16.4 Accessible Countryside 5.1 1.1 1.1 Total 100 100 100
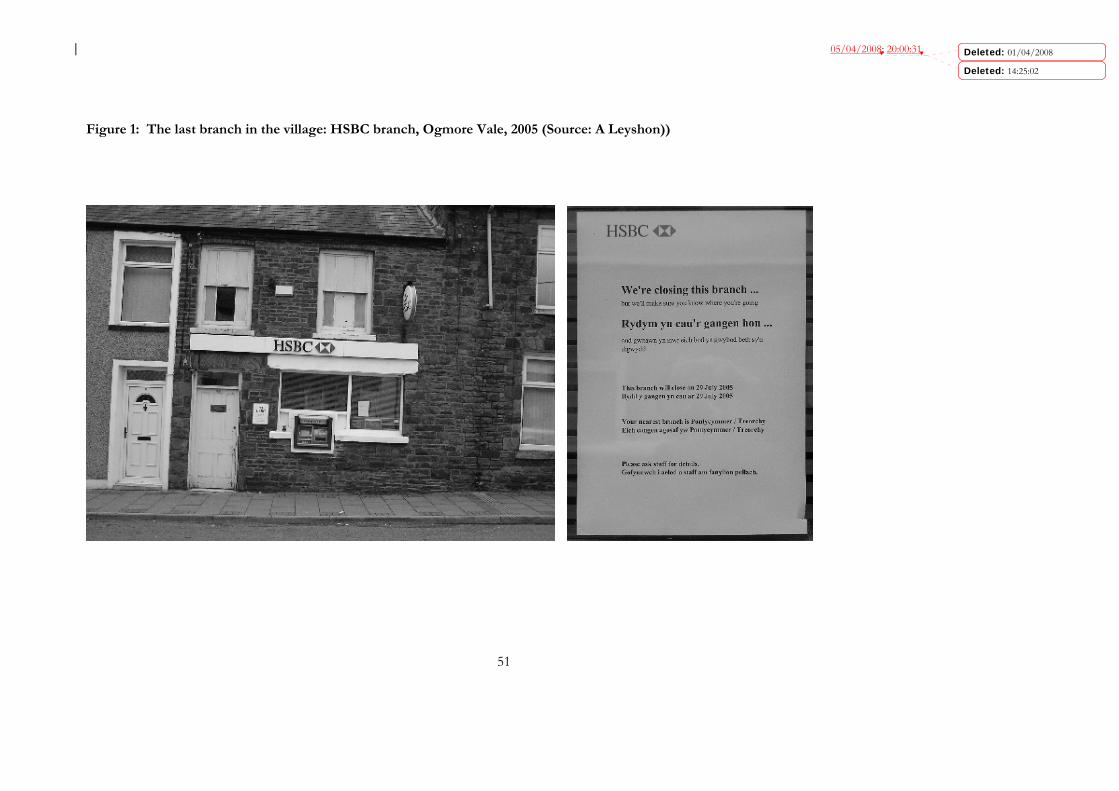
05/04/2008; 20:00:31
51
Figure 1: The last branch in the village: HSBC branch, Ogmore Vale, 2005 (Source: A Leyshon))
Deleted: 01/04/2008
Deleted: 14:25:02

05/04/2008; 20:00:31
52
Figure 2: Ogmore Vale, Pontycymer and Treorchy
Deleted: 01/04/2008
Deleted: 14:25:02