financial globalisation, monetary policy spillovers and macro
TRANSCRIPT
Financial Globalisation, Monetary Policy Spilloversand Macro-Modelling:
Tales from One Hundred and One Shocks
Georgios Georgiadis* Martina Jancoková*
∗European Central Bank
ECB-IMF-BoE Workshop“Global spillovers: How much do we really know?”
Frankfurt, 26/4/2016
The views expressed are those of the authors and not those of the ECB or of the ESCB.
1/26
Motivation
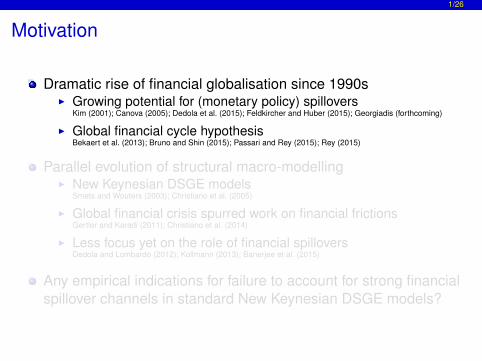
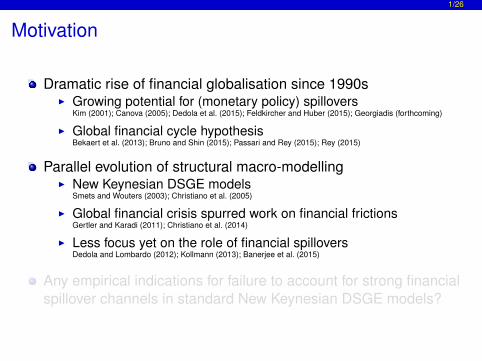
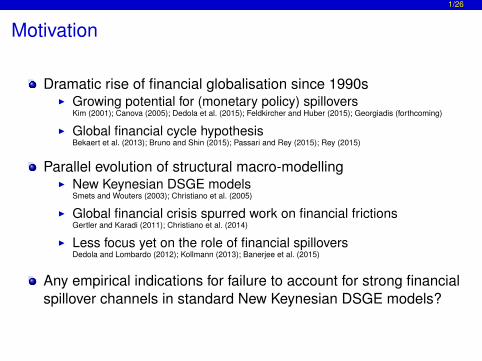
Dramatic rise of financial globalisation since 1990sI Growing potential for (monetary policy) spillovers
Kim (2001); Canova (2005); Dedola et al. (2015); Feldkircher and Huber (2015); Georgiadis (forthcoming)
I Global financial cycle hypothesisBekaert et al. (2013); Bruno and Shin (2015); Passari and Rey (2015); Rey (2015)
Parallel evolution of structural macro-modellingI New Keynesian DSGE models
Smets and Wouters (2003); Christiano et al. (2005)
I Global financial crisis spurred work on financial frictionsGertler and Karadi (2011); Christiano et al. (2014)
I Less focus yet on the role of financial spilloversDedola and Lombardo (2012); Kollmann (2013); Banerjee et al. (2015)
Any empirical indications for failure to account for strong financialspillover channels in standard New Keynesian DSGE models?
1/26
Motivation
Dramatic rise of financial globalisation since 1990sI Growing potential for (monetary policy) spillovers
Kim (2001); Canova (2005); Dedola et al. (2015); Feldkircher and Huber (2015); Georgiadis (forthcoming)
I Global financial cycle hypothesisBekaert et al. (2013); Bruno and Shin (2015); Passari and Rey (2015); Rey (2015)
Parallel evolution of structural macro-modellingI New Keynesian DSGE models
Smets and Wouters (2003); Christiano et al. (2005)
I Global financial crisis spurred work on financial frictionsGertler and Karadi (2011); Christiano et al. (2014)
I Less focus yet on the role of financial spilloversDedola and Lombardo (2012); Kollmann (2013); Banerjee et al. (2015)
Any empirical indications for failure to account for strong financialspillover channels in standard New Keynesian DSGE models?
2/26
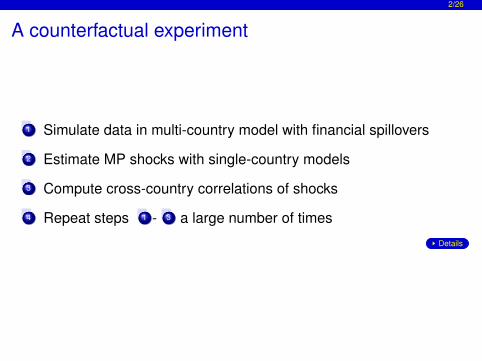
A counterfactual experiment
1 Simulate data in multi-country model with financial spillovers
2 Estimate MP shocks with single-country models
3 Compute cross-country correlations of shocks
4 Repeat steps 1 - 3 a large number of times
Details

3/26
Smoothed MP shocks cross-country correlated incase of strong financial spillovers
Correlation coefficient-0.3 -0.2 -0.1 0 0.1 0.2 0.3 0.4 0.5 0.6
Small fin. spillovers
Large fin. spillovers

4/26
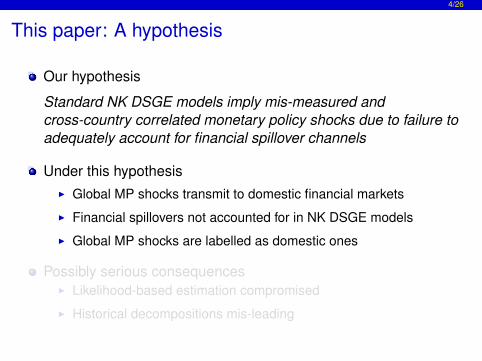
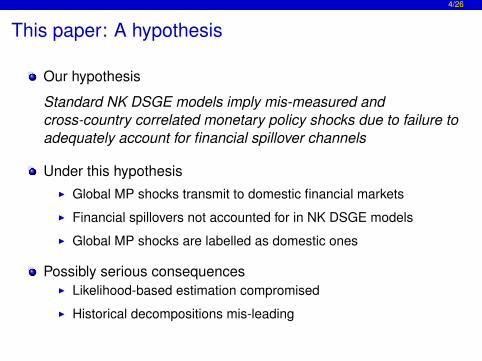
This paper: A hypothesis
Our hypothesis
Standard NK DSGE models imply mis-measured andcross-country correlated monetary policy shocks due to failure toadequately account for financial spillover channels
Under this hypothesisI Global MP shocks transmit to domestic financial markets
I Financial spillovers not accounted for in NK DSGE models
I Global MP shocks are labelled as domestic ones
Possibly serious consequencesI Likelihood-based estimation compromised
I Historical decompositions mis-leading
4/26
This paper: A hypothesis
Our hypothesis
Standard NK DSGE models imply mis-measured andcross-country correlated monetary policy shocks due to failure toadequately account for financial spillover channels
Under this hypothesisI Global MP shocks transmit to domestic financial markets
I Financial spillovers not accounted for in NK DSGE models
I Global MP shocks are labelled as domestic ones
Possibly serious consequencesI Likelihood-based estimation compromised
I Historical decompositions mis-leading

5/26
This paper: Testing the hypothesis
Set up a cross-country database with MP shock time series from100+ macro-models
Systematic analysis of determinants of cross-country correlationsI Model type, frequency, country pairsI Economies’ financial integration properties

5/26
This paper: Testing the hypothesis
Set up a cross-country database with MP shock time series from100+ macro-models
Systematic analysis of determinants of cross-country correlationsI Model type, frequency, country pairsI Economies’ financial integration properties
6/26
Outline
1 Monetary policy shocks databaseOverviewDescriptives
2 Testing the hypothesis about the role of financial integrationRegressions
3 Conclusion

Monetary policy shocks database Overview 7/26
1 Monetary policy shocks databaseOverviewDescriptives
2 Testing the hypothesis about the role of financial integrationRegressions
3 Conclusion

Monetary policy shocks database Overview 8/26
MP shocks database
Database draws on existing/ongoing academic/institutional work
Multitude of modelsI Structural macro-models (NK DSGEs)I Statistical models (SVARs, SVECMs, SFAVARs, SDFMs)I Narrative approachesI Shocks based on financial market expectations
We consider shock time-series over 1993q1-2007q4
Contributors
Monetary policy shocks database Overview 9/26
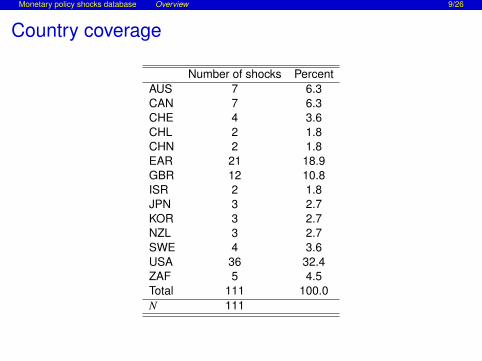
Country coverage
Number of shocks PercentAUS 7 6.3CAN 7 6.3CHE 4 3.6CHL 2 1.8CHN 2 1.8EAR 21 18.9GBR 12 10.8ISR 2 1.8JPN 3 2.7KOR 3 2.7NZL 3 2.7SWE 4 3.6USA 36 32.4ZAF 5 4.5Total 111 100.0N 111
Monetary policy shocks database Overview 10/26
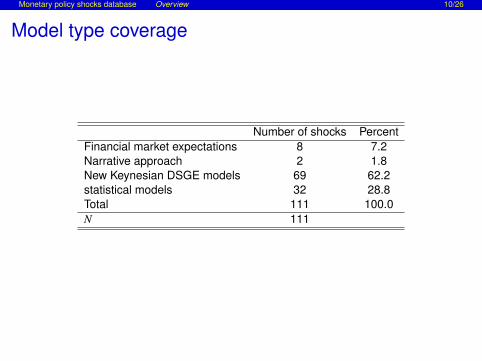
Model type coverage
Number of shocks PercentFinancial market expectations 8 7.2Narrative approach 2 1.8New Keynesian DSGE models 69 62.2statistical models 32 28.8Total 111 100.0N 111

Monetary policy shocks database Descriptives 11/26
1 Monetary policy shocks databaseOverviewDescriptives
2 Testing the hypothesis about the role of financial integrationRegressions
3 Conclusion
Monetary policy shocks database Descriptives 12/26
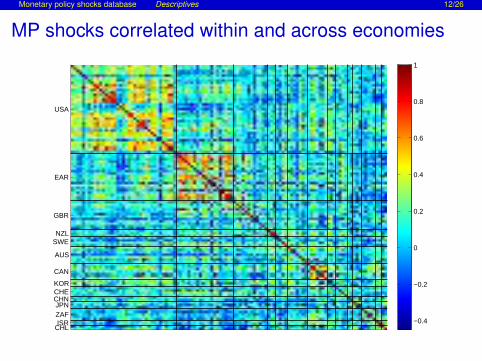
MP shocks correlated within and across economies
USA
EAR
GBR
NZLSWE
AUS
CAN
KORCHECHNJPNZAFISR
CHL−0.4
−0.2
0
0.2
0.4
0.6
0.8
1

Monetary policy shocks database Descriptives 13/26
MP shock correlations: Distributions
−0.4 −0.2 0 0.2 0.4 0.6 0.8
Domestic correlations(All models)
−0.4 −0.2 0 0.2 0.4 0.6 0.8
Cross-country correlations(All models)
−0.4 −0.2 0 0.2 0.4 0.6 0.8
Domestic correlations(DSGE models)
−0.4 −0.2 0 0.2 0.4 0.6 0.8
Cross-country correlations(DSGE models)
−0.4 −0.2 0 0.2 0.4 0.6 0.8
Domestic correlations(Non-DSGE models)
−0.4 −0.2 0 0.2 0.4 0.6 0.8
Cross-country correlations(Non-DSGE models)
Monetary policy shocks database Descriptives 14/26
MP shock correlations: Regression analysis
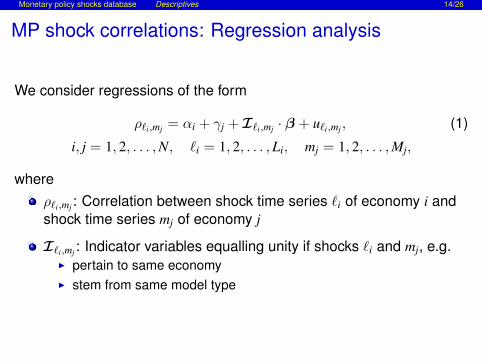
We consider regressions of the form
ρ`i,mj = αi + γj + I`i,mj · β + u`i,mj , (1)
i, j = 1, 2, . . . ,N, `i = 1, 2, . . . ,Li, mj = 1, 2, . . . ,Mj,
whereρ`i,mj : Correlation between shock time series `i of economy i andshock time series mj of economy j
I`i,mj : Indicator variables equalling unity if shocks `i and mj, e.g.I pertain to same economyI stem from same model type
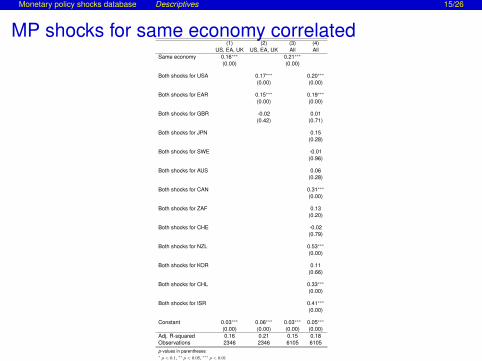
Monetary policy shocks database Descriptives 15/26
MP shocks for same economy correlated(1) (2) (3) (4)
US, EA, UK US, EA, UK All AllSame economy 0.16∗∗∗ 0.21∗∗∗
(0.00) (0.00)
Both shocks for USA 0.17∗∗∗ 0.20∗∗∗
(0.00) (0.00)
Both shocks for EAR 0.15∗∗∗ 0.19∗∗∗
(0.00) (0.00)
Both shocks for GBR -0.02 0.01(0.42) (0.71)
Both shocks for JPN 0.15(0.28)
Both shocks for SWE -0.01(0.96)
Both shocks for AUS 0.06(0.28)
Both shocks for CAN 0.31∗∗∗
(0.00)
Both shocks for ZAF 0.13(0.20)
Both shocks for CHE -0.02(0.79)
Both shocks for NZL 0.53∗∗∗
(0.00)
Both shocks for KOR 0.11(0.66)
Both shocks for CHL 0.33∗∗∗
(0.00)
Both shocks for ISR 0.41∗∗∗
(0.00)
Constant 0.03∗∗∗ 0.06∗∗∗ 0.03∗∗∗ 0.05∗∗∗
(0.00) (0.00) (0.00) (0.00)Adj. R-squared 0.16 0.21 0.15 0.18Observations 2346 2346 6105 6105p-values in parentheses∗ p < 0.1, ∗∗ p < 0.05, ∗∗∗ p < 0.01
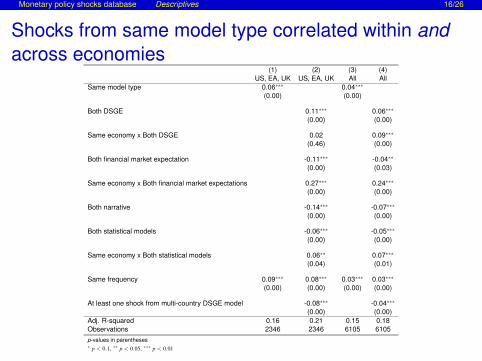
Monetary policy shocks database Descriptives 16/26
Shocks from same model type correlated within andacross economies
(1) (2) (3) (4)US, EA, UK US, EA, UK All All
Same model type 0.06∗∗∗ 0.04∗∗∗
(0.00) (0.00)
Both DSGE 0.11∗∗∗ 0.06∗∗∗
(0.00) (0.00)
Same economy x Both DSGE 0.02 0.09∗∗∗
(0.46) (0.00)
Both financial market expectation -0.11∗∗∗ -0.04∗∗
(0.00) (0.03)
Same economy x Both financial market expectations 0.27∗∗∗ 0.24∗∗∗
(0.00) (0.00)
Both narrative -0.14∗∗∗ -0.07∗∗∗
(0.00) (0.00)
Both statistical models -0.06∗∗∗ -0.05∗∗∗
(0.00) (0.00)
Same economy x Both statistical models 0.06∗∗ 0.07∗∗∗
(0.04) (0.01)
Same frequency 0.09∗∗∗ 0.08∗∗∗ 0.03∗∗∗ 0.03∗∗∗
(0.00) (0.00) (0.00) (0.00)
At least one shock from multi-country DSGE model -0.08∗∗∗ -0.04∗∗∗
(0.00) (0.00)Adj. R-squared 0.16 0.21 0.15 0.18Observations 2346 2346 6105 6105p-values in parentheses∗ p < 0.1, ∗∗ p < 0.05, ∗∗∗ p < 0.01
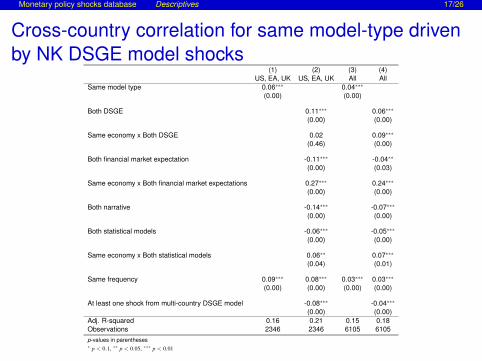
Monetary policy shocks database Descriptives 17/26
Cross-country correlation for same model-type drivenby NK DSGE model shocks
(1) (2) (3) (4)US, EA, UK US, EA, UK All All
Same model type 0.06∗∗∗ 0.04∗∗∗
(0.00) (0.00)
Both DSGE 0.11∗∗∗ 0.06∗∗∗
(0.00) (0.00)
Same economy x Both DSGE 0.02 0.09∗∗∗
(0.46) (0.00)
Both financial market expectation -0.11∗∗∗ -0.04∗∗
(0.00) (0.03)
Same economy x Both financial market expectations 0.27∗∗∗ 0.24∗∗∗
(0.00) (0.00)
Both narrative -0.14∗∗∗ -0.07∗∗∗
(0.00) (0.00)
Both statistical models -0.06∗∗∗ -0.05∗∗∗
(0.00) (0.00)
Same economy x Both statistical models 0.06∗∗ 0.07∗∗∗
(0.04) (0.01)
Same frequency 0.09∗∗∗ 0.08∗∗∗ 0.03∗∗∗ 0.03∗∗∗
(0.00) (0.00) (0.00) (0.00)
At least one shock from multi-country DSGE model -0.08∗∗∗ -0.04∗∗∗
(0.00) (0.00)Adj. R-squared 0.16 0.21 0.15 0.18Observations 2346 2346 6105 6105p-values in parentheses∗ p < 0.1, ∗∗ p < 0.05, ∗∗∗ p < 0.01

Monetary policy shocks database Descriptives 18/26
...and not by non-NK DSGE model shocks(1) (2) (3) (4)
US, EA, UK US, EA, UK All AllSame model type 0.06∗∗∗ 0.04∗∗∗
(0.00) (0.00)
Both DSGE 0.11∗∗∗ 0.06∗∗∗
(0.00) (0.00)
Same economy x Both DSGE 0.02 0.09∗∗∗
(0.46) (0.00)
Both financial market expectation -0.11∗∗∗ -0.04∗∗
(0.00) (0.03)
Same economy x Both financial market expectations 0.27∗∗∗ 0.24∗∗∗
(0.00) (0.00)
Both narrative -0.14∗∗∗ -0.07∗∗∗
(0.00) (0.00)
Both statistical models -0.06∗∗∗ -0.05∗∗∗
(0.00) (0.00)
Same economy x Both statistical models 0.06∗∗ 0.07∗∗∗
(0.04) (0.01)
Same frequency 0.09∗∗∗ 0.08∗∗∗ 0.03∗∗∗ 0.03∗∗∗
(0.00) (0.00) (0.00) (0.00)
At least one shock from multi-country DSGE model -0.08∗∗∗ -0.04∗∗∗
(0.00) (0.00)Adj. R-squared 0.16 0.21 0.15 0.18Observations 2346 2346 6105 6105p-values in parentheses∗ p < 0.1, ∗∗ p < 0.05, ∗∗∗ p < 0.01
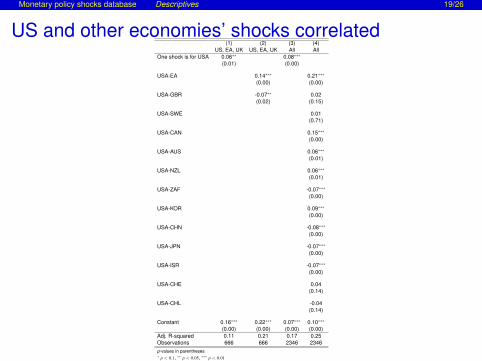
Monetary policy shocks database Descriptives 19/26
US and other economies’ shocks correlated(1) (2) (3) (4)
US, EA, UK US, EA, UK All AllOne shock is for USA 0.06∗∗ 0.08∗∗∗
(0.01) (0.00)
USA-EA 0.14∗∗∗ 0.21∗∗∗
(0.00) (0.00)
USA-GBR -0.07∗∗ 0.02(0.02) (0.15)
USA-SWE 0.01(0.71)
USA-CAN 0.15∗∗∗
(0.00)
USA-AUS 0.06∗∗∗
(0.01)
USA-NZL 0.06∗∗∗
(0.01)
USA-ZAF -0.07∗∗∗
(0.00)
USA-KOR 0.09∗∗∗
(0.00)
USA-CHN -0.08∗∗∗
(0.00)
USA-JPN -0.07∗∗∗
(0.00)
USA-ISR -0.07∗∗∗
(0.00)
USA-CHE 0.04(0.14)
USA-CHL -0.04(0.14)
Constant 0.16∗∗∗ 0.22∗∗∗ 0.07∗∗∗ 0.10∗∗∗
(0.00) (0.00) (0.00) (0.00)Adj. R-squared 0.11 0.21 0.17 0.25Observations 666 666 2346 2346p-values in parentheses∗ p < 0.1, ∗∗ p < 0.05, ∗∗∗ p < 0.01
Monetary policy shocks database Descriptives 20/26
Descriptive analysis: Summing up
MP shocks in database positively cross-country correlated
Cross-country MP shock correlations particularly strongI for NK DSGE models
I when one economy is the US
Does the cross-country shock correlation in standard DSGE modelsstem from failure to adequately account for financial spillover channelsand the importance of the US for the global financial cycle?
Testing the hypothesis about the role of financial integration Regressions 21/26
1 Monetary policy shocks databaseOverviewDescriptives
2 Testing the hypothesis about the role of financial integrationRegressions
3 Conclusion

Testing the hypothesis about the role of financial integration Regressions 22/26
The role of financial integration
Under our hypothesisGlobal MP shocks transmit to domestic financial markets
Financial spillovers not accounted for in NK DSGE models
Global MP shocks are labelled as domestic ones
Then, the cross-country correlation should rise with economies’overall financial integration with the RoW
bilateral financial integration with the US

Testing the hypothesis about the role of financial integration Regressions 23/26
Testing for the role of financial integration
We consider regressions of the form
ρ`i,mj = αi + γj + xij · β + u`i,mj , (2)
i, j = 1, 2, . . . ,N, i 6= j, `i = 1, 2, . . . ,Li, mj = 1, 2, . . . ,Mj,
whereρ`i,mj : Correlation between shock time series `i of economy i andshock time series mj of economy j
xij: Vector of bilateral country characteristicsI Economy i × economy j overall financial integrationI Economy i × economy j bilateral financial integration with US
Only NK DSGE model MP shocks

Testing the hypothesis about the role of financial integration Regressions 24/26
Correlation higher for financially integrated economies
(1) (2) (3)Overall fin. integration country 1 x country 2 (CPIS) 0.70∗∗∗ 0.61∗∗∗
(0.00) (0.00)
Share of US in country 1 fin. integration x country 2 1.44∗∗∗ 1.23∗∗∗
(0.00) (0.01)
Country 1 dummies Yes Yes Yes
Country 2 dummies Yes Yes YesAdj. R-squared 0.12 0.11 0.12Observations 1228 1176 1176p-values in parentheses∗ p < 0.1, ∗∗ p < 0.05, ∗∗∗ p < 0.01
Conclusion 25/26
1 Monetary policy shocks databaseOverviewDescriptives
2 Testing the hypothesis about the role of financial integrationRegressions
3 Conclusion

Conclusion 26/26
Conclusion
Standard NK DSGE models imply cross-country correlated MPshocks
This can be rationalised by a lack of accounting for financialspillover channels in this class of models
Possible/likely consequencesI Inconsistent likelihood-based estimation of NK DSGE modelsI Mis-leading historical decompositions
Need for structural macro-modelling to consider powerful financialspillover channels
Appendix 27/26
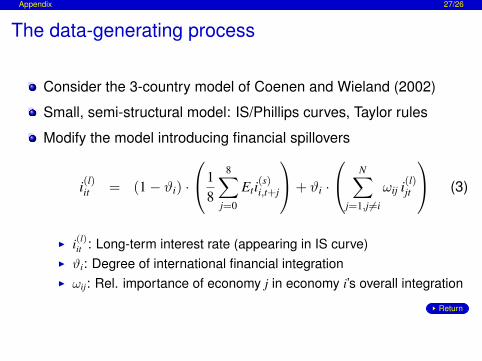
The data-generating process
Consider the 3-country model of Coenen and Wieland (2002)
Small, semi-structural model: IS/Phillips curves, Taylor rules
Modify the model introducing financial spillovers
i(l)it = (1− ϑi) ·
18
8∑j=0
Eti(s)i,t+j
+ ϑi ·
N∑j=1,j 6=i
ωij i(l)jt
(3)
I i(l)it : Long-term interest rate (appearing in IS curve)
I ϑi: Degree of international financial integrationI ωij: Rel. importance of economy j in economy i’s overall integration
Return

Appendix 28/26
True EA MP shock spillovers
Quarters0 4 8 12 16
-0.06
-0.04
-0.02
0
0.02Output gap
Quarters0 4 8 12 16
×10-3
-6
-4
-2
0
2Q-o-q inflation
Quarters0 4 8 12 16
-0.2
0
0.2
0.4
0.6
0.8Short-term interest rate
US - small fin. spillovers
EA - small fin. spillovers
US - large fin. spillovers
EA - large fin. spillovers
Quarters0 4 8 12 16
-0.1
0
0.1
0.2
0.3Long-term interest rate

Appendix 29/26
True US MP shock spillovers
Quarters0 4 8 12 16
-0.06
-0.04
-0.02
0
0.02Output gap
Quarters0 4 8 12 16
×10-3
-6
-4
-2
0
2Q-o-q inflation
Quarters0 4 8 12 16
-0.2
0
0.2
0.4
0.6
0.8Short-term interest rate
US - small fin. spillovers
EA - small fin. spillovers
US - large fin. spillovers
EA - large fin. spillovers
Quarters0 4 8 12 16
-0.05
0
0.05
0.1
0.15
0.2Long-term interest rate
Return
Appendix 30/26
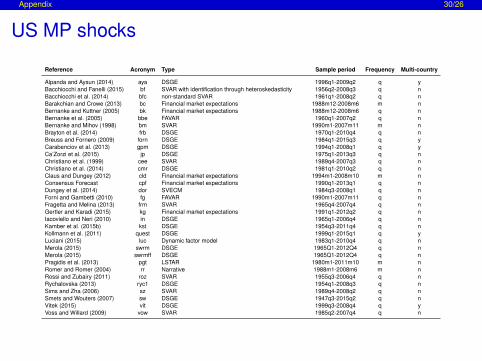
US MP shocks
Reference Acronym Type Sample period Frequency Multi-country
Alpanda and Aysun (2014) aya DSGE 1996q1-2009q2 q yBacchiocchi and Fanelli (2015) bf SVAR with identification through heteroskedasticity 1956q2-2008q3 q nBacchiocchi et al. (2014) bfc non-standard SVAR 1961q1-2008q2 q nBarakchian and Crowe (2013) bc Financial market expectations 1988m12-2008m6 m nBernanke and Kuttner (2005) bk Financial market expectations 1988m12-2008m6 q nBernanke et al. (2005) bbe FAVAR 1960q1-2007q2 q nBernanke and Mihov (1998) bm SVAR 1990m1-2007m11 m nBrayton et al. (2014) frb DSGE 1970q1-2010q4 q nBreuss and Fornero (2009) forn DSGE 1984q1-2015q3 q yCarabenciov et al. (2013) gpm DSGE 1994q1-2008q1 q yCa’Zorzi et al. (2015) jp DSGE 1975q1-2013q3 q nChristiano et al. (1999) cee SVAR 1989q4-2007q3 q nChristiano et al. (2014) cmr DSGE 1981q1-2010q2 q nClaus and Dungey (2012) cld Financial market expectations 1994m1-2008m10 m nConsensus Forecast cpf Financial market expectations 1990q1-2013q1 q nDungey et al. (2014) dor SVECM 1984q3-2008q1 q nForni and Gambetti (2010) fg FAVAR 1990m1-2007m11 q nFragetta and Melina (2013) frm SVAR 1965q4-2007q4 q nGertler and Karadi (2015) kg Financial market expectations 1991q1-2012q2 q nIacoviello and Neri (2010) in DSGE 1965q1-2006q4 q nKamber et al. (2015b) kst DSGE 1954q3-2011q4 q nKollmann et al. (2011) quest DSGE 1999q1-2015q1 q yLuciani (2015) luc Dynamic factor model 1983q1-2010q4 q nMerola (2015) swrm DSGE 1965Q1-2012Q4 q nMerola (2015) swrmff DSGE 1965Q1-2012Q4 q nPragidis et al. (2013) pgt LSTAR 1980m1-2011m10 m nRomer and Romer (2004) rr Narrative 1988m1-2008m6 m nRossi and Zubairy (2011) roz SVAR 1955q3-2006q4 q nRychalovska (2013) ryc1 DSGE 1954q1-2008q3 q nSims and Zha (2006) sz SVAR 1989q4-2008q2 q nSmets and Wouters (2007) sw DSGE 1947q3-2015q2 q nVitek (2015) vit DSGE 1999q3-2008q4 q yVoss and Willard (2009) vow SVAR 1985q2-2007q4 q n
Appendix 31/26
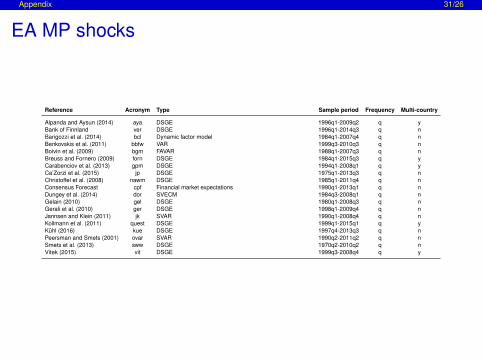
EA MP shocks
Reference Acronym Type Sample period Frequency Multi-country
Alpanda and Aysun (2014) aya DSGE 1996q1-2009q2 q yBank of Finnland ver DSGE 1996q1-2014q3 q nBarigozzi et al. (2014) bcl Dynamic factor model 1984q1-2007q4 q nBenkovskis et al. (2011) bbfw VAR 1999q3-2010q3 q nBoivin et al. (2009) bgm FAVAR 1988q1-2007q3 q nBreuss and Fornero (2009) forn DSGE 1984q1-2015q3 q yCarabenciov et al. (2013) gpm DSGE 1994q1-2008q1 q yCa’Zorzi et al. (2015) jp DSGE 1975q1-2013q3 q nChristoffel et al. (2008) nawm DSGE 1985q1-2011q4 q nConsensus Forecast cpf Financial market expectations 1990q1-2013q1 q nDungey et al. (2014) dor SVECM 1984q3-2008q1 q nGelain (2010) gel DSGE 1980q1-2008q3 q nGerali et al. (2010) ger DSGE 1998q1-2009q4 q nJannsen and Klein (2011) jk SVAR 1990q1-2008q4 q nKollmann et al. (2011) quest DSGE 1999q1-2015q1 q yKühl (2016) kue DSGE 1997q4-2013q3 q nPeersman and Smets (2001) ovar SVAR 1990q2-2011q2 q nSmets et al. (2013) sww DSGE 1970q2-2010q2 q nVitek (2015) vit DSGE 1999q3-2008q4 q y

Appendix 32/26
UK MP shocks
Reference Acronym Type Sample period Frequency Multi-country
Andreasen (2011) and DSGE 1990q1-2008q3 q nBurgess et al. (2013) boe DSGE 1987q3-2007q4 q nCa’Zorzi et al. (2015) jp DSGE 1975q1-2013q3 q nCesa-Bianchi et al. (2016) ctv Financial market expectations 1997m7-2015m6 m nCloyne and Hürtgen (forthcoming) clh Narrative 1975m1-2007m12 q nConsensus Forecast cpf Financial market expectations 1990q1-2013q1 q nEllis et al. (2014) mum TV-FAVAR 1976q1-2005q4 q nFaccini et al. (2013) fmz DSGE 1971q1-2009q4 q nHarrison and Oomen (2010) harr DSGE 1958q1-2007q1 q nKamber and Millard (2012) km SVAR 1979q4-2007q4 q nMumtaz and Theophilopoulou (2016) mut BSVAR 1976q2-2009q1 q nVitek (2015) vit DSGE 1999q3-2008q4 q y
Appendix 33/26
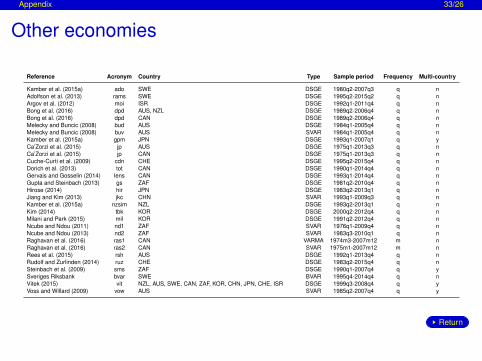
Other economies
Reference Acronym Country Type Sample period Frequency Multi-country
Kamber et al. (2015a) ado SWE DSGE 1980q2-2007q3 q nAdolfson et al. (2013) rams SWE DSGE 1995q2-2015q2 q nArgov et al. (2012) moi ISR DSGE 1992q1-2011q4 q nBong et al. (2016) dpd AUS, NZL DSGE 1989q2-2006q4 q nBong et al. (2016) dpd CAN DSGE 1989q2-2006q4 q nMelecky and Buncic (2008) bud AUS DSGE 1984q1-2005q4 q nMelecky and Buncic (2008) buv AUS SVAR 1984q1-2005q4 q nKamber et al. (2015a) gpm JPN DSGE 1993q1-2007q1 q yCa’Zorzi et al. (2015) jp AUS DSGE 1975q1-2013q3 q nCa’Zorzi et al. (2015) jp CAN DSGE 1975q1-2013q3 q nCuche-Curti et al. (2009) cdn CHE DSGE 1995q2-2015q4 q nDorich et al. (2013) tot CAN DSGE 1990q1-2014q4 q nGervais and Gosselin (2014) lens CAN DSGE 1993q1-2014q4 q nGupta and Steinbach (2013) gs ZAF DSGE 1981q2-2010q4 q nHirose (2014) hir JPN DSGE 1983q2-2013q1 q nJiang and Kim (2013) jkc CHN SVAR 1993q1-2009q3 q nKamber et al. (2015a) nzsim NZL DSGE 1993q2-2013q1 q nKim (2014) tbk KOR DSGE 2000q2-2012q4 q nMilani and Park (2015) mil KOR DSGE 1991q2-2012q4 q nNcube and Ndou (2011) nd1 ZAF SVAR 1976q1-2009q4 q nNcube and Ndou (2013) nd2 ZAF SVAR 1983q3-2010q1 q nRaghavan et al. (2016) ras1 CAN VARMA 1974m3-2007m12 m nRaghavan et al. (2016) ras2 CAN SVAR 1975m1-2007m12 m nRees et al. (2015) rsh AUS DSGE 1992q1-2013q4 q nRudolf and Zurlinden (2014) ruz CHE DSGE 1983q2-2015q4 q nSteinbach et al. (2009) sms ZAF DSGE 1990q1-2007q4 q ySveriges Riksbank bvar SWE BVAR 1995q4-2014q4 q nVitek (2015) vit NZL, AUS, SWE, CAN, ZAF, KOR, CHN, JPN, CHE, ISR DSGE 1999q3-2008q4 q yVoss and Willard (2009) vow AUS SVAR 1985q2-2007q4 q y
Return
Appendix 34/26
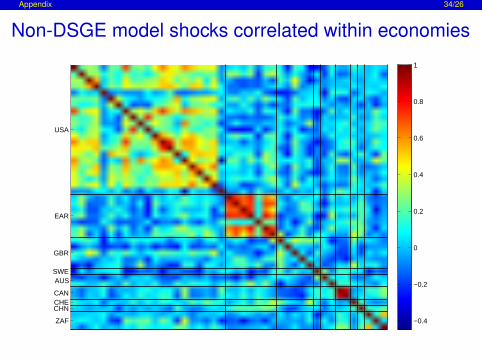
Non-DSGE model shocks correlated within economies
USA
EAR
GBR
SWEAUS
CANCHECHN
ZAF −0.4
−0.2
0
0.2
0.4
0.6
0.8
1
Appendix 35/26
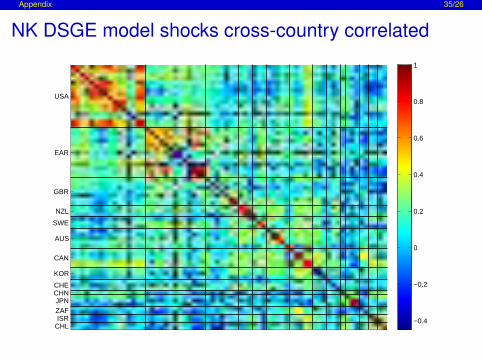
NK DSGE model shocks cross-country correlated
USA
EAR
GBR
NZL
SWE
AUS
CAN
KOR
CHECHNJPNZAFISR
CHL−0.4
−0.2
0
0.2
0.4
0.6
0.8
1
References 35/26
Adolfson, M., Laséen, S., Christiano, L., Trabandt, M., Walentin, K., 2013. RAMSES II - Model Description. Sveriges RiksbankOccasional Paper 12.
Alpanda, S., Aysun, U., 2014. International Transmission of Financial Shocks in an Estimated DSGE Model. Journal ofInternational Money and Finance 47 (C), 21–55.
Andreasen, M., 2011. An Estimated DSGE Model: Explaining Variations in Term Premia. Bank of England Working Paper 441.
Argov, E., Barnea, E., Binyamini, A., Borenstein, E., Elkayam, D., Rozenshtrom, I., 2012. MOISE: A DSGE Model for the IsraeliEconomy. Bank of Israel Discussion Paper 2012.06.
Bacchiocchi, E., Castelnuovo, E., Fanelli, L., 2014. Gimme a Break! Identification and Estimation of the Macroeconomic Effects ofMonetary Policy Shocks in the US. Dipartimento di Scienze Economiche “Marco Fanno” Working Paper 0181.
Bacchiocchi, E., Fanelli, L., 2015. Identification in Structural Vector Autoregressive Models with Structural Changes, with anApplication to US Monetary Policy. Oxford Bulletin of Economics and Statistics 77 (6), 761–779.
Banerjee, R., Devereus, M., Lombardo, G., 2015. Self-Oriented Monetary Policy, Global Financial Markets and Excess Volatility ofInternational Capital Flows. NBER Working Paper 21737.
Barakchian, M., Crowe, C., 2013. Monetary Policy Matters: Evidence from New Shocks Data. Journal of Monetary Economics60 (8), 950–966.
Barigozzi, M., Conti, A. M., Luciani, M., October 2014. Do Euro Area Countries Respond Asymmetrically to the CommonMonetary Policy? Oxford Bulletin of Economics and Statistics 76 (5), 693–714.
Bekaert, G., Hoerova, M., Lo Duca, M., 2013. Risk, Uncertainty and Monetary Policy. Journal of Monetary Economics 60 (7),771–788.
Benkovskis, K., Bessonovs, A., Feldkircher, M., Wörz, J., 2011. The Transmission of Euro Area Monetary Shocks to the CzechRepublic, Poland and Hungary: Evidence from a FAVAR Model. Focus on European Economic Integration (3), 8–36.
Bernanke, B., Boivin, J., Eliasz, P., 2005. Measuring the Effects of Monetary Policy: A Factor-Augmented Vector Autoregressive(FAVAR) Approach. Quarterly Journal of Economics 120 (1), 387–422.
Bernanke, B., Kuttner, K., 2005. What Explains the Stock Market’s Reaction to Federal Reserve Policy? Journal of Finance60 (3), 1221–1257.
Bernanke, B., Mihov, I., 1998. Measuring Monetary Policy. The Quarterly Journal of Economics 113 (3), 869–902.
Boivin, J., Giannoni, M., Mojon, B., December 2009. How Has the Euro Changed the Monetary Transmission Mechanism? In:NBER Macroeconomics Annual 2008, Volume 23. NBER Chapters. National Bureau of Economic Research, pp. 77–125.
Bong, K. S., Doh, T., Park, W. Y., 2016. Yield Curve and Monetary Policy Expectations in Small Open Economies. FederalReserve Bank of Kansas City Working Paper 14-13.
Brayton, F., Laubach, T., Reifschneider, D., 2014. The FRB/US Model: A Tool for Macroeconomic Policy Analysis. FEDS Notes2014-11-21, Board of Governors of the Federal Reserve System.

References 35/26
Breuss, F., Fornero, J., 2009. An Estimated DSGE Model of Austria, the Euro Area and the US: Some Welfare Implications ofEMU. FIW Working Paper 034.
Bruno, V., Shin, H. S., 2015. Cross-Border Banking and Global Liquidity. Review of Economic Studies 82 (2), 535–564.
Burgess, S., Fernandez-Corugedo, E., Groth, C., Harrison, R., Monti, F., Theodoridis, K., Waldron, M., 2013. The Bank ofEngland’s Forecasting Platform: COMPASS, MAPS, EASE and the Suite of Models. Bank of England Working Paper 471.
Canova, F., 2005. The Transmission of US Shocks to Latin America. Journal of Applied Econometrics 20 (2), 229–251.
Carabenciov, I., Freedman, C., Garcia-Saltos, R., Laxton, D., Kamenik, O., Manchev, P., 2013. GPM6 - The Global ProjectionModel with 6 Regions. IMF Working Paper 87.
Ca’Zorzi, M., Kolasa, M., Rubaszek, M., 2015. Exchange Rate Forecasting with DSGE Models. mimeo.
Cesa-Bianchi, A., Thwaites, G., Vicondoa, A., 2016. Monetary Policy Transmission in an Open Economy: New Data andEvidence from the United Kingdom. mimeo.
Christiano, L., Eichenbaum, M., Evans, C., 1999. Monetary Policy Shocks: What Have We Learned and to What End? In: Taylor,J. B., Woodford, M. (Eds.), Handbook of Monetary Economics. Amsterdam: Elsevier Science, pp. 65–148.
Christiano, L. J., Eichenbaum, M., Evans, C. L., 2005. Nominal Rigidities and the Dynamic Effects of a Shock to Monetary Policy.Journal of Political Economy 113 (1), 1–45.
Christiano, L. J., Motto, R., Rostagno, M., 2014. Risk Shocks. American Economic Review 104 (1), 27–65.
Christoffel, K., Coenen, G., Warne, A., 2008. The New Area-Wide Model of the Euro Area: A Micro-Founded Open-EconomyModel for Forecasting and Policy Analysis. ECB Working Paper 0944.
Claus, E., Dungey, M., 2012. US Monetary Policy Surprises: Identification with Shifts and Rotations in the Term Structure. Journalof Money, Credit and Banking 44 (7), 1443–1453.
Cloyne, J., Hürtgen, P., forthcoming. The Macroeconomic Effects of Monetary Policy: A New Measure for the United Kingdom.American Economic Journal: Macroeconomics.
Coenen, G., Wieland, V., 2002. Inflation Dynamics and International Linkages: A Model of the United States, the Euro Area andJapan. ECB Working Paper 0181.
Cuche-Curti, N. A., Dellas, H., Natal, J.-M., 2009. A Dynamic Stochastic General Equilibrium Model for Switzerland. SwissNational Bank Economic Studies 2009-05.
Dedola, L., Lombardo, G., 2012. Financial Frictions, Financial Integration and the International Propagation of Shocks. EconomicPolicy 27 (70), 319–359.
Dedola, L., Rivolta, G., Stracca, L., 2015. When the Fed Sneezes, Who Gets a Cold? mimeo.
Dorich, J., Johnston, M., Mendes, R., Murchison, S., Zhang, Y., 2013. ToTEM II: An Updated Version of the Bank of Canada’sQuarterly Projection Model. Technical Reports 100, Bank of Canada.

References 35/26
Dungey, M., Osborn, D., Raghavan, M., 2014. International Transmissions to Australia: The Roles of the USA and Euro Area. TheEconomic Record 90 (291), 421–446.
Ellis, C., Mumtaz, H., Zabczyk, P., 05 2014. What Lies Beneath? A Time-varying FAVAR Model for the UK TransmissionMechanism. Economic Journal 124 (576), 668–699.
Faccini, R., Millard, S., Zanetti, F., 2013. Wage Rigidities in an Estimated Dynamic, Stochastic, General Equilibrium Model of theUK Labour Market. The Manchester School 81, 66–99.
Feldkircher, M., Huber, F., 2015. The International Transmission of US Structural Shocks: Evidence from Global VectorAutoregressions. European Economic Review 81, 167–188.
Forni, M., Gambetti, L., 2010. The Dynamic Effects of Monetary Policy: A Structural Factor Model Approach. Journal of MonetaryEconomics 57 (2), 203–216.
Fragetta, M., Melina, G., 2013. Identification of Monetary Policy in SVAR Models: A Data-oriented Perspective. EmpiricalEconomics 45 (2), 831–844.
Gelain, P., 2010. The External Finance Premium in the Euro Area: A Dynamic Stochastic General Equilibrium Analysis. TheNorth American Journal of Economics and Finance 21 (1), 49–71.
Georgiadis, G., forthcoming. Determinants of Global Spillovers from US Monetary Policy. Journal of International Money andFinance.
Gerali, A., Neri, S., Sessa, L., Signoretti, F. M., 2010. Credit and Banking in a DSGE Model of the Euro Area. Journal of Money,Credit and Banking 42 (1), 107–141.
Gertler, M., Karadi, P., 2011. A Model of Unconventional Monetary Policy. Journal of Monetary Economics 58 (1), 17–34.
Gertler, M., Karadi, P., 2015. Monetary Policy Surprises, Credit Costs, and Economic Activity. American Economic Journal:Macroeconomics 7 (1), 44–76.
Gervais, O., Gosselin, M.-A., 2014. Analyzing and Forecasting the Canadian Economy through the LENS Model. TechnicalReports 102, Bank of Canada.
Gupta, R., Steinbach, R., 2013. A DSGE-VAR Model for Forecasting Key South African Macroeconomic Variables. EconomicModelling 33, 19–33.
Harrison, R., Oomen, O., 2010. Evaluating and Estimating a DSGE Model for the United Kingdom. Bank of England WorkingPaper 380.
Hirose, Y., 2014. An Estimated DSGE Model with a Deflation Steady State. CAMA Working Paper 2014-52.
Iacoviello, M., Neri, S., 2010. Housing Market Spillovers: Evidence from an Estimated DSGE Model. American Economic Journal:Macroeconomics 2 (2), 125–64.
Jannsen, N., Klein, M., 2011. The International Transmission of Euro Area Monetary Policy Shocks. Kiel Institute for the WorldEconomy Working Paper 1718.

References 35/26
Jiang, J., Kim, D., 2013. Is China’s Monetary Policy Effective? Evaluating the VAR Evidence. China Economic Policy Review 2 (2),1–21.
Kamber, G., McDonald, C., Sander, N., Theodoridis, K., 2015a. A Structural Model for Policy Analysis and Forecasting: NZSIM.Reserve Bank of New Zealand Discussion Paper 2015/05.
Kamber, G., Millard, S., December 2012. Using Estimated Models to Assess Nominal and Real Rigidities in the United Kingdom.International Journal of Central Banking 8 (4), 97–119.
Kamber, G., Smith, C., Thoenissen, C., 2015b. Financial Frictions and The role of Investment-specific Technology Shocks in theBusiness Cycle. Economic Modelling 51, 571–582.
Kim, S., 2001. International Transmission of U.S. Monetary Policy Shocks: Evidence from VAR’s. Journal of Monetary Economics48 (2), 339–372.
Kim, T. B., 2014. Analysis on Korean Economy with an Estimated DSGE Model after 2000. KDI Journal of Economic Policy 36 (2),1–64.
Kollmann, R., 2013. Global Banks, Financial Shocks, and International Business Cycles: Evidence from an Estimated Model.Journal of Money, Credit and Banking 45 (2), 159–195.
Kollmann, R., Pataracchia, B., Raciborski, R., Ratto, M., Roeger, W., Vogel, L., 2011. The Post-Crisis Slump in the Euro Area andthe US: Evidence from an Estimated Three-Region DSGE Model. mimeo.
Kühl, M., 2016. Government bond purchases and their transmission through the financial sector in an estimated banking model ofthe euro area. mimeo.
Luciani, M., 03 2015. Monetary Policy and the Housing Market: A Structural Factor Analysis. Journal of Applied Econometrics30 (2), 199–218.
Melecky, M., Buncic, D., 2008. An Estimated, New Keynesian Policy Model for Australia. Economic Record 84 (264), 1–16.
Merola, R., 2015. The role of financial frictions during the crisis: An estimated DSGE model. Economic Modelling 48 (C), 70–82.
Milani, F., Park, S. H., 2015. The Effects of Globalization on Macroeconomic Dynamics in a Trade-dependent EEconomy: TheCase of Korea. Economic Modelling 48 (C), 292–305.
Mumtaz, H., Theophilopoulou, A., 2016. The Impact of Monetary Policy on Inequality in the UK: An Empirical Analysis. QueenMary University of London Working Paper 738.
Ncube, M., Ndou, E., 2011. Monetary Policy Transmission, House Prices and Consumer Spending in South Africa: An SVARApproach. African Development Bank Working Paper 317.
Ncube, M., Ndou, E., 2013. Monetary Policy and Exchange Rate Shocks on South African Trade Balance. African DevelopmentBank Working Paper 448.
Passari, E., Rey, H., 2015. Financial Flows and the International Monetary System. Economic Journal 125 (584), 675–698.
26/26
Peersman, G., Smets, F., 2001. The Monetary Transmission Mechanism in the Euro Area: More Evidence from VAR Analysis.ECB Working Paper 91.
Pragidis, I., Gogas, P., Tabak, B., 2013. Asymmetric Effects of Monetary Policy in the US and Brazil. Democritus University ofThrace Research Papers in Economics 7-2013.
Raghavan, M., Athanasopoulos, G., Silvapulle, P., 2016. Canadian Monetary Policy Analysis Using a Structural VARMA Model.Canadian Journal of Economics 49 (1).
Rees, D., Smith, P., Hall, J., 2015. A Multi-sector Model of the Australian Economy. Reserve Bank of Australia ResearchDiscussion Paper (2015-07).
Rey, H., 2015. Dilemma not Trilemma: The Global Financial Cycle and Monetary Policy Independence. NBER Working Paper21162.
Romer, C., Romer, D., 2004. A New Measure of Monetary Shocks: Derivation and Implications. American Economic Review94 (4), 1055–1084.
Rossi, B., Zubairy, S., 2011. What Is the Importance of Monetary and Fiscal Shocks in Explaining U.S. MacroeconomicFluctuations? Journal of Money, Credit and Banking 43 (6), 1247–1270.
Rudolf, B., Zurlinden, M., 2014. A Compact Open-Economy DSGE Model for Switzerland. Swiss National Bank Economic Studies2014-08.
Rychalovska, Y., 2013. The Implications of Financial Frictions and Imperfect Knowledge in the Estimated DSGE Model of the USEconomy. CERGE-EI Working Paper 482.
Sims, C., Zha, T., 2006. Were There Regime Switches in U.S. Monetary Policy? American Economic Review 96 (1), 54–81.
Smets, F., Warne, A., Wouters, R., 2013. Professional Forecasters and the Real-time Forecasting Performance of an EstimatedNew Keynesian Model for the Euro Area. ECB Working Paper 1571.
Smets, F., Wouters, R., 2003. An Estimated Dynamic Stochastic General Equilibrium Model of the Euro Area. Journal of theEuropean Economic Association 1 (5), 1123–1175.
Smets, F., Wouters, R., 2007. Shocks and Frictions in US Business Cycles: A Bayesian DSGE Approach. American EconomicReview 97 (3), 586–606.
Steinbach, R., Mathuloe, P., Smit, B., 2009. An Open-Economy New Keynesian DSGE Model of the South African Economy09/01.
Vitek, F., 2015. Macrofinancial Analysis in the World Economy : A Panel Dynamic Stochastic General Equilibrium Approach. IMFWorking Paper 15/227.
Voss, G., Willard, L., 2009. Monetary Policy and the Exchange Rate: Evidence from a Two-country Model. Journal ofMacroeconomics 31 (4), 708–720.