financial guide for the rural health care leader during
TRANSCRIPT

Financial Guide for the Rural Health
Care Leader During COVID and Post-
COVID
October 2021
525 South Lake Avenue, Suite 320 Duluth, Minnesota 55802 (218) 727-9390 | [email protected] | www.ruralcenter.org
This project is/was supported by the Health Resources and Services Administration (HRSA) of the U.S. Department of Health and Human Services (HHS) under grant number UB1RH24206, Information Services to Rural Hospital Flexibility Program Grantees, $1,009,120 (0% financed with nongovernmental sources). This information or content and conclusions are those of the author and should not be construed as the official position or policy of, nor should any endorsements be inferred by HRSA, HHS or the U.S. Government.

NATIONAL RURAL HEALTH RESOURCE CENTER 1
This report was prepared by:
National Rural Health Resource Center
525 S Lake Ave, Suite 320
Duluth, Minnesota 55802
Phone: 218-727-9390
www.ruralcenter.org
and
Ralph Llewellyn, Partner
and Brian Bertsch, Principal
Eide Bailly
https://www.eidebailly.com/

NATIONAL RURAL HEALTH RESOURCE CENTER 2
Contents Purpose ..................................................................................................... 3 Executive Summary ..................................................................................... 3
The Indicators .......................................................................................... 4 The Strategies ......................................................................................... 5
Introduction ............................................................................................... 6 The Financial Indicators ................................................................................ 6
Days in Gross Accounts Receivable / Days in Net Accounts Receivable............... 7 Days Cash On Hand .................................................................................. 9 Total Margin .......................................................................................... 11 Operating Margin .................................................................................... 12 Current Ratio ......................................................................................... 14 Debt Service Coverage ............................................................................ 15 Salaries to Net Patient Revenue ................................................................ 16 Payer Mix Percentage .............................................................................. 19 Average Age of Plant ............................................................................... 20 Long Term Debt to Capitalization .............................................................. 21
Strategies to Address and Improve Financial Performance and Condition ............ 23 Community Health Needs Assessments ...................................................... 23 Strategic Planning................................................................................... 25 Assessing Operational Efficiency and Effectiveness ....................................... 28 Exploration of Population Health and Wellness Opportunities.......................... 30 Reinventing Themselves .......................................................................... 32 Service Line Analysis ............................................................................... 35 Telehealth Services ................................................................................. 36 Outmigration ......................................................................................... 38 Maintaining Ongoing Education ................................................................. 40
Conclusion ............................................................................................... 42 Appendix ................................................................................................. 43

NATIONAL RURAL HEALTH RESOURCE CENTER 3
Purpose This manual was developed for use by state Medicare Rural Hospital Flexibility (Flex) Program personnel, leaders of critical access hospitals (CAHs) and provider based rural health clinics (RHCs), and others that assist these providers in managing their long-term financial performance. The content is designed to be as non-technical as possible and to provide guidance regarding the potential and anticipated impact the COVID Public Health Emergency (PHE) will have on top financial indicators during and after the PHE. Strategies on how to address the financial indicators have been included to guide CAH and provider based RHC leaders as organizations navigate the challenges of the PHE and post-PHE periods. Successful implementation of the action plans will assist providers improve overall performance long after the effects of the PHE have passed.
Executive Summary The COVID pandemic created significant financial challenges for rural health care providers. While the severity of the impacts varies by provider, there has been major financial impact of COVID on providers:
• Lower patient volumes as clinic patients cancel and avoid in-person visits, surgeries are cancelled, and other elective services are postponed.
• Lower volumes lead to lower revenues from inpatient and outpatient services.
• New infusions of cash are received from Paycheck Protection Payments (PPP), Provider Relief Funds (PRF), Medicare Advanced Payments (MAP), and other external funding sources.
• Increased expenses related to personal protective equipment (PPE), ventilators, employed and contracted staffing, and temporary relocations of services.
As Rural health leaders continue to monitor financial indicators, they find themselves having to develop an understanding of the impact of the COVID pandemic on these indicators and develop strategies for moving into the future. The changes in financial operations during this time are expected to show significant changes in reported financial indicators when compared to historic performance. Some of these variations are expected to be short term while others may have long term implications on health care organizations and their financial indicators.
This manual describes the potential impact the PHE may have on individual financial indicators and strategies for monitoring these indicators during this period of significant change. But monitoring these indicators will not be enough for some

NATIONAL RURAL HEALTH RESOURCE CENTER 4
organizations. For some rural health leaders, strategies will need to be implemented to ensure long term survival. For others, implementing new strategies may provide significant benefits to take advantage of opportunities to improve financial performance, increase access, and decrease outmigration.
The Indicators Days in Gross Accounts Receivable / Days in Net Accounts Receivable – Increases in unemployment, uninsured rates and economic uncertainty are expected to lead to higher days in receivables. However, some providers utilized this period of lower volumes to help “catch-up” on outstanding balances. In these situations, providers could be reporting improvement in their reported days in receivables.
Days Cash on Hand – The influx of funds from PPP, PRF, MAP, and other sources are expected to result in higher average days cash on hand in initial reporting. As time progresses it is anticipated these balances will be depleted.
Total Margin – Expect to see great levels of fluctuations in this financial indicator. While decreased revenues are expected to hit all providers, the amount of PPP, PRF, and other outside funding will vary significantly based on the providers ability to qualify for the funds, desire to apply for various funding, and the decision on whether to retain all funding.
Operating Margin – Overall expect to see lower operating margins during 2020 and 2021. While outside funding will help prop up total margin for many providers, the outside funding is not considered operating income for many provider types.
Current Ratio – The estimated impact of COVID on this ratio is dependent on the historical current ratio. One should expect a reduction in the average current ratio for those with a higher than 1.0 current ratio. For those with less than a 1.0 historical current ratio, there could be an increase in the reported current ratio.
Debt Service Coverage – The uncertainty noted in total margin will also create uncertainty in this financial indicator.
Salaries to Net Patient Revenue – Increases in staffing costs and decreases in net patient revenues would indicate an expected increase in the average salaries to net patient revenue. However, if there were shifts in staffing from employed staff to contracted staff, providers could see stable to decreasing salaries to net patient revenue.
Payor Mix Percentage – With Medicare beneficiaries being older and at a higher risk of complications from COVID, one could anticipate a higher Medicare Payor Mix Percentage. However, the elderly have also shown a higher level of acceptance for vaccinations. At the same time there are newer variants that are having an impact on the younger population. Over time, this could drive a lower Medicare Payor Mix

NATIONAL RURAL HEALTH RESOURCE CENTER 5
Percentage. Great fluctuations could occur by region of the country based on vaccination rates.
Average Age of Plant – A slight increase in average age of plant is expected initially as delays in capital projects have occurred during the PHE. Anticipate a return to more historical levels as time progresses as delayed projects are completed.
Long Term Debt to Capitalization – Anticipate stable levels in 2020 and 2021 as there were lower levels of new debt with ongoing payment on existing debt.
The Strategies The financial challenges posed by COVID are going to require providers to identify new ways to manage their organizations. Strategies to assist in improving financial performance and condition have been identified in the following areas:
• Community Health Needs Assessments • Strategic Planning • Assessing Operational Efficiency and Effectiveness • Exploration of Population Health and Wellness Opportunities • Reinventing Themselves • Service Line Analysis • Telehealth Services • Outmigration • Maintaining Ongoing Education
With the proper commitment and organizational focus, these strategies can assist the rural health organization improve financial indicator performance and better position the organization for long term financial stability.

NATIONAL RURAL HEALTH RESOURCE CENTER 6
Introduction The COVID pandemic has and is expected to continue to create challenges to CAH and provider based RHC leaders as they continue to monitor the top financial indicators and strive to achieve positive results. The major financial impacts include:
• Lower patient volumes as clinic patients cancel and avoid in-person visits, surgeries are cancelled, and other elective services are postponed. Some of these lower volumes may be temporary, but we have also seen changes in patient preferences and approach to seeking health care that will have an impact on long term volumes for individual organizations.
• Lower volumes lead to lower revenues from inpatient and outpatient services.
• New infusions of cash are received from Paycheck Protection Payments (PPP), Provider Relief Funds (PRF), Medicare Advanced Payments (MAP), and other external funding sources.
• Increased expenses related to personal protective equipment (PPE), ventilators, employed and contracted staffing, and temporary relocations of services.
The Financial Indicators A comprehensive explanation and calculation of the financial indicators can be found in the Small Rural Hospital and Clinic Finance 101 Manual on the National Rural Health Resource Center website. The manual also includes the U.S. CAH median for each financial indicator to serve as a benchmark. The below content highlights 11 key financial indicators and guidance regarding the potential and anticipated impact the COVID Public Health Emergency (PHE) will have on these top financial indicators during and after the PHE. Each indicator is described, including its calculation methodology. Context is then provided on what is occurring in the industry and what is anticipated in the future.
Unless otherwise noted, as state and national data is released for 2020 and 2021, it is expected that there will be great fluctuation in individual facility results as well as state and national results as compared to prior years. The variation in local volumes, local economics, and the amount of outside funding received may all impact each facility differently.

NATIONAL RURAL HEALTH RESOURCE CENTER 7
Days in Gross Accounts Receivable / Days
in Net Accounts Receivable
Measures the number of days it takes an organization to collect its payments. Lower values are favorable.
HOW DAYS IN GROSS ACCOUNTS RECEIVABLE IS CALCULATED:
Gross Accounts Receivable / Gross Revenue / 365
HOW DAYS IN NET ACCOUNTS RECEIVABLE IS CALCULATED:
Net Accounts Receivable / Net Revenue / 365
During the PHE overall patient volumes have been down which has driven a decrease in gross and net revenues for most providers. At the same time there have been significant increases in the unemployment levels with an unemployment rate of 11.1% in June 2020. There has been some improvement in nation unemployment levels with an unemployment rate of 5.9% reported in June in 2021. However, this lower rate still exceeds the rates before the PHE which were running below 4.0%. Increases in unemployment rates can be expected to lead to increased days in accounts receivable as households experience their own cashflow challenges. With increases in unemployment, one would expect to also see increases in reported levels of uninsured.
The increases in unemployment rates, anticipated increases in uninsured rates in 2020, and overall financial insecurity have led to increased days in accounts receivable in many situations. This occurs as there is a level or greater percentage of the health care bill that is the responsibility of the patient while family incomes have been reduced for many. This creates increased delays in the cash inflows to the CAH and provider based RHCs as the self-pay patient balances are typically collected at a much slower rate than the balances from commercial payers.

NATIONAL RURAL HEALTH RESOURCE CENTER 8
On the other hand, there have been providers that have seen little change in the calculated days in accounts receivable. Some providers have utilized this time of lower volumes and revenue as an opportunity to “catch-up” on outstanding billing and collections from both commercial payers as well as self-pay balances. For many the receipt of Paycheck Protection Payments (PPP), Provider Relief Funds (PRF), and other external funding provided the necessary cashflow to maintain historical staffing levels during the PHE. Lower current volumes during this same time provided these organizations the ability to address long standing challenges in their accounts receivable balances. While not all CAHs and provider based RHCs received both PPP and PRF, it appears the majority did not furlough or eliminate positions in the business office during this time.
While there may be reasons for fluctuations from past performance, it is still going to be critical that all CAHs and provider based RHCs closely monitor these financial indicators due to the direct impact on the cash flow required to maintain operations. The need for short-term and long term cashflow will not have decreased during the PHE and is not expected to change in the future.
Until state and national results stabilize, and new benchmarks are identified and established, leaders will need to consider managing to their pre-COVID benchmarks and historical performance levels. There will also be a need for internal facility specific discussion and documentation on what had changed in their specific environment and how these changes should have impacted the days in accounts receivable calculations versus how the changes did impact the organization.
RECOMMENDED STRATEGY
From here, internal strategies need to be developed to (1) improve results back to historical levels or closer to benchmarks and/or (2) maintain gains that were achieved during the PHE due to being able to clean up historically challenging account balances.

NATIONAL RURAL HEALTH RESOURCE CENTER 9
Days Cash On Hand
Measures the number of days an organization could operate if no additional cash was collected or received. Higher levels of Days Cash On Hand are favorable.
HOW DAYS CASH ON HAND IS CALCULATED:
(Cash and Temporary Investments) / ((Total Expenses – Depreciation and Amortization – Provision for Doubtful Accounts) / 365)
In the earliest days of the PHE there were significant and justifiable concerns about the ability for CAHs and provider based RHCs to meet the short term cashflow needs of their organizations. A large number of CAHs and provider based RHCs were experiencing serious cashflow and other financial challenges before the pandemic. In response, legislation was passed, and rules adopted to provide large lump sum cash deposits through PPP, PRF, and Medicare Advanced Payments. These various lump sum payments were made in an unprecedented short timeline to help ensure some stability for providers to be able to maintain necessary services to combat COVID as well as regular ongoing health care needs. The amount of dollars received by provider has varied significantly based on individual elections, type, and size of the organization as well as organizational/legal structure. However, regardless of these varying factors all organizations will have seen some level of lump sum payments being received by their organization.
The required use of these funds also varies. Some lump sum payment balances received may be forgiven based on documenting lost revenues, incurring and documenting expenses, or a mixture of lost revenue and on incurring and documenting expenses. Others are essentially prepayments that must be repaid to or recouped by Medicare in the future. In addition, some providers opted to return lump sum payments received for a variety of reasons. These reasons include a perceived lack of need for the additional outside resources, receipt of dollar amounts greater than the organization felt they could properly utilize, perceptions that payments may have been made in error, and concerns related to the reporting requirements attached to most of these funds.
For a large portion of the facilities, as well as the state and national averages, it is anticipated that organizations will initially report higher calculated days cash on hand due to the influx of the initial funds. There is risk that these higher

NATIONAL RURAL HEALTH RESOURCE CENTER 10
calculations may create some inappropriate assumptions and actions by leaders and outside observers. Some of these funds must be forgiven based on lost revenues or additional expenses (e.g., PRF) while others must be repaid or recouped (e.g., Medicare Advanced Payments). As time progresses and there are losses in revenue, incurring of expenses, and repayment/recoupment occurs, it is anticipated that the average days cash on hand will begin to revert to more historical levels. Since PPP was related to existing/ongoing staffing costs and not new expenses, these funds may provide for a higher days cash on hand for a longer time period for providers that did not experience significant losses in volumes.
All of the aforementioned activity will create challenges for providers as they attempt to monitor their performance against historical benchmarks and against other organizations.
RECOMMENDED STRATEGY
Until state and national results stabilize, and new benchmarks are established leaders will need to consider how much of their current cash has been earmarked for future lost revenues, future additional expenses, and eventual repayment/recoupment.
These identified balances can then be adjusted from current cash balances to calculate an adjusted days cash on hand which can be compared to their pre-COVID benchmarks and actual performance levels.
RECOMMENDED STRATEGY
The facilities should also consider compiling internal facility specific calculations to estimate the timing of identified lost revenues, additional expenses, and repayment/recoupment of cash. Until such time that all uses of funds have been documented and occurred, there may be a greater need to create more detailed monthly cashflow budgets to better anticipate and manage future cashflow needs and abilities.

NATIONAL RURAL HEALTH RESOURCE CENTER 11
Total Margin
Measures the control of expenses relative to revenues. Higher values are favorable.
HOW TOTAL MARGIN IS CALCULATED:
Change in Net Assets / Total Revenue
In many ways, this is one financial indicator that may have the greatest fluctuation from historical performance as well as between individual providers. CAHs and provider based RHCs that did not participate in PPP, receive PRF, and/or did not meet the requirements for recognizing PRF funds as revenue would be expected to see lower than historic total margins due to lost revenues and increased expenses that have not been offset by the above-mentioned funding sources. At that same time CAHs and RHCs that participated in PPP, received PRF, and did meet the requirements for recognizing PRF funds as revenue could see anything from lower to improved total margins.
In 2020 and 2021, some providers may report significantly higher total margins than they have historically experienced while others may report historically lower total margins. One could expect to see continued fluctuations in total margins until all PPP funds have been used and/or all PRF funds have been earned and/or returned.

NATIONAL RURAL HEALTH RESOURCE CENTER 12
RECOMMENDED STRATEGY
In the interim, leaders should consider continued monitoring and measurement against historical benchmarks with adjustment for known anomalies. This would include consideration and analysis of facility-by-facility PPP and PRF activities as well as short term revenue and expense changes to best estimate an adjusted total margin that would have been achieved without COVID funding activity. It could also include changes that were seen in investment income that were outside the historical norms for the organization. The goal of the additional analysis is to determine how much of the total margin is due to unusual circumstances. This can assist in monitoring the results without the additional funding that was received.
While only an estimate, this information can be an indication to leaders of the ability to drive long term total margin and the potential need to implement short term and long term strategic changes to protect overall financial performance of the facility.
Operating Margin
Measures the control of operating expenses relative to operating revenues related to patient care. Higher Operating Margins are favorable.
HOW OPERATING MARGIN IS CALCULATED:
Net Operating Income / Total Operating Income
The previously noted major financial impacts are anticipated to result in lower operating margins during 2020 and 2021. The exact level and length of the impact is not yet known. While some of these impacts may be temporary, there are

NATIONAL RURAL HEALTH RESOURCE CENTER 13
legitimate concerns that there may be a slow, and not complete, return in revenues and that there are some expenses that may never return to pre-COVID levels.
One complicating factor in the calculation of operating margin is the receipt and recognition of revenue from PPP and PRF forgiveness. Financial reporting rules may handle the reporting of these revenues as operating income for some providers (e.g., governmental entities) while these same funds may be considered as operating income or non-operating income by others based on management’s accounting policies and the specific use of the funds. This is expected to create greater levels of fluctuations between historical and current levels in the short run.
RECOMMENDED STRATEGY
In the interim until all PPP and PRF balances have been resolved, leaders should consider continued monitoring and measurement against historical benchmarks with consideration and analysis of facility by facility PPP and PRF activities as well as short term revenue and expense changes to best estimate an adjusted operating margin that would have been achieved without COVID funding activity. The goal of the additional analysis is to determine how much of the operating margin is due to unusual circumstances. While only an estimate, this information can be an indication to leaders of the ability to drive long term total margin and the potential need to implement short term and long term strategic changes to protect overall financial performance of the facility.
Slow to return revenues could easily occur as patients adopt permanent changes in preference on how to access care (e.g., telehealth, online research, etc.), changes in preferred providers due to alternative experiences during the PHE, and new competitors in the market.
Long term labor costs are also a potentially large factor to be considered. During the PHE, the cost for labor went up significantly for many organizations as they found themselves in situations in which they were required pay out higher amounts of overtime and bonuses to maintain essential staffing levels and attract the necessary talent. Even with these higher compensation amounts the need for contracted staffing has never been higher and the contracted staffing hourly costs could easily exceed 3-4 times the historical cost of employed staff. Some organizations experienced significant losses in employed staff as staffing agencies heavily recruited employed staff which helped create the shortage of employed staff in the market. As the outside staffing agencies have become more aggressive in certain markets, the market rates to attract employed staffing has continued to

NATIONAL RURAL HEALTH RESOURCE CENTER 14
increase. While some of the health care labor market pressures can be expected to subside over time, there is strong indication that overall wage costs will continue to increase due to overall labor shortages. This may drive leaders to search for increased opportunities to implement improvements in productivity and efficiency. In addition to the staffing related costs, there have been new costs in the area of personal protective equipment. These types of costs are not expected to go away in the future but may come under better control as long term supply catches up with long term demand. Over the long run, the increases in costs would be expected to place increased pressure on an organization’s ability to meet historical operating margin benchmarks unless new revenue streams to can be identified and captured.
Current Ratio
Measures the number of times short-term obligations can be paid using short-term assets. A higher Current Ratio is favorable.
HOW CURRENT RATIO IS CALCULATED:
Current Assets / Current Liabilities
The aforementioned increase in cash inflows from PPP, PRF and Medicare Advanced Payments will increase current assets, but also increase short term liabilities until the conditions for forgiveness have been met or repayment/recoupment has occurred. A one-to-one increase in the balances of current assets and current liabilities would be expected to reduce the current ratio on those organizations with higher than a 1.0 current ratio until such point that the conditions for forgiveness have been met. However, the impact should level off and, all other things considered consistent, return to normal levels as conditions for forgiveness are met or repayment / recoupment has occurred. In addition, any significant reductions in accounts receivable due to clean up activities may create some one-time improvement in this ratio.
Understanding the impact of the unusual transactions under the PHE will be critical in assisting a provider in managing this financial indicator over time. The historical

NATIONAL RURAL HEALTH RESOURCE CENTER 15
performance and benchmarks should be considered until new industry benchmarks are established.
RECOMMENDED STRATEGY
In the meantime, providers should consider calculating adjusted current ratios that would remove the changes and current assets and liabilities due to the outstanding PPP, PRF, and Medicare Advanced Payment transactions. This can help somewhat normalize the facility performance until such time that all amounts have been forgiven or repaid/recouped.
Debt Service Coverage
Measures the ability to pay obligations related to long term debt. Higher values are favorable.
HOW DEBT SERVICE COVERAGE IS CALCULATED:
(Change in Net Assets + Interest + Depreciation and Amortization) / (Repayment of Debt + Interest Paid on Long Term Debt)
The overall impact on state and national averages as well as individual facility calculations for 2020 and 2021 are unknown and virtually impossible to estimate. Overall, it is anticipated that the total increase in new debt will have been lower than normal during the 2020 and 2021 time period with many providers placing plans for new facilities, significant renovations, and new high-cost equipment on hold during the PHE due to the numerous financial uncertainties. In normal periods, this may have led to anticipated increases in the overall debt service coverage calculation as some debt balances were repaid and total margins remained constant. The uncertainty already discussed in the total margin section of this manual is expected to create significantly different results for individual facilities based on their specific situation when it comes to total margin.

NATIONAL RURAL HEALTH RESOURCE CENTER 16
An additional potential area of concern with this financial ratio is that it is commonly included in debt covenants. If the debt service coverage ratio falls below a certain defined level, the organization may be required to take additional action such as the use of external consultants or the development of corrective action plans to address the shortfall.
RECOMMENDED STRATEGY
Ultimately, the facility is going to still need to monitor this financial indicator against any debt covenants to attempt to prevent the need to complete the additional requirements. Strategies will need to be developed and implemented to assist in preventing the failure to meet the debt covenants.
These strategies will need to be focused on proactively engaging in activities to increase operating and total margins to the extent possible. Initiating conversations with lenders as soon as debt covenant concerns are identified may also assist in obtaining some less restrictive additional interventions due to the cause of financial struggles.
Salaries to Net Patient Revenue
Measures labor costs relative to the generation of operating revenue from patient care. Lower Salaries to Net Patient Revenue calculations are favorable.
HOW SALARIES TO NET PATIENT REVENUE IS CALCULATED:
Salaries / Net Patient Revenue
While there will be variations, overall, it is expected that the total costs to staff health care organizations will have seen an increase during the PHE. This is especially true in the patient care areas. These increases will come in various components. As previously noted, there have been increases in hourly wages to attract the necessary staff as well as the need to provide new bonus pay and

NATIONAL RURAL HEALTH RESOURCE CENTER 17
retention pay to remain competitive in the market and maintain this staff. Even with increases in hourly wages, bonuses and retention pay to attract and retain staffing levels, there was an overall increase in the use of outside staffing agencies. The hourly cost of these resources could vary but exceeded $150 an hour in many markets. It is possible for some providers to see potential offsets to these costs due to furloughs in low-volume and non-patient care areas, but the use of furloughs did not appear to be significant in CAHs and provider based RHCs as organizations appeared to be attempting to hold on to their staff as much as possible with the use of PPP and other funding sources. Even in those organizations that were working with less than desirable staffing levels, it is not anticipated that the lower staffing levels would always be enough to offset the higher hourly rates to keep total staffing costs below historical levels.
When monitoring this financial indicator, it is important to first understand what is included in the calculation as well as what is not. For salaries, this financial indicator only includes those costs are that are salaries from employment of staff as reported on the Medicare cost report. This does not include any cost for labor that may have been acquired as part of a purchased service from an outside vendor or from a related party. This is a very important clarification due to the significant challenges providers have encountered during the PHE in maintaining the necessary staffing levels with employed staff. As previously noted, this resulted in a large number of providers to obtain necessary resources from outside agencies on a contracted (non-salary) basis.
The anticipated increase in staffing cost is only one half of the calculation. With the expected reductions in volume during the PHE and the potential for lower volumes longer term, there could be some large swings upward in this calculation. However, this could be very dependent on how much of the staffing cost is in wages versus contracted labor. For those facilities that were able to avoid large increases in contracted labor, one would expect to see increases in the salary to net patient revenue calculation. Again, this would be due to higher salary costs being compared to lower net patient revenues. The anticipated impact on those that relied heavier on outside contracted labor could be level or lower salary to net patient revenue calculations depending on how large of shift there was from salaried staffing to contracted staffing.
While it is understandable that this calculation is traditionally made in the manner it is nationally (e.g., the data is only available from the Medicare cost report as salary – contract labor is not separately identified), the formula may not be as beneficial for comparison purposes in the short run until health care operations return to more of a normal state.

NATIONAL RURAL HEALTH RESOURCE CENTER 18
RECOMMENDED STRATEGY
In the short run, organizations may consider updating their own internal calculation to monitor their trend of total costs related to labor. This would include calculating some historical as well as current labor to net patient revenue values that include both wages and contracted labor costs.
While not a perfect calculation, it can assist the organization in monitoring their trends and in the development of corrective action strategies.
Salaries to net patient revenue is an indicator that one should expect will be impacted over the long term. Over time as operations move back towards more of a normal state, it is expected that staffing will move back to a lower reliance on outside staffing agencies. This will definitely help organizations financially and revive the relevance of this financial indicator. However, as there is movement back to salaried staff there should be expected to be new challenges in returning to historical levels and benchmarks. There will be higher pressure seen in the labor markets to attract staff. This not only impacts nursing and other patient care staff, but also others that may now be able to work remotely for organizations outside the current market area. While the flexibility to allow staff to work remotely has been considered as a positive step by many providers, it also creates a new external competitor for much needed non-patient care labor. Not only are organizations competing locally for staff, all staff may be vulnerable to loss to other employers that are in other cities, counties, or states without staff having to relocate. It is also expected that over time revenues will show some improvement which will assist in improving this financial measure. Focusing on pre-authorizations, collecting revenues, eliminating denials, and increasing volumes will be critical. While it is noted that there will be anticipated ongoing challenges to get back to historical levels and benchmarks, the financial reality is that organizations are going to have to identify strategies to manage to historical salary costs through improvements in productivity or identify new opportunities for increase revenues to maintain financial viability.

NATIONAL RURAL HEALTH RESOURCE CENTER 19
Payer Mix Percentage
Inpatient Payer Mix measures the percentage of total inpatient days that are provided to patients of each payer type. Outpatient Payer Mix measures the percentage of total outpatient charges that are for patients of each payer type. Lower Inpatient and Outpatient Medicare Payer Mix Percentages are favorable.
HOW INPATIENT PAYER MIX PERCENTAGE IS CALCULATED:
Inpatient Days for Payer / (Total Inpatient Days – Nursery Bed Days – Nursing Facility Swing Days)
HOW OUTPATIENT PAYER MIX PERCENTAGE IS CALCULATED:
Outpatient Charges for Payer / Total Outpatient Charges
It is difficult to estimate what will be seen as 2020 and 2021 state and national data is released. The changes from previous levels should be expected to vary due to how COVID impacted the various regions of the country as well as how the individual states and communities reacted to COVID with limitations on services, prevalence of COVID, personal preferences, etc.
The Medicare beneficiary is older and more susceptible to the complications of COVID. That could result in higher Medicare inpatient admissions as well as initial outpatient visits for COVID related illnesses by the Medicare population. That would seem to be consistent with reports during the early phase of the PHE. However, as vaccinations became available and were more widely accepted by the elderly, there was a shift in the volumes of admissions for COVID from the elderly to younger populations. For outpatient services there appeared to be a big push by patients of all ages to avoid preventative and other regular outpatient and clinic visits. The ability to avoid outpatient and clinic visits in the short run may have been more successful for younger patients as they tend to have less chronic conditions requiring the attention of their health care provider.

NATIONAL RURAL HEALTH RESOURCE CENTER 20
Historically, it has been considered that a Medicare payer mix percentage (both inpatient and outpatient) that is lower than the median is a positive indicator of financial performance. This is due to the fact that Medicare only covers its portion of allowable costs at 101% and unallowable costs are not included in the Medicare reimbursement calculation.
RECOMMENDED STRATEGY
Therefore, the only ability to drive a positive bottom-line for the organization comes from the commercial payer. That does not mean the strategy is to minimize the Medicare volume, but to maximize the total volumes with all payers with a larger increase or percentage covered by commercial payers to allow for growth in profitability. In the long run providers are going to continue to need to maintain and implement strategies that will maximize their total volumes with a focus on capturing a higher commercial percentage of the market.
Average Age of Plant
Measures the average age in years of the buildings and equipment of an organization. Lower or decreasing values are an indication of a newer facility and/or reinvestment in buildings and equipment. A lower Average Age of Plant is favorable.
HOW AVERAGE AGE OF PLANT IS CALCULATED:
Accumulated Depreciation / (Depreciation and Amortization)
The calculated average age of plant typically does not move much unless there are significant investments in capital such as new facilities, extensive remodeling, or purchases of higher cost technologies (e.g., robotics, imaging equipment, software, etc.). As 2020 and 2021 state and national data is released it should be expected that the state and national averages will increase slightly due to the delays that many providers placed on new facilities, remodels, and new equipment that was not

NATIONAL RURAL HEALTH RESOURCE CENTER 21
related to the PHE. While there have been some additional capital expenditures related to COVID, many of these projects were lower in cost and slow to be completed due to challenges in availability of materials and getting contractors scheduled for the work.
RECOMMENDED STRATEGY
These anticipated increases in average age of plant are most likely temporary as many of these projects and investments in capital will still need to be completed as operations return closer to a normal state. It is very possible the nature of investments may change from what was originally planned to reflect newly identified strategic needs during the PHE, but it should be expected that investments will still need to be made.
Long Term Debt to Capitalization
Measures the percentage of net assets (or equity) that is debt. Lower values are favorable.
HOW LONG TERM DEBT TO CAPITALIZATION IS CALCULATED:
(Long Term Debt, Net of Current Portion) / ((Long Term Debt, Net of Current Portion) + (Net Assets – Accumulated Earnings)
The calculated long term debt to capitalization is similar to the average age of plant as it typically does not move much unless there are significant investments in capital such as new facilities, extensive remodeling, or purchases of higher cost technologies (e.g., robotics, imaging equipment, software, etc.). As 2020 and 2021 state and national data is released it should be expected that the state and national averages could remain very stable for CAHs and provider based RHCs as it is anticipated there were minimal changes in new debt with ongoing repayment on existing debt with a variety of increases and decreases in net assets. It should be expected that new debt will begin to be reported in future periods as organizations

NATIONAL RURAL HEALTH RESOURCE CENTER 22
catch up on delayed projects and invest in newly identified needs. Those organizations that have accessed additional debt during this period will need to focus on strategies to enhance operating and total margins to increase net assets while also continuing to pay down debt.
RECOMMENDED STRATEGY
As noted, it should be expected that new debt will begin to be reported in the future as new projects are initiated. The need to add new capital investments to address previously unknown needs due to the COVID PHE will require providers to monitor and possibly reprioritize strategic investments to stay within the financial capabilities of the organization.

NATIONAL RURAL HEALTH RESOURCE CENTER 23
Strategies to Address and
Improve Financial Performance
and Condition The PHE is expected to have long term financial and operational affects in the health care industry. This will potentially include the overall design of care delivery, long term avoidance of patients accessing preventative and routine care, changes in patient preferences for accessing care, new competitors in the market, and increased costs for personal protective equipment as well as staffing. These long term challenges will require providers to reexamine how they operate internally and how they approach the market to create long term financial stability. The following areas are specific opportunities and strategies that may assist providers better position themselves for the future and should be considered by CAH and provider based RHC leaders.
Community Health Needs Assessments The Community Health Needs Assessment (CHNA) is a requirement for hospitals that wish to maintain their tax-exempt status under §501(c)(3). A large percentage of CAHs and provider based RHCs fall under these requirements. At its core, the CHNA must include input from the broad interests of the community served (including those with a special knowledge in public health), be made widely available to the public, and documented in a written report. In addition, the organization must adopt an implementation strategy to meet the identified needs. Failure to comply with these requirements can lead up to a $50,000 penalty for each year in non-compliance.
Unfortunately, many providers look at the CHNA as just another task that they must complete in order to check a box that it was completed, and the requirements met. In addition, there are significant variations in the depth and type of information that is gathered during the CHNA process. The CHNAs completed by some providers and outside vendors have been designed to meet the bare minimum requirements while others have gone in much greater depth in an attempt to enhance the value of the information gathered and contained in the completed assessment. In addition, there are many governmental, for profit, and other organizations that are not required to complete the CHNA.
NATIONAL RURAL HEALTH RESOURCE CENTER 24
There is a great opportunity for CAHs and provider based RHCs to use the CHNA as a tool to gather information that is very valuable to the organization. This is information above and beyond the basics required under the §501(c)(3) requirement. This would include providers that are not required to complete the CHNA but opt to use the process to gain a better understanding of community needs and the market they serve.
A robust CHNA goes beyond assessing just the health needs of the community today, but looks deeper and explores patient preferences, patient impressions, anticipated future changes in market demographics, and projected future volumes of services based on anticipated changes in demographics, income, and patient care practices. In order to capture this more valuable information, the CHNA includes a market share assessment, projected demographic and income levels, and research regarding anticipated changes in volumes between inpatient and outpatient as well as changes within service lines. Patient preferences and impressions are gathered through the inclusion of survey tools. The survey tools ask specific questions of community members or patients about what providers are used in the service area, why they choose those providers, why they don’t choose other providers, etc. The PHE may have changed patients’ preferences significantly from the past with many having their first experiences with telehealth and other remote care methodologies. Survey data can help better understand the patient’s perspective and acceptance of these new technologies. This information in conjunction with the information gathered in the typical CHNA provides significant information to the organization on opportunities to improve market share, address and improve patient perceptions, improve payer mix, and enhance marketing efforts. While this robust approach to the CHNA is designed to assist in the financial improvement of the health care organization, it has the added potential benefits of impacting health improvement activities and the overall long term health of the community.
A robust CHNA can provide the information necessary to drive increases in overall volumes with typically moderate levels of incremental expense which increases revenues and improves organizational efficiency, increases cashflow, and improves financial stability. This in turn assists in improving many financial indicators such as days in accounts receivable, operating margin, total margin, days cash on hand, current ratio, debt service ratio, salary to net revenue payer mix, and long term debt to capitalization.
NATIONAL RURAL HEALTH RESOURCE CENTER 25
RECOMMENDED STRATEGY
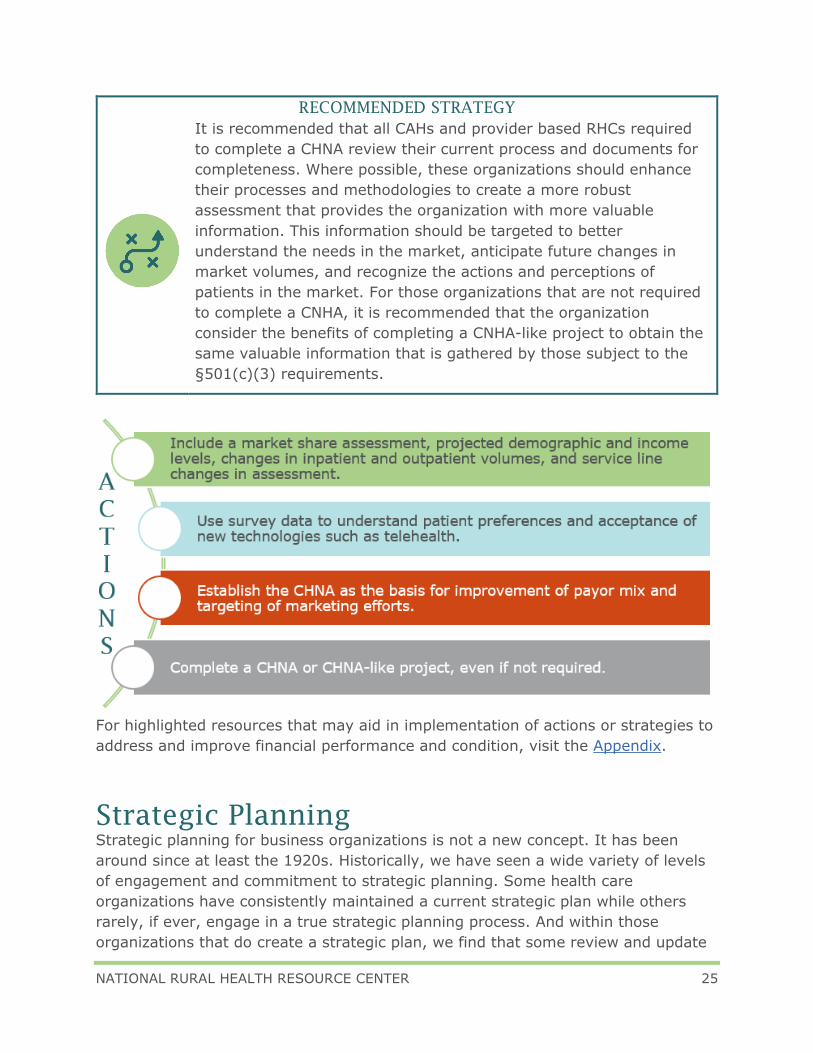
It is recommended that all CAHs and provider based RHCs required to complete a CHNA review their current process and documents for completeness. Where possible, these organizations should enhance their processes and methodologies to create a more robust assessment that provides the organization with more valuable information. This information should be targeted to better understand the needs in the market, anticipate future changes in market volumes, and recognize the actions and perceptions of patients in the market. For those organizations that are not required to complete a CNHA, it is recommended that the organization consider the benefits of completing a CNHA-like project to obtain the same valuable information that is gathered by those subject to the §501(c)(3) requirements.
For highlighted resources that may aid in implementation of actions or strategies to address and improve financial performance and condition, visit the Appendix.
Strategic Planning Strategic planning for business organizations is not a new concept. It has been around since at least the 1920s. Historically, we have seen a wide variety of levels of engagement and commitment to strategic planning. Some health care organizations have consistently maintained a current strategic plan while others rarely, if ever, engage in a true strategic planning process. And within those organizations that do create a strategic plan, we find that some review and update

NATIONAL RURAL HEALTH RESOURCE CENTER 26
theirs in some manner annually while others complete the planning every 3-5 years. There are even great variations when it comes to monitoring and reporting on activity related to the strategic plan. Some only report annually or when it is time to update the current strategic plan while others report on their activity as a standing agenda item at each Board meeting.
Regardless of historical efforts, it is very critical that all health care organizations revisit their strategic plans as they look to move beyond the PHE. This is regardless of how recently the last strategic plan has been updated. The PHE has changed so much of what we know about the delivery of health care and how it will change into the future. It is important to ensure that the current strategic plan of the organization is structured in a manner to address the needs and challenges of the future versus those of the past.
In order for the organization to properly complete a comprehensive strategic plan, the organization is going to need to obtain an appropriate amount of data. Data helps organizations better understand the realities of the market and industry versus the emotions, perceptions, and opinions. Often times the lack of appropriate data can lead organizations to develop strategic plans that address perceptions of historical and current needs versus future needs of the community and organization. Lack of appropriate data can also lead to plans that promote the development of goals based on perceived versus actual needs.
The data gathering preparation process should include an assessment of current technological opportunities and threats, the potential need to update patient flows due to issues identified during the PHE, the current/updated CHNA or similar document, service area definition, competitive presence, service area market share, population trends, historical inpatient and outpatient volume trends, future volume projections by service line, and historical financial information related to the facility. The intent of this data gathering is to separate perceptions from reality, identify patient preferences for care delivery, obtain an understanding of market share leakage, estimate future volume projections by service, and determine future financial needs of the organization.
The above data will provide a significant amount of information to be absorbed by Board members and management. This data creates a foundation for the strategic planning process. The organization uses this data to move through the strategic planning processes of identifying strengths, weaknesses, opportunities, and threats (SWOT). The process continues with the identification of pillars, goals, objectives, and initiatives. The final step is the assignment of accountability and timelines related to strategic initiatives. This last process is very crucial and the failure to complete this final step can lead to the inability to meet the overall goals of the strategic plan.

NATIONAL RURAL HEALTH RESOURCE CENTER 27
Strategic plan goals and initiatives around increased patient volumes and improved payer mix will provide the necessary improvements in net patient revenue to assist in improving operating margin, total margin, days cash on hand, current ratio, debt service ratio, salary to net revenue payer mix, and long term debt to capitalization. Goals and initiatives that address staff satisfaction, recruitment, and training can provide the necessary results to reduce total costs which assists in improving operating margin, total margin, days cash on hand, current ratio, debt service ratio, salary to net revenue payer mix, and long term debt to capitalization. Finally, goals around master facility planning can assist in ensuring the organization is addressing the needs of the organization by restoring and replacing plant and property in a responsible and appropriate manner.
RECOMMENDED STRATEGY
It is recommended all CAHs and provider based RHCs review and update their strategic plan. Organizations should engage in this process regardless of how recent they last updated their strategic plan to ensure the plan maintains its relevance given the long term changes in the industry due to the PHE. Assignment of responsibility and timelines needs to be part of this process to assist in achievement of the goals set forth in the strategic plan. Finally, a process needs to be put in place to provide for ongoing reporting, preferably monthly on status goals, objectives, and initiatives.
For highlighted resources that may aid in implementation of actions or strategies to address and improve financial performance and condition, visit the Appendix.

NATIONAL RURAL HEALTH RESOURCE CENTER 28
Assessing Operational Efficiency and
Effectiveness The PHE required organizations to operate in a different manner and to do so quickly. This resulted in changes in locations for patient care delivery, altering patient and staff flow, working with lower numbers of staffing with a variety of skill sets, and accessing external resources to fill the gaps in staffing needs. As the health care industry establishes a new level of normalcy, it will be very easy for many organizations to attempt to revert back to their old practice patterns. The question and the challenge to providers is “should our organizations just revert back to old staffing practices, processes, and practice locations?” While it may be easier to make this transition back to the past, there is great opportunity to learn from the PHE experience and to adopt/embrace the positive things that were learned throughout the process.
Periods of crisis can create long term opportunities. It occurs as individuals and organizations become very creative in developing solutions to the daily challenges of staffing our departments appropriately and meeting the needs of the patients. In our haste, it quite easy to fail to see the changes that have long term positive implications. These potentially positive impacts are forever lost when organizations allow themselves to revert to their old habits without an analysis of the good and bad that occurred during the crisis.
As an example, did the organization find itself working with what it felt was “short” staffing in some departments based on historical staffing levels and perceived needs? During the PHE, it is expected that the answer would be “yes” with great fluctuations by department and facility. Organizations have a choice as they look to move back to the new level of normal. They can either automatically revert to old habits and staffing levels. Or they can take time to step back and assess the lessons learned during the period of “short” staffing. Organizations may find that the crisis, changes in staffing, and alterations in process flow resulted in the identification of new ways to provide services and meet the needs of the patients in a more effective and efficient manner. It is more than just looking at the total number of staff. Organizations should consider potential changes in the mix of staff in various departments. An example could be the mix of registered nurses (RNs), licensed practical nurses (LPNs), and aides in a department. Have opportunities been identified that would allow the organization to better utilize staff to the highest level of their licensure? There may also be opportunities in all clinic settings to explore the appropriateness and ability to increase the percentage of the providers that are nurse practitioners and physician assistants versus physicians. When appropriate, these changes can result in consistent levels of staffing, but at a much-improved price point.

NATIONAL RURAL HEALTH RESOURCE CENTER 29
Another example would be the cleanup we saw many CAHs and provider based RHCs experience in their days in accounts receivable. In any cleanup project, there are bound to be situations in which the organization discovers consistent causes for failures that lead to lower levels of performance in the organization. In the revenue cycle this may include inaccurate capture of patient demographics and insurance information, charge capture errors, improper posting of payments, chargemaster/coding errors, billing system errors, etc. As ongoing errors were identified and corrected, did the organization take the time to step back and update the systems, processes, and procedures to prevent future rework and delays in payment? Or did the organization just revert back to old policies, procedures, and processes that created the challenges in the past? There may be many opportunities for improvement available to the organization.
Ultimately, the adoption of the best practices learned during a crisis can reduce overall costs, improve efficiencies, create necessary savings to address staffing and operational issues in other areas, increase cashflow, and improve financial stability. This in turn assists in improving days in accounts receivable, operating margin, total margin, days cash on hand, current ratio, debt service ratio, salary to net revenue payer mix, and long term debt to capitalization.
Beyond what was learned during the PHE, the timing may be appropriate to engage in a review of all staffing and process flows within the organization with comparison to established benchmarks. If opportunities to improve efficiencies and effectiveness can occur during the chaos of a PHE, it should be expected that even more opportunities may be available when an organization has the time to step back and analyze operations in greater detail. Using the examples identified during the PHE can help reduce resistance by leaders.
RECOMMENDED STRATEGY
It is recommended all CAHs and provider based RHCs review the changes made within their organizations during the PHE to determine opportunities to adopt the best practices learned during the PHE. It is also recommended that these organizations complete a comprehensive analysis of staffing and processes against established benchmarks to identity opportunities to improve overall operational performance and financial condition.

NATIONAL RURAL HEALTH RESOURCE CENTER 30
For highlighted resources that may aid in implementation of actions or strategies to address and improve financial performance and condition, visit the Appendix.
Exploration of Population Health and
Wellness Opportunities As uncertainty continues to exist as to the return of historical patient volumes to individual facilities after the PHE, CAHs and provider based RHCs are expected to be looking towards opportunities to expand current and/or identify new service lines to fill the void due to the lower demand and changes in patient preferences. A potential area for these providers to identify opportunities is in the area of population health programs and wellness services. Population health programs such as accountable care organizations (ACOs) and patient centered medical home (PCMH) are examples of more formalized programs that require the demonstration of value and/or cost savings to enhance reimbursement.
The above noted population health programs rely heavily on providing preventative and other wellness services to create long term improvements in health as well as overall cost savings. Properly implemented, these preventative and wellness services can create new revenue streams, increased brand awareness, and increased market share for the provider. These benefits can be achieved even if the organization is not part of a formalized population health program.
Historically, coverage for wellness and preventative services has been very limited by Medicare as well as many other providers. However, this has changed in recent

NATIONAL RURAL HEALTH RESOURCE CENTER 31
years for Medicare with the identification of many various services that are beneficial to the patient with earlier identification of potential health issues and improvement in the long term health of the patient. Unfortunately, many CAHs and provider based RHCs have not taken the opportunity to maximize their opportunities to increase volumes in these areas and to increase their value to the patient community. Some of these services such as Initial Preventative Physical Examination (IPPE) and the Annual Wellness Visit (AWV) provide an opportunity for the provider and patient to plan out the patient’s wellness and preventative activities for the next year. There are over 25 preventative services covered by Medicare that may be identified during the provision of the IPPE and/or AWV service. These are services that are not only covered by Medicare and in the best interest of the patient, but many have no coinsurance or deductible obligations to the beneficiary. Fortunately, many of these services are services the CAH and/or provider based RHC already provides or could add to their current service lines with little cost or effort to the organization. The potential for coverage by other commercial payers will vary by payer and their various plans. Providers need to monitor the specifics of their contracts for potential opportunities.
Medicare also provides coverage for services meant to help patients with care management for multiple chronic conditions and/or recent inpatient admissions. These services include chronic care management and transitional care management. These services include payment for the ongoing contact with the patient to improve the compliance with care plans, improve adherence to medication regiments, increase attendance at scheduled appointments, and increase the number of clinic visits due to the earlier detection of potential health issues. In addition to the potential to improve the health of the patient and the increase in clinic visits and other services, these services can help create greater brand awareness through word of mouth by satisfied patients. This word of mouth can assist in improving overall capture of market share without having to expand the current footprint of the market.
It takes a well-defined and executed plan to successfully implement programing that focuses on population health as well as the provision and promotion of wellness and preventative services. This includes education of physicians, nurse practitioners, physician assistants, nursing staff, and the public. It will also involve the development of efficient, effective, and patient friendly processes for delivery of the services. Finally, it requires a marketing plan to ensure the public is aware of the programming and its benefits in promoting long term improvement in patient health along with long term cost savings.
The successful implementation of this population health and wellness programming can drive increases in overall volumes with typically moderate levels of incremental expense. This leads to increases in revenues and improves organizational efficiency, increases cashflow, and improves financial stability. This in turn assists in improving

NATIONAL RURAL HEALTH RESOURCE CENTER 32
days in operating margin, total margin, days cash on hand, current ratio, debt service ratio, salary to net revenue payer mix, and long term debt to capitalization.
RECOMMENDED STRATEGY
It is recommended that CAHs and provider based RHCs review the various population health opportunities as well as covered wellness and preventative services that are available and can be offered by their organizations. Initial planning should include an identification of services currently offered as well as gaps in providing these services. For those services that are currently being offered, there should be in depth analysis to identify opportunities to increase overall utilization of the services. For those services not being offered, the discussion should be focused on the financial viability of providing these services as well as the development of processes and marketing to support their successful implementation.
For highlighted resources that may aid in implementation of actions or strategies to address and improve financial performance and condition, visit the Appendix.
Reinventing Themselves The PHE has created disruption like never before. For the foreseeable future there will be concerns regarding the long term loss of patient volumes, the introduction of

NATIONAL RURAL HEALTH RESOURCE CENTER 33
new competitors, and changes in patient preferences. This will only enhance the need for CAHs and provider based RHCs to explore how well they address access issues as well as how they present themselves in the market.
In many situations, providers consider the provision of a service in a market as being access. However, it is only access if it is accessible when the patient needs or desires to access the service. An example would be clinic services. A clinic that is open from 8:00 a.m. – 5:00 p.m. Monday through Friday may appear to some to provide access to primary care. But for the individual or parent that cannot get away from work or otherwise coordinate care, access may still be considered to be lacking. For these patients, their normal local access to care may only be the emergency room. But high deductibles and copays in the emergency room compared to a clinic visit may drive the patient to either avoid care all together or travel to another nearby competitor that provides access that is available when they need and want it. It is not uncommon to find that nearby larger communities offer Urgent Care services with extended hours. This leads to potential patients leaving the community for their primary care needs. And once the other communities get them into their system, they can become aggressive in encouraging the patients to move all their ongoing health care needs to the urgent care clinic and its related entities. These patients are often covered by commercial payers and over time as they age will be the next group of Medicare population organizations rely on for patient volumes.
Addressing increased access in the CAH or provider based RHC can be met with resistance. This often occurs as providers view increasing access to mean being open 24/7/365. This is unfortunate as creating access is not an all or nothing proposition. Increasing access does not mean the RHC must be open until 10:00 p.m. every evening and full days on weekends. It means updating available hours to provide access during the hours of need for the patient. In the clinic setting, this may mean being open until 6:00 p.m. or 7:00 p.m. to allow for the working individual to get themselves or family members into the clinic. Many facilities have found that expanding hours in small amounts can have a big impact on volumes. It is important to note that volumes may not appear overnight as it takes time for the patients to become aware of the service hour changes, to observe the consistency of the change and to change their habits. Weekend hours may be limited to mornings and Sundays may or may not be included based on market needs. Other departments may also benefit from slight modifications of hours. This may vary by individual markets.
Implementing changes in access hours is a great time to revisit marketing strategies. It is not uncommon to find that patients are unaware of services being offered by health care entities and the available hours. This includes changes in hours that are either permanent or seasonal. It is easy for rural providers to assume that potential patients have access to this information and are fully aware,

NATIONAL RURAL HEALTH RESOURCE CENTER 34
but it is not always an accurate assessment of the situation. An updated market approach can focus on specific areas of the organization and address awareness, access, perceptions, etc.
Increasing access and improving marketing strategies can help drive improvement in overall volumes with moderate levels of incremental expense which increases revenues and improves organizational efficiency, increases cashflow, and improves financial stability. It can also improve the payer mix by increasing the percentage of patients with commercial coverage which typically provide for greater reimbursement levels. This in turn assists providers in improving operating margin, total margin, days cash on hand, current ratio, debt service ratio, payer mix, salary to net revenue payer mix, and long term debt to capitalization.
RECOMMENDED STRATEGY
Providers should review their current hours of operations as well as other approaches to access to ensure they are developing strategies and taking advantage of opportunities to increase overall service volumes and increase the capture of the market share. A full assessment of the marketing plan should also be considered at this time to ensure it is meeting the needs of the community and organization. This should include an alignment of marketing plans and activity as it relates to the strategic plan. External expertise that specializes in rural health care marketing should be considered in this review to identify opportunities to improve overall marketing tactics based on industry best practices.

NATIONAL RURAL HEALTH RESOURCE CENTER 35
For highlighted resources that may aid in implementation of actions or strategies to address and improve financial performance and condition, visit the Appendix.
Service Line Analysis Just like expanding service areas and increasing access to care, a review of historical service lines is also critical to rural health care providers. A service line analysis helps the organization understand the financial contribution a service line provides. When properly analyzed, it will provide information on historical trends for volume, revenues, and costs. Once this information is available, leadership is able to determine risks and opportunities that make impact future profitability. Through this process it may be identified that the necessary volumes no longer exist to support the services. This may be due to outmigration or to changes in medical practice that reduce the need for the service. If the issue is outmigration, the organization should explore further to determine the reasoning for this outmigration (i.e., is it related to service issues, perception of quality, etc.). Information on outmigration may be captured in those facilities that have expanded their CHNA process or as a separate activity.
The analysis may indicate that the challenges in a service line are due to inappropriate pricing and/or reimbursement levels. This may require implementing pricing increases or using the data and expending additional efforts to negotiate better payment levels from commercial payors. The last potential finding may be that staffing and other operational costs are creating the financial challenges for the service line. This creates the need and opportunity to review current processes and staffing levels to determine if opportunities exist to decrease resource utilization and service line cost.
There can be many outcomes from a service line analysis. The desired outcome is to find opportunities to improve underperforming service lines to a point of appropriate profitability. In some situations, there may be a realization that there are challenges that cannot be overcome. For these situations, a facility may accept this reality but maintain the service line due to reasons related to mission of the organization, etc. In other situations, the decision may be made to discontinue the service line. If the service line is still needed in the community this latter option would typically include working with other outside service providers to ensure continuity of care.
Improving financial performance of existing services lines or eliminating those that cannot be improved can help drive improvement in overall bottom line of the organization. This in turn assists providers in improving operating margin, total margin, days cash on hand, current ratio, debt service ratio, salary to net revenue payer mix, and long term debt to capitalization.

NATIONAL RURAL HEALTH RESOURCE CENTER 36
RECOMMENDED STRATEGY
Providers should analyze their service lines to assist in identifying opportunities to improve financial performance or, when appropriate, exit services lines. At a minimum, the analysis should include a consideration of volumes, revenues, expenses, and current levels of outmigration.
For highlighted resources that may aid in implementation of actions or strategies to address and improve financial performance and condition, visit the Appendix.
Telehealth Services Prior to the PHE, the volumes of telehealth services in the rural setting varied significantly from community to community and region to region. The variations could frequently be attributed to facility acceptance, provider acceptance, and/or payment levels. Acceptance by facilities and providers could be further broken down into two categories. Some facilities and providers viewed telehealth as a model that did not provide the personal hands-on care that they felt they needed to provide in order to deliver the appropriate level of patient care. Others viewed this model as an alternative to increase total number of visits and expand access to care. There were also many facilities and providers that held the perception that a telehealth visit would not be accepted by patients and/or that the patients would not possess

NATIONAL RURAL HEALTH RESOURCE CENTER 37
the technology/skills to access the service line. Payment levels were definitely a concern with variations in coverage and payment levels by commercial payors and low payment levels for originating sites from Medicare.
There have been significant changes in telehealth during the PHE. This includes expansion of allowable locations and increased acceptance by facilities and providers. Most significant has been the level of acceptance by patients. Patients have accepted this method of patient care and many now prefer to access care in this manner. While there are still some challenges, it has been demonstrated that the technology and skill needed to engage in telehealth is available to a large portion of the population.
Payment levels are still challenging in many situations and concerns about coverage after the PHE, but there has been some movement in a positive direction and continued conversation on the need for future improvements.
While there has been some improvement in the adoption of telehealth, there are significant opportunities that still exist. Some providers have yet to embrace this care model while others still have significant opportunities to expand this service line. Expansion opportunities exist in getting more local providers engaged, providing access to more distant providers, and expanding available specialists.
Enhancing the telehealth service line can assist providers in expanding their footprint in the market. This can occur by attracting new patients in outlying areas that may be outside or on the fringe of the current market area. It can also provide patients access to their local providers when they are traveling or temporarily relocated (i.e., “snowbirds”). This enhancement can also be a preemptive approach to addressing potential competitors in the market to prevent future outmigration.
Increasing engagement in telehealth services can help drive improvement in overall bottom line of the organization through increased telehealth revenues and other related ancillary services. This in turn assists providers in improving operating margin, total margin, days cash on hand, current ratio, debt service ratio, salary to net revenue payer mix, and long term debt to capitalization.
RECOMMENDED STRATEGY
Providers should complete an internal analysis of the telehealth services they offer compared to those services they could offer and could be in demand in their market. The expanded CNHA and strategic plans may provide additional information to support the opportunity and need for increased engagement and expansion of this service area.

NATIONAL RURAL HEALTH RESOURCE CENTER 38
For highlighted resources that may aid in implementation of actions or strategies to address and improve financial performance and condition, visit the Appendix.
Outmigration Outmigration is a topic that is often difficult to assess for the rural provider. In health care, outmigration is the leaving of the community or region for health care services. The topic of outmigration is intertwined with the areas of CHNA, strategic planning, exploration of population health and wellness opportunities, reinventing themselves, and telehealth that have already been discussed. However, outmigration is an area of strategy that can be addressed on its own.
The extent of outmigration from the rural provider is often misunderstood. The difficulty in obtaining market share data is a significant hurdle for many facilities. Even when available, the analysis of this data is often overlooked. In some states, there are robust databases that are compiled and can assist health care organizations better understand the amount of outmigration, what services are being lost, and what competitors are capturing the lost services. It may even be possible to drill down to determine the demographics of the populations that are out-migrating. In states without this level of data, Medicare data may have to be utilized as an alternative.
Collecting the data and completing the analysis is only the beginning of the process. Further work and research are required to determine the “why” that drives the outmigration. Is it a lack of awareness of availability, hours of availability, service

NATIONAL RURAL HEALTH RESOURCE CENTER 39
issues, quality concerns, etc.? The acceptance of the reasoning for outmigration by an organization can be challenging, but it is important to accept the identified reasons even if the organization does not agree with the identified patient reasoning. This last point is important as it is the reason the potential patient is choosing to purchase services elsewhere. If the organization believes that there are misconceptions, the strategy to reduce the outmigration would be to correct these misconceptions.
Outmigration information can then be used to develop strategies to address the root cause of preventable outmigration. These strategies may include updated marketing, service line redesign, staff education, and adjustment in service hours.
Decreasing outmigration can help drive improvement in overall bottom line of the organization through increased revenues. This in turn assists providers in improving operating margin, total margin, days cash on hand, current ratio, debt service ratio, salary to net revenue payer mix, and long term debt to capitalization.
RECOMMENDED STRATEGY
Providers should complete a full market share assessment to gain a better understanding of the outmigration that is occurring in their market. Additional steps then need to be taken to determine the root cause of this outmigration. The identification and implementation of strategies to decrease the outmigration completes the strategy.
For highlighted resources that may aid in implementation of actions or strategies to address and improve financial performance and condition, visit the Appendix.

NATIONAL RURAL HEALTH RESOURCE CENTER 40
Maintaining Ongoing Education The challenges facing CAHs and provider based RHCs have never been greater. The PHE changes how most everything operates in health care. There are unknown effects of changes in total patient volumes, change in patient preferences, and new competitors in the market. On top of this are changes in payer rules, CMS regulations, RHC reimbursement limits, new provider types (e.g., rural emergency hospital), etc. These challenges will require leaders to invest the appropriate resources to ensure they and their team are adequately trained and keeping up with the trends in the industry. It is anticipated that changes will occur quickly and now will not be the time to fall behind industry changes and trends.
If there is one thing that has been learned from the PHE, it is that training and communication can be accomplished remotely. The improvement in remote technologies for training and communication has been significant. These methodologies have allowed for extremely efficient and timely transmission of high-level knowledge. However, it is important to acknowledge the unique benefits of live training events. Remote training can allow for the presenter to share extremely timely knowledge which is powerful. However, a large portion of training benefits comes from two-way interaction when the audience asks specific questions regarding how new rules, regulations and opportunities may apply to their situation. It also occurs when attendees discuss and share best practices. Unfortunately, the amount of two-way communication is frequently limited in remote trainings. This is not typically due to the presenter limiting the discussion, but a reduction in interaction from the attendees. This can occur due to additional distractions in the office for the attendees, a level of uncomfortableness by the attendees, and/or a failure of the presenter to be able to adequately encourage engagement.
In addition to the education one receives at a live meeting or conference, attendees meet individuals with similar positions, responsibilities, and challenges from other organizations. Historically these individuals become part the network of colleagues that individuals reach out to and rely on for idea sharing, guidance, and sometimes just an educated ear to listen. Those that do not maintain a learning strategy that includes live events run an increased risk of losing their existing network and/or finding it impossible to build their network. A strong network provides access to best practices, lessons learned, hidden opportunities, identification of increasing risks, market trends, and more.
The information garnered from maintaining a strong educational plan as well as a strong network will assist in positioning leaders and organizations to improve their performance under all financial indicators. Critical to the success of the organization is continuous educational support for mid-level managers. Not only do mid-level managers carry out the strategic priorities of the organization, they play an

NATIONAL RURAL HEALTH RESOURCE CENTER 41
important role in influencing and educating their teams and departments about their organizational role and strategies. Mid-level managers should be provided information about the financial impact of their departments and teams in ways the influence performance and employee satisfaction by connecting their direct work to organizational outcomes.
RECOMMENDED STRATEGY
In these challenging times, it is recommended that organizations take a hard look at their educational plans and strategies to ensure their plan provides a proper balance between remote and live events. This would include the training plans for all leaders and other applicable individuals. It is understood that this is a balancing act between the adequacy of financial resources and the benefits of live training and its networking opportunities. It has often been said that the only thing more expensive than training is the lack of training.
For highlighted resources that may aid in implementation of actions or strategies to address and improve financial performance and condition, visit the Appendix.

NATIONAL RURAL HEALTH RESOURCE CENTER 42
Conclusion The COVID pandemic will definitely leave a financial mark on rural hospitals, clinics, and the entire health care industry. Some of this impact will be temporary while some will be longer lasting. This guide has been designed to assist state Medicare Rural Hospital Flexibility (Flex) Program personnel, leaders of CAHs and provider based RHCs and others navigate the current and expected challenges of monitoring and managing the strength of provider’s financial indicators. Positive results are not expected to come easy, but the action steps identified will improve the ability to continue to meet long term obligations and goals.

NATIONAL RURAL HEALTH RESOURCE CENTER 43
Appendix Below please find highlighted resources that may aid in implementation of actions or strategies to address and improve financial performance and condition.
Community Health Needs Assessments Association for Community Health Improvement. (2017). Community Health
Assessment Toolkit. Retrieved from AHA Community Health Improvement: https://www.ruralcenter.org/resource-library/community-health-assessment-toolkit
National Rural Health Resource Center. (n.d.). Population Health Toolkit. Retrieved from https://www.ruralcenter.org/population-health-toolkit
National Rural Health Resource Center. (n.d.). Put Data to Use. Retrieved from Population Health Toolkit: https://www.ruralcenter.org/population-health-toolkit/data
Rural Health Information Hub. (n.d.). Retrieved from Rural Data Visualizations: https://www.ruralhealthinfo.org/visualizations
Rural Health Information Hub. (2020). Retrieved from Finding Statistics and Data Related to Rural Health: https://www.ruralhealthinfo.org/topics/statistics-and-data
Univeristy of Kansas. (n.d.). Community Tool Box. Retrieved from Community Tool Box: https://www.ruralcenter.org/resource-library/community-health-assessment-toolkit
Strategic Planning National Rural Health Resource Center. (2017). Balanced Scorecard and Strategy
Map Templates. Retrieved from https://www.ruralcenter.org/resource-library/2017-rural-hospital-value-based-strategic-summit-bsc-%26amp%3B-strategy-map-templates
National Rural Health Resource Center. (2021). Small Rural Hospital Blueprint for Performance Excellence and Value. Retrieved from https://www.ruralcenter.org/resource-library/small-rural-hospital-blueprint-for-performance-excellence-and-value
National Rural Health Resource Center. (n.d.). Strategic Planning: Hospital Best Practices and Recommended Strategies. Retrieved from https://www.ruralcenter.org/srht/rural-hospital-toolkit/strategic-planning
National Rural Health Resource Center. (2019). Strategy Map and Balanced Scorecard Learning Collaborative Recordings. Retrieved from https://www.ruralcenter.org/news/new-tool-to-create-or-update-your-strategy-map-and-bsc

NATIONAL RURAL HEALTH RESOURCE CENTER 44
Assessing Operational Efficiency and Effectiveness Colorado Hospital Association and Eugene S. Farley, Jr. Health Policy Center.
(2020). Re-imagining Leadership: A Pathway for Rural Health to Thrive in a COVID-19 World. Retrieved from https://www.ruralcenter.org/resource-library/re-imagining-leadership-a-pathway-for-rural-health-to-thrive-in-a-covid-19-world
National Rural Health Resource Center. (2019, March). Revenue Cycle Improvement Billing and Coding Bootcamp. Retrieved from https://www.ruralcenter.org/events/revenue-cycle-improvement-billing-and-coding-bootcamp
National Rural Health Resource Center. (2020, July 31). DRCHSD COVID Financial Recovery Webinar Series Part III: Operational Considerations. Retrieved from https://www.ruralcenter.org/events/drchsd-covid-financial-recovery-webinar-series-part-iii-operational-considerations
National Rural Health Resource Center. (2020, August 7). DRCHSD COVID Financial Recovery Webinar Series Part IV: Revenue Cycle Strategies. Retrieved from https://www.ruralcenter.org/events/drchsd-covid-financial-recovery-webinar-series-part-iv-revenue-cycle-strategies
National Rural Health Resource Center. (2021, August). Revenue Cycle Management Best Practices Guide. Retrieved from https://www.ruralcenter.org/resource-library/revenue-cycle-management-best-practices-guide
National Rural Health Resource Center. (n.d.). Rural Hospital Toolkit for Transitioning to Value-based Systems. Retrieved from https://www.ruralcenter.org/srht/rural-hospital-toolkit
Exploration of Population Health and Wellness
Opportunities Bialek, R., & Moran, J. W. (2020, April 15). Cross-Sector Collaboration for
Improving the Health of Communities: You Can’t Do It Alone. Retrieved from Public Health Foundation: https://www.ruralcenter.org/resource-library/cross-sector-collaboration-for-improving-the-health-of-communities-you-can%E2%80%99t-do-it
Institute for Healthcare Improvement. (2017). Pathways to Population Health. Retrieved from Population Health: https://www.ruralcenter.org/resource-library/pathways-to-population-health-framework
National Quality Forum. (2016, August). Improving Population Health by Working with Communities: Action Guide 3.0. Retrieved from National Quality Forum: https://www.ruralcenter.org/resource-library/improving-population-health-by-working-with-communities-action-guide-30
National Rural Health Resource Center. (2015, September 17). A Guide for Rural Hospitals to Identify Populations and Shift to Population Health. Retrieved from Small Rural Hospital Transition (SRHT) Project Guide:

NATIONAL RURAL HEALTH RESOURCE CENTER 45
https://www.ruralcenter.org/resource-library/a-guide-for-rural-hospitals-to-identify-populations-and-shift-to-population-health
National Rural Health Resource Center. (2021). Value-Based Care (VBC) Webinar Series. Retrieved from https://www.ruralcenter.org/resource-library/2021-value-based-care-vbc-webinar-series
National Rural Health Resource Center. (n.d.). Population Health Readiness Assessment. Retrieved from Population Health Toolkit: https://www.ruralcenter.org/population-health-toolkit/get-motivated/readiness-assessment
National Rural Health Resource Center. (n.d.). Population Health Toolkit. Retrieved from https://www.ruralcenter.org/population-health-toolkit
National Rural Health Resource Center. (n.d.). Rural Hospital Toolkit for Transitioning to Value-based Systems. Retrieved from https://www.ruralcenter.org/srht/rural-hospital-toolkit
Rural Health Value. (n.d.). Profiles in Innovation. Retrieved from https://www.ruralcenter.org/resource-library/rural-health-value-profiles-in-innovation
Reinventing Themselves National Rural Health Resource Center. (2020). Communication Strategies for
Community Outreach and Education Webinar Series. Retrieved from https://www.ruralcenter.org/resource-library/communication-strategies-for-community-outreach-and-education-webinar-series
National Rural Health Resource Center. (n.d.). Customizable Communications Toolkit for Rural Hospitals and Clinics. Retrieved from https://www.ruralcenter.org/drchsd/communications-toolkit
Service Line Analysis Hendriksen, M., Richard, B., & Ballard, J. (2019, February). Illinois Critical Access
Hospitals: Exploring the Financial Impacts of the Swing Bed Program. Retrieved from Rural Health Care White Paper Series: https://icahn.org/wp-content/uploads/2019/02/ICAHN-Swing-Bed-Report-print-Final-1.31.19_for-transmittal.pdf
Miller Temple, K. (2021, August 11). Understanding the Rural Swing Bed: More than Just a Reimbursement Policy. Retrieved from The Rural Monitor: https://www.ruralhealthinfo.org/rural-monitor/swing-beds/
Modern Healthcare. (2012). Hospital service line organization: Innovation in approaches and strategy. Retrieved from Modern Healthcare Insights: https://www.modernhealthcare.com/assets/pdf/CH81353810.PDF
National Rural Health Resource Center. (2021, June 16). Services to Jumpstart and Assist in the Transition from Volume to Value. [Webinar]. Retrieved from https://www.ruralcenter.org/rhptp/events/help-webinars/services-to-jumpstart-and-assist-in-the-transition-from-volume-to-value
NATIONAL RURAL HEALTH RESOURCE CENTER 46
National Rural Health Resource Center. (n.d.). Rural Hospital Toolkit for Transitioning to Value-based Systems. Retrieved from https://www.ruralcenter.org/srht/rural-hospital-toolkit
Rural Health Information Hub. (2021, April 18). Avita Health System Comprehensive Cardiology Program. Retrieved from https://www.ruralhealthinfo.org/project-examples/1088
Telehealth Services National Consortium of Telehealth Resource Centers, (n.d.). Retrieved from
https://telehealthresourcecenter.org/ National Rural Health Resource Center. (2021). CAH Telehealth Guide. Retrieved
from https://www.ruralcenter.org/events/cah-telehealth-guide National Rural Health Resource Center. (2021). Delta Region Community Health
System Development 2021 Telehealth Series. Retrieved from https://www.ruralcenter.org/resource-library/drchsd-2021-telehealth-series
Rural Health Information Hub. (n.d.). Rural Health Toolkit. Retrieved from https://www.ruralhealthinfo.org/toolkits/telehealth
National Rural Health Resource Center. (n.d.). Telehealth Resource Collection. Retrieved from https://www.ruralcenter.org/resource-library/telehealth
Rural Health Information Hub. (n.d.). Marketing Considerations for Telehealth Programs. Retrieved from https://www.ruralhealthinfo.org/toolkits/telehealth/4/marketing
Rural Health Information Hub. (n.d.). Telehealth Use in Rural Healthcare Topic Guide. Retrieved from https://www.ruralhealthinfo.org/topics/telehealth
Outmigration Center for Optimizing Rural Health. (n.d.). Patient Out-Migration Review – Best
Practices. Retrieved from https://optimizingruralhealth.org/patient-out-migration-review-best-practices/
National Rural Health Resource Center. (2015, September 17). A Guide for Rural Hospitals to Identify Populations and Shift to Population Health. Retrieved from Small Rural Hospital Transition (SRHT) Project Guide: https://www.ruralcenter.org/resource-library/a-guide-for-rural-hospitals-to-identify-populations-and-shift-to-population-health
Maintaining Ongoing Education National Rural Health Resource Center. (2020). Managing from the Middle: Leading
Through Change Video Series. Retrieved from https://www.ruralcenter.org/resource-library/managing-from-the-middle-leading-through-change
National Rural Health Resource Center. (2021). Mid-Level Leaders and the Transition to Value Video Series. Retrieved from https://www.ruralcenter.org/tasc/mid-level-leaders-and-the-transition-to-value-video-series

NATIONAL RURAL HEALTH RESOURCE CENTER 47
National Rural Health Resource Center. (2020). Visionary Board Leadership and the Transition to Value Video Series. Retrieved from https://www.ruralcenter.org/tasc/flex/visionary-board-leadership-and-the-transition-to-value-video-series
In addition to the above listed series that are focused on rural hospital Boards, leaders, and mid-level leaders, national organizations offer educational opportunities in the form of in-person events such as conferences and virtual offerings as well such as webinars. Examples of organizations include:
• National organizations with a rural focus: o National Rural Health Association (NRHA) (in-person and virtual) o American Hospital Association (AHA) (in-person and virtual) o American College of Healthcare Executives (ACHE) (in-person and
virtual) o Agency for Healthcare Research and Quality (AHRQ) and Institute for
Healthcare Improvement (IHI) offer virtual education courses that can be done as time allows.
o National level organizations that focus on various health professions • State-level organizations:
o Hospital associations o Rural health associations o State offices of rural health and state Flex Programs