financial inclusion in the philippines: a regional · pdf filefinancial inclusion in the...
TRANSCRIPT

Submitted by: Tatum Blaise Tan
51-138216 The University of Tokyo
Financial Inclusion in the Philippines: A Regional Assessment
As a requirement for the course Case Study in International Political Economy
Summer 2014
Submitted to: Professor Nobuhiro Hiwatari Institute of Social Sciences The University of Tokyo

`
1
Abstract
The current state of financial inclusion in the Philippines appears relatively weak, lagging behind some of its comparators. Assessing financial inclusiveness on a regional basis by constructing an index of financial inclusion (IFI), the study finds that five regions are classified as high IFI regions, three regions are categorized as medium IFI regions, while nine out of the 17 regions in the country fall under the low IFI group. Low IFI regions are associated with relatively lower income, urbanization levels, and functional literacy rates. Moreover, the study finds that low IFI regions in the Philippines are likewise associated with dominance of entrepreneurial activity as main source of income and have higher shares of employment in agriculture. I. Introduction Defining Financial Inclusion Over the past decade, financial inclusion has become the maxim in the financial and economic arena. Highlighting its importance in achieving sustainable growth, financial stability, and poverty alleviation. In fact, it has even transcended from simply being an economic/financial agenda to an important social agenda. The idea of financial inclusion has garnered support from various multilateral agencies like the Asian Development Bank (ADB), International Monetary Fund (IMF) and World Bank (WB). Cognizant to the importance of this financial development, this has likewise become a widely recognized priority issue by policy makers in the Philippines. According to Hannig and Jansen (2010),
“Financial inclusion aims at drawing the “unbanked” population into the formal financial system so that they have the opportunity to access financial services ranging from savings, payments, and transfers to credit and insurance.”
As the current administration embarks on a quest for an inclusive growth, the importance of financial inclusion becomes more apparent. Economic growth is no longer sufficient, rather a growth that trickles down all the way down to the bottom of the pyramid is now a necessity. Despite being among the countries in Southeast Asia to register marked economic performance and displayed resilience amid the global economic crunch, the Philippines continues to be plagued by a “jobless growth,” with the rate of unemployment pinned at seven percent. To quote Mthuli Ncube, Chief Economist & Vice-President, African Development Bank Group,
“The concept of inclusive growth is multifaceted and has financial inclusion as one of its main building blocks. For sustained and inclusive development to thrive, a great deal of innovation and thinking is needed to ensure that appropriate financial services and instruments are put in place for the benefit of the poor and other vulnerable groups.” (Ubinas, 2013)
Financial inclusion plays an critical role in overall development of the financial system and economy. According to Khan (2012), the overall financial system benefits from
`
2
greater inclusion by: “1) enhance saving and credit to the people at the bottom of the pyramid; 2) providing banks a more stable deposit base contributed by retail customers; and 3) promoting financial stability and discourages informal sectors.” In addition, financial inclusion generates a “multiplier effect on the economy through enhanced saving and credit outreach as well as makes monetary policy more effective.” Khan (2012)
Given the importance of financial inclusion, how can we assess or gauge a country/state’s level of inclusiveness? While there are several indicators available to assess the state of various financial aspects, each of these indicators fails to capture the overall extent of financial inclusion when evaluated on its own. This could potentially result in misleading assessments on the country’s overall level of financial inclusion. (Sarma, 2008) Thus, an index is crucial in evaluating a country/state’s level of financial inclusiveness at a given time. Moreover, Conrad et al. and Beck et. al (2008, 2006) also stress the importance of gauging banking outreach on a regional level, considering that bank branches and ATMs could be concentrated in the urban areas and the distribution of loans and deposits could be disproportionate across regions/states.
The rest of the paper is organized as follows: section II explains the motivation of the study; section III provides a comprehensive overview of the current state of financial inclusion in the Philippines; section IV discusses the relevant literature; section V tackles the research design of the paper; section VI presents the results and an analytical discussion of the index; and section VII concludes the paper as well as presents policy recommendations.
II. Motivation of the Study
The study intends to delve deeper in explaining the relatively weak state of financial inclusion in the Philippines by providing a more empirical regional-wise analysis on the issue and identifying the socio-economic factors that could shed light on the financial inclusion gap across the different regions. The study first constructs an index of financial inclusion (IFI) in order to gauge the financial inclusiveness in each region as well as categorically distinguish the regions that are falling behind. From there, the paper gathers insights on which dimension particularly needs focus and examine key factors that are associated with low IFI regions.
In addition, other future potential contributions of this research include the following:
1) Establish an index that will serve as an input in financial policy formulation; 2) Enable the concerned policy makers to monitor the progress and effectiveness of
policy initiatives on financial inclusion, both in magnitude and pace; and 3) Support further empirical studies relevant to financial inclusion and its impact on
growth, poverty and financial stability. Sarma (2008)
Table 1 presents the 17 regions that comprise the Philippines and the provinces under each region.

`
3
III. Financial Inclusion: How Does the Philippines Fair?
According to the World Bank (2012), 2.5 billion people remains “unbanked” and three quarters of the poor people worldwide do not have a bank account. Table 2 presents a cross-country summary of selected financial inclusion indicators sourced from the World DataBank G20 Financial Inclusion Indicators. Based on the table, the Philippines lags
Table 1: Regional Composition of the Philippines Region Provinces
National Capital Region (NCR) Cities of Caloocan, Las Pin ̃as, Makati, Malabon, Mandaluyong, Manila, Marikina, Muntinlupa, Navotas, Paran ̃aque, Pasay, Pasig, Quezon, San Juan, Taguig and Valenzuela, and the Municipality of Pateros
Cordillera Administrative Region (CAR)
Abra, Benguet, Ifugao, Kalinga Apayao, and Mountain Province
Region I – Ilocos Region Ilocos Norte, Ilocos Sur, La Union, and Pangasinan Region II – Cagayan Valley Batanes, Cagayan, Isabela, Nueva Vizcaya, and Quirino Region III – Central Luzon Aurora, Tarlac, Pampanga, Zambales, Bataan, Nueva
Ecija, and Bulacan Region IV A – CALABARZON (Cavite, Laguna, Batangas, Rizal, and Quezon )
Cavite, Laguna, Batangas, Rizal, and Quezon
Region IV-B MIMAROPA (Mindoro, Marinduque, Romblon, and Palawan)
Occidental Mindoro, Oriental Mindoro, Marinduque, Romblon, and Palawan
Region V – Bicol Region Camarines Norte, Camarines Sur, Albay, Masbate, Sorsogon, and Catanduanes
Region VI – Western Visayas Negros Occidental, Iloilo, Antique, Guimaras, Aklan and Capiz
Region VII – Central Visayas Bohol, Cebu, Negros Oriental, and Siquijor Region VIII – Eastern Visayas Leyte, Southern Leyte, Biliran, Eastern Samar, Northern
Samar, and Samar Region IX – Zamboanga Peninsula Zamboanga Sibugay, Zamboanga del Norte, Zamboanga
del Sur, Zamboanga City (Zamboanga Peninsula), and Isabela City (Basilan Province)
Region X – Northern Mindanao Bukidnon, Camiguin, Misamis Oriental, Misamis Occidental, and Lanao del Norte
Region XI – Davao Region Davao City, Davao del Norte, Davao del Sur, Davao Oriental, and Compostela Valley
Region XII –SOCCSKSARGEN (South Cotabato, Cotabato, Sultan Kudarat, Sarangani and General Santos City)
North Cotabato, South Cotabato, Sultan Kudarat Province, Saranggani, and the cities of Cotabato, General Santos, Kidapawan, Koronadal, and Tacurong
Region XIII – Caraga Agusan del Norte, Agusan del Sur, Surigao del Norte, and Surigao del Sur
Autonomous Region in Muslim Mindanao (ARMM)
Basilan, Lanao del Sur, Sulu and Tawi-Tawi, and Maguindanao Province
Source: Bangko Sentral ng Pilipinas (2010), Regional Economic Developments in the Philippines

`
4
behind its Southeast Asian comparators, espacially Malaysia and Thailand in both banking penetration and availability of financial services. In terms of number of deposit accounts per 100 adults and ATMs per 100,000 adults, the Philippines barely comprises a third of the said countries’ figures.
Table 2: Selected Financial Inclusion Indicators Across South East Asia
Cambodia Indonesia Philippines Malaysia Thailand Banking Penetration
Account at a formal financial institution (% age 15+) 3.7 19.6 26.6 66.2 72.7 Number of deposit accounts with commercial banks per 1,000 adults 131.5 623.7 492.8 1642.2 1414.3
Availability of Banking Services Commercial bank branches (per 100,000 adults) 4.3 8.5 8.1 10.5 11.3 Automated teller machines (ATMs) (per 100,000 adults) 6.1 16.5 17.7 56.4 77.9 Source: World DataBank G20 Financial Inclusion Indicators Sarma (2008) evaluated several countries’ financial inclusiveness for the year 2004 and finds that the Philippines are among the countries that fall under the low financial inclusion category. In particular, the Philippines ranks 34th out of 55 countries in the three-dimensional index and 53rd out of 100 countries in the two-dimensional index. Table 3 presents the constructed index and the ranking of selected countries based on the research, only Malaysia and Thailand reached the medium financial inclusion category while the rest are in the low financial inclusion group.
Notes: 1) IFI values between 0.5 to 1 is classified as high financial inclusion, while between 0.3 to 0.5 is classified under medium financial inclusion, and values under 0.3 are considered as low financial inclusion; and 2) The two-dimensional index excludes the banking penetration dimension, measured as the number of bank accounts as a proportion to the total population. Source: Sarma, M. (June 2008). Index of Financial Inclusion. In Sarma’s (2012) succeeding research on the same area, the Philippines continues to be in the low financial inclusion category, albeit a recording a higher ratio at 0.258 in 2010. Table 4 shows the index of financial inclusion for selected Southeast Asian countries for the periods 2004-2010. The Philippines advanced at a much slower pace compared to its other neighbors over the past six years, particularly Malaysia and Thailand. These
Table 3: Index of Financial Inclusion of Selected Southeast Asian Countries, 2004 Country IFI Rank IFI Rank
3-Dimensional 2-Dimensional Malaysia 0.406 10 0.367 20 Thailand 0.360 14 0.303 30 Philippines 0.146 34 0.163 53 Indonesia 0.141 60 Cambodia 0.015 100

`
5
countries have transcended to the high financial inclusion group, with Malaysia displaying a relatively swift progress.
Table 4: Index of Financial Inclusion of Selected Southeast Asian Countries 2004 - 2010
Country 2004 2005 2006 2007 2008 2009 2010 Malaysia 0.636 0.692 0.709 0.710 0.720 0.710 0.791 Thailand 0.643 0.655 0.655 0.673 Philippines 0.216 0.221 0.218 0.228 0.231 0.258 Cambodia 0.037 0.054 0.061 0.074 0.087
Note: IFI values between 0.6 to 1 is classified as high financial inclusion, while between 0.3 to 0.6 is classified under medium financial inclusion, and values under 0.3 are considered as low financial inclusion Source: Sarma, M. (July 2021). Index of Financial Inclusion- A Measure of Sector Inclusiveness. According to Socioeconomic Planning Secretary Artemio Balisacan, “only 41 out of 100,000 Filipinos own a deposit account.” Moreover, the number of deposit accounts per 100,000 population is likewise still very far from the target of 750 by 2016, registering only at 41.3 in the first half of 2012. (NEDA, 2013 and De Leon, 18 February 2013) These statements are parallel to the results of the Consumer Finance Survey (CFS) conducted by the Bangko Sentral ng Pilipinas (BSP). 1 Based on the survey eight out of ten households are unbanked, and among those with deposit accounts, approximately 71 percent only have one bank account. The percentage of banked households in NCR, about 28 percent, is significantly higher than that in AONCR, roughly 16 percent only. In terms of credit availment, the survey results revealed that most of the respondents acquired their assets/properties through cash payment instead of borrowing, and on average, less than seven percent availed of loans to acquire properties/assets. (CFS, 2009) III. Review of Related Literature The Index Sarma’s (2008) cross-country research on financial inclusion introduces the concept of constructing an index of financial inclusion (IFI) in order to measure a country’s current state of financial inclusion. The study provides three-dimensional IFIs for 55 countries and two-dimensional IFIs for 100 countries for the year 2004. The two-dimensional IFI 1 Reference year: 2009 as the reference year. Coverage: National Capital Region (NCR), Region 1- Ilocos Region, Region 7- Central Visayas and Region 11- Davao Region (the last three regions are classified as Areas Outside NCR (AONCR)). The survey looks at the financial conditions of households, including their sources of financing and level of indebtedness. 2 Data sources: 2012 Family Income and Expenditure Survey, NSO and NSCB. 3 “Poverty incidence proportion of families/individuals whose income is below the poverty threshold or whose income is not sufficient to buy the basic food and non-‐food requirements, , while the subsistence incidence is proportion of families/individuals whose income is below the food threshold or whose income is not sufficient to buy food items that will meet the basic food requirements.” (NSCB Resolution No. 2, series of 2007) The annual per capita poverty threshold Php 18,935, while the annual per capital subsistence threshold is Php13,232 in

`
6
excludes the dimension pertaining to banking penetration. The dimensions are as follows with their corresponding purpose and indicators employed:
Dimension Captures/Measures Indicator Employed Banking penetration
Size of “banked” population
Number of bank accounts as a proportion of the total population
Availability of Banking Services
Accessibility of banking services to its users
Number of bank branches per 1000 population
Usage Utilization of banking services
Volume of credit and deposit as a proportion of the country’s gross domestic product (GDP)
The paper also provides a discussion on the significance of the said dimensions in measuring financial inclusion:
1. Banking penetration (dimension 1): An inclusive financial system should have as many users as possible, that is, an inclusive financial system should penetrate widely amongst its users… The proportion of people having a bank account is a measure of the banking penetration of the system;
2. Availability of banking services (dimension 2): In an inclusive financial system, banking services should be easily available to the users. Indicators of availability are banking outlets (offices, branches, ATMs and so on); and
3. Usage (dimension 3): This dimension is motivated by the notion of ‘underbanked’
or ‘marginally banked’ people... These underbanked people, despite having access to the formal financial services, are unable to use the financial services, due to various reasons... These factors reflect negatively on the inclusiveness of a financial system. Thus, merely having a bank account is not enough for an inclusive financial system; it is also imperative that the banking services are adequately utilized.
Sarma (2008) uses an approach similar to the United Nations Development Programme’s (UNDP) method in measuring development indices. Each dimension is computed as follows: 𝑑! =
!!! !!!!! !!
, where: Ai = actual value of the dimension, Mi = maximum value of dimension i, and mi = minimum value of dimension i. This ensures that the value of di will fall between 0 and 1. To construct the IFI for a particular country, Sarma (2008) measured the normalized inverse Euclidean distance of the point representing the country in the n-dimensional Cartesian plane from the ideal point, which is the point where all dimensions equal to one. The formula is as follows:
𝐼𝐹𝐼! = 1− 1− 𝑑! ! + 1− 𝑑! ! +⋯+ 1− 𝑑! !
𝑛
where each di captures a particular dimension (i.e. penetration, availability or usage) and n is the number of dimensions.

`
7
The study finds that among the 55 countries (under the three-dimensional IFI) only five countries belong to the high IFI classification (IFI values of 0.5 and up) led by Spain at 0.737, while nine countries fall under the medium IFI category (IFI values between 0.3 to 0.5), and the rest of the countries are under the low IFI classification (IFI values below 0.3), with Madagascar registering the lowest IFI value at 0.155. Furthermore, the study concludes that most countries in the high IFI group belonged to high-income OECD countries, while the frontrunners in the Southeast region are Malaysia, Singapore and Thailand. The Philippines, belonging to the low IFI group and ranks 34th out of the 55, recorded an IFI value of 0.146. Chattopadhyay (2011) applies the methodology developed by Sarma (2008) to generate a state-wise index for India in order to assess each state’s financial inclusiveness. The study includes the years 2006-2009 and zooms in on West Bengal by conducting a survey in the said state to reinforce the paper’s initial findings. The research’s methodology varies slightly in the indicators used to measure the various dimension (summarized below), in light of the recent literary developments in the field and data availability.
Dimension Chattopadhyay (2011) Sarma (2008) Indicator Banking penetration Number of bank accounts (deposit
and credit) as a proportion of the total population
Number of bank accounts as a proportion of the total population
Availability of Banking Services
Number of bank branches per 1000 adult population; Number of branches per square km
Number of bank branches per 1000 population
Usage Volume of outstanding deposit and credit as proportion of state domestic product
Volume of credit and deposit as a proportion of the country’s GDP
The research finds that only two states, Maharashtra and Karnataka, belong to the high IFI group, while five states fall under the medium IFI group. The remaining 16 states are classified as low IFI. The study notes that all the southern states belonged to either the high or medium IFI groups, while all the Eastern, Northeastern, and Central states fall under the low IFI category. In terms of monitoring policy initiatives, the paper concludes that there has been no considerable success in financial inclusion in India since the initiatives started in 2005-06. Sarma (2012) continued the research on constructing a financial inclusion index by employing a more sophisticated methodology to measure the financial inclusiveness of 94 countries over the period 2004 to 2010. This approach differs from the one employed in Sarma’s earlier study in the following aspects: 1) introduction of weights to the dimensions, depending on its perceived importance in gauging financial inclusiveness; 2) redefinition of the maximum value in the calculation of dimensions to correct for outliers and the varying values of the upper bound in the time series; 3) revision of the IFI formula; and 4) revision of the ranges for the classification of IFI values. The table below summarizes the dimensions, the weights assigned to each dimension, the upper limits, and the indicators employed to measure the dimension:

`
8
* Represents the 90th percentile of the distribution of the dataset except for the ATM dimension, which represents approximately the 92th percentile. The study calculates each dimension as follows: 𝑑! = 𝑤!
!!! !!!!! !!
, where wi represents the weight assigned to that particular dimension. Albeit still based on UNDP’s approach, the index differs in a sense that it is “based on a notion of distance from a worst and an ideal situations.” It takes into account the distance between a particular point, X, from the ideal point, W, as well as from the worst point, O, as illustrated graphically in Chart 2. The calculation of the index uses a simple average of the Euclidean distance between X and O and the inverse Euclidean distance between X and W. The equation below presents the new IFI calculation for each country, where X1 represents the distance between point X from the worst point O, and X2 represents the distance between point X and the ideal point W. (Sarma, 2012)
𝐼𝐹𝐼! =12
𝑑! ! + 𝑑! ! +⋯+ 𝑑! !
𝑛+ 1 −
1 − 𝑑! ! + 1 − 𝑑! ! +⋯+ 1 − 𝑑! !
𝑛
The countries are classified according to their respective IFI values. Those with IFI values between 0.6 and 1 are classified as high IFI countries, those with values between 0.3 and 0.6 are considered as medium IFI countries, and those with less than 0.3 are placed under the low IFI group. Results show that most countries with high IFI values belong to high-income countries, while those in the low IFI group are predominantly from low and lower middle income countries. Factors Affecting the State of Financial Inclusion According to the World Bank (2012), the most prevalent reasons for not having a bank account are insufficient income, transactions costs, distance of financial institutions and bureaucratic barriers. Sarma (2012) offers a parallel finding that in general “financial inclusion and income levels tend to move in the same direction.” The World Bank’s
Dimension Weight (wi)
Indicator Upper Limit*
Banking penetration
1
Number of deposit bank accounts per 1000 adult population
2500 – average of at least two deposit accounts per adult
Availability of banking services
0.5 Number of bank outlets per 1000 population Number of ATMs per 1000 population
60 – about 1667 clients per bank branch 120 – 1 ATM per 833 adults
Usage 0.5 Volume of credit to the private sector and deposit mobilized from the private sector as proportion of the country’s GDP
300 – credit plus deposit to GDP ratio of 3
X1 X2

`
9
(2014) report on financial development also points out that barriers to financial access are more pronounced for the poor, women, youth and rural-based segments of the society. On a more micro-level, Chattopadhyay (2011) further assesses the degree of financial inclusiveness in the state by looking at socio-economic factors as well as the inhabitants’ opinion on banking services in the three districts of West Bengal, a low IFI state. Chattopadhyay (2011) finds that a significant portion of the population is dependent on cultivation and that in the district of Birbhum, the loan extensions are particularly very low because the families living there “have no meaningful income and lack[s] direction in business plans.” The research adds that those without bank accounts felt that they do not have enough income to open a bank account, albeit the perceived adequate banking facilities in the area. In the case of the Philippines, the BSP and Alliance for Financial Inclusion (AFI) Financial Inclusion Data Working Group (2014) highlights the country’s geographical and physical constraints, given its archipelagic nature, in facilitating financial access. The case study likewise adds that the “distribution of banking services is skewed highly to urbanized and populous regions,” citing that Metro Manila itself accounts for “43 percent of the total number of deposits and 68 percent of the amount of bank deposits.” Meanwhile, demand side factors identified by the CFS (2009) include insufficient money (92.8 percent), no need for bank/cash account (1.7 percent), unable to manage an account (1.5 percent), minimum balance is too high (1.2 percent), and dislike in dealing with bank/institutions (1.0 percent), among others. The survey concludes that credit access in some areas of the country is “relatively limited.” IV. Methodology This study constructs a regional IFI for the Philippines in order to gauge the degree of financial inclusiveness of each region for the year 2012. The research methodology adopts that of Sarma’s (2012) research with slight differences on the indicators employed due to data availability and the minimum values used in computing the values for the dimensions in order to correct for outliers. The data are sourced from the Bangko Sentral ng Pilipinas (BSP), National Statistics Office (NSO), National Coordination Board (NSCB), and the report on the State of Financial Inclusion in the Philippines (BSP, 2012). The dimensions as well as the indicators used in the calculation are as follows:
Chart 2: The Map of the Philippines
Source:www.top-‐destination-‐choice-‐the-‐philippines.com

`
10
Notes: 1) The data on adult (individuals above 15 years old) population is based on the 2010 census of population; 2) The data on the number banking offices include head offices, regular branches, microfinance-oriented branches, extension offices, other banking offices (OBOs), and micro-banking office (MBOs); and 3) The data on the number of alternative financial service providers include Non-stock savings and loan associations (NSSLAs), Credit Cooperatives, Non-bank financial institutions (NBFIs), pawnshops, remittance agents, e-money agents, and money changers/foreign exchange (FX) dealers. Following Sarma’s (2012) formula in deriving the IFI values, the IFI equation for each region is as follows:
𝐼𝐹𝐼! =12
𝑃! ! + 𝐴𝐵𝑆! ! + 𝑈! !
3+ 1 −
𝑃! ! + 1 − 𝐴𝐵𝑆! ! + 1 − 𝑈! !
3
where i represents a given region and Pi, Ai and Ui represents the availability and usage dimensions for that particular region. Similarly, the estimates for the dimension (Di), Pi, ABSi and Ui, is calculated as 𝐷! =
!!! !!!!! !!
, where Ai represents the actual value of the indicator (number of bank accounts, ATM, banking offices, alternative financial service providers, outstanding deposits and loans as a proportion of the regional GDP), and Mi and mi, represents the maximum and minimum values of the dataset, respectively. The upper bound likewise uses the 90th percentile as the maximum value, while the minimum value uses the 10th percentile as the lower bound to adjust for the outliers. Hence for a given dimension, any value above the upper limit is given the highest value—equivalent to the 90th percentile—and any value lower than the lower bound is given the minimum value—equivalent to the 10th percentile. Since the availability dimension has there indicators (di), a simple average of the three indicators was used, following the method by Gupte et al. (2012) in estimating dimensions that have multiple indicators. As for categorizing the IFI values, the study follows Sarma’s (2012) classification, wherein IFI values between 0.6 and 1 are classified as high IFI regions, those with values between 0.3 and 0.6 are considered as medium IFI regions, and those with less than 0.3 are placed under the low IFI regions. Albeit, it is important to note that the top IFI does
Dimension Notation Indicator * Bank penetration Pi Number of bank accounts per 1000 adult population Availability of banking services
ABSi Number of banking offices per 1000 adult population Number of ATMs per 1000 adult population Number of alternative financial service providers per 1000 adult population
Usage Ui Outstanding loans and deposits as proportion of the region’s GDP

`
11
not imply perfect financial inclusion, rather it is deemed as the “best” state of financial inclusion relative to the country under study, and the same goes for the bottom IFI. V. Presentation and Analysis of Results Table 4 presents the IFI values for the different regions for the year 2012. The IFI values highly vary across the 17 regions, with the National Capital Region (NCR) on top and the Autonomous Region of Muslim Mindanao (ARMM) at the bottom. Among the 17 regions, five regions were able to attain high IFI values, to wit: National Capital Region (NCR), Region III-Central Luzon, Region IVA-CALABARZON, Region VII-Central Visayas and Region XI- Davao Region. The medium IFI regions include Cordillera Administrative Region (CAR), Region VI, and Region X. Meanwhile, nine out of the 17 regions fall under the low IFI group, namely: are Region I, Region II, Region IVB, Region VIII, Region IX, Region XII, Region XIII, and the ARMM. The average index value for “bank penetration” is 0.347, while the average for “availability of banking services” is 0.445, and the average index value for “usage” of banking services is 0.395. As for the overall IFI value, the average stands at 0.398, leaning more towards the lower-end of the medium IFI category. Zooming in on the nine low IFI regions (kindly refer to Table 5), the average IFI value registers at 0.142, falling under the middle range of the low IFI category. The ARMM stands out registering the lowest IFI value for all dimensions. On the other end, the Region XII recorded a 0.293 IFI value, very close to transcending to the middle IFI category. The region’s index for banking penetration is significantly higher than the overall average, however, the availability of banking services and the usage index fall below the overall average. This could suggest that while the population is relatively banked, utilization of financial services is limited, which perhaps could be related to the physical barriers to financial access. In contrast, MIMAROPA has a relatively high index for availability of banking services, only a little below the average, but its banked population is quite low and the use of financial services is at the minimum. This could imply that while there are many available bank outlets in the region, for some reason, the population remains relatively unbanked and financial services are not quite utilized.

`
12
Table 4: IFI values for the 17 regions in the Philippines, 2012
Legend:

`
13
The subsequent discussions explore the potential factors that could help shed light on the degree and variation of IFI values across region. Table 6 presents the correlation between the IFI values and selected socio-economic indicators. While several other factors (e.g. inflation, unemployment, and average family size) were considered in the study, the following factors showed the strongest correlation. Before proceeding further, a cautionary remark is in order. It is important to keep in mind that correlation only implies association but not necessarily causality.
Regions Bank Penetration
Availability of Banking
Services Usage IFI
I- Ilocos 0.065 0.127 0.125 0.108
II- Cagayan Valley 0.000 0.362 0.341 0.252 IV-B MIMAROPA 0.007 0.428 0 0.185
V- Bicol 0.09 0.213 0.063 0.129 IX- Zamboanga Peninsula 0.087 0.101 0.172 0.123
XII- SOCOSKSARGEN 0.47 0.224 0.16 0.293 VIII- Eastern Visayas 0.085 0.153 0 0.089 XIII- CARAGA 0.024 0.292 0.17 0.175
ARMM 0 0 0 0 Average 0.092 0.211 0.115 0.142
Table 6: Correlation with IFI Values 2012 (unless otherwise stated) Per Capital Gross Domestic Product (Current Prices) 0.742 Average Family Income 0.827 Poverty Incidence -0.739 Subsistence incidence -0.650 Level of Urbanization, 2010 0.846 Main Source of Income Salary/Wage 0.738 Entrepreneurial -0.606 Other Sources 0.024 Functional Literacy Rate, 2008 0.692 Share of Agriculture in Total Employment -0.809 Source: National Statistical Coordination Board, National Statistics Office, and Author's calculations
Table 5: Low IFI Regions

`
14
Regional GDP Per Capita Income and Average Family Income 2 The most common reason cited by the respondents in the CFS (2009) for not having a bank account is the lack of money or insufficient income. The results of this study comport with the said statement, GDP per capita is positively correlated to the IFI values at 0.742. Chart 3 presents the regional per capita income of high and low IFI regions. Based on the chart, high IFI regions are associated with significantly higher per GDP capita income while low IFI regions are associated with lower per capita income. The high IFI and high income region is led by the NCR posting 312,137 Php, almost triple the national level of 110,314 Php. In stark contrast is the ARMM which has the lowest IFI value and the lowest per capita income at 27,819 Php. Probing further using the regional average family income, two notable trends can be observed: 1) high IFI regions generally have higher average family income; and 2) regions in the Luzon, even those low IFI regions, generally have higher average household income compared to their counterparts in Visayas and Mindanao. In particular, the three high IFI regions in Luzon rank in the top three nationwide, significantly exceeding the national average of 235,000 Php. The two other high IFI regions located outside Luzon, Region VII and XI, have relatively lower average family income at 209,000 and 194,000, respectively. Moreover, while low IFI regions are generally associated with lower average family income, Regions I and II in the Luzon island registered moderate levels of average family income at 204,000 and 195,000, respectively. These levels are almost at par with the high IFI regions outside Luzon. The lowest average family income was recorded at the ARMM at 130,000, substantially lower than the national average. These results are consistent with Sarma’s (2012) findings that income and level of financial inclusion moves in tandem.
2 Data sources: 2012 Family Income and Expenditure Survey, NSO and NSCB.
Chart 3: GDP Per Capita, by Region (High vs. Low IFI Regions), 2012
Legend: Blue – High IFI regions, Green – Low IFI regions Source: National Statistical Coordination Board
0 50,000 100,000 150,000 200,000 250,000 300,000 350,000
NCR
Central Luzon
Calabarzon
Central Visayas
Davao Region
Ilocos
Cagayan Valley
Mimaropa
Bicol
Eastern Visayas
Zamboanga Peninsula
SOCOSKSARGEN
CARAGA
ARMM
III IV-‐A
VII XI I II IV-‐B
V VIII IX XII XIII

`
15
Poverty Incidence and Subsistence Incidence 3 Regions with high poverty incidence and subsistence incidence translate to higher number of families with inadequate income to even support their basic needs. Thus, these families will most likely fall under the unbanked segment of the population with insufficient income to open deposit accounts. These segments are also unlikely to obtain credit from formal institutions because of their relative riskiness and their inability to comply with the documentary requirements. Regions with high IFI values are associated with lower levels of poverty incidence among its population, especially the three high IFI regions in Luzon: NCR, Central Luzon and CALABARZON. The NCR records the lowest poverty and subsistence incidence at 3.9 and 0.5 percent, respectively. As for the high IFI regions outside Luzon, their poverty and subsistence incidence are comparable, even higher, compared to some of the low IFI regions located in Luzon. This is parallel to the earlier findings on the average household income. Meanwhile, the low IFI regions in Visayas and Mindanao have the highest poverty and subsistence incidences among its population. The ARMM has the highest poverty incidence 55.8 percent, more than half of the population in the region. Based on Chart 4, all the low IFI regions, except for Regions I and II in Luzon, are associated with poverty and subsistence incidences that are well above the national incidence. Table 6 indicates that poverty incidence and subsistence incidence are highly and negatively correlated with IFI values at -0.739 and -0.650, respectively. 3 “Poverty incidence proportion of families/individuals whose income is below the poverty threshold or whose income is not sufficient to buy the basic food and non-‐food requirements, , while the subsistence incidence is proportion of families/individuals whose income is below the food threshold or whose income is not sufficient to buy food items that will meet the basic food requirements.” (NSCB Resolution No. 2, series of 2007) The annual per capita poverty threshold Php 18,935, while the annual per capital subsistence threshold is Php13,232 in 2012.
Note: Poverty incidence and subsistence incidence for the Philippines are 25.2 and 10.4 percent, respectively. Source: Family Income and Expenditure Survey (FIES), National Statistics Office
0 10 20 30 40 50 60
NCR
CAR
Ilocos
Cagayan Va
lley
Central Luzon
Calabarzon
Mim
arop
a
Bicol
Western Visa
yas
Central V
isayas
Eastern Visayas
Zambo
anga Pen
insula
Northern Mindanao
Davao Re
gion
SOCO
SKSA
RGEN
CARA
GA
ARMM
I-‐ II-‐ III-‐ IV-‐A IV-‐B V-‐ VI-‐ VII-‐ VIII-‐ IX-‐ X-‐ XI-‐ XII-‐ XIII-‐
In percent
Poverty Incidence Subsistence incidence
Chart 4: Poverty and Subsistence Incidences, 2012

`
16
Level of Urbanization 4 Most of the high IFI regions are located in Luzon, the largest and considered as the center of economic and political activities in the Philippines. Meanwhile, Regions VII and XI include the two major economic powerhouses and relatively highly urbanized cities, Cebu City and Davao City, respectively. Chart 5 presents the level of urbanization by region for the year 2010. On one hand, it may be observed that all of the high IFI regions are above the national level of 45.3, except for Region VII, which is slightly lower at 43.7. This suggests that regions that are highly financially inclusive are associated with higher levels of urbanization. Financial institutions are likely prefer to invest in areas that are more populous, progressive, and with higher income levels. Correspondingly, higher the percentage of population living in the urbanized area translates to more people having wider access to said financial institutions/services. This potentially explains the positive relationship between the level of financial inclusion and highly urbanized regions. 4 The NSO defines the level of urbanization, “as the proportion of the urban population to the total population for a specific period, which is calculated by dividing the urban population by the total population and multiplying the quotient by 100.” (http://www.census.gov.ph/sites/default/files/attachments/hsd/article/Explanatory%20Text.pdf)
Chart 5: Level of Urbanization, 2010
Note: The national level of urbanization is 45.3. Source: National Statistics Office
100
26.3
12.7 11.6
51.6 59.7
22.3 15.3
34.7 43.7
8.7
33.9 41.3
59.3 46.5
27.5
13.7
0
20
40
60
80
100
120
NCR
CAR
Ilocos
Cagayan Valley
Central Luzon
Calabarzon
Mimaropa
Bicol
Western Visayas
Central Visayas
Eastern Visayas
Zamboanga Peninsula
Northern Mindanao
Davao Region
SOCOSKSARGEN
CARAGA
ARMM
I II III IV-‐A IV-‐B
V VI VII VIII IX X XI XII XIII

`
17
Functional Literacy Rate 5 This study finds that high IFI regions are generally associated with functional literacy rates that are above the national level of 86.4 percent. The NCR leads the pack at 94 percent. Chart 6 presents the functional literacy rate for each region. For the medium IFI group only the CAR, which has the highest IFI value in the group, has a functional literacy rate above the national standard. Correspondingly, the low IFI regions generally have functional literacy rates that are generally lower the national functional literacy rate. The two regions with the lowest IFI, ARMM and Region VIII, also has the lowest literacy rate at 71.6 and 72.9, respectively. This is substantially below the national standard. Lehrer and West (2014) label literacy as “the hidden hurdle” in attaining financial inclusion. The article explains, “systems that should work in theory breakdown when poor people are unable to learn how to use them....” A functionally literate person means that the individual cannot only read and write but also able to compute or completed at least a high school level of education, as such, they are possibly more receptive or at ease in dealing with financial institutions. This could explain the positive correlation between IFI values and the region’s functional literacy rate. (NSO, 2010)
5 The NSCB defines functional literacy as a significantly higher level of literacy that includes reading, writing, and numeracy skill. These skills must be sufficiently advanced to enable the individual to participate fully and effectively in activities commonly occurring in his life situation that require a reasonable capacity beyond oral and written communication. (http://www.census.gov.ph/content/technical-‐notes-‐1994-‐functional-‐literacy-‐education-‐and-‐mass-‐media-‐survey-‐flemms)
Chart 6: Functional Literacy Rate, 2008
Notes: 1) Includes 10-‐64 years old 2) The national literacy rate is 86.4. Source: Functional Literacy, Education and Mass Media Survey (FLEMMS), National Statistics Office
0 10 20 30 40 50 60 70 80 90 100
NCR
CAR
Ilocos
Cagayan Valley
Central Luzon
Calabarzon
Mimaropa
Bicol
Western Visayas
Central Visayas
Eastern Visayas
Zamboanga Peninsula
Northern Mindanao
Davao Region
SOCOSKSARGEN
CARAGA
ARMM
I II III IV-‐A IV-‐B
V VI VII VIII IX X XI XII XIII

`
18
Main Source of Income 6 The research also tests for the correlation between the family’s main source of income, by region, and the IFI and uncovers an interesting observation that regions wherein the family’s main source of income is entrepreneurial are associated with low IFI values. Taking a step further, the research looked into the composition of the entrepreneurial activity in the regions and gains support on its initial proposition that these entrepreneurial activities could be dominated by microenterprises. Chart 7 shows the share of microenterprises in the total number of establishments as well as the share of outstanding microloans to outstanding total loans, by region. Microenterprises in high IFI regions account for about 82.4 – 91.1 percent while for low IFI regions microbusinesses comprise about 92.2 – 96.0 percent. Running a correlation test on the IFI values and the percentage distribution accounted by microenterprises shows a stronger negative correlation at -0.797. Taking these into account, this study surmises that these microenterprises could be largely home-based businesses with income sufficient only to cover day-to-day operations and possibly modestly supplement the family income. As such, there may be none or very little savings, which could potentially be used to open a bank deposit. Consequently, given the size of these businesses it could be that there is little motivation to apply for credit for business expansion and undergo the perceptibly cumbersome loan application process. Similarly, banks may not be very keen on lending to these markets considering the potential risks and the relatively small potential of earning significant returns. The share of loans to microenterprises is highest in Region II and XIII, however, it only accounts for six percent of the overall level of outstanding loans in the region.
6 Data Source: 2012 Family Income and Expenditure Survey, NSO
Chart 7: Share of Microenterprises, 2012
Note: Classification of the size of establishments is based on number of employees. Enterprises with 1-‐9 employees are categorized as a microenterprise. Sources: Bangko Sentral ng Pilipinas and List of Establishments, Department of Trade and Industry
0%
1%
2%
3%
4%
5%
6%
75%
80%
85%
90%
95%
100%
NCR
CA
R Ilocos
Cagayan Va
lley
Central Luzon
Calabarzon
Mim
arop
a
Bicol
Western Visa
yas
Central V
isayas
Eastern Visayas
Zambo
anga Pen
insula
Northern Mindanao
Davao Re
gion
SO
COSKSA
RGEN
CA
RAGA
AR
MM
I-‐ II-‐ III-‐ IV-‐A IV-‐B V-‐ VI-‐ VII-‐ VIII-‐ IX-‐ X-‐ XI-‐ XII-‐ XIII-‐ Share of Microenterprises to Total Number of Establishments (LHS) Share of Microenterprise loans to Total Loans (RHS)
`
19
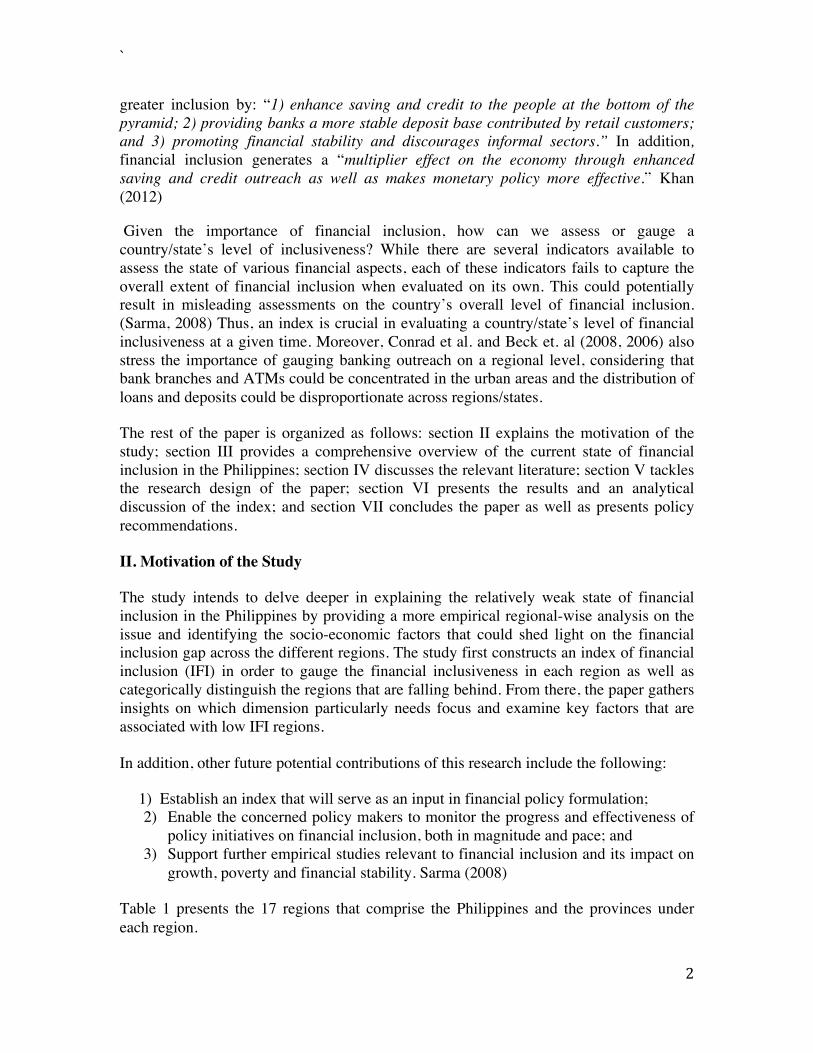
Share of Agriculture in Total Employment
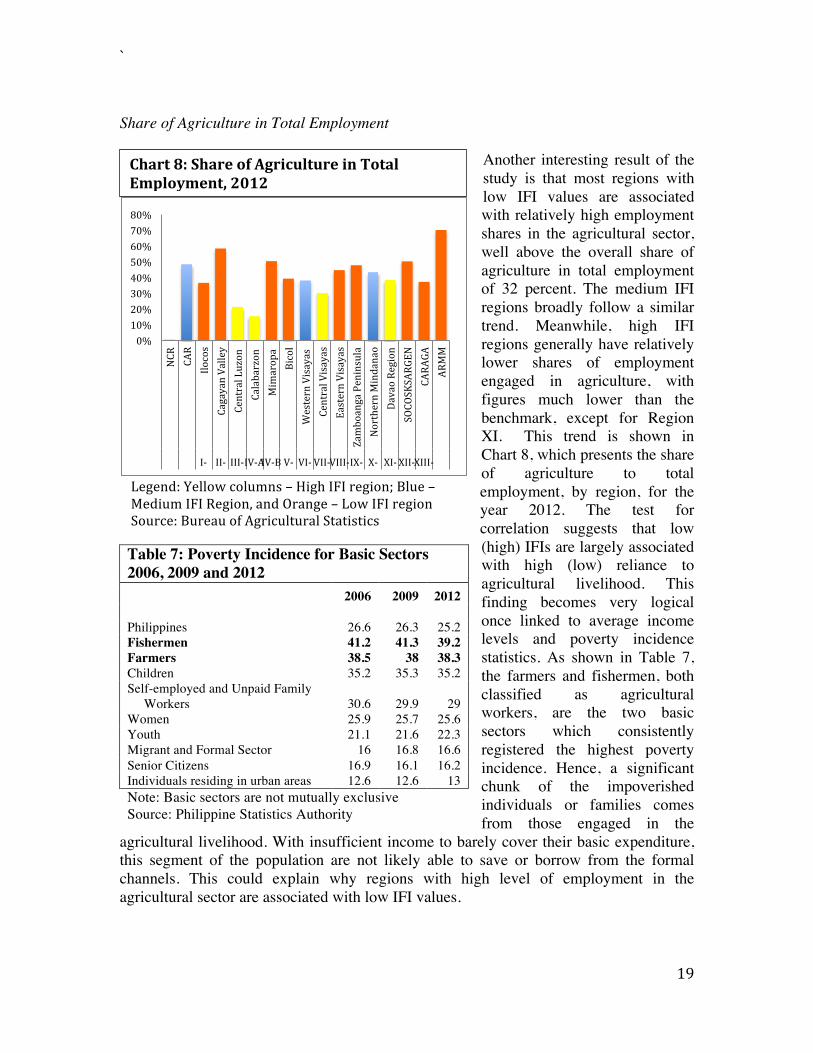
Another interesting result of the study is that most regions with low IFI values are associated with relatively high employment shares in the agricultural sector, well above the overall share of agriculture in total employment of 32 percent. The medium IFI regions broadly follow a similar trend. Meanwhile, high IFI regions generally have relatively lower shares of employment engaged in agriculture, with figures much lower than the benchmark, except for Region XI. This trend is shown in Chart 8, which presents the share of agriculture to total employment, by region, for the year 2012. The test for correlation suggests that low (high) IFIs are largely associated with high (low) reliance to agricultural livelihood. This finding becomes very logical once linked to average income levels and poverty incidence statistics. As shown in Table 7, the farmers and fishermen, both classified as agricultural workers, are the two basic sectors which consistently registered the highest poverty incidence. Hence, a significant chunk of the impoverished individuals or families comes from those engaged in the
agricultural livelihood. With insufficient income to barely cover their basic expenditure, this segment of the population are not likely able to save or borrow from the formal channels. This could explain why regions with high level of employment in the agricultural sector are associated with low IFI values.
Table 7: Poverty Incidence for Basic Sectors 2006, 2009 and 2012 2006 2009 2012 Philippines 26.6 26.3 25.2 Fishermen 41.2 41.3 39.2 Farmers 38.5 38 38.3 Children 35.2 35.3 35.2 Self-employed and Unpaid Family Workers 30.6 29.9 29 Women 25.9 25.7 25.6 Youth 21.1 21.6 22.3 Migrant and Formal Sector 16 16.8 16.6 Senior Citizens 16.9 16.1 16.2 Individuals residing in urban areas 12.6 12.6 13 Note: Basic sectors are not mutually exclusive Source: Philippine Statistics Authority
Chart 8: Share of Agriculture in Total Employment, 2012 In Thousands
Legend: Yellow columns – High IFI region; Blue – Medium IFI Region, and Orange – Low IFI region Source: Bureau of Agricultural Statistics
0% 10% 20% 30% 40% 50% 60% 70% 80%
NCR
CAR
Ilocos
Cagayan Valley
Central Luzon
Calabarzon
Mimaropa
Bicol
Western Visayas
Central Visayas
Eastern Visayas
Zamboanga Peninsula
Northern Mindanao
Davao Region
SOCOSKSARGEN
CARAGA
ARMM
I-‐ II-‐ III-‐ IV-‐A IV-‐B V-‐ VI-‐ VII-‐ VIII-‐ IX-‐ X-‐ XI-‐ XII-‐ XIII-‐

`
20
Special Focus: The Autonomous Region of Muslim Mindanao (ARMM) Moulton and Dall (2006) used the term “fragile states” to characterize a phase of fragility in a nation’s political or economic history, which stems from problems in governance. According to case study, “under the current USAID fragile states typology, the case of Mindanao in the Philippines is considered as a state in arrested development.” However, the Australian Agency for International Development (AusAID) (2012) points out that in reality there are two Mindanaos that exist, "one largely conflict free and growing economically, and one that suffers from insecurity, extreme poverty, and a crisis of governance." The ARMM appears front and center in the latter. The peace and order situation is surmised as a key element that explains the region's dismal state of financial exclusiveness. Also, the conflict in the region contributed to its despondent economic and socio-economic conditions.
The region’s development has been stunted because of the complicated and hostile security and political conditions. The armed conflict in ARMM brought about by decades of insurgency arising from the fight for autonomy by Moro groups as well as internationally-linked terrorist activities. (World Bank, n.d.) Likewise, clan wars, religion-related disputes, and violent political contestation also substantially contribute to the conflict in the region. (AusAID, 2012) Moreover, the region suffers from poor governance and weak rule of law. Table 8 summarizes the Good Governance Index (GGI) and Human Development Index (HDI) of provinces in the region. These figures indicate undesirable living conditions in the area. 7 In addition, the region’s poor infrastructure and unstable power supply have become a crucial impediment to its economic development. (BSP, REDP, 2012)
The security concerns and political instability in the region make the struggle for a more financially inclusive system more challenging. On one hand, for the financial services providers, the instability increases uncertainty in the market and its riskiness as an investment. The constant displacement of people makes the establishment of a permanent and stable client base in the area difficult, increasing the likelihood of loan non-repayments. These conditions discourage financial institutions to invest in the area. On the other hand, for the consumers, the constant displacement and uncertainty in the overall environment compels them to resort to informal mechanisms, which are usually a faster and easier means to access to credit. (African Development Bank, 2013) The constant threat of war also makes it difficult to maintain a stable livelihood and income
7 The NSCB developed the GGI to: “(1) draw attention to good governance outcomes… (2) determine and address the specific areas for improvement… and (3) improve the generation, analysis and utilization of government statistics by addressing the most pressing information needs of the society...” The GGI is constructed using three (3) major indices: the Economic Governance Index (EGI), the Administrative Governance Index (AGI) and the Political Governance Index (PGI). (http://www.nscb.gov.ph/ggi/techNotes.asp) The HDI “attempts to measure the complex concept of human development.” The HDI takes the average of (1) life expectancy; (2) weighted average of functional literacy and combined elementary and secondary net enrolment rate; and (3) real per capita income. (http://www.nscb.gov.ph/technotes/hdi/hdi_tech_comp.asp)

`
21
stream as farms are abandoned and crops are destroyed amid the outburst of armed conflicts. Thus, the overall flow of credit is significantly disrupted, placing both the people and the financial institutions at the losing end. Table 9 presents the impact of conflict in region to credit availment in 2013.
Table 8: Good Governance Index and Human Development Index of the Provinces in the ARMM, for the years indicated Province Good
Governance Index, 2008
Rank Political Governance Index, 2008
Rank Human Development Index, 2009
Rank
Basilan 104.38 65 91.08 56 0.460 62 Lanao del Sur 130.67 26 101.72 13 0.416 70 Maguinadanao 79.06 79 91.46 51 0.470 78 Sulu 107.0 58 79.06 79 0.266 79 Tawi-Tawi 128.73 30 90.12 59 0.310 77 Notes: 1) For the ranking, 1 is the highest out of 79 provinces nationwide; 2) Political governance index is a component of the good governance index. Sources: NSCB, and UNDP (2013), "Philippine Human Development Report 2012/2013"
In addition, the inhabitants of the region are predominantly Muslims who have different banking practices in accordance to the Islamic Shari’ah principles. This is another viable reason for the weak financial penetration in the region, as Islamic banking still has a very limited presence the Philippine financial system. To date, Al Amanah is the only Islamic Bank in the country and it has persistently struggled financially, thus, the privatization by the Development Bank of the Philippines. (Lema, K. and Vizcaino, B., 2013)
Source: The World Bank (2003). "Social Assessment of Conflict-‐Affected Areas in Mindanao," p. 14.
Table 9: Impact of Conflict to Credit Availment in ARMM, 2003

`
22
VI. Conclusion The low ratio of financial inclusion in the Philippines reflects the predominance of low IFI regions over the few high IFI regions in the country. While the lack of physical presence of financial institutions is an apparent constraint in the provision of financial services in the low IFI regions, the more interesting finding is the notable extrication between the availability of financial services and its actual utilization. The people in these regions are not taking advantage of the availability financial services and transactions are usually limited to bank deposits. This disconnection appears to have dragged down the financial inclusiveness in the relevant regions. Thus, initiatives need to be undertaken and efforts need to be intensified to encourage more active usage of financial services. This study likewise offers evidence that even on a micro-level, higher financial inclusiveness is associated with higher levels of income, represented by regional GDP per capita in this study, as in the cross-country research findings. The rationale of this result is supported by the findings on other related variables—average family income as well as poverty and subsistence incidences and their correlation to the IFI values. Similarly, urbanization and literacy levels are also positively correlated with financial inclusiveness, comporting with the findings of other existing literature. On a more distinct note, the research finds that in the Philippines, low IFI regions are commonly associated with predominance of entrepreneurial activity as a main source of income and high share of employment to agriculture. Looking at the overall structure of micro, small and medium enterprises (MSMEs) in the country, the numbers for medium-sized enterprises remain low, resulting in a “hollowed-middle” industry (Fajardo, 2013) Despite the dominance of microenterprises, the amount of outstanding credit extended to these enterprises remains modest compared to the total. The lack of credit could be among the factors that constrain these enterprises to transition to a bigger scale. Moreover, the relatively low credit provision could also be attributed to their inability to obtain bank loans due to insufficient credit profile information and weak asset base to serve as collateral given their relatively small size. Hence, the relatively weak link between the two markets could partly account for the low IFI value in the regions where entrepreneurial activities dominate the source of income. The same can be inferred from the low IFI values in regions where employment is highly contingent on the agricultural sector. Farmers and fisher folks have relatively lower skill level at the same time face an inherent uncertainty in their livelihood and income stream, which adversely influence their inclination and ability to avail loans. However, the more crucial angle behind the financial exclusion of this segment could be on the supply side. Lending institutions catering to this market face “high risk and thin profit margins” because of the market’s modest borrowing capacity and high default probability. (IPA, 2009) The inadequacy of the small farmers’ assets to fully cover the loan reinforces the default concerns thereby further discouraging loan extensions. As a result, formal lending institutions are highly cautious in their lending activities to this segment. In addition, farmers predominantly reside in the rural areas where banking presence is limited, as described in the earlier section. (World Bank, 2014)

`
23
In conclusion, financial literacy can effectively tackle demand side issues, particularly in encouraging and easing the unbanked segment’s apprehensions in transacting with financial institutions. Meanwhile, supply side constraints could be addressed by enhancing the institutional presence of formal fund providers and developing innovative financial instruments that would better cater to the untapped segments. Likewise, the presence of Islamic banking should be strengthened to reach out to the Muslim population in the country. Majority of the Muslim population resides in the Mindanao and thus, the expansion of Islamic banking services could generate significant improvements in the state of financial inclusion in the island where several low IFIs regions located. Furthermore, the glaring significance of income in financial inclusion highlights the need for decentralization of development, which is concentrated mainly in the NCR or in a sense largely centered in Luzon, in order to improve the economic position and income/job opportunities in other regions. However, income seems to be not the only important variable as seen in some low IFI regions in Luzon with relatively moderate-income levels, urbanization and literacy also play a role in a region’s financial inclusiveness. Lastly, further research on the area could include more parameters to better capture the different dimensions, especially the usage dimension, as well as cover a longer time span to provide a more dynamic analysis, particularly in terms of assessing the effectiveness of programs or initiatives targeted at promoting financial inclusion.

`
24
References: African Development Bank (2013). “Financial Inclusion in Africa” http://www.afdb.org/fileadmin/uploads/afdb/Documents/Project-and-Operations/Financial_Inclusion_in_Africa.pdf Australia Agency for International Development (AusAID) Philippines (December 2012). ”Delivery Strategy for Mindanao Conflict-affected Areas." http://aid.dfat.gov.au/Publications/Pages/mindanao-conflict-affected-areas-delivery-strategy.aspx Bangko Sentral ng Pilipinas (BSP) (2009). “Consumer Finance Survey(CFS).” http://www.bsp.gov.ph/publications/media.asp?id=2854 Bangko Sentral ng Pilipinas (2010), “Regional Economic Developments in the Philippines(REDP).” http://www.bsp.gov.ph/downloads/Publications/2010/REDP_Sem10.pdf Bangko Sentral ng Pilipinas (2012), “Regional Economic Developments in the Philippines (REDP).” http://www.bsp.gov.ph/downloads/Publications/2012/REDP_2012.pdf Bangko Sentral ng Pilipinas (2012). “State of Financial Inclusion in the Philippines.” http://www.bsp.gov.ph/downloads/Publications/2012/Financial%20Inclusion.pdf Bangko Sentral ng Pilipinas and the Alliance for Financial Inclusion (AFI) Financial Inclusion Data Working Group (2014). “The Use of Financial Inclusion Data Country Case Study: Philippines (Policy on Micro-Deposits),” Global Partnership for Financial Inclusion and Alliance for Financial Inclusion. http://www.gpfi.org/sites/default/files/documents/The%20Use%20of%20Financial%20Inclusion%20Data%20Country%20Case%20Study_Philippines.pdf Beck, T. and de la Torre, A. (2006). “The Basic Analytics of Access Financial Service,” World Bank Policy Research Working Paper 4026. http://elibrary.worldbank.org/doi/pdf/10.1596/1813-9450-4026 Chattopadhyay, S.K. (January 2011).”Financial Inclusion in India: A case study of West Bengal,” Munich Personal RePEc Archive, MPRA Paper NO. 34269. http://ideas.repec.org/p/pra/mprapa/34269.html Conrad, A., Neuberger, D., and Schneider-Reiβig, M. (2008). “Geographic and Demographic Bank Outreach: Evidence from Germany’s Three-Pillar Banking System,” Thünen-series of Applied Economic Theory, No. 98. http://ideas.repec.org/p/zbw/roswps/98.html De Leon, M. (18 February 2013). “Only 41 in 100,000 Pinoys Own a Bank Account,” Business Mirror. http://businessmirror.com.ph/index.php/en/news/top-news/9456-only-41-in-100-000-pinoys-own-bank-deposit-accounts

`
25
Fajardo, F. (17 July 2013). “Nation’s MSM enterprises plan,”Cebu Daily News. Accessed 18 July 2014. http://newsinfo.inquirer.net/446681/nations-msm-enterprises-plan Gupte, R., Venkataramani, B., and Gupta, D. (2012). “Computation of Financial Inclusion Index for India,” Presented during the International Conference on Emerging Economies – Prospects and Challenges in India on 12- 13 January 2012. Procedia- Science and Behavioral Sciences 37, pp. 133 – 149. http://www.sciencedirect.com/science/article/pii/S1877042812007604 Hannig, A. and Jansen, S. (December 2010). “Financial Inclusion and Financial Stability: Current Policy Issues,” Asian Development Bank Working Paper No. 259. http://www.adbi.org/working-paper/2010/12/21/4272.financial.inclusion.stability.policy.issues/what.is.financial.inclusion/#sthash.ydJ70IqH.dpuf Khan, H. (2012). “Issues and Challenges in Financial Inclusion: Policies, Partnerships, Processes and Products,” Bank for International Settlements (BIS), Central Bankers’ Speeches. Keynote Address at the Symposium on Financial Inclusion in Indian Economy, Organized by Indian Institute of Public Administration, Bhubaneswar, 30 June 2012. http://www.bis.org/review/r120802f.pdf Innovations for Poverty Action (IPA) (April 2009). “Improving Agricultural Microfinance: Barriers to the supply of agricultural lending in the Philippines,” prepared under the joint project by IPA and Hanns Seidel Foundation/Germany (HSF) on “Microfinance Capacity Building Program,” in partnership with the Ninoy and Cory Aquino Foundation (NCAF), and the PinoyME Foundation (PMF). Accessed 16 June 2014. http://www.hss.de/fileadmin/suedostasien/philippines/downloads/090401-Improving-Agricultural-Microfinance.pdf Lehrer, R and West, H. (2014). “Literacy a Hidden Hurdle to Financial Inclusion,” Consultative Group to Assist the Poor (CGAP), www.cgap.org Lema, K. and Vizcaino, B. (27 September 2013). "Bangko Sentral's Islamic banking bid to boost financial inclusion of Muslims," Reuters. GMA News. http://www.gmanetwork.com/news/story/328419/economy/moneyandbanking/bangko-sentral-s-islamic-banking-bid-to-boost-financial-inclusion-of-muslims Moulton, J. and Dall, F. (2006). “Delivering Education Services in Fragile States: Lessons from Four Case Studies,” Creative Associates International, Inc. and The IRIS Center, prepared for the United States Agency for International Development (USAID). http://www.creativeassociatesinternational.com/caiistaff/dashboard_giroadmincaiistaff/dashboard_caiiadmindatabase/publications/Education_States.pdf National Economic Development Authority, Philippines (2013). “Socio-Economic Report 2010-2012.” http://www.neda.gov.ph/wp-content/uploads/2013/10/SER2010-2012.pdf National Statistics Office, Philippines (9 September 2010). “Almost Nine Out of Ten Filipinos Are Functionally Literate (Final Results from the 2008 Functional Literacy and

`
26
Mass Media Survey).” http://www.census.gov.ph/content/almost-nine-out-ten-filipinos-are-functionally-literate-final-results-2008-functional Sarma, M. (June 2008). “Index of Financial Inclusion,” Indian Council For Research On International Economic Relations, Working Paper No. 215. http://www.icrier.org/pdf/Working_Paper_215.pdf Sarma, M. (July 2012). “Index of Financial Inclusion- A Measure of Sector Inclusiveness,” Berlin Working Papers on Money, Finance, Trade and Development, Working Paper No. 07/2012. http://finance-and-trade.htw-berlin.de/fileadmin/working_paper_series/wp_07_2012_Sarma_Index-of-Financial-Inclusion.pdf Ubinas, L. (2013). “Inclusive growth for shared prosperity,” speech delivered at the OECD Workshop on Inclusive Growth in Paris on 23 April 2013. Accessed 16 June 2014. http://www.oecd.org/inclusive-growth/inclusive-growth-for-shared-prosperity.htm United Nations Development Programme (UNDP) (2013), "Philippine Human Development Report 2012/2013." http://hdn.org.ph/20122013-philippine-human-development-report/ World Bank (n.d.). "Social Assessment of Conflict-Affected Areas in Mindanao," p. 14. http://siteresources.worldbank.org/INTCPR/214578-1111741001753/20482308/Mindanao.pdf World Bank (2014), “Global Financial Development Report 2014,” International Bank for Reconstruction and Development and The World Bank. https://openknowledge.worldbank.org/bitstream/handle/10986/16238/9780821399859.pdf?sequence=4 World Bank (19 April 2012). “Three Quarters of the World’s Poor are Unbanked,” http://econ.worldbank.org/WBSITE/EXTERNAL/EXTDEC/0,,contentMDK:23173842~pagePK:64165401~piPK:64165026~theSitePK:469372,00.html World Bank. “World DataBank G20 Financial Inclusion Indicators.” http://databank.worldbank.org/data/views/reports/tableview.aspx Websites: www.bsp.gov.ph www.census.gov.ph www.nscb.gov.ph www.bas.gov.ph www.dti.gov.ph www.undp.org