financial information 2016 - iwatani · financial information 2016. ... lpg sales volumes tend to...
TRANSCRIPT
Financial Information 2016
CONTENTS
Management’s Discussion and Analysis P. 1Consolidated Balance Sheets P. 4Consolidated Statements of Income P. 6Consolidated Statements of Comprehensive Income P. 6Consolidated Statements of Changes in Net Assets P. 7Consolidated Statements of Cash Flows P. 8Notes to the Consolidated Financial Statements P. 9Independent Auditors’ Report P. 29
1
Management’s Discussion and Analysis
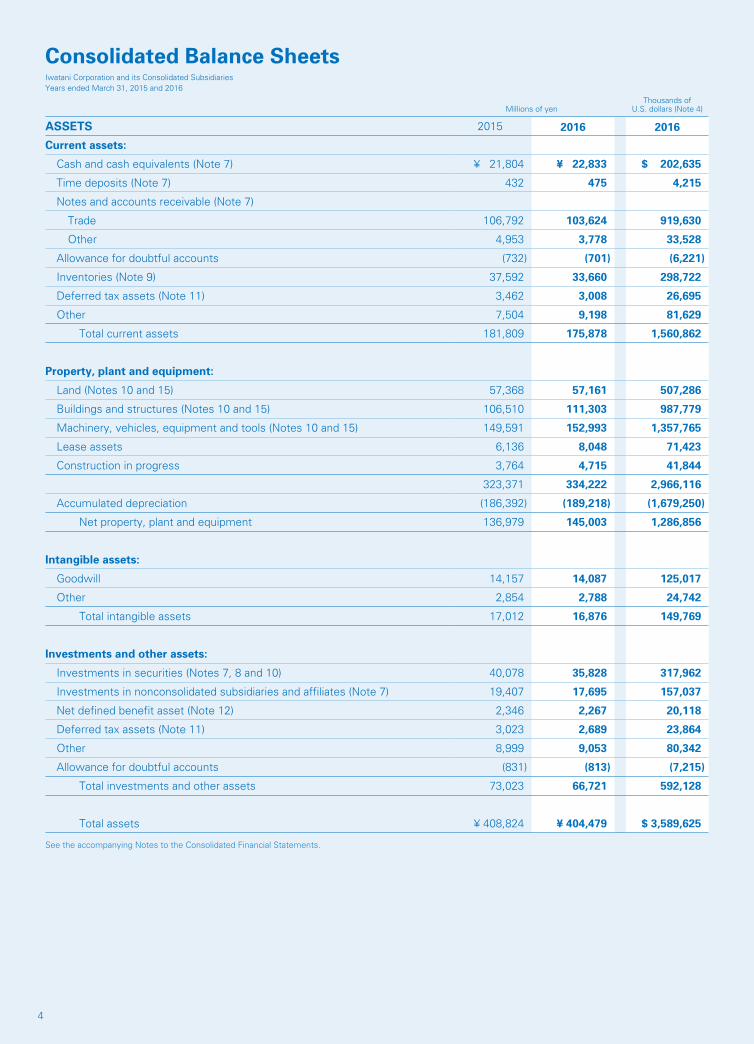
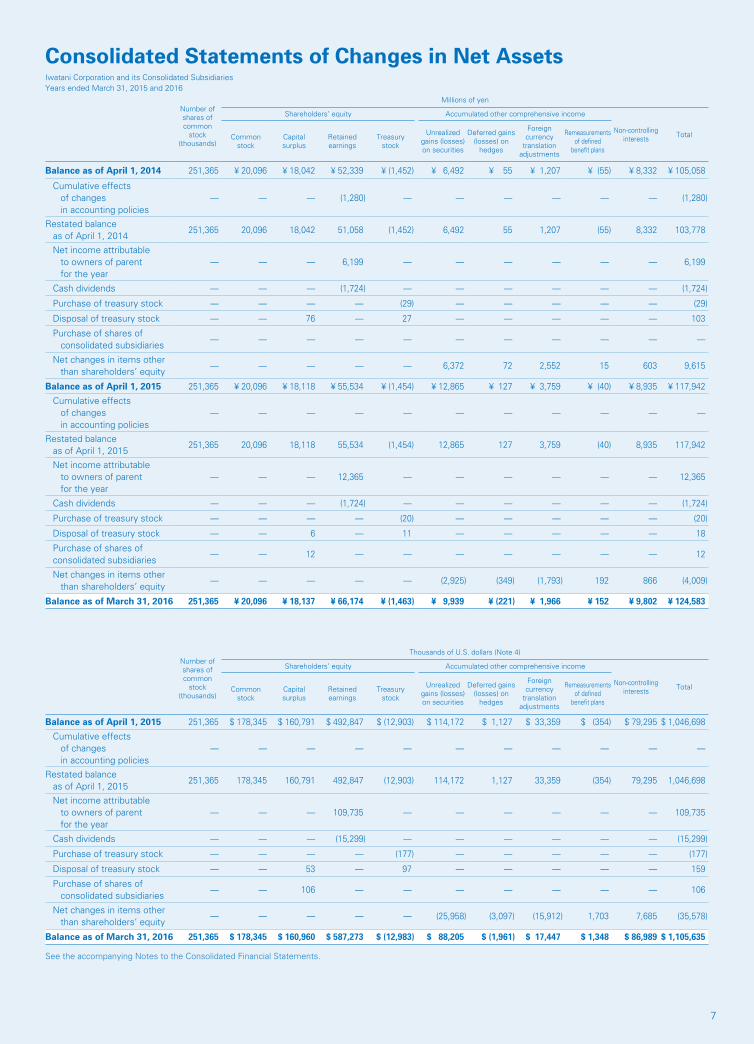
1. Financial PositionTotal assets as of March 31, 2016 stood at ¥404,479 million, a ¥4,345 million decrease compared with the previous fiscal year-end. The change is mainly attributable to decreases of ¥5,961 million in investments in securities, ¥3,168 million in notes and accounts receivable–trade, and ¥2,592 million in merchandise and finished goods, which exceeded increases of ¥4,151 million in buildings and structures, ¥1,217 million in tangible lease assets, and ¥1,108 million in buildings and structures. Total liabilities as of March 31, 2016 stood at ¥279,895 million, a ¥10,986 million decrease compared with the previous fiscal year-end. The change is mainly attributable to decreases of ¥21,522 million in notes and accounts payable–trade, ¥20,300 million in long-term borrowings, and ¥14,224 million in short-term borrowings, which exceeded increases of ¥30,136 million in bonds and ¥14,487 million in electronically recorded obligations–operating. Among liabilities, the aggregate amount of interest-bearing debt including lease obligations was ¥136,514 million, a ¥5,278 million decrease. Total net assets as of March 31, 2016 stood at ¥124,583 million, a ¥6,640 million increase compared with the previous fiscal year-end. The change is mainly attributable to an increase of ¥10,640 million in retained earnings, which exceeded decreases of ¥2,925 million in unrealized gains on securities and ¥1,793 million in foreign currency translation adjustments.
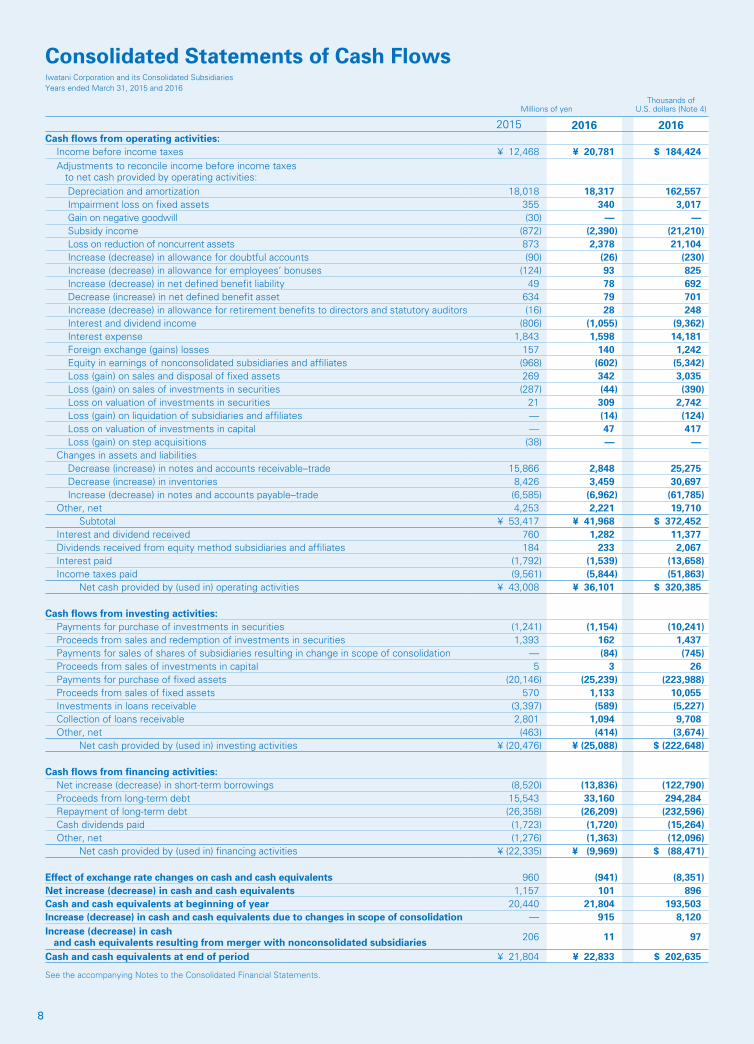
2. Cash FlowsCash and cash equivalents as of March 31, 2016 amounted to ¥21,804 million, a ¥1,363 million increase from the previous fiscal year-end.
(1) Cash flows from operating activitiesNet cash provided by operating activities in the fiscal year ended March 31, 2016 decreased by ¥6,907 million from the previous fiscal year to ¥36,101 million. Major items include ¥20,781 million in income before income taxes and minority interests and ¥15,203 million in depreciation and amortization.
(2) Cash flows from investing activitiesNet cash used in investing activities in the fiscal year ended March 31, 2016 increased by ¥4,611 million from the previous fiscal year to ¥25,088 million. Major items include ¥22,013 million in payments for purchase of property, plant, and equipment.
(3) Cash flows from financing activitiesNet cash used in financing activities in the fiscal year ended March 31, 2016 decreased by ¥12,365 million from the previous fiscal year to ¥9,969 million. Major items include ¥30,150 million in proceeds from
issuance of bonds, ¥2,629 million in repayment of long-term debt, and a ¥13,836 million net decrease in short-term borrowings.
3. Corporate Governance Structure(1) Basic policy on corporate governanceThe Company’s corporate philosophy is “Become a person needed by society, as those needed by society can prosper.” In keeping with that philosophy, the Company has set forth a basic policy on corporate governance consisting of five elements and endeavors to develop a corporate governance structure to increase management soundness, transparency, and efficiency.
Basic policy1. Develop an environment in which shareholders can exercise their
rights appropriately and strive to ensure equal treatment of shareholders.
2. Respect the rights and positions of stakeholders including employees, customers, business partners, creditors, and local communities and endeavor to appropriately cooperate with these stakeholders.
3. Appropriately make information disclosure in compliance with the relevant laws and regulations. Also strive to actively provide information beyond that required by law to ensure transparency.
4. Engage in fair, transparent, and flexible decision-making and endeavor to appropriately execute the roles and responsibilities of the Board of Directors.
5. Endeavor to engage in constructive dialogue with shareholders to contribute to sustained growth and enhancement of corporate value.
(2) Business execution and oversight structure• Board of DirectorsThe Board of Directors, the Company’s business decision-making and oversight body, consists of 17 directors (including two outside directors). The Board of Directors engages in appropriate, prompt decision-making and oversight on the basis of full and active discussion. In particular, the outside directors enhance the function of the Board of Directors by strengthening and enhancing transparency in decision-making and oversight effectiveness through a wealth of experience and extensive knowledge concerning corporate governance from a position independent from management.• Management CommitteeThe Management Committee, consisting of directors at the executive director level and above, meets twice monthly to deliberate on matters to be submitted for resolution by the Board of Directors and important matters related to business execution and to promote information sharing and communication.
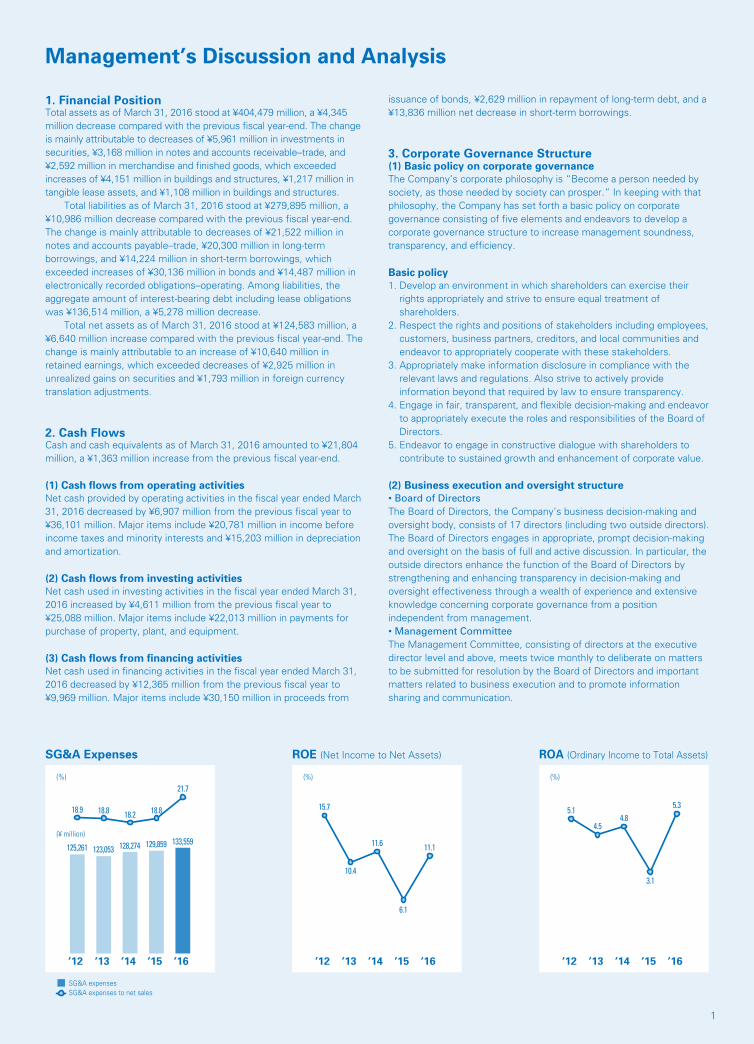
SG&A Expenses ROE (Net Income to Net Assets) ROA (Ordinary Income to Total Assets)
(¥ million)
(%)
SG&A expensesSG&A expenses to net sales
’16’12 ’13 ’14 ’15
18.9 18.8
125,261 123,053
18.2
128,274
18.8
129,859
21.7
133,559
(%)
’16’12 ’13 ’14 ’15
15.7
10.4
11.6 11.1
6.1
(%)
’16’12 ’13 ’14 ’15
5.1
4.54.8
5.3
3.1
2
• Executive Officer SystemThe Company has introduced an executive officer system and is undertaking to invigorate the Board of Directors to increase the speed of decision-making and promote delegation of authority.
(3) Audit structureThe Company has adopted the audit and supervisory board system. The Audit & Supervisory Board consists of four Audit & Supervisory Board members (including two outside Audit & Supervisory Board members). The full-time Audit & Supervisory Board members attend all meetings of the Board of Directors and Management Committee, and the outside Audit & Supervisory Board members also attend meetings of the Board of Directors. The result is a system that enables sufficient monitoring of the directors’ execution of duties. When electing Audit & Supervisory Board members, the Company places importance on specialized expertise in finance and accounting or the law and on knowledge and experience of the Company’s business. The outside Audit & Supervisory Board members, in particular, satisfy the requirements concerning independent corporate officers stipulated by financial instruments exchanges. In this way, the Company has established an audit structure based on more diversified points of view. The Company has established the Audit Department as an organization directly under the control of the president. The Audit Department periodically conducts necessary internal audits, maintaining a close relationship and collaboration with the Audit & Supervisory Board members, and conducts audits to determine whether the Company’s business activities are being conducted appropriately and efficiently.
(4) Risk management systemTo comprehensively manage group-wide risks, the Group established the Risk Management Committee as an organization under the direct control of the president. Eight subcommittees formed under the Committee comprehensively respond to latent and manifest corporate risks. In addition, the Outline of Iwatani Corporate Ethics was established in 1998 to prevent the occurrence of corporate misconduct or scandals, and we are working to ensure awareness of this document throughout the Company and the Group. The Outline consists of ethical standards to be observed throughout every phase of our business activities and is based on management principles, ethical standards, and values shared by Group managers and employees.
4. Business RisksThe following are some risks to the Group’s business that may have a significant influence on investor decisions. Any forward-looking
statements contained herein reflect the judgment of the Group as of March 31, 2016.
(1) Seasonal factors and weather fluctuationsSince consumption of LPG, the Group’s mainstay product, is affected by air and water temperatures, LPG sales volumes tend to decrease in warm seasons and increase in cool seasons. For this reason, the Group’s earnings structure is weighted toward income in the second half of the fiscal year. Additionally, unseasonable weather patterns may affect the Group’s LPG sales volumes.
(2) The impact of LPG import pricesWith regard to LPG import prices, the contract price (CP) announced monthly by Saudi Arabian Oil Company (Saudi Aramco) has a significant influence on pricing decisions in the international market. Accordingly, sudden fluctuations in the CP are a factor that affects the Group’s LPG purchase prices. The Group also procures LPG produced in the U.S. and is affected by fluctuations in the Mont Belvieu (MB) price, the LPG benchmark price in the U.S.
(3) Impact of currency rate fluctuationsThe Group uses forward exchange contracts in order to avoid risks from exchange rate fluctuations in currency markets, which the Group is exposed to in its trade transactions. However, if exchange rates fluctuate rapidly, it is difficult to completely eliminate the risks, meaning that such conditions could impact on the Group’s financial performance.
(4) Impact of interest rate fluctuationsThe Group has financing needs for its strategic investments, including capital expenditures for increasing the number of LPG customer households through M&A, as well as for expanding the industrial gas business. This means that interest rate fluctuations could impact on the Group’s financial performance. However, since most of the Group’s interest-bearing debt has been procured at a fixed rate, such fluctuations have limited impact.
(5) Impact of credit riskThe Group has made it a practice to grant credit to business partners in various ways, meaning that the Group is exposed to credit risk in the event of non-performance by the partners. In order to avoid such credit risk, the Group takes appropriate safeguard measures depending on the partners’ credit standing, such as setting credit limits and obtaining the necessary collateral and guarantees. However, in the event that we are unable to recover credit because of deterioration in credit standing, bankruptcies or other conditions affecting our business partners, the financial performance of the Group could possibly be affected.
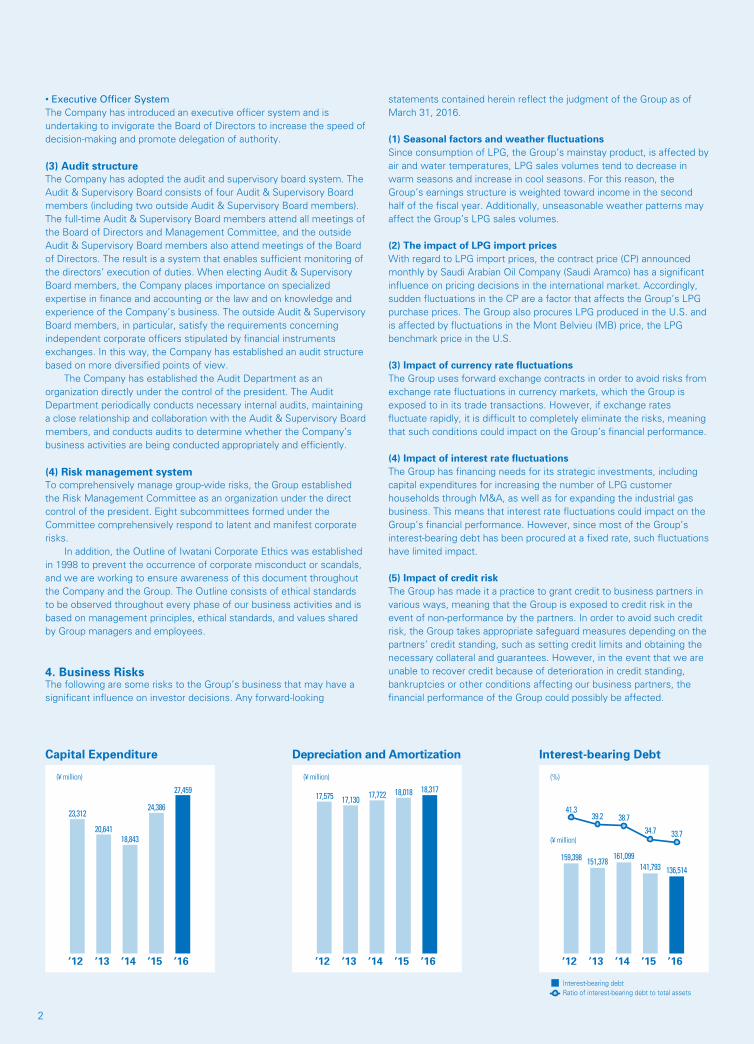
Capital Expenditure Depreciation and Amortization Interest-bearing Debt
(¥ million)
’16’12 ’13 ’14 ’15
23,312
20,64118,843
24,386
27,459
(¥ million)
’16’12 ’13 ’14 ’15
17,575 17,130 17,722 18,018 18,317
(¥ million)
(%)
Interest-bearing debt Ratio of interest-bearing debt to total assets
’16’12 ’13 ’14 ’15
41.339.2
159,398 151,378
38.7
161,099
34.7
141,793
33.7
136,514
32
(6) Intensified competition resulting from deregulationCurrently, legal reforms and deregulation are under way to extensively liberalize the electric power and gas retail businesses. Such movements could result in significant transformation of the business environment toward severer competition within the same industry and/or among the various energy businesses, and the financial performance of the Group could be negatively affected.
(7) Impact of country riskThe Group not only has vast foreign trade transactions, but also has established business operations overseas, especially in Asia. The Group’s financial performance may be affected if changes should occur in the countries and regions where the Group operates, such as deterioration in political and/or economic climate, unexpected revision of laws, regulations and tax schemes, and deterioration of public security.
(8) Risk from price fluctuations in marketable securitiesIn addition to holding shares in the Group companies, the Group holds marketable securities, primarily in business partners, for the purpose of creating closer business relationships. Accordingly, future fluctuations in the stock markets may impact on the Group’s financial performance.
(9) Defects in products and servicesThe products and services of the Group are produced and provided under an appropriate quality control system. However, if compensation was claimed for product liability, or if the Group must recall certain products, the social credibility and public image of the Group could be tarnished, in addition to a considerable amount of monetary expenses being directly required. Such a situation may impact the financial performance of the Group.
(10) DisastersThe Group handles LPG, industrial gases and other products in
compliance with the High-Pressure Gas Safety Law. The Group therefore conducts regular inspections as mandated by the Law, as well as voluntary inspections and checks. However, the stable supply of these products may conceivably be interrupted if the Group’s supply sites or the customers’ facilities were to be damaged due to a large earthquake or other natural disasters.
(11) Handling of personal informationIn running the LPG business and other business operations, the Group handles a considerable amount of personal information. As business operators handling personal information covered by the Law on the Protection of Personal Information, we do our utmost to comply with the Law by always working to ensure that such information is managed properly. However, if any of the personal information the Group handles were to be leaked outside of the Group despite our efforts to prevent such events, the Group’s reputation in society could be tarnished and/or customers could claim for damages. Such events could negatively affect the financial performance of the Group.
(12) Risk relating to legal complianceThe Group, which develops its businesses at home and abroad under various laws, regulations and social norms, has established the Compliance Committee and been striving to reinforce the corporate structure for legal compliance. In addition, the Group has also established the Outline of Iwatani Corporate Ethics, and widely publicized it to all members of the Group as the norm they should comply with. However, if infringement of laws and regulations occurred despite our efforts for thorough legal compliance as described above, the financial performance of the Group could be adversely affected through such consequences as administrative dispositions made by the authorities, lawsuits raised by stakeholders and tarnished social credibility of the Group.
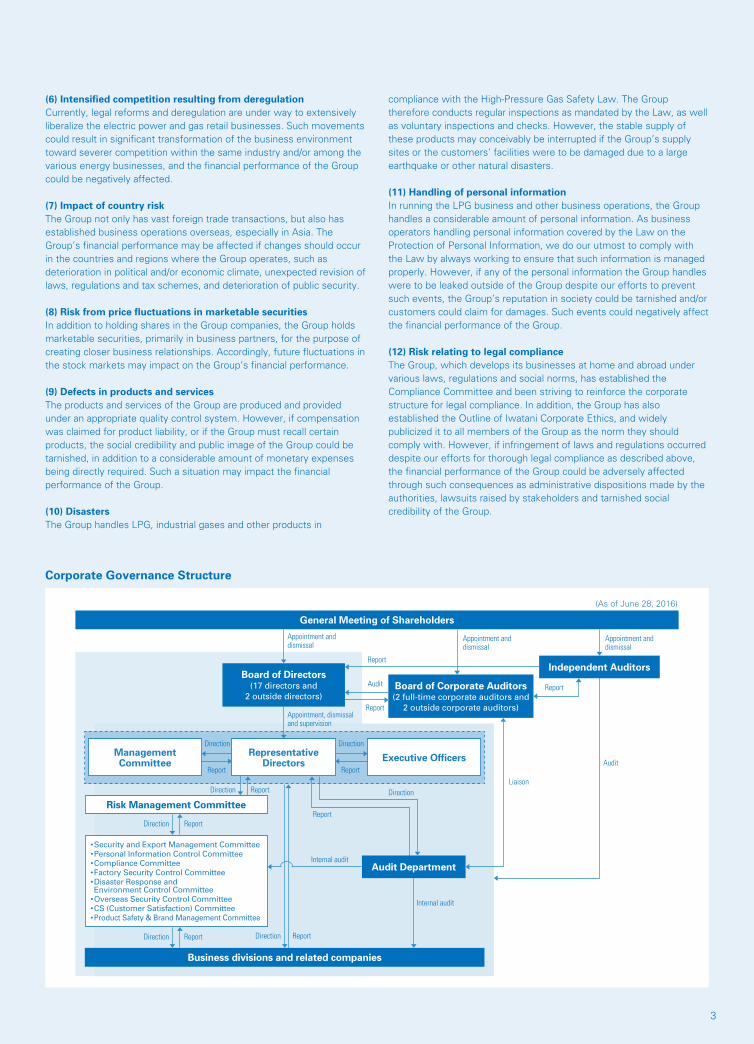
Corporate Governance Structure
General Meeting of Shareholders
Board of Directors (17 directors and
2 outside directors)
Executive Officers
(As of June 28, 2016)
Management Committee
•Security and Export Management Committee•Personal Information Control Committee•Compliance Committee•Factory Security Control Committee• Disaster Response and Environment Control Committee
•Overseas Security Control Committee•CS (Customer Satisfaction) Committee•Product Safety & Brand Management Committee
Business divisions and related companies
RepresentativeDirectors
Board of Corporate Auditors (2 full-time corporate auditors and
2 outside corporate auditors)
Appointment and dismissal
Appointment and dismissal
Report
Report
Report Report
Direction
Direction
Direction Direction
Direction
Report
Report Report
Report
Direction
Direction
Report
Internal audit
Internal audit
Appointment, dismissal and supervision
Report
Liaison
Audit
Audit
Appointment and dismissal
Risk Management Committee
Audit Department
Independent Auditors
4
Consolidated Balance SheetsIwatani Corporation and its Consolidated SubsidiariesYears ended March 31, 2015 and 2016
Millions of yenThousands of
U.S. dollars (Note 4)
ASSETS 2015 2016 2016
Current assets:
Cash and cash equivalents (Note 7) ¥ 21,804 ¥ 22,833 $ 202,635
Time deposits (Note 7) 432 475 4,215
Notes and accounts receivable (Note 7)
Trade 106,792 103,624 919,630
Other 4,953 3,778 33,528
Allowance for doubtful accounts (732) (701) (6,221)
Inventories (Note 9) 37,592 33,660 298,722
Deferred tax assets (Note 11) 3,462 3,008 26,695
Other 7,504 9,198 81,629
Total current assets 181,809 175,878 1,560,862
Property, plant and equipment:
Land (Notes 10 and 15) 57,368 57,161 507,286
Buildings and structures (Notes 10 and 15) 106,510 111,303 987,779
Machinery, vehicles, equipment and tools (Notes 10 and 15) 149,591 152,993 1,357,765
Lease assets 6,136 8,048 71,423
Construction in progress 3,764 4,715 41,844
323,371 334,222 2,966,116
Accumulated depreciation (186,392) (189,218) (1,679,250)
Net property, plant and equipment 136,979 145,003 1,286,856
Intangible assets:
Goodwill 14,157 14,087 125,017
Other 2,854 2,788 24,742
Total intangible assets 17,012 16,876 149,769
Investments and other assets:
Investments in securities (Notes 7, 8 and 10) 40,078 35,828 317,962
Investments in nonconsolidated subsidiaries and affiliates (Note 7) 19,407 17,695 157,037
Net defined benefit asset (Note 12) 2,346 2,267 20,118
Deferred tax assets (Note 11) 3,023 2,689 23,864
Other 8,999 9,053 80,342
Allowance for doubtful accounts (831) (813) (7,215)
Total investments and other assets 73,023 66,721 592,128
Total assets ¥ 408,824 ¥ 404,479 $ 3,589,625
See the accompanying Notes to the Consolidated Financial Statements.

54
Millions of yenThousands of
U.S. dollars (Note 4)
LIABILITIES AND NET ASSETS 2015 2016 2016
Current liabilities:
Short-term borrowings (Notes 7 and 10) ¥ 37,654 ¥ 23,430 $ 207,933
Current portion of long-term debt (Notes 7 and 10) 24,704 22,467 199,387
Notes and accounts payable–trade (Note 7) 97,987 76,464 678,594
Electronically recorded obligations–operating (Note 7) — 14,487 128,567
Income taxes payable 3,347 3,567 31,656
Accrued bonuses 4,364 4,491 39,856
Other 24,620 27,579 244,755
Total current liabilities 192,678 172,489 1,530,786
Long-term liabilities:
Long-term debt (Notes 7 and 10) 75,899 85,735 760,871
Deferred tax liabilities (Note 11) 5,483 4,146 36,794
Net defined benefit liability (Note 12) 5,732 5,811 51,570
Allowance for retirement benefits for directors and statutory auditors 1,174 1,291 11,457
Other 9,913 10,422 92,492
Total long-term liabilities 98,203 107,406 953,194
Total liabilities 290,882 279,895 2,483,981
Contingent liabilities (Note 13)
Net assets (Note 18)
Shareholders’ equity:
Common stock Authorized–600,000,000 shares in 2016 and 2015 Issued–251,365,028 shares in 2016 and 2015
20,096 20,096 178,345
Capital surplus 18,118 18,137 160,960
Retained earnings 55,534 66,174 587,273
Treasury stock, at cost 5,282,495 shares in 2016 5,279,790 shares in 2015
(1,454) (1,463) (12,983)
Total shareholders' equity 92,294 102,945 913,604
Accumulated other comprehensive income:
Unrealized gains (losses) on securities 12,865 9,939 88,205
Deferred gains (losses) on hedges 127 (221) (1,961)
Foreign currency translation adjustments 3,759 1,966 17,447
Remeasurements of defined benefit plans (40) 152 1,348
Total accumulated other comprehensive income 16,712 11,836 105,040
Non-controlling interests 8,935 9,802 86,989
Total net assets 117,942 124,583 1,105,635
Total liabilities and net assets ¥ 408,824 ¥ 404,479 $ 3,589,625
See the accompanying Notes to the Consolidated Financial Statements.

6
Consolidated Statements of IncomeIwatani Corporation and its Consolidated SubsidiariesYears ended March 31, 2015 and 2016
Millions of yenThousands of
U.S. dollars (Note 4)
2015 2016 2016Net sales ¥ 691,902 ¥ 616,201 $ 5,468,592 Cost of sales 550,868 462,145 4,101,393
Gross profit 141,034 154,055 1,367,190 Selling, general and administrative expenses (Note 19) 129,859 133,559 1,185,294
Operating income 11,174 20,496 181,895
Other income (expenses):Interest and dividend income 806 1,055 9,362 Interest expense (1,843) (1,598) (14,181)Equity in earnings of nonconsolidated subsidiaries and affiliates 968 602 5,342 Impairment loss on fixed assets (Note 15) (355) (340) (3,017)Other, net (Note 20) 1,718 565 5,014
1,293 285 2,529
Income before income taxes 12,468 20,781 184,424 Income taxes (Note 11) :
Current 5,433 6,261 55,564 Deferred 114 1,185 10,516
5,548 7,447 66,089
Net income 6,919 13,334 118,335 Net income attributable to non-controlling interests 719 969 8,599 Net income attributable to owners of parent ¥ 6,199 ¥ 12,365 $ 109,735
Yen U.S. dollars (Note 4)
2015 2016 2016Per share (Note 17) :
Basic: net income ¥ 25.19 ¥ 50.24 $ 0.44 Diluted: net income — 46.79 0.41 Cash dividends applicable to the period 7.00 8.00 0.07
See the accompanying Notes to the Consolidated Financial Statements.
See the accompanying Notes to the Consolidated Financial Statements.
Consolidated Statements of Comprehensive IncomeIwatani Corporation and its Consolidated SubsidiariesYears ended March 31, 2015 and 2016
Millions of yenThousands of
U.S. dollars (Note 4)
2015 2016 2016Net income ¥ 6,919 ¥ 13,334 $ 118,335
Other comprehensive income:Unrealized gains (losses) on securities 6,320 (2,942) (26,109)Deferred gains (losses) on hedges 64 (339) (3,008)Foreign currency translation adjustments 2,470 (1,704) (15,122)Remeasurements of defined benefit plans, net of tax (3) 241 2,138 Share of other comprehensive income of associates accounted for using equity method 328 (307) (2,724)
Total other comprehensive income 9,181 (5,053) (44,843)Comprehensive income ¥ 16,100 ¥ 8,281 $ 73,491
Comprehensive income attributable to:Owners of the parent 15,212 7,488 66,453 Non-controlling interests ¥ 888 ¥ 792 $ 7,028
76
Consolidated Statements of Changes in Net AssetsIwatani Corporation and its Consolidated SubsidiariesYears ended March 31, 2015 and 2016
Number of shares of common
stock (thousands)
Millions of yen
Shareholders’ equity Accumulated other comprehensive income
Non-controllinginterests TotalCommon
stockCapital surplus
Retained earnings
Treasury stock
Unrealized gains (losses) on securities
Deferred gains (losses) on
hedges
Foreign currency
translation adjustments
Remeasurementsof defined
benefit plans
Balance as of April 1, 2014 251,365 ¥ 20,096 ¥ 18,042 ¥ 52,339 ¥ (1,452) ¥ 6,492 ¥ 55 ¥ 1,207 ¥ (55) ¥ 8,332 ¥ 105,058
Cumulative effects of changes in accounting policies
— — — (1,280) — — — — — — (1,280)
Restated balance as of April 1, 2014
251,365 20,096 18,042 51,058 (1,452) 6,492 55 1,207 (55) 8,332 103,778
Net income attributable to owners of parent for the year
— — — 6,199 — — — — — — 6,199
Cash dividends — — — (1,724) — — — — — — (1,724)
Purchase of treasury stock — — — — (29) — — — — — (29)
Disposal of treasury stock — — 76 — 27 — — — — — 103
Purchase of shares of consolidated subsidiaries
— — — — — — — — — — —
Net changes in items other than shareholders’ equity
— — — — — 6,372 72 2,552 15 603 9,615
Balance as of April 1, 2015 251,365 ¥ 20,096 ¥ 18,118 ¥ 55,534 ¥ (1,454) ¥ 12,865 ¥ 127 ¥ 3,759 ¥ (40) ¥ 8,935 ¥ 117,942
Cumulative effects of changes in accounting policies
— — — — — — — — — — —
Restated balance as of April 1, 2015
251,365 20,096 18,118 55,534 (1,454) 12,865 127 3,759 (40) 8,935 117,942
Net income attributable to owners of parent for the year
— — — 12,365 — — — — — — 12,365
Cash dividends — — — (1,724) — — — — — — (1,724)
Purchase of treasury stock — — — — (20) — — — — — (20)
Disposal of treasury stock — — 6 — 11 — — — — — 18
Purchase of shares of consolidated subsidiaries
— — 12 — — — — — — — 12
Net changes in items other than shareholders’ equity
— — — — — (2,925) (349) (1,793) 192 866 (4,009)
Balance as of March 31, 2016 251,365 ¥ 20,096 ¥ 18,137 ¥ 66,174 ¥ (1,463) ¥ 9,939 ¥ (221) ¥ 1,966 ¥ 152 ¥ 9,802 ¥ 124,583
Number of shares of common
stock (thousands)
Thousands of U.S. dollars (Note 4)
Shareholders’ equity Accumulated other comprehensive income
Non-controllinginterests TotalCommon
stockCapital surplus
Retained earnings
Treasury stock
Unrealized gains (losses) on securities
Deferred gains (losses) on
hedges
Foreign currency
translation adjustments
Remeasurementsof defined
benefit plans
Balance as of April 1, 2015 251,365 $ 178,345 $ 160,791 $ 492,847 $ (12,903) $ 114,172 $ 1,127 $ 33,359 $ (354) $ 79,295 $ 1,046,698
Cumulative effects of changes in accounting policies
— — — — — — — — — — —
Restated balance as of April 1, 2015
251,365 178,345 160,791 492,847 (12,903) 114,172 1,127 33,359 (354) 79,295 1,046,698
Net income attributable to owners of parent for the year
— — — 109,735 — — — — — — 109,735
Cash dividends — — — (15,299) — — — — — — (15,299)
Purchase of treasury stock — — — — (177) — — — — — (177)
Disposal of treasury stock — — 53 — 97 — — — — — 159
Purchase of shares of consolidated subsidiaries
— — 106 — — — — — — — 106
Net changes in items other than shareholders’ equity
— — — — — (25,958) (3,097) (15,912) 1,703 7,685 (35,578)
Balance as of March 31, 2016 251,365 $ 178,345 $ 160,960 $ 587,273 $ (12,983) $ 88,205 $ (1,961) $ 17,447 $ 1,348 $ 86,989 $ 1,105,635
See the accompanying Notes to the Consolidated Financial Statements.
88
Consolidated Statements of Cash FlowsIwatani Corporation and its Consolidated SubsidiariesYears ended March 31, 2015 and 2016
See the accompanying Notes to the Consolidated Financial Statements.
Millions of yenThousands of
U.S. dollars (Note 4)
2015 2016 2016Cash flows from operating activities:
Income before income taxes ¥ 12,468 ¥ 20,781 $ 184,424 Adjustments to reconcile income before income taxes to net cash provided by operating activities:
Depreciation and amortization 18,018 18,317 162,557 Impairment loss on fixed assets 355 340 3,017 Gain on negative goodwill (30) — —Subsidy income (872) (2,390) (21,210)Loss on reduction of noncurrent assets 873 2,378 21,104 Increase (decrease) in allowance for doubtful accounts (90) (26) (230)Increase (decrease) in allowance for employees’ bonuses (124) 93 825 Increase (decrease) in net defined benefit liability 49 78 692 Decrease (increase) in net defined benefit asset 634 79 701 Increase (decrease) in allowance for retirement benefits to directors and statutory auditors (16) 28 248 Interest and dividend income (806) (1,055) (9,362)Interest expense 1,843 1,598 14,181 Foreign exchange (gains) losses 157 140 1,242 Equity in earnings of nonconsolidated subsidiaries and affiliates (968) (602) (5,342)Loss (gain) on sales and disposal of fixed assets 269 342 3,035 Loss (gain) on sales of investments in securities (287) (44) (390)Loss on valuation of investments in securities 21 309 2,742 Loss (gain) on liquidation of subsidiaries and affiliates — (14) (124)Loss on valuation of investments in capital — 47 417 Loss (gain) on step acquisitions (38) — —
Changes in assets and liabilitiesDecrease (increase) in notes and accounts receivable–trade 15,866 2,848 25,275 Decrease (increase) in inventories 8,426 3,459 30,697 Increase (decrease) in notes and accounts payable–trade (6,585) (6,962) (61,785)
Other, net 4,253 2,221 19,710 Subtotal ¥ 53,417 ¥ 41,968 $ 372,452
Interest and dividend received 760 1,282 11,377 Dividends received from equity method subsidiaries and affiliates 184 233 2,067 Interest paid (1,792) (1,539) (13,658)Income taxes paid (9,561) (5,844) (51,863)
Net cash provided by (used in) operating activities ¥ 43,008 ¥ 36,101 $ 320,385
Cash flows from investing activities:Payments for purchase of investments in securities (1,241) (1,154) (10,241)Proceeds from sales and redemption of investments in securities 1,393 162 1,437 Payments for sales of shares of subsidiaries resulting in change in scope of consolidation — (84) (745)Proceeds from sales of investments in capital 5 3 26 Payments for purchase of fixed assets (20,146) (25,239) (223,988)Proceeds from sales of fixed assets 570 1,133 10,055 Investments in loans receivable (3,397) (589) (5,227)Collection of loans receivable 2,801 1,094 9,708 Other, net (463) (414) (3,674)
Net cash provided by (used in) investing activities ¥ (20,476) ¥ (25,088) $ (222,648)
Cash flows from financing activities:Net increase (decrease) in short-term borrowings (8,520) (13,836) (122,790)Proceeds from long-term debt 15,543 33,160 294,284 Repayment of long-term debt (26,358) (26,209) (232,596)Cash dividends paid (1,723) (1,720) (15,264)Other, net (1,276) (1,363) (12,096)
Net cash provided by (used in) financing activities ¥ (22,335) ¥ (9,969) $ (88,471)
Effect of exchange rate changes on cash and cash equivalents 960 (941) (8,351)Net increase (decrease) in cash and cash equivalents 1,157 101 896 Cash and cash equivalents at beginning of year 20,440 21,804 193,503 Increase (decrease) in cash and cash equivalents due to changes in scope of consolidation — 915 8,120 Increase (decrease) in cash and cash equivalents resulting from merger with nonconsolidated subsidiaries 206 11 97
Cash and cash equivalents at end of period ¥ 21,804 ¥ 22,833 $ 202,635
988
Notes to the Consolidated Financial StatementsIwatani Corporation and its Consolidated Subsidiaries
1. Basis of Presenting Consolidated Financial Statements
The accompanying consolidated financial statements of Iwatani Corporation (“the Company”) and its consolidated subsidiaries (together, “the Companies”) have been prepared in accordance with the provisions set forth in the Japanese Financial Instruments and Exchange Act and its related accounting regulations and in conformity with accounting principles generally accepted in Japan (“Japanese GAAP”), which are different in certain respects as to application and disclosure requirements from International Financial Reporting Standards. The accompanying consolidated financial statements have been restructured and translated into English, with some expanded descriptions, from the consolidated financial statements of the Company prepared in accordance with Japanese GAAP and filed with the appropriate Local Finance Bureau of the Ministry of Finance as required by the Financial Instruments and Exchange Act. Some supplementary information included in the statutory Japanese language consolidated financial statements, but not required for fair presentation, is not presented in the accompanying consolidated financial statements. As permitted, amounts of less than one million yen are omitted in the presentation for 2015 and 2016. As a result, the totals shown in the accompanying consolidated financial statements, both in yen and in U.S. dollars, do not necessarily agree with the sum of the individual amounts.
2. Summary of Major Accounting Policies(1) Scope of consolidationThe accompanying consolidated financial statements include the accounts of the Company and 111 of its subsidiaries for the year ended March 31, 2016. Certain subsidiaries have fiscal years ending on December 31 and on February 29. As a result, adjustments have been made for any significant intercompany transactions which took place during the period between the fiscal year-end of those subsidiaries and the fiscal year-end of the Company.
(2) Equity method of accounting for investments in nonconsolidated subsidiaries and affiliates
As of March 31, 2016, the Company had 61 nonconsolidated subsidiaries and 88 affiliates (Companies over which the Company exercises significant influence over operating and financial policies). The equity method has been applied to the investments in 60 of the subsidiaries and 43 of the affiliates. Since the investments in the remaining affiliates do not have a material effect on consolidated net income and retained earnings, the investments in these affiliates are carried at cost and are not accounted for by the equity method.
(3) Translation of foreign currenciesForeign currency transactions are translated at the applicable rate of exchange prevailing at the transaction date. Assets and
liabilities denominated in foreign currencies at the balance sheet date are translated into Japanese yen at the applicable rate of exchange prevailing at that date. Exchange differences are charged or credited to income. Assets and liabilities of foreign consolidated subsidiaries and affiliates accounted for by the equity method are translated into Japanese yen at applicable year-end rates of exchange, and all income and expense accounts are translated at the average rate of exchange prevailing during the year. The resulting translation adjustments are accumulated and included in ”Foreign currency translation adjustments” classified as part of net assets.
(4) Cash and cash equivalentsCash and cash equivalents include all highly liquid investments, generally, with original maturities of three months or less that are readily convertible to known amounts of cash and are so near maturity that they present insignificant risk of change in value because of a change in interest rates.
(5) SecuritiesSecurities are classified into four categories: trading securities, held-to-maturity debt securities, equity securities of nonconsolidated subsidiaries and affiliates and other securities. As of March 31, 2015 and 2016, the Companies did not hold any trading securities. Held-to-maturity debt securities are stated at amortized cost. Equity securities of nonconsolidated subsidiaries and affiliates are accounted for, with minor exceptions due to materiality, using the equity method of accounting. Other securities whose fair market values are readily determinable are carried at fair value with unrealized gains and losses included as a component of net assets, net of related taxes. Other securities for which it is not practicable to estimate fair value are stated at cost. In cases in which a significant decline in the value of net assets is assessed to be other than temporary, the cost of other securities is written-down by the impaired amount and charged to income. Realized gains and losses are determined by the moving average cost method and are reflected in the consolidated statement of income.
(6) Allowance for doubtful accountsAn allowance for doubtful accounts is provided in an amount based on past experience with bad debts generally and an evaluation of the collectibility of specific receivables with the possibility of default.
(7) InventoriesInventories are stated mainly at the lower of first-in, first-out cost or net realizable value.
(8) Property, plant and equipment and depreciationFixed assets, including significant renewals and additions, are carried at cost. When these assets are retired or otherwise disposed of, the cost and related depreciation are cleared from the respective accounts, and the net difference less any
10
amount realized on disposal is reflected in earnings. Principal estimated useful lives are as follows: Buildings and structures ...............................3 to 50 years Machinery, vehicles, equipment and tools ...2 to 20 years Depreciation is calculated by the declining balance method over the useful life of the asset, except that the straight-line method is applied to the Sakai LPG Plant, hydrogen stations, certain fixed assets for lease, certain gas generators and buildings purchased since April 1, 1998. Lease assets are depreciated using the straight-line method over the lease term as the useful life, with zero residual value. However, finance lease transactions that do not transfer ownership of the lease assets and commenced prior to April 1, 2008 or have total lease payments of not more than ¥3 million ($26 thousand) under a single lease contract are accounted for as operating leases. Maintenance and repairs, including minor renewals and improvements are charged to income as incurred.
(9) Intangible assetsComputer software for internal use is amortized by the straight-line method over the estimated useful life of 5 years. Other intangible assets are amortized by the straight-line method over the estimated useful life of the respective asset.
(10) Income taxesThe asset-liability approach is used to recognize deferred tax assets and liabilities for the expected future tax consequences of temporary differences between the carrying amounts of assets and liabilities for financial reporting purposes and the amounts used for income tax purposes. Deferred income taxes are measured by applying currently enacted tax laws. The effect on deferred tax assets and liabilities of a change in tax rates is recognized in income in the period that the change is enacted. Valuation allowances are recorded to reduce deferred tax assets when it is more likely than not that a tax benefit will not be realized.
(11) Accrued bonusesAccrued bonuses are calculated and provided for based on the estimated amounts of future payments attributable to the services that have been rendered by employees as of the date of the balance sheet.
(12) Retirement benefits( i ) Employees’ severance and retirement benefitsTo provide for retirement benefit payments to employees, net defined benefit asset and liability are recorded at the amounts deemed to be incurred at the fiscal year-end, based on the amount of projected benefit obligations and the fair value of plan assets at the fiscal year-end. The retirement benefit obligations are attributed to periods on a benefit formula basis. Prior service cost is amortized by the straight-line method over a period of 12 to 14 years, which is within the average remaining years of service of employees. Actuarial differences are amortized by the straight-line method over a period of 12 to 14 years, which is within the average remaining years of
service of employees, commencing with the following period. Unrecognized actuarial differences and unrecognized prior service cost are accrued as remeasurements of defined benefit plans, net of tax, in accumulated other comprehensive income in net assets.
(ii) Retirement benefits for directors and statutory auditorsTo provide for the payment of lump-sum retirement benefits to directors and statutory auditors, certain consolidated subsidiaries provide an allowance for retirement benefits to directors and statutory auditors at an amount that would be required by their internal regulations if all directors and statutory auditors retired on the balance sheet date.
(13) Goodwill and negative goodwillGoodwill and negative goodwill generated on or before March 31, 2010 are amortized on a straight-line basis over a period not to exceed 10 years.
(14) Derivative financial instrumentsDerivative financial instruments are used by the Companies principally to reduce interest rate and foreign exchange rate risks. Derivative financial instruments are measured at fair value. Hedging transactions which meet the criteria for hedge accounting are accounted for using deferral hedge accounting, which requires the unrealized gain or loss to be deferred as a liability or asset until the loss or gain on the related hedged item is recognized. In addition, certain forward exchange contracts and certain interest rate swap transactions are accounted for using the allocation method and the special method. The allocation method requires that recognized foreign currency receivables and payables covered by forward exchange contracts be translated at contract rates. Under the special method, interest rate swap transactions are accounted for as if the interest rates under those transactions were originally applied to the underlying borrowings and bonds.
(15) Expenses for research and developmentExpenses for research and development are charged to income when incurred.
3. Changes in Accounting PoliciesPrevious fiscal year (April 1, 2014 to March 31, 2015)
Adoption of accounting standard for retirement benefitsThe Company and its consolidated domestic subsidiaries adopted Article 35 of the “Accounting Standard for Retirement Benefits” (ASBJ Statement No. 26, May 17, 2012 (hereinafter, “Statement No. 26”)) and Article 67 of the “Guidance on Accounting Standard for Retirement Benefits” (ASBJ Guidance No. 25, March 26, 2012 (hereinafter, “Guidance No. 25”)) from the year ended March 31, 2015 and have changed the determination of retirement benefit obligations and current service cost. In addition, the Company and its consolidated domestic subsidiaries have changed the method of attributing expected
1110
benefit to periods from a straight-line basis to a benefit formula basis along with changing the method of determining discount rate to a method that uses a single weighted average discount rate reflecting the estimated timing and amount of benefit payment, rather than a discount rate based on the term of the relevant bonds approximate to the expected average remaining service years of employees. In accordance with Article 37 of Statement No. 26, the effect of changing the determination of retirement benefit obligations and current service costs has been recognized in retained earnings at the beginning of the year ended March 31, 2015. As a result of the application, net defined benefit asset decreased by ¥1,553 million, net defined benefit liability increased by ¥434 million and retained earnings decreased by ¥1,280 million at the beginning of the year ended March 31, 2015. There was immaterial impact on operating income, ordinary income and income before income taxes and minority interests for the year ended March 31, 2015, respectively.
Current fiscal year (April 1, 2015 to March 31, 2016)
Adoption of accounting standards for business combinationsThe Company and its domestic subsidiaries adopted “Revised Accounting Standard for Business Combinations” (ASBJ Statement No.21, September 13, 2013 (hereinafter, “Statement No.21”)), “Revised Accounting Standard for Consolidated Financial Statements” (ASBJ Statement No.22, September 13, 2013 (hereinafter, “Statement No.22”)) and “Revised Accounting Standard for Business Divestitures” (ASBJ Statement No.7, September 13, 2013 (hereinafter, “Statement No.7”)) (together, the “Business Combination Accounting Standards”), from the year ended March 31, 2016. As a result, the Company changed its accounting policies to recognize in capital surplus the differences arising from the changes in the Company’s ownership interest of subsidiaries over which the Company continues to maintain control and to record acquisition related costs as expenses in the fiscal year in which the costs are incurred. In addition, the Company changed its accounting policy for the reallocation of acquisition costs due to the completion following provisional accounting to reflect such reallocation in the consolidated financial statements for the fiscal year in which the business combination took place. The Company also changed the presentation of net income and the term “non-controlling interests” is used instead of “minority interests”. Certain amounts in the prior year comparative information were reclassified to conform to such changes in the current year presentation. In the consolidated statement of cash flows, cash flows from acquisition or disposal of shares of subsidiaries with no changes in the scope of consolidation are included in “Cash flows from financing activities” and cash flows from acquisition related costs for shares of subsidiaries with changes in the scope of consolidation or costs related to acquisition or disposal of shares of subsidiaries with no changes in the scope of consolidation are included in “Cash flows from operating activities”. With regard to the application of the Business Combination
Accounting Standards, the Company followed the provisional treatments in article 58-2 (4) of Statement No.21, article 44-5 (4) of Statement No.22 and article 57-4 (4) of Statement No.7 with application from the beginning of the year ended March 31, 2016, prospectively. As a result, there was immaterial impact on operating income, ordinary income, income before income taxes for the year ended March 31, 2016, and capital surplus as of March 31, 2016.
Unapplied accounting standards– “Revised Implementation Guidance on Recoverability of
Deferred Tax Assets” (ASBJ Guidance No. 26, March 28, 2016 (hereinafter, “Guidance No.26”)
(1) SummaryFollowing the framework in Auditing Committee Report No. 66 “Audit Treatment regarding the Judgment of Recoverability of Deferred Tax Assets”, which prescribes estimation of deferred tax assets according to the classification of the entity by one of five types, the following treatments were changed as necessary:
q Treatment for an entity that does not meet any of the criteria in types 1 to 5
w Criteria for types 2 and 3e Treatment for deductible temporary differences which an
entity classified as type 2 is unable to scheduler Treatment for the period which an entity classified as type 3
is able to reasonably estimate with respect to future taxable income before consideration of taxable or deductible temporary differences that exist at the end of the current fiscal year
t Treatment when an entity classified as type 4 also meets the criteria for types 2 or 3
(2) Effective datesEffective from the beginning of the year ended March 31, 2017.
(3) Effects of application of the standardsThe Company is currently in the process of determining the effects of these new standards on the consolidated financial statements.
4. U.S. Dollar AmountsThe translation of the Japanese yen amounts into U.S. dollar amounts is included solely for the convenience of readers outside Japan, using the prevailing exchange rate as of March 31, 2016, which was ¥112.68 to U.S.$1.00. The translations should not be construed as representations that the Japanese yen amounts have been, could have been or could in the future be converted into U.S. dollars at this or any other rate of exchange.
12
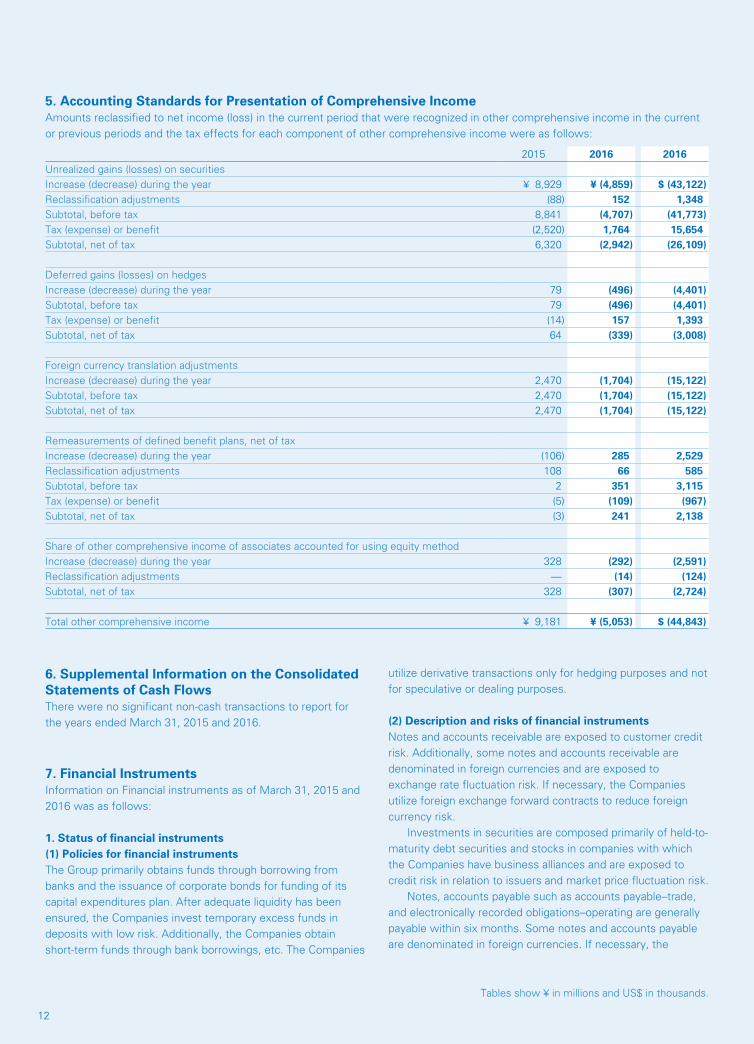
5. Accounting Standards for Presentation of Comprehensive IncomeAmounts reclassified to net income (loss) in the current period that were recognized in other comprehensive income in the current or previous periods and the tax effects for each component of other comprehensive income were as follows:
2015 2016 2016Unrealized gains (losses) on securitiesIncrease (decrease) during the year ¥ 8,929 ¥ (4,859) $ (43,122)Reclassification adjustments (88) 152 1,348 Subtotal, before tax 8,841 (4,707) (41,773)Tax (expense) or benefit (2,520) 1,764 15,654 Subtotal, net of tax 6,320 (2,942) (26,109)
Deferred gains (losses) on hedgesIncrease (decrease) during the year 79 (496) (4,401)Subtotal, before tax 79 (496) (4,401)Tax (expense) or benefit (14) 157 1,393 Subtotal, net of tax 64 (339) (3,008)
Foreign currency translation adjustmentsIncrease (decrease) during the year 2,470 (1,704) (15,122)Subtotal, before tax 2,470 (1,704) (15,122)Subtotal, net of tax 2,470 (1,704) (15,122)
Remeasurements of defined benefit plans, net of taxIncrease (decrease) during the year (106) 285 2,529 Reclassification adjustments 108 66 585 Subtotal, before tax 2 351 3,115 Tax (expense) or benefit (5) (109) (967)Subtotal, net of tax (3) 241 2,138
Share of other comprehensive income of associates accounted for using equity methodIncrease (decrease) during the year 328 (292) (2,591)Reclassification adjustments — (14) (124)Subtotal, net of tax 328 (307) (2,724)
Total other comprehensive income ¥ 9,181 ¥ (5,053) $ (44,843)
6. Supplemental Information on the Consolidated Statements of Cash FlowsThere were no significant non-cash transactions to report for the years ended March 31, 2015 and 2016.
7. Financial InstrumentsInformation on Financial instruments as of March 31, 2015 and 2016 was as follows:
1. Status of financial instruments(1) Policies for financial instrumentsThe Group primarily obtains funds through borrowing from banks and the issuance of corporate bonds for funding of its capital expenditures plan. After adequate liquidity has been ensured, the Companies invest temporary excess funds in deposits with low risk. Additionally, the Companies obtain short-term funds through bank borrowings, etc. The Companies
Tables show ¥ in millions and US$ in thousands.
utilize derivative transactions only for hedging purposes and not for speculative or dealing purposes.
(2) Description and risks of financial instrumentsNotes and accounts receivable are exposed to customer credit risk. Additionally, some notes and accounts receivable are denominated in foreign currencies and are exposed to exchange rate fluctuation risk. If necessary, the Companies utilize foreign exchange forward contracts to reduce foreign currency risk. Investments in securities are composed primarily of held-to-maturity debt securities and stocks in companies with which the Companies have business alliances and are exposed to credit risk in relation to issuers and market price fluctuation risk. Notes, accounts payable such as accounts payable–trade, and electronically recorded obligations–operating are generally payable within six months. Some notes and accounts payable are denominated in foreign currencies. If necessary, the

1312
Companies utilize foreign exchange forward contracts to reduce foreign currency risk. Borrowings and bonds are mainly for capital expenditures. The longest redemption period is fourteen years after the fiscal year closing date. Because some of these instruments have a variable interest rate, they are exposed to interest rate fluctuation risk. Derivative transactions consist of the use of foreign exchange forward contracts for the purpose of hedging exchange rate fluctuation risk related to notes and accounts receivable and notes and accounts payable. Hedging instruments and hedged items, hedging policy, assessment of hedge effectiveness and hedge accounting are discussed in Note 2(15), “Summary of Major Accounting Policies–Derivative financial instruments.”
(3) Risk management of financial instruments( i ) Management of credit risk (risk of default by customers
and counterparties) In accordance with the internal policies of the Companies for managing credit risk arising from receivables and long-term loan receivables, each related sales management section monitors the credit worthiness of their main customers and counterparties on a regular basis and monitors due dates and outstanding balances by individual customer. In addition, the Companies are making efforts to quickly identify and mitigate risks of bad debts of customers who are having financial difficulties. In investments in securities, the Companies monitor the financial condition, etc., of the issuing companies on a regular basis. The Companies believe that the credit risk of the derivatives themselves is insignificant as they enter into derivatives only with financial institutions which have a high credit rating.
(ii) Management of market risk (risk arising from fluctuations in foreign exchange rates, interest rates and others)
The Companies utilize foreign exchange forward contracts within the requirements of their business activities in respect to part of their trade receivables and trade liabilities denominated in foreign currencies to mitigate exchange rate fluctuation risk. In investments in securities, the Companies review the fair value of these securities and the financial condition of the
issuing companies on a quarterly basis. For investments in securities, except held-to-maturity debt securities, the Companies monitor the market price and financial condition of the issuers and regularly evaluate the investment in each company, taking into account the relationship with the counterparty. The accounting department enters into and manages derivative transactions within the requirements of the Companies’ business activities and regulations established by the internal policies of the Companies. Based on policies approved by the Board of Directors, the issuance of bonds and the borrowing of large amounts, etc., are decided only by the Board of Directors. Therefore, foreign exchange forward contracts and interest rate swap contracts in respect to the aforementioned transactions are decided by the Board of Directors at the same time.
(iii) Management of liquidity risk (risk that the Companies may not be able to meet their obligations on scheduled due dates)
The Companies prepare cash flow projections and monitor funding requirements in the accounting department based on reports from each section and maintain fund liquidity.
(4) Supplementary explanation of fair value of financial instruments
The fair value of financial instruments is based on market price, but in cases in which the market price is not available, the fair value is reasonably estimated. As variable factors are incorporated in the estimation of values, values may vary depending on the assumptions used. The contract amount related to derivative transactions under “Note 16, Derivative Transactions,” does not express the market risk related to the derivative transactions themselves.
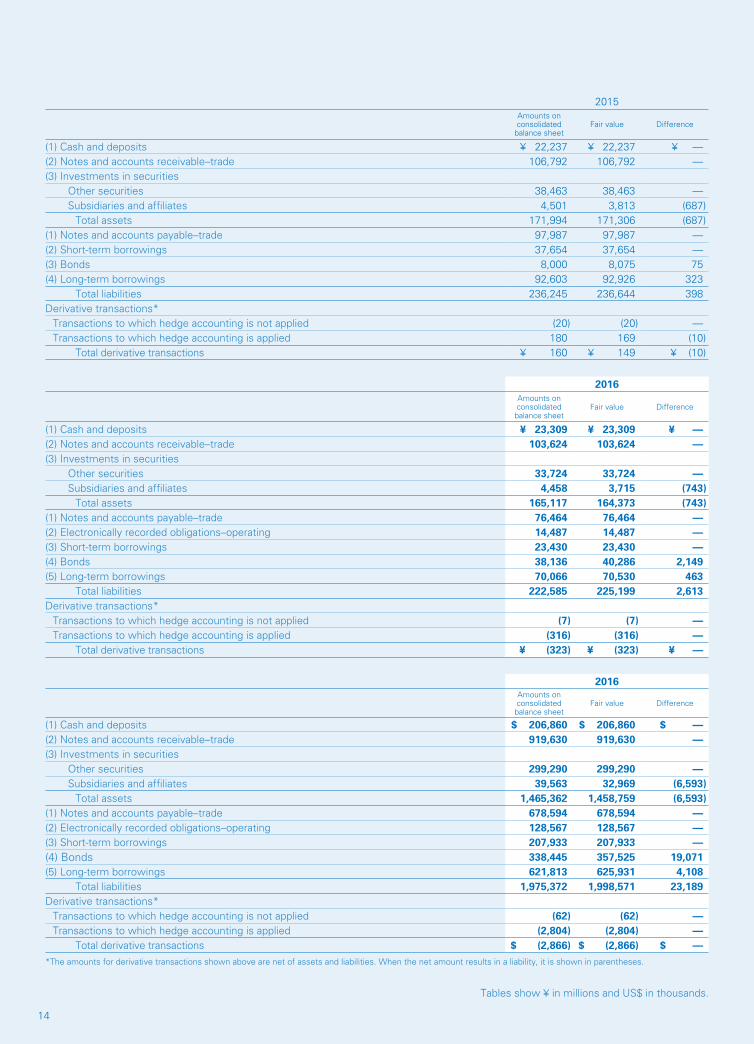
2. Fair values of financial instrumentsFor financial instruments, amounts recorded on the consolidated balance sheet, the fair values as of March 31, 2015 and 2016 and the difference between the two are set forth in the table below. It should be noted that financial instruments for which it was considered extremely difficult to assess the fair value were not included in the table.
14
2015Amounts onconsolidatedbalance sheet
Fair value Difference
(1) Cash and deposits ¥ 22,237 ¥ 22,237 ¥ — (2) Notes and accounts receivable–trade 106,792 106,792 —(3) Investments in securities
Other securities 38,463 38,463 —Subsidiaries and affiliates 4,501 3,813 (687)
Total assets 171,994 171,306 (687)(1) Notes and accounts payable–trade 97,987 97,987 —(2) Short-term borrowings 37,654 37,654 —(3) Bonds 8,000 8,075 75(4) Long-term borrowings 92,603 92,926 323
Total liabilities 236,245 236,644 398Derivative transactions*
Transactions to which hedge accounting is not applied (20) (20) —Transactions to which hedge accounting is applied 180 169 (10)
Total derivative transactions ¥ 160 ¥ 149 ¥ (10)
2016Amounts on consolidated balance sheet
Fair value Difference
(1) Cash and deposits ¥ 23,309 ¥ 23,309 ¥ —(2) Notes and accounts receivable–trade 103,624 103,624 —(3) Investments in securities
Other securities 33,724 33,724 —Subsidiaries and affiliates 4,458 3,715 (743)
Total assets 165,117 164,373 (743)(1) Notes and accounts payable–trade 76,464 76,464 —(2) Electronically recorded obligations–operating 14,487 14,487 —(3) Short-term borrowings 23,430 23,430 —(4) Bonds 38,136 40,286 2,149 (5) Long-term borrowings 70,066 70,530 463
Total liabilities 222,585 225,199 2,613 Derivative transactions*
Transactions to which hedge accounting is not applied (7) (7) —Transactions to which hedge accounting is applied (316) (316) —
Total derivative transactions ¥ (323) ¥ (323) ¥ —
2016Amounts on consolidated balance sheet
Fair value Difference
(1) Cash and deposits $ 206,860 $ 206,860 $ —(2) Notes and accounts receivable–trade 919,630 919,630 —(3) Investments in securities
Other securities 299,290 299,290 —Subsidiaries and affiliates 39,563 32,969 (6,593)
Total assets 1,465,362 1,458,759 (6,593)(1) Notes and accounts payable–trade 678,594 678,594 —(2) Electronically recorded obligations–operating 128,567 128,567 —(3) Short-term borrowings 207,933 207,933 —(4) Bonds 338,445 357,525 19,071 (5) Long-term borrowings 621,813 625,931 4,108
Total liabilities 1,975,372 1,998,571 23,189 Derivative transactions*
Transactions to which hedge accounting is not applied (62) (62) —Transactions to which hedge accounting is applied (2,804) (2,804) —
Total derivative transactions $ (2,866) $ (2,866) $ —*The amounts for derivative transactions shown above are net of assets and liabilities. When the net amount results in a liability, it is shown in parentheses.
Tables show ¥ in millions and US$ in thousands.

1514
Tables show ¥ in millions and US$ in thousands.
Liabilities(1) Notes and accounts payable–trade(2) Electronically recorded obligations–operating(3) Short-term borrowingsThe book value is used as the fair value for these items as the fair value approximates book value due to the short maturity of these instruments.
(4) BondsThe fair values of bonds that have market prices are based on the market prices. The fair values of bonds that do not have market prices are based on present values calculated by discounting the sum of the future principal and interest payments at rates that would be applied if similar borrowings were to be carried out at the present time.
(5) Long-term borrowingsThe fair value of long-term borrowings is based on present value calculated by discounting the sum of future principal and interest payments at rates that would be applied to similar borrowings at the present time.
(Note 1) The calculation method used to determine fair value of financial instruments and matters related to securities and derivative transactions
Assets(1) Cash and deposits(2) Notes and accounts receivable–tradeThe book value is used as the fair value for these items as fair value approximates book value due to the short maturity of these instruments.
(3) Investments in securitiesThe fair value of equity securities is based on market price on securities exchanges. Refer to Note 8, “Investments in Securities,” for notes on securities categorized by holding purposes.
(Note 2) Financial instruments with no fair value as of March 31, 2015 and 2016 were as follows:
2015 2016 2016Held-to-maturity debt securities ¥ — ¥ 180 $ 1,597 Unlisted securities 1,615 1,923 17,066Investments in subsidiaries and affiliates 12,986 11,389 101,073Investments in capital of subsidiaries and affiliates 1,918 1,847 16,391
(Note 3) The maturity profile of the anticipated future contractual cash flows in relation to the Companies’ financial assets as of March 31, 2015 and 2016 was as follows:
2015
Due within 1 year
Due over 1 yearbut within
5 years
Due over 5 yearsbut within10 years
Due over 10 years
Cash and deposits ¥ 22,237 ¥ — ¥ — ¥ —Notes and accounts receivable–trade 106,792 — — —
Total ¥ 129,029 ¥ — ¥ — ¥ —
2016
Due within 1 year
Due over 1 yearbut within
5 years
Due over 5 yearsbut within10 years
Due over 10 years
Cash and deposits ¥ 23,309 ¥ — ¥ — ¥ —Notes and accounts receivable–trade 103,624 — — —
Total ¥ 126,933 ¥ — ¥ — ¥ —
2016
Due within 1 year
Due over 1 yearbut within
5 years
Due over 5 yearsbut within10 years
Due over 10 years
Cash and deposits $ 206,860 $ — $ — $ —Notes and accounts receivable–trade 919,630 — — —
Total $ 1,126,490 $ — $ — $ —
16
Tables show ¥ in millions and US$ in thousands.
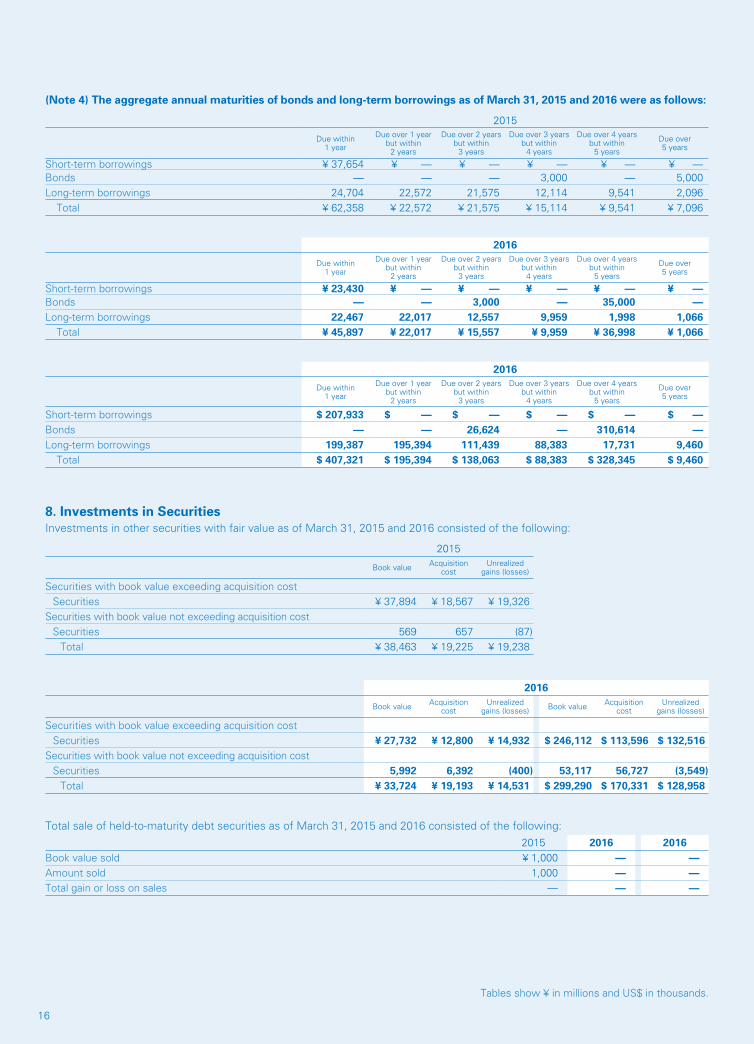
(Note 4) The aggregate annual maturities of bonds and long-term borrowings as of March 31, 2015 and 2016 were as follows:
2015
Due within 1 year
Due over 1 yearbut within
2 years
Due over 2 yearsbut within
3 years
Due over 3 yearsbut within
4 years
Due over 4 yearsbut within
5 years
Due over 5 years
Short-term borrowings ¥ 37,654 ¥ — ¥ — ¥ — ¥ — ¥ —Bonds — — — 3,000 — 5,000Long-term borrowings 24,704 22,572 21,575 12,114 9,541 2,096
Total ¥ 62,358 ¥ 22,572 ¥ 21,575 ¥ 15,114 ¥ 9,541 ¥ 7,096
2016
Due within 1 year
Due over 1 yearbut within
2 years
Due over 2 yearsbut within
3 years
Due over 3 yearsbut within
4 years
Due over 4 yearsbut within
5 years
Due over 5 years
Short-term borrowings ¥ 23,430 ¥ — ¥ — ¥ — ¥ — ¥ —Bonds — — 3,000 — 35,000 —Long-term borrowings 22,467 22,017 12,557 9,959 1,998 1,066
Total ¥ 45,897 ¥ 22,017 ¥ 15,557 ¥ 9,959 ¥ 36,998 ¥ 1,066
2016
Due within 1 year
Due over 1 yearbut within
2 years
Due over 2 yearsbut within
3 years
Due over 3 yearsbut within
4 years
Due over 4 yearsbut within
5 years
Due over 5 years
Short-term borrowings $ 207,933 $ — $ — $ — $ — $ —Bonds — — 26,624 — 310,614 —Long-term borrowings 199,387 195,394 111,439 88,383 17,731 9,460
Total $ 407,321 $ 195,394 $ 138,063 $ 88,383 $ 328,345 $ 9,460
8. Investments in SecuritiesInvestments in other securities with fair value as of March 31, 2015 and 2016 consisted of the following:
2015
Book value Acquisitioncost
Unrealizedgains (losses)
Securities with book value exceeding acquisition costSecurities ¥ 37,894 ¥ 18,567 ¥ 19,326
Securities with book value not exceeding acquisition costSecurities 569 657 (87)
Total ¥ 38,463 ¥ 19,225 ¥ 19,238
2016
Book value Acquisitioncost
Unrealizedgains (losses) Book value Acquisition
costUnrealized
gains (losses)
Securities with book value exceeding acquisition costSecurities ¥ 27,732 ¥ 12,800 ¥ 14,932 $ 246,112 $ 113,596 $ 132,516
Securities with book value not exceeding acquisition costSecurities 5,992 6,392 (400) 53,117 56,727 (3,549)
Total ¥ 33,724 ¥ 19,193 ¥ 14,531 $ 299,290 $ 170,331 $ 128,958
Total sale of held-to-maturity debt securities as of March 31, 2015 and 2016 consisted of the following:2015 2016 2016
Book value sold ¥ 1,000 — —Amount sold 1,000 — —Total gain or loss on sales — — —
1716
Tables show ¥ in millions and US$ in thousands.
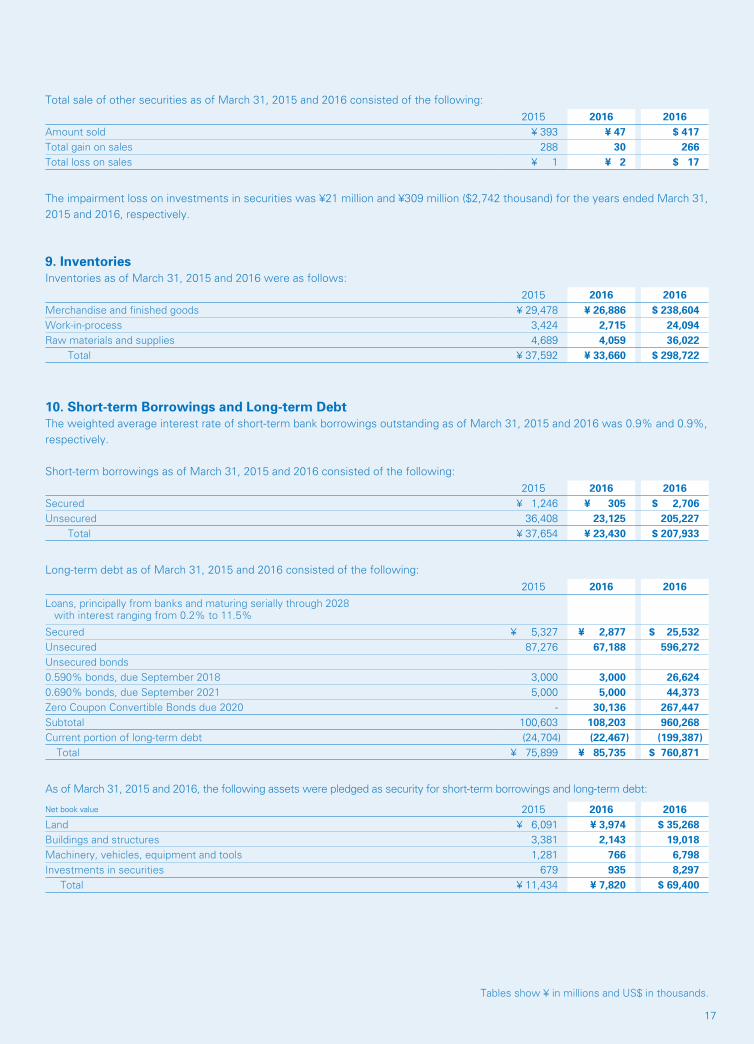
Total sale of other securities as of March 31, 2015 and 2016 consisted of the following:2015 2016 2016
Amount sold ¥ 393 ¥ 47 $ 417Total gain on sales 288 30 266Total loss on sales ¥ 1 ¥ 2 $ 17
The impairment loss on investments in securities was ¥21 million and ¥309 million ($2,742 thousand) for the years ended March 31, 2015 and 2016, respectively.
9. InventoriesInventories as of March 31, 2015 and 2016 were as follows:
2015 2016 2016Merchandise and finished goods ¥ 29,478 ¥ 26,886 $ 238,604Work-in-process 3,424 2,715 24,094Raw materials and supplies 4,689 4,059 36,022
Total ¥ 37,592 ¥ 33,660 $ 298,722
10. Short-term Borrowings and Long-term DebtThe weighted average interest rate of short-term bank borrowings outstanding as of March 31, 2015 and 2016 was 0.9% and 0.9%, respectively.
Short-term borrowings as of March 31, 2015 and 2016 consisted of the following:2015 2016 2016
Secured ¥ 1,246 ¥ 305 $ 2,706Unsecured 36,408 23,125 205,227
Total ¥ 37,654 ¥ 23,430 $ 207,933
Long-term debt as of March 31, 2015 and 2016 consisted of the following:2015 2016 2016
Loans, principally from banks and maturing serially through 2028 with interest ranging from 0.2% to 11.5%
Secured ¥ 5,327 ¥ 2,877 $ 25,532Unsecured 87,276 67,188 596,272Unsecured bonds0.590% bonds, due September 2018 3,000 3,000 26,6240.690% bonds, due September 2021 5,000 5,000 44,373Zero Coupon Convertible Bonds due 2020 - 30,136 267,447Subtotal 100,603 108,203 960,268Current portion of long-term debt (24,704) (22,467) (199,387)
Total ¥ 75,899 ¥ 85,735 $ 760,871
As of March 31, 2015 and 2016, the following assets were pledged as security for short-term borrowings and long-term debt:
Net book value 2015 2016 2016Land ¥ 6,091 ¥ 3,974 $ 35,268Buildings and structures 3,381 2,143 19,018Machinery, vehicles, equipment and tools 1,281 766 6,798Investments in securities 679 935 8,297
Total ¥ 11,434 ¥ 7,820 $ 69,400

18
The aggregate annual maturities of long-term debt as of March 31, 2016 were as follows:Year ended March 31,
2018 ¥ 22,017 $ 195,3942019 15,557 138,0632020 9,959 88,3832021 36,998 328,3452022 and thereafter 1,066 9,460
Total ¥ 85,598 $ 759,655
The Company entered into commitment line contracts with three banks for the efficient management of financial liabilities. The maximum aggregate credit facility available to the Company as of March 31, 2015 and 2016 was ¥10,000 million and ¥10,000 million ($88,746 thousand), respectively. The credit facility has not been used as of March 31, 2015 and 2016.
11. Deferred TaxesThe Company and its domestic subsidiaries are subject to a number of taxes based on earnings which, in the aggregate, resulted in a statutory rate of approximately 35.6% and 33.0% for the years ended March 31, 2015 and 2016, respectively. Overseas subsidiaries are subject to income taxes of the countries in which they operate.
Deferred taxes consisted of the following:2015 2016 2016
Deferred tax assetsTax loss carryforwards ¥ 1,748 ¥ 989 $ 8,777Allowance for doubtful accounts 268 289 2,564Accrued bonuses 1,434 1,383 12,273Net defined benefit liability 1,359 1,155 10,250Accrued enterprise taxes 251 299 2,653
Intercompany profits and write-downs (inventories, investments in securities and fixed assets) 1,477 1,555 13,800
Loss on valuation of securities 327 325 2,884Loss on cancellation of real estate trust 347 328 2,910Impairment loss 779 632 5,608Other 3,993 3,435 30,484Valuation allowance (2,340) (2,234) (19,826)
Total deferred tax assets ¥ 9,645 ¥ 8,161 $ 72,426
Deferred tax liabilitiesReserve for advanced depreciation of noncurrent assets (262) (155) (1,375)Unrealized gains on securities (6,076) (4,370) (38,782)Valuation of assets and liabilities of consolidated subsidiaries on acquisition (973) (946) (8,395)Deferred gains on hedges (67) — —Other (1,263) (1,136) (10,081)
Total deferred tax liabilities (8,643) (6,609) (58,652)Net deferred tax assets ¥ 1,001 ¥ 1,551 $ 13,764
Tables show ¥ in millions and US$ in thousands.

1918
Tables show ¥ in millions and US$ in thousands.
Reconciliation of the differences between the statutory tax rate and the effective tax rate was as follows:2015 2016
Statutory tax rate 35.6% 33.0%Permanently nondeductible expenses 5.2 3.3Permanently nontaxable gain (0.7) (0.3)Change in valuation allowance (0.6) 0.1Taxation on per capital basis 1.6 0.9Equity in earnings of nonconsolidated subsidiaries and affiliates (2.8) (1.0)Retained earnings of foreign consolidated subsidiaries 1.3 (0.2)Adjustment of deferred tax assets due to changes in tax rate 2.7 0.7Other 2.3 (0.7)Effective tax rate 44.5% 35.8%
Adjustment of deferred tax assets and liabilities for enacted changes in tax laws and ratesOn March 29, 2016, amendments to the Japanese tax regulations were enacted. Based on the amendments, the statutory income tax rates utilized for the measurement of deferred tax assets and liabilities expected to be settled or realized from April 1, 2016 to March 31, 2018 and on or after April 1, 2018 are changed from 32.2% for the year ended March 31, 2016 to 30.8% and 30.5%, respectively, as of March 31, 2016.
Due to these changes in statutory income tax rates, net deferred tax liabilities (after deducting the deferred tax assets) decreased by ¥81 million ($718 thousand) as of March 31, 2016, deferred income tax expense recognized for the year ended March 31, 2016 increased by ¥150 million ($1,331 thousand), unrealized gains on securities increased by ¥240 million ($2,129 thousand), remeasurements of defined benefit plans decreased by ¥3 million ($26 thousand) and deferred gains on hedges decreased by ¥4 million ($35 thousand).
12. Employees’ Severance and Retirement BenefitsThe Company and some domestic consolidated subsidiaries have contributory funded defined benefit pension plans and lump-sum benefit plans, and some domestic consolidated subsidiaries have defined contribution plans.
1. Defined benefit plans(1) Movement in retirement benefit obligations
2015 2016 2016Balance as of April 1, ¥ 18,308 ¥ 20,929 $ 185,738
Cumulative effects of changes in accounting policies 1,987 — —Restated balance as of April 1, 20,296 20,929 185,738
Service cost 1,674 1,443 12,806Interest cost 190 169 1,499Actuarial loss (gain) 175 (86) (763)Benefits paid (1,331) (1,306) (11,590)Other (76) (5) (44)
Balance as of March 31, ¥ 20,929 ¥ 21,144 $ 187,646
(2) Movements in plan assets2015 2016 2016
Balance as of April 1, ¥ 17,501 ¥ 17,543 $ 155,688Expected return on plan assets 214 266 2,360Actuarial loss (gain) 94 198 1,757Contributions paid by the employer 377 335 2,973Benefits paid (741) (749) (6,647)Other 98 5 44
Balance as of March 31, ¥ 17,543 ¥ 17,600 $ 156,194
20
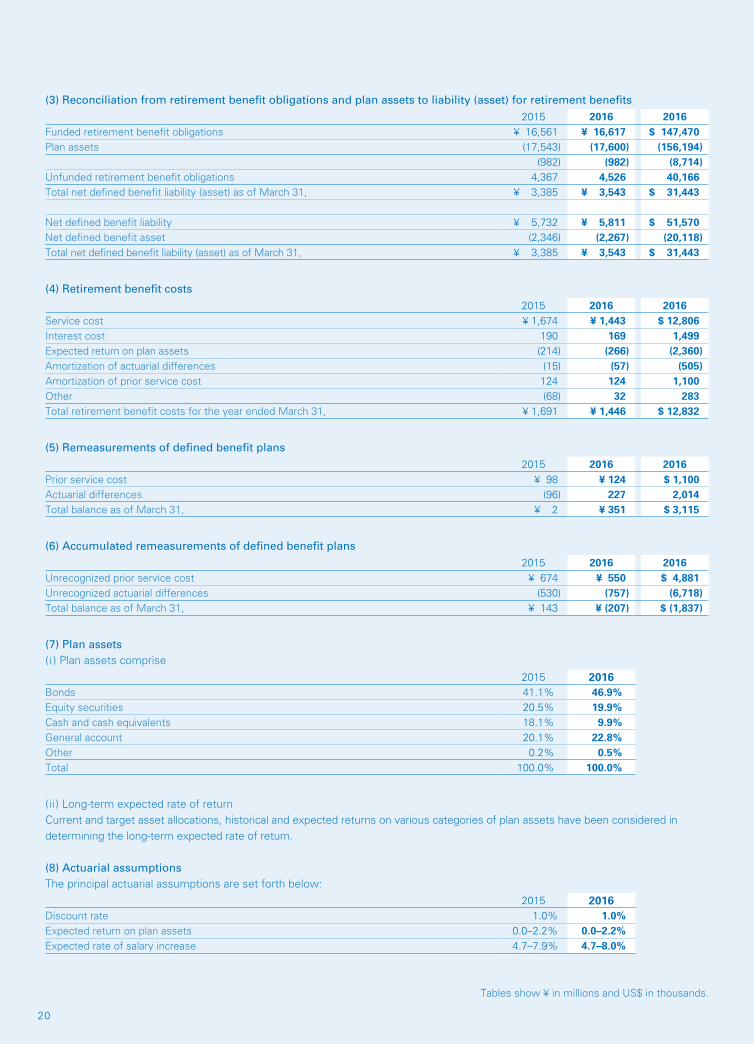
(3) Reconciliation from retirement benefit obligations and plan assets to liability (asset) for retirement benefits2015 2016 2016
Funded retirement benefit obligations ¥ 16,561 ¥ 16,617 $ 147,470Plan assets (17,543) (17,600) (156,194)
(982) (982) (8,714)Unfunded retirement benefit obligations 4,367 4,526 40,166Total net defined benefit liability (asset) as of March 31, ¥ 3,385 ¥ 3,543 $ 31,443
Net defined benefit liability ¥ 5,732 ¥ 5,811 $ 51,570Net defined benefit asset (2,346) (2,267) (20,118)Total net defined benefit liability (asset) as of March 31, ¥ 3,385 ¥ 3,543 $ 31,443
(4) Retirement benefit costs2015 2016 2016
Service cost ¥ 1,674 ¥ 1,443 $ 12,806Interest cost 190 169 1,499Expected return on plan assets (214) (266) (2,360)Amortization of actuarial differences (15) (57) (505)Amortization of prior service cost 124 124 1,100Other (68) 32 283Total retirement benefit costs for the year ended March 31, ¥ 1,691 ¥ 1,446 $ 12,832
(5) Remeasurements of defined benefit plans2015 2016 2016
Prior service cost ¥ 98 ¥ 124 $ 1,100Actuarial differences (96) 227 2,014Total balance as of March 31, ¥ 2 ¥ 351 $ 3,115
(6) Accumulated remeasurements of defined benefit plans2015 2016 2016
Unrecognized prior service cost ¥ 674 ¥ 550 $ 4,881Unrecognized actuarial differences (530) (757) (6,718)Total balance as of March 31, ¥ 143 ¥ (207) $ (1,837)
(7) Plan assets( i ) Plan assets comprise
2015 2016Bonds 41.1% 46.9%Equity securities 20.5% 19.9%Cash and cash equivalents 18.1% 9.9%General account 20.1% 22.8%Other 0.2% 0.5%Total 100.0% 100.0%
( ii ) Long-term expected rate of returnCurrent and target asset allocations, historical and expected returns on various categories of plan assets have been considered in determining the long-term expected rate of return.
(8) Actuarial assumptionsThe principal actuarial assumptions are set forth below:
2015 2016Discount rate 1.0% 1.0%Expected return on plan assets 0.0–2.2% 0.0–2.2%Expected rate of salary increase 4.7–7.9% 4.7–8.0%
Tables show ¥ in millions and US$ in thousands.
2120
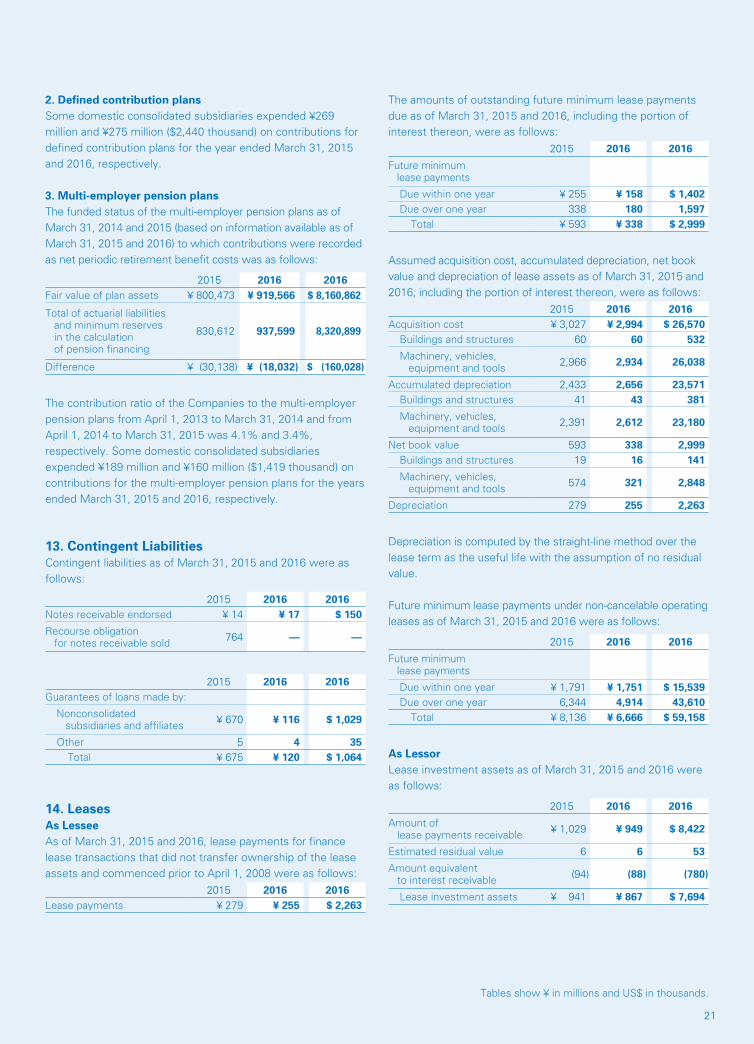
The amounts of outstanding future minimum lease payments due as of March 31, 2015 and 2016, including the portion of interest thereon, were as follows:
2015 2016 2016
Future minimum lease payments
Due within one year ¥ 255 ¥ 158 $ 1,402Due over one year 338 180 1,597
Total ¥ 593 ¥ 338 $ 2,999
Assumed acquisition cost, accumulated depreciation, net book value and depreciation of lease assets as of March 31, 2015 and 2016, including the portion of interest thereon, were as follows:
2015 2016 2016Acquisition cost ¥ 3,027 ¥ 2,994 $ 26,570
Buildings and structures 60 60 532
Machinery, vehicles, equipment and tools 2,966 2,934 26,038
Accumulated depreciation 2,433 2,656 23,571Buildings and structures 41 43 381
Machinery, vehicles, equipment and tools 2,391 2,612 23,180
Net book value 593 338 2,999Buildings and structures 19 16 141
Machinery, vehicles, equipment and tools 574 321 2,848
Depreciation 279 255 2,263
Depreciation is computed by the straight-line method over the lease term as the useful life with the assumption of no residual value.
Future minimum lease payments under non-cancelable operating leases as of March 31, 2015 and 2016 were as follows:
2015 2016 2016
Future minimum lease payments
Due within one year ¥ 1,791 ¥ 1,751 $ 15,539Due over one year 6,344 4,914 43,610
Total ¥ 8,136 ¥ 6,666 $ 59,158
As LessorLease investment assets as of March 31, 2015 and 2016 were as follows:
2015 2016 2016
Amount of lease payments receivable ¥ 1,029 ¥ 949 $ 8,422
Estimated residual value 6 6 53
Amount equivalent to interest receivable (94) (88) (780)
Lease investment assets ¥ 941 ¥ 867 $ 7,694
2. Defined contribution plansSome domestic consolidated subsidiaries expended ¥269 million and ¥275 million ($2,440 thousand) on contributions for defined contribution plans for the year ended March 31, 2015 and 2016, respectively.
3. Multi-employer pension plansThe funded status of the multi-employer pension plans as of March 31, 2014 and 2015 (based on information available as of March 31, 2015 and 2016) to which contributions were recorded as net periodic retirement benefit costs was as follows:
2015 2016 2016Fair value of plan assets ¥ 800,473 ¥ 919,566 $ 8,160,862
Total of actuarial liabilities and minimum reserves in the calculation of pension financing
830,612 937,599 8,320,899
Difference ¥ (30,138) ¥ (18,032) $ (160,028)
The contribution ratio of the Companies to the multi-employer pension plans from April 1, 2013 to March 31, 2014 and from April 1, 2014 to March 31, 2015 was 4.1% and 3.4%, respectively. Some domestic consolidated subsidiaries expended ¥189 million and ¥160 million ($1,419 thousand) on contributions for the multi-employer pension plans for the years ended March 31, 2015 and 2016, respectively.
13. Contingent LiabilitiesContingent liabilities as of March 31, 2015 and 2016 were as follows:
2015 2016 2016Notes receivable endorsed ¥ 14 ¥ 17 $ 150
Recourse obligation for notes receivable sold 764 — —
2015 2016 2016Guarantees of loans made by:
Nonconsolidated subsidiaries and affiliates ¥ 670 ¥ 116 $ 1,029
Other 5 4 35Total ¥ 675 ¥ 120 $ 1,064
14. LeasesAs LesseeAs of March 31, 2015 and 2016, lease payments for finance lease transactions that did not transfer ownership of the lease assets and commenced prior to April 1, 2008 were as follows:
2015 2016 2016Lease payments ¥ 279 ¥ 255 $ 2,263
Tables show ¥ in millions and US$ in thousands.
22
Tables show ¥ in millions and US$ in thousands.
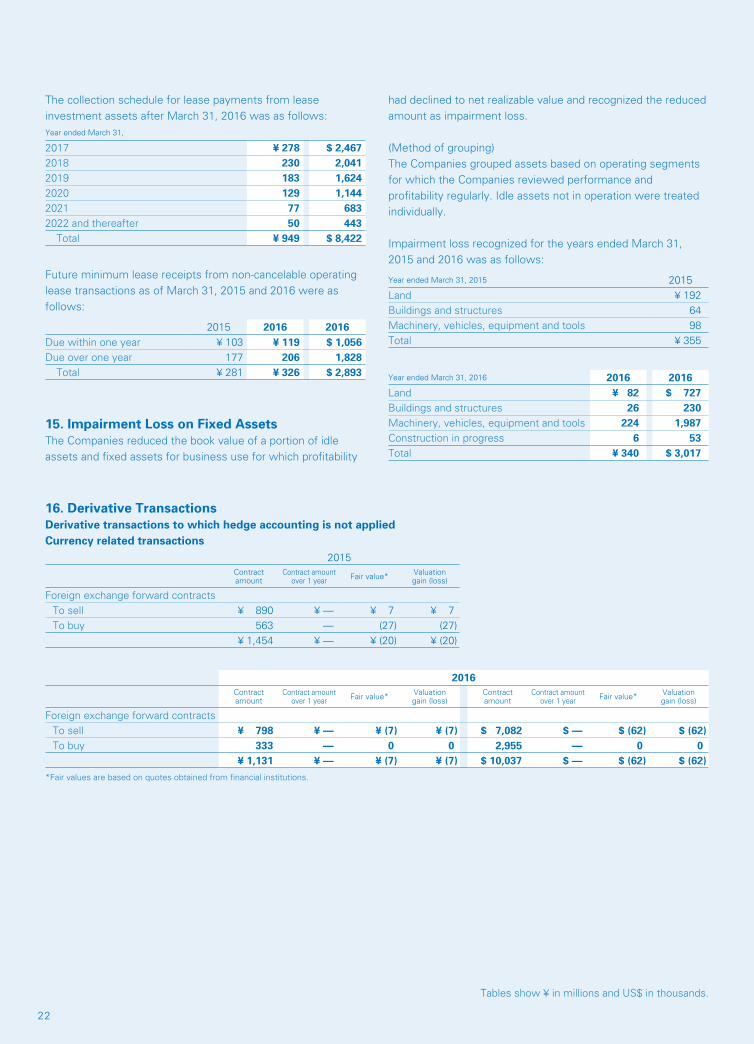
The collection schedule for lease payments from lease investment assets after March 31, 2016 was as follows:Year ended March 31,
2017 ¥ 278 $ 2,4672018 230 2,0412019 183 1,6242020 129 1,1442021 77 6832022 and thereafter 50 443
Total ¥ 949 $ 8,422
Future minimum lease receipts from non-cancelable operating lease transactions as of March 31, 2015 and 2016 were as follows:
2015 2016 2016Due within one year ¥ 103 ¥ 119 $ 1,056Due over one year 177 206 1,828
Total ¥ 281 ¥ 326 $ 2,893
15. Impairment Loss on Fixed AssetsThe Companies reduced the book value of a portion of idle assets and fixed assets for business use for which profitability
had declined to net realizable value and recognized the reduced amount as impairment loss.
(Method of grouping)The Companies grouped assets based on operating segments for which the Companies reviewed performance and profitability regularly. Idle assets not in operation were treated individually.
Impairment loss recognized for the years ended March 31, 2015 and 2016 was as follows:
Year ended March 31, 2015 2015Land ¥ 192Buildings and structures 64 Machinery, vehicles, equipment and tools 98 Total ¥ 355
Year ended March 31, 2016 2016 2016Land ¥ 82 $ 727Buildings and structures 26 230Machinery, vehicles, equipment and tools 224 1,987Construction in progress 6 53Total ¥ 340 $ 3,017
16. Derivative TransactionsDerivative transactions to which hedge accounting is not appliedCurrency related transactions
2015Contract amount
Contract amount over 1 year Fair value* Valuation
gain (loss)
Foreign exchange forward contractsTo sell ¥ 890 ¥ — ¥ 7 ¥ 7To buy 563 — (27) (27)
¥ 1,454 ¥ — ¥ (20) ¥ (20)
2016Contract amount
Contract amount over 1 year Fair value* Valuation
gain (loss)Contract amount
Contract amount over 1 year Fair value* Valuation
gain (loss)
Foreign exchange forward contractsTo sell ¥ 798 ¥ — ¥ (7) ¥ (7) $ 7,082 $ — $ (62) $ (62)To buy 333 — 0 0 2,955 — 0 0
¥ 1,131 ¥ — ¥ (7) ¥ (7) $ 10,037 $ — $ (62) $ (62)*Fair values are based on quotes obtained from financial institutions.

2322
Tables show ¥ in millions and US$ in thousands.
Derivative transactions to which hedge accounting is applied(1) Currency related transactions
2015Principal
items hedgedContract amount
Contract amount over 1 year Fair value*1
Principle method / Allocation methodForeign exchange forward contracts
Foreignexchangeforward
transactionsForeign exchange forward contracts
To sellU.S. dollars ¥ 1,622 ¥ — ¥ (20)Other currencies 6 — 0
To buyU.S. dollars 4,976 29 221Other currencies 396 — (20)
Allocation method Foreign exchange forward contracts
To sell
U.S. dollars*2 Accounts receivable 2,741 — —
Other currencies*2 Accounts receivable 675 — —
To buy
U.S. dollars*2 Accounts payable 3,667 — —
Other currencies*2 Accounts payable 23 — —
¥ 14,110 ¥ 29 ¥ 180
2016Principal
items hedgedContract amount
Contract amount over 1 year Fair value*1 Principal
items hedgedContract amount
Contract amount over 1 year Fair value*1
Principle method / Allocation methodForeign exchange forward contracts
Foreignexchangeforward
transactions
Foreignexchangeforward
transactionsForeign exchange forward contracts
To sellU.S. dollars ¥ 1,521 ¥ 12 ¥ 30 $ 13,498 $ 106 $ 266 Other currencies 35 — 0 310 — 0
To buyU.S. dollars 8,514 53 (297) 75,559 470 (2,635)Other currencies 1,044 135 (50) 9,265 1,198 (443)
Allocation method Foreign exchange forward contracts
To sell
U.S. dollars*2 Accounts receivable 2,017 — — Accounts
receivable 17,900 — —
Other currencies*2 Accounts receivable 1,377 — — Accounts
receivable 12,220 — —
To buy
U.S. dollars*2 Accounts payable 3,127 — — Accounts
payable 27,751 — —
Other currencies*2 Accounts payable 64 — — Accounts
payable 567 — —
¥17,702 ¥ 201 ¥ (316) $ 157,099 $ 1,783 $ (2,804)*1 Fair values are based on quotes obtained from financial institutions.*2 The hedged foreign currency receivables and payables were recorded using the Japanese yen amounts at the contracted forward rate, and no gains or losses on the
foreign exchange forward contracts were recorded. The fair values of foreign exchange forward contracts were included in accounts receivable and accounts payable.
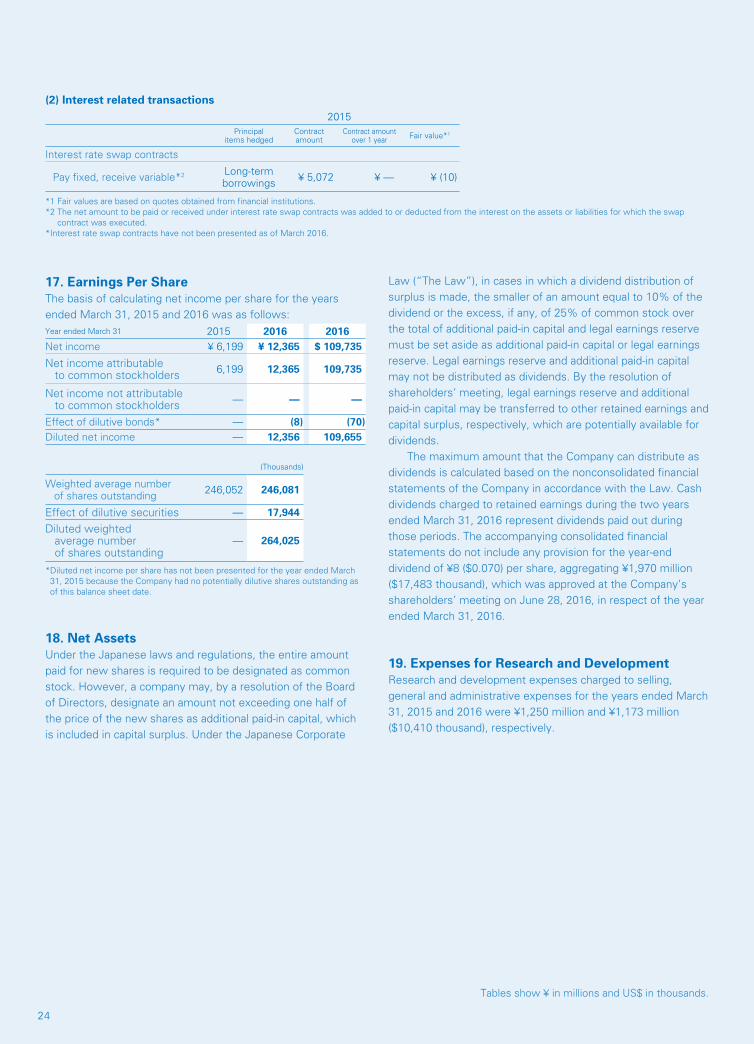
24
Tables show ¥ in millions and US$ in thousands.
(2) Interest related transactions2015
Principal items hedged
Contract amount
Contract amount over 1 year Fair value*1
Interest rate swap contracts
Pay fixed, receive variable*2 Long-termborrowings ¥ 5,072 ¥ — ¥ (10)
*1 Fair values are based on quotes obtained from financial institutions.*2 The net amount to be paid or received under interest rate swap contracts was added to or deducted from the interest on the assets or liabilities for which the swap
contract was executed.*Interest rate swap contracts have not been presented as of March 2016.
17. Earnings Per ShareThe basis of calculating net income per share for the years ended March 31, 2015 and 2016 was as follows:Year ended March 31 2015 2016 2016Net income ¥ 6,199 ¥ 12,365 $ 109,735
Net income attributable to common stockholders 6,199 12,365 109,735
Net income not attributable to common stockholders — — —
Effect of dilutive bonds* — (8) (70)Diluted net income — 12,356 109,655
(Thousands)
Weighted average number of shares outstanding 246,052 246,081
Effect of dilutive securities — 17,944
Diluted weighted average number of shares outstanding
— 264,025
* Diluted net income per share has not been presented for the year ended March 31, 2015 because the Company had no potentially dilutive shares outstanding as of this balance sheet date.
18. Net AssetsUnder the Japanese laws and regulations, the entire amount paid for new shares is required to be designated as common stock. However, a company may, by a resolution of the Board of Directors, designate an amount not exceeding one half of the price of the new shares as additional paid-in capital, which is included in capital surplus. Under the Japanese Corporate
Law (“The Law”), in cases in which a dividend distribution of surplus is made, the smaller of an amount equal to 10% of the dividend or the excess, if any, of 25% of common stock over the total of additional paid-in capital and legal earnings reserve must be set aside as additional paid-in capital or legal earnings reserve. Legal earnings reserve and additional paid-in capital may not be distributed as dividends. By the resolution of shareholders’ meeting, legal earnings reserve and additional paid-in capital may be transferred to other retained earnings and capital surplus, respectively, which are potentially available for dividends. The maximum amount that the Company can distribute as dividends is calculated based on the nonconsolidated financial statements of the Company in accordance with the Law. Cash dividends charged to retained earnings during the two years ended March 31, 2016 represent dividends paid out during those periods. The accompanying consolidated financial statements do not include any provision for the year-end dividend of ¥8 ($0.070) per share, aggregating ¥1,970 million ($17,483 thousand), which was approved at the Company’s shareholders’ meeting on June 28, 2016, in respect of the year ended March 31, 2016.
19. Expenses for Research and DevelopmentResearch and development expenses charged to selling, general and administrative expenses for the years ended March 31, 2015 and 2016 were ¥1,250 million and ¥1,173 million ($10,410 thousand), respectively.
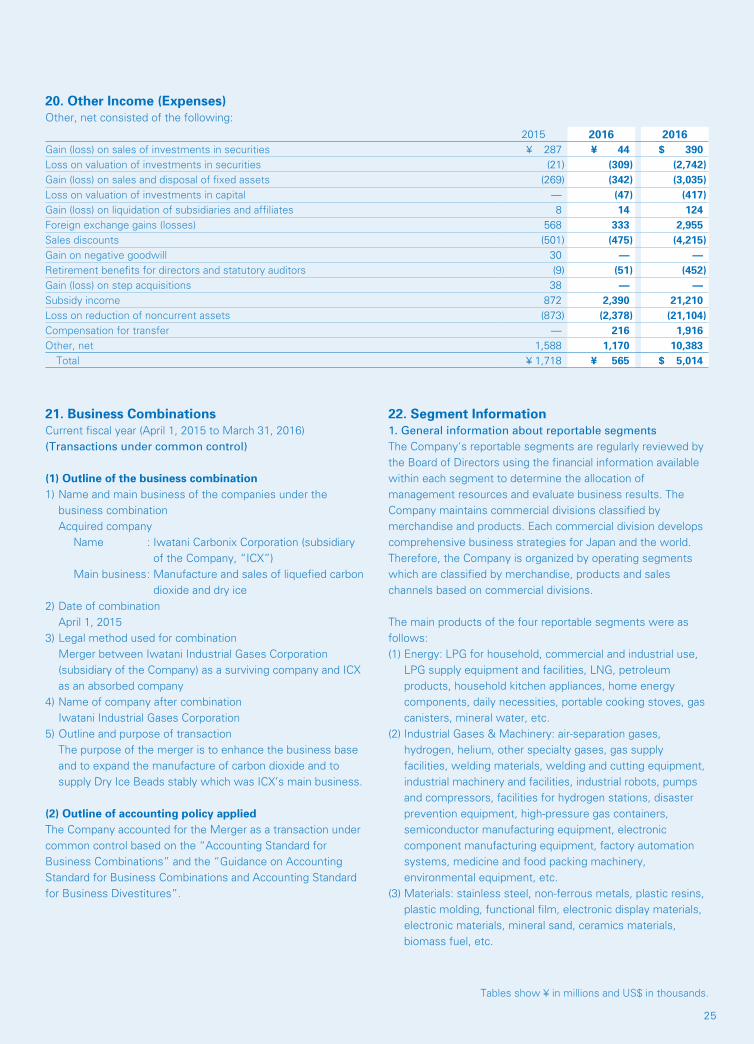
2524
Tables show ¥ in millions and US$ in thousands.
20. Other Income (Expenses)Other, net consisted of the following:
2015 2016 2016Gain (loss) on sales of investments in securities ¥ 287 ¥ 44 $ 390Loss on valuation of investments in securities (21) (309) (2,742)Gain (loss) on sales and disposal of fixed assets (269) (342) (3,035)Loss on valuation of investments in capital — (47) (417)Gain (loss) on liquidation of subsidiaries and affiliates 8 14 124Foreign exchange gains (losses) 568 333 2,955Sales discounts (501) (475) (4,215)Gain on negative goodwill 30 — —Retirement benefits for directors and statutory auditors (9) (51) (452)Gain (loss) on step acquisitions 38 — —Subsidy income 872 2,390 21,210Loss on reduction of noncurrent assets (873) (2,378) (21,104)Compensation for transfer — 216 1,916Other, net 1,588 1,170 10,383
Total ¥ 1,718 ¥ 565 $ 5,014
21. Business CombinationsCurrent fiscal year (April 1, 2015 to March 31, 2016)(Transactions under common control)
(1) Outline of the business combination1) Name and main business of the companies under the
business combination Acquired company Name : Iwatani Carbonix Corporation (subsidiary
of the Company, “ICX”) Main business : Manufacture and sales of liquefied carbon
dioxide and dry ice2) Date of combination April 1, 20153) Legal method used for combination Merger between Iwatani Industrial Gases Corporation
(subsidiary of the Company) as a surviving company and ICX as an absorbed company
4) Name of company after combination Iwatani Industrial Gases Corporation5) Outline and purpose of transaction The purpose of the merger is to enhance the business base
and to expand the manufacture of carbon dioxide and to supply Dry Ice Beads stably which was ICX’s main business.
(2) Outline of accounting policy appliedThe Company accounted for the Merger as a transaction under common control based on the “Accounting Standard for Business Combinations” and the “Guidance on Accounting Standard for Business Combinations and Accounting Standard for Business Divestitures”.
22. Segment Information1. General information about reportable segmentsThe Company’s reportable segments are regularly reviewed by the Board of Directors using the financial information available within each segment to determine the allocation of management resources and evaluate business results. The Company maintains commercial divisions classified by merchandise and products. Each commercial division develops comprehensive business strategies for Japan and the world. Therefore, the Company is organized by operating segments which are classified by merchandise, products and sales channels based on commercial divisions.
The main products of the four reportable segments were as follows:(1) Energy: LPG for household, commercial and industrial use,
LPG supply equipment and facilities, LNG, petroleum products, household kitchen appliances, home energy components, daily necessities, portable cooking stoves, gas canisters, mineral water, etc.
(2) Industrial Gases & Machinery: air-separation gases, hydrogen, helium, other specialty gases, gas supply facilities, welding materials, welding and cutting equipment, industrial machinery and facilities, industrial robots, pumps and compressors, facilities for hydrogen stations, disaster prevention equipment, high-pressure gas containers, semiconductor manufacturing equipment, electronic component manufacturing equipment, factory automation systems, medicine and food packing machinery, environmental equipment, etc.
(3) Materials: stainless steel, non-ferrous metals, plastic resins, plastic molding, functional film, electronic display materials, electronic materials, mineral sand, ceramics materials, biomass fuel, etc.
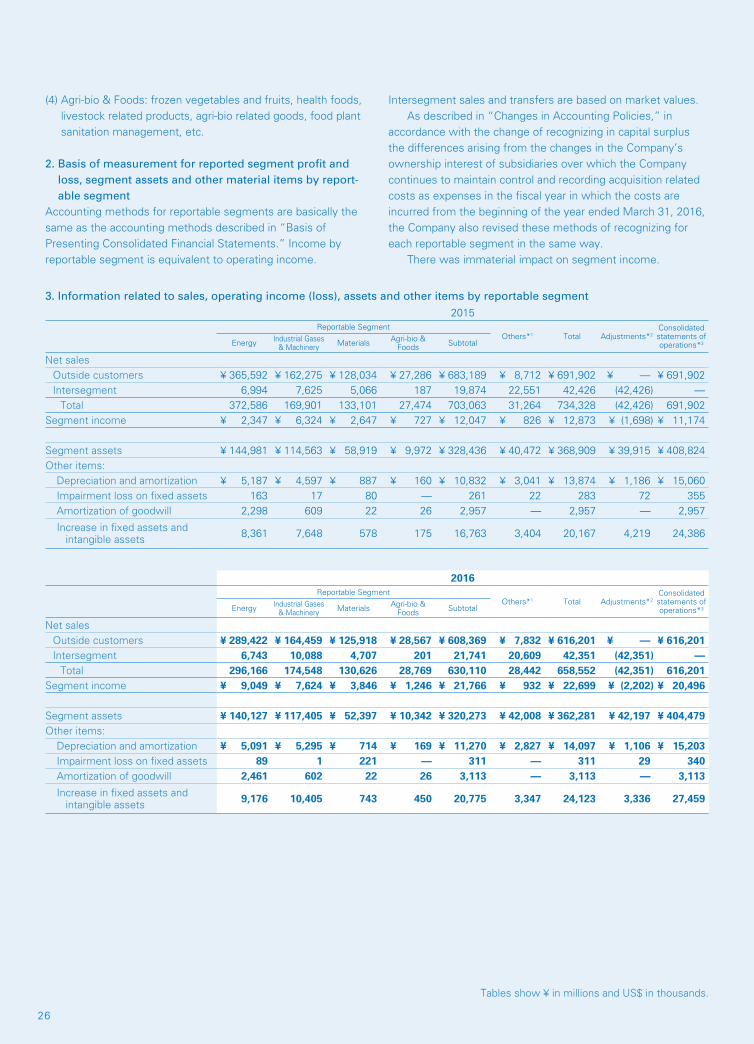
26
Tables show ¥ in millions and US$ in thousands.
(4) Agri-bio & Foods: frozen vegetables and fruits, health foods, livestock related products, agri-bio related goods, food plant sanitation management, etc.
2. Basis of measurement for reported segment profit and loss, segment assets and other material items by report-able segment
Accounting methods for reportable segments are basically the same as the accounting methods described in “Basis of Presenting Consolidated Financial Statements.” Income by reportable segment is equivalent to operating income.
Intersegment sales and transfers are based on market values. As described in “Changes in Accounting Policies,” in accordance with the change of recognizing in capital surplus the differences arising from the changes in the Company’s ownership interest of subsidiaries over which the Company continues to maintain control and recording acquisition related costs as expenses in the fiscal year in which the costs are incurred from the beginning of the year ended March 31, 2016, the Company also revised these methods of recognizing for each reportable segment in the same way. There was immaterial impact on segment income.
3. Information related to sales, operating income (loss), assets and other items by reportable segment2015
Reportable SegmentOthers*1 Total Adjustments*2
Consolidated statements of operations*3Energy Industrial Gases
& Machinery Materials Agri-bio &Foods Subtotal
Net salesOutside customers ¥ 365,592 ¥ 162,275 ¥ 128,034 ¥ 27,286 ¥ 683,189 ¥ 8,712 ¥ 691,902 ¥ — ¥ 691,902Intersegment 6,994 7,625 5,066 187 19,874 22,551 42,426 (42,426) —
Total 372,586 169,901 133,101 27,474 703,063 31,264 734,328 (42,426) 691,902Segment income ¥ 2,347 ¥ 6,324 ¥ 2,647 ¥ 727 ¥ 12,047 ¥ 826 ¥ 12,873 ¥ (1,698) ¥ 11,174
Segment assets ¥ 144,981 ¥ 114,563 ¥ 58,919 ¥ 9,972 ¥ 328,436 ¥ 40,472 ¥ 368,909 ¥ 39,915 ¥ 408,824Other items:
Depreciation and amortization ¥ 5,187 ¥ 4,597 ¥ 887 ¥ 160 ¥ 10,832 ¥ 3,041 ¥ 13,874 ¥ 1,186 ¥ 15,060Impairment loss on fixed assets 163 17 80 — 261 22 283 72 355Amortization of goodwill 2,298 609 22 26 2,957 — 2,957 — 2,957
Increase in fixed assets and intangible assets 8,361 7,648 578 175 16,763 3,404 20,167 4,219 24,386
2016Reportable Segment
Others*1 Total Adjustments*2Consolidated statements of operations*3Energy Industrial Gases
& Machinery Materials Agri-bio &Foods Subtotal
Net salesOutside customers ¥ 289,422 ¥ 164,459 ¥ 125,918 ¥ 28,567 ¥ 608,369 ¥ 7,832 ¥ 616,201 ¥ — ¥ 616,201Intersegment 6,743 10,088 4,707 201 21,741 20,609 42,351 (42,351) —
Total 296,166 174,548 130,626 28,769 630,110 28,442 658,552 (42,351) 616,201 Segment income ¥ 9,049 ¥ 7,624 ¥ 3,846 ¥ 1,246 ¥ 21,766 ¥ 932 ¥ 22,699 ¥ (2,202) ¥ 20,496
Segment assets ¥ 140,127 ¥ 117,405 ¥ 52,397 ¥ 10,342 ¥ 320,273 ¥ 42,008 ¥ 362,281 ¥ 42,197 ¥ 404,479 Other items:
Depreciation and amortization ¥ 5,091 ¥ 5,295 ¥ 714 ¥ 169 ¥ 11,270 ¥ 2,827 ¥ 14,097 ¥ 1,106 ¥ 15,203Impairment loss on fixed assets 89 1 221 — 311 — 311 29 340Amortization of goodwill 2,461 602 22 26 3,113 — 3,113 — 3,113
Increase in fixed assets and intangible assets 9,176 10,405 743 450 20,775 3,347 24,123 3,336 27,459
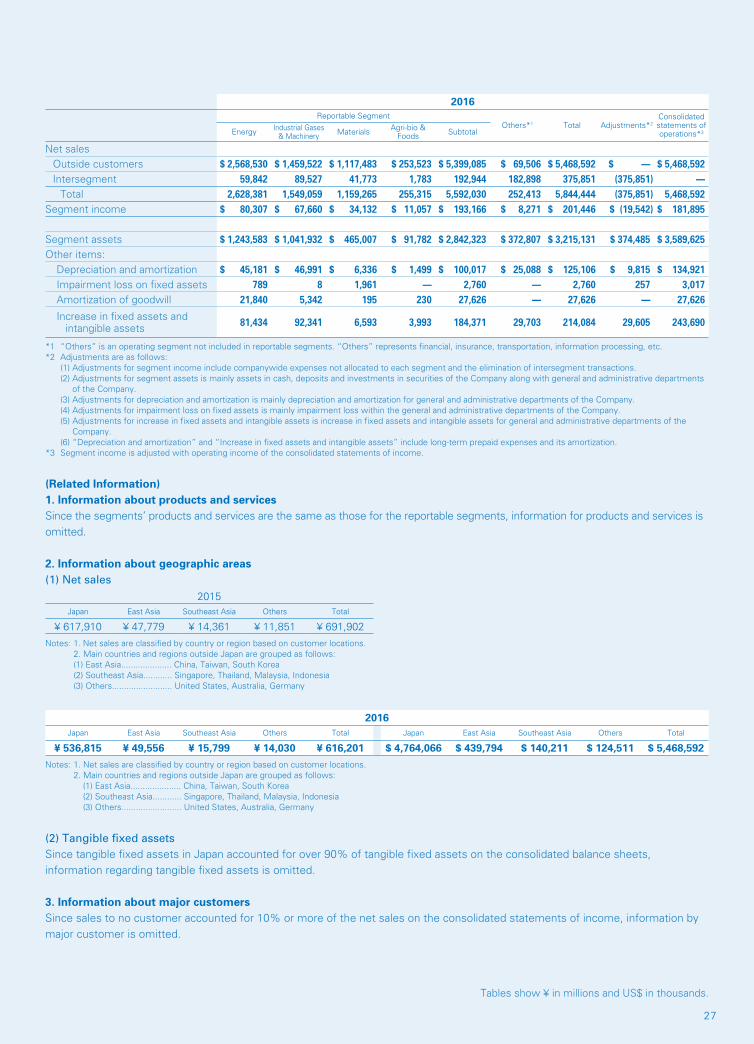
2726
Tables show ¥ in millions and US$ in thousands.
2016Reportable Segment
Others*1 Total Adjustments*2Consolidated statements of operations*3Energy Industrial Gases
& Machinery Materials Agri-bio &Foods Subtotal
Net salesOutside customers $ 2,568,530 $ 1,459,522 $ 1,117,483 $ 253,523 $ 5,399,085 $ 69,506 $ 5,468,592 $ — $ 5,468,592 Intersegment 59,842 89,527 41,773 1,783 192,944 182,898 375,851 (375,851) —
Total 2,628,381 1,549,059 1,159,265 255,315 5,592,030 252,413 5,844,444 (375,851) 5,468,592Segment income $ 80,307 $ 67,660 $ 34,132 $ 11,057 $ 193,166 $ 8,271 $ 201,446 $ (19,542) $ 181,895
Segment assets $ 1,243,583 $ 1,041,932 $ 465,007 $ 91,782 $ 2,842,323 $ 372,807 $ 3,215,131 $ 374,485 $ 3,589,625 Other items:
Depreciation and amortization $ 45,181 $ 46,991 $ 6,336 $ 1,499 $ 100,017 $ 25,088 $ 125,106 $ 9,815 $ 134,921 Impairment loss on fixed assets 789 8 1,961 — 2,760 — 2,760 257 3,017Amortization of goodwill 21,840 5,342 195 230 27,626 — 27,626 — 27,626
Increase in fixed assets and intangible assets 81,434 92,341 6,593 3,993 184,371 29,703 214,084 29,605 243,690
*1 “Others” is an operating segment not included in reportable segments. “Others” represents financial, insurance, transportation, information processing, etc.*2 Adjustments are as follows: (1) Adjustments for segment income include companywide expenses not allocated to each segment and the elimination of intersegment transactions. (2) Adjustments for segment assets is mainly assets in cash, deposits and investments in securities of the Company along with general and administrative departments
of the Company. (3) Adjustments for depreciation and amortization is mainly depreciation and amortization for general and administrative departments of the Company. (4) Adjustments for impairment loss on fixed assets is mainly impairment loss within the general and administrative departments of the Company. (5) Adjustments for increase in fixed assets and intangible assets is increase in fixed assets and intangible assets for general and administrative departments of the
Company. (6) “Depreciation and amortization” and “Increase in fixed assets and intangible assets” include long-term prepaid expenses and its amortization.*3 Segment income is adjusted with operating income of the consolidated statements of income.
(Related Information)1. Information about products and servicesSince the segments’ products and services are the same as those for the reportable segments, information for products and services is omitted.
2. Information about geographic areas(1) Net sales
2015Japan East Asia Southeast Asia Others Total
¥ 617,910 ¥ 47,779 ¥ 14,361 ¥ 11,851 ¥ 691,902 Notes: 1. Net sales are classified by country or region based on customer locations. 2. Main countries and regions outside Japan are grouped as follows: (1) East Asia..................... China, Taiwan, South Korea (2) Southeast Asia............ Singapore, Thailand, Malaysia, Indonesia (3) Others......................... United States, Australia, Germany
2016Japan East Asia Southeast Asia Others Total Japan East Asia Southeast Asia Others Total
¥ 536,815 ¥ 49,556 ¥ 15,799 ¥ 14,030 ¥ 616,201 $ 4,764,066 $ 439,794 $ 140,211 $ 124,511 $ 5,468,592Notes: 1. Net sales are classified by country or region based on customer locations. 2. Main countries and regions outside Japan are grouped as follows: (1) East Asia..................... China, Taiwan, South Korea (2) Southeast Asia............ Singapore, Thailand, Malaysia, Indonesia (3) Others......................... United States, Australia, Germany
(2) Tangible fixed assetsSince tangible fixed assets in Japan accounted for over 90% of tangible fixed assets on the consolidated balance sheets, information regarding tangible fixed assets is omitted.
3. Information about major customersSince sales to no customer accounted for 10% or more of the net sales on the consolidated statements of income, information by major customer is omitted.
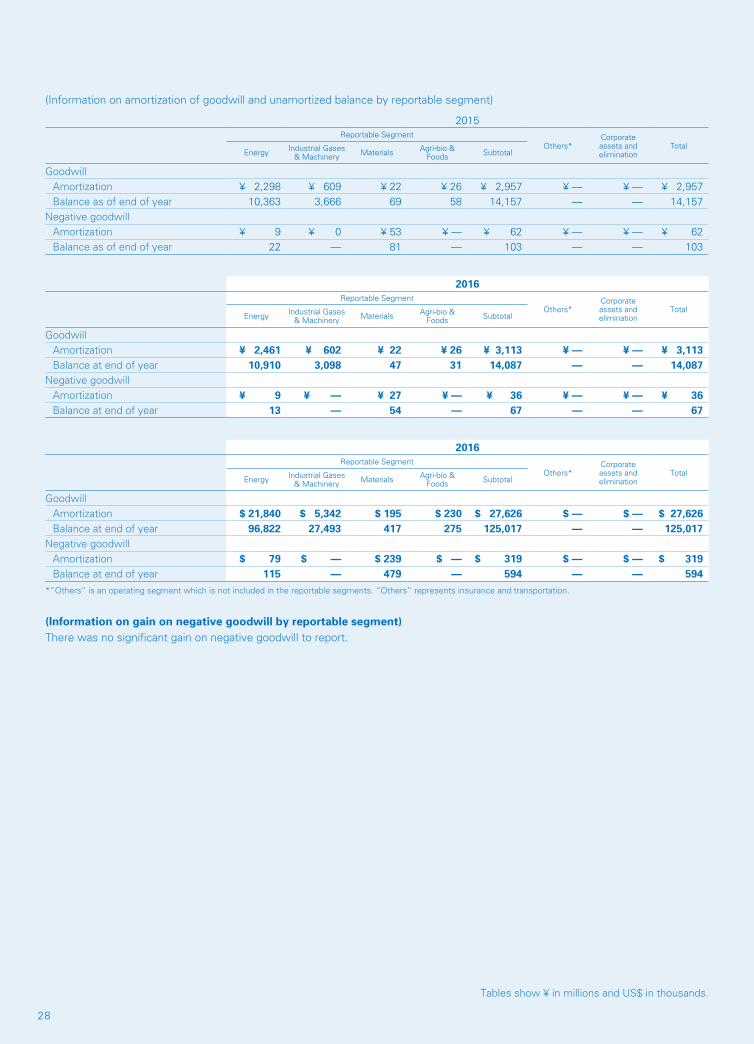
28
Tables show ¥ in millions and US$ in thousands.
(Information on amortization of goodwill and unamortized balance by reportable segment)
2015Reportable Segment
Others*Corporate assets and elimination
TotalEnergy Industrial Gases
& Machinery Materials Agri-bio &Foods Subtotal
GoodwillAmortization ¥ 2,298 ¥ 609 ¥ 22 ¥ 26 ¥ 2,957 ¥ — ¥ — ¥ 2,957Balance as of end of year 10,363 3,666 69 58 14,157 — — 14,157
Negative goodwillAmortization ¥ 9 ¥ 0 ¥ 53 ¥ — ¥ 62 ¥ — ¥ — ¥ 62Balance as of end of year 22 — 81 — 103 — — 103
2016Reportable Segment
Others*Corporate assets and elimination
TotalEnergy Industrial Gases
& Machinery Materials Agri-bio &Foods Subtotal
GoodwillAmortization ¥ 2,461 ¥ 602 ¥ 22 ¥ 26 ¥ 3,113 ¥ — ¥ — ¥ 3,113Balance at end of year 10,910 3,098 47 31 14,087 — — 14,087
Negative goodwillAmortization ¥ 9 ¥ — ¥ 27 ¥ — ¥ 36 ¥ — ¥ — ¥ 36Balance at end of year 13 — 54 — 67 — — 67
2016Reportable Segment
Others*Corporate assets and elimination
TotalEnergy Industrial Gases
& Machinery Materials Agri-bio &Foods Subtotal
GoodwillAmortization $ 21,840 $ 5,342 $ 195 $ 230 $ 27,626 $ — $ — $ 27,626Balance at end of year 96,822 27,493 417 275 125,017 — — 125,017
Negative goodwillAmortization $ 79 $ — $ 239 $ — $ 319 $ — $ — $ 319Balance at end of year 115 — 479 — 594 — — 594
*“Others” is an operating segment which is not included in the reportable segments. “Others” represents insurance and transportation.
(Information on gain on negative goodwill by reportable segment)There was no significant gain on negative goodwill to report.

2928
Independent Auditors’ Report

Printed in Japan
Osaka Head Office6-4, Hommachi 3-chome, Chuo-ku, Osaka 541-0053, JapanTel: 81-6-7637-3310 Fax: 81-6-7637-3535
Tokyo Head Office21-8, Nishi-Shimbashi 3-chome, Minato-ku, Tokyo 105-8458, JapanTel: 81-3-5405-5711 Fax: 81-3-5405-5640
Corporate Website http://www.iwatani.co.jp/eng/