financial information for - michelin.com · sou rce: us de pa rtm en t of tran sp or tat ion / fe...
TRANSCRIPT
April 29, 2010
Financial Information for the 3 Months Ended
March 31, 2010
2 FirstQuarter 2010 Financial Information – April 29, 2010
Clear rebound in tire demand off of favorable prior year comparatives, except in the European OE truck market
Increase in Michelin volumes, gaining momentum late in the quarter as market share held firm
Firstquarter mix reflected growth in OE sales
Impact of price increases expected over the coming quarters
First First Quarter 2010: Quarter 2010: 12.2% 12.2% Increase Increase in Net Sales in Net Sales

3 FirstQuarter 2010 Financial Information – April 29, 2010
Analysis of Net Sales
Global Market Trends
Performance by Reporting Segment
Outlook

4 FirstQuarter 2010 Financial Information – April 29, 2010
Analysis Analysis of Net Sales of Net Sales
5 FirstQuarter 2010 Financial Information – April 29, 2010
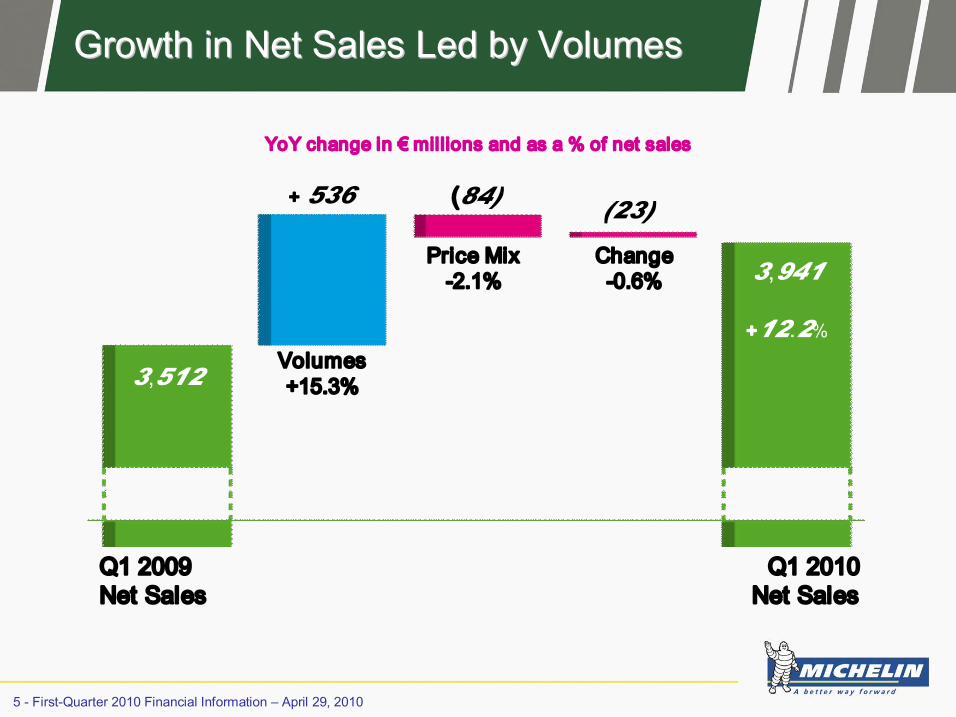
Growth Growth in Net Sales in Net Sales Led Led by Volumes by Volumes
YoY change in € millions and as a % of net sales
Q1 2009 Net Sales
Q1 2010 Net Sales
Volumes +15.3%
Price Mix 2.1%
Change 0.6%
3,512
+ 536 (84) (23)
3,941
+12.2%

6 FirstQuarter 2010 Financial Information – April 29, 2010
Higher Higher Volumes: Volumes: Growing Growing Contribution Contribution from from the OE Segment the OE Segment
YoY change as a % of net sales
Q1 09
Q2 09
Q3 09
Q4 09
Q1 10
Q1 09
Q2 09
Q3 09
Q4 09
Q1 10
Q1 09
Q2 09
Q3 09
Q4 09
Q1 10
Volumes Price Mix Currency
24.4 22.2
14.0
+1.9
+15.3 +11.0
+8.2
+4.0 +1.1
2.1
+2.2 +3.6
0.3 3.9
0.6

7 FirstQuarter 2010 Financial Information – April 29, 2010
Global Global Market Market Trends Trends
8 FirstQuarter 2010 Financial Information – April 29, 2010
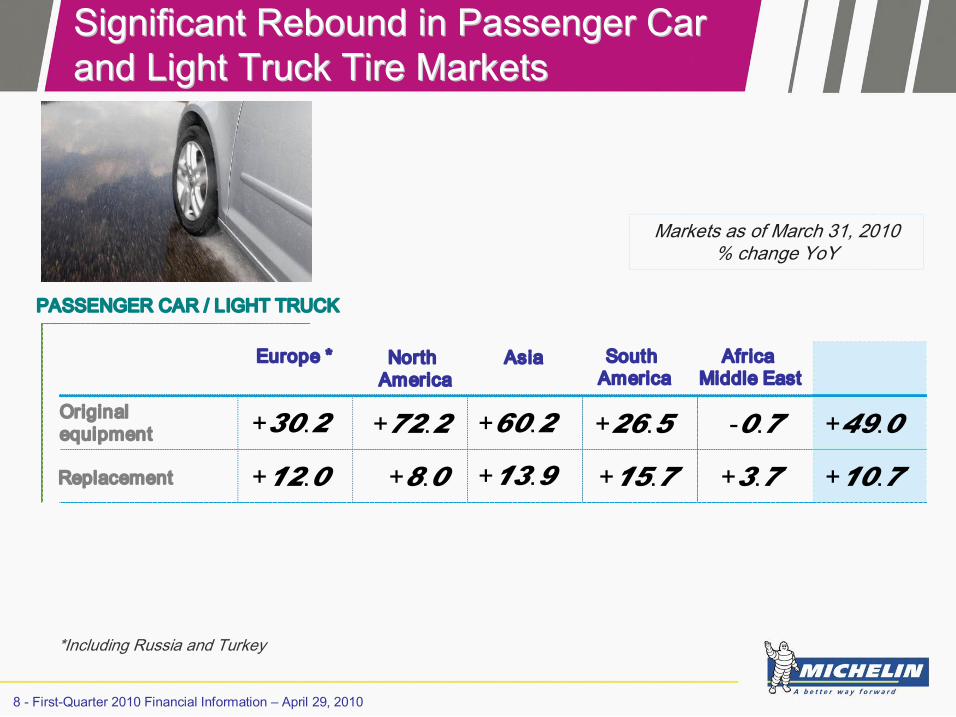
Significant Significant Rebound Rebound in in Passenger Passenger Car Car and Light Truck Tire and Light Truck Tire Markets Markets
Europe * North America
Asia South America
Africa Middle East
Total
Markets as of March 31, 2010 % change YoY
Original equipment
Replacement
PASSENGER CAR / LIGHT TRUCK
+30.2 +72.2 +60.2 +26.5 0.7 +49.0
+12.0 +8.0 +13.9 +15.7 +3.7 +10.7
*Including Russia and Turkey

9 FirstQuarter 2010 Financial Information – April 29, 2010
Sharp Sharp Recovery Recovery in the Group in the Group’ ’s s Traditional Traditional Markets Markets
EUROPE NORTH AMERICA
Original equipment (% change YoY)
Replacement (% change YoY)
39 28
18
+18 +30
11 14 6
+12 +12
12 10
+4 +9 +8
52 50
18
+1
+72
2009 2010 Q1 Q2 Q3 Q4 Q1
2009 2010 Q1 Q2 Q3 Q4 Q1

10 FirstQuarter 2010 Financial Information – April 29, 2010
2010 vs. 2007: 2010 vs. 2007: Markets Markets Generally Generally Lower Lower but but Better Better Trend Line in Europe Trend Line in Europe
Replacement (% change versus 2007)
EUROPE NORTH AMERICA
38
26 21
18 16
57 58
32 27 25
7 9
+4 +8
7 13 11
4 6 1
Original equipment (% change versus 2007)
2009 2010 Q1 Q2 Q3 Q4 Q1
2009 2010 Q1 Q2 Q3 Q4 Q1
11 FirstQuarter 2010 Financial Information – April 29, 2010
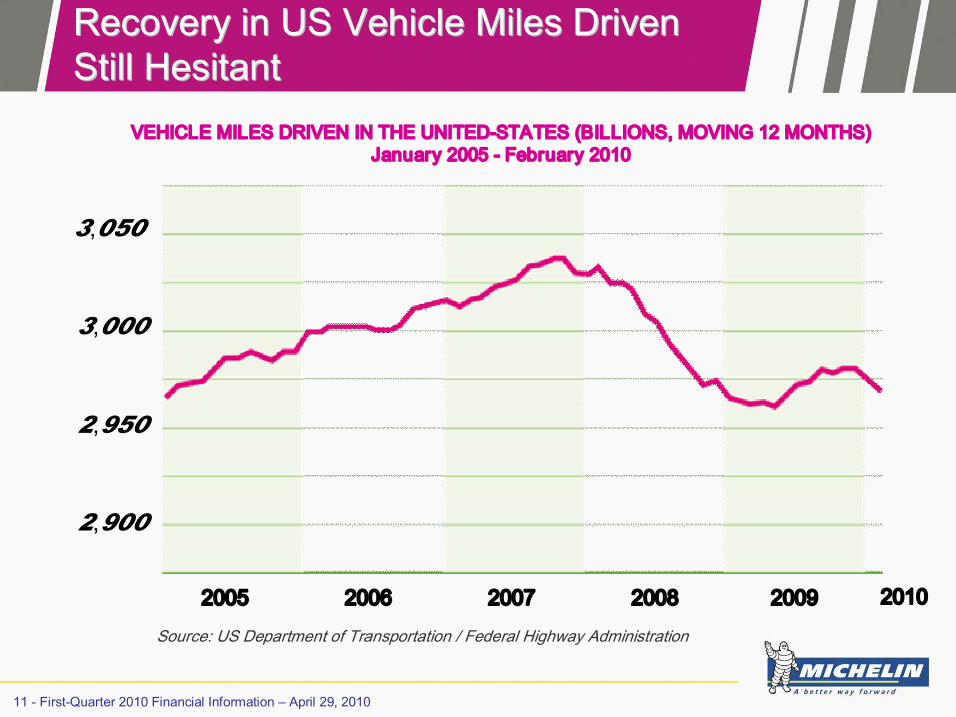
Recovery Recovery in US in US Vehicle Vehicle Miles Miles Driven Driven Still Still Hesitant Hesitant
VEHICLE MILES DRIVEN IN THE UNITEDSTATES (BILLIONS, MOVING 12 MONTHS) January 2005 February 2010
2,900
2,950
3,050
3,000
2005 2006 2007 2008 2009 Source: US Department of Transportation / Federal Highway Administration
2010
12 FirstQuarter 2010 Financial Information – April 29, 2010
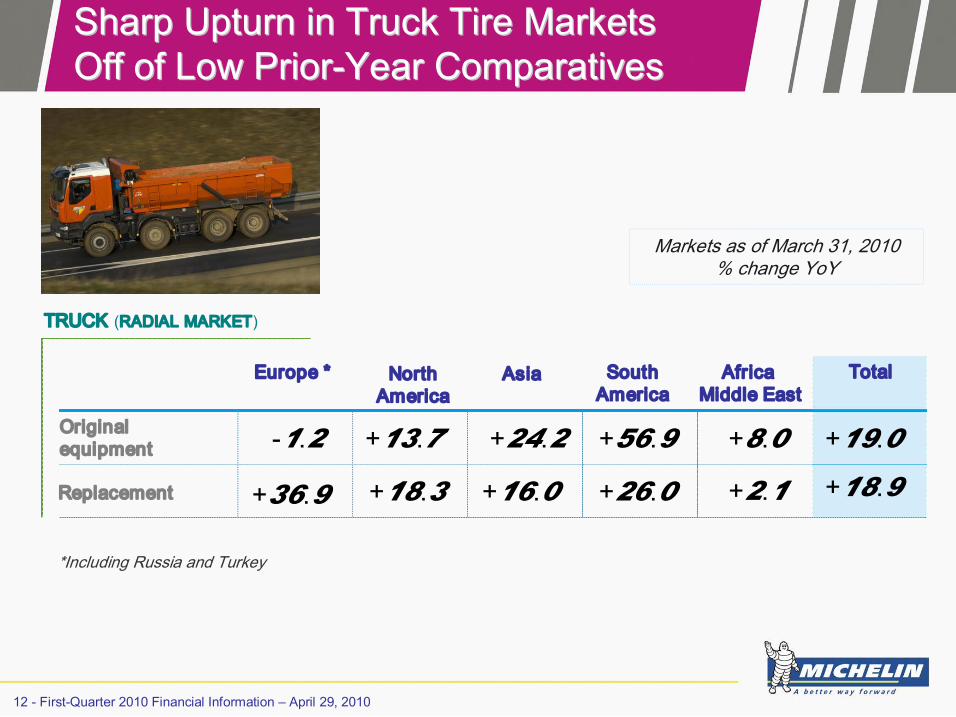
Sharp Sharp Upturn Upturn in Truck Tire in Truck Tire Markets Markets Off of Off of Low Low Prior Prior Year Year Comparatives Comparatives
Markets as of March 31, 2010 % change YoY
Original equipment
Replacement
1.2
+36.9
+13.7
+18.3
+24.2
+16.0
+56.9
+26.0
+8.0
+2.1
+19.0
+18.9
TRUCK (RADIAL MARKET)
Europe * North America
Asia South America
Africa Middle East
Total
*Including Russia and Turkey

13 FirstQuarter 2010 Financial Information – April 29, 2010
Flat Flat Demand Demand in the in the European European OE OE Market Market Dealers More Dealers More Optimistic Optimistic
62 72 65
50
1
45 50 36
12
+14
35 28 16
+2
+37
25 12 12
+3 +18
Original equipment (% change YoY)
Replacement (% change YoY)
EUROPE NORTH AMERICA 2009 2010
Q1 Q2 Q3 Q4 Q1 Q1 Q2 Q3 Q4 Q1
2009 2010

14 FirstQuarter 2010 Financial Information – April 29, 2010
2010 vs. 2007: OE Segment 2010 vs. 2007: OE Segment Still Still Down, Down, Positive Positive Signs Signs in the Replacement in the Replacement Market Market
Replacement (% change versus 2007)
EUROPE NORTH AMERICA 2009 2010
Q1 Q2 Q3 Q4 Q1 Q1 Q2 Q3 Q4 Q1
2009 2010
Original equipment (% change versus 2007)
57 69 66 65
55 59 55 43
31
54
38 28
21 24
3
25 21 16 16
9
15 FirstQuarter 2010 Financial Information – April 29, 2010
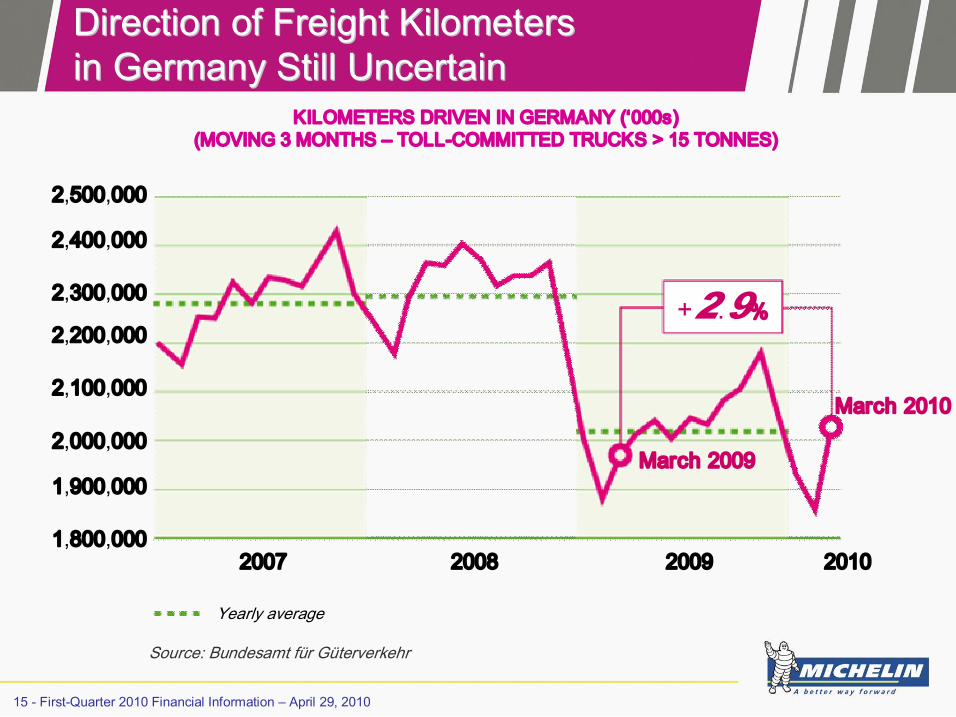
Direction of Direction of Freight Freight Kilometers Kilometers in Germany in Germany Still Still Uncertain Uncertain
Yearly average
KILOMETERS DRIVEN IN GERMANY (‘000s) (MOVING 3 MONTHS – TOLLCOMMITTED TRUCKS > 15 TONNES)
Source: Bundesamt für Güterverkehr
2007 2008 2009 2010
2,500,000
2,400,000
2,300,000
2,200,000
2,100,000
2,000,000
1,900,000
1,800,000
March 2009
March 2010
+2.9%
16 FirstQuarter 2010 Financial Information – April 29, 2010
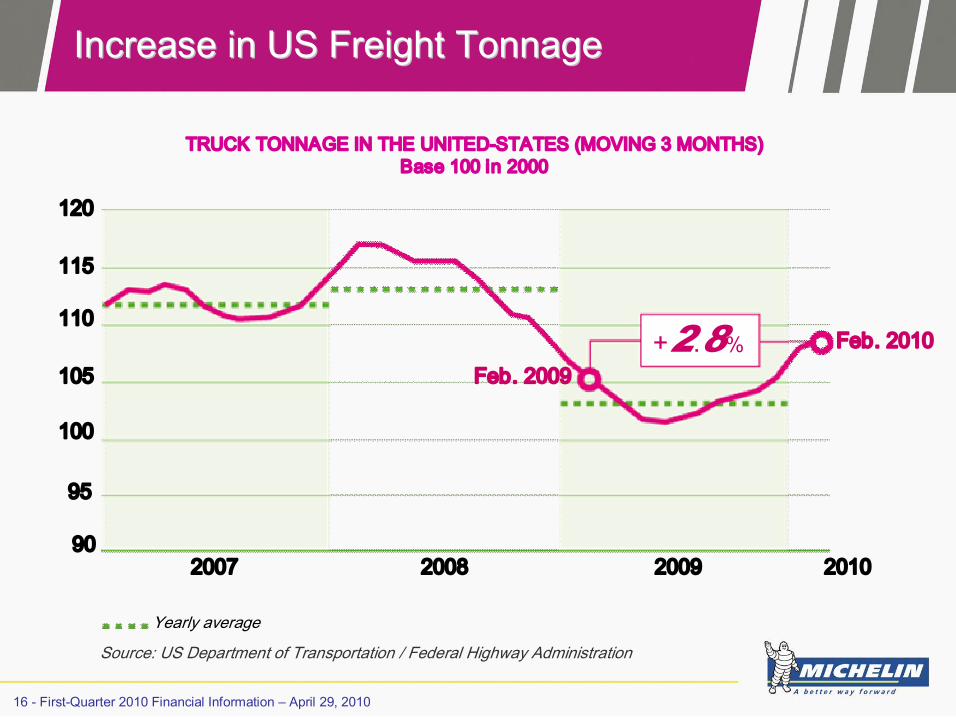
Increase Increase in US in US Freight Freight Tonnage Tonnage
TRUCK TONNAGE IN THE UNITEDSTATES (MOVING 3 MONTHS) Base 100 in 2000
+2.8%
90
95
100
105
110
115
120
Feb. 2009 Feb. 2010
2007 2008 2009 2010
Source: US Department of Transportation / Federal Highway Administration
Yearly average
17 FirstQuarter 2010 Financial Information – April 29, 2010
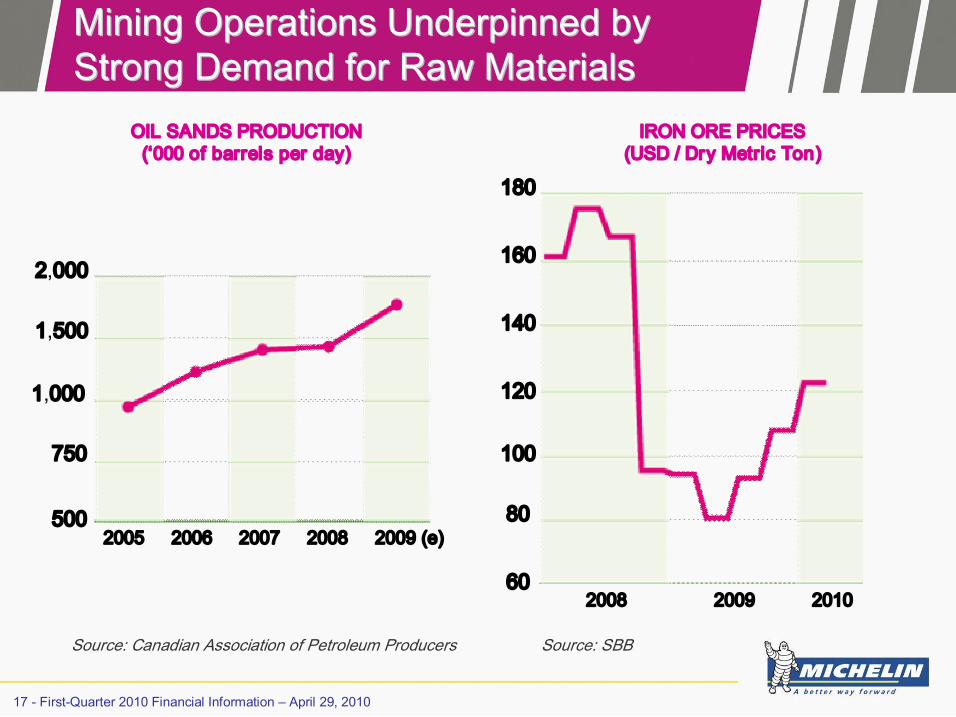
Mining Mining Operations Operations Underpinned Underpinned by by Strong Strong Demand Demand for for Raw Raw Materials Materials
OIL SANDS PRODUCTION (‘000 of barrels per day)
IRON ORE PRICES (USD / Dry Metric Ton)
Source: Canadian Association of Petroleum Producers Source: SBB
80
100
120
140
160
180
60
500
750
1,000
1,500
2,000
2005 2007 2009 (e) 2006 2008
2008 2009 2010
18 FirstQuarter 2010 Financial Information – April 29, 2010
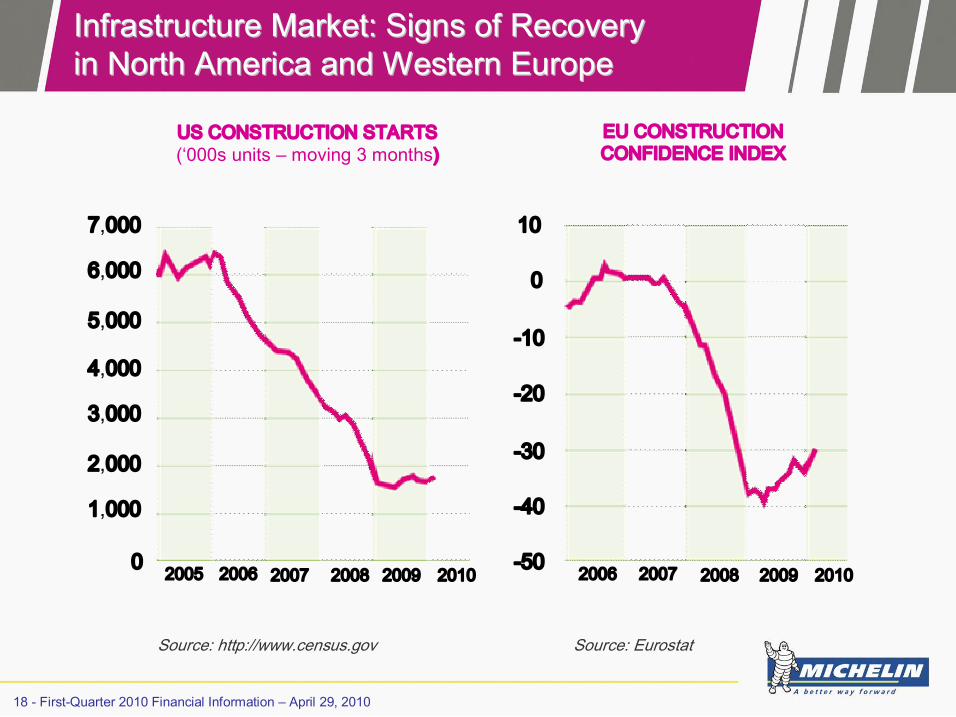
Infrastructure Infrastructure Market Market: : Signs Signs of of Recovery Recovery in in North North America America and Western Europe and Western Europe
US CONSTRUCTION STARTS (‘000s units – moving 3 months)
EU CONSTRUCTION CONFIDENCE INDEX
Source: http://www.census.gov Source: Eurostat
7,000
6,000
5,000
4,000
3,000
2,000
1,000
0 2005 2006 2007 2008 2009 2010 2006 2007 2008 2009 2010
10
0
10
20
30
40
50
19 FirstQuarter 2010 Financial Information – April 29, 2010
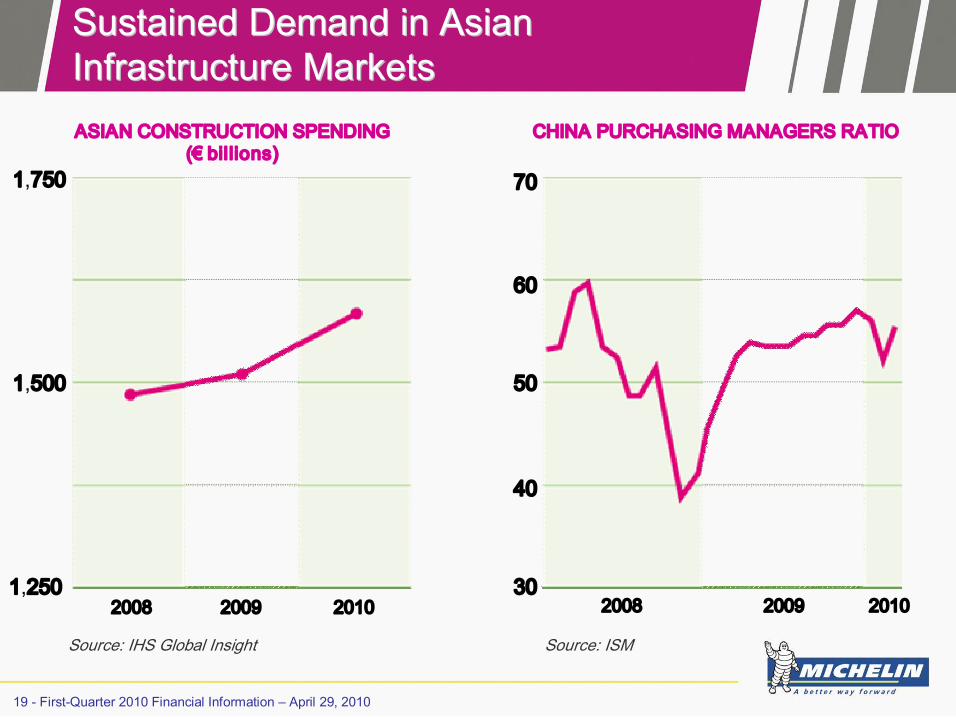
Sustained Sustained Demand Demand in in Asian Asian Infrastructure Infrastructure Markets Markets
2009
ASIAN CONSTRUCTION SPENDING (€ billions)
CHINA PURCHASING MANAGERS RATIO
Source: IHS Global Insight Source: ISM
1,750
1,250
1,500
30
50
60
70
40
2008 2009 2010 2008 2010

20 FirstQuarter 2010 Financial Information – April 29, 2010
Performance by Performance by Reporting Reporting Segment Segment

21 FirstQuarter 2010 Financial Information – April 29, 2010
Passenger Passenger Car and Light Truck Tires: Car and Light Truck Tires: Strong Strong Growth Growth in Volumes in Volumes
MICHELIN brand holds firm
Strong growth in OE sales
Further improvement in the segment mix
High capacity utilization in most regions
1,946 2,003 2,093
2,238 2,213
Q1 09 Q2 09 Q3 09 Q4 09 Q1 10
+13.7%
NET SALES – € MILLIONS

22 FirstQuarter 2010 Financial Information – April 29, 2010
Truck Tires: Truck Tires: Rebound Rebound in Volumes in Volumes Off of Off of Low Low Prior Prior Year Year Comparatives Comparatives
Volume lifted by a favorable market mix
Market share gains for the MICHELIN brand, especially in Europe
Improvement in OE volumes, despite still weak signs of a recovery
Higher capacity utilization rates
Q1 09 Q2 09 Q3 09 Q4 09 Q1 10
1,006 1,065
1,206 1,219 1,211
+20.4%
NET SALES – € MILLIONS
23 FirstQuarter 2010 Financial Information – April 29, 2010
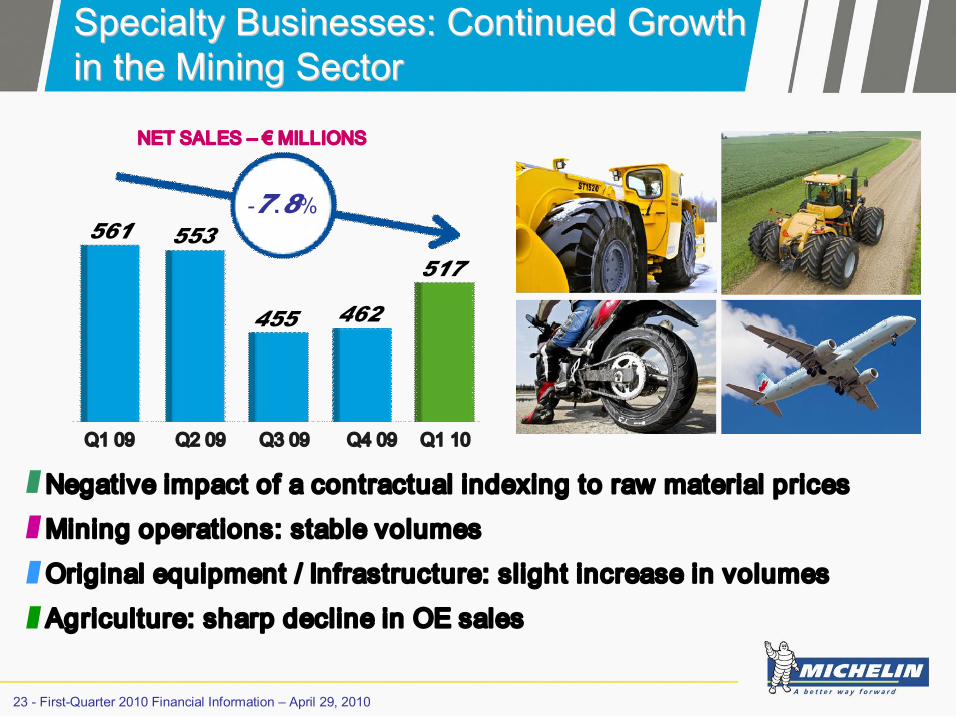
Specialty Specialty Businesses: Businesses: Continued Continued Growth Growth in the in the Mining Mining Sector Sector
Negative impact of a contractual indexing to raw material prices
Mining operations: stable volumes
Original equipment / Infrastructure: slight increase in volumes
Agriculture: sharp decline in OE sales
Q1 09 Q2 09 Q3 09 Q4 09 Q1 10
561 553
455 462
517
7.8%
NET SALES – € MILLIONS

24 FirstQuarter 2010 Financial Information – April 29, 2010
Outlook Outlook

25 FirstQuarter 2010 Financial Information – April 29, 2010
Passenger Car and Light Truck Tires § Further growth in the replacement market, as postponed orders are fulfilled
§ Possible slowdown in the European original equipment segment
Truck Tires § Demand supported by sharp dealer and fleet inventory drawdowns in 2009
§ Ongoing rebound already apparent in Europe § Miles driven on the rise and a tighter retread market in North America
Specialty Tires § Demand trending upward in mining operations and growth regions
§ Infrastructure and original equipment: replenishing inventory in expectation of an increase in enduser demand
Tire Tire Demand Demand Expected Expected to to Increase Increase

26 FirstQuarter 2010 Financial Information – April 29, 2010
Increase Increase in in Raw Raw Material Material Prices Prices, , Especially Especially Natural Natural Rubber Rubber
NATURAL RUBBER PRICES TSR20 USD/kg
BRENT PRICES (USD/Barrel)
2008 2009 2010 2008 2009 2010 20
40
60
80
100
120
140
1
1.5
2
2.5
3
3.5

27 FirstQuarter 2010 Financial Information – April 29, 2010
Raw Raw Materials Materials: a Major Impact if : a Major Impact if Current Current Prices Prices Hold Hold Firm Firm
2010 SIMULATION:
€1 = $1.36
Natural rubber: $3.42/kg
Oil: $82/barrel
H1 2009 H2 2009 H1 2010 H2 2010
P&L P&L Cost Cost: : 123 123
P&L P&L Cost Cost: : 97 97
P&L P&L Cost Cost: : 118 118
P&L P&L Cost Cost: : 142 142
Purchases Purchases: : 100 100
Purchases Purchases: : 102 102
Purchases Purchases: : 132 132
Purchases Purchases: : 143 143
90
100
110
120
130
140
150
28 FirstQuarter 2010 Financial Information – April 29, 2010
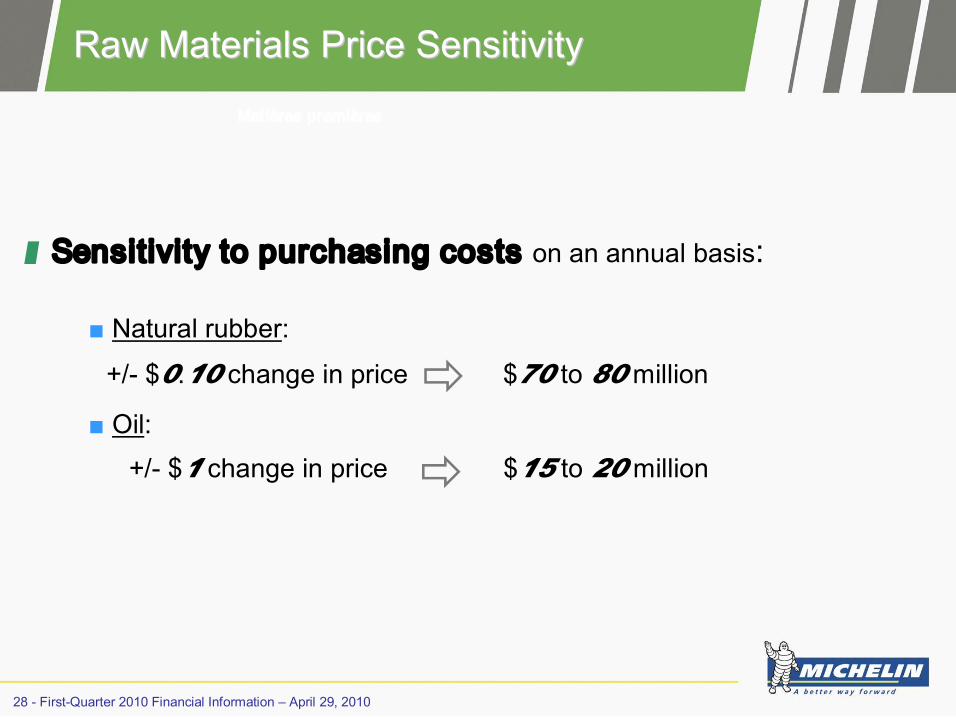
Raw Raw Materials Materials Price Price Sensitivity Sensitivity
Matières premières
Sensitivity to purchasing costs on an annual basis:
■ Natural rubber:
ð ■ Oil:
ð $15 to 20 million
$70 to 80 million +/ $0.10 change in price
+/ $1 change in price

29 FirstQuarter 2010 Financial Information – April 29, 2010
Responsive Pricing Policy Responsive Pricing Policy to to Pass Pass on on Higher Higher Raw Raw Material Material Prices Prices
North America (February 1) Truck tire replacement market: from +3% to +7% Passenger car & Light truck tires: depending on the range Earthmover tire replacement market: +4%
North America (June 1) Passenger car & Light truck tires: up to 6%
Europe April 1: Truck tire replacement market: +4% 2nd Quarter: Passenger car & Light truck replacement tires: +3% to +4%
Other regions Price increases scheduled in the second quarter
Contractual indexation clauses Prices to be revised upwards in the second half

30 FirstQuarter 2010 Financial Information – April 29, 2010
Volumes expected to increase by around 10%
Higher working capital requirement as demand recovers and raw material prices increase
Capex: €1 – 1.2 billion § Startup of spending on projects in Brazil, China and India § Ongoing tight management of other capital projects
Objective: generate positive free cash flow
Continuing Continuing to to Tightly Tightly Manage Operations Manage Operations

April 29, 2010
Financial Information for the 3 Months Ended
March 31, 2010

32 FirstQuarter 2010 Financial Information – April 29, 2010
Contacts Contacts
Investor Relations
Valérie Magloire Alban de Saint Martin
+33 (0) 1 45 66 16 15
46, avenue de Breteuil 75324 Paris Cedex 07 – France
investor[email protected]

33 FirstQuarter 2010 Financial Information – April 29, 2010
Disclaimer Disclaimer
This presentation is not an offer to purchase or a solicitation This presentation is not an offer to purchase or a solicitation to recommend to recommend the purchase of Michelin shares. To obtain more detailed informa the purchase of Michelin shares. To obtain more detailed information on tion on Michelin, Michelin, please consult the documentation published in France by please consult the documentation published in France by Autorit Autorité é des des march marché és s financiers available from the financiers available from the www.michelin.com www.michelin.com website. website.
This presentation could contain a number of provisional statemen This presentation could contain a number of provisional statements. ts. Although the Company believes that these statements are based on Although the Company believes that these statements are based on reasonable assumptions at the time of the publication of this do reasonable assumptions at the time of the publication of this document, cument, they are by nature subject to risks and contingencies liable to they are by nature subject to risks and contingencies liable to translate into translate into a difference between actual data and the forecasts made or induc a difference between actual data and the forecasts made or induced by ed by these statements. these statements.