financial innovation -...
TRANSCRIPT

Financial Innovation
What is financial innovation?
• New Products/Services
• New Processes
• New Organizational Forms
Why is financial innovation important?
• Finance is a central input for virtually all productive activity
• Better finance encourages more saving and investment
• Better finance encourages improved productivity ofinvestment decisions

Can Finance Industry Innovate More? Business Week Top 50 Most Innovative Companies, 2006
Source: Business Week
Only one of the top 50 most innovative companies is in the financialservice industry.
Apple Virgin Amazon DaimlerChrysler PepsiCo
Google Samsung Target Infosys Hewlett Packard
3M Sony Honda Ryanair Disney
Toyota DellResearch In
MotionPixar jetBlue
Microsoft IDEO Southwest SonyEricssonW.L. Gore &
Associates
General Electric BMW Porsche Whole Foods Skype Technologies
Procter &
GambleIntel Genentech Capital One FedEx
Nokia eBay Cisco Tesco Bang & Olufsen
Starbucks IKEA Nike Danone Renault
IBM Wal-Mart Motorola BP L'Oreal

Financial Innovations Reduce Volatility Selected Macroeconomic Volatility Before and After FI Period
Source: Jermann and Quadrini 2006
1.7
0.8
2.2
7.4
0.90.90.4
1.1
4.8
0.5
0
1
2
3
4
5
6
7
8
Output TFP Labor Investment Consumption
1952-1983
1984-2005
Percent

$US 370 Trillions Notional Amount Global Over-the-Counter Derivative Market
10,073369,905Total
1,70735,969Others
29420,352Credit Default Swaps
7186,394Commodity
6716,783Equity-Linked
5,549262,296Interest Rate
1,13438,111Foreign Exchange
Market Value ofContracts
US$ Billions
NotionalAmounts
US$ Billions
June 2006
Source: International Monetary Fund

Interest Rate Derivatives By Counterparty and Maturity
44 44
12
3539
27
0
10
20
30
40
50
With OtherDealers
With OtherFinancial Inst.
WithNonfinancial
Customers
Less than 1year
Between 1- 5years
More than 5years
Percent of US$ 262 Trillions Notional Amount, June 2006
By Counterparty By Maturity
Source: International Monetary Fund

Real Estate
79%
Other
21%
\
Real Estate: Largest U.S. Tangible Assets
$47.2 Trillion U.S. Tangible Assets, December 2006
Source: Federal Reserve
2006200520042003200220012000
20
15
10
5
0
-5
-10
3.5
3.0
2.5
2.0
1.5
1.0
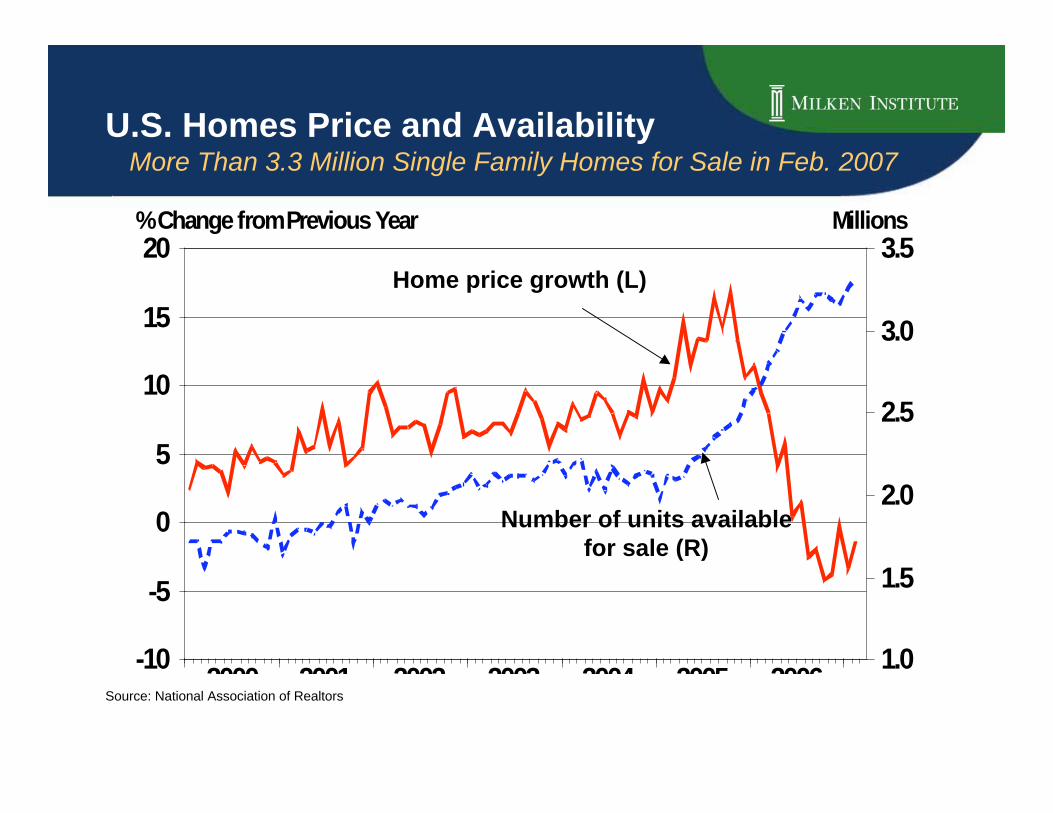
% Change from Previous Year Millions
U.S. Homes Price and AvailabilityMore Than 3.3 Million Single Family Homes for Sale in Feb. 2007
Home price growth (L)
Number of units availablefor sale (R)
Source: National Association of Realtors

Homeownership and Adjustable Mortgage
20062004200220001998199619941992
70
69
68
67
66
65
64
63
64
62
60
58
56
54
% of Total U.S. Households % of Total Mortgage
Source: Federal Housing Finance Board and U.S. Census
ConventionalAdjustable Mortgage
Share of Total Mortgage
Homeownership Rate

U.S. Homeownership by Race 68.9 % of Total U.S. Household Own a Home
Source: U.S. Census
47
71
46
54
48
72
50
60
40
45
50
55
60
65
70
75
80
Black White Hispanic Others
1999 2006
% of Household

Number of
homes available
for sale (L)
Average sales
price of existing
homes (R)
1.6
2.1
2.6
3.1
3.6
4.1
140
160
180
200
220
240
260
280
300
Millions $ Thousands
1999 2000 2001 2002 2003 2004 2005 2006
U.S. Homes Price and Availability3.7 Millions Homes and Condos for Sale in January 2007
Source:Source: Economy.com

2.0
2.2
2.4
2.6
2.8
3.0
Dec-98 Dec-99 Dec-00 Dec-01 Dec-02 Dec-03 Dec-04 Dec-05 Dec-06
9
10
11
12
13
14
15
16
Percent of Loans Percent of Loans
Increasing Mortgage Delinquency All Delinquencies: 30, 60 and 90 Days
Source: Mortgage Banker Association
Subprime (R)Dec. 06: 13.3%
Prime (L)Dec. 06 : 2.6%

Weakened Underwriting Standards
LTV>80%
Full
Documentation
(% of Orig.)
With Second
Liens % Interest Only
2003 10.1 48.6 10.9 53.3
2004 20.7 51.2 23.1 71.2
2005 21.7 47.3 26.8 81.4
2006 28.2 33.6 35.3 90.7
2003 33.3 28.1 23.4 56.4
2004 46.8 32.6 39.1 75.0
2005 49.6 28.3 46.9 82.6
2006 55.4 19.0 55.4 87.2
2003 55.6 63.5 9.9 5.3
2004 61.1 59.9 19.1 19.5
2005 64.4 55.9 28.1 31.6
2006 64.0 54.6 31.0 19.9
% of Origination
Pri
me
AR
Ms
Alt
-A
AR
Ms
Su
bp
rim
e
AR
Ms
Year
Source: UBS

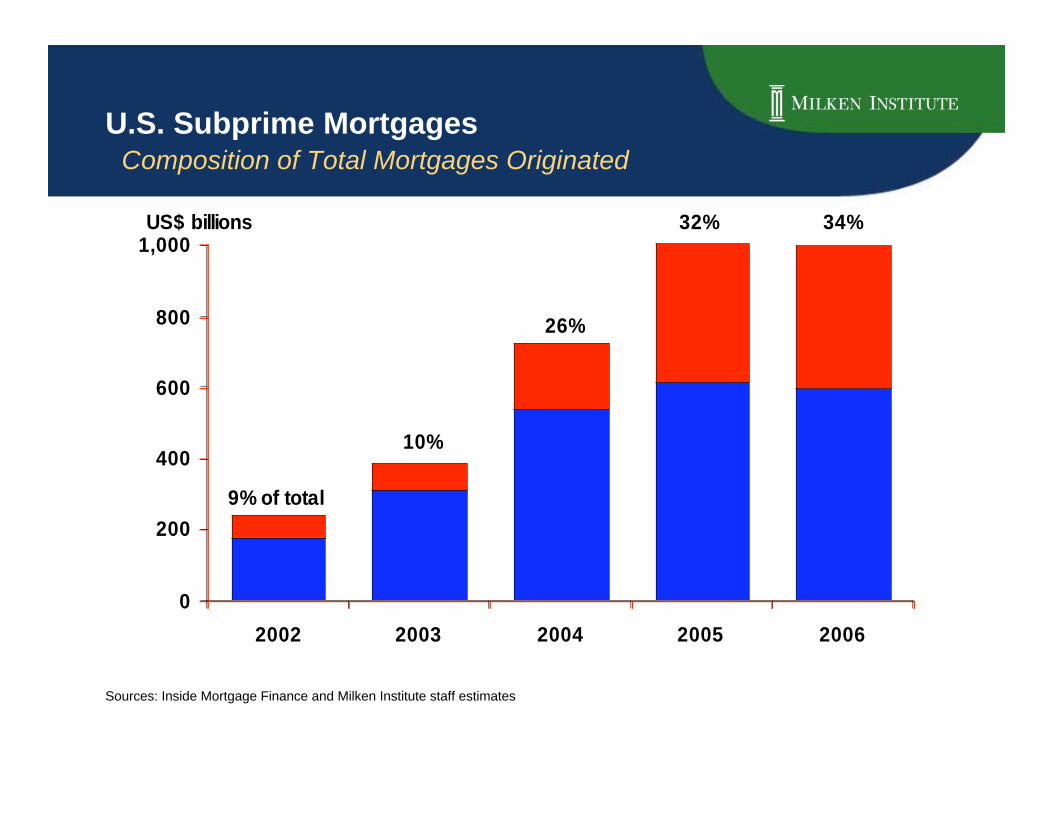
U.S. Subprime Mortgages Composition of Total Mortgages Originated
Sources: Inside Mortgage Finance (adapted from The Economist), Milken Institute staff estimates
0%
20%
40%
60%
80%
100%
2002 2003 2004 2005 2006
S b i "Alt A" T diti l

200620052004200320022001200019991998
8.5
8.0
7.5
7.0
6.5
6.0
5.5
5.0
14
12
10
8
6
Percent YOY % Change
Growth in Mortgage Outstanding andMortgage Rate
$13.3 trillionstotal mortgages
outstanding,December 2006 (R)
30-year fixedconventional mortgage
rate (L)
Source: Federal Reserve and Federal Housing Finance Board

Rising Overall Real Estate Leverage U.S. Household Real Estate Loan To Value
Source: Federal Reserve060196918681
50
45
40
35
30
25
Percent
U.S. Subprime Mortgages Composition of Total Mortgages Originated
Sources: Inside Mortgage Finance and Milken Institute staff estimates
0
200
400
600
800
1,000
2002 2003 2004 2005 2006
S b i "Alt A"
9% of total
10%
26%
32% 34%US$ billions

S&P/Case-Shiller Home Price Composite
0
50
100
150
200
250
Jan-87 Jan-91 Jan-95 Jan-99 Jan-03 Jan-07
Source: Bloomberg

Housing Price Futures Contract
210.2
216.0
215.2
211.4
215.0
206
208
210
212
214
216
218
Nov-06 Dec-06 Jan-07 Feb-07 Mar-07
11/07 Future Contract on S&P Case-Shiller Housing Composite
Source: Bloomberg

Rational or Irrational Exuberance?

Mortgage Debt as a Percentage of GDP
> 50%
20-50%
10-20%
5-10%
< 5%
n/a
2
Source: Lehman Brothers; European Mortgage Federation; Merrill Lynch; World Bank; Bureau of Economic Analysis; IMF; IUHF; HousingFinance; Unicorn Investment Bank; BIS.

FI Transferring Challenge Mexico and U.S. Housing Markets
1.2 1.6 Potential Market per year (Millions of Units)
<1% >50% % of Self-built Housing Stock
- ~50% % of Sub-standard Housing Stock
1900700 Average Square Feet
2.34.5 Persons per Household
72.5 21.5 Households (Millions)
U.S. Mexico
Source: Mexican Housing Overview, U.S. Census, Joint Center for Housing Studies of Harvard University

Largest Commercial Real EstateMarkets Worldwide
World total: >$14 trillion
Source: European Public Real Estate Association, World Bank Organization, FTSE Group
Belgium Switzerland
MexicoS Korea
HKSpain
CanadaUK
GermanyJapan
US
6000
5000
4000
3000
2000
1000
0
40
30
20
10
0
US$ Billion Percent of World Total
0.91.01.41.62.02.62.7
7.27.4
13.5
34.4Total Percentage

Outstanding Residential MortgageBalances in Selected Countries, 2005
Source: US data is from Federal Reserve and other data is from CIA World Factbook, Hypostat 2005
527
1,575
252 47469 654
107
1,606
8,281
1,411
0
2,000
4,000
6,000
8,000
10,000
US Japan Germany France UK Italy Mexico Spain Australia Belgium
US$ Billions

Mortgage Balances Outstanding 2005
Source: US data is from Federal Reserve and other data is from Wall Street Journal, March 20, 2007
36
23
139
3
49
97
37
0
20
40
60
80
100
US HK Taiwan Singapore Malaysia S. Korea Thailand India
Percent of GDP
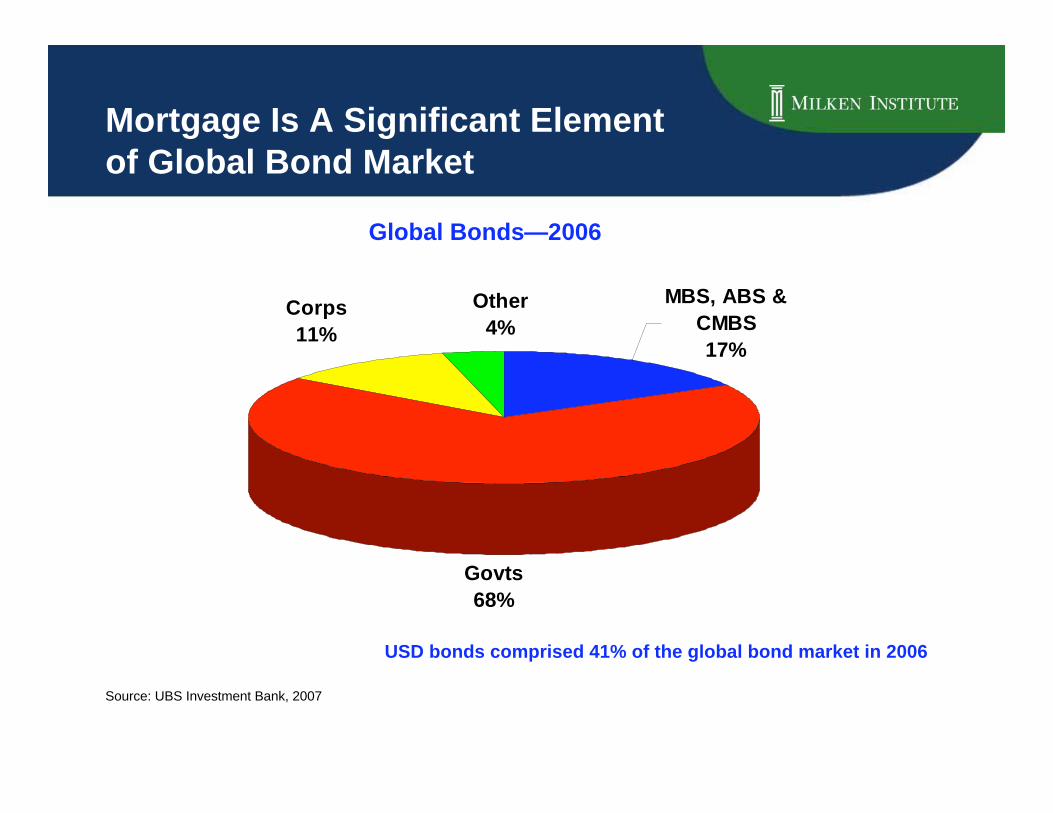
Mortgage Is A Significant Elementof Global Bond Market
Source: UBS Investment Bank, 2007
Global Bonds—2006
MBS, ABS &
CMBS
17%
Govts
68%
Corps
11%
Other
4%
USD bonds comprised 41% of the global bond market in 2006

Characteristics of Mortgage Markets Selected Industrialized Countries
Source: IMF, 2005

Growing Global CommercialMortgage-Backed Securities (CMBS)
Source: www.cmbs.org
17 17 16 26 37
7457 49
7452
7893
169
203
143 8
110.3 3 1
14
19 12
2329
21
34
69
0
0
50
100
150
200
250
90 91 92 93 94 95 96 97 98 99 00 01 02 03 04 05 06
Non-US
US
US$ Billions

Global CommercialMortgage-Backed Securities As a Percentage of the Total
Source: GPR, NAREIT, FTSE, EPRA (Dec 2006)
0
2
4
6
8
10
12
World N America Latin America Asia-Pacific Europe
Percent

Implications of Global SocioeconomicChange on Mortgage Markets
Source: United Nations Population Division
2006: 6.4 billion
2050: 9 billion The world’spopulation growthwill occur almostentirely in lessdeveloped regions,which shows hugemortgageopportunities inthese regions
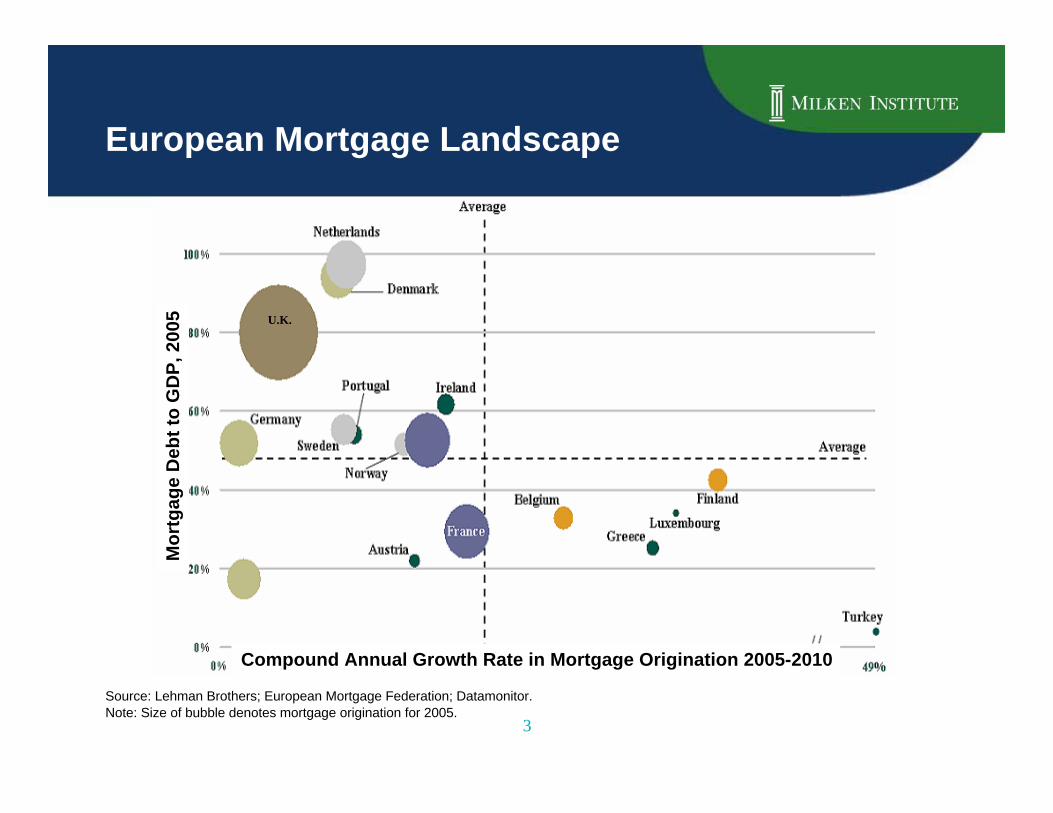
European Mortgage Landscape
3
Source: Lehman Brothers; European Mortgage Federation; Datamonitor.Note: Size of bubble denotes mortgage origination for 2005.
U.K.
Compound Annual Growth Rate in Mortgage Origination 2005-2010
Mo
rtg
ag
e D
eb
t to
GD
P,
20
05

The Asian Mortgage Landscape
4
Source: Lehman Brothers
Note: Size of bubble denotes actual and estimated mortgage origination for 2005; CAGR in mortgage origination estimated by LehmanBrothers.
Compound Annual Growth Rate in Mortgage Origination 2005-2010
Mo
rtg
ag
e D
eb
t to
GD
P,
20
05
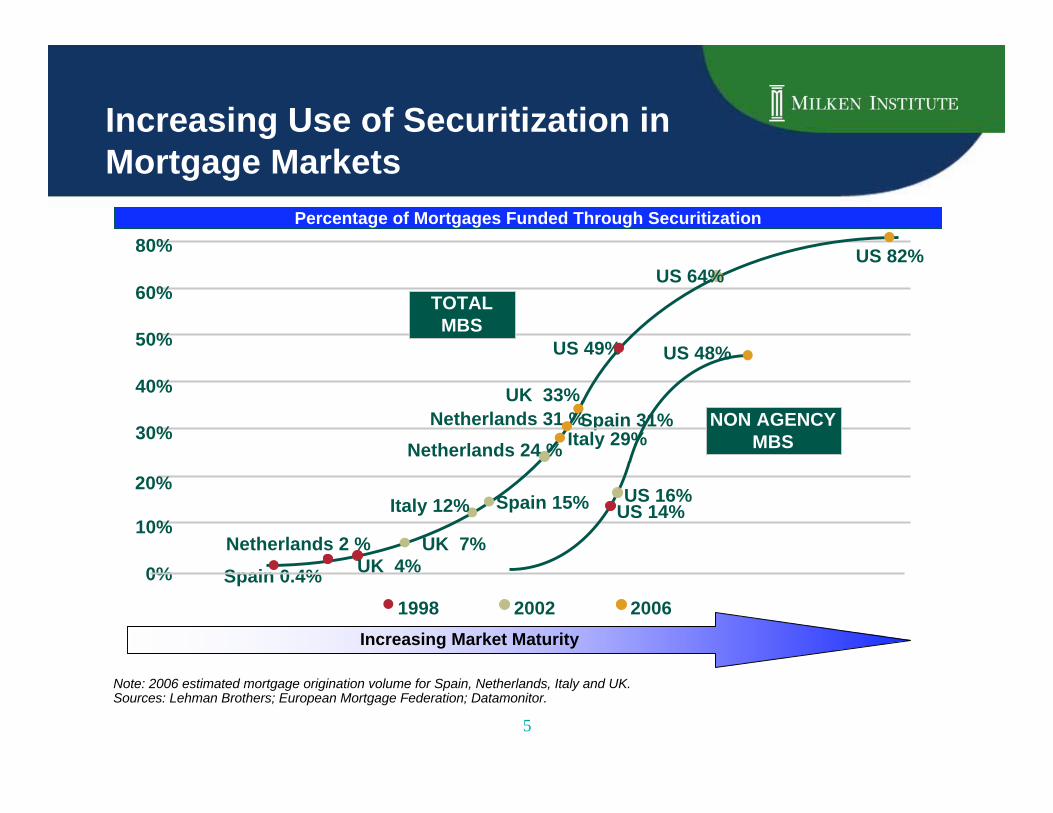
Increasing Use of Securitization inMortgage Markets
Note: 2006 estimated mortgage origination volume for Spain, Netherlands, Italy and UK.Sources: Lehman Brothers; European Mortgage Federation; Datamonitor.
Percentage of Mortgages Funded Through Securitization
UK 33%
Spain 31%
Spain 15%
UK 7%
Spain 0.4%
US 49%
60%
40%
30%
20%
10%
0%
50%
Netherlands 2 %
80%
Increasing Market Maturity
2002 20061998
US 64%US 82%
Netherlands 31 %
Netherlands 24 %
TOTALMBS
NON AGENCYMBS
US 14%US 16%
US 48%
Italy 12%
Italy 29%
UK 4%
5

Capital Market Fundingin Emerging Markets
33
Mortgage BondsStructured
Finance(Asia, CEE)
StructuredFinance
(Latin America,Africa)
ConduitsLiquidityFacilities
Chile China Argentina Argentina India
Colombia Hong Kong Brazil Brazil Jordan
Czech Republic Korea Colombia Colombia Malaysia
Hungary Malaysia Chile Hong Kong Mexico
Kazakstan Philippines Mexico Korea South Africa
Latvia Thailand Panama Trinidad Trinidad
Poland Peru Thailand
Trinidad
Latvia
Russia Morocco
South Africa

Reasons for Mortgage-Backed Securities
• Transform illiquid individual financial assets into liquidand tradable capital market instruments
• Allow mortgage originators to replenish their funds
• Can be used by Wall Street banks to monetize the creditspread
• A more efficient and lower cost source of financing
• Allow issuers to diversify their financing sources
• Allow issuers to remove assets from their balance sheetwhich can help to improve various financial ratios andutilize capital more efficiently

35
Pre-requisites of EffectiveHousing Finance Systems
• Avoidance of Severe Inflation
• An Efficient Property Registration System
• Free Markets in Land and Housing
• Competitive Financial Markets
• Legal Infrastructure That Supports HousingFinance
• Regulatory Infrastructure That Supports theFinancial System

The Four Housing Finance Models
• Commercial Bank Model: Deposit-financed, diversified portfoliolenders
• Mortgage Bank Model: Bond-financed, specialized portfolio lenders
• Contract Savings Model: Specialized institutions (e.g.: Bausparkassen) offering subsidized, loan-linked savingscontracts
• Secondary Market Model: Second-tier institution lending to or purchasing loans from primary lenders

Renewable Energy Consumption Trend United States, 1995-2006
Source: Energy Information Administration/Monthly Energy Review March 2007
060504030201009998979695
4.0
3.0
2.0
1.0
0.0
Quadrillion BTU
Hydro-Electric PowerBiomassOther

Electric PowerTransportation
IndustrialCommercial
Residential
5
4
3
2
1
0
Quadrillion BTU
U.S. Renewable Energy Consumption By Sector, 2006
Source: Energy Information Administration/Monthly Energy Review March 2007
0.50.1
1.6
0.5
3.9

Renewable EnergyNuclear Electric Power
Fossil Fuels
100
80
60
40
20
0
Quadrillion BTU
U.S. Renewable Energy Consumption Compared with Other Resources, 2006
Source: Energy Information Administration/Monthly Energy Review March 2007
85.4
8.2 6.5

Oil Reserves Concentrated inUnstable Regions
Sources: Energy Information Administration
Middle East
60%
Africa
10%
Venezuela
6%
Russia
5%
Other
3%
Canada
14%
United States
2%

Volatile Oil and Natural Gas Prices
Sources: Energy Information Administration
0500959085
$80
$70
$60
$50
$40
$30
$20
$10
$12
$10
$8
$6
$4
$2
$0
US dollars per barrel US dollars per Thousand Cubic
WTI Crude Oil PriceNatural Gas Price

Most Costly Disaster in US History
TOTAL ECONOMIC IMPACT ~ APPROX. $200B USD
Drasticallyreduced tax
revenue base,unemployment,displacement,
bankruptcy
Loss ofapproximately
$500,000 in taxrevenue for each
day riverboatcasinos were
closed
Loss of timberproducts
estimated at $1.3billion; USDAdeclared 31agricultural
disaster areas
Interrupted oilproduction,
importation, andrefining in the Gulfarea had a major
effect on fuelprices

$40 - $60 Billion
$2 – 3 Billion
$15 – 25 Billion
$20 - 25 Billion
$2 - 5 Billion
$1 - 2 Billion
Gross IndustryLoss
1,752
Claims Filed
Additional Sources of Loss
Total
Wind & Surge, Second Landfall
New Orleans Flooding
First Landfall in Florida
Offshore Energy
Loss Component
Insurance Industry Loss Estimate September 2005
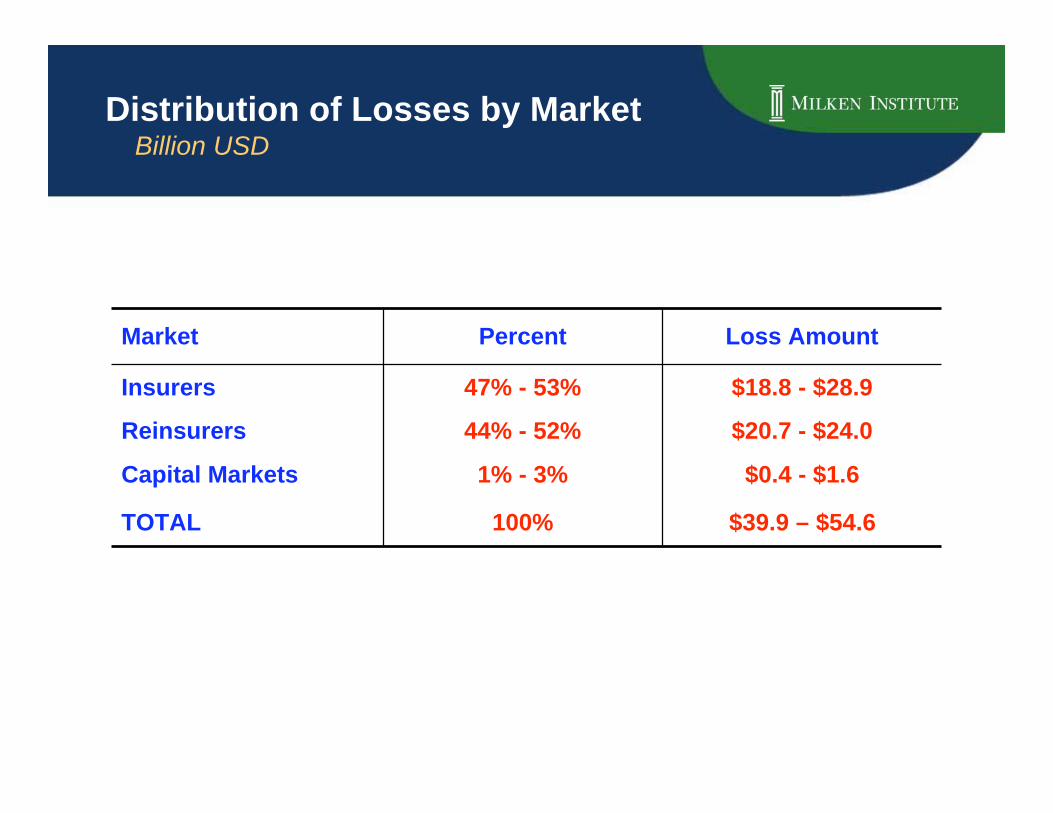
$0.4 - $1.61% - 3%Capital Markets
100%
44% - 52%
47% - 53%
Percent
$39.9 – $54.6
$20.7 - $24.0
$18.8 - $28.9
Loss Amount
TOTAL
Insurers
Reinsurers
Market
Distribution of Losses by Market Billion USD

Catastrophic Risk on the Rise Global Number of Catastrophic Events, 1979 – 2004
Sources: Allstate Insurance Company
0
50
100
150
200
250
1979 1984 1989 1994 1999 2004
Natural Catastrophes
Man-Made Disasters

Economic Impact of Catastrophes
Sources: Allstate Insurance Company
$25.7 $29.0
$169.6
$15.9$27.0
$52.4 (Est.)
0
50
100
150
200
250
1 2 3
Insured Property Loss
Uninsured Loss and Other Economic Loss
Earthquake
Northridge,
California
(1994)
Hurricanes
Charley, Frances,
Ivan and Jeanne
(2004)
Hurricanes
Katrina, Wilma
and Rita
(2005)
US$ Billions
$41.6 $56.0
$222.0 (Est.)

Larger Impact onEmerging Market Economies
Sources: Allstate Insurance Company
38%
14%12%
8% 7%
3% 3% 2% 2%
Honduras Dominican
Republic
Ecuador Iran Algeria Poland India Mexico Argentina
Hurricane
Flood
Earthquake
1998 1998 1998 1990 1980 1997 1990 1985 1985
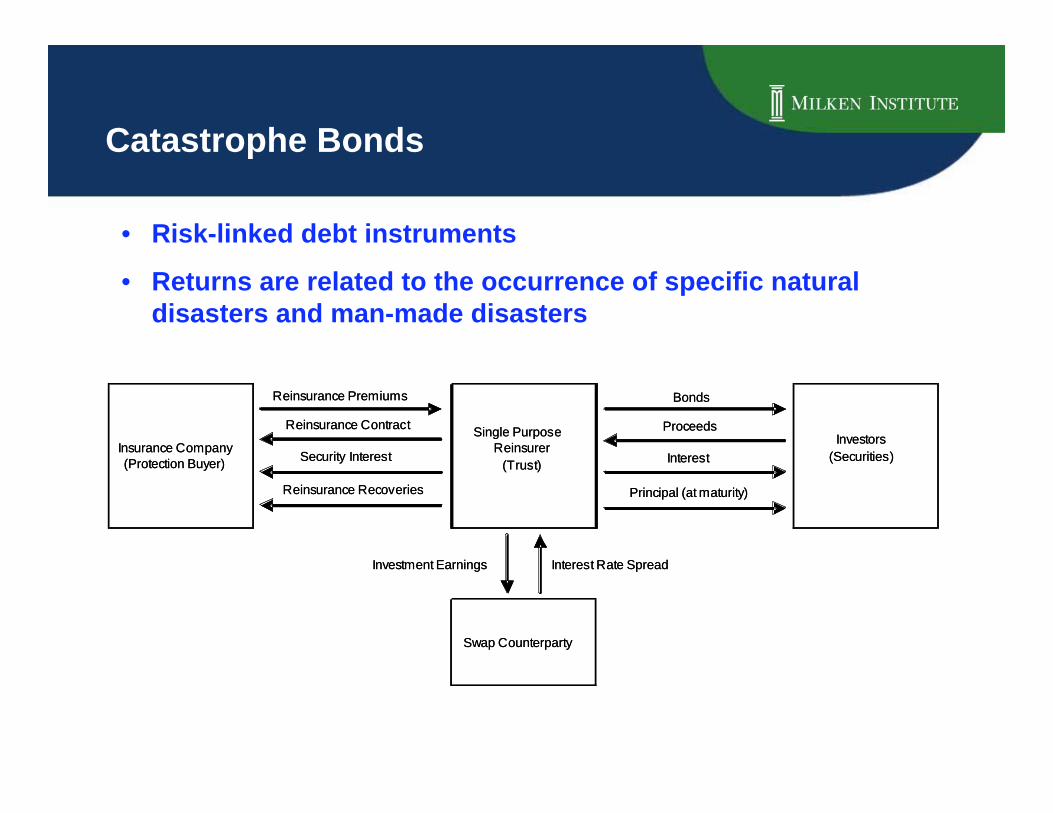
Catastrophe Bonds
Insurance Company
(Protection Buyer)
Single Purpose
Reinsurer
(Trust)
Swap Counterparty
Reinsurance Premiums
Reinsurance Contract
Investment Earnings
Security Interest
Reinsurance Recoveries
Investors
(Securities)
Bonds
Proceeds
Interest
Principal (at maturity)
Interest Rate Spread
Insurance Company
(Protection Buyer)
Single Purpose
Reinsurer
(Trust)
Swap Counterparty
Reinsurance Premiums
Reinsurance Contract
Investment Earnings
Security Interest
Reinsurance Recoveries
Investors
(Securities)
Bonds
Proceeds
Interest
Principal (at maturity)
Interest Rate Spread
• Risk-linked debt instruments
• Returns are related to the occurrence of specific naturaldisasters and man-made disasters

Catastrophe Bonds
• First sold in 1997
• 64 catastrophe bonds have been issued
– Total risk limits: $9.68 billion
• Annual issuance peaked in 2003
– $1.73 billion
– Leveled off to slightly over $1 billion since 2003
• Transaction costs are declining
• Usage could increase with certain regulatory and tax changes
• High reinsurance premiums and inadequate global capacity are themain reasons for market limitations.

Why Invest in Catastrophe Bonds?
• For Investors:
• Consistently shown higher returns than similarly ratedcorporate bonds
• Uncorrelated with stock, bond, commodities, and real estatemarkets
• For Insurers:
• Have virtually no credit risk
• Can provide a capacity much larger than the traditionalreinsurance capacity after a mega catastrophic event
• For Individuals:
• Provide means for accessing insurance in “uninsurable”geographic areas
• Increase the supply of capital in financial markets and can beutilized as a financial tool in risk management

Gas, 20.90%
Nuclear, 6.50%
Renewables,
13.10%Coal, 25.10%
Non-Renew.
Waste, 0.20%
Oil, 34.30%
Fuel Shares of World Total PrimaryEnergy Supply 2004
Source: International Energy Agency

Water ShortagesHigh Vulnerability to Water Scarcity
Source:

The global water market is a perfect fitwith Siemens long term business strategy World water market 2004 - 2008, in USD
Operation of municipaland industrial water andwaste water treatment
plants
Source: World Bank, various research institutes
Global facts
Less than 1% of Earth'swater is usable
Population increase of2.5B by 2035 mainly inregions with watershortage
1.5B people do not havesafe water supply; 4B in2025
40% increase in waterconsumption by 2025
316
29
96
473
2008
Systems, Products &
Services
Turnkey /EPC
Oper-ations
CAGR 6%
375
2004
250
40
117
Consulting, Design andEngineering of turn-key
solutions
Systems, products, services(product related and
maintenance)
The annual world water infrastructure market exceeds$400 billion, and is projected to grow at 2x global GDP

The “accessible” water market will growat 8% per year in developing countries Accessible water market 2004 and CAGR by geography, USD and %
375
Total watermarket 2004
6"
10" 5"
15" 4"
20"
29"
24" 6"
151"
8%
3-5%
12%
4-6%
3-5%
7-9%
4-6%3-6%
6-9%
~6%
Accessiblemarket by segment
2004
CAGR2004-2008
Pumps & Valves
Infrastructure
Outsourcedoperations
Turnkey / EPC
Non-chemical watertreatment equipm.
Automation& Metering
Chemicals & chem.treatm. equipm.1)
Maintenance &analytical services
24" Municipal
2" Industrial
Core systems market
5"
1"
Core service market
224
151
In-sourced
opera-tions
Acces-sible
market Developed countriesaccount for 70% of the
market with growth ratesof 3.6% p.a.
Developing countriesshow growth rates of
8.11% p.a.
Siemens WTaddressed market
segment $38BUSD
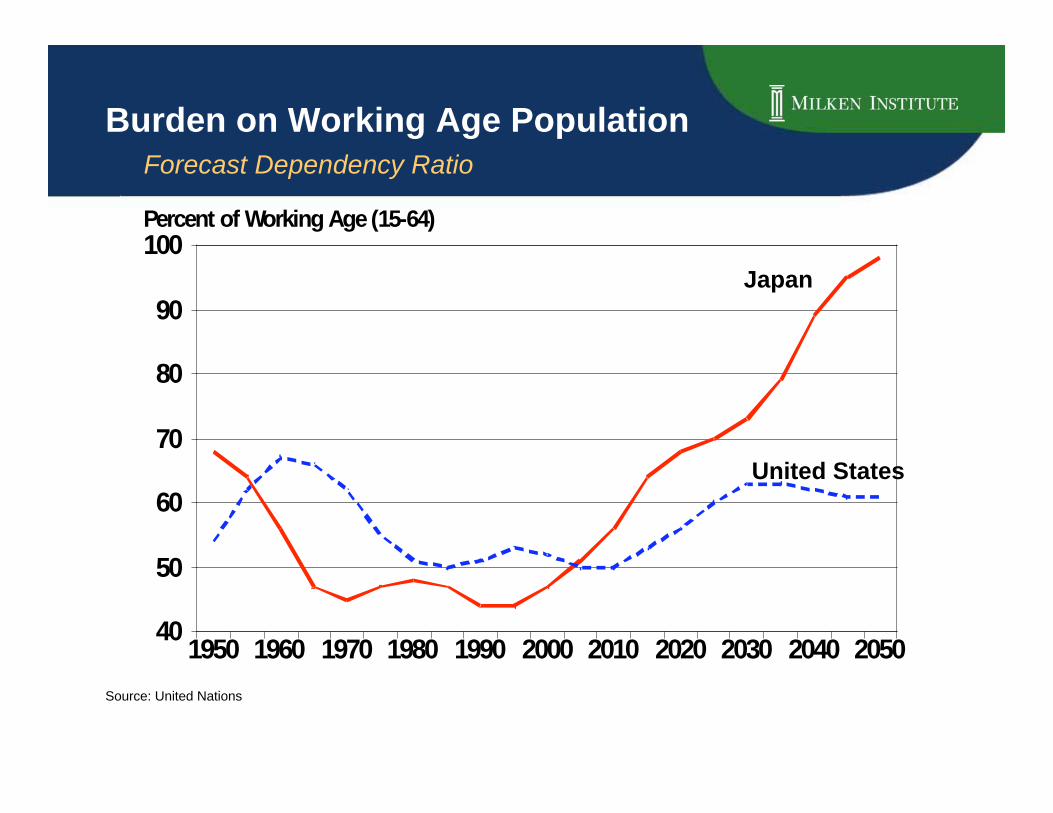
20502040203020202010200019901980197019601950
100
90
80
70
60
50
40
Percent of Working Age (15-64)
Burden on Working Age Population Forecast Dependency Ratio
Japan
United States
Source: United Nations

Dependents - Developed CountriesForecast Dependency Ratio
20502040203020202010200019901980197019601950
80
60
40
20
0
Percent of Working Age (15-64)
Aged 0-14Aged 65+
Source: United Nations

Dependents - Developing CountriesForecast Dependency Ratio
20502040203020202010200019901980197019601950
80
60
40
20
0
Percent of Working Age (15-64)
Aged 0-14Aged 65+
Source: United Nations

Developed
Countries
Developing
Countries
20502040203020202010200019901980197019601950
85
80
75
70
65
60
55
50
45
Percent of Working Age (15-64)
Dependency BurdenForecast Dependency Ratio
Source: United Nations

Most Mature Economies HavePopulations Peaking by 2010
Source: United Nations Population Division
The labor force of Japan is withering and the elderly population—especially females—will expand dramatically.

Most Emerging Economies HaveGrowing Populations
Source: United Nations Population Division
The workforce growth in India will be staggering.The country will generate enormous demand for high-quality real estate of alltypes—residential, retail, industrial, warehouses, hotels, and office buildings.

Projected Age-Related Spending
4.20.155.888.6 G7 Average
5.9-1.843.561.8 United States
4.1-1.540.046.7 United Kingdom
2.2-3.086.4173.1 Japan
1.91.495.1120.4 Italy
3.20.151.571.1 Germany
3.3-0.243.776.1 France
9.05.530.270.8 Canada
(Percentagepoints of GDP)
(% of GDP, 2005)
Age-RelatedSpending, 2005
to 2050
PrimaryBudgetBalance
Net Debt Gross Debt
Source: International Monetary Fund

World Hunger 20% or More Undernourished
Source:

Malaria DistributionWhere Malaria is Endemic
Source:

Tuberculosis Distribution100 or more cases per 100,000 people
Source:

HIV DistributionAdult HIV prevalence of 5% or more

Hepatitis B DistributionPrevalence of 7% or more

Leading Causes of Death-United StatesAs Percent of Deaths by Gender, 2001
Respiratory DiseaseStroke
AccidentsCancer
Heart Disease
35
30
25
20
15
10
5
0
Percent
malefemale
Source:

Most Products that Get to MarketNever Make Enough to Recoup R&D Investment
After-Tax Net Lifetime Sales ($M)
1st 2nd 3rd 4th 5th 6th 7th 8th 9th 10th
New Products Grouped in Tenths According to Financial Success
$0
$500
$1,000
$1,500
$2,000
$2,500
$3,000
After-tax average R&D Cost
After-Tax Net Lifetime Sales ($M)
1st 2nd 3rd 4th 5th 6th 7th 8th 9th 10th1st 2nd 3rd 4th 5th 6th 7th 8th 9th 10th
New Products Grouped in Tenths According to Financial Success
$0
$500
$1,000
$1,500
$2,000
$2,500
$3,000
After-tax average R&D Cost
Source: Grabowski, Vernon, and DiMasi, PharmacoEcon 2002

Market Potential for EnergyEfficiency and Clean Technologies
Source: Scenarios for a Clean Energy Future, Oak Ridge National Lab, 2000;
American Council on Renewable Energy (ACORE), December, 2006
0
50
100
150
2006 2020 business as usual 2020 with energy
efficiency and
renewables
Qu
ad
s o
f U
.S.
en
erg
y u
se
The market potential

A Green Loan: A New BusinessModel Rises from An Intersection of Expertise

A New Sandwich:the Energy intermediary Model

2 + 2 = 5: the Energy intermediaryModel Profits from the Synergies

Reorganize Parties to MakeA Significant Change

• Great national concern about energy security and globalwarming
• Sufficient “ready” technologies exist, but the market side
needs incentives to change
• The profit motive will encourage business to adopt new
technologies
• Businesses must adopt financeable plans to adopt newtechnologies
• Businesses must monetize their savings with innovativemetering and contracts
Connection between NationalConcerns and the Role of Capital Markets

Large Risks Remain After the ScienceIs Completed
Source: Martha Amram, Growth Options Insights

Valuations at Key Milestones inDrug Development
• In the traditionalfinancing model,investmentoccurred over life-cycle of drugdevelopment
• In today’smodel, there islittle investmentuntil after ClinicalPhase II

Expected Value Distributionof an IP Portfolio
• We expect the value of a portfolio to be Lognormallydistributed with three primary components

Transaction Structure of YaleUniversity’s Royalty Monetization
Source: Royalty Pharma

Leveraging Foundations toAccelerate Cures
Source: Technology Option Capital, LLC

A Private Company Closes theMarket Gap for Lending Using IP
Source: IP Innovations

Transaction Structure ofAdvanced Purchase Agreements
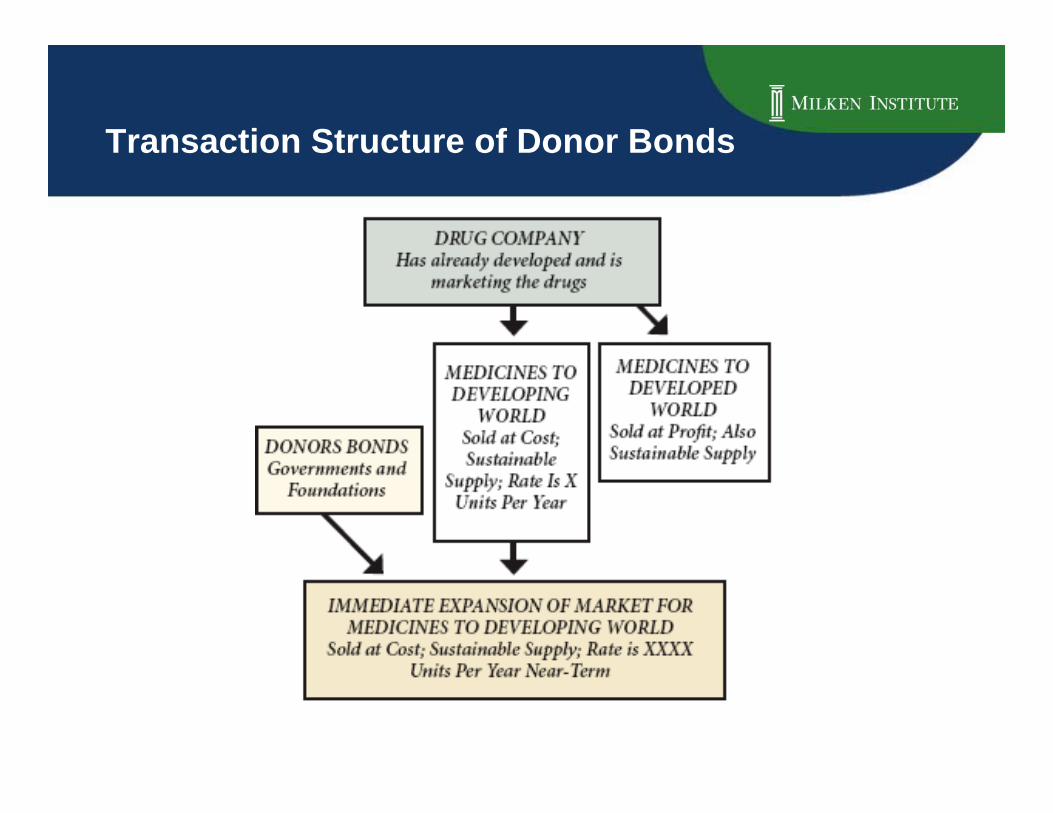
Transaction Structure of Donor Bonds

Financial Innovation: Human Capital andEducation

What Is Intellectual Property?
• Patents
• Trademarks
• Know-how
• Copyrights
• Trade Secrets
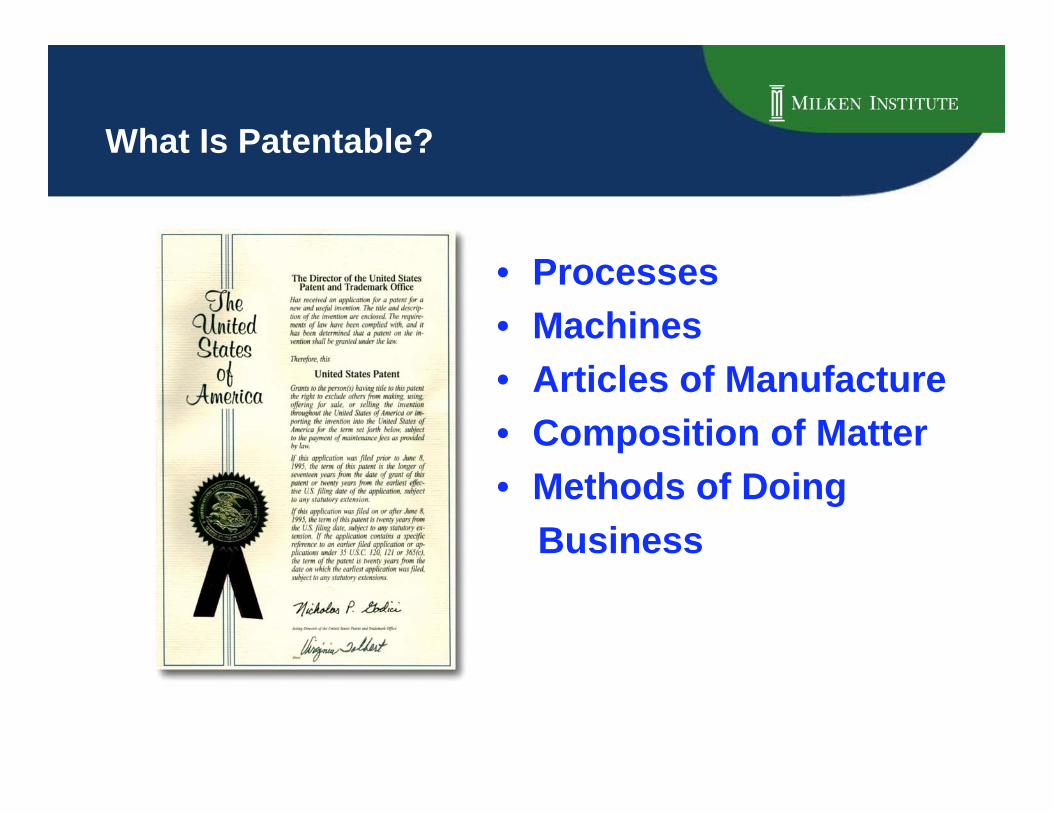
• Processes
• Machines
• Articles of Manufacture
• Composition of Matter
• Methods of Doing
Business
What Is Patentable?

Methods Commonly Used to ValueIntellectual Property
• Industry Averages orRules-of-Thumb
• Comparable Transactions
• Discounted Cash Flow(DCF)
• Options Value

Wealth Today Residesin Human Capital
• Becker and others estimatethat roughly 70% of anation’s wealth today is inthe form of human capitalrather than physical capital.
• The pecuniary returns toknowledge, education andskill are very high in theUnited States and evenhigher outside the mostdeveloped countries.

Explosive Growth of Patents,But Declining Share of the U.S.
Source: United States Patent and Trademark Office
0
30
60
90
120
150
180
40
50
60
70
80
90
100
Thousands Percent
Number of GrantedPatents (L)
U.S. Resident Share ofGranted Patents (R)

Personal Internal Rate of ReturnHigher Education
ItalyJapan
CanadaGermany
SwedenNetherlands
FranceDenmark
USUK
18
16
14
12
10
8
6
4
Percent
MaleFemale
Source:
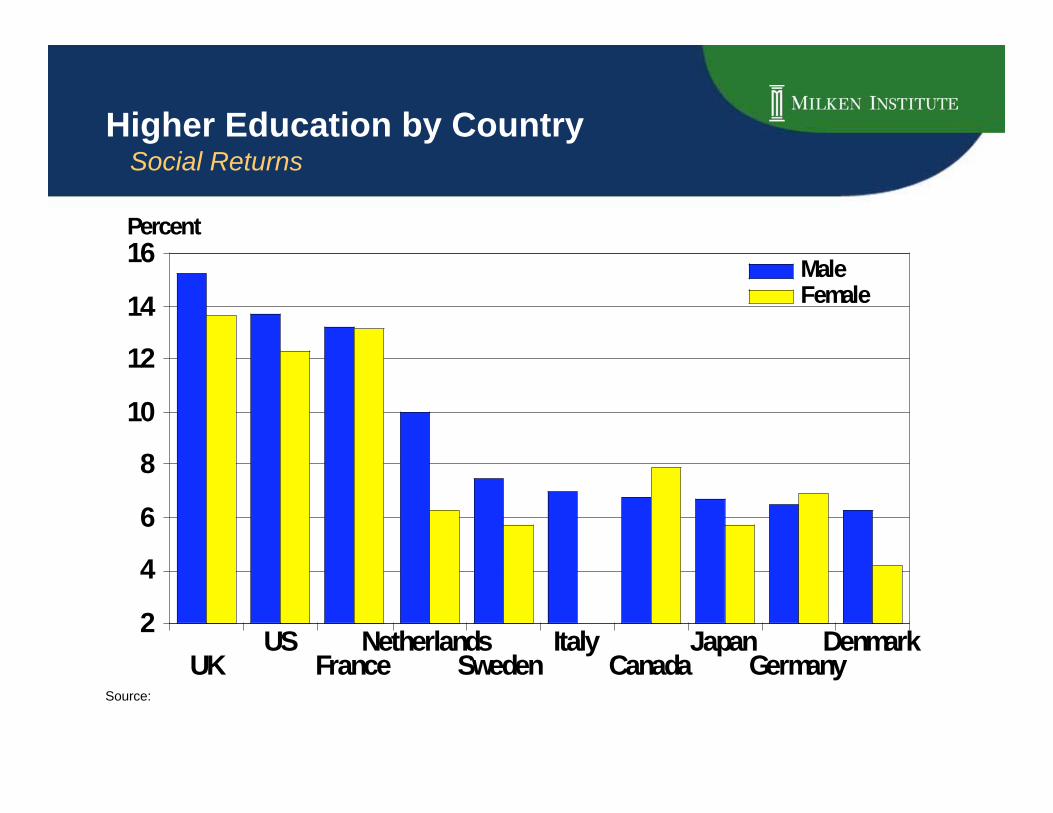
DenmarkGermany
JapanCanada
ItalySweden
NetherlandsFrance
USUK
16
14
12
10
8
6
4
2
Percent
MaleFemale
Higher Education by CountrySocial Returns
Source:

Education and Training Pays…
Master’sdegree
Bachelor’sdegree
Associatedegree
Some college,no degree
High schoolgraduate
Some highschool, no
diploma
Unemployment rate in 2000
(Percent)
Median earnings in 2000
(Dollars)
1.6
1.8
2.3
2.9
3.5
6.5
55,300
46,300
35,400
32,400
28,800
21,400
Source:
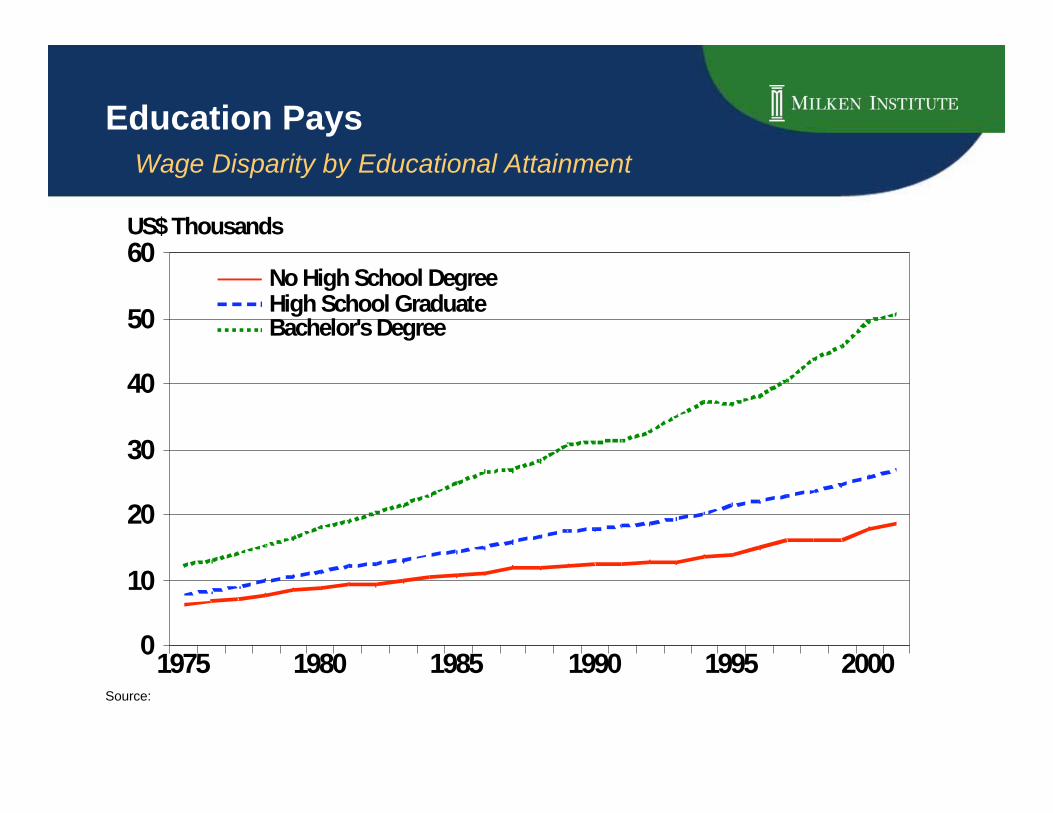
Education Pays
Wage Disparity by Educational Attainment
200019951990198519801975
60
50
40
30
20
10
0
US$ Thousands
No High School DegreeHigh School GraduateBachelor's Degree
Source:
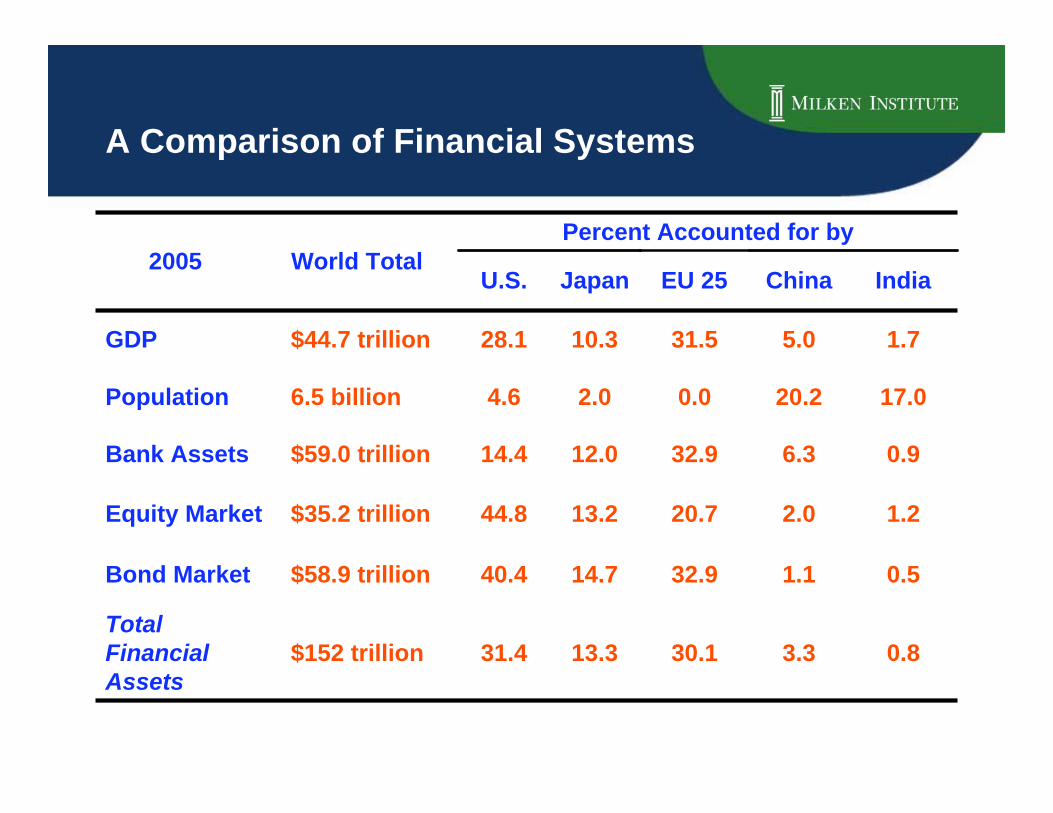
A Comparison of Financial Systems
World Total
31.4
40.4
44.8
14.4
4.6
28.1
U.S.
13.3
14.7
13.2
12.0
2.0
10.3
Japan
0.51.132.9$58.9 trillionBond Market
1.75.031.5$44.7 trillionGDP
Percent Accounted for by2005
0.83.330.1$152 trillionTotalFinancialAssets
1.22.020.7$35.2 trillionEquity Market
0.96.332.9$59.0 trillionBank Assets
17.020.20.06.5 billionPopulation
IndiaChinaEU 25
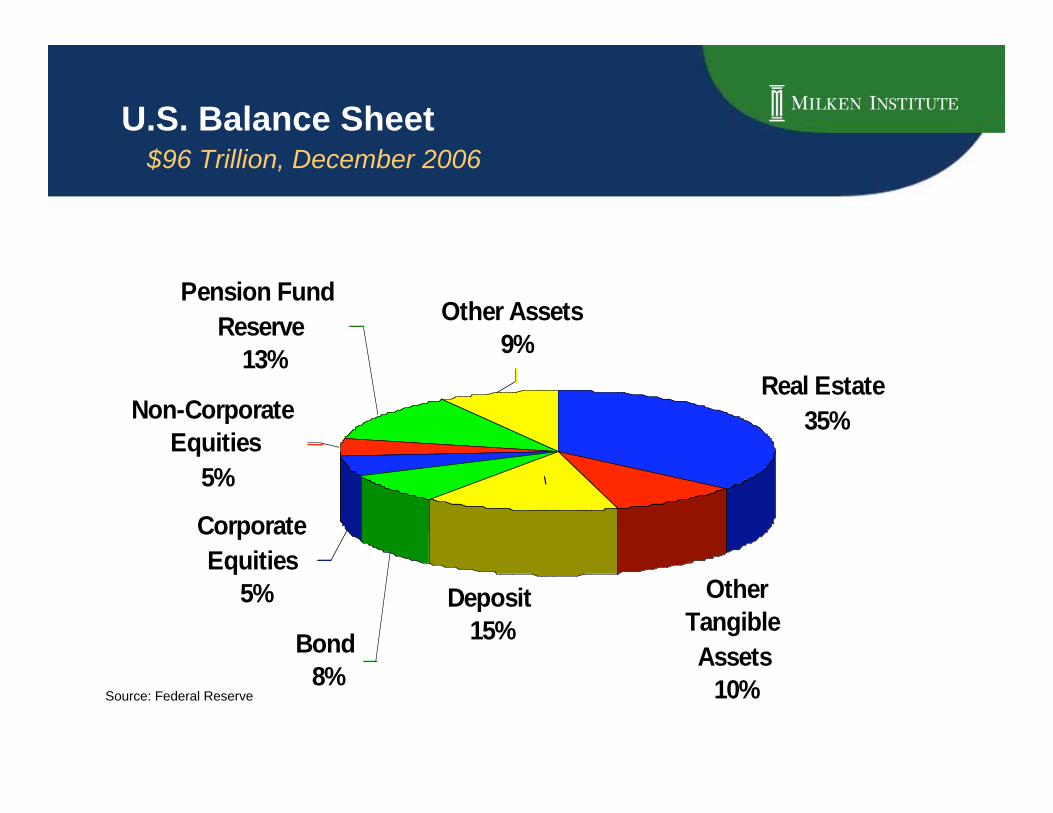
U.S. Balance Sheet $96 Trillion, December 2006
Real Estate
35%
Other
Tangible
Assets
10%
Deposit
15%Bond
8%
Corporate
Equities
5%
Non-Corporate
Equities
5%
Pension Fund
Reserve
13%
Other Assets
9%
\
Source: Federal Reserve

U.S. Financial AssetsDecember 2006: $56 Trillions
Source: Federal Reserve06029894908682
80
60
40
20
0
US$ Trillion
Bonds: Treasury, Agency and Muni Securities, Corporate Bonds, ABSLoans: Bank Loans, Mortgages, Consumer CreditsStocks: Corporate Equities and Mutual Fund Shares
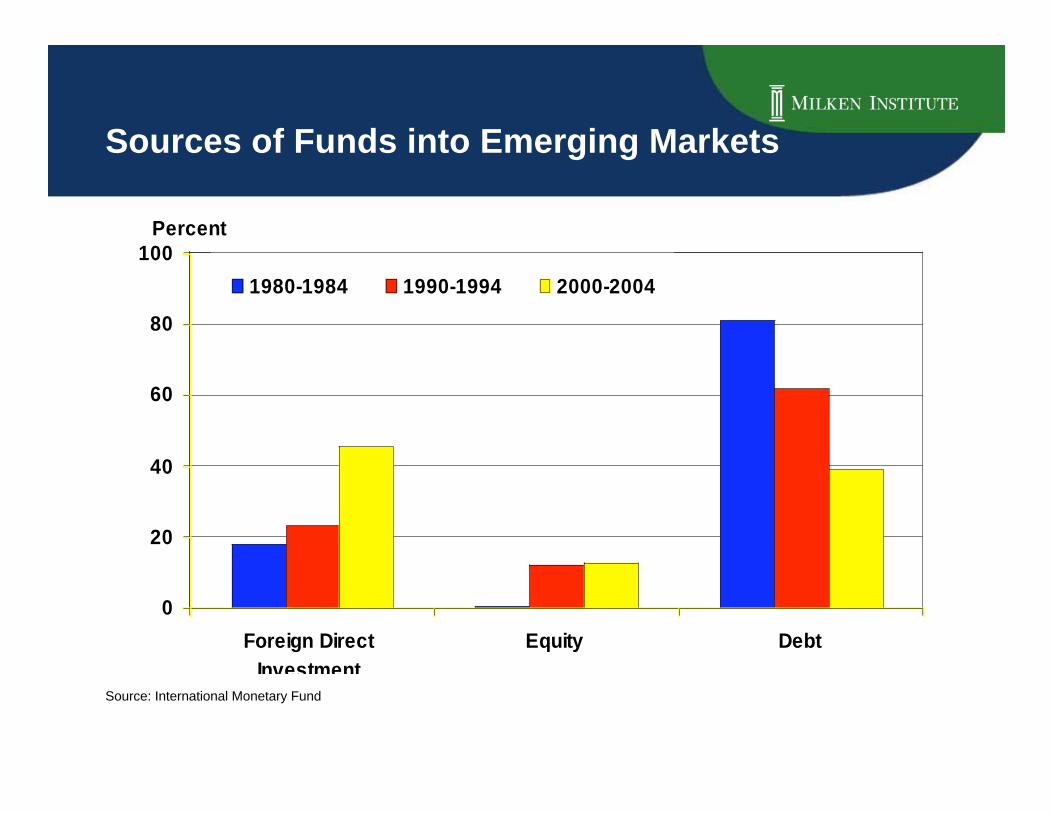
Sources of Funds into Emerging Markets
Source: International Monetary Fund
0
20
40
60
80
100
Foreign Direct
Investment
Equity Debt
1980-1984 1990-1994 2000-2004
Percent

Historical Bond Default Rates
0
20
40
60
80
100
1971 1976 1981 1986 1991 1996 2001 2006
0
3
6
9
12
15Par Value Defaults (L)
Default Rates (R)
US$ Billions Percent
Sources: Altman

Hedge Funds vs. Mutual Funds Number by Domicile Location, 2005
Total = 56,863
United
States
14%
Europe
53%
Asia
21%
Other
Countries
12%
Total = 6,445
United
States
52%
Europe
33%
Off-shore
Centers
8%
Asia
2%
Other
Countries
5%
Hedge Funds Mutual Funds
Source: Hedgefunds.net and MI staff estimates

Hedge Funds vs. Mutual Funds Assets by Domicile Location, 2005
Total = $17.8 Trillion
United
States
50%
Europe
34%
Asia
7%
Other
Countries
9%
Total = $968.7 Billion
United
States
53%Europe
38%
Off-shore
Centers
6%Asia
1%
Other
Countries
2%
Hedge Funds Mutual Funds
Source: Hedgefunds.net and MI staff estimates

968,69024,17712,63457,788371,048503,044All locations of fund assets
(US$ Millions)
1,163000316847Other/Unknown
70167900022Australia/Oceania
96378705010125Africa
3,6412,5541275959257South America
3,8332,390055450938North America
58,3963,81610,7893,38229,75410,655Asia
102,3541,42908,17983,0399,708Europe
303,5291,76428314,74224,426262,315United States
494,11010,7581,55030,622232,905218,275Global
All regions ofdomicile
OtherCountries
AsiaOff
ShoreEuropeUnited States
Region of Domicile
Lo
ca
tio
n o
f A
ss
ets
Total Assets of Hedge Fundsby Domicile and Asset Location
Source: Hedgefunds.net and MI staff estimates

Credit to Households:Retail Loan Penetration Percent of GDP
Source: Merrill Lynch, 2006

Credit to Households:Market Loan Penetration Percent of GDP
Source: Merrill Lynch, 2006

Debit and Credit Card Penetration 2005
Source: Wall Street Journal, March 20, 2007
5444 44
3
71
174
61
0
40
80
120
160
200
S. Korea Brazil China Thailand Mexico Poland India
Percentage of Population

Credit Card Usage to GDP
FinlandNewZealand
Hong KongFrance
U.S.Sweden
IsraelAustralia
IcelandNorway
21
20
19
18
17
16
15
14
Percent of GDP
1515
161616
1718
2020
20
Source:

Remittances Are the Largest Sourceof External Financing in Developing Countries
Source: Global Economic Prospects 2006: Economic Implications of Remittances and Migration (World Bank), World Development
Indicator s 2006, and Global Development Finance 2006
Total Remittances (includingestimated unrecorded remittance)
$199 billion

Remittance to Selected LAC Countriesin 2006
Source: Inter-American Development Bank
23,053
7,373
4,200 3,610 3,316 2,900 2,900
0
5,000
10,000
15,000
20,000
25,000
Mexico Brazil Colombia Guatemala El
Salvador
Ecuador Dominican
Repulic
US $ Millions
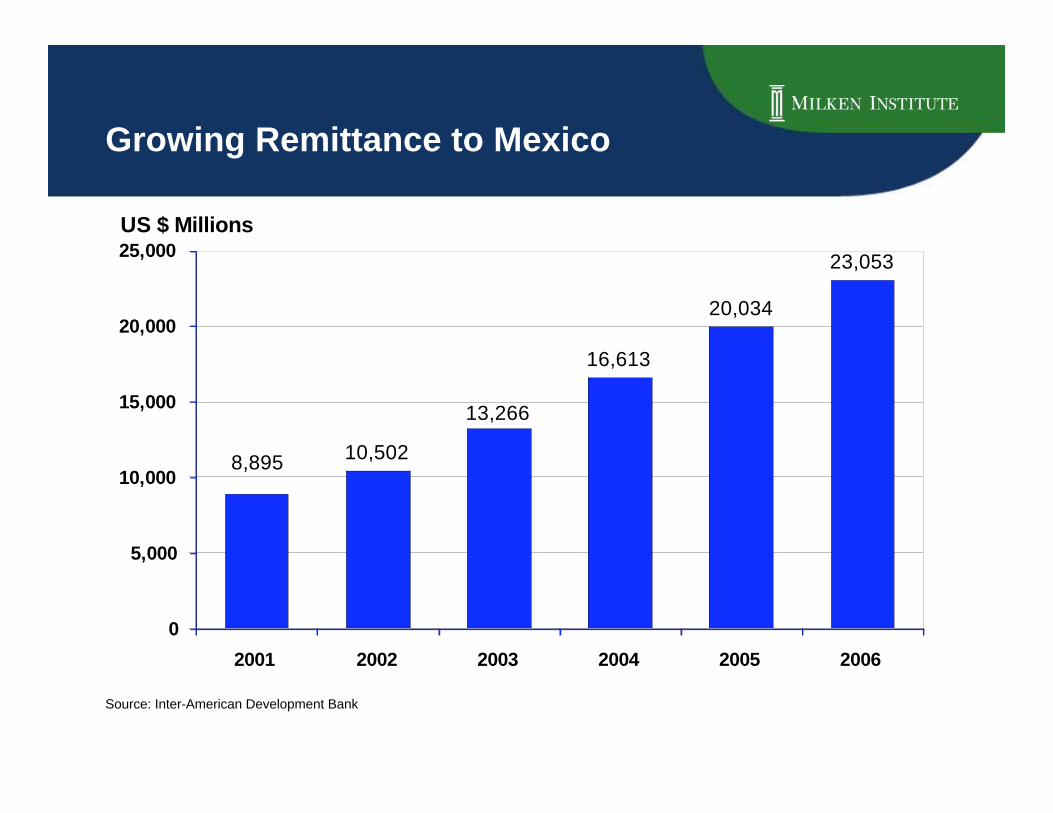
Growing Remittance to Mexico
Source: Inter-American Development Bank
10,502
16,613
20,034
23,053
13,266
8,895
0
5,000
10,000
15,000
20,000
25,000
2001 2002 2003 2004 2005 2006
US $ Millions

Remittance to Latin Americafrom the U.S. in 2006 (US$ Millions)
Source: Inter-American Development Bank
CA$13,191
TX$5,222
NY$3,714
Total:
>$45 billion

0
100
200
300
400
500
600
700
Jan. 85 - Dec. 94Jan. 95 - Dec. 04
Jan. 05 - Mar. 07
Media and Ent.
High Technology
Real Estate
Retail
Healthcare
Energy and Power
Other
US$ Billions
U.S. LBO by Target Industry
Source: SDC
Of which37% wereConsumer
Stable Of which35% wereIndustrial
$506
$307
$653
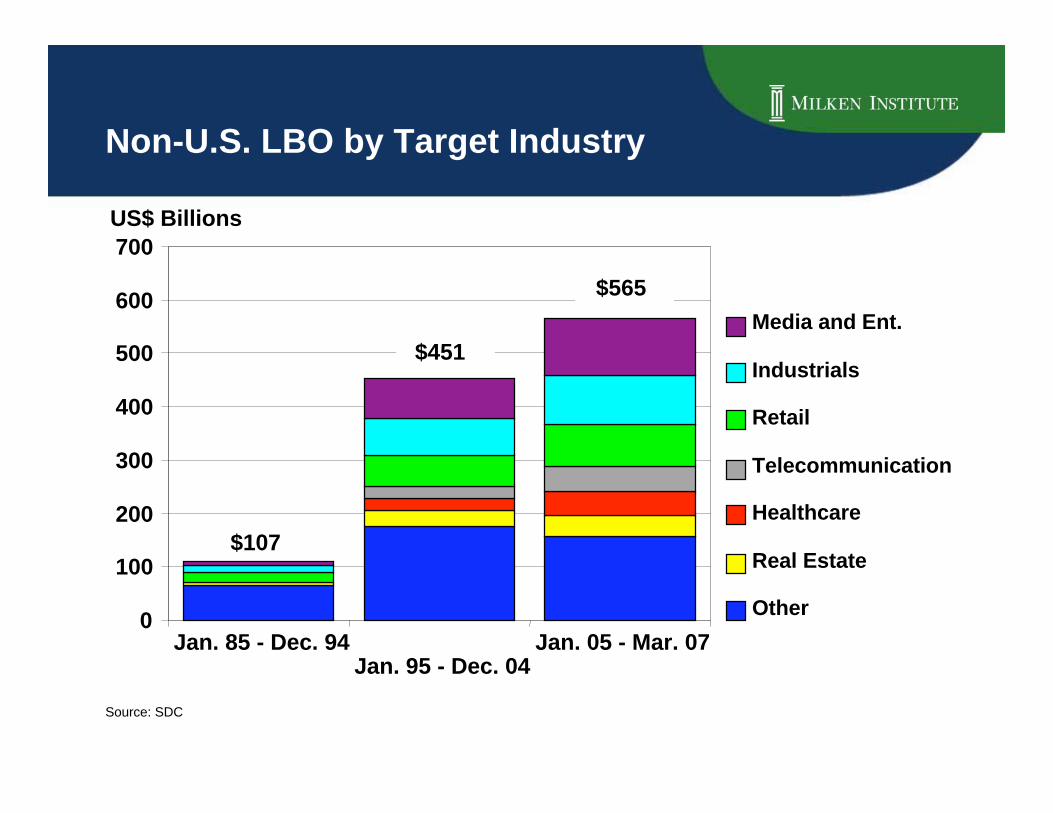
Non-U.S. LBO by Target Industry
Source: SDC
0
100
200
300
400
500
600
700
Jan. 85 - Dec. 94Jan. 95 - Dec. 04
Jan. 05 - Mar. 07
Media and Ent.
Industrials
Retail
Telecommunication
Healthcare
Real Estate
Other
$107
$565
$451
US$ Billions

© 2006 Reproduction or quotation is prohibited withoutthe express written consent of Chicago Climate Exchange,Inc.
Chicago Climate Exchange®
The Use of Markets to SolveEnvironmental Problems and Create Private Wealth

Wealth Creation in the U.S.since World War II
• 1945-70 Manufacturing
• 1970’s Inflation
• 1980’s Asset, liability mgmt., derivatives,commoditization of mortgages and bank debt(Junk Bonds)
• 1990’s High tech, Telecom
• 2000’s Commoditization of air and water

The Commoditization of Air & Water
• Clean Air Act Amendments of 1990 - SO2emission allowance trading
• Kyoto Protocol of 1997 - Greenhouse gas (GHG)emission trading
• Launch of the Chicago Climate Exchange, 2003
• Launch of the Chicago Climate FuturesExchange, 2004
• Water markets – in the Southwest and the GreatLakes

Why Carbon Emissions Trading?
• Proven, least-cost, and comprehensive tool for managingemissions: (CCX as an Emissions Management System)
• Environmental stewardship that rewards environmentalinnovation and strategic planning
• Flexibility, market efficiencies
• Multiple successes: US SO2, lead phase-out (gasoline), NOx,ETS
• Enhances coherent management practices and technologicalinnovation
• Establish value to scare resource
• Carbon price signal
• Reveals hidden assets and hidden costs throughoutoperations

What is the Chicago ClimateExchange?
• The Chicago Climate Exchange (CCX ®) is a
– financial institution which administers the
– world’s first and North America’s only voluntary,legally binding cap and trade system to reduceemissions of all six greenhouse gases, with offsetprojects in North America and worldwide

Role of Price Discovery
• To stimulate inventive activity
• To reorganize corporate financial decision-making
• To monetize hidden assets

Environmental Markets on the Horizon
Water• Western United States
– Snowpack could be reduced by 25% by 2050 in California dueto climate change
– Colorado River delivery system fully allocated and on the brinkof failure
– Runoff declining while demand is increasing
– Water already extensively litigated with more to come
• Northern China
– Has been warned of a water crisis by 2030 when per capitaconsumption is expected to fall below the internationallyrecognized standard for shortage
– Rivers are heavily polluted
– Agriculture impossible in certain regions

Environmental Markets on the Horizon
Water• Middle East
– Water scarcity a significant political issue
– Need to develop peaceful, sustainable solutions between Jordan, Syria,Israel, Palestine, other countries
– Great need for a comprehensive water plan for the countries to sharethe resource
• Africa
– Climate change anticipated to reduce precipitation in regions near theequator
– Water quality problems lead to millions of deaths by infants every year
• Non GHG Pollutants
• Wildlife and Endangered Species

Corporate credit is increasingly tradedin derivative form
0 200 400 600 800 1000 1200 1400
Investmentgrade creditbonds
Credit defaultswaps
US$ billions
Absolute growth (% of baseyear)
Compound Annual GrowthRate
2002
2006
200%
32%
2002
2006
-10%
-2%
Investment grade credit bonds vs. credit default swap trading volumes
North America
Source: Greenwich Associates

Derivatives are de-riskingthe mortgage market
Mortgage derivatives vs. securities volumes
U.S.
Source: Bond Market Association, Isda
Absolute growth (% of baseyear)
Compound Annual GrowthRate
US$ billions
2006
2007F
2007F
2005
2000
191%
519%
87%
191%
149%
11%
0 100 200 300 400 500 600 700 800 900 1000
New Issuanceof AgencyMBS
Volume of Single-name ABS CDSTraded
Volume of ABXTraded
2006

Risk-transfer technology is freeing-upcapital for corporate financing
Source: Bond Market Association, Isda
US$ billions
Absolute growth (% of base year) Compound Annual Growth Rate
2000
2000
2000
2007F
2007F
2007F
633%
3210%
342%
33%
24%
65%
0 50 100 150 200 250 300 350
New IssuanceVolumes for allCDOs
New IssuanceVolumes forStructuredProducts
New IssuanceVolumes for allCLOs

The Role of Risk-transfer Technologyin Meeting the Challenges of Climate Change
United Nations Framework Convention on Climate Change
MT millions
0
20
40
60
80
100
120
140
Q1' 05 Q2' 05 Q3' 05 Q4' 05 Q1' 06 Q2' 06 Q3' 06 Q4' 06 Q1' 07
Cumulative Estimated Annual Reductions of Registered projects since 1/1/05
Cumulative CER issuance since 1/1/05

The Role of Risk-transfer Technologyin Meeting the Challenges of Climate Change
United Nations Framework Convention on Climate Change
Registered project activities by host party, Total: 632