financial instability and the fed’s crisis response
TRANSCRIPT

Financial Instability and the Fed’s Crisis Response
James Andrew Felkerson
Bard College

Fed Balance Sheet 2008-
0
500
1000
1500
2000
2500
3000
3500
4000
4500
5000
20
08
-01
-02
20
08
-03
-12
20
08
-05
-21
20
08
-07
-30
20
08
-10
-08
20
08
-12
-17
20
09
-02
-25
20
09
-05
-06
20
09
-07
-15
20
09
-09
-23
20
09
-12
-02
20
10
-02
-10
20
10
-04
-21
20
10
-06
-30
20
10
-09
-08
20
10
-11
-17
20
11
-01
-26
20
11
-04
-06
20
11
-06
-15
20
11
-08
-24
20
11
-11
-02
20
12
-01
-11
20
12
-03
-21
20
12
-05
-30
20
12
-08
-08
20
12
-10
-17
20
12
-12
-26
20
13
-03
-06
20
13
-05
-15
20
13
-07
-24
20
13
-10
-02
20
13
-12
-11
20
14
-02
-19
20
14
-04
-30
20
14
-07
-09
20
14
-09
-17
Total Assets
Loans
Federal Ageny Debt Securities
Agency MBS
Treasuries
Repo
Other Credit

Introduction
• Two tools:– Interest Rates
– Large Scale Asset Purchases (LSAPs)• So-called “QE”
• My interest is with the effects of LSAPs on systematic risk.
• Interest rates come into the picture and may be important for other reasons, but will not be emphasized here.

Interest Rates Since the Crisis
0.00
1.00
2.00
3.00
4.00
5.00
6.00
7.00
20
08
-01
-01
20
08
-04
-01
20
08
-07
-01
20
08
-10
-01
20
09
-01
-01
20
09
-04
-01
20
09
-07
-01
20
09
-10
-01
20
10
-01
-01
20
10
-04
-01
20
10
-07
-01
20
10
-10
-01
20
11
-01
-01
20
11
-04
-01
20
11
-07
-01
20
11
-10
-01
20
12
-01
-01
20
12
-04
-01
20
12
-07
-01
20
12
-10
-01
20
13
-01
-01
20
13
-04
-01
20
13
-07
-01
20
13
-10
-01
20
14
-01
-01
20
14
-04
-01
20
14
-07
-01
30yr Conventional Mortgage
Effective Fed Funds Rate
10yr Treasury Constant Maturity
Target FF (Upper band)

LSAPs Since the Crisis
• Contention between the distinction between “pure QE” and LSAPs (credit easing)
• From Bernanke, “The Crisis and the Policy Response:– “…in a pure QE regime the focus of policy is the
quantity of bank reserves; the composition of loans and securities on the asset side of the central bank’s balance sheet is incidental.”
– “In contrast, the Federal Reserve’s credit easing approach focuses on the mix of loans and securities it holds and on how this composition of assets affects credit conditions for households and businesses.”
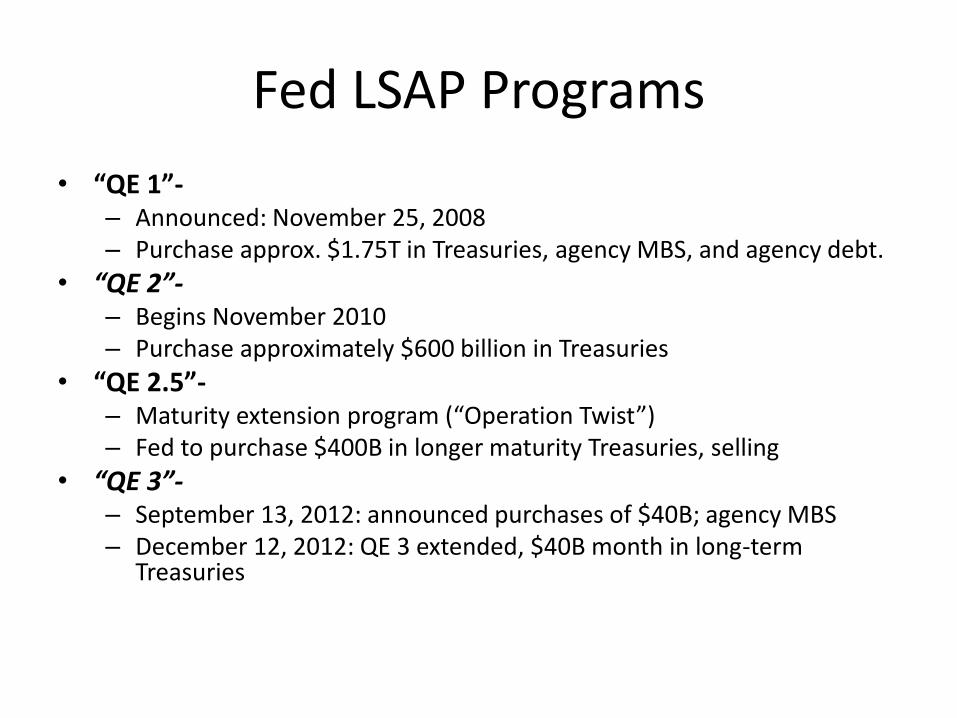
Fed LSAP Programs
• “QE 1”-– Announced: November 25, 2008– Purchase approx. $1.75T in Treasuries, agency MBS, and agency debt.
• “QE 2”-– Begins November 2010– Purchase approximately $600 billion in Treasuries
• “QE 2.5”-– Maturity extension program (“Operation Twist”)– Fed to purchase $400B in longer maturity Treasuries, selling
• “QE 3”-– September 13, 2012: announced purchases of $40B; agency MBS– December 12, 2012: QE 3 extended, $40B month in long-term
Treasuries

Global LSAP Programs
Central Bank Peak size (billion USD) Share of economy (%)
Federal Reserve $3,152 22.1
BOE $596 26.3
ECB $432 3.5
BOJ $2,193 37.3
Source: Fawley and Neely, 2013, “Four Stories of Quantitative Easing”***Numbers as of end of 2012***

MBS Issuance 1996-
0.0
500.0
1000.0
1500.0
2000.0
2500.0
3000.0
3500.0
4000.0
1996 1997 1998 1999 2000 2001 2002 2003 2004 2005 2006 2007 2008 2009 2010 2011 2012 2013
Total mortgage-related issuance
Agency MBS
Agency CMO
Nonagency MBS

85
90
95
100
105
1101
/3/1
1
2/3
/11
3/3
/11
4/3
/11
5/3
/11
6/3
/11
7/3
/11
8/3
/11
9/3
/11
10
/3/1
1
11
/3/1
1
12
/3/1
1
1/3
/12
2/3
/12
3/3
/12
4/3
/12
5/3
/12
6/3
/12
7/3
/12
8/3
/12
9/3
/12
10
/3/1
2
11
/3/1
2
12
/3/1
2
1/3
/13
2/3
/13
3/3
/13
4/3
/13
5/3
/13
6/3
/13
7/3
/13
8/3
/13
9/3
/13
10
/3/1
3
11
/3/1
3
12
/3/1
3
1/3
/14
FHLMC 30yr Pass Throughs, Last and Fed Purchase Prices
2.5 last 3.0 last 3.5 last 4.0 last 4.5 last 2.5 purchase 3.0 purchase 3.5 purchase 4.0 purchase 4.5 purchase
85
90
95
100
105
1101
/3/1
1
2/3
/11
3/3
/11
4/3
/11
5/3
/11
6/3
/11
7/3
/11
8/3
/11
9/3
/11
10
/3/1
1
11
/3/1
1
12
/3/1
1
1/3
/12
2/3
/12
3/3
/12
4/3
/12
5/3
/12
6/3
/12
7/3
/12
8/3
/12
9/3
/12
10
/3/1
2
11
/3/1
2
12
/3/1
2
1/3
/13
2/3
/13
3/3
/13
4/3
/13
5/3
/13
6/3
/13
7/3
/13
8/3
/13
9/3
/13
10
/3/1
3
11
/3/1
3
12
/3/1
3
1/3
/14
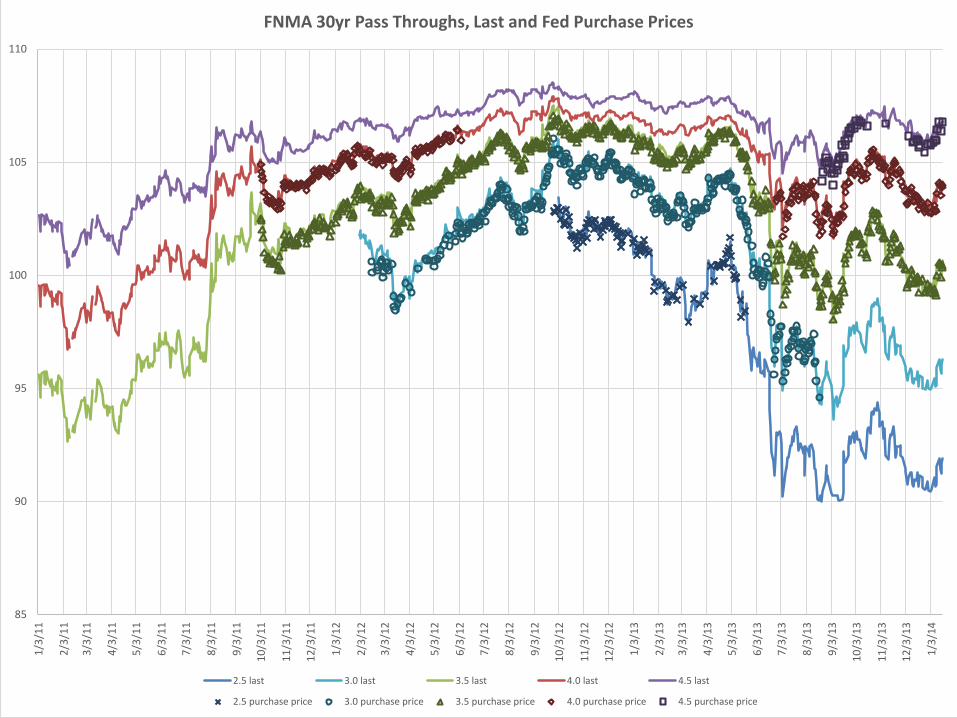
FNMA 30yr Pass Throughs, Last and Fed Purchase Prices
2.5 last 3.0 last 3.5 last 4.0 last 4.5 last
2.5 purchase price 3.0 purchase price 3.5 purchase price 4.0 purchase price 4.5 purchase price

90
95
100
105
110
1151
/3/1
1
2/3
/11
3/3
/11
4/3
/11
5/3
/11
6/3
/11
7/3
/11
8/3
/11
9/3
/11
10
/3/1
1
11
/3/1
1
12
/3/1
1
1/3
/12
2/3
/12
3/3
/12
4/3
/12
5/3
/12
6/3
/12
7/3
/12
8/3
/12
9/3
/12
10
/3/1
2
11
/3/1
2
12
/3/1
2
1/3
/13
2/3
/13
3/3
/13
4/3
/13
5/3
/13
6/3
/13
7/3
/13
8/3
/13
9/3
/13
10
/3/1
3
11
/3/1
3
12
/3/1
3
1/3
/14
GNMA I 30yr Pass Throughs, Last and Fed Purchase Prices
3.0 close 3.5 close 4.0 close 3.0 purchase price 3.5 purchase price 4.0 purchase price
0.0%
10.0%
20.0%
30.0%
40.0%
50.0%
60.0%
70.0%
80.0%
90.0%
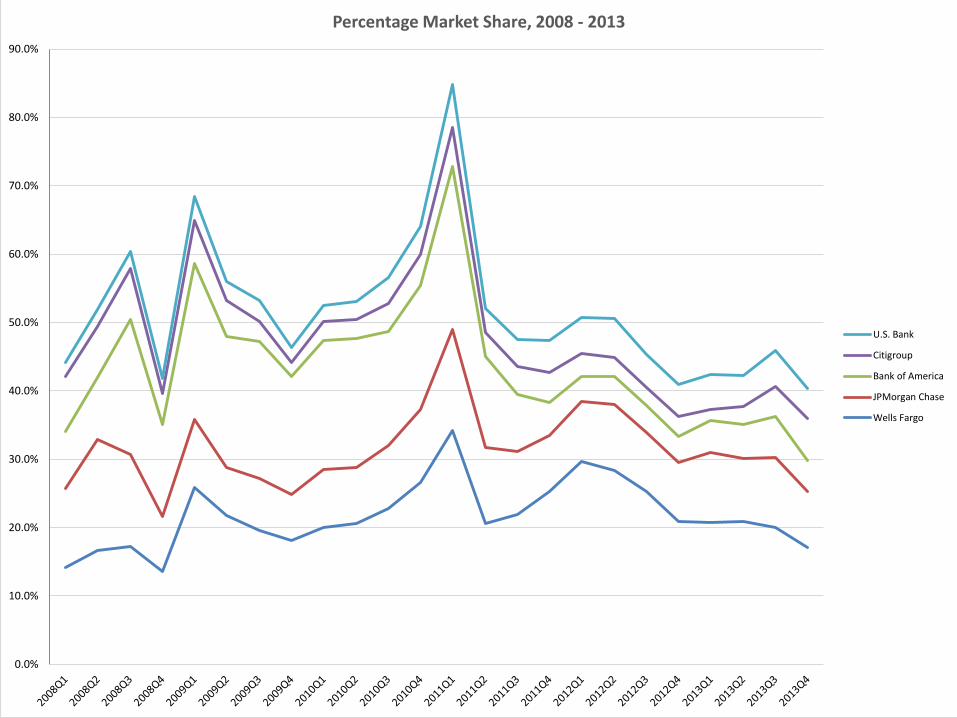
Percentage Market Share, 2008 - 2013
U.S. Bank
Citigroup
Bank of America
JPMorgan Chase
Wells Fargo

0.0
100.0
200.0
300.0
400.0
500.0
600.0
700.0
800.0
900.0
1000.0
Total Quarterly Mortage Orginations, in billions
Total originations
U.S. Bank
Citigroup
Bank of America
JPMorgan Chase
Wells Fargo
0%
10%
20%
30%
40%
50%
60%
70%
80%
90%
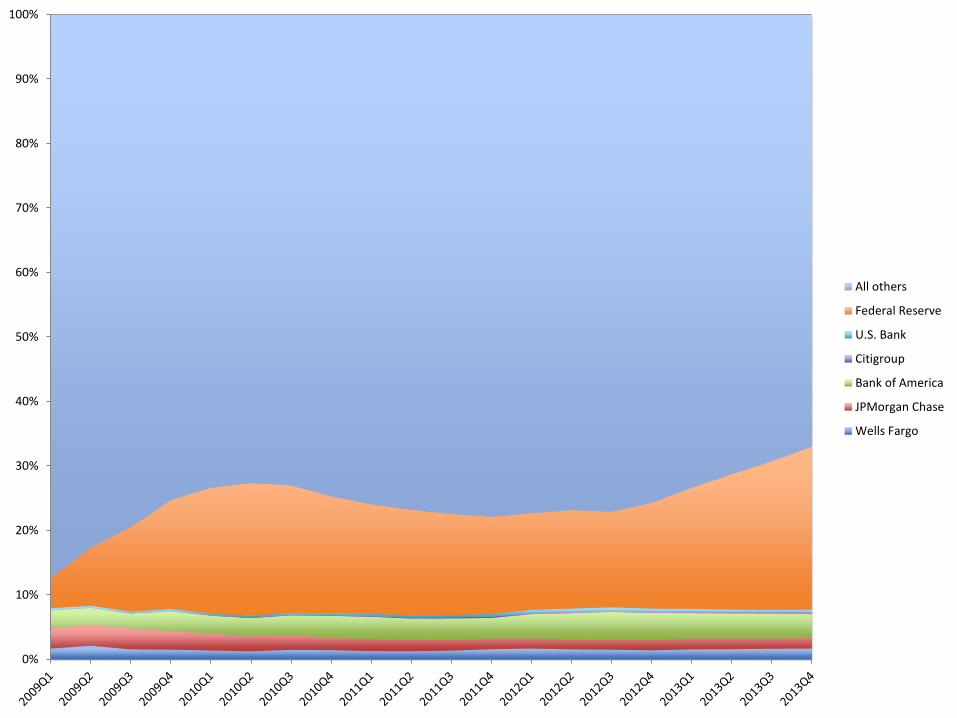
100%
All others
Federal Reserve
U.S. Bank
Citigroup
Bank of America
JPMorgan Chase
Wells Fargo

0.0%
5.0%
10.0%
15.0%
20.0%
25.0%
30.0%
35.0%
40.0%
45.0%
50.0%
Percentage of Total U.S. Depository Institution Agency MBS Holdings by Five Largest Mortgage Originators
C
USB
JPM
WFC
BAC

0.000
0.200
0.400
0.600
0.800
1.000
1.200
1.400
1.600
1.800
2.000
Ratio of Agency MBS UPB to Total Equity (Regulatory) Capital
Wells Fargo
JP Morgan
Bank of America
Citigroup
US Bank
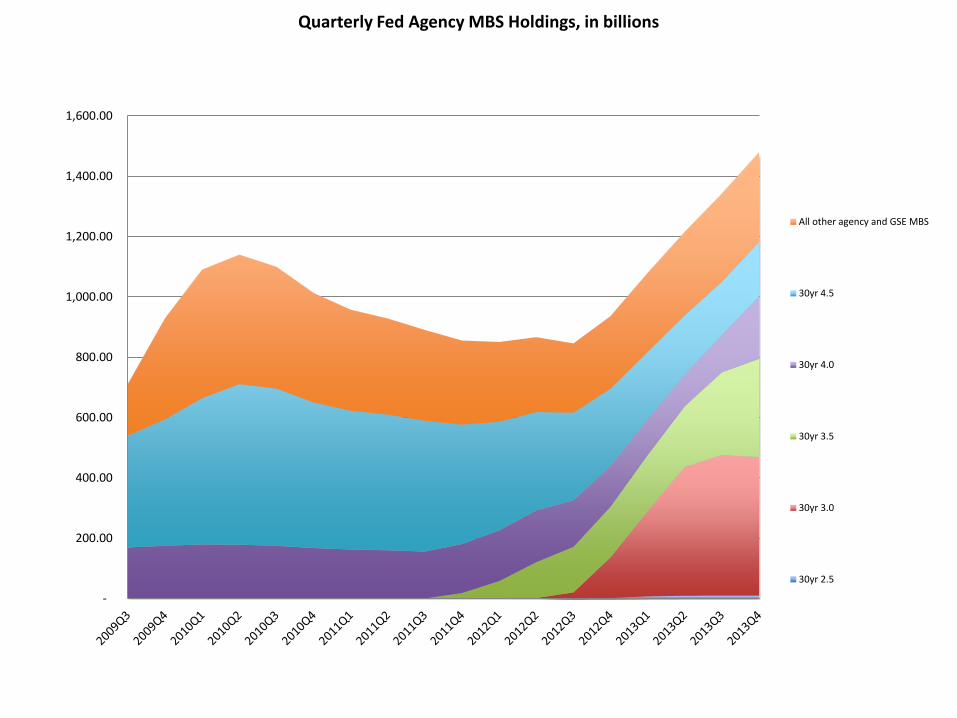
-
200.00
400.00
600.00
800.00
1,000.00
1,200.00
1,400.00
1,600.00
Quarterly Fed Agency MBS Holdings, in billions
All other agency and GSE MBS
30yr 4.5
30yr 4.0
30yr 3.5
30yr 3.0
30yr 2.5
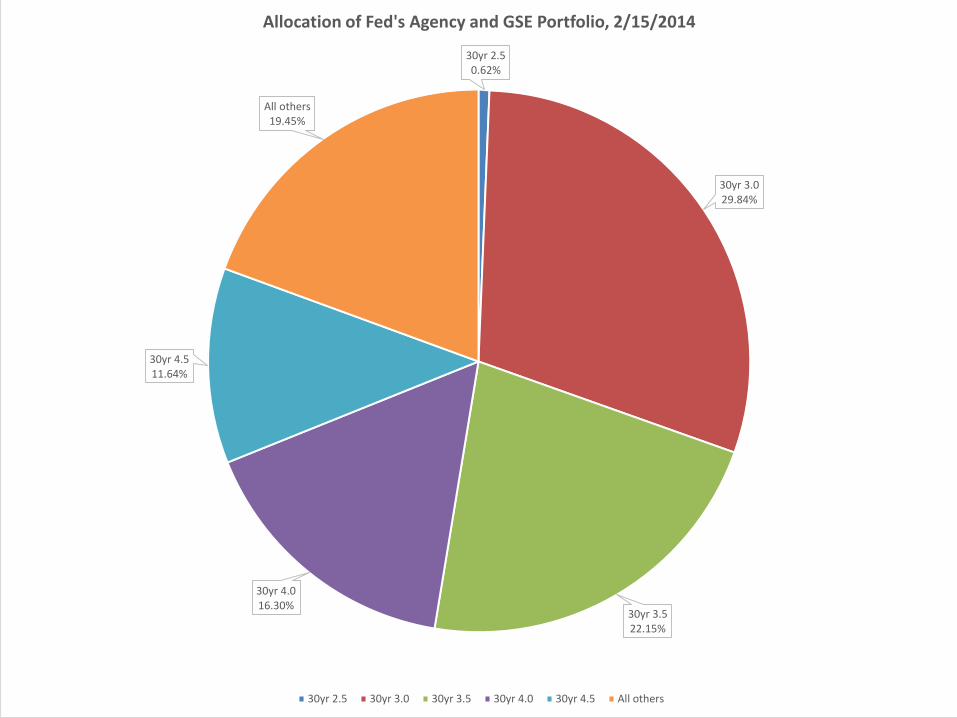
30yr 2.50.62%
30yr 3.029.84%
30yr 3.522.15%
30yr 4.016.30%
30yr 4.511.64%
All others19.45%
Allocation of Fed's Agency and GSE Portfolio, 2/15/2014
30yr 2.5 30yr 3.0 30yr 3.5 30yr 4.0 30yr 4.5 All others

-12.00% -10.00% -8.00% -6.00% -4.00% -2.00% 0.00% 2.00%
FNMA 30yr 2.5
FHLMC 30yr 2.5
FNMA 30yr 3.0
FHLMC 30yr 3.0
GNMA 30yr 3.0
GNMA 30yr 2.5
GNMA 30yr 3.5
FHLMC 30yr 3.5
FNMA 30yr 3.5
GNMA 30yr 4.0
FNMA 30yr 4.0
FHLMC 30yr 4.0
GNMA 30yr 4.5
FNMA 30yr 4.5
GNMA 30yr 6.0
FHLMC 30yr 4.5
GNMA 30yr 6.5
GNMA 30yr 5.0
GNMA 30yr 5.5
FHLMC 30yr 5.0
FNMA 30yr 5.0
FNMA 30yr 6.5
FHLMC 30yr 5.5
FNMA 30yr 5.5
FHLMC 30yr 6.5
FNMA 30yr 6.0
FHLMC 30yr 6.0
% Gain/ Loss GSE and Agency Pass Throughs
% Change from 1/1/2013 % Change from 1/1/2012

Final Considerations
• Must consider Treasury/Congress actions: most importantly the significant increase in conforming loan limits during crisis; allowed banks to move mortgages off balance sheet.
• But, the Fed encouraged the production of mortgages, which benefits banks:– By providing a residual buyer– By protecting banks initially from contraction
(prepayment) risk and, now, from extension (contraction risk)
• But, in the end, are we done with Fed intervention in mortgage markets?