financial integration and scope efficiency post...
TRANSCRIPT

1
FINANCIAL INTEGRATION AND SCOPE EFFICIENCY POST GRAMM-LEACH-BLILEY
November 2007
ABSTRACT
The Gramm-Leach-Bliley Act of 1999 removed barriers that forced separation between commercial banks, investment banks, and insurance companies in the U.S., and promised the most fundamental reform in U.S. financial services regulation in more than half a century. By constructing a unique dataset that links the U.S. banking and insurance regulatory datasets, we firstly identify domestic “assurbanks” (insurers owning banks), “bancassurers” (banks owning insurers), and the unique subsidiaries licensed as commercial banks, thrifts, or insurance companies. We then estimate efficiency effects from the economies of scope across the two formally separate sectors by estimating multi-product costs, revenue, and profit functions. The empirical evidence suggests that a significant number of cost scope diseconomies, revenue scope economies, and weak profit scope economies exist in the post-GLB U.S. integrated banking and insurance sectors. The scope economies are variant among firms, and certain firm characteristics (size, business portfolio, geographic diversification, product mix and diversification, insurance distribution system, and X-efficiency) are the determinants of scope economies.
JEL Classification: G21, G22, L25 Key Words: Financial Services Integration; Gramm-Leach-Bliley Act; Economy of Scope
Yuan Yuan
Assistant Professor Department of Finance & Business Law University of Wisconsin – Whitewater
Whitewater, WI 53190 [email protected]
1-262-472-5458 (office) 1-262-472-4863 (fax)
Richard D. Phillips Chair, Bruce A. Palmer Professor of RMI
Department of Risk Management & Insurance Georgia State University
Atlanta, GA 30302 [email protected]
1-404-413-7478 (office) 1-404-413-7499 (fax)
Note: This paper is preliminary and for discussion purposes only. Please do not cite or quote without permission of the authors.

2
1. INTRODUCTION AND MOTIVATION
When the landmark financial service reform legislation, the Financial Service Modernization
Act1 (known as the Gramm-Leach-Bliley Act), was passed in 1999, it was viewed as the
culmination of years of effort to reform the U.S. financial service industry and the most
significant legislation in decades to affect the financial service industry. Gramm-Leach-Bliley
Act (GLB) repealed the 66-year old Glass-Steagall Act (GSA) of 19332 and eliminated the
restrictions on affiliation between commercial banks and investment banks. GLB substantially
modified the 43-year old Bank Holding Company Act (BHCA) of 19563 and removed barriers
which forced separation between commercial banks and insurance companies.
The potential for GLB to have a profound impact on financial services providers were
great, and as the end of 2003—under the GLB Act—more than 600 companies operated as
Financial Holding Companies (FHC), which represented 78 percent of the total assets of all Bank
Holding Companies (BHC). In addition, more than 1,300 FHCs/BHCs became engaged in
insurance agency or underwriting activities under the Act. By the end of 2003, more than 2,500
insurance companies (either through agents or through risk bearing underwriters) were affiliated
with commercial banks and thrift institutions.4 Today, financial service consumers can choose
from a broadening array of financial tools and from companies either aiming to serve their
multiple needs or companies specializing in one or two types of financial products. Thus, looking
at GLB on a superficial level, given the changes that had already taken place, it appears to have
produced radical changes in the U.S. insurance and banking industries.
1 Pub. L. 106-102, 113 Stat. 1338 (1999). 2 Pub. L. 66, 48 Stat. 162 (1933). 3 Ch. 240, 70 Stat. 133 (1956). 4 BHC Statutory Financial Report (multiple years); Federal Reserve Report to Congress, 2003
3
Over time, the financial industry headed towards consolidation. Such convergence was
spurred by the changes that had been taking place in the market since the 1980s, including
advancing technology, financial innovations, increased competition, changing customer’s needs,
financial globalization, and deregulation in other industrialized countries. Financial services
institutions wanted to offer a broad array of financial products and services. The country
advanced financial reform in spite of the lack of financial modernization legislation. The Office
of the Comptroller of Currency (OCC) began to explore the possible expansions of bank
insurance power.5 The Office of Thrift Supervision (OTS) liberally granted thrift charters. In
addition, industry leaders moved forward on their own. The merger of Travelers and Citicorp in
1998 increased the pressure on Congress to pass the financial services modernization act.6
When GLB passed, it was expected to spur waves of cross-sector mergers (M&As).
However, massive cross-sector M&As did not occur. Instead, banks bought specialized securities
firms and acquired insurance agencies and brokerages rather than acquiring insurance
underwriting companies as had been predicted. Banks now control some of the largest insurance
brokerages companies. Insurance companies applied for new thrift charters instead of
commercial bank charters. After GLB, some firms even chose to de-converge. In 2002, Citigroup
spun off the property/casualty insurance unit of Travelers, and St. Paul Companies bought the
insurance unit from Citigroup in 2003. Later in 2005, Citigroup announced it was selling
Travelers Life & Annuity to MetLife. The different activities of financial institutions following
GLB and the effects we observed in the market raise important policy and research questions on
the motivations and consequences of financial services integration.
5 For example, based on Section 92 of the National Banking Act, OCC Interpretive Letter 366 (1986) stated that national banks may sell insurance to customers residing outside small towns where their main offices or branches were located. 6 Citicorp and Travelers Group announced their merger on the morning of April 6, 1998. The combined company was named Citigroup (“Citicorp, Travelers Group to merger,” Dow Jones Newswires, 6 April 1998 at 7:03 a.m.).
4
Debates exist among researchers about the motives for financial diversification. One of
the important elements in the current debate is the effect integration has on the efficiency of
financial institutions. Since the 1990s, substantial research has been devoted to measuring the
productive efficiency of financial institutions, particularly in commercial banks. Literally
hundred of studies have been conducted to estimate various measures of efficiency of financial
institutions located in more than two-dozen countries.7 However, there is little research on the
efficiency effects of integrating providers of different categories of financial services into
universal-type organizations. The little evidence that exists is extrapolated either from scope
efficiency within one sector of the financial industry, e.g., the commercial banking (Berger,
Hanweck, and Humphrey, 1987; Berger, Hancock, and Humphrey, 1993; Berger, et al. 1996) or
the insurance industry (Grace and Timme, 1992; Berger, et al. 2000), or from simulations of risk
diversification benefits of diversifying integration in the absence of synergistic gains (Boyd,
Graham and Hewitt, 1993; Allen and Jagtiani, 2000; Lown, Osler, Strahan, and Sufi, 2000).
The purpose of this paper is to provide the first set of evidence to inform this debate. In
this research, we estimate economies of scope of the cross-sector integration in the post-GLB
U.S. financial services industry across costs, revenue and profit measures. Gains from exploiting
scope economies and product mix efficiencies are often cited as motives for financial institution
integration. Scope efficiency gains can be created by sharing such physical inputs as computers,
furniture, or offices; employing common information systems, distribution systems, or
investment departments; reusing managerial expertise; providing consumption
complementarities (“one-stop shopping”) to customers. However, scope diseconomies may also
arise at the same time because of higher administration and coordination expenses,
7 Berger and Humphrey (1997) critically reviewed more than 130 studies and summarized empirical efficiency estimates of financial institutions in 21 countries.

5
organizational diseconomies, cross-subsidization in internal capital markets, or they may arise
because of the loss of specialized expertise for customers needing tailored products.
We utilize a two-stage econometric method to investigate economies of scope. The
analysis proceeds as follows. We first estimate costs, revenue, and profit scope economy scores
using econometric functions. Then, in the second stage, the scores from the first stage are
regressed upon a set of variables describing firm characteristics.8 The second stage regression
allows us to test whether scope economies exist for firms jointly producing financial products
across multiple sectors and allows us to explain the variation of scope economy estimations.
A likely reason empirical research on the integration of the banking and insurance sectors
is so scarce is because the regulatory data sets available to study this issue are product specific,
and there is no convenient way to identify companies affiliated with one another across sectors.
Thus, the first effort in our study is to construct a unique dataset which links the insurance
regulatory data sets with the bank regulatory data sets. The combined data set exists for financial
conglomerates (bancassurers and assurbanks), specialist banks, and specialist insurers in the U.S.
banking and insurance industry during the years 2003, 2004, and 2005.
This paper is organized as follows: Section 2 discusses GLB and its effects on the U.S.
banking and insurance industries. Section 3 discuss the concept of scope economies and reviews
the literature. Section 4 describes the construction of the dataset. In Section 5, we develop the
testable hypotheses. Section 6 explains the estimation methodologies and outlines the estimation
of inputs, outputs, and prices. Section 7 reports the scope economies estimation results and
discusses the regression results. Section 8 offers conclusions.
8 The two-stage procedure has been used in literature explaining the differences in efficiency. For example, bank studies include Aly et al. (1990), Berger et al. (1993), Pi and Timme (1993), Kwan and Eisenbeis (1995), Mester (1996), and Berger and Hannan (1998); Thrift institution studies include Cebenoyan et al. (1993a, 1993b), Mester (1993), and Hermalin and Wallace (1994); Insurance studies include Garder and Grace (1993), Berger et al. (2000), and Cummins et al. (2003).

6
2. U.S. FINANCIAL INTEGRATION AND GLB ACT
Prior to 1999, U.S. financial services were statutorily separated into three broad sectors: banking,
insurance, and securities. The securities sector was one area of the financial services industry that
exhibited significant crossover with banks.9 Unlike affiliations between banks and securities
companies, affiliations between banks and insurance companies have been highly restricted since
the early 1900s. GLB totally lifted barriers which restricted competition across financial sectors.
Because of the lack of data for security firms relevant to insurance and banking, this paper
focuses on the integration across U.S. banking and insurance sectors.
2.1. DEFINITION OF BANCASSURANCE AND ASSURBANKING
A financial conglomerate is commonly defined as any group of companies under common
management control that provides services, predominantly in two or more of the three major
financial services sectors.10 We differentiate between bank-initiated and insurer-initiated financial
conglomerates and, therefore, define bancassurance and assurbanking as follows: Bancassurance is
the process of a bank selling insurance products manufactured by insurance subsidiaries that are
owned by the bank, either through its own distribution channels or through outside agents.
Assurbanking is the process of an insurance company selling banking products manufactured by
banking subsidiaries that are owned by the insurer. Instead of focusing on distribution and cross-
selling, our definition focuses on the manufacturing of cross-sector financial service product, and
encompasses integration of production, management, and controlling rights.
Financial services integration is broadly defined as a financial service group's participation in
more than one of the major sectors of the financial service industry either in-house or through
9 The Glass-Steagall Act of 1933 prohibited banks from principally engaging in underwriting securities. However, in 1986 the FRB eased these restrictions by raising the limits of bank-ineligible securities activities to 5 percent of BHC’s total revenue. The revenue limit was raised to 10 percent in 1989 and to 25 percent in 1996. These securities subsidiaries are called “Section 20 companies.” 10 Skipper and Kwon (2007), p. 656.

7
separately capitalized subsidiaries. We further classify financial service integration as being either
within-sector integration or cross-sector integration. Within-sector integration involves offering
multiple financial products within the same sector of the financial industry. Cross-sector integration
involves offering a broad range of financial products in two or more sectors of the financial
industry.11
2.2. GRAMM-LEACH-BLILEY ACT OF 1999
On November 12, 1999, Gramm-Leach-Bliley Act was signed into law. The law allowed banks
of all sizes to be able to offer their customers a wide range of financial products and services
manufactured by the same financial service conglomerate. In addition, other types of financial
companies – insurance and securities companies, or even, financial technology companies were
able to more readily form into a single financial operation. Numerous financial products across
sectors were now permitted to be manufactured under one roof.
2.2.1. IMPACT ON BANKS ENTERING INSURANCE
GLB provides two vehicles to allow financial institutions to engage in new types of financial
activities or to affiliate with other financial companies: financial holding companies (FHCs) and
financial subsidiaries. FHCs, the more flexible of the two possibilities, may engage in new
activities that are financial in nature, including banking, merchant banking, securities, insurance
underwriting or agency through a holding company affiliate regulated by the Federal Reserve
Board (FRB). BHCs can apply and elect to be FHCs and then conduct all activities permitted
under GLB and BHCA. As of March 11, 2000, the date GLB went into effect, the FRB
announced the list of the first 117 FHCs.12
11 Within-sector integration occurs when, for example, a commercial bank expands its banking business by acquiring another commercial bank, or an insurance holding company owning only life insurance subsidiaries acquires a property-liability insurance company. Cross-sector integration occurs when, for example, a bank holding company launches an insurance subsidiary, or an insurance group offers banking products through its banking subsidiaries. 12 Federal Reserve Board statistic release.

8
GLB provides banks with the alternative of using a subsidiary rather than an FHC for
conducting new financial activities. A financial subsidiary, which can engage in most of the
newly-authorized activities, must be a direct subsidiary of a bank. The most important difference
between the FHC and the financial subsidiary is that the latter is prohibited from engaging in
certain financial activities as a "principal.”13 Under GLB, neither a national bank nor its
subsidiaries may underwrite insurance unless underwriting was permitted by the OCC rulings
before January 1, 1999. National banks may still act as an insurance agent in offices of the
national bank located in a place of less than 5,000 inhabitants. The new insurance underwriting
restrictions for national banks in GLB also restrict the underwriting ability of state banks. In
general, state banks are prohibited by the Federal Deposit Insurance Corporation Improvement
Act of 1991 (FDICIA) from engaging in insurance underwriting even if permitted under state
law, except to the extent that the activity is permitted for national banks.
The GLB Act substantially expands the ability of a bank to affiliate with any financial
institution, such as an insurance company or a security firm. However, with limited exceptions,
GLB withholds the longstanding prohibition on a bank affiliating with commercial companies.
Recognizing that thrift institutions have become much more like banks, GLB also prohibits a
commercial company from affiliating with a thrift institution and specifically acquiring a thrift
institution through the "unitary thrift holding company" vehicle.14
2.2.2. IMPACT ON INSURERS ENTERING BANKING
An insurance company and its holding company may take advantage of GLB and apply to
become an FHC so that it may begin manufacturing banking products. If an insurance company
13 The prohibited activities are insurance underwriting and annuity issuance, real estate development or investment, and merchant banking. 14 GLB grandfathers any commercial company that was a unitary thrift holding company as of May 4, 1999 or had an application pending at the OTS to become a unitary thrift holding company as of that date.

9
elects to become an FHC, it may continue to engage in all prior lawful non-banking activities in
which it was engaging as of September 30, 1999. In addition, insurance companies still have the
option to expand into the banking industry through the vehicle of saving and loan holding
companies (SLHC). Following GLB, the OTS ruled that SLHCs are eligible under GLB to
engage in the same list of financial activities permissible for FHCs.15
Since the passage of GLB, the majority of insurers that have entered the banking sector
have done so by using SLHCs instead of FHCs. By 2005, more than 40 insurers were approved
by the OTS as SLHCs and engaged in banking business through their thrift subsidiaries.16 Only
one insurance company, MetLife, chose to become an FHC and own a small commercial bank.
The most likely reason for this is the regulatory burden. FHCs and commercial banks are
regulated by various regulators. For example, federally chartered commercial banks are regulated
by the OCC; state chartered commercial banks are regulated by the state banking regulatory
authorities; insured banks are also monitored by FDIC; FHCs are regulated by the Federal
Reserve. However, the only regulator for thrifts and SLHCs is the OTS. In addition, thrifts have
much more freedom in establishing branches and offices nationwide. Thrifts may do business in
any state without restrictions. In order to expand business to other states, commercial banks have
to meet different requirements imposed by different states, e.g., branch restrictions.
Another aspect of GLB, which facilitates insurance companies’ entry into banking via an
FHC, is the provision permitting mutual insurance companies to re-domesticate to another state
for the purpose of converting to a stock company. An insurance company organized in a mutual
organizational form may wish to convert to a stock company form to obtain access to equity
capital and related financing alternatives (convertible debentures, warrants, or preferred stock)
15 Federal Register, November 8, 2001 issue. 16 Thrift Holding Company Structure Report. For example: State Farm owned Sate Farm Bank; Allstate owned Allstate Bank; American International Group owned AIG Federal Saving Bank.

10
from the capital market. These financial alternatives are necessary to expand the financial
activities under the new powers (Viswanathan and Cummins, 2003; Butler, Cui, and Whitman,
2000; Cagle, Lippert, and Moore 1996). Such demutualization can also provide enhanced
corporate structure flexibility and make it possible for mutual insurance companies to affiliate
with other financial institutions. GLB eases the process of converting the status of a company by
permitting a mutual insurance company to easily re-domesticate to a state with laws favorable for
conversion to the stock company form of ownership.
3. SCOPE ECONOMIES IN FINANCIAL SERVICES:
A SURVEY OF THE EVIDENCE
One of the important elements in the current debate is the effect integration has on the efficiency
of financial institutions. The most commonly quoted source of potential gains from cross-sector
integration is the exploitation of scope economies (Herring and Santomero, 1990; Calomiris,
1998; Berger, 2000; Yeager, Yeager and Harshman, 2004). The scope efficiency gains can be
created, for example, by providing customers the consumption complementarities (“one-stop
shopping” convenience); sharing such physical inputs as computers, furniture, or offices;
employing common information systems, distribution systems, or services department; reusing
managerial expertise. However, scope diseconomies may also arise at the same time because of
organizational diseconomies, higher administration and coordination expenses, principal-agent
conflicts, cross-subsidization in internal capital markets, or losing specialization expertise when
customers need specially tailored products. Therefore, it is particularly important to evaluate
scope efficiencies of financial conglomerates (e.g., bancassurers and assurbanks).
3.1. COST SCOPE ECONOMIES

11
Cost scope economies refer to the reduction of the average total production costs through the
production of a wider variety of goods or services. For cross-sector integration, cost scope
economies may be realized from the sharing of physical inputs such as computers, software,
furniture, or offices; reusing managerial expertise and experience; raising external capital at
lower costs because of reduced risks; and employing common service functions, such as
distribution, advertisement, or investment. One of the most desirable things about joint
production is that commercial bank and insurer integration may lower total costs by cross-selling
and by using a joint customer database and using information at a lower cost.17 However, cost
scope diseconomies may also arise from the integration because of higher coordination and
administrative costs, and organizational diseconomies may arise when producing or distributing
a broad range of products.
Some studies exist estimating the cost scope efficiencies of providing multiple products
within a single financial institution. These studies evaluate cost scope economies of within-sector
products (e.g., commercial loans and consumer loans) rather than cross-sector products (e.g.,
commercial loans and life insurance policies). Within the U.S. banking sector, the evidence was
mixed and most studies found no substantial evidence of cost scope economies in commercial
banks or in savings and loans (e.g., Mester, 1987, 1993; Berger and Humphrey, 1991; Pulley and
Humphrey, 1993; Ferrier, et al., 1993; Jagtiani, Nathan, and Sick, 1995; and Rogers, 1998).18
Two papers found evidence of cost scope diseconomies arising from the coordination and
administrative costs of banks offering a broad range of products (Cebenoyan, 1990; Winton,
17 Jappelli and Pagano (2002) showed that by using a common information system or reusing gathered information, integrated financial institutions can diminish the adverse selection problem and reduce their default rate in credit markets. Mester, Nakamura and Renault (2002) offered empirical evidence showing that information gathered from different financial services gave an advantage to institutions that combined these services over other lending institutions. 18 See: Berger, Hanweck, and Humphrey (1987), Hunter, Timme, and Yang (1990), Goldberg et al., (1991), Noulas, Miller, and Ray (1993).

12
1999). As for the evidence in Europe, Cavallo and Rossi (2001) examined six EU countries and
found consistent cost scope economies at all production levels, suggesting that cost scope
economies can increase as banks move towards the universal banking model. Valverde and
Fernandez (2005) examined Spanish banks and found significant cost scope economies when
incorporating off-balance sheet business.
Within the insurance sector, Grace and Timme (1992) found no significant cost scope
economies for the largest 423 U.S. life insurance companies. Berger, Cummins, Weiss, and Zi
(2000) focused on both the U.S. life and property-liability insurance sectors for the period 1988-
1992 and found cost scope economies for firms jointly offered life and property-liability
insurance. A more recent paper by Cummins, Weiss, and Zi (2003) extended Berger et al. (2000)
and found no evidence of cost scope efficiencies for firms offering both life and property-
liability insurance in the U.S. insurance sector during the period 1993-1997.
In addition, Kellner and Mathewson (1983) found cost scope economies in the Canadian
life industry. Khaled, Adams, and Pickford (2001) concluded that small and medium-sized New
Zealand life insurance companies experienced cost scope diseconomies while the large-sized
companies had neither economies nor diseconomies of scope. Hirao and Inoue (2004) found
significant cost scope economies for Japanese property-liability insurers, and Toivanen (1997)
showed modest cost scope economies in the Finnish non-life insurance industry.
Although studies have investigated scope economies across lines of business within the
same sector of the U.S. financial services industry, no evidence exists on whether scope
economies exist for offering a wider variety of products across different financial sectors in the
U.S. Only a handful of studies provide evidence on scope economies of financial conglomerates
in the EU, with mixed results. Lang and Welzel (1998) found mostly diseconomies of producing

13
loans and investment-oriented services within German universal banks, and they found cost
scope economies only for small German banks. By searching for complementarities between
loans and investment-related products offered by universal banks, Allen and Rai (1996) showed
small scope economies for EU universal banking. Vander Vennet (2002) found limited evidence
of cost scope economies of universal banks in Europe.
3.2. REVENUE SCOPE ECONOMIES
Scope economies in revenue refer to the increases of total revenue resulting from the production
of different categories of services or products. Revenue scope economies may occur because of
consumption complementarities, otherwise called the demand super-additivity. By offering “one-
stop shopping” convenience, financial conglomerates can reduce consumers’ search and
transactions costs. Furthermore, some customers may be willing to pay more for the
convenience of “supermarket” shopping for their banking and insurance needs. Demand side
scope efficiency gains may arise by cross-selling a broad range of financial products or
integrating distribution systems. Reputation recognition can also lead to revenue scope
economies when the integration or consolidation associates itself with a strong brand name,
which customers recognize and prefer. By diversifying across products, financial conglomerates
may lower their risk if net cash flows are negatively correlated. In this sense, conglomerates may
realize revenue scope economies by charging higher prices because of lower bankruptcy and
financial distress costs. In addition, financial integration may also provide firms with market
power in pricing.
However, the existence of revenue scope diseconomies cannot be dismissed, especially if
the integration creates or enhances conflicts of interest. The conglomerate form of organization
can create internal capital markets, which may somehow worsen inefficient cross-subsidies and

14
investment inefficiencies arising from managerial agency problems (e.g., Jensen, 1993; Lamont,
1997; Shin and Stulz, 1998). Scharfstein and Stein (2000) reported inefficient cross-subsidies in
internal capital markets, which are often “socialist” in nature, whereby weaker divisions receive
subsidies from stronger ones. Thus, the failure of a subsidiary may endanger the other
subsidiaries and even the group as a whole.
Mester (1992) argued that the market would view problems in one subsidiary as signaling
problems in other subsidiaries and emphasized that BHCs have tended to rescue their failing
affiliates. In a financial conglomerate, catastrophic losses of one business line (e.g., property-
liability insurance) could be subsidized by other business lines (e.g., commercial banking). Thus,
commercial banking customers would worry about their savings and change to unaffiliated
banks. In this case, revenue scope diseconomies are more likely to occur. Revenue scope
diseconomies may also arise if specialists from different types of financial services have better
knowledge and expertise in their areas and can provide better-tailored products for customers,
and, thereby, charge higher prices than joint producers.
There exists little research investigating revenue scope efficiency effects of financial
services integration. The studies that do exist, again, are based on within-sector data (e.g.,
banking or insurance), and the results are inconclusive. Berger, Humphrey, and Pulley (1996)
and Noulas, Miller, and Ray (1993) found little or no evidence of revenue scope efficiency for
providing deposits and loans. In addition, both studies showed non-increasing revenue for
charging customers for joint consumption benefits. Berger, Cummins, Weiss, and Zi (2000)
found revenue scope diseconomies from providing life insurance and property-liability insurance
products by integrated insurers. However, using a more sophisticated estimation technique, a

15
more recent research by Cummins, Weiss, and Zi (2003) found weak evidence of revenue scope
economies in the U.S. insurance industry.
3.3. PROFIT SCOPE ECONOMIES
Profit scope economies generally refer to increased profits from producing a broader range of
products. Profit scope economies simultaneously consider both costs and revenues and,
therefore, reflect differences in product or service quality, which may not be measurable by
considering cost or revenue scope efficiency in isolation. For example, customers show their
preference for “one-stop shopping” by paying more for such consumption convenience, which
leads to revenue scope economies. However, financial conglomerates may incur additional
expenses in offering one-stop shopping convenience to their customers that leads to cost scope
diseconomies. So, revenue scope economies or cost scope diseconomies alone cannot explain the
net scope efficiency gain/loss from integrating different categories of financial products. In this
sense, profit scope economies dominate the more commonly used concept of cost and revenue
scope economies since estimation of profit scope economies incorporates both cost and revenue
efficiency effects.
Studies of profit scope efficiencies generally do not find consistent benefits of either joint
production or specialization either within the banking or the insurance industry. Studies typically
find that joint production was more efficient for some firms and specialization was more efficient
for others (Berger, Hancock, and Humphrey, 1993; Berger, et al. 2000; Cummins, Weiss, and Zi,
2003). Few studies analyzing profit efficiencies have found meaningful profit scope economies
among traditional deposit and loan outputs (Humphrey and Pulley, 1997; Rogers, 1998). Vander
Vennet (1999, 2002) studied universal banks in Europe and showed that universal banks
typically had both higher revenue and higher profitability than specialized banks. Vander Vennet

16
(1996) suggested that EU universal banks appear to be more profit efficient than non-universal
banks. Valverde and Fernandez (2005) examined Spanish banks and found significant profit
scope economies when the banks incorporated off-balance sheet business.
4. CONSTRUCTION OF THE BANKING/INSURANCE DATABASE
The regulatory data sets in the U.S. covering financial service firms are product specific, with no
convenient way to identify affiliations among companies across different product lines. Thus,
one of the main efforts in this paper is to construct a linking variable that allows us to match the
unique company identifiers between the insurance and bank regulatory data sets.
The data come from a variety of sources. The variable we develop links the unique
company identifiers in the National Association of Insurance Commissioners (NAIC) insurance
data sets together with the identifiers in the Bank Holding Company Financial Report (BHCFR),
the Commercial Banks Call Report (CALL), and the Thrift Financial Report (TFR). These four
data sets contain financial and domicile information for almost all insurers, BHCs, FHCs,
commercial banks, and thrifts operating in the U.S. for our research period over 2003 – 2005.19
To construct the linking variable, we first identify the list of insurance companies
affiliated with banks, if any, by using key word searches on the Federal Reserve Structure Report
(FEDSR) and the Thrift Holding Company Structure Report (THCFR), and by using self-
reported answers to queries posed by insurance regulators as part of the annual oversight process
as reported on the General Interrogatories page of each company’s annual regulatory statements.
With supplementary information from the National Information Center Hierarchy Report
(NICHR), we can tie the BHCFR, TFR and CALL to FEDSR and THCFR by the core linkage
code assigned by the FRB. In the final step, we match the banking data to the insurance 19 These datasets might miss some types of insurers or banks. For example, single-state insurers are not required to report to the NAIC although some do; prior 2005 state-chartered commercial banks that were not insured by the FDIC were not required to file CALL reports, but since 2005 all commercial banks are insured by FDIC.

17
regulatory data manually using company name, location and other domicile information required
to perform the merge.
Firms under common ownership in the combined data set are aggregated to the group
level. We aggregate separately the data of each group’s life, property-liability, commercial
banks, and saving bank subsidiaries to obtain the divisional totals. A firm is treated as a single
producer with up to four business divisions – life insurance, property-liability insurance,
commercial banking, and thrift division. We eliminate inactive firms with zero or negative total
assets, liabilities, or net worth. Insurance companies with zero premium income and banks with
zero deposits are not viable business entities and, therefore, are deleted. Since almost all joint
producers are large, in this study we focus on large financial institutions licensed as insurers or
banks in the U.S. We then further excluded joint producers with less than $1 billion assets,
specialist banks with less than $1 billion assets, and specialist insurers with less than $600
million assets. The final data sample consists of 260 observations of diversified firm jointly
producing banking and insurance products, 613 insurance specialist observations (offering
insurance products only) and 1,450 bank specialist observations (offering banking products only)
over the research period 2003 – 2005. Table 1 shows the statistics of the data sample. The
number of firms is further disaggregated by sectors and product lines. The firms included
account for about 98 percent life insurance industry assets, 94 percent property-liability
insurance assets, 88 percent commercial banks assets, and 81 percent thrifts assets.
5. HYPOTHESES DEVELOPMENT
Although GLB largely eliminates the barriers and restrictions on affiliations across financial
sectors, it does not necessarily follow that financial "supermarkets" will become dominant in the
U.S. financial service industry. Furthermore, we observe the coexistence of conglomeration and

18
specialization business strategies by U.S. banks and insurance companies. Whether scope
efficiency benefits exist for either joint or specialized production remains an open question for
cross-industry financial conglomeration in the U.S. These suggest the first two general
hypotheses regarding the existence of scope economies, stated in null form as follows:
Hypothesis 1: Neither scope economies nor diseconomies exist in the post-GLB integrated banking and insurance industries. Hypothesis 2: Economies of scope are invariant among financial conglomerates jointly producing banking and insurance products. As we discussed early, economies of scope can arise from variety cost complementarities
and/or revenue complementarities. Firm-specific characteristics, e.g., firm size, product mix,
distribution network, and regulatory regime, may affect those complementarities and then
contribute to assorted scope economies or diseconomies. Some banks or insurers could be in a
better position to benefit from the diversified manufacturing. We then formulate the following
specific hypotheses to address the question of which types of banks and insurers are more likely
to realize economies of scope through cross-industry financial integration.
Firm size is regarded as an important factor in the financial institution literature. Akhigbe
and Whyte (2001) and Barth et al. (2000) found that large banks benefited more from the
passage of GLB than small banks. In addition, there is a consensus that firm size may be
associated with greater or lesser scope economies, and it is typically found that large banks or
insurance companies could exploit higher scope economies than small ones (Berger, Humphrey,
and Pulley, 1996; Milbourn, Boot, and Thakor, 1999; Berger, et al., 2000; Cummins, Weiss, and
Zi, 2003). Financial conglomerates jointly producing banking and insurance products may gain a
competitive advantage through implicit government guarantees if they are large enough and if
they are considered “too big to fail.” These large conglomerates may also gain a reputational

19
advantage if consumers perceive that the implicit guarantees reduce potential losses. The implicit
guarantees may also allow them to borrow funds at lower costs (Kane, 1995, 1999; Carow,
2001a). Cost scope economies may exist on a small scale, from sharing some inputs or sharing
fixed resources such as computers or offices, but for larger conglomerates these cost scope
economy gains could be exhausted or offset by coordination or management diseconomies.
Nevertheless, large scale may be needed to generate revenue scope economies from consumption
complementarities because of the need to maintain a large distribution network. The third null
hypothesis is stated as follows:
Hypothesis 3: Larger financial conglomerates are more likely to exploit economies of scope in jointly producing banking and insurance products. The two primary product segments of the insurance sector are life-health insurance and
property-liability insurance. The business opportunities offered by GLB may benefit some lines
of insurance business more than others. Carow (2001a) found that life insurance companies
benefited more from the passage of GLB than did property-liability insurers. A GAO (1990)
study, along with a study conducted by Saunders and Walter (1994), concluded that synergistic
gains are greater for the combination of banks and life insurers than for the combination of banks
and property-casualty insurers. Given regulations precluding banks from manufacturing
insurance, U.S. banks have been engaging in the insurance business through the selling of
annuities and through the selling of credit and mortgage-related insurance, and they have long
entered distribution alliances with insurance companies. Since life insurance products have more
similarities with banking products or since they can function as complementarities to banking
products, banks are more interested in life insurance products than property-liability products
(Johnston and Madura, 2000). Our data support this inference – bank-owned insurers accounted
for 7.3 percent life insurance industry assets but only 3 percent property-liability industry assets.

20
Carow (2001b) found that life insurance companies received more intense competition from
banks than did property-liability insurers.20
A majority of banks has been offering annuities and credit related life and health
insurance to their customers for a long time. A 1996 Life Office Management Association survey
of banks and thrifts involved in insurance distribution showed that banks were most likely to sell
annuities followed by term life and whole life, and were least likely to distribute property-
liability products. As a result, many banks and thrift institutions have accumulated significant
experience distributing life insurance. Hence, banks could gain greater scope economies when
combining with life insurers than property-liability insurers. The fourth null hypothesis is stated
as follows:
Hypothesis 4: Economies of scope are more likely to occur in jointly producing life and banking products than in jointly producing property-liability and banking products. In addition, economies that arise from marketing, distribution, administration, and other
functions could be more prevalent in the retail product lines than in the commercial lines. The
primary argument in favor of this position is that marketing, distribution, administration, and
other functions tend to be more homogeneous in the retail lines and more heterogeneous in the
commercial lines. Retail customers may be willing to pay more for such one-stop shopping
convenience, however, commercial customers face relatively trivial search or transaction costs
and prefer tailored products for their banking or insurance needs. These arguments suggest the
following null hypothesis in relation to the product portfolio:
Hypothesis 5: Economies of scope are more likely to occur in the retail financial product lines than in the commercial lines.
20 The combination of banks and life insurers may also benefit from risk reduction. Using simulated data, Boyd and Graham (1988) and Brewer et al. (1988) document reduced coefficients of variation and reduced bankruptcy risk for bank-life insurance combination.

21
A sixth hypothesis has to do with distribution systems, which may have an effect on the
level of scope economies. Although a consolidated bank and insurer may lower total costs or
increase expected revenue by cross-selling, scope economies may vary with distribution systems.
Insurers using vertically integrated distribution systems distribute their products through
exclusive agents, direct marketing (by company employees), or mass marketing (mail and/or
mass media advertising). Insurers using horizontally integrated distribution systems distribute
through brokers or independent agents who sell the products of multiple insurers.21
Banks are expected to sell their insurance affiliates’ products through their branches or
offices. Banks affiliated with vertically integrated insurers can reuse insurers’ relatively large
investments in advertising and marketing, which more likely create cost scope economies.
However, revenue scope economies may be less likely in the affiliation between banks and
vertically integrated insurers because such affiliations may increase competition and conflicts
within the group, which is especially serious when bank-sold insurance products are similar to
the insurance products offered by their insurer affiliates, especially annuities.22 In this sense,
insurers using horizontal distribution systems may be in a better position to gain revenue scope
economies when affiliating with banks. Berger, Cummins, and Weiss (1997) found that
vertically integrated distributors are more likely to realize both cost and revenue scope
economies in the life insurance industry. However, Cummins, Weiss, and Zi (2003) did not find
evidence that scope economies were more likely for insurers using vertically integrated
distributions than those using horizontal distribution systems. These arguments inform the next
hypothesis:
21 Kim, Mayers , and Smith (1996) had further discussions of the choice of insurance distribution system. 22 Banks and thrift institutions made about 15 percent of individual annuity sales in 1999 and about 23 percent in 2003 (The Financial Services Fact Book 2005).

22
Hypothesis 6: Economies of scope are more likely to be present for the combination of banks and insurers using vertically integrated distributions than for the combination of banks and insurers using horizontally integrated distributions. Since efficient managers are already outperforming their competitors, with the ability to
achieve high levels of X-efficiency, they can use and extend their managerial talent, experience,
and expertise into the conglomeration. Thus, they can better realize economies of scope, yielding
a positive relationship between efficiency and scope economies. X-efficiencies capture
individual firm’s deviations from the efficiency frontier. For example, the revenue X-efficiency
refers to how close a firm’s actual revenues are to the revenues of a best-practice firm producing
the same outputs. The last hypothesis is as follows:
Hypothesis 7: X-efficient firms are more likely to enjoy economies of scope in the joint production of banking and insurance products.
6. METHODOLOGY AND DATA
6.1. ECONOMETRIC APPROACH
We use the composite cost function first proposed by Pulley and Braunstein (1992). The
composite function not only allows zero output for some products but also negative values for
the dependent variable. Thus, this functional form is attractive for the scope economies analysis,
especially for estimating profit scope efficiencies.23
6.1.1. FUNCTION FORM
The composite Pulley and Braunstein (P-B) model combines a quadratic structure for outputs
and a log-quadratic specification for input prices. It is given by:
∑∑∑ ∑∑∑∑ ∑∑∑
++++⋅
+++=
εμβββ
δααα
]lnlnln)2/1(lnexp[
]ln)21([
0
0
kiiklkklkk
kiikjiijii
rqrrr
rqqqqC (1)
23 This type of model has been used to estimate economies of scope in banking (e.g., Pulley and Humphrey, 1993; McKillop, Glass, and Morikawa, 1996; Berger, Humphrey, and Pulley, 1996; Humphrey and Pulley, 1997) and in insurance (e.g., Berger et al., 2000; Hirao and Inoue, 2004).
23
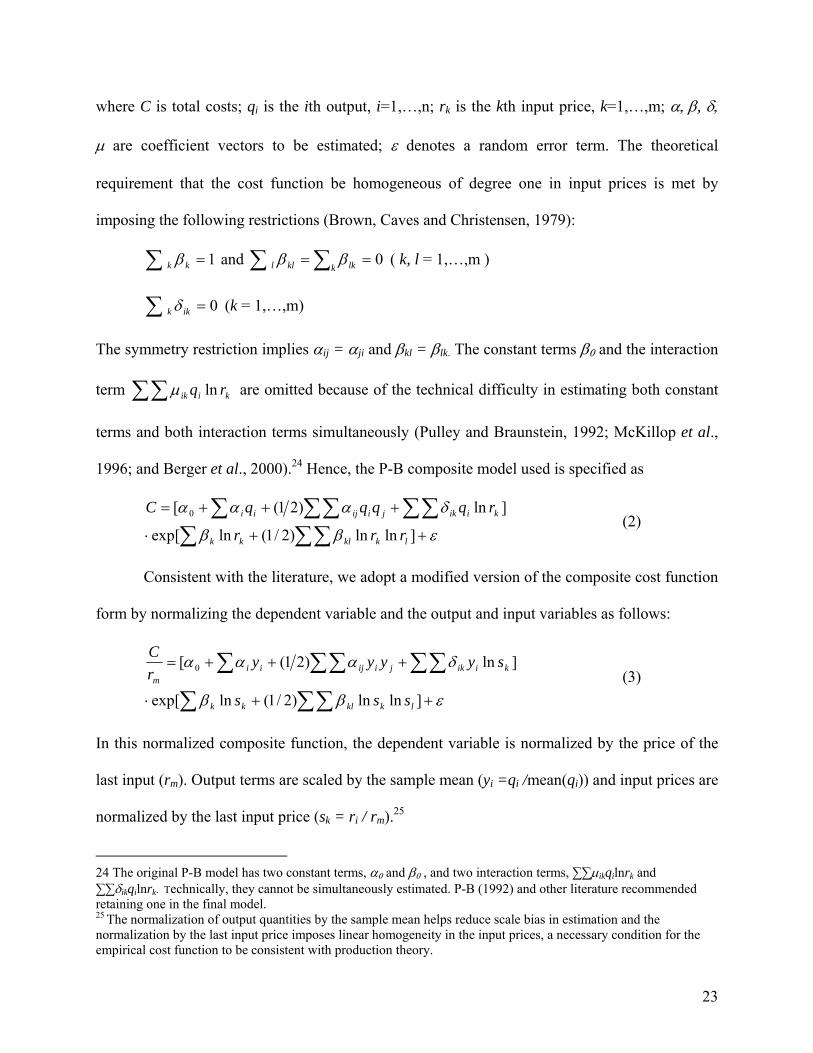
where C is total costs; qi is the ith output, i=1,…,n; rk is the kth input price, k=1,…,m; α, β, δ,
μ are coefficient vectors to be estimated; ε denotes a random error term. The theoretical
requirement that the cost function be homogeneous of degree one in input prices is met by
imposing the following restrictions (Brown, Caves and Christensen, 1979):
∑ = 1kk β and ∑ ∑ == 0k lkkll ββ ( k, l = 1,…,m )
∑ = 0ikk δ (k = 1,…,m)
The symmetry restriction implies αij = αji and βkl = βlk. The constant terms β0 and the interaction
term ∑∑ kiik rq lnμ are omitted because of the technical difficulty in estimating both constant
terms and both interaction terms simultaneously (Pulley and Braunstein, 1992; McKillop et al.,
1996; and Berger et al., 2000).24 Hence, the P-B composite model used is specified as
∑ ∑∑∑∑ ∑∑∑
++⋅
+++=
εββ
δααα
]lnln)2/1(lnexp[
]ln)21([ 0
lkklkk
kiikjiijii
rrr
rqqqqC (2)
Consistent with the literature, we adopt a modified version of the composite cost function
form by normalizing the dependent variable and the output and input variables as follows:
εββ
δααα
++⋅
+++=
∑ ∑∑
∑∑ ∑∑∑]lnln)2/1(lnexp[
]ln)21([ 0
lkklkk
kiikjiijiim
sss
syyyyrC
(3)
In this normalized composite function, the dependent variable is normalized by the price of the
last input (rm). Output terms are scaled by the sample mean (yi =qi /mean(qi)) and input prices are
normalized by the last input price (sk = ri / rm).25
24 The original P-B model has two constant terms, α0 and β0 , and two interaction terms, ∑∑μikqilnrk and ∑∑δikqilnrk. Technically, they cannot be simultaneously estimated. P-B (1992) and other literature recommended retaining one in the final model. 25 The normalization of output quantities by the sample mean helps reduce scale bias in estimation and the normalization by the last input price imposes linear homogeneity in the input prices, a necessary condition for the empirical cost function to be consistent with production theory.

24
The revenue and profit functions estimated in our study are identical to the composite
cost function (3), except that the dependent variable, cost, is replaced by revenue and profit
respectively.26 Thus, revenue and profit functions are
εββ
δααα
++⋅
+++=
∑ ∑∑
∑∑ ∑∑∑]lnln)2/1(lnexp[
]ln)21([ 0
lkklkk
kiikjiijiim
sss
syyyyrR
(4)
εββ
δααα
++⋅
+++=
∑ ∑∑
∑∑ ∑∑∑]lnln)2/1(lnexp[
]ln)21([ 0
lkklkk
kiikjiijiim
sss
syyyyrP
(5)
where R is the revenue; P is the profit. The modified composite cost, revenue, and profit
functions are estimated by non-linear least squares.
6.1.2. MEASUREMENT OF ECONOMIES OF SCOPE
Cost economies of scope (CSCOPE) are measured as the percentage of costs that firms could
save by producing multiple products jointly instead of producing each product separately in
specialist firms (Panzar and Willig, 1975, 1981). The traditional measure of CSCOPE (specified
as CSCOPET) in the case of a firm producing two products Q1 and Q2 is given by
);,();,();,0();0,(
21
2121
rqqCrqqCrqCrqCCSCOPE T −+
= (6)
Where C( . ) is a continuous cost function estimated for conglomerates only; q1 and q2 are output
level of the two products; and r refers to the input price vector. Cost scope economies are
believed to be present if CSCOPET > 0, and diseconomies are present if CSCOPET < 0. Since
26 Following Berger et al. (2000), we use the same form and independent variables for the cost, revenue, and profit functions to avoid the impact of specification differences on the cost, revenue, and profit scope economies estimations. Furthermore, these are also called alternative revenue and profit efficiency functions. Standard profit efficiency takes output prices to be exogenous, and alternative profit efficiency takes output quantities to be exogenous. Alternative profit efficiency concept is used primarily because output prices and quality are difficult to measure accurately for banks and because output quantities are relatively fixed in the short-run and cannot respond quickly to changing prices as is assumed in the use of standard profit efficiency (Berger and Mester, 1997, 2003).
25
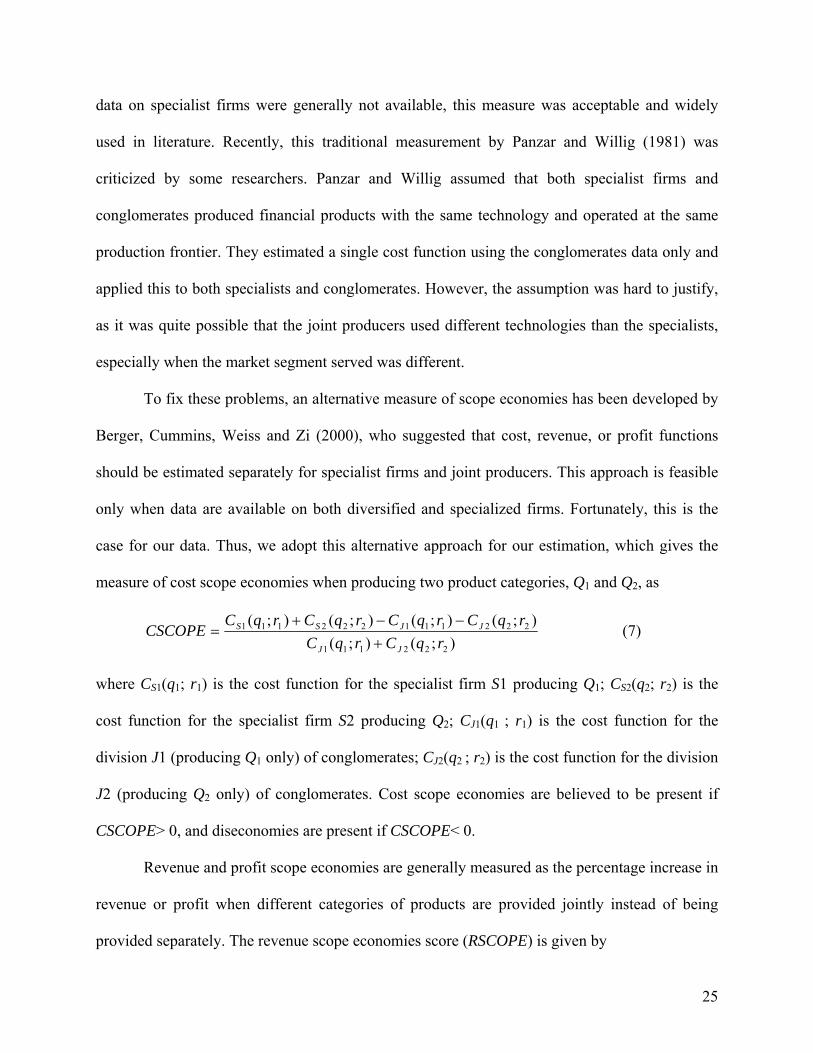
data on specialist firms were generally not available, this measure was acceptable and widely
used in literature. Recently, this traditional measurement by Panzar and Willig (1981) was
criticized by some researchers. Panzar and Willig assumed that both specialist firms and
conglomerates produced financial products with the same technology and operated at the same
production frontier. They estimated a single cost function using the conglomerates data only and
applied this to both specialists and conglomerates. However, the assumption was hard to justify,
as it was quite possible that the joint producers used different technologies than the specialists,
especially when the market segment served was different.
To fix these problems, an alternative measure of scope economies has been developed by
Berger, Cummins, Weiss and Zi (2000), who suggested that cost, revenue, or profit functions
should be estimated separately for specialist firms and joint producers. This approach is feasible
only when data are available on both diversified and specialized firms. Fortunately, this is the
case for our data. Thus, we adopt this alternative approach for our estimation, which gives the
measure of cost scope economies when producing two product categories, Q1 and Q2, as
);();();();();();(
222111
222111222111
rqCrqCrqCrqCrqCrqC
CSCOPEJJ
JJSS
+−−+
= (7)
where CS1(q1; r1) is the cost function for the specialist firm S1 producing Q1; CS2(q2; r2) is the
cost function for the specialist firm S2 producing Q2; CJ1(q1 ; r1) is the cost function for the
division J1 (producing Q1 only) of conglomerates; CJ2(q2 ; r2) is the cost function for the division
J2 (producing Q2 only) of conglomerates. Cost scope economies are believed to be present if
CSCOPE> 0, and diseconomies are present if CSCOPE< 0.
Revenue and profit scope economies are generally measured as the percentage increase in
revenue or profit when different categories of products are provided jointly instead of being
provided separately. The revenue scope economies score (RSCOPE) is given by

26
);();();();();();(
222111
222111222111
rqRrqRrqRrqRrqRrqR
RSCOPEJJ
SSJJ
+−−+
= (8)
and profit scope economies score (PSCOPE) is
);();();();();();(
222111
222111222111
rqPrqPrqPrqPrqPrqP
PSCOPEJJ
SSJJ
+−−+
= (9)
where RS1( . ), RS2( . ), and PS1( . ), PS2( . ) are revenue and profit functions for specialist firms
S1 and S2 respectively; RJ1( . ), RJ2( . ), and PJ1( . ), PJ2( . ) are revenue and profit functions for
divisions J1 and J2 of conglomerates,. Similarly, revenue or profit scope economies are believed
to be present if RSCOPE> 0 or PSCOPE> 0, and scope diseconomies are present if RSCOPE< 0
or PSCOPE< 0.
6.2. ESTIMATION OF OUTPUTS, INPUTS, AND PRICES
Like other service industries, it is difficult to define what financial institutions produce and how
the services are priced. This section briefly discusses the measurement of outputs, inputs, and
prices for insurance companies and banks, respectively. Table 2 summarizes the output and input
measures.
6.2.1. INSURANCE OUTPUTS
Consistent with the recent literature on insurance efficiency, we identify three principal services
provided by insurance companies: risk pooling and risk-bearing, real financial services, and
financial intermediation. The actuarial, underwriting, claim settlement, and associated expenses
incurred in operating risk pools are the main components of value added related to risk-pooling
and risk-bearing. In life insurance, real financial services include personal financial planning,
pension counseling, and commercial benefit plan administration. In property-liability insurance,
risk surveys, coverage program design, and consulting on policy deductibles and limits are the
major real services related to insured losses. For financial intermediation, interest credited to life

27
insurance policies and premium discounts applied to property-liability insurance policies
represent the value added of the insurers’ intermediation function.
PROPERTY-LIABILITY INSURANCE. For property-liability insurers, the present
value of real losses incurred (PV(L)) is used as a output proxy (Berger, Cummins, and Weiss,
1997; Berger, Cummins, Weiss, and Zi, 2000; Cummins, Weiss, and Zi, 2003). Losses incurred
are generally defined as the total losses that are expected to be paid for providing insurance
coverage arising from business written during the previous year; specifically they are calculated
as the sum of losses paid plus the net change in loss reserves. We calculate the present value to
reflect claim settlement lags that may have a significant impact on certain product lines, e.g.,
liability insurance vs. auto physical damage insurance. Four output lines of business are defined:
personal short-tail lines, personal long-tail lines, commercial short-tail lines, and commercial
long-tail lines. Table 3 provides a list of outputs and lines of business definition.
We estimate the proportion of losses incurred from any accident year t that is paid in year
t+j using the Taylor separation method (Taylor, 2000) with industry aggregate claim data
obtained from Schedule P of the A.M. Best Rating Guide (2003, 2004, and 2005). Then the
expected loss payouts of the company are discounted using interest rate data for U.S. Treasury
yield curves obtained from the Federal Reserve Board. The output of intermediation functions is
measured by the annual average real invested assets (Berger, Cummins, and Weiss, 1997; Berger
et al., 2000; Cummins, Weiss, and Zi, 1999, 2003; Cummins and Weiss, 2001).
Because of the sample size limitation, we use three aggregate insurance outputs for
property-liability insurers: (1) personal lines combining personal short-tail and long-tail
products; (2) commercial lines combining commercial short-tail and long-tail products; (3)
intermediary output (invested assets).

28
LIFE INSURANCE. Because of the specific limitations in information reported by life
insurers, the present value of benefits incurred for life insurers is not available. Following
accepted practice, e.g., Yuengert (1993), Cummins, Tennyson, and Weiss (1999), Berger, et al.
(2000), Cummins, et al. (2003), we use incurred benefits (payments received by policyholders in
a year) plus additions to reserves as a proxy of life insurance outputs. We define five business
lines: personal life insurance, personal annuities, group life insurance, group annuities, and
accident and health insurance. Because of the small sample size, we use three aggregate outputs
for life insurers: (1) life insurance including personal and group life insurance; (2) annuities
including personal and group annuities; (3) accident and health insurance.
6.2.2. BANKING OUTPUTS
The services provided by banks are traditional financial services (on-balance sheet), new
financial services (on-balance sheet), and off-balance sheet (OBS) activities. The traditional
financial services include deposits (demand, time and savings) and loans (real estate,
commercial, installment), and those services continue to represent the majority of the bank
business (Pulley and Humphrey, 1993; Berger et al., 1997; and Kashyap, Rajan, and Stein,
2002). As noted by Stiroh (2000), fee-based services and off-balance sheet activities have been
recognized as a growing category of bank assets and have accounted for a substantial portion of
bank revenues. These activities are especially concentrated in large institutions and failure to
account for them may lead to incorrect conclusions.27 New financial services, including portfolio
management, mutual or pension fund distributions, and safekeeping services, are expected to
reduce risk (Gallo, Apilado, and Kolari, 1996), enhance scale economies and produce cross-
27 Rogers (1998) found significant but small complementarities between traditional output and “new financial services.” Jagtiani and Khanthavit (1996) and Clark and Siems (2002) found complementarities when considering a wide range of off-balance sheet activities jointly. Valverde and Fernandez (2005) examined Spanish banks and found that OBS business introduced both cost and profit scope economies compared to a narrow (traditional) definition of output mix.
29
selling synergy (Kane, 1995; Golter, 1996). The major off-balance sheet activities are loan
commitments (lines of credit and credit cards), credit derivatives, letters of credit, and loan
originations, sales, and servicing.
Following the literature, we identify three categories of outputs – consumer loans,
business loans, and other assets.28 The first output, consumer loans, involves intermediation and
loan services and is calculated as the sum of the dollar value of residential loans, credit card
loans and other installment loans. The second output, business loans, includes the dollar value of
real estate loans, commercial and industrial loans, farm loans and other loans and leases. The last
output, other assets, includes a bank's new financial services and off-balance sheet business and
reflects another important source of bank revenue. It is defined as the sum dollar value of
securities and trading assets held by banks and OBS activities. The OBS activities are calculated
as the risk-weighted (based on Basle Accord risk weights) amounts of unused commitments,
letters of credit, derivatives and other OBS items.
6.2.3. INSURANCE INPUTS AND PRICES
Unlike output definitions, there is a general agreement in the literature regarding the
measurement of inputs in the financial service industry. Generally, the inputs to insurance fall
into four principal categories – home office administrative labor, agent labor, material and
physical capital, and financial equity and debt capital.
Since insurers are not required to report detail information about the number of
employees and quantity of materials used in business, we impute them from the dollar value of
related expenses reported in their regulatory statements divided by the price. The price of the
28 It would be ideal if the bank outputs were disaggregated into more categories, e.g., commercial and industrial loans, real estate loans, installment loans to individuals. However, because of the trade-off between the degree of aggregation for outputs and the degree of freedom, our data cannot afford to lose the degree of freedom since the data have a small number of conglomerate observations.

30
home office labor is obtained from average weekly wage rates for life insurers (SIC categories
6311 or NAICS categories 524113) and property-liability insurers (SIC categories 6331 or
NAICS categories 524126) in their domicile state available from the U.S. Department of Labor.
Similarly, the price of agent labor is defined as the premium-weighted average weekly wage
rates for insurance agents (SIC categories 6411 or NAICS code 524210) in states where the
insurer operates. The weight is the proportion of the insurer’s direct business written in each
state. The price of the materials and business services is defined as the U.S. Department of Labor
average weekly wage rates for business services. We use the national index consistent with
materials being available for the same price nationwide.
In addition to labor and physical inputs, we include two proxies for the financial capital:
equity capital and debt capital. Financial equity capital plays an important role in reducing the
insolvency risk29 and is viewed as one of the important inputs as conveyed in the literature (e.g.,
Berger, Cummins, and Weiss, 1997; Hughes and Mester, 1998; and Hughes, et al. 2001). An
insurer’s financial equity capital is defined as the statutory policyholders surplus measured as the
average of beginning and end-of-year equity capital. To measure the price of financial equity
capital, we use the estimated cost of equity capital using 3-Factor Fama-French CAPM with
industry specific beta obtained from Ibbotson Associates Cost of Capital Yearbook.30
The debt capital is defined as the funds borrowed from policyholders. These funds are
comprised of loss reserves and unearned premiums reserves. The price of policyholder supplied
debt capital is calculated as total expected investment income minus expected investment income
attributed to equity capital divided by average debt capital. The expected investment income
29 The insurance pricing theory predicts that insurers have optimal capital structures and insurance product price is inversely related to insurers’ default risk (Cummins and Sommer, 1996; Cummins and Danzon, 1997). 30 Cummins and Weiss (2001) proposed a book-value approach, which assumed that insurers held equity portfolios with a market beta coefficient of 1.0; therefore, they use a constant cost of equity across all insurers in the industry.

31
attributed to equity capital is calculated as the expected rate of investment return multiplied by
average equity capital (Cummins and Weiss, 2001).
6.2.4. BANKING INPUTS AND PRICES
Similar to the inputs for insurance companies, the four inputs for banks (commercial banks and
thrift institutions) are widely recognized as deposits, labor, physical capital, and purchased funds
(e.g., Berger, et al. 2005; Berger and Mester, 2003; Berger and Humphrey, 1992).
The first input, deposits, includes demand deposits, time and saving deposits. The
quantity of deposits is directly measured as the total dollar value of demand deposits, time and
saving deposit liabilities of the bank. The price of deposits is calculated as total interest expense
on the deposits divided by the quantity of deposits. The quantity of labor is defined as the
number of employees reported in the bank’s regulatory report, and the price of labor is calculated
as the salary, wage and welfare per employee. The quantity of physical capital is defined by the
dollar value of net premises and fixed assets available in the bank’s regulatory report, and the
price of physical capital is obtained as occupancy and fixed asset expenditures divided by the
quantity of physical capital. Purchased funds include federal funds purchased, large CDs, foreign
deposits, demand notes, and other liabilities for borrowed money. The price of purchased funds
is calculated as interest paid on these funds divided by the total dollar value of these funds,
which is the quantity of purchased funds.
7. EMPIRICAL RESULTS
We first evaluate the cost, revenue, and profit scope economies by estimating the composite cost,
revenue, and profit functions. Then, the second-stage regression results are discussed.
7.1. SCOPE ECONOMY ESTIMATES
32
It is well recognized that specialist firms and diversified firms may operate at different
production frontiers due to different business strategies and technologies. We estimate cost,
revenue, and profit functions for specialist and diversified firms, respectively. Tables 4, 5, 6 and
7 show the descriptive statistics of the variables used in the function estimation for commercial
banks, thrift saving banks, life insurers, and property-liability insurers, respectively. We use non-
linear least square to estimate the composite functions. The estimated functions well fit the
sample and show good overall fitness.
Scope economy estimates for the joint producers (bancassurers and assurbanks) are
obtained by applying the scope economy formulas with the coefficients estimated from the
composite functions. Scope economy estimates for the specialists are obtained by simulating
mergers of insurance specialists with bank specialists (Berger et al., 2000). We use Cartesian
product to obtain the hypothetical financial conglomerates, which are created by merging every
insurance specialist with every bank specialist in each given year. Thus, 298,185 synthetic joint
producers are obtained.31
One common approach in inferring scope economies is to evaluate at a single point, e.g.,
the mean or median of the data. Nevertheless, this point estimation method has been criticized
for its weak representation, as it may not provide a good approximation for the whole sample
(Hirao and Inoue, 2004; Berger et al., 2000). We present our scope economy estimations in
several different ways. The cost, revenue, and profit scope economies are evaluated, first, for all
the firms in the sample, then, for the actual joint producers only, and, finally, for the synthetic
financial conglomerates. The scope economy scores, then, are evaluated at the 25th (Q1), 50th
(median), and 75th (Q3) percentile of the data. For example, for the whole sample the scope
31 The Cartesian product approach considers all possible firm pairs and, therefore, can reduce the potential for bias resulting from arbitrarily excluding ex ante some firm combinations that might be associated with scope economies or diseconomies.

33
economy scores are estimates at the first quartile, the median, and the third quartile of outputs
quantities and inputs prices.
Table 8 summarizes the estimates of costs, revenue, and profit scope economy scores.
Panel A shows consistent negative cost scope economy estimates regardless of evaluation points
or firms samples. The evidence indicates significant cost scope diseconomies on jointly
producing banking and insurance products. For example, at median level of outputs and input
prices, the data show cost scope diseconomies of 11.4 percent for all the firms, 24.1 percent for
actual joint producers, and 26 percent for the hypothetical joint firms. The estimates at Q1 and
Q3 suggest the same conclusion, and the cost scope diseconomies are statistically significant.
Panel A also shows an inverse relationship between firm size and cost scope diseconomies. As
discussed earlier, cost scope economies may exist on a small scale from sharing inputs or sharing
fixed resources such as computers or offices, but such gains could be offset by coordination or
management diseconomies and exhausted in larger scale. The relationship between scope
economies and firm size will be further discussed in the regression analysis.
Panel B of Table 8 lists the revenue scope economies estimates. All the estimate scores
are large in value and statistically significant at the 1 percent level. The positive revenue scope
economy scores indicate revenue scope economies in joint production, suggesting that offering
both banking and insurance products can generate higher sales revenue than producing the
products separately in specialists firms. At median value, actual joint firms could realize revenue
scope economies of 32.1 percent, and for specialist firms, revenue scope economies are predicted
to be 38.8 percent. In terms of the pattern between revenue scope economies and firm size, Panel
B indicates a positive relationship. The larger the firm size, the higher its revenue scope
economies. It is not surprising to see that small size firms are less capable of benefiting from

34
such production complementarities. As discussed earlier, large scale operations may be needed to
generate revenue scope economies from consumption complementarities because of the need to
maintain a large distribution network. In addition, this finding suggests that large firms are the
most efficient in utilizing cross-selling and exploiting benefits from offering one-stop shopping
convenience when providing banking and insurance products simultaneously.
Panel C of Table 8 provides the summary of profit scope economy score estimations. The
data generally show significant profit scope economies for all firms in the sample, the actual
joint firms only, and hypothetical joint firms only. However, profit scope economies are quite
small and less significant. For example, at sample median, actual joint producers could benefit
from joint production by increasing 2 percent net income, and the specialists are predicted to
increase 10 percent net income by conglomeration. Except for the estimates for actual joint
producers at Q1, the profit scope economies are statistically significant. Similar to the revenue
scope economies in Panel B, large firms show higher profit scope economies when producing
both banking and insurance products. The profit scope economies increase from 2.6 percent at
Q1, to 3.9 percent at median, to 7.6 percent at Q3 for all firms in the data.
The findings reject Hypothesis 1 and suggest that significant cost scope diseconomies,
significant revenue scope economies, and weak profit scope economies exist in the post-GLB
integrated banking and insurance industries. The evidence of cost scope diseconomies cannot
support production complementarities and suggests that cost savings from sharing resources do
not offset the extra costs possibly incurred in joint production and conglomeration. The findings
of revenue scope economies support consumption complementarities, which suggest that
customers are willing to pay more for the convenient one-stop shopping. Demand side scope
efficiency gains also arise by cross-selling. The findings of profit scope economies indicate that

35
revenue scope economies dominate cost scope diseconomies on joint productions. This leads to
the final net profit scope economies, which, however, are small.
Furthermore, the evidence of varied cost and revenue scope economies or diseconomies
supports our contention that profit scope economies dominate the commonly used concept of
cost or revenue scope economies. Neither the cost nor the revenue scope economies can explain
net effects of integrating the banking and insurance manufacturing on financial conglomerate
operations. Focusing on either cost or revenue economies may lead to misleading conclusions.
7.2. REGRESSION ANALYSIS
We next investigate which types of firms are more likely to benefit from conglomeration and
how firm characteristics explain the scope economies difference among firms. The remainder of
the paper is devoted to a regression analysis. It is the second stage analysis. The cost, revenue,
and profit scope economy scores are regressed on a set of firm characteristic variables. The
regression results discussed in this section reveal the effects of firm characteristics on economies
of scope and test the hypotheses presented in Section 5. Observations with extreme scope
economy scores, e.g., scope economy scores greater than 1 and less than -1, are excluded from
the sample. The final sample used in the regression contains 214 joint producer observations.
Table 9 provides a summary of the descriptive statistics of regression variables. Table 10
shows the coefficient results for cost, revenue, and profit scope economy regressions. A
truncated Tobit model is used since dependent variables are truncated at 1 and -1. The dependent
variables are cost scope economy scores (function <1> and <4>), revenue scope economy scores
(functions <2> and <5>), and profit scope economy scores (functions <3> and <6>). Two sets of
regressions are estimated and compared. The only difference is the variables used to capture each
firm’s business portfolio and product mix. Functions <1>, <2>, and <3> use the total personal

36
business share and overall firm categories, while functions <4>, <5>, and <6> further segregate
personal business share into insurance personal business share and banking personal business
share. Then, firms are grouped into nine sub-categories.
To test Hypothesis 3 that firm size is related on scope economies, we use the natural log
of the gross total assets (LASSETGTA) to measure the size, which is a commonly used proxy in
the literature. Gross total assets are defined as the sum of insurance division assets, bank division
assets, and allowance for loans and leases. The coefficient on LASSETGTA is negative in the
cost regression and positive in both revenue and profit regressions. All these coefficients are
statistically significant. These coefficient results are consistent with the findings in Table 8, with
no controls for other factors. The coefficients suggest that large firms are more likely to benefit
from revenue increases than cost savings when jointly producing banking and insurance
products. They are more efficient in keeping large scale distribution networks which could
generate significant revenue increases by cross-selling. Small firms are more likely to benefit
from cost saving by sharing important or costly resources in conglomeration.
Hypothesis 4 and 5 are related with a firm’s business portfolio and product mix effects on
scope economies. Three business share variables are used. The total personal products share is
defined as total personal business outputs (including insurance personal business and banking
personal business)32 divided by the firm’s total business outputs (P_SHARE). The personal
product share in the insurance division is measured as the personal insurance outputs divided by
total insurance outputs (P_SHARE_INS).33 The personal banking product share in the banking
32 Insurance personal business includes individual life or annuity insurance, private passenger auto physical damage insurance, and homeowner's insurance. Banking personal business includes consumer loans, credit cards and other installment loans, residence mortgage, and core deposits. 33 Total insurance outputs include personal insurance outputs and commercial insurance outputs, such as group life or annuity insurance, inland marine, commercial auto insurance, and workers compensation.

37
division is defined as the personal banking outputs divided by total banking outputs
(P_SHARE_BK).34
We also include indicator variables designed to capture broad differences in the business
strategies employed by the firms. Firms whose bank division assets are more than 75 percent of
total group assets are defined as bancassurers (DV_BKASSUR). If bank division assets account
for less than 25 percent of group assets, the firms are categorized as assurbanks
(DV_ASSURBK), and the remaining firms are conglomerates (DV_CONG).
Each of the three groups is further segregated by the range of business in which they
engage. The DV_BKASSUR is segregated into three indicators: bancassurers participating in life
insurance business only (BKASSUR_LH), bancassurers owning property-liability insurance
subsidiaries only (BKASSUR_PC), and bancassurers participating in both the life and property-
liability insurance business (BKASSUR_LHPC). The DV_ASSURBK is segregated into:
assurbanks that operate commercial banks only (ASSURBK_CB), assurbanks owning thrift
saving business only (ASSURBK_SB), and assurbanks owning both commercial banking and
thrift saving businesses (ASSURBK_CBSB). Then, the DV_CONG is disaggregated into:
conglomerates owning life insurance subsidiaries only (CONG_LH), conglomerates participating
in the property-liability insurance business only (CONG_PC), and conglomerates doing both life
and property-liability insurance business (CONG_LHPC). DV_CONG and CONG_LHPC are
dropped because of the linearity.
As shown in Table 10, both the overall total personal product share variable, P_SHARE,
and division personal product share variables, P_SHARE_INS and P_SHARE_B, have negative
coefficients in the cost scope regression and positive coefficients in the revenue and profit scope
34 Total banking outputs include personal banking outputs and commercial banking outputs, such as commercial and industrial loans.

38
regression. These results suggest that joint firms with an emphasis on the retail business are less
likely to realize cost scope economies but more likely to benefit from revenue scope economies.
In addition, such effects are mainly dominated by the insurance retail business, which tends to
contribute more effects than the banking retail business. The effect on net profit scope economies
is estimated to be positive and statistically significant, which supports Hypothesis 5. Economies
of scope are more likely to occur in personal product lines than in commercial lines. This finding
suggests that retail banking and insurance products are more homogeneous and could be
efficiently produced through cross-selling. In addition, the results also suggest that commercial
customers may prefer expertise and tailored products to meet their banking and/or insurance
needs. Firms with business portfolios highly weighted on commercial products appear unable to
achieve significant revenue scope economies due to joint production.
Life insurance products have more similarities to banking products than do property-
liability insurance products, and higher economies of scope are expected to occur in the joint
production of life and banking products than in the joint production of property-liability and
banking products. The results in Table 10 show that the coefficient on BKASSUR_LHPC is
positive and significant in the profit scope equation. This evidence suggests that bancassurers are
profit scope efficient when participating in both the life and property-liability insurance business.
The negative and significant coefficient on ASSURBK_CBSB in the profit scope equation
suggests that assurbanks are profit scope inefficient when participating in both the commercial
and thrift banking business. The coefficient on CONG_PC in the profit scope regression is
positive and significant, suggesting that if the firm has balanced banking and insurance business,
scope economies are more likely to occur when offering property-liability insurance products.

39
To control for the business diversifications, four variables are included: the insurance
product Herfindahl index (PRODHHI), the banking product Herfindahl index (PRODHHI_B),35
the insurance division geographic business HHI (DPWHHI),36 and the log of the number of
domestic offices and branches in the banking division (LOFFDOM). The maximum possible
value for the Herfindahl index of 1.0 indicates a single product manufacturing and, as such,
higher index values indicate a decrease in product diversification. Table 10 shows that, the more
products diversified in the insurance division, the more likely the firm is to exploit cost scope
economies but the less likely it is to exploit revenue and profit scope economies. In addition, the
more products diversified in the banking division, the more likely it is to realize cost and profit
scope economies and the less likely it is to realize revenue scope economies. Only the insurance
products diversification effects on net profit scope economies are statistically significant.
The insurance geographic business Herfindahl index and the number of bank offices and
branches capture the effects of national or local operation strategies. The higher the insurance
geographic diversification variable, DPWHHI, and the lower the number of bank offices,
LOFFDOM, the less geographically diversified. The results show that both measures of
geographical diversification have a consistent impact on scope economies. Joint firms with more
geographically diversified insurance or banking businesses are less likely to exploit cost scope
economies but are more likely to exploit revenue and profit scope economies, suggesting that
national operations contribute to net profit scope economy gains. This finding is consistent with
35 Herfindahl index (HHI) for a firm producing n types of products is measured as (Y1^2 + Y2^2 + …+ Yn^2 ) / (Y1 + Y2 + … + Yn)^2, where Yi is the ith product output. Insurance products include property-liability insurance (personal short-tail lines, personal long-tail lines, commercial short-tail lines, and commercial long-tail lines) and life insurance (individual life insurance, individual annuity, group life insurance, group annuity, and accident and health insurance). Banking products include residential real estate loans, commercial real estate loans, credit card and other installment loans, farm loans, commercial & industrial loans, other loans, demand deposits, and time and saving deposits. 36 Herfindahl index for insurers operating in m states is measured as (Y1^2 + Y2^2 + …+ Ym^2 ) / (Y1 + Y2 + … + Ym)^2, where Yi is the direct premium written in the ith state.

40
our earlier discussions. National operations are sufficient to large sales volumes and, therefore,
contribute to revenue scope economies. However, on the cost side, national operations can be
cost inefficient, and extra costs or expenses can contribute to cost scope diseconomies. The
results show that national operations provide positive net effects on profitability.
We test the hypothesis regarding the insurance distribution systems using three dummy
variables: insurance horizontal integrated distribution (DV_MKT_H = 1, if the insurance
horizontal integrated distribution channels are used), insurance vertical integrated distribution
(DV_MKT_V = 1, if insurance vertical integrated distribution channels are used), and both
insurance horizontal and vertical distributions (DV_MKT_HV = 1, if both horizontal and vertical
integrated distribution channels are used).37 The final classification is omitted from the
regression to avoid linearity. The coefficient on DV_MKT_V is positive, and the coefficient on
DV_MKT_H is negative in the profit scope equation, suggesting that banks affiliated with
vertically integrated insurers could benefit from reusing insurers’ relatively large investments in
advertising, marketing, and brand names and therefore enjoy profit scope economies. However,
these two coefficients are not statistically significant in Table 10.
Some of the other variables included in the regressions also appear related to scope
economies. The capital to asset ratio (C_TO_A) estimated coefficients suggest that a higher
capital to asset ratio leads to cost scope diseconomies and revenue and profit scope economies.
The results are consistent with low risk firms attracting more potential customers; however,
holding additional equity capital can be costly.
The results also suggest that efficient companies are more likely to enjoy profit scope
economies. This is evidenced by the positive and significant coefficients on the X-efficiency
37 Vertical integrated distribution channels include exclusive/captive agents, direct response, internet, affinity group marketing, worksite marketing. Horizontal integrated distribution channels include independent agents, brokers, general agents, career agents, and banks.
41
variables. This finding supports our last hypothesis. Since efficient managers are already
outperforming their competitors with the ability to achieve high levels of X-efficiency, they can
reuse and extend their managerial talent, experience, and expertise into the conglomeration.
Thus, they can be better able to realize economies of scope, yielding a positive relationship
between efficiency and scope economies. Finally, two year-dummy variables are added to the
control for any possible effects, and the coefficients are significant for both sets of regressions.
8. SUMMARY AND CONCLUSIONS
The Gramm-Leach-Bliley Act of 1999 is a landmark financial services legislation, which
promised the most fundamental reform in the U.S. financial services regulation in more than half
a century. Few doubted the potential for GLB to have a profound impact on financial service
market. However, there is a striking lack of empirical research on the effects of diversification by
financial firms. This paper has sought to contribute new evidence on scope efficiencies from the
joint production of insurance and banking products in the post-Gramm-Leach-Bliley era.
By constructing a unique variable that links the U.S. banking and insurance regulatory
data sets, we first identify domestic assurbanks and bancassurers, and all the unique subsidiaries
of all financial service companies in the U.S. licensed as a commercial bank, thrift, or insurance
company. We, then, examine the existence of scope economies in financial conglomerations by
utilizing a two-stage procedure econometric method.
The first stage consists of investigating cost, revenue, and profit scope economies for
U.S. banks and insurers by estimating the composite costs, revenue, and profit composite
functions. The estimation results suggest that significant cost scope diseconomies, revenue scope
economies, and weak profit scope economies exist in the post-GLB U.S. integrated banking and
insurance industries. The evidence of cost scope diseconomies suggests that cost savings from

42
sharing inputs cannot offset the extra costs possibly incurred in joint production and
conglomeration. The findings of revenue scope economies support consumption
complementarities, showing that customers may be willing to pay more for the convenience of
one-stop shopping; the findings also suggest that demand side scope efficiency gains also arise
by cross-selling. This finding further suggests that financial conglomerates may target consumers
of financial services in different ways, such as offering higher quality products for which they
charge a premium. The findings of profit scope economies indicate that revenue scope
economies dominate cost scope diseconomies for joint productions, i.e. revenue scope efficiency
gains can offset cost scope efficiency losses and contribute to net profit scope efficiency gains.
In the second stage, we use regression analysis to address the following research
questions: Which types of firms are more likely to benefit from conglomeration? How do firm
characteristics explain scope economies differences among firms? The regression results suggest
that large firms are associated with higher cost scope diseconomies and higher revenue or profit
scope economies than small firms. Large firms are more likely to benefit from increased revenue
than cost savings when jointly producing banking and insurance products.
Considering business portfolios and product mix, economies of scope are found to be
more likely to occur in personal product lines than in commercial lines. This finding suggests
that retail banking and retail insurance products are more homogeneous and can be efficiently
distributed through cross-selling, but commercial customers may prefer expertise and tailored
products. Thus, firms with business portfolios highly weighted on commercial products struggle
to achieve significant sales arising from joint production. Bancassurers focusing on traditional
banking business are found to be more profit scope efficient in conducting life and property-

43
liability insurance business simultaneously, while assurbanks concentrating on insurance
business are profit scope inefficient in engaging in both commercial and thrifts business.
Business diversifications also affect scope economies in joint production. The more
products diversified in insurance, the more likely to exploit cost scope economies but the less
likely to exploit revenue and profit scope economies. In addition, joint producers, which are
more geographically diversified, are more likely to realize profit scope economies, which show
that national operations impose positive net effects on scope efficiencies. Then, the impact of
insurance distribution systems are that banks affiliated with vertically integrated insurers show
higher profit scope economies in joint production.
The other firm characteristics affecting scope economies include capital-to-assets ratio
and X-efficiencies. The results suggest the more X-efficient a firm is, the more scope efficient;
and firms with high capital-to-assets ratio present high profit scope economies.
After the passage of GLB, we did not observe the wave of cross-sector conglomerations,
as expected in the U.S. banking and insurance industries. Banks and insurers showed their
hesitation on exercising the new power granted by GLB. Our results further explain why U.S.
banks and insurers have opted for integration at the marketing level rather than the production
level. The cost scope economies on the supply side are not pervasive, and whether the magnitude
of the revenue scope economies on the demand side is large enough to offset the cost increase,
hinders cross-sector expansions.
44
REFERENCES
Akhigbe, A. and A.M. Whyte. 2001, “The Market’s Assessment of Financial Services Modernization Act of 1999,” The Financial Review, Vol. 36, 119-138.
Allen, Linda, and Rai, Anoop. 1996, “Operational Efficiency in Banking: An International
Comparison,” Journal of Banking and Finance, 18(6), 655-672. Allen, L. and Jagtiani, J. 2000, “The Risk Effects of Combining Banking, Securities, and
Insurance Activities,” Journal of Economics and Business, 52, 485-497. Aly, H.Y., Grabowski, R., Pasurka, C., and Rangan, N. 1990, "Technical, Scale, and Allocative
Efficiencies in U. S. Banking: An Empirical Investigation," Review of Economics and Statistics 72: 211-218.
Barth, J.R., Brumbaugh, R.D. Jr., and Wilcox, J.A. 2000, “The Repeal of Glass-Steagall and the
Advent of Broad Banking,” Journal of Economic Perspectives, Val. 14, pp. 191-204. Berger, A.N., Gerald A. Hanweck, and David B. Humphrey. 1987, “Competitive Viability in
Banking: Scale, Scope, and Product Mix Economies,” Journal of Monetary Economics 20(3): 501-520.
Berger, A.N. and David B. Humphrey. 1991, “The Dominance of Inefficiencies over Scale and
Product Mix Economies in Banking,” Journal of Monetary Economics 28(1): 117-148. Berger, A. N., Hancock, D., and Humphrey, D. B. 1993, “Bank efficiency derived from the profit
function,” Journal of Banking and Finance, 17, 317–347. Berger, A.N., David B. Humphrey, and Lawrence B. Pulley. 1996, “Do Consumers Pay for One-
Stop Banking? Evidence from an Alternative Revenue Function,” Journal of Banking and Finance 20(9): 1601-1621.
Berger, A.N., J. David Cummins, Mary A. Weiss. 1997, “The Coexistence of Multiple
Distribution Systems for Financial Services: The Case of Property-Liability Insurance,” Journal of Business 70(4): 515-546.
Berger, A.N. and David B. Humphrey. 1997, “Efficiency of Financial Institutions: International
Survey and Directions for Future Research,” European Journal of Operational Research 98: 175-212.
Berger, A.N. and Loretta J. Mester. 1997, “Inside the Black Box: What Explains Differences in
the Efficiencies of Financial Institutions?” Journal of Banking and Finance 21: 895-947. Berger, A.N. and Timothy H. Hannan. 1998. "The Efficiency Cost Of Market Power in The
Banking Industry: A Test Of The "Quiet Life" And Related Hypotheses," The Review of Economics and Statistics, MIT Press, vol. 80(3): 454-465.

45
Berger, A.N. 2000, “The Integration of the Financial Services Industry: Where are the
Efficiencies?,” North American Actuarial Journal, 4 Berger, A.N., J. David Cummins, Mary A. Weiss, and Hongmin Zi. 2000, “Conglomeration
Versus Strategic Focus: Evidence from the Insurance Industry,” Journal of Financial Intermediation, 9, 323-362.
Berger, A.N. and Mester, L.J. 2003, “Explaining the Dramatic Changes in Performance of US
banks: Technological change, deregulation, and Dynamic Changes in Competition,” Journal of Financial Intermediation, 12, 57-95.
Berger, A.N., Dick, A.A., Goldberg, L.G., and White, L.J. 2005, “The Effects of Competition
from Large, Multimarket Firms on the Performance of Small, Single-Market Firms: Evidence from the Banking Industry,” Finance and Economics Discussion Series, Federal Reserve Board, 2005-15.
Boyd, J.H., and Graham, S.L. 1988, “Bank Holding Company Mergers with Non-bank Financial
Firms: Effects on the Risk of Failure,” Journal of Banking and Finance 17, 43-64. Boyd, J.H., Graham, S.L., and Hewitt, R.S. 1993, “Bank Holding Company Mergers with Non-
Bank Financial Firm: Effects on the Risk of Failure,” Journal of Banking and Finance, 17(1), 43-63.
Brewer, E., Fortier, D., and Pavel, C. 1988, “Bank Risk from Non-bank Activities,” Economic
Perspectives, Federal Reserve Bank of Chicago, July-August, 14-26. Brown, R.S., Caves, D.W., and Christensen, L.R. 1979, “Modelling the Structure of Cost and
Production for Multiproduct Firms,” Southern Economic Journal, Vol. 46, No. 1: 256-273. Butler, Richard J., Yijing Cui, and Andrew Whitman. 2000, “Insurers' Demutualization
Decisions,” Risk Management and Insurance Review 2: 135-154. Cagle, Julie A. B., Robert L. Lippert, and William T. Moore. 1996, “Demutualization in the
Property-Liability Insurance Industry,” Journal of Insurance Regulation 14: 343-369. Calomiris, C. W. 1998, “Universal Banking ‘American Style’,” Journal of Institutional and
Theoretical Economics, 154, 44-60. Carow, K.A. 2001a, “Citicorp-Travelers Group Merger: Challenging Barriers Between Banking
and Insurance,” Journal of Banking and Finance, 25 Carow, K.A. 2001b, “The Wealth Effects of Allowing Bank Entry Into the Insurance Industry,”
The Journal of Risk and Insurance, Vol. 68, No.1, 129-150.

46
Cavallo, L. and Rossi, P.S. 2001, “Scale and Scope Economies in the European Banking Systems,” Journal of Multinational Financial Management, 11, 515-531.
Cebenoyan, A.S. 1990, “Scope Economies in Banking: The Hybrid Box-Cox Function,” The
Financial Review, 25(1), 115-125. Cebenoyan, A.S., Cooperman, E.S., and Register, C.A. 1993a, “Firm Inefficiency and the
Regulatory Closure of S&Ls: An Empirical Investgation,” Review of Economics and Statistics, 75, 540-545.
Cebenoyan, A.S., Cooperman, E.S., and Register, C.A. 1993b, “The Relative Efficiency of Stock
vs. Mutual S&Ls: A Stochastic Cost Frontier Approach,” Journal of Financial Services Research, 7, 151-170.
Clark, J. and Siems, T.F. 2002, “X-Efficiency in Banking: Looking beyond the Balance Sheet,”
Journal of Money, Credit, and Banking, Vol. 34, No. 4 Cummins, D.J. and Sommer, D.W. 1996, “Capital and Risk in Property-Liability Insurance
Markets,” Journal of Banking and Finance, 20, 1069-1092. Cummins, D.J. and Danzon, P. 1997, “Price Shocks and Capital Flows in Liability Insurance,”
Journal of Financial Intermediation, 6, 3-38. Cummins, D.J., Tennyson, S., and Weiss, M.A. 1999, “Consolidation and Efficiency in the US
Life Insurance Industry,” Journal of Banking & Finance, 23, 325-357. Cummins, D.J., Weiss, M.A., and Zi, H. 1999, “Organizational Form and Efficiency: The
Coexistence of Stocks and Mutual Property-Liability Insurers,” Management Science, Vol. 45, No. 9, 1254-1269.
Cummins, D.J., and Weiss, M.A. 2001, “Analyzing Firm Performance in the Insurance Industry
Using Frontier Efficiency and Productivity Models,” in G. Dionne, ed., Handbook of Insurance (Boston: Kluwer Academic Publishers), Chapter 24.
Cummins, D.J., Weiss, M.A., and Zi, H. 2003, “Economies of Scope in Financial Services: A
DEA Bootstrapping Analysis of the US Insurance Industry,” working paper, University of Pennsylvania.
Ferrier, G.D., Shawna Grosskopf, Kathy Hayes, and Suthathip Yaisawarng. 1993, “Economies of
Diversification in the Banking Industry: A Frontier Approach,” Journal of Monetary Economics 31: 229-249.
Gallo, J. G., Apilado, V.P., and Kolari, J.W. 1996, “Commercial Bank Mutual Fund Activities:
Implications for Bank Risk and Profitability,” Journal of Banking and Finance 20, 1775-1791.

47
Gardner, L. and Grace, M.F. 1993. “X-Efficiency in the U.S. Life Insurance Industry,” Journal of Banking and Finance 17(2-3): 497-510.
General Accounting Office, 1990, “Insurance Regulation: The Insurance Regulatory Information
/system Needs Improvement,” GAO/GDC, 91-20, Washington, DC. Goldberg, L.G., Gerald A. Hanweck, Michael Keenan, and Allister Young. 1991, “Economics of
Scale And Scope in the Securities Industry,” Journal of Banking and Finance 15: 91-107. Golter, G. 1996, “Banks and mutual funds”’ Federal Deposit Insurance Company Banking
Review, 8:10–20. Grace, M. and Stephen G. Timme. 1992, “An Examination of Cost Economies in the United
States Life Insurance Industry,” Journal of Risk and Insurance 59(1): 72-103. Hermalin, B.E. and Wallace, N.E. 1994, “The Determinants of Efficiency and Solvency in
Savings and Loans,” Rand Journal of Economics, 25, 361-381. Herring, R. J., and Santomero, A. M. 1990, “The Corporate Structure of Financial
Conglomerates,” Journal of Financial Services Research, 4, 471-497. Hirao, Y., and Inoue, T. 2004, “On The Cost Structure of The Japanese Property-Casualty
Insurance Industry,” Journal of Risk and Insurance, 71(3), 501-530. Hughes, J.P., and Mester, L.J. 1998, “Bank Capitalization and Cost: Evidence of Scale
Economies in Risk Management and Signaling,” Review of Economics and Statistics 80, 314–25.
Hughes, J.P., Mester, L.J., and Moon, C.G. 2001, “Are Scale Economies in Banking Elusive or
Illusive? Evidence Obtained by Incorporating Capital Structure and Risk-Taking into Models of Bank Production,” Journal of Banking and Finance 25, 2169-2208.
Humphrey, D., & Pulley, L. 1997, “Bank’s Responses to Deregulation: Profits, Technology and
Efficiency,” Journal of Money, Credit and Banking, 29, 73–93. Hunter, W.C., Stephen G. Timme, and Won Keun Yang. 1990, “An Examination of Cost
Subadditivity and Multiproduct Production in Large U.S. Banks,” Journal of Money, Credit and Banking 22(4): 504-525.
Jagtiani, J. and Khanthavit, A. 1996, “Scale and Scope Economies at Large Banks: Including
Off-Balance-sheet Products and Regulatory Effects 1984–1991,” Journal of Banking and Finance 20, 1271–87.
Jagtiani, J., Nathan, A., and Sick, G. 1995, “Scale Economies and Cost Complementarities in
Commercial Banks: On- and Off-Balance-Sheet Activities,” Journal of Banking and Finance 19, 1175–89.

48
Jappelli, T. and Pagano, M. 2002, “Information Sharing, Lending and Defaults: Cross-country
Evidence,” Journal of Banking and Finance 26(10), 2017-2045. Jensen, M.C., 1993. "The Modern Industrial Revolution, Exit, and the Failure of Internal Control
Systems," Journal of Finance, vol. 48(3): 831-880. Johnston, J. and Madura, J. 2000, “Valuing the Potential Transformation of Banks into Financial
Service Conglomerates: Evidence from the Citigroup Merger,” The Financial Review 35 (2), 17–36.
Kane, E.J. 1995, “What is the value-added for large banks in offering Mutual Funds?,” WP 5111.
Cambridge, MA: National Bureau of Economic Research. Kane, E.J. 1999, “Implications of Superhero Metaphors for the Issue of Banking Powers,”
Journal of Banking and Finance 23, 663-673. Kashyap, A.K., Raghuram Rajan and Jeremy C. Stein. 2002, "Banks As Liquidity Provider: An
Explanation For The Coexistence Of Lending And Deposit-Taking," Journal of Finance, 57:33-73.
Kellner, S. and G. Frank Mathewson. 1983, “Entry, Size Distribution, Scale, and Scope
Economies in the Life Insurance Industry,” Journal of Business 56: 25-44. Khaled, M., Adams, M.B., and Pickford, M. 2001, “Estimates of Scale and Scope Economies in
the New Zealand Life Insurance Industry,” The Manchester School, 69(3), 327-349. Kim, W., Mayers, D., and Smith, C. 1996, “On the Choice of Insurance Distribution Systems,”
Journal of Risk and Insurance, 63(2): 207-227. Kwan, S.H., and Eisenbeis, R.A. 1995, “An Analysis of Inefficiencies in Banking,” Journal of
Banking and Finance, June 1995, Volume 19, Numbers 3-4, Page 733-734. Lamont, Owen. 1997, “Cash Flow and Investment: Evidence from Internal Capital Markets,”
The Journal of Finance, Vol. 52, No. 1: 83-109. Lang, Gunter, and Welzel, Peter. 1998, “Technology and Cost Efficiency in Universal Banking:
A ‘Thick-Frontier’ Analysis of the German Banking Industry,” Journal of Productivity Analysis, 10(1), 63-84.
Lown, C.S., Osler, C.L., Strahan, P.E., and Sufi, A. 2000, “The Changing Landscape of the
Financial Services Industry: What Lies Ahead?,” FRBNY Economic Policy Review, October, 39-55.
McKillop, d.G., Glass, J.C., and Morikawa, Y. 1996, “The Composite Cost Function and
Efficiency in Giant Japanese Banks,” Journal of Banking and Finance, 20, 1651-1671.

49
Mester, L., Nakamura, L. and Renault, M. 2002, “Checking Accounts and Bank Monitoring,”
Wharton Financial Institution Working Paper. Wharton School Center for Financial Institutions, University of Pennsylvania.
Mester, L. J. 1987, “A Multiproduct Cost Study of Savings and Loans,” Journal of Finance, 42,
423–445. Mester, L.J. 1992, “Banking and Commerce: A Dangerous Liaison?,” Federal Reserve Bank of
Philadelphia Business Review, May/June, 17-29. Mester, L. J. 1993, “Efficiency in the Savings and Loan Industry,” Journal of Banking and
Finance 17(2-3): 267-286. Mester, L. J. 1996, “A Study of Bank Efficiency Taking into Account Risk-preferences,” Journal
of Banking and Finance, 20, 1025-1045. Milbourn, T.T., Boot, A.W.A., and Thakor, A.V. 1999, “Megamergers and Expanded Scope:
Theories of Bank Size and Activity Deversity,” Journal of Banking and Finance, 23, 195-214.
Noulas, A.G., Stephen M. Miller, Subhash C. Ray. 1993, “Regularity Conditions and Scope
Estimates: The Case of Large-Sized U.S. Banks,” Journal of Financial Services Research 7(3): 235-48.
Panzar, J. Willig, R. 1975, “Economies of Scale and Economies of Scope in Multioutput
Production,” Economic Discussion paper no. 33. Bell Laboratories. Panzar, J., Willig, R. 1981, “Economies of Scope,” American Economic Review 71, 268–272. Pi, L. and Timme, S. 1993, “Corporate Control and Bank Efficiency,” Journal of Banking and
Finance, 17, 515-530. Pulley, L. and Braunstein, Y. M. 1992, “A Composite Cost Function for Multiproduct Firms with
An Application to Economies of Scope in Banking,” Review of Economics and Statistics, 74, 221-230.
Pulley, L. and Humphrey, D. 1993, “The Role of Fixed Costs and Cost Complementarities in
Determining Scope Economies and the Cost of Narrow Banking Proposals,” Journal of Business 66(3): 437-462.
Rogers, K.E. 1998, “Nontraditional Activities and the Efficiency of U.S. Commercial Banks,”
Journal of Banking and Finance 22, 467–82. Saunders, A. and Ingo Walter. 1994, Universal Banking in the United States: What Could We
Gain? What Could We Lose? Oxford University Press.
50
Scharfstein, D.S. and Jeremy C. Stein. 2000, "The Dark Side of Internal Capital Markets:
Divisional Rent-Seeking and Inefficient Investment," Journal of Finance, American Finance Association, vol. 55(6): 2537-2564.
Shin, Hyun-Han and Rene M. Stulz, 1998, “Are Internal Capital Markets Efficient?,” The
Quarterly Journal of Economics, Vol. 113, No. 2: 531-552. Skipper, Harold D. and W. Jean Kwon, 2007, “Risk Management and Insurance Perspectives in
A Global Economy,” Blackwell Publishing. Stiroh, K. J. 2000, “How did Bank Holding Companies Prosper in the 1990s?,” Journal of
Banking and Finance, 24, 1703–1745. Taylor, G. 2000, Loss Reserving: An Actuarial Perspective, (Bonston: Kluwer Academic
Publishers). Toivanen, O. 1997, “Economies of Scale and Scope in the Finnish Non-Life Insurance Industry,”
Journal of Banking and Finance 21: 759-779. Valverde, Santiago Carbo and Fernandez, Francisco Rodriguez. 2005, “New Evidence of Scope
Economies among Lending, Deposit-taking, Loan Commitments and Mutual Fund Activities,” Journal of Economics and Business, vol.57(3), 187-207.
Vander Vennet, R. 1996, “The Effect of Mergers and Acquisitions on the Efficiency and
Profitability of EU Credit Institutions,” Journal of Banking and Finance, 20(9), 1531-1558. Vander Vennet, R. 1999, “Cost and Profit Dynamics in Financial Conglomerates and Universal
Banks in Europe,” University of Ghent. Belgium. Vander Vennet, R. 2002, “Cost and Profit Efficiency of Financial Conglomerates and Universal
Banks in Europe,” Journal of Money, Credit and Banking, 34, 1. Viswanathan, Krupa S. and J. David Cummins. 2003, “Ownership Structure Changes in the
Insurance Industry: An Analysis of Demutualization,” Journal of Risk and Insurance 70, no. 401-437.
Winton, A. 1999, “Don’t Put All Your Eggs in One Basket? Diversification and Specialization in
Lending,” Working Paper, SSRN: http://ssrn.com/abstract=173615 Yeager, Timothy J., Yeager, Fred C. and Harshman, Ellen F. 2004, “The Financial
Modernization Act: Evolution or Revolution?,” FRB of St. Louis Supervisory Policy Analysis Working Paper, No. 2004-05.
Yuengert, A. 1993, “The Measurement of Efficiency in Life Insurance: Estimates of a Mixed
Normal-Gamma Error Model,” Journal of Banking and Finance 17(2-3): 483-496.

Table 1 Data Sample Statistics
2003 2004 2005 Total
Joint Firms 88 85 87 260 - Bank & LH 38 37 36 111 - Bank & PC 14 15 15 44 - Bank & LH, PC 36 33 26 95
Insurance Specialists 204 208 209 621 - Life Insurers 110 104 102 316 - PC Insurers 144 149 151 444
Banking Specialists 461 470 509 1,440 - Commercial Banks 389 402 439 1,230 - Thrift Saving Banks 132 132 146 410
This table lists the number of firms contained in the data sample by sectors and product lines. The firms under common ownership are aggregated to the group level. Joint firms are those producing both banking and insurance products. Life, PC, CB and SB subsidiaries are joint producers' business divisions by product lines. Insurance and banking specialists are firms producing only insurance or banking products, respectively. The data sample accounts for 98 percent life insurance industry assets, 94 percent property-liability insurance assets, 88 percent commercial banks assets, and 81 percent thrift saving banks assets.
Note: LH is the abbreviation for life insurance. PC is the abbreviation for property-liability insurance. "Bank & LH" refers to the affiliation between banks and life insurance companies, "Bank & PC" refers to the affiliation between banks and property-liability insurance companies, and "Bank & LH, PC" refers to the affiliation between banks, life insurance and property-liability insurance.

Table 2. Outputs and Inputs MeasuresPanel A: Property-Liability Insurers
QuantityPresent Value of Losses Incurred (PV (L )) Price = ( Premium Earned - Present Value of Losses Incurred ) / Present Value (1) Personal short-tail lines of Losses Incurred (2) Personal long-tail lines (3) Commercial short-tail lines (4) Commercial long-tail lines
Average Invested Assets Expected Rate of Return (ROR) on the Insurer's Assets Insurer holding of stocks and other invested assets -- Expected ROR on Invested Assets is the weighted average of the expected return on
stocks and on other invested assets-- Expected ROR on stocks is cost of equity capital using 3-Factor Fama-French CAPM
with industry beta (SIC 6331) from Ibbotson Associates.-- Expected ROR on other invested assets is the ratio of acutal investment income (minus
dividends on stock) to insurer holding of other invested assets.
QuantityAdminstrative Labor Total Administration and Manager Labor Expenses/Input Price Agent Labor Total Acquisition Expenses/Input Price Materials & Business Services All Non Labor Expense / Input PriceFinancial Equity Capital Equity Capital (Surplus)
Debt Capital Loss Reserves and Unearned Premium Reserves
Panel B: Life-Health Insurers
QuantityIncurred Benefits plus Additions to Reserves (L + W ) Price = [Premium Earned + Investment Income - (Incurred Benefits + Additions to (1) Personal life insurance Reserves)] / (Incurred Benefits + Additions to Reserves) (2) Personal annuities (3) Group life insurance (4) Group annuities (5) Accident & Health
QuantityAdminstrative Labor Total Administration and Manager Labor Expenses/Input Price Agent Labor Total Acquisition Expenses/Input Price Materials & Business Services All Non Labor Expense / Input PriceFinancial Equity Capital Equity Capital (Surplus)
Debt Capital Loss Reserves and Unearned Premium Reserves
OutputsPrice
Inputs
Price
Real Avg. Weekly Wage SIC 7300
Price
OutputsPrice
Inputs
Real Average Weekly Wages SIC 6331
Real Average Weekly Wages SIC 6411
Cost of equity capital using 3-Factor Fama-French CAPM using industry beta (SIC 6331) from Ibbotson Associates.
Price = Investment Income Attributed to Policy Holders / Input Quantity
Price = Investment Income Attributed to Policy Holders / Input Quantity
Real Average Weekly Wages SIC 6311
Real Average Weekly Wages SIC 6411
Real Avg. Weekly Wage SIC 7300
Cost of equity capital using 3-Factor Fama-French CAPM using industry beta (SIC 6311) from Ibbotson Associates.

Panel C: Banks
QuantityConsumer Loans Residential real estate loans, Loans to individuals.Business Loans Commercial real estate loans, Commercial & Industrial loans, Farm loans, Other loans.Other Assets Securities and Investments held, and Off-Balance Sheet (OBS) activities
QuantityDeposits Demand Deposits, Saving and Small Time Deposits, and Other deposits ( domestic only)Labor Number of Employees Reported Physical Capital Dollar Value of Net Premises and Fixed Assets
Purchased Funds Federal Funds Purchased, Foreign Deposits, and Other Liabilities for Borrowed Money
Sum of the total interests and earnings on securities and investment and the total non-interest income divided by the total dollar value of “other assets”.
Total interest income earned on these loans divided by the quantity of these loans
OutputsPrice
Inputs
Total interest income earned on these loans divided by the quantity of these loans
Price
The interest paid on these funds divided by the dollar value of purchased funds
The occupancy and fixed asset expenditures divided by the quantity of physical capital.
The salary, wage and welfare per employee
Total interest expenses on the deposits divided by the quantity of total deposits
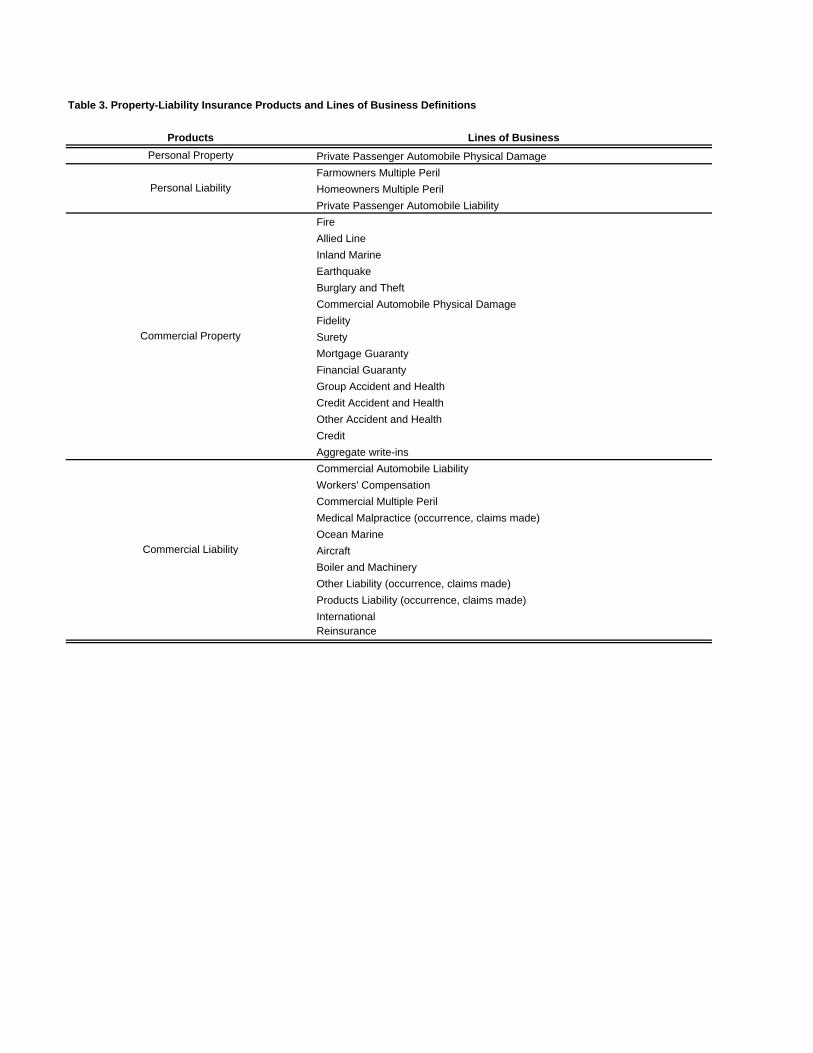
Table 3. Property-Liability Insurance Products and Lines of Business Definitions
Products Lines of BusinessPersonal Property Private Passenger Automobile Physical Damage
Farmowners Multiple PerilHomeowners Multiple PerilPrivate Passenger Automobile LiabilityFireAllied LineInland MarineEarthquakeBurglary and TheftCommercial Automobile Physical DamageFidelitySuretyMortgage GuarantyFinancial GuarantyGroup Accident and HealthCredit Accident and HealthOther Accident and HealthCredit Aggregate write-insCommercial Automobile LiabilityWorkers' CompensationCommercial Multiple PerilMedical Malpractice (occurrence, claims made)Ocean MarineAircraft Boiler and MachineryOther Liability (occurrence, claims made)Products Liability (occurrence, claims made)InternationalReinsurance
Personal Liability
Commercial Property
Commercial Liability

Table 4. Descriptive Statistics of Variables in Composite Function Estimation - Commercial Banks
Panel A: Descriptive statistics for diversified commercial banks ( N= 111 )
Variable Definition Mean Std. Dev. Min MaxCost 3,821,298 8,868,608 4,035 51,172,912Revenue 5,020,367 11,661,406 4,949 67,617,667Profit 1,199,069 2,816,317 -18,449 16,444,755Output quantity - Consumer loans 33,050,750 73,816,765 0 358,827,325Output quantity - Business loans 20,434,609 48,476,928 0 268,248,721Output quantity - Other assets 150,522,991 479,974,730 74,302 3,117,297,782Input price - Labor 78.5325 45.3557 35.8438 347.2667Input price - Net premiuses and fixed assets 1.6137 5.7786 0.0000 52.2632Input price - Deposits 0.0169 0.0147 0.0009 0.0969Input price - Purchased Fund 0.0250 0.0241 0.0000 0.2176
Panel B: Descriptive statistics for specialist commercial banks ( N= 1,238 )
Variable Definition Mean Std. Dev. Min MaxCost 288,041 644,243 20,013 5,518,470Revenue 368,159 822,725 18,563 7,105,638Profit 80,118 186,667 -59,209 1,738,170Output quantity - Consumer loans 1,741,006 4,120,055 0 35,748,992Output quantity - Business loans 2,261,665 5,119,329 0 46,505,825Output quantity - Other assets 4,183,472 12,178,919 139,659 129,215,588Input price - Labor 59.8007 22.7612 20.1755 276.4737Input price - Net premiuses and fixed assets 0.3977 0.6602 0.0000 14.1736Input price - Deposits 0.0149 0.0056 0.0020 0.0596Input price - Purchased Fund 0.0290 0.0247 0.0000 0.6769
Panel C: Descriptive statistics for all commercial banks ( N= 1,349 )
Variable Definition Mean Std. Dev. Min MaxCost 578,768 2,782,530 4,035 51,172,912Revenue 750,957 3,654,265 4,949 67,617,667Profit 172,189 879,677 -59,209 16,444,755Output quantity - Consumer loans 4,317,271 23,114,961 0 358,827,325Output quantity - Business loans 3,756,992 15,516,865 0 268,248,721Output quantity - Other assets 16,224,752 143,365,414 74,302 3,117,297,782Input price - Labor 61.3420 25.8804 20.1755 347.2667Input price - Net premiuses and fixed assets 0.4977 1.7991 0.0000 52.2632Input price - Deposits 0.0151 0.0069 0.0009 0.0969Input price - Purchased Fund 0.0287 0.0246 0.0000 0.6769
This table provides summary statistics of variables used in the composite function estimation. Cost, Revenue, Profit, and output quantities are in thousands.

Table 5. Descriptive Statistics of Variables in Composite Function Estimation - Thrift Saving Banks
Panel A: Descriptive statistics for diversified thrifit saving banks ( N= 68 )
Variable Definition Mean Std. Dev. Min MaxCost 219,562 512,449 5,416 3,177,384Revenue 251,198 596,823 6,025 3,670,408Profit 31,636 87,580 -20,548 493,024Output quantity - Consumer loans 1,529,552 3,048,094 0 12,826,927Output quantity - Business loans 283,622 1,129,100 0 7,047,061Output quantity - Other assets 3,337,837 9,804,086 7,400 50,942,408Input price - Labor 72.6990 28.7693 38.7872 251.0833Input price - Net premiuses and fixed assets 5.1889 12.3835 0.0000 61.9318Input price - Deposits 0.0212 0.0067 0.0060 0.0361Input price - Purchased Fund 0.0287 0.0284 0.0000 0.1990
Panel B: Descriptive statistics for specialist thrift saving banks ( N= 202 )
Variable Definition Mean Std. Dev. Min MaxCost 258,653 336,869 32,583 2,526,626Revenue 328,918 434,286 47,141 3,253,980Profit 70,265 111,019 -19,880 727,354Output quantity - Consumer loans 3,405,588 4,586,445 895 27,655,552Output quantity - Business loans 924,846 1,767,719 0 16,150,809Output quantity - Other assets 2,734,887 4,311,897 114,652 28,828,965Input price - Labor 63.2470 24.1848 29.1730 295.5603Input price - Net premiuses and fixed assets 0.5389 0.4275 0.0000 2.9332Input price - Deposits 0.0185 0.0057 0.0059 0.0422Input price - Purchased Fund 0.0385 0.0390 0.0000 0.5253
Panel C: Descriptive statistics for all thrift saving banks ( N= 270 )
Variable Definition Mean Std. Dev. Min MaxCost 248,808 387,931 5,416 3,177,384Revenue 309,344 480,404 6,025 3,670,408Profit 60,536 106,781 -20,548 727,354Output quantity - Consumer loans 2,933,105 4,324,080 0 27,655,552Output quantity - Business loans 763,352 1,652,333 0 16,150,809Output quantity - Other assets 2,886,741 6,156,456 7,400 50,942,408Input price - Labor 65.6275 25.6923 29.1730 295.5603Input price - Net premiuses and fixed assets 1.7100 6.5131 0.0000 61.9318Input price - Deposits 0.0191 0.0060 0.0059 0.0422Input price - Purchased Fund 0.0360 0.0368 0.0000 0.5253
This table provides summary statistics of variables used in the composite function estimation. Cost, Revenue, Profit, and output quantities are in thousands.

Table 6. Descriptive Statistics of Variables in Composite Function Estimation - Life Insurance Companies
Panel A: Descriptive statistics for diversified life insurance companies ( N= 133 )
Variable Definition Mean Std. Dev. Min MaxCost 831,038 1,033,719 535 4,145,507Revenue 1,125,697 1,400,670 3,545 6,489,245Profit 294,659 434,943 -38,546 2,343,738Output quantity - Life Insurance 957,672 1,636,354 8 7,719,653Output quantity - Annuities 1,435,005 2,609,786 0 12,558,310Output quantity - Accident & Health Insurance 284,276 535,468 0 2,669,184Input price - Administration and management labor 1265.34 228.10 807.00 1882.00Input price - Agent labor 1024.27 98.11 796.52 1457.71Input price - Materials and physical capital 706.63 145.73 435.05 1019.43Input price - Equity capital 0.1200 0.0061 0.1132 0.1280Input price - Debt capital 0.0445 0.0140 0.0102 0.0823
Panel B: Descriptive statistics for specialist life insurance companies ( N= 315 )
Variable Definition Mean Std. Dev. Min MaxCost 237,061 311,482 79 1,833,309Revenue 311,534 422,973 255 2,373,229Profit 74,474 139,820 -66,198 1,005,259Output quantity - Life Insurance 217,125 364,395 0 2,955,663Output quantity - Annuities 251,982 437,434 0 2,867,009Output quantity - Accident & Health Insurance 252,897 587,877 0 3,382,254Input price - Administration and management labor 1241.30 219.13 760.00 1923.00Input price - Agent labor 999.39 99.63 760.01 1412.22Input price - Materials and physical capital 714.76 177.99 353.01 1473.32Input price - Equity capital 0.1200 0.0061 0.1132 0.1280Input price - Debt capital 0.0466 0.0173 0.0102 0.1192
Panel C: Descriptive statistics for all life insurance companies ( N= 448 )
Variable Definition Mean Std. Dev. Min MaxCost 413,398 676,399 79 4,145,507Revenue 553,239 918,529 255 6,489,245Profit 139,841 282,382 -66,198 2,343,738Output quantity - Life Insurance 436,975 999,362 0 7,719,653Output quantity - Annuities 603,192 1,561,572 0 12,558,310Output quantity - Accident & Health Insurance 262,213 572,405 0 3,382,254Input price - Administration and management labor 1248.44 221.85 760.00 1923.00Input price - Agent labor 1006.78 99.72 760.01 1457.71Input price - Materials and physical capital 712.35 168.94 353.01 1473.32Input price - Equity capital 0.1200 0.0061 0.1132 0.1280Input price - Debt capital 0.0460 0.0164 0.0102 0.1192
This table provides summary statistics of variables used in the composite function estimation. Cost, Revenue, Profit, and output quantities are in thousands.

Table 7. Descriptive Statistics of Variables in Composite Function Estimation - Property-Liability Insurance Companies
Panel A: Descriptive statistics for diversified property-liability insurance companies ( N= 114 )
Variable Definition Mean Std. Dev. Min MaxCost 535,078 1,077,620 52 6,792,995Revenue 662,600 1,247,356 73 7,258,835Profit 127,522 218,534 -24,344 1,123,429Output quantity - Personal property-liability insurance 485,816 1,130,523 0 5,597,831Output quantity - Commercial property-liability insurance 312,227 690,986 0 3,923,788Output quantity - Invested assets 3,128,234 5,587,308 2,570 29,081,332Input price - Administration and management labor 1145.71 130.96 792.00 1408.00Input price - Agent labor 1007.18 125.09 665.00 1438.53Input price - Materials and physical capital 679.10 203.02 432.33 1655.83Input price - Equity capital 0.0811 0.0015 0.0798 0.0832Input price - Debt capital 0.0287 0.0267 0.0102 0.1889
Panel B: Descriptive statistics for specialist property-liability insurance companies ( N= 443 )
Variable Definition Mean Std. Dev. Min MaxCost 331,560 458,874 323 4,402,666Revenue 421,052 592,411 233 5,921,569Profit 89,492 182,961 -385,183 1,518,902Output quantity - Personal property-liability insurance 167,852 315,397 0 1,961,435Output quantity - Commercial property-liability insurance 284,816 451,168 0 3,970,428Output quantity - Invested assets 2,339,506 3,114,810 5,791 26,166,168Input price - Administration and management labor 1171.83 152.04 664.00 1707.00Input price - Agent labor 1046.39 130.13 714.00 1444.00Input price - Materials and physical capital 706.07 158.86 296.82 1154.76Input price - Equity capital 0.0811 0.0015 0.0798 0.0832Input price - Debt capital 0.0315 0.0281 0.0102 0.3449
Panel C: Descriptive statistics for all property-liability insurance companies ( N= 557 )
Variable Definition Mean Std. Dev. Min MaxCost 373,214 640,437 52 6,792,995Revenue 470,490 777,640 73 7,258,835Profit 97,275 191,188 -385,183 1,518,902Output quantity - Personal property-liability insurance 232,929 596,087 0 5,597,831Output quantity - Commercial property-liability insurance 290,426 508,898 0 3,970,428Output quantity - Invested assets 2,500,934 3,762,829 2,570 29,081,332Input price - Administration and management labor 1166.48 148.23 664.00 1707.00Input price - Agent labor 1038.37 129.97 665.00 1444.00Input price - Materials and physical capital 700.55 168.99 296.82 1655.83Input price - Equity capital 0.0811 0.0015 0.0798 0.0832Input price - Debt capital 0.0309 0.0278 0.0102 0.3449
This table provides summary statistics of variables used in the composite function estimation. Cost, Revenue, Profit, and output quantities are in thousands.

Table 8. Cost, Revenue, and Profit Scope Economy Estimates
Panel A: Cost Scope Economies
1st Quartile Median 3rd QuartileAll -19.9% ** -11.4% ** -36.0% ***Joint Firms -0.1% -24.1% *** -70.8% ***Synthetic Joint Firms -24.4% *** -26.0% *** -78.6% ***
Panel B: Revenue Scope Economies
1st Quartile Median 3rd QuartileAll 29.2% *** 25.6% *** 49.6% ***Joint Firms 15.7% ** 32.1% *** 74.3% ***Synthetic Joint Firms 33.7% *** 38.8% *** 78.1% ***
Panel C: Profit Scope Economies
1st Quartile Median 3rd QuartileAll 2.6% * 3.9% * 7.6% ***Joint Firms -0.4% 2.0% * 16.9% ***Synthetic Joint Firms 6.3% *** 10.3% *** 25.9% ***
*** Significant at 1%** Significant at 5%* Significant at 10%
Notes: The data sample used to evaluate scope economies contains 260 actual joint firms and 298,185 hypothetic joint firms, which is created by merging every insurance specialist with every bank specialist. Scope economy is present if the scope economy score is greater than zero; Scope diseconomy is present if the scope economy score is less than zero; Neither scope economy nor diseconomy is present if the scope economy score equals zero.
Cost Scope Economies
Revenue Scope Economies
Profit Scope Economies
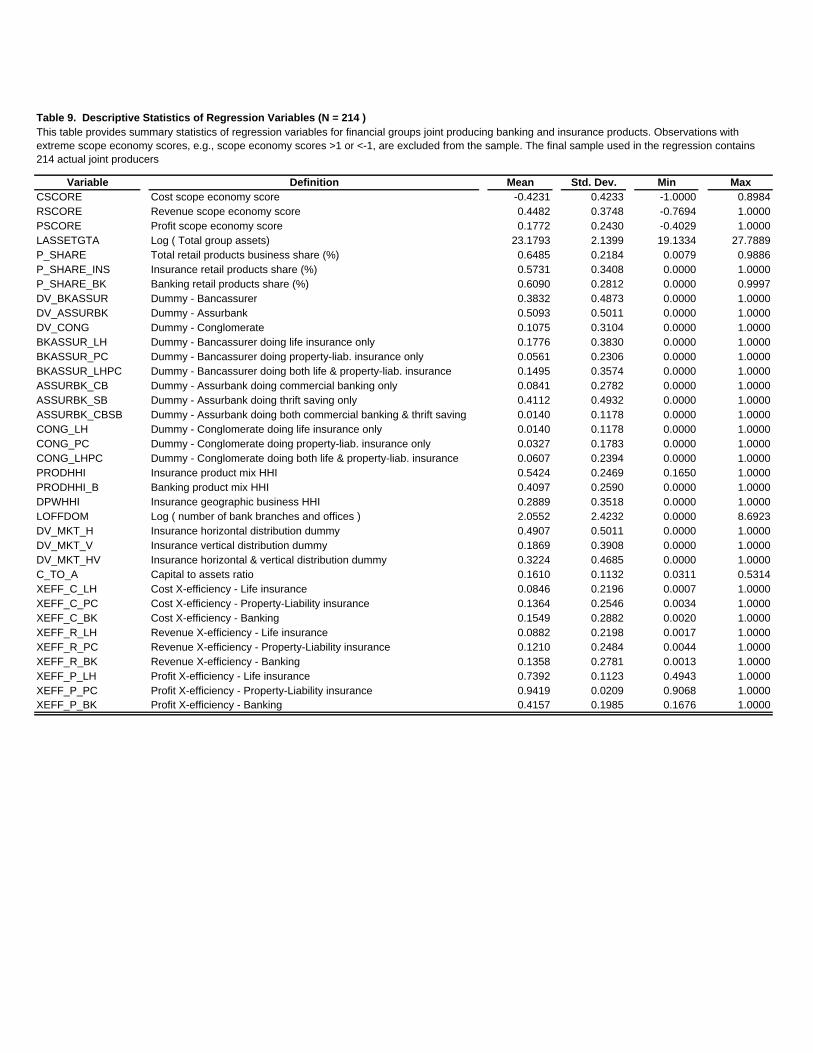
Table 9. Descriptive Statistics of Regression Variables (N = 214 )
Variable Definition Mean Std. Dev. Min MaxCSCORE Cost scope economy score -0.4231 0.4233 -1.0000 0.8984RSCORE Revenue scope economy score 0.4482 0.3748 -0.7694 1.0000PSCORE Profit scope economy score 0.1772 0.2430 -0.4029 1.0000LASSETGTA Log ( Total group assets) 23.1793 2.1399 19.1334 27.7889P_SHARE Total retail products business share (%) 0.6485 0.2184 0.0079 0.9886P_SHARE_INS Insurance retail products share (%) 0.5731 0.3408 0.0000 1.0000P_SHARE_BK Banking retail products share (%) 0.6090 0.2812 0.0000 0.9997DV_BKASSUR Dummy - Bancassurer 0.3832 0.4873 0.0000 1.0000DV_ASSURBK Dummy - Assurbank 0.5093 0.5011 0.0000 1.0000DV_CONG Dummy - Conglomerate 0.1075 0.3104 0.0000 1.0000BKASSUR_LH Dummy - Bancassurer doing life insurance only 0.1776 0.3830 0.0000 1.0000BKASSUR_PC Dummy - Bancassurer doing property-liab. insurance only 0.0561 0.2306 0.0000 1.0000BKASSUR_LHPC Dummy - Bancassurer doing both life & property-liab. insurance 0.1495 0.3574 0.0000 1.0000ASSURBK_CB Dummy - Assurbank doing commercial banking only 0.0841 0.2782 0.0000 1.0000ASSURBK_SB Dummy - Assurbank doing thrift saving only 0.4112 0.4932 0.0000 1.0000ASSURBK_CBSB Dummy - Assurbank doing both commercial banking & thrift saving 0.0140 0.1178 0.0000 1.0000CONG_LH Dummy - Conglomerate doing life insurance only 0.0140 0.1178 0.0000 1.0000CONG_PC Dummy - Conglomerate doing property-liab. insurance only 0.0327 0.1783 0.0000 1.0000CONG_LHPC Dummy - Conglomerate doing both life & property-liab. insurance 0.0607 0.2394 0.0000 1.0000PRODHHI Insurance product mix HHI 0.5424 0.2469 0.1650 1.0000PRODHHI_B Banking product mix HHI 0.4097 0.2590 0.0000 1.0000DPWHHI Insurance geographic business HHI 0.2889 0.3518 0.0000 1.0000LOFFDOM Log ( number of bank branches and offices ) 2.0552 2.4232 0.0000 8.6923DV_MKT_H Insurance horizontal distribution dummy 0.4907 0.5011 0.0000 1.0000DV_MKT_V Insurance vertical distribution dummy 0.1869 0.3908 0.0000 1.0000DV_MKT_HV Insurance horizontal & vertical distribution dummy 0.3224 0.4685 0.0000 1.0000C_TO_A Capital to assets ratio 0.1610 0.1132 0.0311 0.5314XEFF_C_LH Cost X-efficiency - Life insurance 0.0846 0.2196 0.0007 1.0000XEFF_C_PC Cost X-efficiency - Property-Liability insurance 0.1364 0.2546 0.0034 1.0000XEFF_C_BK Cost X-efficiency - Banking 0.1549 0.2882 0.0020 1.0000XEFF_R_LH Revenue X-efficiency - Life insurance 0.0882 0.2198 0.0017 1.0000XEFF_R_PC Revenue X-efficiency - Property-Liability insurance 0.1210 0.2484 0.0044 1.0000XEFF_R_BK Revenue X-efficiency - Banking 0.1358 0.2781 0.0013 1.0000XEFF_P_LH Profit X-efficiency - Life insurance 0.7392 0.1123 0.4943 1.0000XEFF_P_PC Profit X-efficiency - Property-Liability insurance 0.9419 0.0209 0.9068 1.0000XEFF_P_BK Profit X-efficiency - Banking 0.4157 0.1985 0.1676 1.0000
This table provides summary statistics of regression variables for financial groups joint producing banking and insurance products. Observations with extreme scope economy scores, e.g., scope economy scores >1 or <-1, are excluded from the sample. The final sample used in the regression contains 214 actual joint producers

Panel B: Descriptive statistics for synthetic joint firms ( N= 248,661)
Variable Definition Mean Std. Dev. Min MaxCSCORE Cost scope economy score -0.4968 0.4410 -1.0000 0.9999RSCORE Revenue scope economy score 0.5588 0.3782 -0.9998 1.0000PSCORE Profit scope economy score 0.1881 0.2334 -0.9998 1.0000LASSETGTA Log ( Total group assets) 22.6287 0.9728 21.0881 26.3682P_SHARE Total retail products business share (%) 0.5896 0.1482 0.0001 0.9999P_SHARE_INS Insurance retail products share (%) 0.4060 0.3651 0.0000 1.0000P_SHARE_BK Banking retail products share (%) 0.6299 0.1399 0.0001 0.9999DV_BKASSUR Dummy - Bancassurer 0.2506 0.4334 0.0000 1.0000DV_ASSURBK Dummy - Assurbank 0.1941 0.3955 0.0000 1.0000DV_CONG Dummy - Conglomerate 0.5553 0.4969 0.0000 1.0000BKASSUR_LH Dummy - Bancassurer doing life insurance only 0.0622 0.2416 0.0000 1.0000BKASSUR_PC Dummy - Bancassurer doing property-liab. insurance only 0.1475 0.3546 0.0000 1.0000BKASSUR_LHPC Dummy - Bancassurer doing both life & property-liab. insurance 0.0409 0.1981 0.0000 1.0000ASSURBK_CB Dummy - Assurbank doing commercial banking only 0.1404 0.3474 0.0000 1.0000ASSURBK_SB Dummy - Assurbank doing thrift saving only 0.0481 0.2141 0.0000 1.0000ASSURBK_CBSB Dummy - Assurbank doing both commercial banking & thrift saving 0.0055 0.0742 0.0000 1.0000CONG_LH Dummy - Conglomerate doing life insurance only 0.1456 0.3527 0.0000 1.0000CONG_PC Dummy - Conglomerate doing property-liab. insurance only 0.2881 0.4529 0.0000 1.0000CONG_LHPC Dummy - Conglomerate doing both life & property-liab. insurance 0.1216 0.3268 0.0000 1.0000PRODHHI Insurance product mix HHI 0.2678 0.3186 0.0000 1.0000PRODHHI_B Banking product mix HHI 3.4043 1.2007 0.0000 7.2766DPWHHI Insurance geographic business HHI 0.5917 0.2549 0.1490 1.0000LOFFDOM Log ( number of bank branches and offices ) 0.3300 0.0826 0.0748 1.0000DV_MKT_H Insurance horizontal distribution dummy 0.5800 0.4936 0.0000 1.0000DV_MKT_V Insurance vertical distribution dummy 0.0944 0.2924 0.0000 1.0000DV_MKT_HV Insurance horizontal & vertical distribution dummy 0.3256 0.3825 0.0000 1.0000C_TO_A Capital to assets ratio 0.1612 0.0792 0.0170 0.6197XEFF_C_LH Cost X-efficiency - Life insurance 0.4554 0.1879 0.1915 1.0000XEFF_C_PC Cost X-efficiency - Property-Liability insurance 0.3751 0.1917 0.1688 1.0000XEFF_C_BK Cost X-efficiency - Banking 0.5360 0.2020 0.2421 1.0000XEFF_R_LH Revenue X-efficiency - Life insurance 0.4249 0.1864 0.1665 1.0000XEFF_R_PC Revenue X-efficiency - Property-Liability insurance 0.3966 0.2035 0.1701 1.0000XEFF_R_BK Revenue X-efficiency - Banking 0.5466 0.2051 0.2522 1.0000XEFF_P_LH Profit X-efficiency - Life insurance 0.8983 0.0406 0.8137 1.0000XEFF_P_PC Profit X-efficiency - Property-Liability insurance 0.9361 0.0255 0.8778 1.0000XEFF_P_BK Profit X-efficiency - Banking 0.6925 0.1497 0.4479 1.0000
This table provides summary statistics of regression variables for synthetic financial groups joint producing banking and insurance products. The synthetic joint producers are created by merging every bank specialists with every insurance specialists in the data sample. Some of the synthetic groups are exclued because of missing variables, inactive operation, or extreme scope economy scores. The final sample include 248,661 obervations for the regression analysis.

Table 10. Scope Economies Regression Analysis - Joint firms (N=214)
Coefficient t stat. Coefficient t stat. Coefficient t stat. Coefficient t stat. Coefficient t stat. Coefficient t stat.Intercept 5.1188 5.91 *** -3.7674 -6.34 *** -3.9126 -7.27 *** 5.2104 6.51 *** -4.0153 -6.96 *** -4.3025 -8.25 ***Firm size variables
Log ( Total group assets) -0.1940 -5.71 *** 0.1506 6.33 *** 0.0693 9.25 *** -0.1967 -6.29 *** 0.1562 6.88 *** 0.0717 10.04 ***Business and product mix variables
Total retail products business share (%) -0.8422 -3.96 *** 0.4321 2.74 *** 0.0954 1.77 ***Insurance retail products share (%) -0.6826 -4.52 *** 0.2618 2.39 ** 0.0779 2.17 **Banking retail products share (%) -0.1349 -0.84 0.1210 0.91 0.0971 2.26 **Dummy - Bancassurer -0.1420 -0.81 0.2235 1.69 * 0.0135 0.30Dummy - Assurbank 0.2330 1.52 -0.1033 -0.91 -0.0596 -1.48Dummy - Bancassurer doing life insurance only -0.1468 -0.69 0.3293 2.15 ** -0.0164 -0.30Dummy - Bancassurer doing property-liab. insurance only -0.6623 -2.31 ** 0.7024 3.33 *** 0.0333 0.49Dummy - Bancassurer doing both life & property-liab. insurance -0.3106 -1.41 0.4867 2.90 *** 0.1199 2.25 **Dummy - Assurbank doing commercial banking only -0.0599 -0.28 0.1730 1.10 -0.0741 -1.32Dummy - Assurbank doing thrift saving only 0.0825 0.44 0.1802 1.34 0.0221 0.47Dummy - Assurbank doing both commercial banking & thrift saving 0.5763 1.66 * -0.4800 -1.81 * -0.1919 -1.92 *Dummy - Conglomerate doing life insurance only -0.5877 -1.72 * 0.5222 1.98 ** 0.1362 1.33Dummy - Conglomerate doing property-liab. insurance only -0.5175 -1.94 ** 0.6693 3.24 *** 0.1316 1.85 *
Business diversification variablesInsurance product mix HHI -0.3979 -2.01 ** 0.2160 1.49 0.1373 2.83 *** -0.2691 -1.35 0.0893 0.60 0.1651 3.33 ***Banking product mix HHI -0.0698 -0.41 0.0415 0.32 -0.0255 -0.56 -0.0679 -0.44 0.0270 0.22 -0.0133 -0.31Insurance geographic business HHI 0.2422 1.50 -0.3447 -2.89 *** -0.1004 -2.55 ** 0.3720 2.31 ** -0.4286 -3.51 *** -0.0898 -2.29 **Log ( number of bank branches and offices ) -0.0104 -0.31 -0.0031 -0.12 0.0159 2.08 ** -0.0409 -1.25 0.0222 0.88 0.0179 2.37 **
Insurance distribution system variablesInsurance horizontal distribution dummy -0.0102 -0.10 0.0537 0.70 -0.0200 -0.77 0.0488 0.48 -0.0198 -0.25 -0.0213 -0.82Insurance vertical distribution dummy 0.1029 0.74 0.0073 0.07 0.0174 0.50 0.1500 1.12 -0.0592 -0.58 0.0038 0.12
Leverage variableCapital to assets ratio -2.0945 -4.23 *** 1.6671 4.54 *** 0.2432 1.96 ** -2.1069 -4.61 *** 1.6650 4.80 *** 0.1850 1.57
X-efficiency variables Cost X-efficiency - Life insurance -0.6069 -2.23 *** -0.7758 -2.90 ***Cost X-efficiency - Property-Liability insurance -0.5800 -2.81 *** -0.3641 -1.82 *Cost X-efficiency - Banking -0.1290 -0.77 -0.1249 -0.73Revenue X-efficiency - Life insurance 0.4271 2.32 ** 0.6218 3.22 ***Revenue X-efficiency - Property-Liability insurance 0.3495 2.31 ** 0.2595 1.65 *Revenue X-efficiency - Banking 0.0755 0.59 0.0922 0.67Profit X-efficiency - Life insurance 0.5299 5.18 *** 0.5832 5.92 ***Profit X-efficiency - Property-Liability insurance 1.9393 3.51 *** 2.1479 4.08 ***Profit X-efficiency - Banking 0.2079 3.33 *** 0.1919 2.97 ***
Year dummy variablesYear 2003 -0.2440 -2.34 ** 0.2325 2.97 *** 0.0737 2.77 *** -0.2755 -2.87 0.2461 3.37 *** 0.0725 2.90 ***Year 2004 -0.1316 -1.32 0.1570 2.07 ** 0.0561 2.05 ** -0.1412 -1.55 0.1557 2.21 ** 0.0551 2.15 **
Average value of dependent variable -0.4231 0.4482 0.1772 -0.4231 0.4482 0.1772Number of observations 214 214 214 214 214 214
*** Significant at the 1% level** Significant at the 5% level* Significant at the 10% level
Independed Variables
This table provides the regression results for financial conglomerates joint producing banking and insurance products. A truncated Tobit model is used. The dependent variabe for the regression <1> and <4> is cost scope economy score; the dependent variabe for the regression <2> and <5> is revenue scope economy score; the dependent variabe for the regression <3> and <6> is profit scope economy score.
Profit Scope Economies< 1 > < 2 > < 3 > < 4 > < 5 > < 6 >
Revenue Scope EconomiesCost Scope Economies Profit Scope Economies Cost Scope Economies Revenue Scope Economies