financial integration in europe - european central bank · key messages 9 executive summary 11 ......
TRANSCRIPT

EURO
PEAN
CEN
TRAL
BAN
K
iNAN
CiAL
iNT
EgRA
TiON
iN
EURO
PE
APRi
L 20
13
F i NANC iAL iNTEgRAT iON iN EUROPEAPR iL 2013

FINANCIAL INTEGRATIONIN EUROPE
APR IL 2013
In 2013 all ECBpublications
feature a motiftaken from
the €5 banknote.

© European Central Bank, 2013
Address Kaiserstrasse 29
60311 Frankfurt am Main
Germany
Postal address Postfach 16 03 19
60066 Frankfurt am Main
Germany
Telephone +49 69 1344 0
Website http://www.ecb.europa.eu
Fax +49 69 1344 6000
All rights reserved. Reproduction for educational and non-commercial purposes is permitted provided that the source is acknowledged.
Unless otherwise stated, this document uses data available as at 15 March 2013.
ISSN 1830-7140 (print)
ISSN 1830-7159 (online)
EU catalogue number QBAJ07001ENC (print)
EU catalogue number QBAJ07001ENN (PDF)
3ECB
Financial integration in Europe
April 2013
CONTENTS
PREFACE 8
KEY MESSAGES 9
EXECUTIVE SUMMARY 11
CHAPTER I
RECENT DEVELOPMENTS IN FINANCIAL INTEGRATION IN THE EURO AREA 15
1 Introduction 15
2 Money markets 16
3 Bond markets 23
4 Equity markets 28
5 Banking markets 31
CHAPTER II
EUROPEAN INSTITUTIONAL REFORM 37
THE SINGLE SUPERVISORY MECHANISM: A PIVOTAL STEP TOWARDS A BANKING UNION 37
1 Introduction 37
2 Rationale for establishing the SSM 37
3 Main features of the proposed SSM regulation 38
4 The benefi ts of the SSM 44
5 Other components to complete the banking union 44
6 Challenges ahead – establishing the SSM 45
CHAPTER III
EUROSYSTEM ACTIVITIES FOR FINANCIAL INTEGRATION 47
1 The legislative and regulatory framework for the fi nancial system 47
2 Catalyst for private sector activities 52
3 Knowledge of the state of fi nancial integration 56
4 Central bank services that foster integration 59
SPECIAL FEATURES
A. EURO AREA MONEY MARKET SEGMENTATION IN THE PRESENT LOW INTEREST RATE
ENVIRONMENT 65
1 Introduction 65
2 Background 67
3 Treasury bill markets 73
4 Short-term repo market 77

4ECB
Financial integration in Europe
April 20134
5 Short-term unsecured market 80
6 Conclusions 84
B. THE INTEGRATION OF THE EURO RETAIL PAYMENTS MARKET – SEPA AND BEYOND 86
1 Why SEPA is a major driver of euro area fi nancial integration and how it has evolved 86
2 Major benefi ts from the creation of SEPA 89
3 The remaining challenges in SEPA 91
4 Looking forward to the next generation of retail payments 93
C. SECTORAL ACCOUNTS AND REBALANCING IN THE EURO AREA 96
1 Introduction 96
2 Regional analysis of sectoral accounts 98
3 Rebalancing of price/cost competitiveness in euro area countries 103
D. US MONEY MARKETS: STRUCTURAL COMPARISON AND IMPLICATIONS
FOR FINANCIAL INTEGRATION 108
1 Introduction 108
2 Overview of US fi nancial system structure 109
3 Major policy and regulatory changes 113
4 US money market dynamics 116
5 Conclusions 124
STATISTICAL ANNEX S1

5ECB
Financial integration in Europe
April 2013
ABBREVIAT IONS
COUNTRIES
AT Austria IT Italy
BE Belgium JP Japan
BG Bulgaria LT Lithuania
CH Switzerland LU Luxembourg
CY Cyprus LV Latvia
CZ Czech Republic MT Malta
DK Denmark NL Netherlands
DE Germany PL Poland
EE Estonia PT Portugal
IE Ireland RO Romania
ES Spain SE Sweden
FI Finland SI Slovenia
FR France SK Slovakia
GR Greece UK United Kingdom
HR Croatia US United States
HU Hungary
OTHERS
ABS Asset-backed security
ACI Financial Markets Association
AFME Association for Financial Markets in Europe
AMEX American Stock Exchange
BCBS Basel Committee on Banking Supervision
BIC Bank identifi er code
BIS Bank for International Settlements
BRRD Bank Recovery & Resolution Directive
CBPP Covered Bond Purchase Programme
CCBM Correspondent central banking model
CCBM2 Collateral Central Bank Management
CCP Central counterparty
CDO Collateralised debt obligation
CDS Credit default swap
CEPR Centre for Economic Policy Research
CESAME Clearing and Settlement Advisory and Monitoring Expert Group
CESR Committee of European Securities Regulators
CFS Center for Financial Studies
CGFS Committee on the Global Financial System
CLS Continuous Linked Settlement
CPSS Committee on Payment and Settlement Systems
CRDIV Capital Requirements Directive
CRR Capital Requirements Regulation
CSD Central securities depository
CSM Clearing and settlement mechanism
DTCC The Depository Trust & Clearing Corporation
DVP Delivery versus payment
EAA Euro area accounts
ABBREVIATIONS
6ECB
Financial integration in Europe
April 2013
EBA European Banking Authority
EBF European Banking Federation
EBRD European Bank for Reconstruction and Development
ECB European Central Bank
Ecofi n Council Council of Economic and Finance Ministers
ECP Euro commercial paper
ECSDA European Central Securities Depositories Association
EEA European Economic Area
EFMLG European Financial Markets Lawyers Group
EFR European Financial Services Round Table
EFSF European Financial Stability Facility
EGMI Expert Group on Market Infrastructures
EIOPA European Insurance and Occupational Pensions Authority
EMIR European Market Infrastructure Regulation
EMU Economic and Monetary Union
EONIA Euro overnight index average
EPC European Payments Council
EPTG European Post Trade Group
ERF European Resolution Fund
ESA European Supervisory Authorities
ESCB European System of Central Banks
ESM European Stability Mechanism
ESMA European Securities and Markets Authority
ESRB European Systemic Risk Board
EU European Union
EUREPO Repo market reference rate for the euro
EURIBOR Euro interbank offered rate
FDIC Federal Deposit Insurance Corporation
FISCO Clearing and Settlement Fiscal Compliance expert group
FOMC Federal Open Market Committee
FRFA Fixed-rate full allotment
FSB Financial Stability Board
FSOC Financial Stability Oversight Council
GDP Gross domestic product
IBAN International bank account number
ICMA International Capital Market Association
ICPF Insurance corporations and pension funds
ICSD International central securities depository
IMF International Monetary Fund
IOSCO International Organization of Securities Commissions
ISDA International Swaps and Derivatives Association, Inc.
ISLA International Securities Lending Association
LTRO Longer-term refi nancing operation
LVPS Large-value payment system
M&A Merger and acquisition
MBS Mortgage-backed security
MFI Monetary fi nancial institution
MiFID Markets in Financial Instruments Directive
7ECB
Financial integration in Europe
April 2013
ABBREVIAT IONS
MMF Money market fund
MRO Main refi nancing operations
NASDAQ National Association of Securities Dealers Automated Quotations
NCB National central bank
NFC Non-fi nancial corporations
NTMA National Treasury Management Agency
NYSE New York Stock Exchange
OECD Organisation for Economic Co-operation and Development
OIS Overnight index swap
OJ Offi cial Journal of the European Union
OMT Outright Monetary Transactions
OTC Over the counter
PHA Proprietary home account
Repo Repurchase Agreement
RMBS Residential mortgage-backed security
RTGS Real-time gross settlement
SCT SEPA credit transfer
SDD SEPA direct debit
SEPA Single Euro Payments Area
SIFMA Securities Industry and Financial Markets Association
SMP Securities Markets Programme
SRA Single Resolution Authority
SRM Single Resolution Mechanism
SSM Single Supervisory Mechanism
SSP Single shared platform
SSS Securities settlement system
STEP Short-term European paper
TARGET Trans-European Automated Real-time Gross settlement Express Transfer system
TR Trade repositories
T2S TARGET2-Securities
UNIDROIT International Institute for the Unifi cation of Private Law
URD User requirements document
WFE World Federation of Exchanges

8ECB
Financial integration in Europe
April 2013
PREFACE
The ECB’s annual report on fi nancial integration in Europe contributes to the advancement of the
European fi nancial integration process by analysing its development and the related policies.
The Eurosystem has a keen interest in the integration and effi cient functioning of the fi nancial
system in Europe, especially in the euro area, as refl ected in the Eurosystem’s mission statement.
Financial integration fosters a smooth and balanced transmission of monetary policy throughout
the euro area. In addition, it is relevant for fi nancial stability and is among the reasons behind
the Eurosystem’s task of promoting well-functioning payment systems. Without prejudice to price
stability, the Eurosystem also supports the objective of completing the EU Single Market, of which
fi nancial integration is a key aspect.
In September 2005 the ECB published a fi rst set of indicators of fi nancial integration and an
accompanying report assessing the state of euro area fi nancial integration. Since then the work on
fi nancial integration has evolved and has resulted in the publication of a yearly report.

9ECB
Financial integration in Europe
April 2013
KEY MESSAGESKEY MESSAGES
OVERALL ASSESSMENT OF FINANCIAL INTEGRATION
• The fragmentation of euro area fi nancial markets increased further in the fi rst half of 2012.
The key driver was redenomination risk, linked to fears of a possible break-up of the euro
area.
• Around mid-2012, the decisions by European leaders to set up a banking union and the
announcement, as well as adoption, of non-standard measures by the ECB contributed to
restoring confi dence in euro area fi nancial markets, improving market sentiment and reversing
the earlier trend towards market fragmentation.
• In spite of the marked improvements in market conditions since then, the climate in the
fi nancial markets remains fragile. It is of paramount importance that the momentum towards
building a stronger Economic and Monetary Union is maintained. Further progress towards
the establishment of a single supervisory mechanism, as well as other components of the
banking union, will be a critical factor underpinning fi nancial market performance this year.
MONEY MARKETS
• Euro area money market conditions improved in 2012. The improvement was due to the
non-standard monetary policy measures, such as the two three-year longer-term refi nancing
operations (LTROs) and the announcement on Outright Monetary Transactions (OMTs),
as well as encouraging signs regarding the implementation of macroeconomic, fi scal and
fi nancial adjustment measures in some Member States. Going forward, lasting improvements
in money markets will largely depend on the progress of the various initiatives to strengthen
the fi nancial sector which are outside of the scope of monetary policy.
• Price-based indicators, especially overnight rates, indicate a high level of dispersion between
euro area countries, while quantity-based indicators show a “home bias” regarding interbank
counterparties, the latter being particularly pronounced in countries that have endured high
levels of fi nancial stress recently. In those countries, some fi nancial institutions are still
suffering from limited market access.
BOND MARKETS
• During the fi rst half of 2012, sovereign bond yields of countries under fi nancial stress rose.
At the same time, the search for safe and liquid assets caused a decrease in yields in other
Member States, deepening the divide in market conditions across euro area countries.
• After the announcement on OMTs and announcements by European leaders regarding the
banking union, sovereign bond markets rebounded. Sovereign spreads declined, especially in
the countries where they had increased the most in the preceding months.
10ECB
Financial integration in Europe
April 2013
• Corporate bond markets also stabilised during the second half of 2012. Moreover, the market
for banks’ long-term debt fi nancing was characterised by increasing divergence in issuance
patterns between distressed and non-distressed countries, which can be interpreted as a signal
of reduced integration.
EQUITY MARKETS
• Since the onset of the crisis, equity market performance has revealed a lower degree of cross-
country heterogeneity than that of bond markets. However, some stock market divergence
was nonetheless observed. Our newly created “segmentation index” showed that this occurred
most in countries subject to more fi nancial stress, while segmentation in other countries
remains around its long-term average.
BANKING MARKETS
• The recovery of banking markets is proving to be slower and less vigorous than that of other
market segments. A divergence between country groups along the lines already noted can
also be observed in banking markets, for instance in the rate of expansion of loans to non-
fi nancial corporations. The cross-country standard deviation of bank interest rates on new
loans to non-fi nancial corporations remains high.
• The regulatory deadline of 1 February 2014 set for completing migration to SEPA constitutes
a major push towards the realisation of a more integrated retail payments market in Europe.
The full achievement of SEPA represents the main challenge at present, particularly in view
of the different speeds of migration in Member States.
11ECB
Financial integration in Europe
April 2013
EXECUTIVESUMMARY
EXECUTIVE SUMMARY
The development of fi nancial market integration in 2012 can be divided into two parts: after further
market deterioration in the fi rst half of the year, an improvement was observed in the second half.
Throughout the fi rst half of 2012, despite the positive effects on bank funding of the two three-year
refi nancing operations (LTROs) carried out by the ECB at the turn of the year, increasing market
fragmentation was caused by adverse market sentiment, deteriorated fi scal conditions and a fragile
banking sector in some euro area countries. These developments were amplifi ed by speculation
about the risk of a break-up of the euro area which gave rise to redenomination risk premia.
All market segments refl ected these adverse conditions. In particular, the sovereign debt markets
displayed an increased divergence in government bond yields, in part related to a fl ight into safe-
haven assets.
The change in sentiment during the second half of 2012 was caused by actions which demonstrated
the strength of cohesion within Europe. In particular, the decision in June 2012 by European
leaders to create a single supervisory mechanism as a fi rst step towards a banking union, and the
announcement on Outright Monetary Transactions (OMTs) created more benign market conditions,
as shown by the indicators in this report.
The indicators presented in this report suggest that at the end of 2012 the integration of the euro
money market improved. However, although price-based indicators indicate decreasing dispersion,
other indicators still show a “home bias” with respect to interbank counterparties and a continuing
dependency of some banks on the Eurosystem’s liquidity support.
In the fi rst half of 2012, the euro area sovereign bond markets continued to experience severe
tensions and a signifi cant degree of segmentation. However, during the second half of the year,
sovereign bond yields declined signifi cantly and some normalisation of liquidity conditions could
be observed. As regards equity markets, these demonstrated a higher resilience than bond markets
during the crisis, although driven by country-specifi c risk.
Finally, for euro area banking markets, some indicators signal a lower degree of integration, but this
has stabilised in recent months.
Overall, the strong signs of fragmentation have been gradually reversed as a result of concrete policy
measures, but the dispersion among countries remains high. Further policy efforts are therefore
necessary to restore confi dence in the euro area and its fi nancial markets.
Chapter II describes the main features of the proposed single supervisory mechanism (SSM) as
the fi rst component of the banking union. It also looks at the main benefi ts of the SSM for fi nancial
stability and fi nancial integration, as well as the remaining challenges to completing the banking
union and the steps required to operationalise the framework within which the ECB shall carry out
the tasks conferred upon it.
Chapter III provides an overview of the main activities that the Eurosystem pursued in 2012 with
a view to advancing fi nancial integration in the euro area.
As regards the provision of advice on the legislative and regulatory framework for the fi nancial
system, the ECB and the Eurosystem have actively contributed to strengthening the regulation of
12ECB
Financial integration in Europe
April 2013
the banking and investment fi rms sector. The ECB provided several opinions on important topics in
the area of EU supervisory and regulatory arrangements. This comprised opinions on the proposals
for the SSM, the Capital Requirements Directive (CRD IV), the Capital Requirements Regulation
(CRR), and the Directive establishing a framework for the recovery and resolution of credit
institutions and investment fi rms (BRRD).
In the area of the legal framework for securities services, various important steps, supported by
the ECB, have been undertaken. The ECB has issued opinions on the following: the proposal for
a Regulation on improving securities settlement in the European Union and on central securities
depositories; the “Alternative Investment Funds Managers Directive (AIFMD)”; the “UCITS V
Directive”; the “Regulation on key information documents for investment products” and on the
European Market Infrastructure Regulation “(EMIR)”. The ECB has also been actively involved in
the development of a legal entity identifi er.
With respect to the role that the ECB and the Eurosystem play as a catalyst, in November 2012
the Governing Council announced that loan-level data reporting will be mandatory for residential
mortgage-backed securities and for asset-backed securities (ABSs) whose underlying assets include
loans to small and medium-sized enterprises as of 3 January 2013, for commercial mortgage-back
securities as of 1 March 2013, and for consumer fi nance, leasing ABSs and auto loan ABSs as of
1 January 2014. As regards the Prime Collateralised Securities (PCS) initiative, its non-mandatory
EU-wide standards for ABSs relating to quality, transparency, standardisation and simplicity are
expected to lead to increased liquidity for securities which acquire the PCS label. In November
2012, the fi rst asset was granted the PCS label. Furthermore, the fi rst covered bond that complied
with the Covered Bond label was introduced in January 2013. In addition, the ECB’s support for
projects such as STEP and SEPA continued during 2012.
In the fi eld of enhancing knowledge, raising awareness and monitoring the state of fi nancial
integration, the ECB carried out a thorough review of the set of fi nancial integration and development
indicators. The review was aimed at assessing whether the indicators used still accurately refl ect the
market situation and to make the indicators more granular by further breaking down the information
through country groupings. In April 2012, the ECB and the European Commission jointly organised
an international conference on “Financial integration and stability: towards a more resilient single
EU fi nancial market” with the participation of the President and Vice-President of the ECB and
other top-level market participants, fi nancial regulators and academics. At this conference the ECB’s
Report on Financial Integration in Europe and the European Financial Stability and Integration
Report prepared by the European Commission were presented. The conference was the third of a
series to be held annually on the same topic, hosted alternately by the ECB and the Commission.
Finally, regarding central bank services that foster fi nancial integration, TARGET2, the single
technical platform for large-value payments in euro, is one good example as it has eliminated the
fragmented situation that previously existed in the management of central bank liquidity and the
real-time settlement of euro payments. In 2012 the Eurosystem took the decision to migrate to a
new messaging standard in 2017. This will further foster fi nancial integration and will improve
interoperability with other market infrastructures, such as TARGET2-Securities (T2S). Furthermore,
in mid-2012, 23 European CSDs committed themselves to T2S. The large CSD participation in T2S
will lead to signifi cant economies of scale and lower settlement costs and will ensure wide reach of
the T2S harmonisation achievements.

13ECB
Financial integration in Europe
April 2013
EXECUTIVESUMMARY
Special Feature A, entitled “Euro area money market segmentation in a low interest rate environment”, focuses mainly on the developments of money market segmentation before and after
the July 2012 ECB rate cut. It argues that a low interest rate environment can have an impact on
the degree of fi nancial market integration. Its main fi nding is that the search for yield triggered by
the low interest rate environment appears to have mainly benefi ted counterparties and fi nancial
instruments with relatively high ratings and located in jurisdictions relatively immune from market
tensions, but which did not have safe-haven status.
Special Feature B, entitled “The integration of the euro retail payments market – SEPA and beyond”,
describes why the Single Euro Payments Area (SEPA) is a major driver of fi nancial integration
in Europe and how it has evolved over time. Furthermore, the feature gives an overview of the
major benefi ts from the creation of SEPA, such as improvements in terms of both the effi ciency
and the security of cashless retail payments. From a macroeconomic perspective, the realisation
of a more effi cient retail payments market through SEPA can facilitate trade, increase competition
and innovation, foster fi nancial integration, and add to the completion of the single currency. The
remaining challenge for SEPA, apart from SEPA for cards, is the replacement of domestic credit
transfers and direct debits in the euro area by truly pan-European ones by 1 February 2014. The
Special Feature concludes by looking ahead to the next generation of retail payments in the domain
of internet and mobile payments.
Special Feature C, entitled “Sectoral accounts and rebalancing in the euro area”, analyses
cross-country patterns in sectoral fi nancial balances from a fi nancial integration perspective. This
feature builds on the special feature in the ECB’s 2012 Financial Integration Report, examining
how aggregate and sectoral savings-investment imbalances have developed across countries in the
euro area in more detail and focusing on recent quarters. The analysis suggests that, while euro
area fi nancial integration permitted a build-up of external defi cits and surpluses across euro area
countries, these differentials in the external balances refl ected not only growth differentials, but
also growing competitiveness imbalances, as measured by unit labour costs, posing a challenge
when cross-border funding dried up. These imbalances were partially reversed in 2012, particularly
in countries under an EU/IMF-programme.
Special Feature D, entitled “US money markets: structural comparison and implications for fi nancial integration”, discusses fi nancial integration within US money markets with a view to
presenting key structural differences from the euro area and implications for money markets and
policy. Although US money market integration would be expected to be much greater than that
of the euro area, there are certain aspects of the US money market that point to some areas where
markets may not be fully integrated (e.g. differences in access to central bank liquidity between
banks and non-bank entities).

15ECB
Financial integration in Europe
April 2013
CHAPTER 1
RECENT DEVELOPMENTS IN FINANCIAL INTEGRATION IN THE EURO AREA
This chapter reviews recent developments in fi nancial integration in the main segments of the euro area fi nancial sector: i.e. the money, bond and equity markets and the banking sector.During the fi rst half of 2012, and particularly during the second quarter, the euro area fi nancial system was strongly affected by a sharp increase in risk aversion paired with an intensifi cation of investors’ concerns regarding the sustainability of sovereign fi scal positions. The intensifi cation of redenomination risk increased the divergence in government bond yields further, and reinforced fl ight-to-safety fl ows into safe haven assets. In the equity markets, valuation levels between countries began to drift apart signifi cantly, a development that was driven mainly by countries under stress. Similarly, the banking markets also showed signs of further fragmentation.In the second half of 2012, the decision by European leaders to move towards a “banking union” and the announcement by the Governing Council of the ECB concerning Outright Monetary Transactions (OMTs) gave rise to more benign market conditions. As a result of the ECB’s efforts to repair the transmission of its monetary policy, although still characterised by a high degree of fragmentation, conditions in euro area money market improved. These measures also led to a signifi cant decline in sovereign bond yields and to some normalisation of liquidity conditions.
1 INTRODUCTION
This chapter reviews the most signifi cant developments regarding fi nancial integration in the euro
area during 2012. It focuses on the most important segments of the fi nancial markets, namely the
money, bond, equity and banking markets. This year, the main focus is placed on the intensifi cation
of the fi nancial crisis and its impact on fi nancial integration in the main market segments.
During the fi rst half of 2012, the fi nancial crisis intensifi ed due to adverse market sentiment,
deteriorated fi scal conditions and a fragile banking sector in some euro area countries. This led
to increased fragmentation of European fi nancial markets and had a negative impact on the real
economy. These developments were amplifi ed by speculation about the risk of a break-up of the
euro area, which gave rise to redenomination risk premia. A strong sign of cohesion came from the
decision by European leaders in June to accelerate the move towards a “banking union” by creating
a single bank supervisor within the ECB and opening up the possibility that European banks, under
certain conditions, could receive capital directly from the European Stability Mechanism (ESM).
Together with the ECB’s new programme of government bond market intervention (OMTs), this
announcement led to more benign market conditions.
Over the course of the year, the money market experienced signs of improvement. The conduct of
two three-year longer-term refi nancing operations (LTROs) at the end of 2011 and in early 2012
helped to improve sentiment in the fi rst half of the year. However, the functioning of the euro
money market remained somewhat impaired. In particular institutions from countries under stress
had limited market access. In order to alleviate these concerns, the ECB’s Governing Council took
further measures during the second half of 2012. The ECB lowered the main refi nancing operation
rate, deposit facility rate and marginal lending facility rate by 25 basis points each to 0.75%, 0.00%
and 1.50% respectively and made its announcement on OMTs. As a result of these efforts, the
market sentiment improved and the tail risk related to sovereign debt crisis progressively declined.
Also at the beginning of 2013, the repayment of the two three-year LTROs was larger than expected
and was seen as a positive sign of gradual normalisation in euro money market conditions.
16ECB
Financial integration in Europe
April 2013
In the fi rst half of 2012, developments in bond markets (sovereign and corporate) were still sharply
differentiated among euro area countries. The surge of risk aversion exacerbated heterogeneity in
asset prices along with a hunt for a limited amount of safe and liquid assets. There is some evidence
that concerns about country-specifi c risks pushed up the cost of funding in the countries under
fi nancial stress, while pushing it down in others. This heterogeneity in fi nancial developments
partly refl ects the impact of the fi nancial crisis on the real economy, especially in distressed
countries. Furthermore, bond markets were affected by the emergence of a perceived risk of a
break-up of the euro area which amplifi ed around mid-2012, leading investors to demand an
additional redenomination premium for holding the assets of specifi c countries. This created a risk
of increased instability, and further impaired the transmission of the Eurosystem’s single monetary
policy. The announcement on OMTs, the compromise reached by Europe’s political leaders on
movement towards a banking union, and additional measures on the fi scal side, helped to address
the severe distortions in euro area government bond markets. In particular, the second half of 2012
was characterised by a gradual normalisation of euro area sovereign bond markets with a signifi cant
decline in yields, improving liquidity conditions and a return of foreign investors in countries under
stress together with some reversal of previous fl ight-to-safety fl ows in non-distressed countries.
Although equity markets proved more resilient than bond markets during the crisis, an increased
degree of market fragmentation can be detected from the divergence in valuation levels across
countries. These developments may have been accentuated by a possible resurgence of home
bias and less synchronous business cycles. As a result, country-specifi c risk also became a more
important factor in this market and cross-border holdings increased.
Data on secondary market functioning and on cross-border holdings of assets, as shown later in this
chapter, provide further evidence that some markets were signifi cantly fragmented in 2012.
Finally, euro area banking markets indicators generally point to a lower degree of integration during
2012. Indicators on the cross-border activities of banks, as well as on prices and conditions for
loans and deposits, reveal a lower degree of integration than in previous years.
During 2012, concrete policy steps were taken to reinforce fi nancial stability and integration. In this
context, it is essential to maintain momentum in the implementation of these reforms. Several of
these policy measures are described in this report.
In the following sections, developments specifi c to each segment of the fi nancial system are
analysed in detail using several indicators of fi nancial integration.1
2 MONEY MARKETS
Since the collapse of Lehman Brothers in the second half of 2008, integration in euro area money market
has declined signifi cantly, as witnessed by an upward drift in cross-country dispersion for overnight
rates and a signifi cant decline in interbank market activity, particularly in the unsecured segment.2
1 Some of the indicators presented in Chapter 1 show data for two groups: “distressed” countries and “non-distressed” countries.
This country grouping is based on long-term interest rates on sovereign bonds with a remaining maturity of approximately ten years. The
distressed group comprises Cyprus, Spain, Greece, Ireland, Italy, Portugal and Slovenia. The non-distressed group comprises Austria,
Belgium, Germany, Estonia, Finland, France, Luxembourg, Malta, the Netherlands and Slovakia. Some indicators do not incorporate all
countries owing to limited data availability.
2 Developments in the 2008-2011 period, and the policy actions undertaken by the Eurosystem to contain money market fragmentation, are
described in detail in previous issues of this report.

17ECB
Financial integration in Europe
April 2013
I RECENT DEVELOPMENTS
IN F INANCIAL INTEGRATION IN THE EURO AREA
In 2011 the intensifi cation of the euro area sovereign bond market crisis impacted further on market
integration. The effects on the secured money market segment became more visible, as signifi cant price
differentiation in the repo market emerged, with the pricing of risk becoming much more dependent on
the geographical origin of both the counterparty and the collateral. As several fi nancial institutions started
to face liquidity constraints, the ECB’s Governing Council announced further non-standard monetary
policy measures in order to repair the transmission mechanism and provide liquidity support, particularly
with the two three-year LTROs conducted in December 2011 and February 2012. This drove excess
liquidity in the banking system to very high levels, with the ECB increasing its intermediation role in the
fi nancial system.
The abundant liquidity buffers held by the banking sector as a result of the Eurosystem’s measures
removed a large part of the short to medium-term funding risks of banks, and money market
rates proved more resilient when sovereign debt tensions began to escalate again in May 2012.
However, excess liquidity continued to be distributed unevenly among euro area countries, and
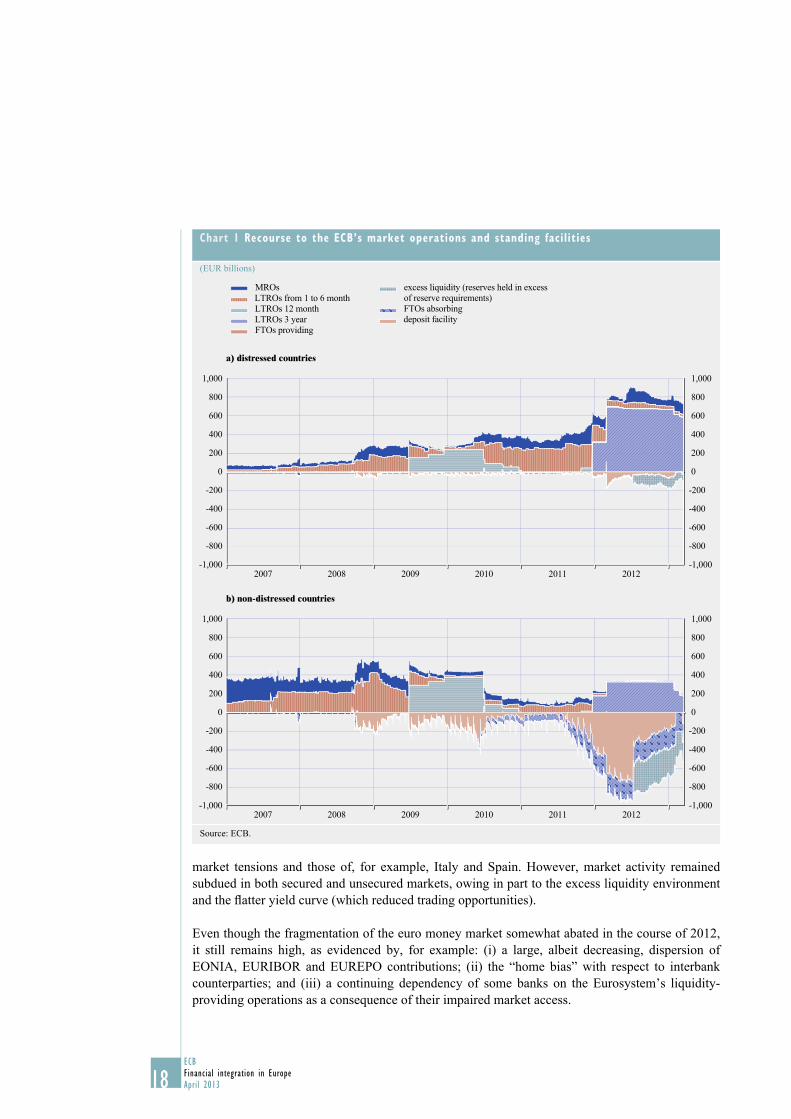
this became even more pronounced following the two three-year LTROs. The aggregate recourse
to the Eurosystem refi nancing operations signifi cantly increased for counterparties/banks from the
distressed country group, in some cases for precautionary reasons, but also due to limited access to
global funding markets. On the other hand, counterparties/banks from the non-distressed country
group experienced high liquidity infl ows, as refl ected in increasing recourse to the deposit facility.
However at the beginning of 2013, the recourse to ECB’s market operations for both country groups
declined progressively after the repayment of the fi rst three-year LTRO on 30 January, whose
amount was larger than expected, along with a large number of repaying banks (Chart 1).
Despite signs of improvement after the two three-year LTROs, the functioning of the euro money
market remained somewhat impaired, as counterparty credit risk concerns with respect to banks
from euro area countries under stress remained elevated and the environment of excess liquidity
continued to depress market activity. Funding costs continued to diverge according to the geographic
origin of both the counterparty and the collateral, while market access of counterparties in distressed
jurisdictions remained seriously impaired, thereby hampering the uniform transmission of monetary
policy throughout the euro area. In order to alleviate such concerns, the ECB‘s Governing Council
took further measures to improve the transmission of monetary policy and pursue the main objective
of price stability in the euro area. On 5 July 2012, the ECB’s Governing Council lowered the ECB
main refi nancing rate by 25 basis points from 1.00% to 0.75%. The deposit facility rate and the
marginal lending facility rate were also cut by 25 basis points, to 0.00% and 1.50% respectively.
Given the large allotments at the two three-year LTROs and the resulting large amount of excess
liquidity, the rate of the deposit facility continued to act as the main reference for short-term money
market rates, leaving those rates close to zero in the second half of the year. On 6 September 2012,
the ECB’s Governing Council announced the preparation of OMTs. It decided to suspend the
application of the minimum credit rating threshold requirement for assets issued or guaranteed by
the governments of countries that are eligible for OMTs and to make marketable debt instruments
denominated in US dollars, pounds sterling or Japanese yen, issued and held in the euro area,
eligible for its refi nancing operations.
As a result of the combined effects of such measures, conditions in euro money markets improved
since the second half of 2012. In the unsecured money market, the EURIBOR-OIS spread, which
is often used as an indicator of credit and liquidity risk in the euro money market, tightened over
2012, reaching the lowest level since September 2007. In the secured segment, the two three-year
LTROs contributed to a decline in spreads between the secured rates of countries not subject to
18ECB
Financial integration in Europe
April 2013
market tensions and those of, for example, Italy and Spain. However, market activity remained
subdued in both secured and unsecured markets, owing in part to the excess liquidity environment
and the fl atter yield curve (which reduced trading opportunities).
Even though the fragmentation of the euro money market somewhat abated in the course of 2012,
it still remains high, as evidenced by, for example: (i) a large, albeit decreasing, dispersion of
EONIA, EURIBOR and EUREPO contributions; (ii) the “home bias” with respect to interbank
counterparties; and (iii) a continuing dependency of some banks on the Eurosystem’s liquidity-
providing operations as a consequence of their impaired market access.
Chart 1 Recourse to the ECB’s market operations and standing facilities
(EUR billions)
MROs
LTROs from 1 to 6 month
LTROs 12 month
LTROs 3 year
FTOs providing
excess liquidity (reserves held in excess
of reserve requirements)
FTOs absorbing
deposit facility
a) distressed countries
-800
-600
-400
-200
0
200
400
600
800
1,000
-1,000
-800
-600
-400
-200
0
200
400
600
800
1,000
2007 2008 2009 2010 2011 2012-1,000
b) non-distressed countries
-1,000
-800
-600
-400
-200
0
200
400
600
800
1,000
-1,000
-800
-600
-400
-200
0
200
400
600
800
1,000
2007 2008 2009 2010 2011 2012
Source: ECB.
19ECB
Financial integration in Europe
April 2013
I RECENT DEVELOPMENTS
IN F INANCIAL INTEGRATION IN THE EURO AREA
PRICE-BASED INDICATORS
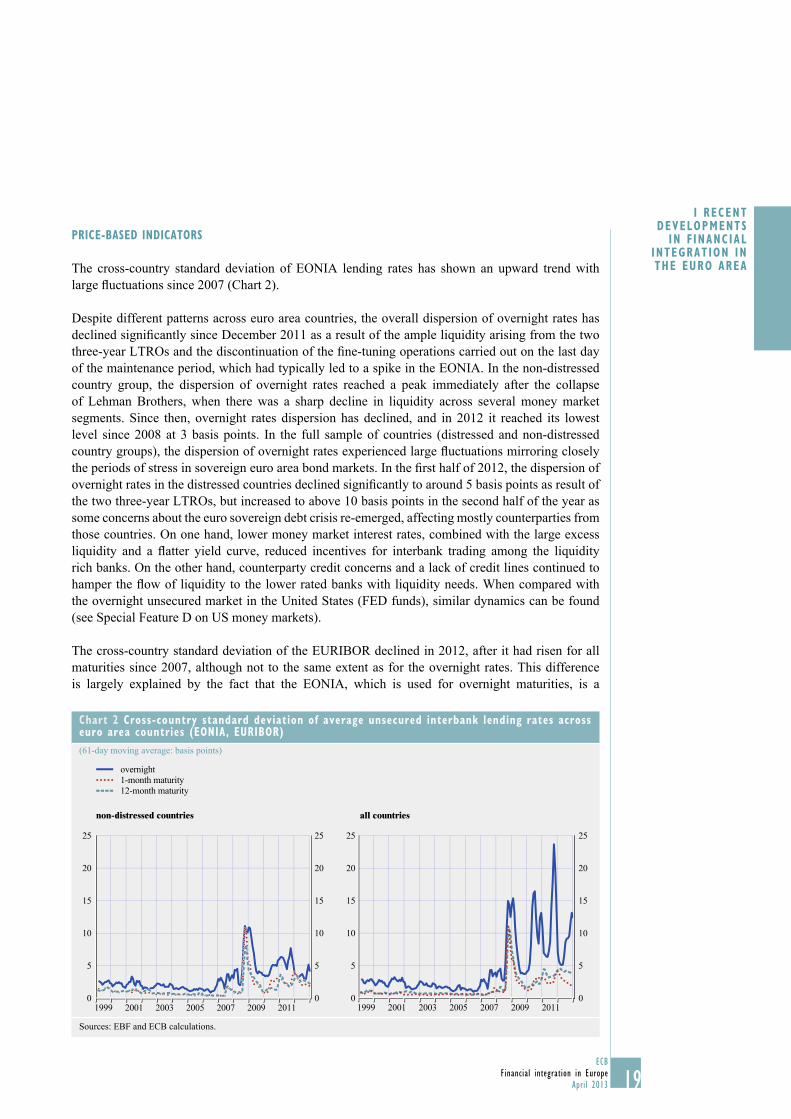
The cross-country standard deviation of EONIA lending rates has shown an upward trend with
large fl uctuations since 2007 (Chart 2).
Despite different patterns across euro area countries, the overall dispersion of overnight rates has
declined signifi cantly since December 2011 as a result of the ample liquidity arising from the two
three-year LTROs and the discontinuation of the fi ne-tuning operations carried out on the last day
of the maintenance period, which had typically led to a spike in the EONIA. In the non-distressed
country group, the dispersion of overnight rates reached a peak immediately after the collapse
of Lehman Brothers, when there was a sharp decline in liquidity across several money market
segments. Since then, overnight rates dispersion has declined, and in 2012 it reached its lowest
level since 2008 at 3 basis points. In the full sample of countries (distressed and non-distressed
country groups), the dispersion of overnight rates experienced large fl uctuations mirroring closely
the periods of stress in sovereign euro area bond markets. In the fi rst half of 2012, the dispersion of
overnight rates in the distressed countries declined signifi cantly to around 5 basis points as result of
the two three-year LTROs, but increased to above 10 basis points in the second half of the year as
some concerns about the euro sovereign debt crisis re-emerged, affecting mostly counterparties from
those countries. On one hand, lower money market interest rates, combined with the large excess
liquidity and a fl atter yield curve, reduced incentives for interbank trading among the liquidity
rich banks. On the other hand, counterparty credit concerns and a lack of credit lines continued to
hamper the fl ow of liquidity to the lower rated banks with liquidity needs. When compared with
the overnight unsecured market in the United States (FED funds), similar dynamics can be found
(see Special Feature D on US money markets).
The cross-country standard deviation of the EURIBOR declined in 2012, after it had risen for all
maturities since 2007, although not to the same extent as for the overnight rates. This difference
is largely explained by the fact that the EONIA, which is used for overnight maturities, is a
Chart 2 Cross-country standard deviation of average unsecured interbank lending rates across euro area countries (EONIA, EURIBOR)
(61-day moving average: basis points)
overnight
1-month maturity
12-month maturity
non-distressed countries all countries
0
5
10
15
20
25
0
5
10
15
20
25
1999 2001 2003 2005 2007 2009 20110
5
10
15
20
25
0
5
10
15
20
25
1999 2001 2003 2005 2007 2009 2011
Sources: EBF and ECB calculations.
20ECB
Financial integration in Europe
April 2013
volume-weighted rate over a full day, while the EURIBOR is a reference rate based on an expert
assessment at a given point in time during a day, which should in principle refl ect lending rates
from one generic prime bank to another generic prime bank and not the funding/lending rate of
one particular bank to its counterparties. In 2012, the dispersion of interbank rates for one-month
and 12-month maturities declined remaining below 5 basis points, with similar patterns across euro
area countries, albeit with a marginally higher dispersion in interbank rates for counterparties/banks
from the distressed country group. The low dispersion observed could be attributed to the market
sentiment improvement after ECB’s Governing Council decisions. However, as noted in the 2012
Euro Money Market Survey3 activity in the unsecured segment remained highly concentrated in
overnight transactions (66% of total borrowing activity and 83% of lending transactions), while
turnover in maturities beyond one month remained very limited (only around 2% of total unsecured
activity). It is also worth mentioning that while the dispersion in overnight rates is almost back to
historical levels for the non-distressed countries, the same is not observed for the longer maturities,
where risk premia are still high compared to pre-crisis levels.
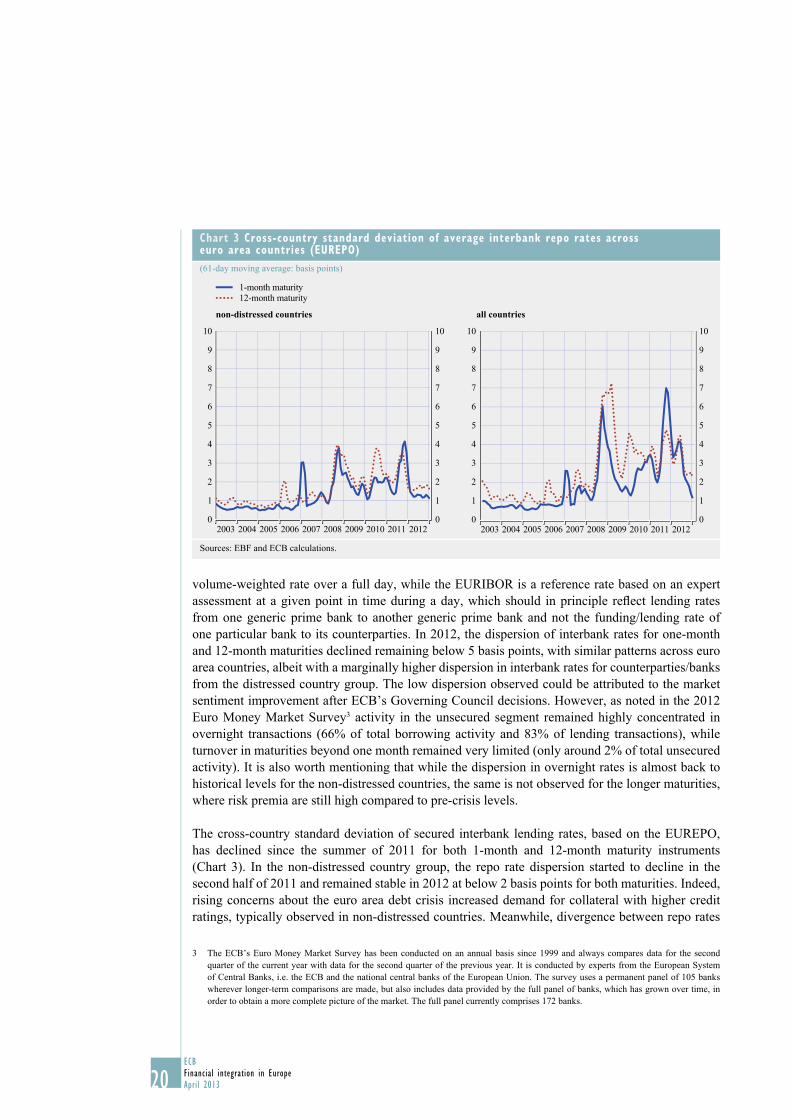
The cross-country standard deviation of secured interbank lending rates, based on the EUREPO,
has declined since the summer of 2011 for both 1-month and 12-month maturity instruments
(Chart 3). In the non-distressed country group, the repo rate dispersion started to decline in the
second half of 2011 and remained stable in 2012 at below 2 basis points for both maturities. Indeed,
rising concerns about the euro area debt crisis increased demand for collateral with higher credit
ratings, typically observed in non-distressed countries. Meanwhile, divergence between repo rates
3 The ECB’s Euro Money Market Survey has been conducted on an annual basis since 1999 and always compares data for the second
quarter of the current year with data for the second quarter of the previous year. It is conducted by experts from the European System
of Central Banks, i.e. the ECB and the national central banks of the European Union. The survey uses a permanent panel of 105 banks
wherever longer-term comparisons are made, but also includes data provided by the full panel of banks, which has grown over time, in
order to obtain a more complete picture of the market. The full panel currently comprises 172 banks.
Chart 3 Cross-country standard deviation of average interbank repo rates across euro area countries (EUREPO)
(61-day moving average: basis points)
1-month maturity
12-month maturity
non-distressed countries all countries
0
1
2
3
4
5
6
7
8
9
10
0
1
2
3
4
5
6
7
8
9
10
2008 2010 2012200620042003 2005 2007 2009 20110
1
2
3
4
5
6
8
10
7
9
0
1
2
3
4
5
6
8
10
7
9
2003 2005 2007 20092008 2010 2011 201220062004
Sources: EBF and ECB calculations.
21ECB
Financial integration in Europe
April 2013
I RECENT DEVELOPMENTS
IN F INANCIAL INTEGRATION IN THE EURO AREA
on general collateral from distressed countries and non-distressed countries declined signifi cantly
in 2012, in response to investors’ search for positive returns and the progressive reduction of tail
risk related to sovereign debt crisis induced by OMTs announcement.
QUANTITY-BASED INDICATORS
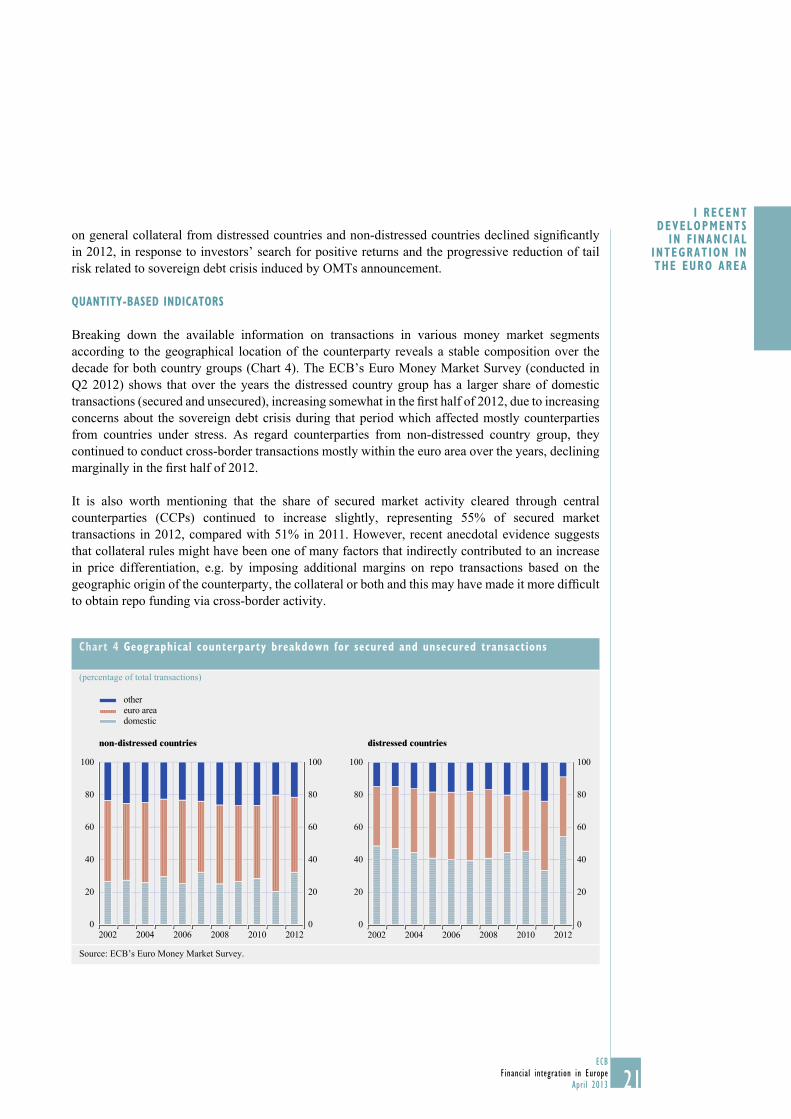
Breaking down the available information on transactions in various money market segments
according to the geographical location of the counterparty reveals a stable composition over the
decade for both country groups (Chart 4). The ECB’s Euro Money Market Survey (conducted in
Q2 2012) shows that over the years the distressed country group has a larger share of domestic
transactions (secured and unsecured), increasing somewhat in the fi rst half of 2012, due to increasing
concerns about the sovereign debt crisis during that period which affected mostly counterparties
from countries under stress. As regard counterparties from non-distressed country group, they
continued to conduct cross-border transactions mostly within the euro area over the years, declining
marginally in the fi rst half of 2012.
It is also worth mentioning that the share of secured market activity cleared through central
counterparties (CCPs) continued to increase slightly, representing 55% of secured market
transactions in 2012, compared with 51% in 2011. However, recent anecdotal evidence suggests
that collateral rules might have been one of many factors that indirectly contributed to an increase
in price differentiation, e.g. by imposing additional margins on repo transactions based on the
geographic origin of the counterparty, the collateral or both and this may have made it more diffi cult
to obtain repo funding via cross-border activity.
Chart 4 Geographical counterparty breakdown for secured and unsecured transactions
(percentage of total transactions)
other
euro area
domestic
non-distressed countries distressed countries
0
20
40
60
80
100
0
20
40
60
80
100
2002 2004 2006 2008 2010 2012
0
20
40
60
80
100
0
20
40
60
80
100
2002 2004 2006 2008 2010 2012
Source: ECB’s Euro Money Market Survey.
22ECB
Financial integration in Europe
April 2013
OTHER INDICATORS
Short-Term European Paper (STEP)
In the years following the introduction of the euro, the integration of the short-term paper market
evolved slowly relative to other market segments, refl ecting differences in market practices,
standards and legal frameworks across EU countries. In order to address this gap in fi nancial
integration, the STEP initiative was launched in 2006, aimed at developing a pan-European short-
term paper market through the voluntary compliance of market participants with a core set of
commonly agreed standards. One important caveat for a study of market integration based on STEP
data is the concentration of the commercial paper market, with French issuers accounting for up
to 50% of the data reported in STEP, followed by Dutch (14%) and Belgian issuers (11%). In
2012, the total outstanding volume increased sharply, particularly after the interest rate decision on
5 July, reaching a peak of EUR 478 billion in August. This trend might signal that investors’ search
for yield was initially confi ned to higher quality market instruments and higher rated euro area
countries, which is another indication of market segmentation in the euro money market along
national borders (see Special Feature A – Euro area money market segmentation in the present low
interest rate environment).
TARGET 2
The rapid integration of money markets after 1999 was largely due to the creation of the Trans-
European Automated Real-time Gross settlement Express Transfer system (TARGET), a payment
system operated by the Eurosystem and
designed to handle large-value euro payments.
In May 2008 a second generation system,
TARGET2, was launched. TARGET2 is based
on a single shared platform, allowing the
provision of a harmonised service level with
a single price structure. In total, 24 EU central
banks (including the ECB) and their national
communities are members of TARGET2.4 The
last two members to join the system were the
Bulgarian National Bank in 2010 and Banca
Naţională a României in 2011.
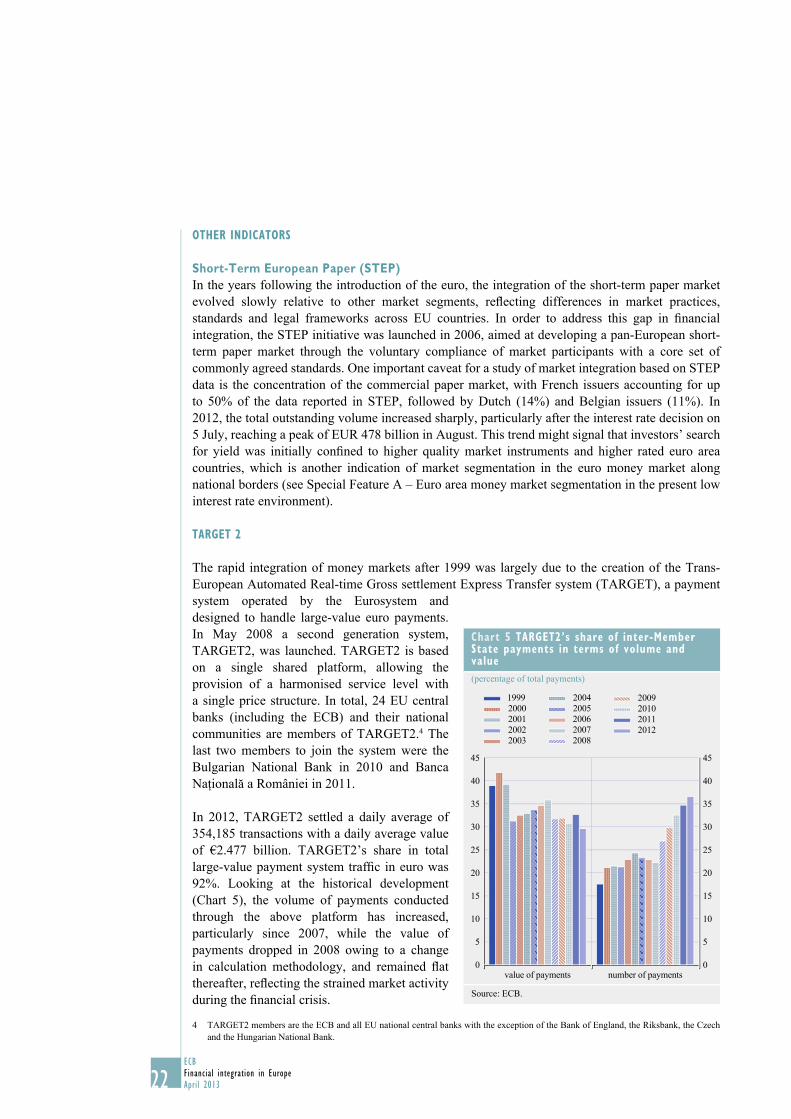
In 2012, TARGET2 settled a daily average of
354,185 transactions with a daily average value
of €2.477 billion. TARGET2’s share in total
large-value payment system traffi c in euro was
92%. Looking at the historical development
(Chart 5), the volume of payments conducted
through the above platform has increased,
particularly since 2007, while the value of
payments dropped in 2008 owing to a change
in calculation methodology, and remained fl at
thereafter, refl ecting the strained market activity
during the fi nancial crisis.
4 TARGET2 members are the ECB and all EU national central banks with the exception of the Bank of England, the Riksbank, the Czech
and the Hungarian National Bank.
Chart 5 TARGET2’s share of inter-Member State payments in terms of volume and value
(percentage of total payments)
0
5
10
15
20
25
30
35
40
45
0
5
10
15
20
25
30
35
40
45
value of payments number of payments
1999
2000
2001
2002
2003
2009
2010
2011
2012
2004
2005
2006
2007
2008
Source: ECB.

23ECB
Financial integration in Europe
April 2013
I RECENT DEVELOPMENTS
IN F INANCIAL INTEGRATION IN THE EURO AREA
3 BOND MARKETS
Sovereign bond markets
Whereas, in 2010, at the outset of the sovereign debt crisis, only a few countries were strongly
affected, in 2012, most non AAA-rated euro area countries came under pressure. In the fi rst part of
2012, euro area sovereign bond markets continued to experience severe tensions and a signifi cant
degree of segmentation. In contrast, in the second half of 2012, the OMT announcement paved the
way for noticeable improvements in bond markets.
PRICE-BASED INDICATORS
Considering information on asset prices fi rst, Chart 6 show the dispersion of euro area sovereign
bond yields for ten-year and two-year maturities with the interquartile range (i.e. the range between
the third and the fi rst quartile) and the range between the highest and the lowest yield together
with the yields for some distressed countries and the average yield for the euro area in the period
from 2007 to 2012 (for a long term perspective from 1990 to 2012, see Chart 13 in the Statistical
Annex). After a period of convergence beginning in the late 1990s, dispersion was very low under
the third stage of EMU in the period before the crisis, but started to increase in 2008, and has
reached, in the fi rst half of 2012, levels comparable with or exceeding those prevailing in the
mid-1990s. The second half of 2012 was, however, characterised by a continuous improvement in
terms of dispersion, especially at the two-year maturity, refl ecting a positive market response to the
OMT announcement and the commitment to move towards a banking union.
Chart 6 Dispersion of euro area sovereign bond yields
(percentages)
Spain
Italy
PortugalIrelandaverage euro areainterquartile rangemin-max range
a) ten-year sovereign bonds b) two-year sovereign bonds
0
5
10
15
20
25
0
5
10
15
20
25
2007 2008 2009 2010 2011 20120
5
10
15
20
25
0
5
10
15
20
25
2007 2008 2009 2010 2011 2012
Sources: Thomson Reuters and ECB.Note: The data used are based on the euro area country composition as in 2011. The yields for Cyprus, Estonia, Greece, Luxembourg, Malta, Slovakia and Slovenia are excluded owing to infrequent or missing observations.

24ECB
Financial integration in Europe
April 2013
This overall higher dispersion in 2011-2012 is mainly due to divergence between the bond yields
of non-distressed and distressed euro area sovereigns. In particular, during the fi rst half of 2012,
the two groups of countries diverged further and the gap between the groups stayed at a high level,
even in the midst of the signifi cant but diminishing effect of the Eurosystem’s two three-year
LTROs. When OMTs were being anticipated by market participants in the summer of 2012 and
then offi cially announced by the ECB on 6 September 2012, the yield gap between non-distressed
and distressed countries reduced somewhat, although it remained elevated by historical standards.
This divergence between non-distressed countries and distressed countries is due to several factors.
First, it refl ects diverging country “fundamentals”, such as increasing differences in the perceived
sustainability of balance of payments and sovereign fi scal positions, the health of the banking
system, the tightness of bank-sovereign linkages (see Chart 14 in the Statistical Annex) and political
uncertainties in some euro area countries. In some countries, declining confi dence among market
participants in policy-makers, and the retreat of cross-border investors, contributed further to a
market perception of worsening “fundamentals”. Positive policy steps, such as the establishment
of a “fi scal compact”5 and the creation of the euro area’s permanent crisis management mechanism,
the European Stability Mechanism (ESM), limited the divergence, although many market
participants considered the timing of their implementation insuffi cient. Credit rating agencies’
assessments of euro area sovereigns have also increasingly diverged since 2009, with a declining
average euro area rating (see Chart 7).
5 At the 1 March 2012 European Council, 25 European leaders signed the Treaty on Stability, Coordination and Governance, also known
as the “fi scal compact”, as agreed on 9 December 2011. It aims to strengthen fi scal discipline by means of stricter surveillance, notably by
establishing a “balanced budget rule”.
Chart 7 Sovereign debt ratings and their dispersion in the euro area
1
2
3
4
5
6
7 AAA
AA+
AA
AA-
A+
A
A-1999 2001 2003 2005 2007 2009 2011 2013
standard deviation (left-hand scale)
average sovereign rating (right-hand scale)
Sources: Thomson Reuters and ECB.Note: The chart shows Standard & Poor’s ratings for long-term sovereign debt. The right-hand side scale represents ratings expressed as letter grades. The left hand side scale represents the standard deviation of ratings expressed as numerical notches.
Chart 8 Spreads of liquidity premia for agency bonds compared with sovereign bonds for Germany and France at ten-year maturity
(5-day moving averages of daily data; basis points)
0
10
20
30
40
50
60
70
80
90
0
10
20
30
40
50
60
70
80
90
Germany
France
Jan. July Jan. July Jan. July Jan. Jan.July2009 2010 2011 2012 2013
Sources: Thomson Reuters and ECB.Note: Zero-coupon spreads between agency and government bond yields.
25ECB
Financial integration in Europe
April 2013
I RECENT DEVELOPMENTS
IN F INANCIAL INTEGRATION IN THE EURO AREA
Second, yield dispersion is infl uenced by risk aversion among investors. For example, during
2003-2007, all euro area government bonds yields were similarly priced, irrespective of ratings
and differences in fi scal positions between countries, which were already pronounced at that time.
This refl ected a high risk tolerance and therefore low risk premia. Since 2008, risk sensitivity has
increased – and may in some cases have led to an overpricing of risk.
Third, closely related to the second factor, the divergence in yields can also be explained by liquidity
effects. In particular, during periods of high tension, investors tend to shift their investment fl ows
towards highly liquid bonds issued by non-distressed countries. Such “safe haven” fl ows depress
the bond yields of non-distressed countries, most notably Germany, and increase the bond yields of
distressed countries, thereby widening sovereign spreads. Typically, these safe haven fl ows manifest
themselves in an increase in the spread between highly liquid government bonds and less liquid, but
equally rated, agency bonds (see Chart 8). In the second half of 2012, these safe haven fl ows were
reversed on the back of improving market sentiment after the OMT announcement, as illustrated by
declining liquidity premia for some non-distressed countries as of September 2012.
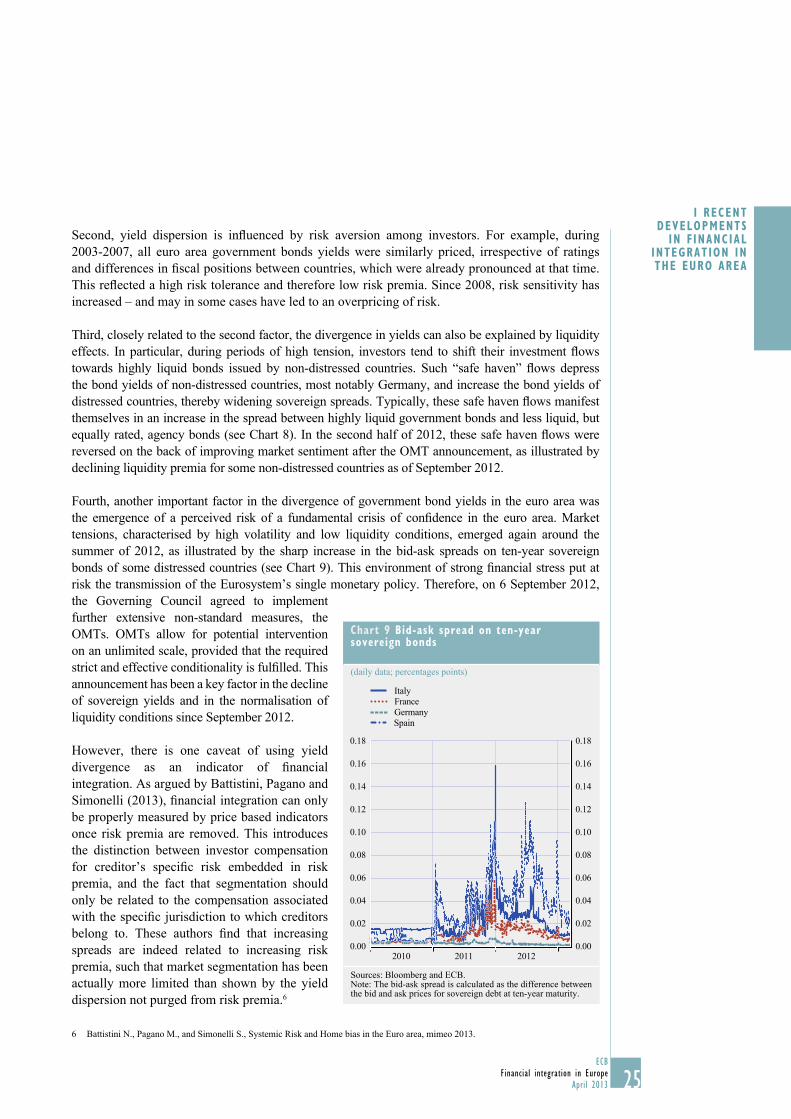
Fourth, another important factor in the divergence of government bond yields in the euro area was
the emergence of a perceived risk of a fundamental crisis of confi dence in the euro area. Market
tensions, characterised by high volatility and low liquidity conditions, emerged again around the
summer of 2012, as illustrated by the sharp increase in the bid-ask spreads on ten-year sovereign
bonds of some distressed countries (see Chart 9). This environment of strong fi nancial stress put at
risk the transmission of the Eurosystem’s single monetary policy. Therefore, on 6 September 2012,
the Governing Council agreed to implement
further extensive non-standard measures, the
OMTs. OMTs allow for potential intervention
on an unlimited scale, provided that the required
strict and effective conditionality is fulfi lled. This
announcement has been a key factor in the decline
of sovereign yields and in the normalisation of
liquidity conditions since September 2012.
However, there is one caveat of using yield
divergence as an indicator of fi nancial
integration. As argued by Battistini, Pagano and
Simonelli (2013), fi nancial integration can only
be properly measured by price based indicators
once risk premia are removed. This introduces
the distinction between investor compensation
for creditor’s specifi c risk embedded in risk
premia, and the fact that segmentation should
only be related to the compensation associated
with the specifi c jurisdiction to which creditors
belong to. These authors fi nd that increasing
spreads are indeed related to increasing risk
premia, such that market segmentation has been
actually more limited than shown by the yield
dispersion not purged from risk premia.6
6 Battistini N., Pagano M., and Simonelli S., Systemic Risk and Home bias in the Euro area, mimeo 2013.
Chart 9 Bid-ask spread on ten-year sovereign bonds
(daily data; percentages points)
0.00
0.02
0.04
0.06
0.08
0.10
0.12
0.14
0.16
0.18
0.00
0.02
0.04
0.06
0.08
0.10
0.12
0.14
0.16
0.18
2010 2011 2012
Italy
France
Germany
Spain
Sources: Bloomberg and ECB.Note: The bid-ask spread is calculated as the difference between the bid and ask prices for sovereign debt at ten-year maturity.
26ECB
Financial integration in Europe
April 2013
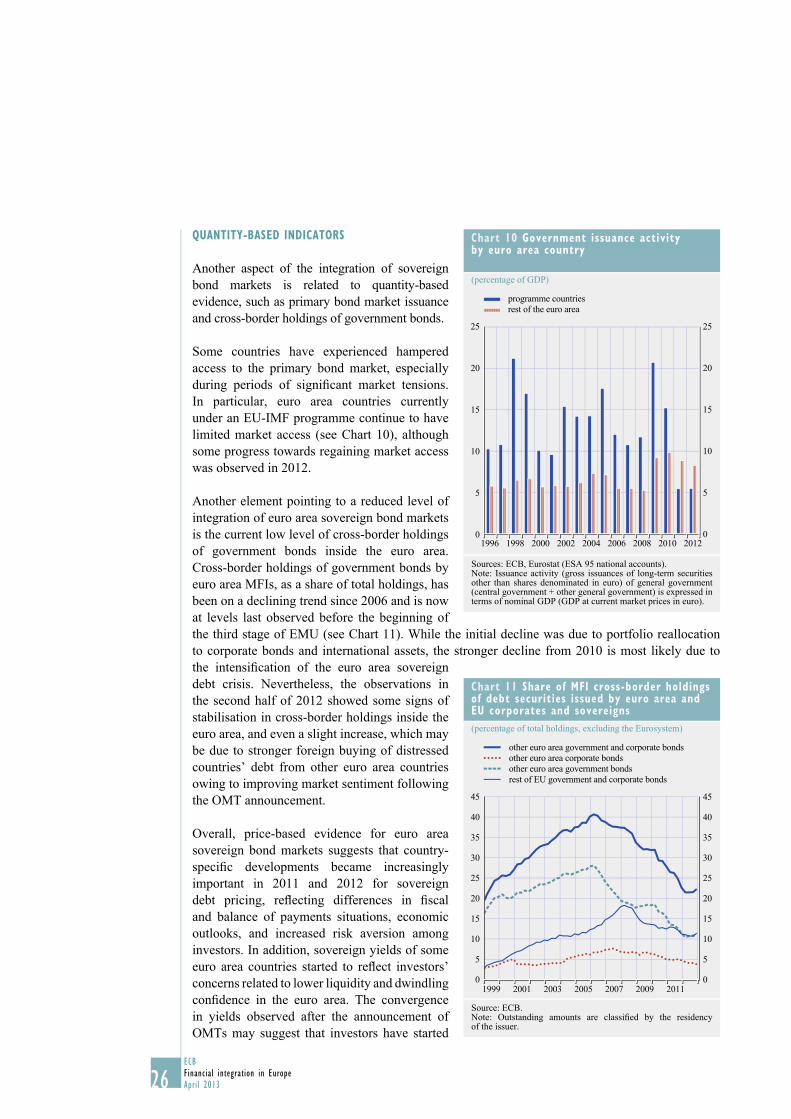
QUANTITY-BASED INDICATORS
Another aspect of the integration of sovereign
bond markets is related to quantity-based
evidence, such as primary bond market issuance
and cross-border holdings of government bonds.
Some countries have experienced hampered
access to the primary bond market, especially
during periods of signifi cant market tensions.
In particular, euro area countries currently
under an EU-IMF programme continue to have
limited market access (see Chart 10), although
some progress towards regaining market access
was observed in 2012.
Another element pointing to a reduced level of
integration of euro area sovereign bond markets
is the current low level of cross-border holdings
of government bonds inside the euro area.
Cross-border holdings of government bonds by
euro area MFIs, as a share of total holdings, has
been on a declining trend since 2006 and is now
at levels last observed before the beginning of
the third stage of EMU (see Chart 11). While the initial decline was due to portfolio reallocation
to corporate bonds and international assets, the stronger decline from 2010 is most likely due to
the intensifi cation of the euro area sovereign
debt crisis. Nevertheless, the observations in
the second half of 2012 showed some signs of
stabilisation in cross-border holdings inside the
euro area, and even a slight increase, which may
be due to stronger foreign buying of distressed
countries’ debt from other euro area countries
owing to improving market sentiment following
the OMT announcement.
Overall, price-based evidence for euro area
sovereign bond markets suggests that country-
specifi c developments became increasingly
important in 2011 and 2012 for sovereign
debt pricing, refl ecting differences in fi scal
and balance of payments situations, economic
outlooks, and increased risk aversion among
investors. In addition, sovereign yields of some
euro area countries started to refl ect investors’
concerns related to lower liquidity and dwindling
confi dence in the euro area. The convergence
in yields observed after the announcement of
OMTs may suggest that investors have started
Chart 11 Share of MFI cross-border holdings of debt securities issued by euro area and EU corporates and sovereigns
(percentage of total holdings, excluding the Eurosystem)
0
5
10
15
20
25
30
35
40
45
0
5
10
15
20
25
30
35
40
45
1999 2001 2003 2005 2007 2009 2011
other euro area government and corporate bonds
other euro area corporate bonds
other euro area government bonds
rest of EU government and corporate bonds
Source: ECB.Note: Outstanding amounts are classifi ed by the residency of the issuer.
Chart 10 Government issuance activity by euro area country
(percentage of GDP)
0
5
10
15
20
25
0
5
10
15
20
25
1996 1998 2000 2002 2004 2006 2008 2010 2012
programme countries
rest of the euro area
Sources: ECB, Eurostat (ESA 95 national accounts).Note: Issuance activity (gross issuances of long-term securities other than shares denominated in euro) of general government (central government + other general government) is expressed in terms of nominal GDP (GDP at current market prices in euro).

27ECB
Financial integration in Europe
April 2013
I RECENT DEVELOPMENTS
IN F INANCIAL INTEGRATION IN THE EURO AREA
to price into sovereign yields the Eurosystem’s
willingness to buy euro area government
bonds on a potentially unlimited scale, thereby
decreasing perceived default risk and associated
premia. Quantity-based evidence confi rms the
assessment of lower bond market integration
with impaired primary market access for some
euro area countries and cross-border holdings
of government bonds in the euro area at a
low level.
Corporate bond markets
PRICE-BASED INDICATORS
Corporate bond markets also experienced
signifi cant tensions in the fi rst part of 2012, in
particular related to the downgrades of distressed
sovereigns and the various developments in
sovereign yields described above. However,
tensions in the corporate bond markets abated
signifi cantly as of the announcement of OMTs.
Chart 12 shows the dispersion of yields across
countries for sovereign bonds, covered bonds
and corporate bonds. After some signs of
improvement with the two three-year LTROs,
the divergence of corporate bond and covered
bond yields across euro area countries increased
again as of March 2012, reaching historically
high levels in June 2012. In the second half
of 2012, after the announcement of OMTs,
the dispersion of corporate bond and covered
bond yields declined signifi cantly, refl ecting
developments in sovereign bond markets.
QUANTITY-BASED INDICATORS
Regarding quantity-based indicators, some
types of instrument, most notably unsecured
bank bonds were characterised by low issuance
in 2012, particularly in distressed countries
(see Chart 13). This is related to many
different factors, including reduced funding
needs following the three-year LTROs of the
Eurosystem, higher borrowing cost in distressed
countries, risk perception, the impact of
Chart 12 Cross-country dispersion in covered bond, corporate bond and sovereign bond yields in the euro area
(daily data; standard deviation; percentage points)
0
1
2
3
4
0
1
2
3
4
2007 2008 2009 2010 2011 2012
corporate bonds
covered bonds
sovereign bonds
Sources: Datastream Thomson Reuters, Bloomberg and ECB calculations.Note: Due to data availability, data only include observations for Germany, Spain, Finland, France, Italy, the Netherlands, Ireland and Austria.
Chart 13 Volume of issuance of senior unsecured bank bonds at euro area level
(EUR billions)
0
50
100
150
200
250
300
0
50
100
150
200
250
300
2004 2006 2008 2010 2012
non-distresseddistressed
Sources: Dealogic DCM Analytics and ECB calculations.Notes: Based on data available as at 31 December 2012. Retained and self-funded deals are not included. Euro area countries with a very small issuance are not included.

28ECB
Financial integration in Europe
April 2013
international regulation and the need for deleveraging. Although low issuance activity is not per
se an indicator of a decline in fi nancial integration, the evidence suggests that access to long-term
debt fi nancing (either senior unsecured or covered bonds) was more diffi cult in 2012 for banks in
distressed countries than for banks in non-distressed countries. This can be interpreted as a signal of
reduced integration in the market for banks’ long-term debt fi nancing.
The share of cross-border holdings of euro area corporate debt in total holdings of corporate debt
securities declined further in 2012 (see Chart 11 in the government bond section). However, the
share of cross-border holdings of the rest of the EU sovereign and corporate debt is still more than
twice as high as it was before the third stage of EMU.
Overall, price-based evidence suggests that the corporate debt market was characterised by increased
yield dispersion until mid-2012 probably refl ecting the pricing of increased risk of some government
bonds, but also higher market sensitivity to country specifi c news. After the announcement of
OMTs in September, yield dispersion reverted to lower levels. Quantity-based indicators show
some signs of reduced integration in the market for banks’ long-term debt fi nancing. Nevertheless,
based on these indicators, it is diffi cult to disentangle the effects of fundamentals from those of the
refi nancing operations of the Eurosystem.
4 EQUITY MARKETS
Recent developments in equity markets reveal a somewhat lower degree of cross-country
heterogeneity than in bond markets. However, the euro area crisis has also tended to accentuate
equity price divergence. Chart 14 shows the
dispersion of euro area stock market indices, as
characterised by the median, the interquartile
range (i.e. the range between the third and the
fi rst quartile), and the range between the highest
and the lowest index in the period from 1999
to 2012 (index: 1 January 1999 = 100). The
continuous widening in market trajectories in
2010-2012 may be a refl ection of the temporary
loss of output associated with the unwinding of
macroeconomic imbalances which had built up
in the run-up to the fi nancial and fi scal crises.
PRICE-BASED INDICATORS
In 2012, the continuation of the economic
crisis, entailing considerable loss of output and
employment in the corporate sector, especially
of some countries, exacerbated heterogeneity in
economic growth expectations among euro area
countries. This is refl ected in the divergence
of stock market indices, which converged
following the introduction of the euro, but have
been on a diverging trend since 2010.
Chart 14 Equity market indices in the euro area
(index: 1 January 1999 = 100)
0
20
40
60
80
100
120
140
160
180
200
0
20
40
60
80
100
120
140
160
180
200
1999 2001 2003 2005 2007 2009 2011 2013
min-max range
interquartile range
median
Sources: Thomson Reuters and ECB calculations.Note: The chart represents minimum, maximum and median equity market indices. Countries considered are Belgium, Ireland, Italy, France, Germany, Greece, Portugal and Spain.
29ECB
Financial integration in Europe
April 2013
I RECENT DEVELOPMENTS
IN F INANCIAL INTEGRATION IN THE EURO AREA
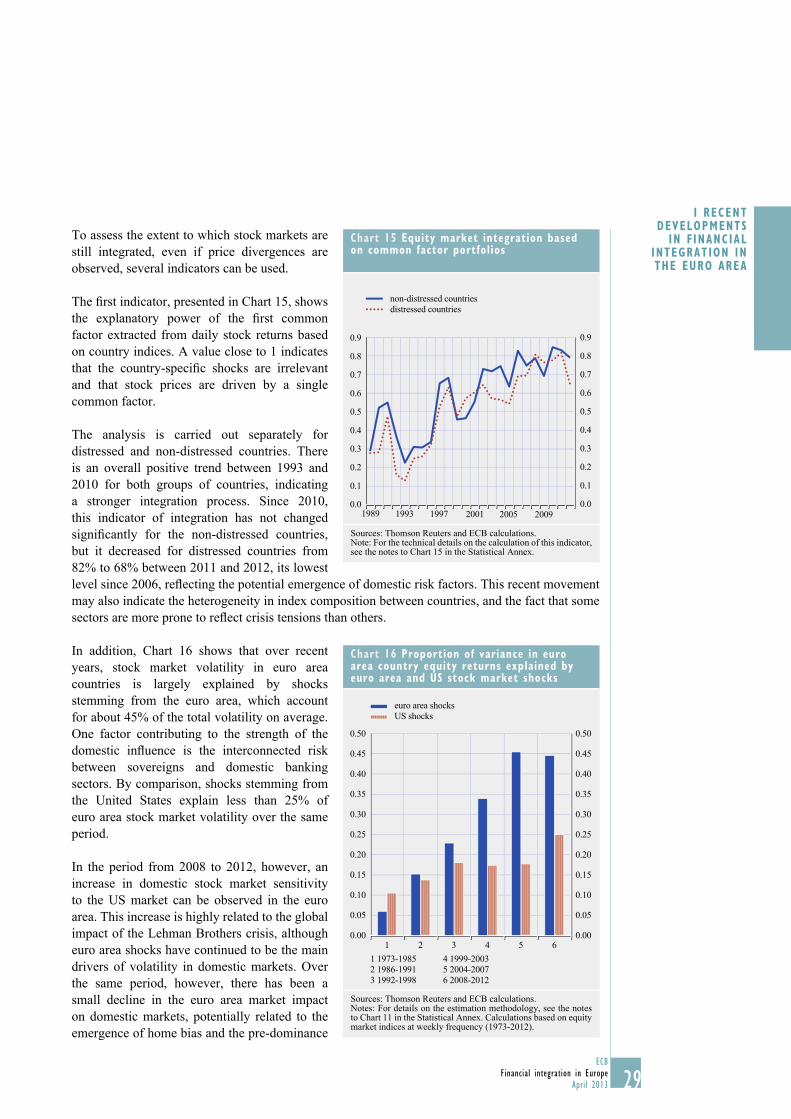
To assess the extent to which stock markets are
still integrated, even if price divergences are
observed, several indicators can be used.
The fi rst indicator, presented in Chart 15, shows
the explanatory power of the fi rst common
factor extracted from daily stock returns based
on country indices. A value close to 1 indicates
that the country-specifi c shocks are irrelevant
and that stock prices are driven by a single
common factor.
The analysis is carried out separately for
distressed and non-distressed countries. There
is an overall positive trend between 1993 and
2010 for both groups of countries, indicating
a stronger integration process. Since 2010,
this indicator of integration has not changed
signifi cantly for the non-distressed countries,
but it decreased for distressed countries from
82% to 68% between 2011 and 2012, its lowest
level since 2006, refl ecting the potential emergence of domestic risk factors. This recent movement
may also indicate the heterogeneity in index composition between countries, and the fact that some
sectors are more prone to refl ect crisis tensions than others.
In addition, Chart 16 shows that over recent
years, stock market volatility in euro area
countries is largely explained by shocks
stemming from the euro area, which account
for about 45% of the total volatility on average.
One factor contributing to the strength of the
domestic infl uence is the interconnected risk
between sovereigns and domestic banking
sectors. By comparison, shocks stemming from
the United States explain less than 25% of
euro area stock market volatility over the same
period.
In the period from 2008 to 2012, however, an
increase in domestic stock market sensitivity
to the US market can be observed in the euro
area. This increase is highly related to the global
impact of the Lehman Brothers crisis, although
euro area shocks have continued to be the main
drivers of volatility in domestic markets. Over
the same period, however, there has been a
small decline in the euro area market impact
on domestic markets, potentially related to the
emergence of home bias and the pre-dominance
Chart 16 Proportion of variance in euro area country equity returns explained by euro area and US stock market shocks
0.00
0.05
0.10
0.15
0.20
0.25
0.30
0.35
0.40
0.45
0.50
0.00
0.05
0.10
0.15
0.20
0.25
0.30
0.35
0.40
0.45
0.50
1 2 3 4 5 6
1 1973-1985
2 1986-1991
3 1992-1998
4 1999-2003
5 2004-2007
6 2008-2012
euro area shocks
US shocks
Sources: Thomson Reuters and ECB calculations.Notes: For details on the estimation methodology, see the notes to Chart 11 in the Statistical Annex. Calculations based on equity market indices at weekly frequency (1973-2012).
Chart 15 Equity market integration based on common factor portfolios
0.0
0.1
0.2
0.3
0.4
0.5
0.6
0.7
0.8
0.9
0.0
0.1
0.2
0.3
0.4
0.5
0.6
0.7
0.8
0.9
non-distressed countries
distressed countries
1989 1993 1997 2001 2005 2009
Sources: Thomson Reuters and ECB calculations.Note: For the technical details on the calculation of this indicator, see the notes to Chart 15 in the Statistical Annex.

30ECB
Financial integration in Europe
April 2013
of country-specifi c shocks. If this is the case,
then it may indicate increased segmentation in
euro area equity markets.
This tendency towards segmentation in
distressed countries is confi rmed by the
“segmentation index” presented in Chart 17.
This index refl ects a differential in returns
between country-specifi c markets and the
euro area: the higher the index, the stronger
the segmentation. It can be seen that, until
2011, distressed and non-distressed countries
presented a similar degree of segmentation,
both being particularly strongly affected by the
Lehman Brothers crisis. However, since 2011,
while market segmentation for non-distressed
countries has fl uctuated around the long-term
average, market segmentation for distressed
countries reacted strongly to the euro area crisis,
peaking at a level close to that observed during
the Lehman Brothers episode.
QUANTITY-BASED INDICATORS
Euro area investment funds’ cross-border holdings of equity issued in other euro area countries have
declined since the beginning of the fi nancial crisis, reaching a level comparable to that prevailing in
2001 (Chart 18).
Chart 18 Investment funds’ holdings of equity issued in other euro area countries and the rest of the world
(percentage of total holdings of equity)
0
10
20
30
40
50
60
70
0
10
20
30
40
50
60
70
other euro area countries
rest of the world
1999 2001 2003 2005 2007 2009 2011
Source: ECB.
Chart 19 The degree of cross-border holdings of equity issued by euro area residents
(percentages)
10
20
30
40
50
10
20
30
40
50
intra-euro area stressed
countries
non-stressed
countries
1997
2001
2002
2003
2004
2005
2006
2007
2008
20092010
2011
Sources: IMF, Thomson Reuters and ECB calculations.Note: Intra-euro area is defi ned as the share of equity issued by euro area residents and held by residents of other euro area countries (excluding central banks).
Chart 17 Equity market segmentation in distressed and non-distressed countries
0.000
0.005
0.010
0.015
0.020
0.025
0.030
0.035
0.040
0.045
0.000
0.005
0.010
0.015
0.020
0.025
0.030
0.035
0.040
0.045
1999 2001 2003 2005 2007 2009 2011
non-distressed countries
distressed countries
Sources: Thomson Reuters and ECB calculations.Note: For technical details on the calculation of this indicator, see notes to Chart 16 in the Statistical Annex.

31ECB
Financial integration in Europe
April 2013
I RECENT DEVELOPMENTS
IN F INANCIAL INTEGRATION IN THE EURO AREA
More generally, the degree of intra-euro area cross-border holdings of equity issued by euro area
residents (Chart 19) has increased steadily over the last decade: the advent of the euro area allowed
investors to diversify portfolios without bearing currency risk, leading to higher cross-border
holdings within the euro area.
5 BANKING MARKETS
Overall, there are signs that the trend towards fragmentation of euro area banking markets continued
during 2012, further reversing some of the past achievements in this segment. Indicators of banks’
cross-border activities, as well as prices and conditions of loans and deposits, reveal a lower degree of
integration in 2012 than in the previous year. However, the move towards a “banking union” and the
OMT announcement halted the fragmentation trend in mid-2012 in some cross-border banking markets.
STRUCTURAL INDICATORS
Banks’ cross-border activities can be measured by total assets of non-domestic branches and subsidiaries
of euro area banks within euro area countries. The share of total assets of these affi liates in the total
assets of the domestic banking system is calculated for each euro area country. Then, the level and
dispersion of these country shares are described by the fi rst and the third quartiles as well as by the
median (Chart 20). Cross-border activity increased strongly and steadily between 1999 and 2008. Owing
to the fi nancial crisis, the share of assets held by foreign branches and subsidiaries of euro area banks
has been decreasing since 2008. A substantial increase in cross-country differences can also be observed.
This might point to a lower degree of banking market integration.
ACTIVITY-BASED INDICATORS
In 2012, the negative trend in cross-border interbank lending came to a halt, after a strong decline
in 2011. In total, cross-border MFI loans to other MFIs in the EU have declined by around 30%
since the start of the fi nancial crisis, following
a strong increase in the years between the
introduction of the euro and the beginning of
the crisis (Chart 21). This can be explained
in part by a higher perception of risk for non-
domestic interbank loans owing to the sovereign
debt crisis. Since mid-2012, positive signals
given by the announcement of the ECB’s OMT
programme and the prospect of a banking union
in Europe have stopped the decline in cross-
border interbank lending.
The less integrated market for MFI loans to
non-MFIs, including households, non-fi nancial
corporations and other fi nancial institutions,
proved to be comparatively robust, despite the
fi nancial and sovereign crises. In 2012, cross-
border activity in this market segment remained
relatively stable. In the fourth quarter of 2012,
cross-border MFI loans to non-MFIs in the EU
Chart 20 Dispersion of the total assets of foreign branches and subsidiaries of euro area banks across euro area countries
(percentage of the total assets of the euro area banking sector)
0
10
20
30
40
0
10
20
30
40
1999 2001 2003 2005 2007 2009 2011
interquartile (blue area)median
Source: ECB.Note: The chart displays the median for the share of cross-border assets and the overall dispersion across countries.

32ECB
Financial integration in Europe
April 2013
accounted for 7.6% of total MFI loans to non-MFIs, while domestic loans accounted for 87.9% and
loans to the rest of the world accounted for 4.5% (see Chart 22 in the Statistical Annex).
The dispersion of growth in bank loans to non-fi nancial corporations across the distressed and the
non-distressed country groups has substantially increased (Chart 22). For the group of distressed
countries, the loan growth even turned negative, reaching lower levels than in 2010, at which time
all Member States were affected. There was also a period of a wide dispersion in loan growth across
countries before the onset of the crisis. However, between 2004 and 2008, loan growth was stronger
in the distressed countries than in the non-distressed countries, whereas in 2012 the reverse was
true. This development follows the pattern of a boom-bust cycle. The divergence between these
groups of countries can be explained by differences in demand for and/or access to credit across
Member States, which may refl ect differences in the economic outlook (e.g. economic growth and
unemployment), the state of their banking systems (e.g. deleveraging pressure, cost of funding)
and/or domestic sovereign risk (e.g. national indebtedness).
SURVEY-BASED INDICATORS
The euro area bank lending survey asks banks on a quarterly basis about changes in their credit
standards applied to the approval of loans to companies and households in euro area countries.
A permanent divergence between the groups of countries would indicate persistent disparities in
borrowers’ access to credit across countries which may refl ect both divergent developments in
banks’ cost of funds and balance sheets as well as in overall credit risk.
Recently, the changes in credit standards applied to the approval of loans or credit lines to
enterprises suggest some convergence (Chart 23). By contrast, the credit standards applied
to loans to households for house purchases have temporarily moved in opposite directions in
the two groups of countries in the second half of 2012 (Chart 23). For the fi rst time since 2006,
Chart 22 MFI loans to non-financial corporations
(annual loan growth; percentages)
-10
-5
0
5
10
15
20
25
-10
-5
0
5
10
15
20
25
2004 2005 2006 2007 2008 2009 2010 2011 2012
euro area
distressed countries
non-distressed countries
Source: ECB.
Chart 21 Cross-border MFI loans to MFIs and non-MFIs in the EU
(index: Q2 2007 = 100)
70
80
90
100
110
120
70
80
90
100
110
120
2007 2008 2009 2010 2011 2012
MFI loans to non-MFIs in the EU
MFI loans to MFIs in the EU
Source: ECB.
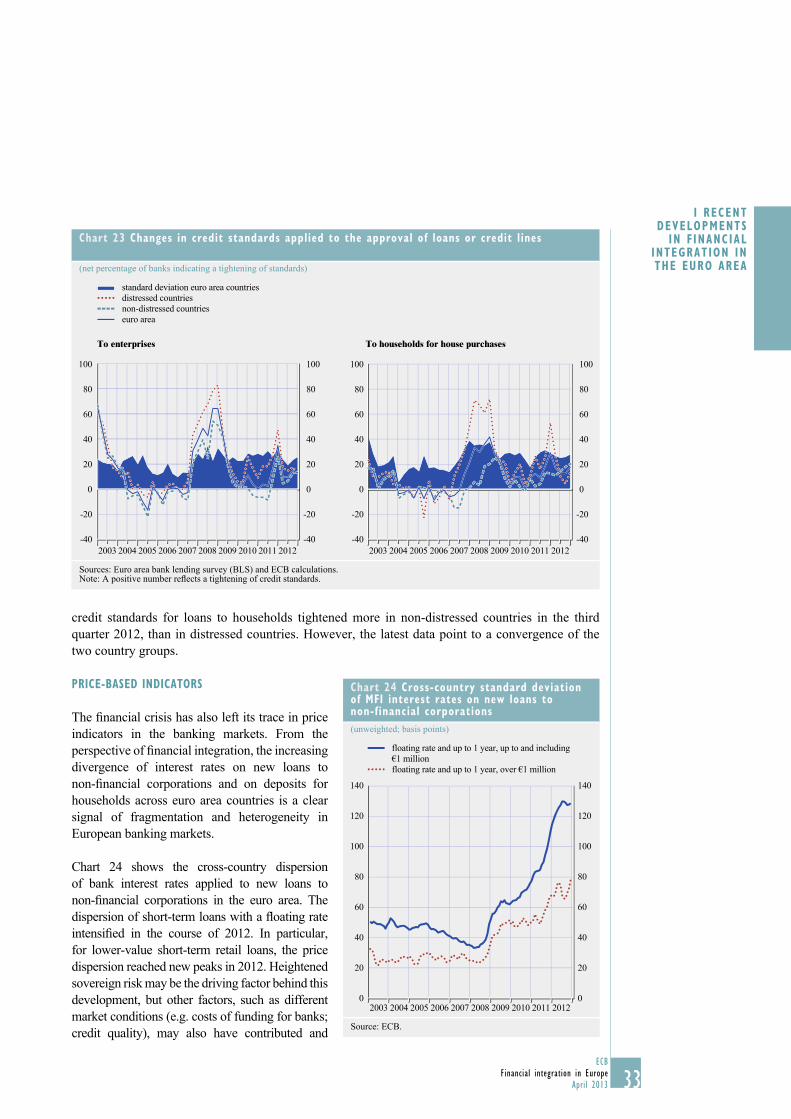
33ECB
Financial integration in Europe
April 2013
I RECENT DEVELOPMENTS
IN F INANCIAL INTEGRATION IN THE EURO AREA
credit standards for loans to households tightened more in non-distressed countries in the third
quarter 2012, than in distressed countries. However, the latest data point to a convergence of the
two country groups.
PRICE-BASED INDICATORS
The fi nancial crisis has also left its trace in price
indicators in the banking markets. From the
perspective of fi nancial integration, the increasing
divergence of interest rates on new loans to
non-fi nancial corporations and on deposits for
households across euro area countries is a clear
signal of fragmentation and heterogeneity in
European banking markets.
Chart 24 shows the cross-country dispersion
of bank interest rates applied to new loans to
non-fi nancial corporations in the euro area. The
dispersion of short-term loans with a fl oating rate
intensifi ed in the course of 2012. In particular,
for lower-value short-term retail loans, the price
dispersion reached new peaks in 2012. Heightened
sovereign risk may be the driving factor behind this
development, but other factors, such as different
market conditions (e.g. costs of funding for banks;
credit quality), may also have contributed and
Chart 23 Changes in credit standards applied to the approval of loans or credit lines
(net percentage of banks indicating a tightening of standards)
standard deviation euro area countries
distressed countries
non-distressed countries
euro area
To enterprises To households for house purchases
-40
-20
0
20
40
60
80
100
-40
-20
0
20
40
60
80
100
2003 20052004 20072006 20092008 2010 2011 2012
-40
-20
0
20
40
60
100
80
-40
-20
0
20
40
60
100
80
2003 20052004 20072006 20092008 2011 20122010
Sources: Euro area bank lending survey (BLS) and ECB calculations.Note: A positive number refl ects a tightening of credit standards.
Chart 24 Cross-country standard deviation of MFI interest rates on new loans to non-financial corporations
(unweighted; basis points)
0
20
40
60
80
100
120
140
0
20
40
60
80
100
120
140
2003 2004 2005 2006 2007 2008 2009 2010 2011 2012
floating rate and up to 1 year, up to and including
€1 million
floating rate and up to 1 year, over €1 million
Source: ECB.
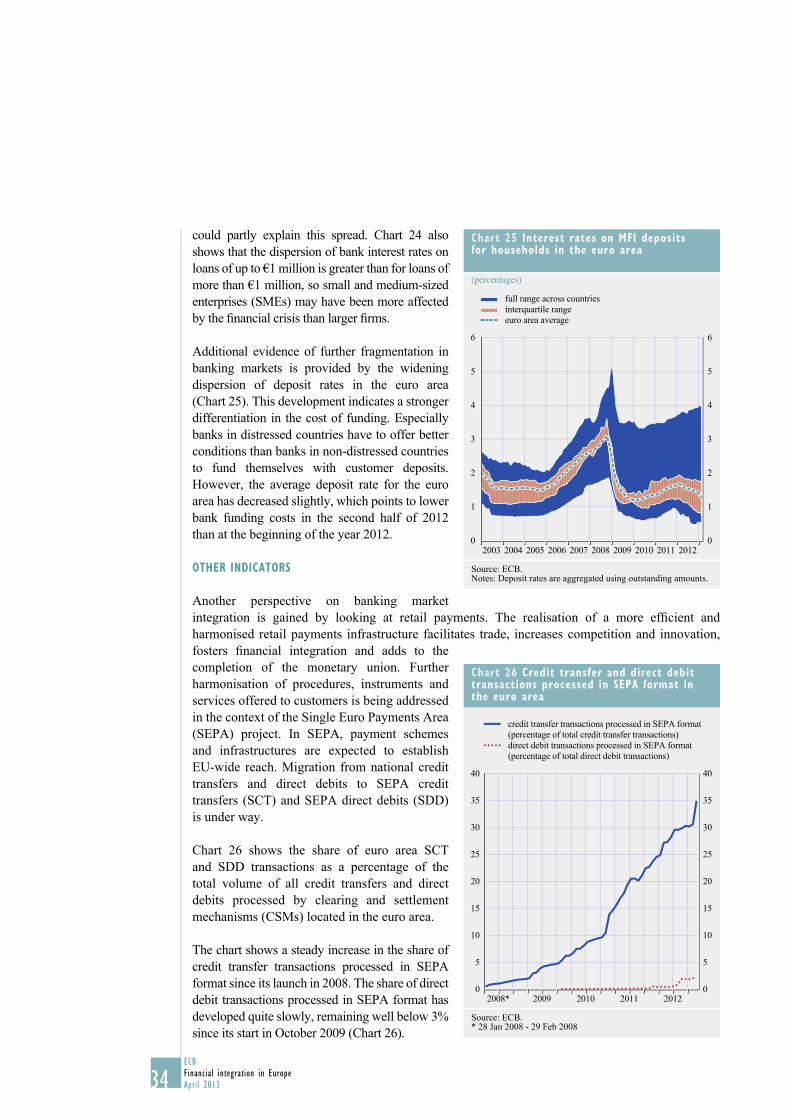
34ECB
Financial integration in Europe
April 2013
could partly explain this spread. Chart 24 also
shows that the dispersion of bank interest rates on
loans of up to €1 million is greater than for loans of
more than €1 million, so small and medium-sized
enterprises (SMEs) may have been more affected
by the fi nancial crisis than larger fi rms.
Additional evidence of further fragmentation in
banking markets is provided by the widening
dispersion of deposit rates in the euro area
(Chart 25). This development indicates a stronger
differentiation in the cost of funding. Especially
banks in distressed countries have to offer better
conditions than banks in non-distressed countries
to fund themselves with customer deposits.
However, the average deposit rate for the euro
area has decreased slightly, which points to lower
bank funding costs in the second half of 2012
than at the beginning of the year 2012.
OTHER INDICATORS
Another perspective on banking market
integration is gained by looking at retail payments. The realisation of a more effi cient and
harmonised retail payments infrastructure facilitates trade, increases competition and innovation,
fosters fi nancial integration and adds to the
completion of the monetary union. Further
harmonisation of procedures, instruments and
services offered to customers is being addressed
in the context of the Single Euro Payments Area
(SEPA) project. In SEPA, payment schemes
and infrastructures are expected to establish
EU-wide reach. Migration from national credit
transfers and direct debits to SEPA credit
transfers (SCT) and SEPA direct debits (SDD)
is under way.
Chart 26 shows the share of euro area SCT
and SDD transactions as a percentage of the
total volume of all credit transfers and direct
debits processed by clearing and settlement
mechanisms (CSMs) located in the euro area.
The chart shows a steady increase in the share of
credit transfer transactions processed in SEPA
format since its launch in 2008. The share of direct
debit transactions processed in SEPA format has
developed quite slowly, remaining well below 3%
since its start in October 2009 (Chart 26).
Chart 25 Interest rates on MFI deposits for households in the euro area
(percentages)
0
1
2
3
4
5
6
0
1
2
3
4
5
6
2003 2004 2005 2006 2007 2008 2009 2010 2011 2012
euro area average
interquartile range
full range across countries
Source: ECB.Notes: Deposit rates are aggregated using outstanding amounts.
Chart 26 Credit transfer and direct debit transactions processed in SEPA format in the euro area
0
5
10
15
20
25
30
35
40
0
5
10
15
20
25
30
35
40
2008* 2009 2010 2011 2012
credit transfer transactions processed in SEPA format
(percentage of total credit transfer transactions)
direct debit transactions processed in SEPA format
(percentage of total direct debit transactions)
Source: ECB.* 28 Jan 2008 - 29 Feb 2008

35ECB
Financial integration in Europe
April 2013
I RECENT DEVELOPMENTS
IN F INANCIAL INTEGRATION IN THE EURO AREA
However, this share is expected to increase following the adoption of the SEPA migration end-date
Regulation in March 2012,7 which lays down a clear timeline for migration to the new European
payment instruments. For the euro area, the fi nal deadline is 1 February 2014, while the deadline
for euro-denominated payments in non-euro area Member States is 31 October 2016. As of these
dates, existing national euro credit transfer and direct debit schemes will have to be phased out
and replaced by the pan-European SEPA alternatives. The ECB welcomed and supported the
legislative proposal in its Opinion of 7 April 2011. More details on the euro retail payments market
are presented in Special Feature B, which discusses the development of the SEPA project as well as
the benefi ts of SEPA and remaining challenges.
7 Regulation (EU) No 260/2012 of the European Parliament and of the Council of 14 March 2012 establishing technical and business
requirements for credit transfers and direct debits in euro and amending Regulation (EC) No 924/2009 (OJ L 94, 30.3.2012, p. 22).
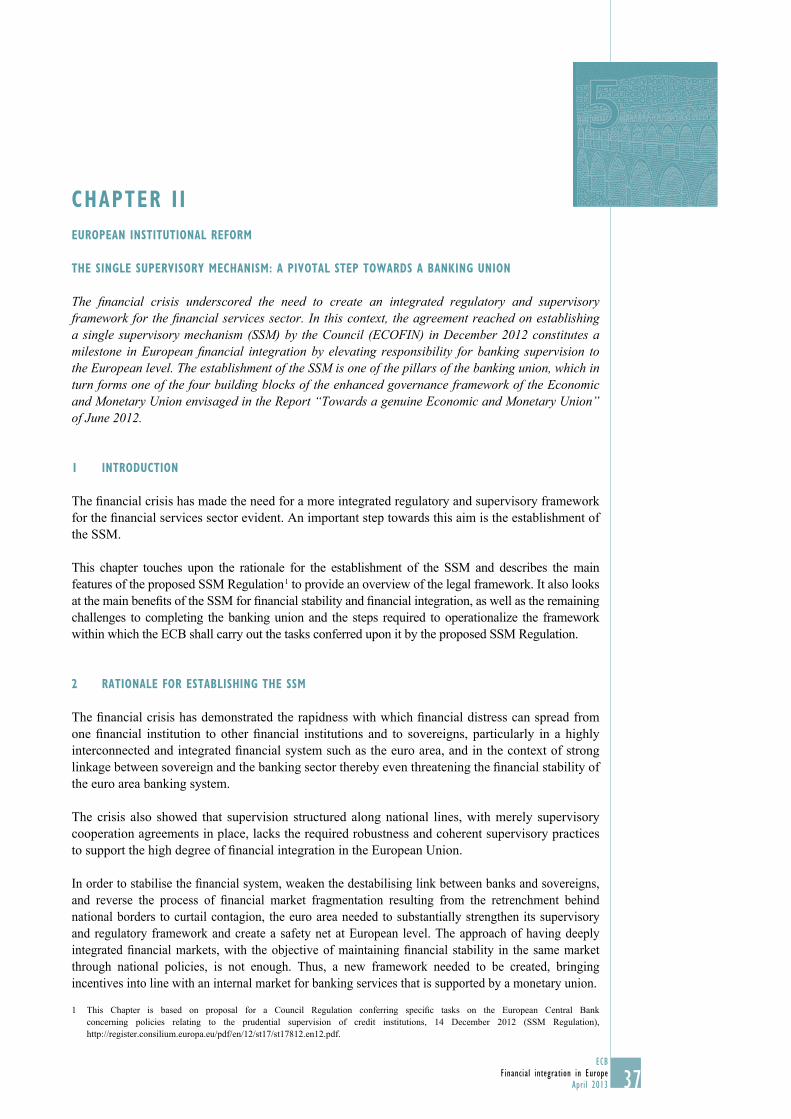
37ECB
Financial integration in Europe
April 2013
EUROPEAN INSTITUTIONAL REFORM
THE SINGLE SUPERVISORY MECHANISM: A PIVOTAL STEP TOWARDS A BANKING UNION
The fi nancial crisis underscored the need to create an integrated regulatory and supervisory framework for the fi nancial services sector. In this context, the agreement reached on establishing a single supervisory mechanism (SSM) by the Council (ECOFIN) in December 2012 constitutes a milestone in European fi nancial integration by elevating responsibility for banking supervision to the European level. The establishment of the SSM is one of the pillars of the banking union, which in turn forms one of the four building blocks of the enhanced governance framework of the Economic and Monetary Union envisaged in the Report “Towards a genuine Economic and Monetary Union” of June 2012.
1 INTRODUCTION
The fi nancial crisis has made the need for a more integrated regulatory and supervisory framework
for the fi nancial services sector evident. An important step towards this aim is the establishment of
the SSM.
This chapter touches upon the rationale for the establishment of the SSM and describes the main
features of the proposed SSM Regulation 1 to provide an overview of the legal framework. It also looks
at the main benefi ts of the SSM for fi nancial stability and fi nancial integration, as well as the remaining
challenges to completing the banking union and the steps required to operationalize the framework
within which the ECB shall carry out the tasks conferred upon it by the proposed SSM Regulation.
2 RATIONALE FOR ESTABLISHING THE SSM
The fi nancial crisis has demonstrated the rapidness with which fi nancial distress can spread from
one fi nancial institution to other fi nancial institutions and to sovereigns, particularly in a highly
interconnected and integrated fi nancial system such as the euro area, and in the context of strong
linkage between sovereign and the banking sector thereby even threatening the fi nancial stability of
the euro area banking system.
The crisis also showed that supervision structured along national lines, with merely supervisory
cooperation agreements in place, lacks the required robustness and coherent supervisory practices
to support the high degree of fi nancial integration in the European Union.
In order to stabilise the fi nancial system, weaken the destabilising link between banks and sovereigns,
and reverse the process of fi nancial market fragmentation resulting from the retrenchment behind
national borders to curtail contagion, the euro area needed to substantially strengthen its supervisory
and regulatory framework and create a safety net at European level. The approach of having deeply
integrated fi nancial markets, with the objective of maintaining fi nancial stability in the same market
through national policies, is not enough. Thus, a new framework needed to be created, bringing
incentives into line with an internal market for banking services that is supported by a monetary union.
1 This Chapter is based on proposal for a Council Regulation conferring specifi c tasks on the European Central Bank
concerning policies relating to the prudential supervision of credit institutions, 14 December 2012 (SSM Regulation),
http://register.consilium.europa.eu/pdf/en/12/st17/st17812.en12.pdf.
CHAPTER I I
38ECB
Financial integration in Europe
April 2013
In this context, a milestone was reached on 13 December 2012, when the Council (ECOFIN)
reached agreement on proposals aimed at establishing a SSM.2
This agreement is a landmark in the process of European integration as it confers at the European
level specifi c supervisory tasks relating to the prudential supervision of credit institutions to the
ECB within the SSM framework over all euro area credit institutions, with an option for non-euro
area supervisory authorities to join.
The establishment of the SSM constitutes the fi rst step towards the creation of a banking union,
aimed at creating an integrated framework for the fi nancial sector as set out in the report “Towards a genuine Economic and Monetary Union” which was prepared by the Presidents of the Council,
the European Commission, the Eurogroup and the European Central Bank.3
The integrated framework envisages the creation of a banking union covering supervision, resolution
and deposit insurance.
These three elements together constitute the Banking Union and are intended to provide a European
dimension to the main pillars for safeguarding the robustness and stability of the banking sector. These
three blocks form, together, a coherent set of policies, which are diffi cult to dissociate in the long run.
3 MAIN FEATURES OF THE PROPOSED SSM REGULATION
The SSM will be a mechanism composed of the ECB and national competent authorities of euro
area countries, with the national competent authorities of non-euro area Member States being able to
participate through the establishment of close cooperation with the ECB, whereby the responsibility
for specifi c supervisory tasks will be conferred to the ECB. The ECB will be responsible for the
effective and consistent functioning of the SSM.4,5 An important element that will be supportive to
the effectiveness of the SSM, is the completion of the single rulebook, which in a substantial way
already exists and whose implementation is overseen by the EBA.
The conferral of supervisory tasks to a central bank is quite common; many other central banks are
assigned responsibilities that combine these two functions. The crisis has strengthened the trend
of central banks acquiring supervisory responsibilities, thereby also reaping the synergies between
macro- and micro-prudential supervision.
In its supervisory function, the ECB will be assisted by national supervisory authorities who
have long-established expertise in supervision. This cooperation includes the assistance of
national competent authorities with the on-going day-to-day assessment of a bank’s situation and
related on-site inspections.6 Furthermore, the ECB will also closely cooperate with the European
Banking Authority (EBA), the European Securities and Markets Authority (ESMA), the European
Insurance and Occupational Pensions Authority (EIOPA) and the European Systemic Risk Board
(ESRB) within the framework of the European System of Financial Supervision (ESFS), which
was established in 2010.7 In addition, the ECB will also cooperate closely with the authorities
2 See the ECOFIN Council press release at http://www.consilium.europa.eu/uedocs/cms_Data/docs/pressdata/en/ecofi n/134287.pdf.
3 “Towards a genuine Economic and Monetary Union”, European Council, 26 June 2012.
4 See Article 5(1) of the proposed SSM Regulation. http://register.consilium.europa.eu/pdf/en/12/st17/st17812.en12.pdf.
5 See the Opinion of the European Central Bank of 27 November 2012, available at http://www.ecb.int/ecb/legal/pdf/en_con_2012_96_f.pdf.
6 See recital 28 and Article 5(3) of the proposed SSM Regulation, http://register.consilium.europa.eu/pdf/en/12/st17/st17812.en12.pdf.
7 See Article 3(1) of the proposed SSM Regulation, http://register.consilium.europa.eu/pdf/en/12/st17/st17812.en12.pdf.

39ECB
Financial integration in Europe
April 2013
I I EUROPEAN INST ITUTIONAL
REFORMempowered to resolve credit institutions and the European Financial Stability Facility (EFSF) and
the European Stability Mechanism (ESM).8
The section below describes the specifi cities of the provisions of the proposed SSM Regulation,
including the scope of supervisory tasks and powers conferred upon the ECB, as well as the safeguards
to ensure a clear separation between the monetary policy and supervisory functions of the ECB.
3.1 SCOPE OF THE SINGLE SUPERVISORY MECHANISM
The scope of the proposed SSM Regulation is very broad, covering more than 6,000 credit
institutions established in the euro area. The fact that all credit institutions in the euro area fall
within the scope of the SSM - albeit a differentiated approach regarding the conduct of supervision
is envisaged - is an essential element of the mechanism. The recent crisis has illustrated that not
only larger banks can pose systemic risks. Due to interlinkages, smaller but more numerous regional
institutions can also be systemic as a group and thus destabilise countries and regions. Important
factors in this context are the interconnectedness of the banking sector and the interlinkages between
banks and sovereigns.
Furthermore, with a view to maintaining and deepening the internal market, the proposed SSM
Regulation allows supervisory authorities of non-euro area Member States to participate in the
SSM through the establishment of close cooperation. The SSM Regulation aims at ensuring equal
treatment of participating Member States whose currency is the euro and participating Member
States whose currency is not the euro which have established a close cooperation with the ECB. A
pre-condition for entering into close cooperation with the ECB is the confi rmation that measures
requested by the ECB will be adopted and complied with by the respective national competent
authorities in the Member States wishing to participate.9 Once close cooperation has been
established, the ECB will conduct supervision of credit institutions established in a Member State
whose currency is not the euro by means of instructions to national authorities.
As regards the conduct of supervision a differentiated approach is envisaged in the proposed SSM
Regulation for those credit institutions falling under the direct supervision of the ECB and those
credit institutions that will be primarily subject to supervision by national competent authorities.
In concrete terms, this means that the ECB will focus its direct supervision on those banks, banking
groups and respective entities that are considered to be signifi cant. The thresholds (on a consolidated
basis) that determine whether a credit institution is signifi cant and should therefore fall under the
direct supervisory responsibility of the ECB are that:
(i) the total value of its assets exceeds €30 billion; or
(ii) the ratio of its total assets over the GDP of the participating Member State of establishment
exceeds 20%, unless the total value of its assets is below €5 billion; or
(iii) following a notifi cation by its national competent authority that it considers such an institution
of signifi cant relevance with regard to the domestic economy, the ECB takes a decision
confi rming such signifi cance following a comprehensive assessment by the ECB, including a
balance-sheet assessment, of that credit institution.10
8 See Article 3(3) and 3(4) of the proposed SSM Regulation, http://register.consilium.europa.eu/pdf/en/12/st17/st17812.en12.pdf.
9 See recital 29 and Article 6(2) of the proposed SSM Regulation, http://register.consilium.europa.eu/pdf/en/12/st17/st17812.en12.pdf.
10 See Article 5 of the proposed SSM Regulation, http://register.consilium.europa.eu/pdf/en/12/st17/st17812.en12.pdf.

40ECB
Financial integration in Europe
April 2013
Furthermore, the ECB shall carry out the tasks conferred upon it by the SSM Regulation in
respect of the three most signifi cant credit institutions in each of the participating Member States,
unless justifi ed by particular circumstances. In addition, the ECB may also, on its own initiative,
consider an institution to be of signifi cant relevance where it has established banking subsidiaries
in more than one participating Member States and its cross-border assets or liabilities represent a
signifi cant part of its total assets or liabilities. Furthermore, banks that have requested or received
public fi nancial assistance directly from the EFSF or the ESM will also be considered to be of
signifi cant relevance.11
With regard to less signifi cant credit institutions, these will be subject to decisions by national
supervisors and the ECB will issue regulations, guidelines or general instructions to the national
competent authorities. Moreover, the ECB will be able to require national competent authorities
to notify the ECB of any material supervisory procedure, to conduct further assessment and/
or transmit to the ECB draft supervisory decisions. The ECB will retain the power to request
information, to conduct investigations and on-site inspections. Where necessary to ensure
consistent application of high supervisory standards, the ECB may at any time, on its own
initiative and after consulting with national authorities, or at the request of a national competent
authority, decide to exercise direct supervision.12
3.2 SUPERVISORY TASKS AND POWERS OF THE ECB
The proposed SSM Regulation confers on the ECB certain key supervisory tasks necessary for the
supervision of credit institutions, notably all key tasks related to the prudential supervision of credit
institutions, while all tasks not specifi ed in the Regulation would remain within the competence of
national competent authorities. Thus the ECB will be responsible for an extensive set of tasks ranging from the authorisation of credit institutions to carrying out early interventions in the case of
fi nancial distress of a credit institution. The main micro-prudential tasks conferred on the ECB are
set out in Box 1. The conduct of these tasks will be done in accordance with the provisions laid out
in the SSM Regulation.
Some supervisory tasks will remain at national level and thus continue to be the responsibility
of national competent authorities. These include the supervision of credit institutions from third
countries establishing a branch in the Member State concerned and matters related to consumer
protection, money laundering and payment services.13
Additionally, as mentioned above, for banks that are considered to be non-signifi cant, national
authorities will remain competent as regards the conduct of supervisory tasks. The conduct of these
tasks will be subject to the ECB’s general oversight framework.
The ECB will have an extensive set of powers. In order to carry out its supervisory tasks, the ECB
may conduct all necessary investigations and on-site inspections, adopt guidelines, recommendations
and regulations and obtain all the information that is necessary from the fi nancial institutions in
the participating Member States, as well as persons belonging to those entities and third parties to
whom the fi nancial institution has outsourced operational functions or activities. Finally, in order to
be able to enforce supervisory rules and decisions, the ECB also has sanctioning powers.
11 See Article 5 of the proposed SSM Regulation, http://register.consilium.europa.eu/pdf/en/12/st17/st17812.en12.pdf.
12 See Article 5(5)(b) of the proposed SSM Regulation, http://register.consilium.europa.eu/pdf/en/12/st17/st17812.en12.pdf.
13 See recital 22 and Article 4 of the proposed SSM Regulation, http://register.consilium.europa.eu/pdf/en/12/st17/st17812.en12.pdf.

41ECB
Financial integration in Europe
April 2013
I I EUROPEAN INST ITUTIONAL
REFORMBox 1
MICRO-PRUDENTIAL TASKS CONFERRED UPON THE ECB, INCLUDE:1
authorisation and withdrawal of authorisation of credit institutions; -
for credit institutions in participating Member States which wish to establish branches in non- -
participating Member States, the ECB would conduct the supervisory tasks the competent
authority of the home Member State would have;
assessing applications for the acquisition and disposal of qualifying holdings in credit -
institutions;
ensuring compliance with prudential requirements imposed on credit institutions in the areas -
of own funds requirements, securitisation, large exposure limits, liquidity, leverage, and
reporting and public disclosure of information on those matters;
ensuring compliance with requirements imposed on credit institutions to have in place robust -
governance arrangements, including fi t and proper requirements for persons responsible for the
management of credit institutions, risk management processes, internal control mechanisms,
remuneration policies and practices, and effective internal capital adequacy assessment
processes;
carrying out supervisory reviews, including stress tests, and on the basis of the review to -
impose specifi c additional own funds requirements, publication requirements, liquidity
requirements and other measures;
carrying out supervision on a consolidated basis of credit institutions’ parents established in -
one of the participating Member States, including supervision of fi nancial holding companies
and mixed fi nancial holding companies, and participating in colleges of supervisors without
prejudice to the participation of national competent authorities of participating Member States
in these colleges as observers, in relation to parents not established in one of the participating
Member States;
participating in supplementary supervision of a fi nancial conglomerate in relation to the credit -
institutions included in it and assume the tasks of coordinator where the ECB is appointed as
such on the basis of relevant Union law;
carrying out supervisory tasks in relation to recovery plans, and early intervention where a -
credit institution does not meet or is likely to breach the applicable prudential requirements
and in cases stipulated by Union law, structural changes required from credit institutions to
prevent fi nancial stress or failure, excluding any resolution powers.
1 See Article 4 of the proposed SSM Regulation, http://register.consilium.europa.eu/pdf/en/12/st17/st17812.en12.pdf.
42ECB
Financial integration in Europe
April 2013
As regards macro-prudential tasks and tools, the SSM Regulation stipulates that, in addition to the
competence of national competent authorities in this fi eld, the ECB, according to the procedures
foreseen in Union law, may apply certain measures addressing systemic or macro-prudential risks.14
These measures include applying higher requirements for capital buffers, in particular counter-
cyclical buffer rates. Macro-prudential instruments which are not specifi ed in Union law, such as
loan-to-income and loan-to-value ratios, will remain the sole responsibility of national authorities.
The conferral of specifi c macro-prudential tasks on the ECB is an important element, as macro- and
micro-prudential risks can be mutually reinforcing, provided some organisational arrangements are
in place to prevent confl icts of perspectives and objectives that may also arise.
In particular, the proposed SSM Regulation allows Member States either to act on their own initiative
when applying macro-prudential tools or to request that the ECB act. In addition, the ECB may
on its own initiative apply more stringent macro-prudential tools in consultation with the relevant
competent authority in each participating Member State. Thus, the proposed SSM Regulation allows
both the national authorities and the ECB to take action. Their action will, however, be subject to
a mutual consultation obligation and close collaboration on these issues will be essential. Both the
national authorities and the ECB must inform each other of their intentions ten working days prior
to taking action and duly consider possible related objections in reply, before proceeding with the
decision. In addition, when acting on the basis of a request from a Member State or on its own
initiative, the ECB will have to take into account the specifi c fi nancial and economic situation of
the Member State concerned.15 The underlying rationale for this comes from the varying economic
cycles of Member States. This fl exible application of national and ECB competences will allow the
SSM to ensure a level playing fi eld, and address fi nancial stability concerns at the relevant level;
sub-national, national or wider.
3.3 GOVERNANCE OF THE SSM
The SSM Regulation provides specifi c safeguards that aim to mitigate potential confl icts of interest
between the ECB’s monetary policy function and its supervisory function, in particular as regards
ensuring the differentiated functioning of the Governing Council in relation to its monetary policy
and supervisory functions. The specifi c features that are introduced as safeguards include:
(i) the establishment of a Supervisory Board;
(ii) the deliberations of the ECB Governing Council on supervisory matters will be strictly
separated from its monetary policy work, including separate agendas and meetings;
(iii) the four representatives of the ECB appointed by the Governing Council in the Supervisory
Board shall not perform duties directly related to the monetary function of the ECB;
(iv) the staff involved in carrying out supervisory tasks will be organisationally separate and
subject to separate reporting lines;
(v) a mediation panel will be established to resolve differences of views expressed by the
competent authorities of participating Member States regarding an objection of the Governing
Council to a draft decision by the Supervisory Board.16
14 See Article 4a of the proposed SSM Regulation, http://register.consilium.europa.eu/pdf/en/12/st17/st17812.en12.pdf.
15 See Article 4a(3) of the proposed SSM Regulation, http://register.consilium.europa.eu/pdf/en/12/st17/st17812.en12.pdf.
16 See Article 18 of the proposed SSM Regulation, http://register.consilium.europa.eu/pdf/en/12/st17/st17812.en12.pdf.
43ECB
Financial integration in Europe
April 2013
I I EUROPEAN INST ITUTIONAL
REFORMWhile the Governing Council will be ultimately responsible for taking decisions, the Supervisory
Board will be fully responsible for the preparation of decisions on supervisory matters. The
Supervisory Board shall prepare draft decisions which will be deemed adopted by the Governing
Council unless it objects within ten working days. In order to support the work of the Supervisory
Board, a steering committee with rotating membership from among the Board’s members and a
secretariat will be established.
Thus, the Supervisory Board will be an essential body in the conduct of supervisory tasks. It will
be composed of a Chair and Vice-Chair elected for non-renewable fi ve-year terms, and include
representatives from the ECB and from national authorities.
The Supervisory Board may also invite representatives of the European Commission as observers.
In addition, the Chair of the European Resolution Authority, once established, shall participate
as observer.17
Decisions of the Supervisory Board shall be taken by simple majority, except in the case of decisions
for the adoption of regulations, which requires a qualifi ed majority, analogous to the voting rules in
the Council of the EU.18
In order to ensure that national supervisors of non-euro area Member States that enter into a
close cooperation with the ECB are placed on an equal footing with euro area Member States, the
SSM Regulation stipulates that they will have full membership of and full voting rights on the
Supervisory Board.19
3.4 ACCOUNTABILITY
High standards of democratic accountability should apply, ensuring that the ECB uses its supervisory
powers in the most effective and proportionate way. With a view to its ESCB tasks, the ECB is
already accountable, and it is logical that when more tasks are conferred, more accountability is
necessary. This higher level of democratic accountability should however not compromise the
ECB’s independence.
To this end, the SSM Regulation specifi es that the ECB will be accountable to the European
Parliament and the Council of Ministers. In addition, the ECB shall submit an annual report to the
European Parliament, the Council, the European Commission and the Eurogroup on the execution of
the tasks conferred upon it by the SSM Regulation. The Chair of the Supervisory Board shall present
this annual report to the European Parliament and the Eurogroup in the presence of representatives
from any participating Member States with which it has established close cooperation. In addition,
the European Parliament may request to hear the Chair of the Supervisory Board. Furthermore, the
national parliaments of the participating Member States may invite the Chair of the Supervisory
Board to exchange views on a particular credit institution in its country. Finally, national parliaments
may also request the ECB to reply to questions related to supervisory matters.
17 See recital 36b and Article 19(6) of the proposed SSM Regulation, http://register.consilium.europa.eu/pdf/en/12/st17/st17812.en12.pdf.
18 See Article 19(2ab) and 19(2b) of the proposed SSM Regulation. In the transition period, according to Article 27(6a) simple majority
voting will be combined with qualifi ed majority voting.
19 See recital 45a and Article 19 of the proposed SSM Regulation, http://register.consilium.europa.eu/pdf/en/12/st17/st17812.en12.pdf.

44ECB
Financial integration in Europe
April 2013
4 THE BENEFITS OF THE SSM
The establishment of the SSM should provide short-term and medium to long-term benefi ts for
fi nancial stability and fi nancial integration.
Focusing on the short-term benefi ts, the most prominent advantage expected from the SSM is the
decoupling of the credit of the sovereign from that of fi nancial institutions. Impartial and centralised
supervision will make it possible for the ESM to directly recapitalise credit institutions, provided
certain conditions are met.20
With respect to the medium to long-term benefi ts, the SSM constitutes a supervisory framework
that with its solid enforcement powers marks a substantial leap forward from supervision conducted
at a national level, with only supervisory coordination mechanisms in place. Furthermore, the SSM
should enhance supervision and support the development and effective application of the single
rulebook and the harmonisation of supervisory procedures and practices, creating a level playing
fi eld. These elements, coupled with the broad coverage of banks and the wider European perspective
through the possible participation of non-euro area Member States, should contribute to restoring
confi dence in the banking environment. The improved confi dence should also be conducive to a
revival of the interbank and credit markets, which combined with the other two elements of the
banking union, should be benefi cial to fostering further fi nancial integration.
Finally, the conferral of macro-prudential tasks to the ECB is an essential element of the new
framework. As there is a reinforcing relationship between fi nancial stability and fi nancial integration,
it is of the essence that the ECB should be able to address these risks in a comprehensive way and in
close collaboration with national authorities.
5 OTHER COMPONENTS TO COMPLETE THE BANKING UNION
Although the SSM constitutes a major step towards a more integrated fi nancial framework, in order
for it to work properly it is essential that a single resolution mechanism is created. In this context, an
agreement by mid-June 2013 on the Bank Recovery and Resolution Directive would be the necessary
next step.21 A common system of deposit protection, built on common EU standards, is needed to
ensure depositor confi dence and thus reduce the probability of a run on a bank that could affect their
liquidity and solvency.22 This element is intended for the longer term. A fi rst step towards achieving
a common system would be the rapid adoption of the revised Deposit Guarantee Scheme Directive.
While the Bank Recovery and Resolution Directive will be an important and necessary step,
it will not be enough on its own. As also recognised in a statement of the European Council
in December 2012, a single resolution mechanism (SRM) is required once bank supervision is
effectively moved to the SSM.23 An SRM with a single resolution authority (SRA) at its centre is
a necessary complement to the SSM, enabling the latter to call for intervention of an EU authority
20 See the conclusions of the European Council of 18/19 October 2012: “The Eurogroup will draw up the exact operational criteria that will guide direct bank recapitalisations by the European Stability Mechanism (ESM), in full respect of the 29 June 2012 euro area Summit statement. It is imperative to break the vicious circle between banks and sovereigns. When an effective single supervisory mechanism is established, involving the ECB, for banks in the euro area the ESM could, following a regular decision, have the possibility to recapitalise banks directly”, available at http://www.consilium.europa.eu/uedocs/cms_data/docs/pressdata/en/ec/133004.pdf.
21 Council conclusions 14 December 2012, http://www.consilium.europa.eu/uedocs/cms_data/docs/pressdata/en/ec/134353.pdf.
22 As an urgent fi rst step, the Deposit Guarantee Scheme Directive should be adopted; see conclusions of the European Council of 13/14
December 2012 on completing EMU, point 8, urging adoption before June 2013.
23 See conclusions of the European Council of 13/14 December 2012 on completing EMU, point 11.
45ECB
Financial integration in Europe
April 2013
I I EUROPEAN INST ITUTIONAL
REFORMspecifi cally entrusted to resolve failing banks in an orderly fashion, so that their problems do not
cascade to other banks, affecting European fi nancial stability. An SRA is essential to achieve an
effective bank resolution regime in the euro area, as it will provide timely and impartial decision-
making focused on the European dimension, and minimise resolution costs with minimum or no
recourse to taxpayers’ money.
Thus the SRA will ensure that failing banks are resolved swiftly, thereby reducing or even
eliminating the pressure to keep the entities artifi cially alive through liquidity assistance. The
SRA would thus constitute a strong counterpart to the SSM: the SSM should provide a timely
and unbiased assessment of the need for resolution, while the SRA should ensure timely and
effi cient resolution once the trigger point is reached. Moreover, the SRA would ensure that losses
and fi nancing needs occurring in resolution are borne, fi rst and foremost, by the shareholders
and creditors of the institution in resolution, and that additional fi nancing needs are covered by
the community of banks under the SRM, contributing to a European resolution fund (ERF). The
contributions to the ERF should consist of ex-ante, risk-based levies on the fi nancial sector, with
the possibility to impose special ex-post contributions. Public backstop arrangements for the ERF
should thus be fi scally neutral over the medium term, given that they will be recouped via ex-post
levies on the fi nancial sector. Conversely, leaving resolution decisions and fi nancing fully in the
hands of national authorities could be vulnerable to possible failure of cooperation among national
authorities, as they may face skewed incentives. A system which combines European supervision
and national resolution is not incentive-compatible, so both supervision and resolution have to be
set at the same level.24
Ahead of assuming the responsibility for the supervision of banks, the ECB in cooperation with
national supervisory authorities will need to carry out a comprehensive assessment of their balance-
sheets. This comprehensive review of banks’ balance sheets is instrumental in identifying potential
legacy problems. It has to be ensured that in the setting-up of a European Resolution Mechanism,
the use of any European funds do not raise issues of moral hazard and/or unjustifi ed mutualisation
of losses stemming from the past.
6 CHALLENGES AHEAD – ESTABLISHING THE SSM
On the basis of the SSM Regulation, the ECB should assume its supervisory tasks 12 months after
the entry into force of the legislation. A main priority for the ECB during 2013 is ensuring the
operationalisation of the SSM, so that it can assume its responsibilities effectively and effi ciently.
In this context, several aspects warrant particular attention.
The preparatory work needed, consists of fact-fi nding with national supervisors on a variety of
issues, including analysing supervisory practices and developing the framework for the data
required for the operation of the SSM. It also consists of planning matters related to support from
existing ECB functions for the operation of the SSM, including the administrative and logistical
infrastructure needed for the establishment of the SSM. In this context, a key aspect upon which the
success of the SSM will hinge is staffi ng requirements. It is therefore essential that the ECB recruits
skilled and knowledgeable staff, including banking supervisors, to complement its current expertise
in this area.
24 Schoenmaker, D. (2012), “Banking union: Where we’re going wrong”, VoxEU.org, October 2012.
46ECB
Financial integration in Europe
April 2013
A major task will be the development of the practical modalities concerning the envisaged
differentiated approach as regards the conduct of supervision. The ECB will have to adopt and
make public the organisational framework for cooperation within the SSM.
Finally, a supervisory framework risk assessment model will need to be developed in order to
ensure that identifi ed risks are assessed in a uniform manner within the SSM.
The SSM is envisaged to become effective 12 months after the entry into force of the proposed
SSM Regulation.
47ECB
Financial integration in Europe
April 2013
CHAPTER I I I
EUROSYSTEM ACTIVITIES FOR FINANCIAL INTEGRATION
The Eurosystem distinguishes between four types of activity through which it contributes to the enhancement of fi nancial integration: (i) advising on the legislative and regulatory framework for the fi nancial system and direct rule-making; (ii) acting as a catalyst for private sector activities by facilitating collective action; (iii) enhancing knowledge, raising awareness and monitoring the state of European fi nancial integration; and (iv) providing central bank services that also foster European fi nancial integration. The following sections provide an overview of the Eurosystem’s contributions in these areas, focusing on the initiatives pursued during 2012.
I THE LEGISLATIVE AND REGULATORY FRAMEWORK FOR THE FINANCIAL SYSTEM
While the Eurosystem considers fi nancial integration to be fi rst and foremost a market-driven
process, the legislative and regulatory framework for the fi nancial system clearly plays an important
facilitating role. A harmonised EU legislative and regulatory framework removes national barriers
to fi nancial integration, supports cross-border access and competition and fosters cross-border
fi nancial transactions.
Against this background and in line with their advisory and regulatory functions,1 the ECB and
the Eurosystem monitor and actively contribute to the development of the EU legislative and
regulatory framework.
More specifi cally, the ECB and the Eurosystem provide input for strategic policy deliberations,
such as on the overall EU fi nancial services policy or on the further development of the EU
framework for fi nancial regulation and supervision. Examples of such input are the publication of
Eurosystem position papers on the websites of the ECB and NCBs and informal discussions with
the regulatory and supervisory committees. Furthermore, the ECB and the Eurosystem provide both
formal opinions and informal input for EU and national legislation in the area of fi nancial services.
The ECB may also contribute to ex post evaluation of regulatory measures.
EU SUPERVISORY AND REGULATORY ARRANGEMENTS
The European Council at the meeting of 28/29 June 2012 agreed on the need to foster economic
integration in Europe, in accordance with the route indicated in the Report “Towards a Genuine
Economic and Monetary Union”, prepared by the President of the European Council, the President
of the European Commission, the Chair of the Eurogroup and the President of the European Central
Bank. The Report sets out four essential building blocks to reinforce Economic and Monetary Union
(EMU) with a view to countering and preventing sovereign debt crises: an integrated fi nancial
framework, an integrated budgetary framework and an integrated economic policy framework
underpinned by strengthened democratic legitimacy and accountability.2 As proposed by the
European Commission in September 2012, the banking union will involve a single supervisory
mechanism (SSM), a single recovery and resolution framework in the euro area and a harmonised
1 According to the Treaty and the Protocol on the Statute of the European System of Central Banks and of the European Central Bank,
the ECB must be consulted, within its fi elds of competence, on any proposed Union act or any draft legislative provision proposed by
national authorities. Such proposed Union acts include implementing and delegated acts adopted by the Commission on the basis of
Articles 290 and 291 of the Treaty, including where they endorse technical standards developed by the European Supervisory Authorities
in accordance with relevant Union legislation. Furthermore, the ECB has the right to issue regulations in certain areas, for example in the
fi eld of payment systems and statistics.
2 See also the European Council press release on the report by the President of the European Council Herman Van Rompuy “Towards a
genuine Economic and Monetary Union”, dated 26 June 2012, available at the Council website at www.consilium.europa.eu.

48ECB
Financial integration in Europe
April 2013
framework for the operation of the deposit protection schemes. As part of the proposed SSM,
supervisory tasks and responsibilities will be assigned to the ECB. The specifi cities of the SSM are
described in more detail in Chapter II.
As regards capital requirements of credit institutions and investment fi rms, the ECB
participates in the Basel Committee on Banking Supervision and is closely following
the work carried out regarding the Basel III framework. The ECB supports the European
Commission’s proposals for a Directive on the access to the activity of credit institutions and the prudential supervision of credit institutions and investment fi rms (the Capital Requirements Directive – CRDIV) and for a Regulation on prudential requirements for credit institutions and investment fi rms (the Capital Requirements Regulation – CRR), transposing the Basel III framework into European law. In its opinion 3
the ECB welcomed the Commission’s approach which establishes a framework of maximum
harmonisation with embedded fl exibility for competent authorities to apply stricter requirements
for macro-prudential reasons.
These developments, contributing to the creation of a single rulebook in the fi nancial sector, will
create a level playing fi eld conducive to mitigation of regulatory arbitrage and increased fi nancial
integration. Such an approach is supportive of an effective performance of supervisory tasks by the
SSM, and was highlighted by the European Council in its conclusions of 18 October 2012.4
As regards crisis management, on 6 June 2012 the European Commission submitted a proposal for
Directive on bank recovery and resolution of credit institutions and investment fi rms (BRRD), setting out a framework with specifi c powers and tools for national resolution authorities. The
proposed directive is aimed at ensuring that banks and investment fi rms across the EU that are failing
or about to fail can be resolved in an orderly way, with a view to avoiding instability in fi nancial
markets and minimising the cost to taxpayers. The proposed framework distinguishes between three
different phases in the management of a bank crisis, each requiring different intervention powers and
tools of intervention: (a) “preparation”, where recovery and resolution plans have to be submitted
and preventative measures may be adopted; (b) “early intervention”, including the adoption of
measures such as the appointment of a special manager; and (c) “resolution”, involving a “toolkit”
of measures, including the sale of a business, the setting up of a bridge institution, asset separation
and bail-in. In all these phases, cooperation among national authorities is strongly supported in
particular as regards cross-border groups, where a prominent role is given to the authority responsible
for the group level resolution. Funding of resolution will occur at the national level, with Member
States being required to put in place national fi nancing arrangements, including the possibility of
cross-border borrowing. In its opinion 5, the ECB welcomed the proposed BRRD, fully supporting
the development of a recovery and resolution framework and the removal of obstacles to effective
crisis management of fi nancial institutions. By harmonising main tools for bank recovery and
resolution, the directive will provide a clear contribution to fi nancial integration. The Directive is
expected to be transposed into national law by 31 December 2014 and national provisions, with the
exception of the bail-in, are envisaged to enter into force on 1 January 2015. National provisions
relating to the bail-in are expected to enter into force by 1 January 2018 at the latest.
3 See ECB Opinion CON/2012/5 of 25 January 2012 on a proposal for a directive on the access to the activity of credit institutions and the
prudential supervision of credit institutions and investment fi rms and a proposal for a Regulation on prudential requirements for credit
institutions and investment fi rms, OJ C 105, 11.4.2012, p. 1.
4 See European Council conclusion of 18 October 2012, available at the Council website.
5 See ECB Opinion CON/2012/99 of 19 November 2012 on a proposal for a directive establishing a framework for recovery and resolution
of credit institutions and investment fi rms OJ C 39, 12.2.2013, p. 1.

49ECB
Financial integration in Europe
April 2013
I I I EUROSYSTEM ACT IV IT IES
FOR F INANCIAL INTEGRATION
EU LEGAL FRAMEWORK FOR RETAIL PAYMENTS
Owing to rather unsatisfactory migration progress towards the Single Euro Payments Area (SEPA), the Eurosystem already drew attention to the need for an end date for migration to SEPA
in its 6th SEPA Progress Report in 2008.
On 31 March 2012, an EU Regulation establishing technical and business requirements for credit
transfers and direct debits in euro (the SEPA migration end-date Regulation) 6 entered into force.
The SEPA migration end-date Regulation lays down rules for the initiation and processing of credit
transfer and direct debit transactions denominated in euro within the European Union. It also defi nes
a clear timeline by when these rules need to be implemented. For the euro area, the fi nal deadline is
1 February 2014. The deadline for euro-denominated payments in non-euro area EU countries will
be 31 October 2016. By these dates, existing national euro credit transfer and direct debit schemes
must be phased out and replaced by the SEPA-compliant alternatives. In its opinion 7, the ECB
welcomed and supported the imposition of end-dates for migration to the SEPA of credit transfers
and direct debits by means of a Union regulation.
In March 2012, the Eurosystem provided a response to the European Commission’s Green Paper
“Towards an integrated European market for card, internet and mobile payments”. This Green Paper
is one of the inputs for the review, planned for 2013, of the Payment Services Directive.8
EU LEGAL FRAMEWORK FOR SECURITIES SERVICES
The current legislative projects in the EU share the objective of developing an appropriate regulatory
framework for clearing and settlement, securities acquisition, holding and disposition, and close-out
netting in order to improve the integration of the EU framework and to foster safety and effi ciency.
On 7 March 2012 the European Commission issued a proposal for a regulation “on improving
securities settlement in the European Union and on central securities depositories (CSDs)”. The
future Central Securities Depository Regulation (CSDR) will establish an EU framework for
authorisation, supervision, cross-border service provision and outsourcing, as well as prudential
and organisational requirements for CSDs. It will have a major impact on the EU legal framework
for fi nancial market infrastructures. The ECB strongly supports the Commission’s proposal to
strengthen the legal framework applicable to CSDs, also in the context of the future TARGET2-
Securities (T2S) environment. In its opinion,9 the ECB recommended an adequate involvement of
the members of the European System of Central Banks (ESCB) in view of their statutory competence
as overseers and central banks of issue. Whilst the proposal recognises the need for cooperation
with the ESCB in the defi nition of regulatory technical standards for CSDs, there should, similarly
and in line with international principles, also be comprehensive cooperation regarding decisions to
grant or withdraw authorisations of CSDs and in the on-going risk assessment of CSDs. In addition,
the regulation should follow the recently issued CPSS-IOSCO principles for fi nancial market
6 See Regulation (EU) No 260/2012 of the European Parliament and of the Council of 14 March 2012 establishing technical and business
requirements for credit transfers and direct debits in euro and amending Regulation (EC) No 924/2009, OJ L 92, 30.03.2012, pp. 22-37.
7 See ECB Opinion CON/2011/32 of 7 April 2011 on a proposal for a Regulation establishing technical requirements for credit transfers
and direct debits in euro, OJ C 155, 25.5.2011, p. 1.
8 See Directive 2007/64/EC of the European Parliament and of the Council of 13 November 2007 on payment services in the internal
market amending Directives 97/7/EC, 2002/65/EC, 2005/60/EC and 2006/48/EC and repealing Directive 97/5/EC, OJ L 319, 5.12.2007,
p. 1-36.
9 See ECB Opinion CON/2012/62 of 1 August 2012 on a proposal for a regulation on improving securities settlement in the European
Union and on central securities depositories, OJ C 310, 13.10.2012, p. 12-31.
50ECB
Financial integration in Europe
April 2013
infrastructures (PFMIs)10 that replace earlier CPSS-IOSCO guidance for securities settlement
systems.11 Close alignment of EU rules with international standards may ensure global consistency
and avoid putting EU CSDs at a competitive disadvantage.
The ECB supports a timely adoption of the CSDR and of the related technical standards before the
go-live of the T2S platform in 2015, as this would facilitate the CSDs’ connection to T2S from a
legal and regulatory perspective and increase legal soundness in cross-border transactions, while
fostering harmonisation and improving the CSDs’ competitive environment. The importance of the
CSDR for a European level playing fi eld as well as for T2S was also recognised by the Council of
the European Union in the conclusions of its 11 May 2012 meeting.
Finally, legislative initiatives in the area of fund management in 2012 included the publication of
regulatory technical standards complementing the Alternative Investment Funds Management Directive (AIFMD) as well as the proposal for a UCITS V Directive reforming the remuneration
rules for UCITS operators and rules concerning UCITS depositaries. In its opinions, 12 the ECB
welcomed in particular the regulation of depositary functions for alternative investment funds and
UCITS while proposing more stringent safeguards in this respect. In another opinion 13 the ECB
also welcomed the initiative for improving the protection of consumer of fi nancial products through
the proposed Regulation on key information documents for fi nancial products.14
EU LEGAL FRAMEWORK FOR OTC DERIVATIVES, CENTRAL COUNTERPARTIES AND TRADE REPOSITORIES
One of the main legislative initiatives in the EU during 2012 concerned the Regulation on OTC derivatives, central counterparties and trade repositories (also referred to as the European Market Infrastructure Regulation EMIR).15 The EMIR, which entered into force in August
2012, introduced for the fi rst time common EU rules for central counterparties (CCPs) and trade
repositories (TRs) and will implement the G20 commitments to mandatory central clearing and
reporting of OTC derivatives. On 26 September 2012, the European Banking Authority (EBA)
published draft regulatory technical standards on capital requirements for CCPs and on 27
September 2012 the European Securities and Markets Authority (ESMA) published the sets of draft
regulatory and implementing technical standards in respect of certain aspects of OTC derivatives
and on requirements for CCPs and TRs. Except for the technical standards for CCP colleges, which
will be adopted at a later stage, all proposed standards were endorsed by the European Commission
on 19 December 2012. Following the subsequent confi rmation of non-objection by the European
Parliament and the Council, the standards were published on 23 February in the Offi cial Journal and
entered into force on 15 March 2013. The ECB considers the adoption of the EMIR and the work
of ESMA and the EBA on the technical standards a major achievement in ensuring the effective
10 See CPSS-IOSCO, “Principles for fi nancial market infrastructures of April 2012, available on the website of the Bank for International
Settlements (BIS) (http://www.bis.org).
11 See CPSS-IOSCO, “Recommendations for securities settlement systems” November 2001, available on the BIS website (http://www.bis.org).
12 See ECB Opinion CON/2012/42 of 24 May 2012 on a draft Commission delegated regulation supplementing Directive 2011/61/EU of
the European Parliament and of the Council with regard to exemptions, general operating conditions, depositaries, leverage, transparency
and supervision, OJ C 47, 19.2.2013, p.1 and ECB Opinion CON/2012/4 of 11 January 2013 on a proposal for a directive of the European
Parliament and of the Council amending Directive 2009/65/EC on the coordination of laws, regulations and administrative provisions
relating to undertakings for collective investment in transferable securities (UCITS) as regards depositary functions, remuneration policies
and sanctions.
13 See ECB Opinion CON/2012/103 of 11 December 2012, on a proposal for a regulation on key information documents for fi nancial
products.
14 See proposal for a regulation of the European Parliament and of the Council on key information documents for investment products, COM
(2012) 350 fi nal.
15 See Regulation (EU) No 648/2012 of the European Parliament and of the Council of 4 July 2012 on OTC derivatives, central counterparties
and trade repositories, OJ L 201, 27.7.2012, p. 1.
51ECB
Financial integration in Europe
April 2013
I I I EUROSYSTEM ACT IV IT IES
FOR F INANCIAL INTEGRATION
implementation of the global commitments for OTC derivatives market reform. The ECB has
directly contributed to the preparation of the standards inter alia by participating in the preparatory
task forces and by issuing a related ECB opinion.16 The ECB welcomes the signifi cant efforts that
have been made to align the requirements for CCPs and TRs with the CPSS-IOSCO PFMIs in order
to ensure consistency and to pre-empt potential regulatory arbitrage. Furthermore, as far as CCPs
are concerned, under the EMIR, the Eurosystem will participate as central bank of issue for the
euro in colleges of authorities for EU CCPs with signifi cant euro-denominated business. The ECB
expects that appropriate cooperative relations between supervisors and central banks will also be
established for TRs and that existing arrangements, such as the cooperative oversight arrangement
for the DTCC Derivatives Repository Limited (DDRL), will be continued once ESMA takes over
supervisory responsibilities.
DEVELOPMENT OF AN INTERNATIONAL REFERENCE DATA UTILITY
A Reference Data Utility, of which the Legal Entity Identifi er (LEI) is the fi rst component, will
contribute to the integration of European fi nancial markets by providing a standardised data
language, which will enable fast and effective exchange, integration, aggregation and analysis of
very large data volumes collected from many sources across the fi nancial system. This will fulfi l
one of the necessary conditions for technically sound, EU-wide implementation of many regulatory
measures and supervisory functions and facilitate higher integration of operational processes and
improvement in operational risk management across the European fi nancial sector and beyond.
Work has now reached a new stage with the endorsement of the Charter of the Regulatory Oversight
Committee (ROC) by the G20 Finance Ministers and Central Bank Governors at their meeting on
4-5 November 2012 in Mexico and the impending creation of the ROC.
Following the mandate received from the G20 Summit of 4 November 2011 in Cannes,
recommendations were developed in an FSB Expert Group and submitted to the G20 Summit on
18-19 June 2012 in Los Cabos, which mandated the FSB to progress towards implementation.
This was done in a 55-strong worldwide FSB LEI Implementation Group (IG) and resulted in the
Charter, among other things. An ECB representative was appointed as one of the three Vice-Chairs
of the IG (one for the Americas, one for Europe, one for Asia). The IG is supported by a 320-strong,
voluntary private sector preparatory group.
The Charter is now open for signing by market authorities worldwide. The fi rst round of signatures,
which closed on 10 January 2013, saw 45 authorities accede to the Charter as members of the
ROC and another 15 as observers, whereby a quorum was reached for establishing the ROC at the
meeting on 24-25 January 2013. The ROC will be the highest authority of the LEI system and will
be established once twelve authorities representing all four of the identifi ed regions and at least two
countries per region have signed. In order to keep the work of the ROC manageable after many
institutions have signed up, it will be equipped with an Executive Committee of 23 members, with
the ECB being proposed as a permanent member for Europe. Five seats will be allocated to each
of the four regions, three seats reserved for global institutions such as the IMF. The EU is in the
Europe Region, which also includes the Commonwealth of Independent States (CIS).
16 See ECB Opinion CON/2012/95 of 27 November 2012 on various draft regulatory and implementing technical standards submitted by
the European Securities and Markets Authority to the Commission to be adopted by means of Commission delegated and implementing
regulations supplementing Regulation (EU) No 648/2012 of the European Parliament and of the Council of 4 July 2012 on OTC
derivatives, central counterparties and trade repositories.

52ECB
Financial integration in Europe
April 2013
The ROC will, as soon as possible, establish the Central Operating Unit (COU), a non-profi t start-
up that will manage the system and its growth to global and universal coverage. That work will
begin by creating a foundation and by appointing a private sector Board of Directors, which will
in turn establish the operations. The COU will contract Local Operating Units (LOUs), public or
private, to run local registration and data validation and maintenance services. In its steady state,
the system will be fi nanced through registration fees and annual maintenance fees levied on the
entities registered.
The COU will also advise legislators and regulators on the design of laws and rules to render the LEI
registration compulsory, and it will sponsor necessary research in its fi eld of activity. The private
sector has constantly advocated legal compulsion to ensure the quality of the LEI coverage and
data, which it needs for improving the effi ciency of its own operations and its risk management.
Meanwhile, the European Parliament’s Committee on Economic and Monetary Affairs expressly
welcomed the LEI in its Report on Shadow Banking (2012/2115(INI)) of 25 October 2012, and
called for its expansion to also cover fi nancial instruments and contracts and calls for common
reporting standards which is in line with the philosophy of the Reference Data Utility as originally
described.17 The LEI system would be well suited for such expansion once its governance and
organisation are suffi ciently stable in its fi rst mission.
2 CATALYST FOR PRIVATE SECTOR ACTIVITIES
While public authorities have the responsibility of providing an adequate framework, conducive
to fi nancial integration, progress in European fi nancial integration ultimately depends on private
sector initiatives making full use of cross-border business opportunities. Competition among
market players is a major driving force in this regard. In addition, progress made in the fi eld of
fi nancial integration also depends on effective collective action, notably where heterogeneous
market practices and standards need to be overcome. However, possible coordination problems
may hamper such cooperative approaches among market participants. In such cases, public sector
support for private sector coordination efforts may help to overcome possible diffi culties.
Given its institutional characteristics, the Eurosystem is particularly well placed to play an active
role as a catalyst for private sector activities in the fi eld of European fi nancial integration. The ECB
is both a public authority with a pan-European remit and, in its capacity as the central bank of the
euro area, an active market participant, with knowledge of and business contacts in the fi nancial
markets. Over the past few years, the ECB has acted as a catalyst in many fi elds.
In 2012 the catalytic activities of the ECB and the Eurosystem focused mainly on the following
initiatives.
17 The European Parliament’s Committee: (i) welcomed the development of a Legal Entity Identifi er (LEI), and believes that, building on
its usefulness. similar common standards should be developed in relation to repo and securities reporting, to cover principal, interest rate,
collateral, haircuts, tenor, counterparties and other aspects which help the formation of aggregates; (ii) underlined that in order to have a
joined-up global approach for regulators to analyse data and for them to be able to share this with one another in order to take action where
necessary to prevent build-up of systemic risk and protect fi nancial stability, it is essential to have common reporting formats based on
open industry standards.

53ECB
Financial integration in Europe
April 2013
I I I EUROSYSTEM ACT IV IT IES
FOR F INANCIAL INTEGRATION
STRUCTURED FINANCE MARKETS
In order to reactivate the structured fi nance markets in Europe, the Eurosystem acted as a catalyst
by supporting market-led initiatives to promote the reactivation of these market segments and
create viable structures that would also attract institutional investors with a medium to long-term
investment horizon. In this respect, and in order to increase transparency in the area of asset-backed
securities (ABSs), the Governing Council of the ECB decided in December 2010 to establish
loan-by-loan information requirements for ABSs in the Eurosystem collateral framework. Since
then, preparatory work has been concluded, and a market-led single loan level data repository, the
European Data warehouse, has been created in order to handle the loan-level data. In November
2012, the Governing Council announced that loan-level data reporting will be mandatory for
residential mortgage-backed securities and for ABSs whose underlying assets include loans to
small and medium-sized enterprises as of 3 January 2013; for commercial mortgage-backed
securities as of 1 March 2013; and for consumer fi nance ABSs, leasing ABSs and auto loan ABSs
of 1 January 2014. Loan-level data are to be provided in accordance with the templates available
on the ECB’s website, at least on a quarterly basis. In addition, the ECB has acted as an observer
and catalyst in two other market-led initiatives in securitisation markets. The fi rst initiative is
aimed at reinforcing ABSs as sustainable investment and funding tools, in particular with a view
to improving market resilience in Europe. It is promoted by the Association for Financial Markets
in Europe (AFME) and the European Financial Services Round Table (EFR). This initiative,
which is called the Prime Collateralised Securities (PCS) initiative, rests on EU-wide standards
for ABSs which relate to quality, transparency, standardisation and simplicity. These standards
are expected to lead to increased liquidity for securities which acquire the PCS label. The work
was fi nalised during 2012 and the fi rst asset was PCS labelled in November 2012.
The second initiative is promoted by the European Covered Bond Council (ECBC). It is aimed at
establishing a “Covered Bond” label, which will be granted to covered bond programmes which
meet specifi c criteria, such as increased transparency, strong safeguards provided by dedicated
national covered bond legislation, the supervision of both the issuing credit institution and the
cover pool, and compliance with the requirements of Article 52(4) of the UCITS Directive. This
initiative was also concluded during 2012, and the fi rst covered bond that complied with the label
was introduced in January 2013. The ECB acts as an observer in advisory groups for the PCS
initiative and for the Covered Bond label, in the same way as it acts as an observer in the STEP
Market Committee.
Standardisation and enhanced transparency, which would in particular ensure access for investors
to comprehensive and standardised information across the European ABS market, are expected to
foster a properly functioning securitisation market. This will in turn contribute to the completeness
of the European fi nancial system and to fostering integration through the improved comparability
of instruments across borders.
RETAIL PAYMENTS INITIATIVES
The Eurosystem, together with the European Commission, continued to monitor and support work
on SEPA, with a view to integrating the market for euro retail payment services, with no distinction
between cross-border and national payments.
54ECB
Financial integration in Europe
April 2013
Special attention has been paid to the migration to the new SEPA instruments. According to the
SEPA indicators, migration to SEPA credit transfers in the euro area reached 34.9% in December
2012, whereas for SEPA direct debits migration amounted to only 1.9% (see Chart 26 in Chapter I).
Legal measures to support migration to the SEPA schemes have been promoted by the Eurosystem
since 2008; the adoption of the SEPA migration end-date Regulation in March 2012 was therefore
highly welcome (see Section 1).
Beyond credit transfers and direct debits, further work is clearly needed for a SEPA for cards.
In 2012 the Eurosystem began analysing the merits of a SEPA Cards Processing Framework which
would connect card processors to more effi ciently process card transactions across borders.
In this context, the Eurosystem is adapting the payments statistics to the new environment
created by SEPA. With a view to minimising the reporting burden while showing the relevant
new developments in the SEPA context, a ‘merits and costs procedure’ has been run that will
eventually allow adopting an ECB regulation supporting the collection of harmonised data from
2014 onwards.
In July 2012 the Eurosystem organised a third meeting of the Forum on the SEPA Certifi cation
Framework. The Eurosystem expressed its support for continued joint efforts of card schemes,
certifi cation authorities, evaluation laboratories, terminal manufacturers and the banking
industry to develop a thorough methodology for the security evaluation and certifi cation of new
payment terminals, which would establish a single type-approval process for terminals, allowing
deployment within the EU based on a single evaluation and certifi cation. These and other elements
of information security and fraud prevention in retail payments remain at the constant focus of
attention for the Eurosystem.
The European forum on the security of retail payments (SecuRe Pay), a voluntary cooperation
between relevant authorities within the EEA dealing with the issue of security in retail payments,
addresses areas where major weaknesses and vulnerabilities are detected and, where necessary,
makes recommendations. In 2012 the focus of the forum was on the security of internet payments.
After a public consultation fi nal recommendations were published in January 2013. The forum also
analysed the risks of account information and payment initiation services, in which internet-enabled
payment accounts are accessed by a third party. A public consultation on draft recommendations
in this area was launched in January 2013. Finally, it also started work on the security of mobile
payments (m-payments).
The full migration to the SEPA credit transfer and direct debit schemes and the realisation of an
integrated and competitive cards market based on common business practices, technical standards
and security requirements form the foundation for innovative payment services offered on a pan-
European scale. However, in the fi eld of internet payments the rollout and usage of this innovative
way of making payments has not kept pace with the rapid development of e-commerce.
In the context of innovation, smaller pilots for m-payments have been organised in several
European countries, sometimes followed by actual deployments. The Eurosystem is concerned
that too little attention is being paid to technical standardisation and business interoperability,
which are key factors of success, thus possibly recreating for m-payments technical, legal and
market barriers similar to the ones which SEPA has been trying to solve with regard to cross-
border retail payments.
55ECB
Financial integration in Europe
April 2013
I I I EUROSYSTEM ACT IV IT IES
FOR F INANCIAL INTEGRATION
At the global level the ECB contributed to work of the Committee on Payment and Settlement
Systems (CPSS) in drawing up a report on “Innovations in retail payments”, published in
May 2012.
In 2012, the SEPA Council 18 held in-depth discussions regarding the review of SEPA governance,
i.e. the way in which the SEPA project is being managed. At the core of these discussions is the
future role of the SEPA Council itself in shaping the future of retail payment services in euro.
Moreover, it discussed several issues related to SEPA migration and the end-date regulation, SEPA
for cards, and innovation. Regarding the latter, in view of the limited progress achieved by the
market so far, it identifi ed key challenges to be examined in order to ensure the provision of EU-
wide e-payment services for e-commerce.
Moreover, in September 2012, the ECB published its study into the social and private costs of
making retail payments, which was conducted in cooperation with 13 NCBs and involved, inter
alia, a survey conducted at national level.19 These costs amount to almost 1% of the GDP of the
13 countries concerned. If extrapolated to cover all 27 EU countries, the costs would be around
€130 billion. The results underline how much retail payment services matter for European society
and for the economy as a whole and provides insights into how overall cost effi ciency in retail
payments could be further improved.
INTEGRATION OF SECURITIES INFRASTRUCTURES
Although the European post-trading market infrastructure for securities transactions is evolving, it is
still fragmented and has not yet reached a level of effi ciency, integration and soundness compatible
with the requirements of the Single Market and the single currency.
The Eurosystem therefore has a strong interest in fostering further integration in this area. The
Eurosystem’s most fundamental contribution to the integration of securities infrastructures is
through the building of T2S, a single platform for securities settlement in Europe. T2S will make
fi nancial markets safer and more effi cient, and it will increase transparency in the post-trade
environment. More details on how the services offered by T2S will foster fi nancial integration in
Europe are provided in Section 4.
T2S also acts as a catalyst for further harmonisation of rules and market practices followed by EU
securities infrastructures, where there are a number of signifi cant barriers to cross-border integration
of securities infrastructures, as identifi ed in the Giovannini Report (2003).20
The launch of T2S in 2015 will be the key catalyst for the private sector’s adaptation to a new post-
trade framework in the EU. The progress in this adaptation is refl ected in a number of developments
which are either triggered or fostered by the mere introduction of T2S: among others, the adoption
of ISO 20022 settlement instruction messages, the introduction of night time securities settlement
in central bank money, the progress achieved in establishing and monitoring market standards for
18 The SEPA Council is a stakeholders’ forum, co-chaired by the ECB and the European Commission, which aims to promote an integrated
euro retail payments market by ensuring the proper involvement of all parties and by fostering consensus on the next steps towards the
realisation of SEPA. The payments industry, public administrations and end-users (such as consumers and corporate entities, like small
and medium-sized enterprises and retailers) are represented. Four Eurosystem national central banks also participate on a rotating basis.
19 For more details, see Schmiedel, H., Kostova, G. and Ruttenberg, W., “The social and private costs of retail payment instruments: a
European perspective”, Occasional Paper Series, No 137, ECB, September 2012.
20 See Giovannini Group, “Second Report on EU Clearing and Settlement Arrangements”, April 2003, available on the European
Commission website (http://ec.europa.eu).

56ECB
Financial integration in Europe
April 2013
managing corporate actions, the harmonisation of settlement fi nality rules (beyond the Settlement
Finality Directive’s generic provisions), the improvement of market access to securities settlement
(provision of omnibus accounts by issuer CSDs) and the harmonisation of securities static data
(i.e. face amount for debt instruments and units for equities).
In addition, the prospect of connected EU securities infrastructures via T2S has prompted market
participants to further work on infl uencing the regulatory initiatives which support fi nancial
integration. A typical example is the work on the harmonisation of settlement cycles (i.e. the T+2
initiative) and the introduction of a settlement discipline regime in the EU. These private sector
initiatives will be taken over by the CSD regulation and the ESMA technical standards.
Finally, the new joint (private and public sector) initiative on post-trade harmonisation, the
European Post Trade Group (EPTG) is based on the current EU regulation on securities market
infrastructures and the introduction of T2S in 2015. The T2S Team at the ECB is participating
in the secretariat of the new group, which is a successor to the European Commission’s Clearing
and Settlement Advisory and Monitoring Expert Group (CESAME) and Expert Group on Market
Infrastructures (EGMI). The EPTG is focusing its attention on post-trade harmonisation items
which are currently not covered by public authority initiatives (T2S, the Contact Group on Euro
Securities Infrastructures (COGESI) and the CSDR). These items include, among others, the work
on cross-border shareholder transparency and pre-settlement procedures (e.g. trade confi rmation,
allocation and time of matching).
3 KNOWLEDGE OF THE STATE OF FINANCIAL INTEGRATION
The ECB is in a unique position to provide in-depth economic analysis and comprehensive statistics
regarding the state of fi nancial integration in the euro area and its development. Furthermore,
the ECB is able to sponsor coordinated analytical research – together with other members of the
Eurosystem and academics – and can make use of its experience and knowledge as an active market
participant. Enhancing knowledge and raising awareness regarding the need for European fi nancial
integration, and measuring the progress achieved in this regard, therefore form a major part of the
ECB’s contribution to fostering fi nancial integration.
During 2012 the activities of the Eurosystem with respect to enhancing knowledge, raising
awareness and monitoring the state of fi nancial integration were mainly focused on the
following initiatives.
INDICATORS OF FINANCIAL INTEGRATION IN THE EURO AREA
Quantitative measures of fi nancial integration provide essential tools for monitoring the status of
fi nancial integration in Europe and the progress achieved. Since September 2005, the ECB has
published statistical indicators of integration in the euro area fi nancial markets.21 These price and
quantity-based indicators cover the money market, the government and corporate bond markets, the
equity market and the banking sector. Indicators on market infrastructures have been allocated to the
main fi nancial markets that they serve. The report also presents indicators of fi nancial development.
In fact, while fi nancial integration is an important factor in increasing the effi ciency of a fi nancial
system, the latter also depends on each fi nancial system’s own degree of development.
21 See Chapter I, and see the ECB reports entitled “Indicators of fi nancial integration in the euro area”, September 2005 and September 2006,
available on the ECB’s website.
57ECB
Financial integration in Europe
April 2013
I I I EUROSYSTEM ACT IV IT IES
FOR F INANCIAL INTEGRATION
Since the publication of the 2012 issue of the report, a thorough review of the set of indicators has
been carried out. The aim of the review was two-fold.
First, the review of the relevant recent research on fi nancial integration gave guidance on whether
the indicators used in the report still accurately refl ected the market situation and whether new
indicators should have been developed and added. As a result, some of the existing indicators were
removed from the report, while new ones were inserted. The review also encompassed a clearer
separation of indicators showing market developments and market integration.
The second aim of the review was to make the indicators more granular, by further breaking down
the information through country groupings. Many indicators are now presented for all the euro
area countries together and then split between countries with the highest and with the lowest and
intermediate rates of long-term sovereign interest rates for bonds with a remaining maturity of
approximately ten years.
The indicators are updated and published semi-annually on the ECB’s website. The last update was
carried out in November 2012 and the next one will take place in May 2013.
ECB AND EUROPEAN COMMISSION JOINT CONFERENCE ON FINANCIAL INTEGRATION AND STABILITY
Under the heading “Financial integration and stability: towards a more resilient single EU fi nancial
market”, the ECB organised a joint high-level conference with the European Commission on
fi nancial integration and stability with the participation of the President and Vice-President of
the ECB and other top-level fi nancial market participants, policy-makers and academics on
26 April 2012. In addition to discussing the implications of the fi nancial crisis for the integration
and stability of European and international fi nancial markets, the ECB presented its 2012 report on
Financial Integration in Europe and the Commission presented its European Financial Stability and
Integration Report 2011.
This conference was the third conference held jointly by the ECB and the European Commission
on fi nancial integration and fi nancial stability issues. The conference is an annual event, with the
venue alternating between the ECB and the European Commission. The fourth conference will take
place on 25 April 2013 at the premises of the European Commission in Brussels.
PROVISION OF FINANCIAL MARKETS STATISTICS
Increasing transparency fosters integration, as it facilitates the comparison of products across the
economic area. Since July 2007 the ECB publishes nominal yield curves of AAA-rated euro-
denominated euro area central government bonds with a residual maturity from three months to
30 years. The ECB publishes zero-coupon (spot, forward and par) yield curves for the euro area.
Data based on the same sources and methodology used for the daily estimations stretch back to
6 September 2004.22 In addition, the ECB releases daily yield curves covering all euro area central
government bonds and publishes the spreads between both curves.
From an ECB monetary policy perspective, the main benefi t of the euro area yield curve is that it
provides a proper empirical representation of the term structure of euro area interest rates, which
can be interpreted in terms of market expectations of monetary policy, economic activity and
22 The yield curves and a description of the methodology used to estimate them can be found on the ECB’s website.
58ECB
Financial integration in Europe
April 2013
infl ation. Publishing a consistent and comparable set of yield curves based on euro-denominated
central government bonds also provides reference information for the wider public and fi nancial
market participants, who previously had to rely on references to bonds of individual issuers.
Since the introduction of the euro, and in particular due to the recent turmoil in fi nancial markets,
the demand both from the public and from institutions for timely and accurate statistical data
on euro money market activity has increased. To this end, since the year 2000 the ECB has
conducted an annual survey of euro money market activities during the second quarter of each year.
For the 2012 survey, 172 banks in the EU and in Switzerland participated on a voluntary basis.
The data include average daily turnover for a variety of market segments (the unsecured market,
repo market, derivatives market and short-term securities market) and their respective maturity
ranges (from overnight to more than ten years). The data are released to the general public as the
“Euro Money Market Survey”. In addition, for each even-numbered year the “Euro Money Market
Study” presents an in-depth analysis of money market activity.23
The ECB has the responsibility for the provision of statistics on the Short Term European Paper
(STEP) market. Apart from daily yields and spreads on new issues, the ECB statistics include
daily data on aggregated outstanding amounts and new issues broken down by sector, maturity,
rating and currency. Outstanding amounts and currency breakdowns are also shown at the level of
each individual issuance programme. This set of statistics enlarges information that helps backing
investors’ decisions. For instance, it allows investors to assess their concentration risk, measuring
their exposure to a specifi c programme as a share of the programme’s overall size.
STATISTICS ON INSTITUTIONAL INVESTORS
In 2012 the ECB, together with the NCBs of the euro area and of most non-euro area Member
States continued the production of an enhanced set of statistics on MFIs concerning balance sheet
items and interest rate statistics as well as statistics on MFI securitisation and the balance sheets of
fi nancial vehicle corporations engaged in securitisation transactions.24 Moreover, the ECB continued
to publish harmonised statistics on assets and liabilities of investment funds. These consist of two
separate datasets, one covering investment funds as part of the “other fi nancial intermediaries”
sector, and the other covering money market funds (MMFs) as part of the MFI sector.25 Since
1 February 2012, the statistical defi nition of MMFs, used in data collection for monetary statistics,
has been aligned with the supervisory defi nition as adopted by the Committee of European Securities
Regulators (the predecessor to ESMA). The motivation behind the adoption and implementation of
an EU-wide defi nition was the desire to protect investors by setting out clear-cut quantitative and
qualitative criteria to be applied to any fund marketing itself as a MMF.26
In addition to this, the ECB also regularly publishes euro area balance sheet statistics for credit
institutions (which together with MMFs constitute almost the whole of the MFI sector excluding
the Eurosystem).
23 The Euro Money Market Study and the Euro Money Market Survey are available on the ECB’s website. Statistical data can be retrieved
from the Statistical Data Warehouse pages on the ECB’s website.
24 Financial vehicle corporations are securitisation vehicles as defi ned in Regulation (EC) No 24/2009 of the European Central Bank of
19 December 2008 concerning statistics on the assets and liabilities of fi nancial vehicle corporations engaged in securitisation transactions
(ECB/2008/30).
25 Collected under Regulation (EC) No 958/3007 of the European Central Bank concerning statistics on the assets and liabilities of investment
funds (ECB/2007/8).
26 Such criteria are aimed at restricting the various types of risk associated with MMFs, i.e. interest rate, liquidity, credit and credit spread
risks.

59ECB
Financial integration in Europe
April 2013
I I I EUROSYSTEM ACT IV IT IES
FOR F INANCIAL INTEGRATION
The analysis of bank lending channel and monetary policy transmission mechanism is a basic
requirement for ECB policy making. As the fi nancial crisis led to an increasing use of country-
specifi c bank lending rates in the regular assessment of euro area economic conditions some
discrepancies in the rates used have been challenging the accurate assessment of cost of lending
developments across the euro area. For forecasting and monitoring purposes, the ECB is developing
a set of standardised indicators to monitor the interest rates charged on loans to non-fi nancial
corporations and households focusing on four composite lending rates, namely short-term and
long-term lending rates to non-fi nancial corporations and to households for house purchase.
Furthermore, in 2012 the ECB continued the regular publication of quarterly statistics for insurance
corporations and pension funds (ICPFs) in the euro area under a ‘short-term’ approach. The statistics,
derived mainly from supervisory sources, contain information on assets and liabilities of ICPFs
resident in the euro area, and, for the main aggregates, are also available separately for insurance
corporations and for pension funds. In parallel to this, in 2012 the ECB started a “merits and costs
procedure” aimed at a “steady-state” approach to harmonised statistics on the insurance sector.
For this purpose, the ECB is cooperating closely with the European Insurance and Occupational
Pensions Authority (EIOPA) on the integration of statistical and new Solvency II supervisory
reporting requirements. Despite some delay in the adoption of the Omnibus II Directive for the
implementation of Solvency II, including the related quantitative reporting templates, cooperation is
continued towards a “phasing-in” approach. Subject to a positive outcome, the ECB intends to launch
a regulation for statistical requirements on insurance undertakings using, to the extent possible,
supervisory data sources as a way to minimise the reporting burden on insurance undertakings.
The regular production of these statistics contribute to a better, more harmonised measurement
of activity in the fi nancial sector as a whole, including that of non-bank fi nancial corporations
across the euro area countries, as well as in some other EU Member States. This ensures greater
transparency and comparability in the assessment of developments in this sector and each
sub-sector.
Work is now on-going to develop a security-by-security dataset on securities holdings of euro
area/EU investors which will represent a further important improvement in data availability as
from 2014.
In response to important gaps in statistics on credit risk transfer (CRT) instruments revealed by
the current fi nancial crisis, an important initiative is being taken to develop harmonised statistics
on securities holdings and improvements have also been made to statistics on credit derivatives
(principally CDSs), the latter compiled by the Bank for International Settlements (BIS), including
the granularity of counterparty breakdowns by sector and region. The credit derivative statistics are
based on the work of a Committee on the Global Financial System (CGFS)/BIS Working Group in
which the ECB participated.27
4 CENTRAL BANK SERVICES THAT FOSTER INTEGRATION
Financial market integration needs to be complemented and supported by the integration of the
underlying market infrastructures. The provision of central bank services is another way in which
the Eurosystem seeks to promote fi nancial integration in this area. Although the main purpose of
27 See “Credit risk transfer statistics”, CGFS Papers, No 35, CGFS, September 2009.

60ECB
Financial integration in Europe
April 2013
such services is the pursuit of the Eurosystem’s basic central banking tasks, the Eurosystem pays
close attention to ensuring that such services, where possible, are specifi ed in such a way that they
are also conducive to supporting the fi nancial integration process.
During 2012 the ECB and the Eurosystem focused their activities in the area of central bank services
on the following initiatives.
TARGET2
TARGET2 plays an important role in the integration of euro large-value payments, including money
market operations. TARGET2 is based on a single technical platform, also referred to as the single
shared platform (SSP). The SSP is used for the processing of euro payments and the management
of accounts opened for fi nancial institutions with their central banks. The SSP also supports other
systems operating in euro (i.e. ancillary systems), settling the cash positions of their participants in
central bank money. With TARGET2 the entire European user community benefi ts from the same
comprehensive, advanced real-time gross settlement services. TARGET2 offers broad access to
credit institutions and ancillary systems. At present, 24 central banks of the EU and their respective
national user communities use the single shared platform of TARGET2: the 17 euro area NCBs,
the ECB, and 6 NCBs from non-euro area EU Member States.
With the creation of TARGET2 the Eurosystem made a crucial contribution to European fi nancial
integration. Being the fi rst market infrastructure completely integrated and harmonised at the
European level, TARGET2 has eliminated the fragmented situation that previously existed in the
management of central bank liquidity and the real-time settlement of euro payments. The move
to a single platform represented a signifi cant step towards a more effi cient, competitive, safe and
fully integrated European payments landscape, offering all market participants equal conditions and
services regardless of their location. The harmonised service level of TARGET2, offered with a
single price structure, ensures a level playing -fi eld for all participants across Europe.
TARGET2 also provides a harmonised set of cash settlement services in central bank money for
all kinds of ancillary systems, such as retail payment systems, money market systems, clearing
houses and securities settlement systems. In 2012, 82 ancillary systems were settling their
balances in TARGET2. The main advantage for ancillary systems is that they are able to settle
their cash positions in TARGET2 via a standardised technical interface and standardised settlement
procedures, thus allowing a substantial harmonisation of business practices.
The TARGET2 system functioned smoothly in 2012. The system’s market share remained stable,
with 92% of the total value and 58% of the total number of euro denominated large-value payments
being executed via TARGET2. The average number of payments processed by the system each
day in 2012 was 354,185, while the average daily value was €2,477 billion. These fi gures position
TARGET2 as one of the most important systems for large-value and time-critical payments
in the world, alongside Fedwire in the United States and Continuous Linked Settlement (CLS),
the international system for settling foreign exchange transactions. In 2012 the overall level of
TARGET2 availability reached 100%.
Observations made with regard to the use of the harmonised and advanced TARGET2 services
(payment prioritisation, liquidity reservation, sender limits, liquidity pooling, etc.) confi rm that they
are actively used by a wide range of participants and that they contribute to the smoother settlement
of transactions. TARGET2 and its new features have both enabled and driven organisational changes
61ECB
Financial integration in Europe
April 2013
I I I EUROSYSTEM ACT IV IT IES
FOR F INANCIAL INTEGRATION
in credit institutions that operate in several European countries, by allowing them to rationalise their
back offi ce functions and consolidate their euro liquidity management.
In October 2012 the Eurosystem adopted its revised strategy for ISO 20022 in TARGET2, aimed at
migrating to the new international standard in November 2017. Compliance with the new messaging
standard will further foster fi nancial integration, improving interoperability with other market
infrastructures using ISO 20022, such as T2S. Further information on the ISO 20022 strategy for
TARGET2 can be found on the TARGET2 website.28
TARGET2-SECURITIES (T2S)
T2S is a major infrastructure project of the Eurosystem which aims to overcome the current
fragmentation in the securities settlement layer of the European post-trading landscape.
It will provide the technical infrastructure necessary for market participants to operate across
borders as effi ciently and safely as they do domestically, thus opening up the securities market for
competition at the European level. The important contribution of T2S to the establishment of a single
market for securities services was also highlighted by the European Council in the conclusions of
its meeting on 11 May 2012.
The deep fragmentation of the market infrastructure today, coupled with the existence of procedures
that have not yet been harmonised across national settlement systems, results in high costs and
ineffi ciencies. This is particularly evident in cross-border securities transactions, and ultimately
creates a considerable competitive disadvantage for European capital markets.
The T2S platform will help solve this problem by offering harmonised and commoditised delivery-
versus-payment (DvP) settlement in central bank money, both in euro and in any other participating
currency (by agreement with the respective NCBs), at the same price for all participating CSDs.
In mid-2012, 22 European CSDs committed themselves to T2S, including almost all euro area CSDs
and fi ve CSDs from outside the euro area. In addition, in June 2012 Danmarks Nationalbank entered
into a contractual agreement with the Eurosystem to make the Danish krone available in T2S as of
2018. The high level of CSD participation in T2S, including nearly 100% of the securities volumes
currently settled in the euro area, will lead to signifi cant economies of scale and lower settlement
costs and will ensure a wide reach for the T2S harmonisation achievements. These benefi ts could
further increase in the future, as T2S remains open to any other European markets and currencies
that may decide to join at a later stage.
The project is currently in the development phase, and the platform is due to go live in June 2015.
For more details on the project’s progress, please refer to the ECB’s latest Annual Report or visit
the T2S website.29
The T2S project is designed to make cross-border settlement as effi cient and safe as domestic
settlement. From the beginning, the Eurosystem has aimed to avoid the cementation of national
specifi cities into the system’s operational blueprint, in line with the market’s request to keep T2S
“lean”, i.e. limited to pure settlement and neutral vis-à-vis participating markets and infrastructures.
No specifi c functionalities have been developed in T2S to support national specifi cities. Instead,
28 See the TARGET2 website (http://www.target2.eu).
29 See the T2S website (http://www.T2S.eu).
62ECB
Financial integration in Europe
April 2013
processes have been identifi ed that allow markets to continue to support their different needs using
a basic T2S functionality. Participation in T2S will increase the incentives to remove specifi cities
and reach wider harmonisation in order to be more competitive in the European arena.
At present there are still signifi cant differences between settlement practices in the various markets
that will connect to T2S. Without a high degree of harmonisation of procedures and market
practices, market participants, issuers and investors would not be able to reap the full benefi ts of a
single EU settlement engine. They would instead be forced to resort to costly manual procedures
and/or use local intermediaries in a particular market to carry out certain tasks connected to cross-
border fi nancial transactions. This implies costs, risks and fragmentation.
The Eurosystem is assisting CSDs and markets in their adaptation to T2S, encouraging the reshaping
of current infrastructure in order to make full use of T2S’s potential in terms of integration and
harmonisation of securities settlement in Europe.
Designing a common settlement service is in itself a driver of harmonisation. The implementation
of T2S will establish, for instance, the use of a single system with the same operating hours and
deadlines, and the use of standardised communication standards (ISO 20022 messages). In addition,
T2S, in cooperation with fi nancial market participants, facilitates further harmonisation of market
practices at the European level. The T2S Advisory Group, a senior member’s forum which provides
advice to the Eurosystem on T2S-related issues, decided in 2011 to further strengthen its catalyst
role in this area, and therefore set up the Harmonisation Steering Group. The Group is composed of
senior level representatives from the industry and the public sector and is mandated to support the
T2S Advisory Group in formulating and monitoring the T2S harmonisation agenda. The Group has
defi ned a set of top priorities and functional targets for harmonisation activities and indicated the
specifi c actors who are responsible for the defi nition, monitoring and implementation of standards
in each activity. The objective is to deliver concrete results before the launch of T2S in 2015.
The priority issues currently being monitored and managed by the Harmonisation Steering Group
include, among others, the establishment of the T2S ISO messages and matching fi elds, the
harmonised rules for settlement fi nality in T2S, the implementation of the T2S corporate actions
standards on pending instructions, establishing the possibility for foreign intermediaries to hold
securities in omnibus accounts as well as agreeing on technical procedures for smooth cross-CSD
settlement in T2S.
The T2S Advisory Group constantly monitors developments relating to all the priority issues
identifi ed by the Harmonisation Steering Group, i.e. the issues where it is deemed of critical
importance that they be resolved prior to the launch of T2S. To this end, harmonisation progress
reports are regularly produced, providing a detailed analysis of the status of each harmonisation
activity and the compliance status of each T2S market. The T2S Advisory Group published its
second progress report on harmonisation in January 2012.30 The third progress report, the results
of which are shared with the T2S Board and the Governing Council of the ECB, was published
in March 2013 and presented, among other things, during a joint ECB-European Commission
conference held in Frankfurt on 19 March 2013, entitled “Post-trade harmonisation and fi nancial
integration in Europe”.
30 See “T2S Harmonisation – Second Progress Report”, January 2012, available on the ECB’s website.
63ECB
Financial integration in Europe
April 2013
I I I EUROSYSTEM ACT IV IT IES
FOR F INANCIAL INTEGRATION
Furthermore, in 2012 intensive work was conducted by a special T2S Advisory Group task
force established in 2011 to develop commonly agreed solutions for adaptation to cross-CSD
settlement in T2S, with the aim of increasing the effi ciency of cross-CSD settlement for CSDs and
their participants on a non-discriminatory basis. The task force, comprising experts from CSDs,
banks and central banks, focused in particular on cross-border issues relating to registration of
securities, tax procedures, CSD ancillary services, and other legal and regulatory barriers to smooth
cross-CSD settlement. The task force drew up proposals for T2S best practices based on the existing
standardised T2S functionality.
EUROSYSTEM COLLATERAL MANAGEMENT
Since its implementation in 1999, the correspondent central banking model (CCBM) has fostered
fi nancial market integration by enabling all euro area counterparties to use a common set of eligible
marketable assets as collateral in Eurosystem credit operations, regardless of the country in which
the security was issued. In line with the introduction of non-marketable assets in the common set of
eligible assets in 2007, specifi c procedures for the cross-border use of such assets under the CCBM
were developed.
The CCBM is the main channel for the cross-border use of collateral in Eurosystem credit operations.
At the end of 2012 it accounted for 55.0% of the collateral used cross-border and 12.5% of the
total collateral provided to the Eurosystem. This model was initially set up as an interim solution
and market participants have called for some improvements. A project aimed at consolidating
the existing technical infrastructure into one single platform handling domestic and cross-border
marketable and non-marketable assets (CCBM2), was discontinued by the Governing Council in
June 2012 owing to challenges in the area of harmonisation.31
The Eurosystem will however implement the previously announced enhancements to existing
Eurosystem collateral management services, namely the removal of the requirement to repatriate
(marketable) assets from investor CSDs to issuer CSDs before mobilisation as collateral through
the CCBM and support the cross-border usage of tri-party collateral management services which
are currently only available domestically in some markets. These enhancements to the CCBM are
planned to be implemented in 2014.
31 See the press release of 15 June 2012 on Eurosystem collateral management services and systems, available on the ECB’s website.
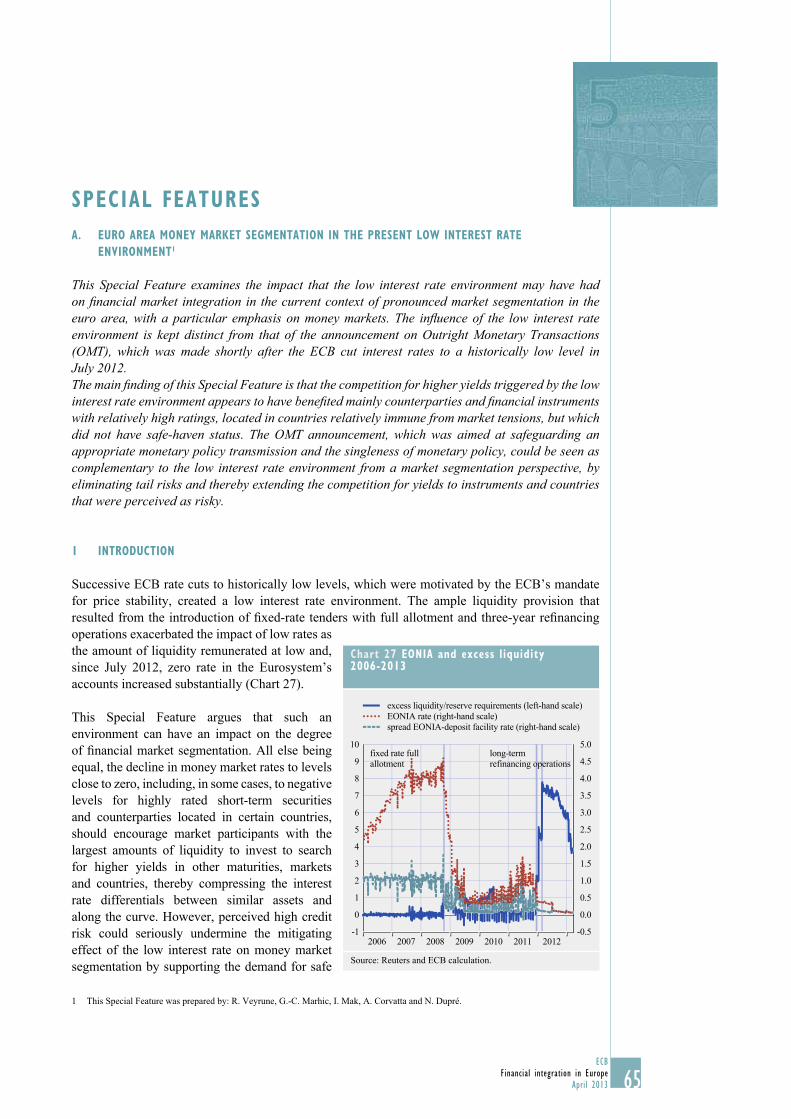
65ECB
Financial integration in Europe
April 2013
SPECIAL FEATURES
A. EURO AREA MONEY MARKET SEGMENTATION IN THE PRESENT LOW INTEREST RATE
ENVIRONMENT1
This Special Feature examines the impact that the low interest rate environment may have had on fi nancial market integration in the current context of pronounced market segmentation in the euro area, with a particular emphasis on money markets. The infl uence of the low interest rate environment is kept distinct from that of the announcement on Outright Monetary Transactions (OMT), which was made shortly after the ECB cut interest rates to a historically low level in July 2012. The main fi nding of this Special Feature is that the competition for higher yields triggered by the low interest rate environment appears to have benefi ted mainly counterparties and fi nancial instruments with relatively high ratings, located in countries relatively immune from market tensions, but which did not have safe-haven status. The OMT announcement, which was aimed at safeguarding an appropriate monetary policy transmission and the singleness of monetary policy, could be seen as complementary to the low interest rate environment from a market segmentation perspective, by eliminating tail risks and thereby extending the competition for yields to instruments and countries that were perceived as risky.
1 INTRODUCTION
Successive ECB rate cuts to historically low levels, which were motivated by the ECB’s mandate
for price stability, created a low interest rate environment. The ample liquidity provision that
resulted from the introduction of fi xed-rate tenders with full allotment and three-year refi nancing
operations exacerbated the impact of low rates as
the amount of liquidity remunerated at low and,
since July 2012, zero rate in the Eurosystem’s
accounts increased substantially (Chart 27).
This Special Feature argues that such an
environment can have an impact on the degree
of fi nancial market segmentation. All else being
equal, the decline in money market rates to levels
close to zero, including, in some cases, to negative
levels for highly rated short-term securities
and counterparties located in certain countries,
should encourage market participants with the
largest amounts of liquidity to invest to search
for higher yields in other maturities, markets
and countries, thereby compressing the interest
rate differentials between similar assets and
along the curve. However, perceived high credit
risk could seriously undermine the mitigating
effect of the low interest rate on money market
segmentation by supporting the demand for safe
1 This Special Feature was prepared by: R. Veyrune, G.-C. Marhic, I. Mak, A. Corvatta and N. Dupré.
Chart 27 EONIA and excess liquidity 2006-2013
-0.5
0.0
0.5
1.0
1.5
2.0
2.5
3.0
3.5
4.0
4.5
5.0
-1
0
1
2
3
4
5
6
7
8
9
10
excess liquidity/reserve requirements (left-hand scale)
EONIA rate (right-hand scale)
spread EONIA-deposit facility rate (right-hand scale)
fixed rate full
allotment
long-term
refinancing operations
2006 2007 2008 2009 2010 2011 2012
Source: Reuters and ECB calculation.

66ECB
Financial integration in Europe
April 2013
haven. Therefore, the impact of the OMT announcement on the perceived credit risk would have to
be considered as a factor enhancing the effects expected from the low interest rate environment.
This Special Feature focuses mainly on market segmentation before and after the July 2012 ECB
rate cut and the possible implications for fi nancial integration.2 One indicator commonly used to
assess the degree of market integration is the convergence/divergence in prices of different money
market products (Treasury bills and short-term securities, unsecured, and secured short-term
lending) across countries. However, changes in the degree of price convergence/divergence may
not be a refl ection of changes in the degree of fi nancial integration if there are also corresponding
changes in relevant characteristics of economic agents, such as their credit worthiness, or if the
fi nancial instruments are not perfectly identical. Hence, price convergence/divergence could
be indicating changes in market segmentation3 while not refl ecting correctly market integration.
Therefore, the spread analysis was complemented by an analysis of price correlations carried out
in a principal component analysis framework. The latter would analyse price covariance across
euro area members and determine how prices responded to factors that are common to euro area
members, such as changes in market sentiment. It has the advantage of providing a better grasp of
phenomena such as safe haven fl ows4 or market conditions convergence (prices moving together
across countries), which provide relevant information regarding fi nancial integration. The latest
ECB rate cut in July 2012 is taken as the main benchmark to observe changes in market behaviour,
as money market rates approached zero following the cut in the ECB deposit rate to zero. The OMT
offi cial announcement in September 2012 and the three-year long-term refi nancing operations in
December 2011 and March 2012 will also be considered.
This Special Feature focuses on six euro area countries, namely Belgium, France, Germany, Italy,
the Netherlands and Spain. These countries refl ect different experiences through the crisis and have
easily available high-frequency data on different money market products that facilitate in-depth
analysis. Germany and the Netherlands have constantly been regarded as safe haven by fi nancial
markets, and hence have benefi ted from capital infl ows, with yields declining in some cases even
into negative territory. Italy and Spain, on the other hand, encountered large increases in yields
across various instruments during the euro area sovereign debt crisis. Belgium and France are
in-between cases that experienced some weakening of their safe haven statute at times during the
crisis. Programme countries5 are not included in the analysis because they lost market access during
most of the period under review, especially before the announcement on OMTs, and therefore lack
high frequency data.
This Special Feature is organised as follows: Section 2 provides some background on recent money
market developments and the factors that drove money markets into a low interest rate environment.
Section 3 reviews the impact on short-term government bond yields of the low interest rate
environment. Section 4 reviews convergence in the short-term secured market, in particular for
three-month repo rates, in the low interest rate environment. Section 5 reviews short-term unsecured
market developments in a low interest rate context based on STEP data. Section 6 concludes.
2 The market for a given fi nancial instrument is considered fully integrated if all economic agents with the same relevant characteristics
acting in that market face a single set of rules, have equal access and are treated equally.
3 For the purpose of this Special Feature, market segmentation is defi ned as substantial and growing price differences between jurisdictions
and a persistent drop in turnover in some jurisdictions.
4 Instruments are characterised as having “safe haven” status when they benefi t from infl ows from investors looking to safeguard their
liquidity or capital in periods of market stress. In the presence of safe haven fl ows, prices would move in opposite direction across the
concerned countries, i.e. they would be negatively correlated.
5 “Program countries” refers to euro area members that requested the fi nancial support of the European Union and the International
Monetary Fund.
67ECB
Financial integration in Europe
April 2013
SPECIAL FEATURE A
2 BACKGROUND
ACADEMIC LITERATURE ON LOW INTEREST RATES
The academic literature has addressed the effects of a low interest rate environment. The most
common fi nding is that low interest rates, especially short-term interest rates which are “too low
for too long”, could encourage fi nancial institutions to take excessive risks. Maddaloni and Peydrό
(2010)6 and Altunbas, Gambacorta, and Marqués-Ibáñez (2010),7 for instance, gathered evidence
that excessively low interest rates over an excessively long period could have contributed to the
fi nancial crisis in 2007-08, along with other factors, such as inadequate supervision, and fi nancial
innovation. In other words, the search for yields could have negative consequences in term of
fi nancial stability.
However, in the current market context, perceived risks are signifi cantly higher than they were
during most periods under review in the literature. Accordingly, so far fi nancial institutions have
been reluctant to pass the low interest rates on to their customers and have instead continued
with their deleveraging process. Diamond and Rajan (2012)8 argue that banks will take on more
short-term leverage or make illiquid loans if the central bank is expected to reduce interest rates at
times of fi nancial stress. However, acknowledging that it would be politically and economically
undesirable to allow high rates in times of fi nancial stress, they add that central banks may want to
raise interest rate in normal times in order to preserve banks incentives to maintain low leverage
and high liquidity. Freixas, Martin, and Skeie (2011)9 explored why major central banks lower
short-term interest rate during banking crisis while the standard view would be that monetary
policy should play a role only if fi nancial disruption directly affects prices or the real economy.
The authors argue that reducing short-term interest rate would help the functioning of the interbank
market and the reallocation of liquidity.
ORIGINS OF CURRENTLY OBSERVED FINANCIAL MARKET SEGMENTATION
Market segmentation has a variety of causes. Apart from fundamental differences between countries
that are connected to national public sector health and national regulation, segmentation may be
related for instance, to technical or legal obstacles, differences in local customs or languages, and
asymmetric information about entities operating in other countries. Such obstacles were partially
overcome in the years leading up to and after the introduction of the euro. Although in hindsight,
convergence in prices and premia demanded in the euro area might have been excessive, refl ecting
some mispricing due to neglected risks.
The recently observed trend towards lower integration in several fi nancial market segments (for
an overview, see Chapter 1 of this report) seems to be driven mainly by a loss of confi dence
due to the reassessment of counterparties’ creditworthiness among market participants. Such
a loss of confi dence associated with greater asymmetry in information on counterparties and the
6 Maddaloni, A., and Peydrό, J.-L. (2010), “Bank risk-taking, securitization, supervision and low interest rates: Evidence from the euro area
and the U.S. lending standards”, ECB Working Paper Series, No 1248.
7 Altunbas, Y., Gambacorta, L. and Marqués-Ibáñez, D. (2010), “Does monetary policy affect risk-taking?”, ECB Working Paper Series,
No 1166.
8 Diamond, D., and R. Rajan, (2012), “Illiquid Banks, Financial Stability, and Interest Rate Policy”, Journal of Political Economy, vol. 120,
issue 3, pages 552-591.
9 Freixas, X., Martin, A., and D. Skeie (2011), “Bank Liquidity, Interbank Markets, and Monetary Policy”, Revue of Financial Studies,
vol. 24, issue 8, pages 2656-2692.

68ECB
Financial integration in Europe
April 2013
dependence of some counterparties on national
developments, affects the pricing and volume
of transactions across countries, as prices (and
quantities traded) refl ect not only the credit risk
and each participant’s appetite for risk, but also
the increased uncertainty or loss of confi dence
in particular in the case of in cross-border trades.
Similarly, market participants’ risk appetite
could be lastingly reduced following a fi nancial
crisis like the one experienced worldwide
since 2007. In a context of acute risk aversion,
market participants might have a strong
preference for liquidity (cash) and highly rated
counterparties. Institutions located in countries
subject to pronounced market stress during the
fi nancial crisis would suffer a stigma, while
those regarded as safe havens would experience
strong demand for their assets.
DEVELOPMENTS THAT LED TO THE LOW INTEREST
RATE ENVIRONMENT
Owing to the scale of excess liquidity, the rate
of the deposit facility became the reference for
short-term money market rates. As a response
to severe frictions in the monetary policy
transmission mechanism, the ECB introduced a
fi xed-rate full allotment policy for its refi nancing operations to foster the smooth functioning of the
transmission mechanism and thereby also alleviate market tensions and facilitate the refi nancing of
fi nancial institutions. As a result of this allotment policy, in aggregated terms, fi nancial institutions
located in some countries of the euro area and large international institutions accumulated signifi cant
liquidity surpluses, which were regularly placed in the Eurosystem’s deposit facility, while other
fi nancial institutions frequently rely on ECB refi nancing operations. The two three-year longer-
term refi nancing operations (LTROs) increased excess liquidity to record high levels in the euro
area (Chart 27). As a result, short-term interest rates drifted toward the rate applied to the ECB’s
deposit facility. For example, the spread between the EONIA and the ECB deposit rate narrowed to
levels near zero (Chart 28).
This and the successive cuts in the ECB policy rates contributed to a near zero interest rate environment.
On 5 July 2012, the ECB reduced its main refi nancing rate and the rates on the marginal lending and
deposit facilities by 25 basis points to the historically low levels of 0.75%, 1.50% and 0%, respectively.
This 25 basis point reduction in the deposit facility rate to 0% resulted in a de facto zero, and at
times even negative, interest rate environment in the euro money market.
The zero interest rate defi nes a barrier which for economic, technical and psychological reasons
is diffi cult for money market participants to cross. First of all, investors and depositors could
avoid negative interest rates simply by holding cash. However, individual would likely not
convert fi nancial assets into cash as long as negative rates do not move beyond the costs of
storing cash and making payment in cash. Second, interest rates are usually positive in order to
Chart 28 EONIA – deposit rate spread and excess liquidity relationship 2006-2013
0
20
40
60
80
100
120
140
0
20
40
60
80
100
120
140
0 100 200 300 400 500 600 700 800 900
y-axis: basis points
x-axis: EUR billions
before fixed rate full allotment (15 October 2008)
after fixed rate full allotment
after first LTRO (26 December 2011)
after second LTRO-ECB deposite rate 0.25%
(1 March 2012 to 11 July 2012)
after second LTRO-ECB depositi rate 0%
(11 July 2012 to 11 November 2012)
13 March 2013
best fit estimate with constant elasticity
Sources: Thomson Reuters and ECB calculations.
69ECB
Financial integration in Europe
April 2013
SPECIAL FEATURE A
compensate individuals’ preference for immediate consumption. As such, there must be some
other extraordinary benefi ts attached to holding assets and deposits bearing negative rates. Safety
would be typically the benefi t searched by investors accepting negative rates. Third, since fi nancial
markets in the euro area, including money markets, have experienced only very few instances of
negative interest rates, which concerned only a limited set of products, many market participants
may not be prepared to operate at negative rates. Some agents, such as money market funds,
may even be unable to operate at negative rates owing to internal constraints. In fact, even in
countries where central banks have applied negative interest rates, banks have not passed negative
rates on to their retail customers. Such barriers can make it diffi cult for fi nancial institutions to
run their usual business models. In practices, negative interest rates were mainly applied to
non-residents that do not have access to the Eurosystem deposit facility.
The reluctance to invest at very low or, in some circumstances, negative interest rates supported
a search for yield that mitigated market segmentation. The “search for yield” triggered by
the low interest rate environment has the particular feature of having been fostered by the
economic, technical, and even psychological barriers to passing on very low or negative yields,
which provided opportunities for diversifi cation in search for positive returns by taking on
relatively limited extra risk. Compared to other major markets, the euro area offers a relatively
large potential for asset diversifi cation owing to the different risk profi les of euro area countries’
domestic markets.
In term of “cost for safe haven,” negative rates go one step further than interest rate differential
between two positive yields (i.e. opportunity cost). Indeed, actually paying negative interest rate
on “safe haven” asset is different from receiving a lower yield on an asset considered as safe haven
compared to another asset not viewed as safe haven. Investors that would accept a lower return
against safety might not accept to receive a negative return i.e. to pay for safety. Without this zero
barrier the demand for safe haven might have been higher in period of stress.
As a rule, market participants adjust their investment strategy to changes in market conditions
gradually. Money market funds, for instance, are not likely to immediately change their full
outstanding investments. Instead, they might wait for instruments to mature and only then consider
re-investing in the money market, under potentially changed conditions. Although the investment
strategies of individual money market funds vary, most would typically hold a signifi cant part of
their portfolio in Treasury bills, commercial paper or certifi cates of deposit. Money market funds
would also progressively adjust their investment guidelines, allowing investments in lower-rated
instruments delivering positive yields if they believe that negative rates on best-rated counterparties
may last a long time. Furthermore, banks might pass on the low interest rates to their fi nancial
counterparties or customers more or less rapidly and fully, depending on their bargaining power or
their reaction function. Banks are also likely to take time to adjust and to open or re-open credit lines
vis-à-vis other market participants, partly refl ecting different internal decision-making processes
between fi nancial institutions.
JOINT EFFECTS ON MONEY MARKETS OF THE LOW INTEREST RATE ENVIRONMENT
AND THE OMT ANNOUNCEMENT
The low interest rate environment and the OMT announcement could be seen as complementary.
The former creates the conditions for a search for yield across countries inasmuch “safe haven”
jurisdictions and fi nancial instruments’ yields moved into negative territory. The latter enlarged
the scope of the search for yield to longer maturities and allegedly more risky instruments or

70ECB
Financial integration in Europe
April 2013
countries by removing some “tail risks” from the market. This policy mix helped to mitigate market
segmentation in the euro area.
The OMT announcement contributed to easing market tensions by affecting the “tail risks” from
the market. The comment by the ECB President on 26 July 2012 that, within its mandate, the
ECB “will do whatever it takes” to preserve the euro and the subsequent OMT announcement on
6 September 2012 eased market tensions in countries affected by elevated market stress. The OMT
announcement paved the way for the possibility of conditional ECB interventions in the sovereign
bond market for maturities up to three years.
The infl uence of the low interest rate environment and the OMT announcement on markets is tightly
intertwined. The impact on some money market instruments of the low interest rate environment may
be diffi cult to disentangle from that of the announcements of OMTs. The move to a zero rate on the
deposit facility and the OMT announcement were close together. However, the OMT announcement
and the low interest rate environment have different targets. OMTs, on one hand, are aimed at
safeguarding an appropriate monetary policy transmission and the singleness of monetary policy by
addressing tail risks. The low interest rate environment, on the other hand, is geared towards dampening
defl ationary pressures and preventing a materialisation of downside risks to economic activity.
Thus, the low interest rate environment impacts directly and fi rstly on the shorter end of the money
market curve, while the OMT announcement could have greater implications for longer maturities.
Markets in countries affected by fi nancial stress and in countries with safe haven status are expected
to be more responsive to the OMT announcement owing to their greater exposure to tail risks or
their status as safe havens from tail risks.
INTERNATIONAL EXPERIENCES WITH LOW INTEREST RATE ENVIRONMENTS
Several other major markets have experienced low and even negative interest rates. Markets
in Japan, the United States, and the United Kingdom are also operating in low interest rate
environments as a result of central banks’ actions during the fi nancial crisis. However, compared
to the euro area, negative money market rates have recently been less frequently observed in Japan,
the United Kingdom, and the United States because the positive remuneration of excess liquidity
by the central banks in these markets set the fl oor on money market transactions slightly above
zero. Furthermore, the euro area presents a larger potential for asset diversifi cation and price
discrimination between national markets with different credit profi les, which has resulted in
consistently negative rates for safe haven jurisdiction issuers and instruments.
With the exception of term deposits, the Eurosystem does not remunerate banks’ deposits at present,
unlike other central banks. In contrast to the Eurosystem, which has cut its deposit rate to zero,
the Bank of Japan has recently maintained a positive rate on its deposit facility for banks’ excess
liquidity (0.1%), the Federal Reserve System introduced a 0.25% rate of remuneration for excess
liquidity and required reserves on 9 October 2008, and the Bank of England applies a bank rate
of 0.5% to all banks’ reserves in its books. In practice, overnight rates have hovered below the
respective rates applied by each central bank because not all market participants have access to the
central banks’ deposit facilities. The environment of credit risk perceived to be elevated encouraged
transactions with the best-rated and best known counterparties in the market and hence at low rates.
In the case of the federal fund market, regulatory changes (described in Special Feature D of this
report) also reduced arbitrage opportunities for banks with access to the Federal Reserve System,
contributing to the spread between the federal fund rate and the Federal Reserve’s excess liquidity

71ECB
Financial integration in Europe
April 2013
SPECIAL FEATURE A
remuneration. With the ECB’s deposit rate cut to zero, euro area banks can only maintain a margin
in the overnight market if they are able to attract deposits at negative rates or lend at above the
deposit facility rate despite the signifi cant excess liquidity. As wholesale market participants are
reluctant to accept negative rates, so far most of the interbank activity has been traded above the
level of the deposit facility.
The euro area, with several national issuers having different risk profi les, offers additional
opportunities for asset diversifi cation within the area. During the crisis, price differentiation within
the euro area increased among the different national jurisdictions and deteriorated into market
segmentation. As a result, euro area safe haven jurisdiction issuers and products experienced more
consistently negative rates than similar products in Japan, the United Kingdom, and the United
States (Chart 29), which do not have such a plurality of jurisdictions. The negative rates increased
the cost of safe haven investments and made other countries more attractive for investors once
markets stabilised. Thus the diversity of euro area markets increases opportunities for investors to
search for yield, especially since the OMT announcement.
Some economies in the euro neighbourhood are sensitive to the developments in the euro area.
Denmark and Switzerland experienced strong exchange rate appreciation pressures due to “safe
haven” fl ows, which led to low and negative rates in both markets. Developments in the respective
bilateral exchange rates of these economies with the euro provide an indirect opportunity to illustrate
the impact of low interest rates in the euro area and OMT on market segmentation.
Danmarks Nationalbank shadowed ECB interest rate decisions in line with its monetary policy
framework, applying a negative premium relative to the ECB deposit rate to stem currency
appreciation pressures. Consequently, Danmarks Nationalbank introduced negative remuneration
for excess liquidity once the ECB cut its deposit rate to zero in July 2012. However, Danmarks
Nationalbank decided to not penalise banks’ reserves up to a predetermined ceiling for current
Chart 29 Treasury bills’ rates in four different low interest rate environments
(percentages)
United States 3M
Japan 3M
United Kingdom 3M
Germany 3M
United States 12M
Japan 12M
United Kingdom 12M
Germany 12M
-0.2
0.0
0.2
0.4
0.6
0.8
1.0
1.2
1.4
-0.2
0.0
0.2
0.4
0.6
0.8
1.0
1.2
1.4
VLTRO 1
VLTRO 2
ECB deposit
rate at 0%
2011 2012 2013
-0.2
0.0
0.2
0.4
0.6
0.8
1.0
1.2
1.4
1.6
1.0
0.0
-0.2
0.2
0.4
0.6
0.8
1.2
1.4
1.6
VLTRO 1
VLTRO 2
ECB deposit
rate at 0%
2011 2012 2013
Source: Bloomberg.

72ECB
Financial integration in Europe
April 2013
account balances considered appropriate for the proper functioning of the payment system and
for necessary liquidity buffers. Balances up to this ceiling are subject to a zero interest rate.10
From July 2012 to January 2013, remuneration on excess liquidity above the ceiling has been set at
-0.2%. On 24 January 2013, the remuneration was increased to -0.1%. Accordingly, the interbank
market moved into negative territory and private market participants introduced negative rates
on some large corporate and institutional deposits, but not on retail deposits. In the search for
yields, negative rates spread to the government securities market, which traded at negative yields
for residual maturities up to four years. Yields on covered bonds backed by mortgages reached a
historically low level, although rates are still slightly above zero.
The Swiss National Bank (SNB) set a fl oor on the exchange rate for the Swiss franc against the
euro at 1.20 and intervened in the foreign exchange market, triggering a substantial increase in its
foreign exchange reserves. Since July 2011, the injections of liquidity through foreign exchange
interventions have remained unsterilised, as the Swiss National Bank stopped issuing certifi cates of
deposit for absorption in August 2011 and the last certifi cates matured in July 2012. In the absence
of a deposit facility or other forms of excess liquidity remuneration (implicitly a zero deposit rate),
excess liquidity created a low interest rate environment with several money market instruments
trading at negative rates. Some Swiss banks announced that they would introduce negative rates or
fees for some deposits placed by other banks.
Chart 30 shows that the Danish krone started depreciating away from its trading band after the cut
in Danmarks Nationalbank’s deposit rate to -0.2%. The OMT announcement, in addition to the
SNB foreign exchange policy, seems to have helped to lift the Swiss franc from its fl oor while the
ECB rate cut may not have had an impact on the franc.
10 Individual current account ceilings also took into account the money market activities of banks in order to not penalise those banks most
active in the domestic money market.
Chart 30 Dealing with safe haven flows in Denmark and Switzerland
(EUR billion)
50
52
54
56
58
60
62
7.41
7.42
7.43
7.44
7.45
7.46
7.47
VLTRO 2
Danish National
Bank deposit
rate at -0.2%
Danish National
Bank deposit
rate at -0.1%
OMT announcement
Jan. Mar. Mar.May July Sep. Nov. Jan.2012 2013
DKK/EUR exchange rate (left-hand scale)
Danmarks National Bank euro foreign
exchange reserves (right-hand scale)
0
50
100
150
200
250
300
350
400
450
500
1.19
1.20
1.21
1.22
1.23
1.24
1.25
VLTRO 2 ECB deposit
rate at 0%
OMT
announcement
Jan. Mar. May July Sep. Nov. Jan. Mar.2012 2013
CHF/EUR exchange rate (left-hand scale)
CHF/EUR trading floor: 1.2 (left-hand scale)
Swiss National Bank euro foreign exchange reserves
(right-hand scale)
Source: Bloomberg.

73ECB
Financial integration in Europe
April 2013
SPECIAL FEATURE A
Most other markets close to the euro area have maintained a noticeable spread against the euro area
money market.
The Czech Republic, however, is an exception. Česka národní banka set its two week liquidity
absorption and deposit rates at the same historically low level of 0.05% in November 2012. The two
rates are the main money market reference rates, as the Czech market is operating in a structural
liquidity surplus. Money market rates accordingly declined to historically low levels, approaching
zero for some instruments, such as Treasury bills.
3 TREASURY BILL MARKETS
How is the low interest rate environment affecting Treasury bill market segmentation in practice?
In the Treasury bill market, some investors are subject to strict credit risk limits related to their
risk management policy. This creates a high demand for the best-rated government securities,
implying that investors have to accept low and possibly negative rates for some short-term
maturities. Alternatively, they could use their credit limits more extensively with other countries
or relax them to invest at positive yields. The latter option would contribute to a reduction in
market segmentation.
The low interest rate environment supported the integration of short-term sovereign debt markets
with a relatively good credit rating, although risk and liquidity differences remain perceptible.
Belgium, Dutch, and French yields approached the levels of those of Germany. Moreover, French
and Dutch Treasury bills started exhibiting responses to the general risk-on/risk-off factor of the
euro area market more similar to those of Germany.
TREASURY BILL SPREADS ACROSS MEMBER STATES
Developments in Treasury bill markets are a useful indicator of the search for yield by investors
after the interest rate cut. Short-term government securities issued by Germany, Belgium, the
Netherlands, France, Italy and Spain represent more than 90% of euro area Treasury bills. Examining
developments in these particular markets provides insights into the possible differences between
short-term Treasury bill markets, thereby throwing some light on the issue of market segmentation.
The ECB’s interest rate cut of July 2012 seems to have supported deeper integration of Treasury
bill markets with relatively good credit rating. The three-year refi nancing operation contributed to
dampen upward pressures on yields that developed at end 2011 as a result of the euro area sovereign
crisis and yields started to decline. However, the cut of the Eurosystem’s deposit rate to zero was
followed by a rapid convergence of French and Belgian short-term yields to German and Dutch
levels and volatility (Chart 31). Spanish and Italian yields, on the other hand, remained volatile and
only began to decrease signifi cantly after the ECB’s President, Mario Draghi, hinted at potential
new measures (OMTs) to address key concerns among market participants at the end of July.
Some differences across countries persisted due to risk perception and structural factors.
In particular, the zero interest rate proved to be a relatively effective fl oor for French, Dutch, and
Belgian yields. French Treasury bills temporarily hovered below zero for maturities of less than
12 months, but this phenomenon was not as sustained as for German Treasury bills. In addition,
some differences subsisted between the French and Belgian/Dutch Treasury bill markets with yields
and volatility remaining higher for Belgian/Dutch than for French Treasury bills. Structural factors,
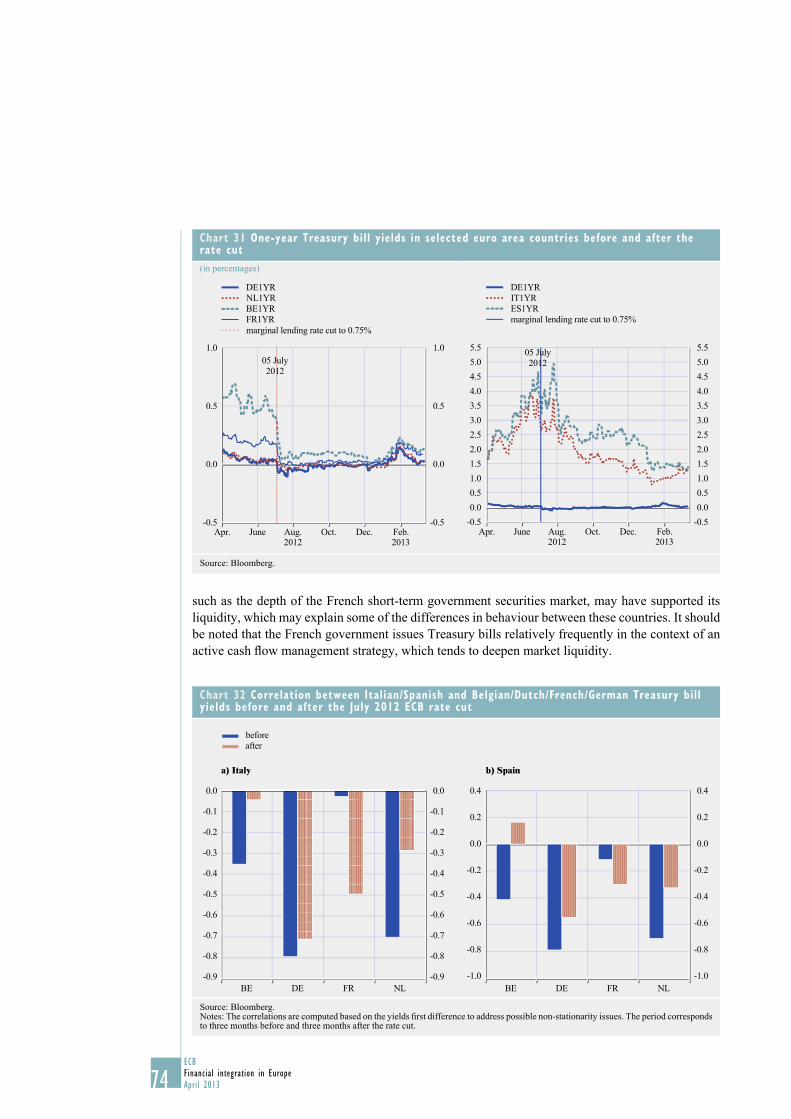
74ECB
Financial integration in Europe
April 2013
such as the depth of the French short-term government securities market, may have supported its
liquidity, which may explain some of the differences in behaviour between these countries. It should
be noted that the French government issues Treasury bills relatively frequently in the context of an
active cash fl ow management strategy, which tends to deepen market liquidity.
Chart 31 One-year Treasury bill yields in selected euro area countries before and after the rate cut
(in percentages)
-0.5
0.0
0.5
1.0
-0.5
0.0
0.5
1.0
Apr. June Aug. Oct. Dec. Feb.
05 July
2012
DE1YR
NL1YR
BE1YR
FR1YR
marginal lending rate cut to 0.75%
2012 2013
-0.5
0.0
0.5
1.0
1.5
2.0
2.5
3.0
3.5
4.0
4.5
5.0
5.5
-0.5
0.0
0.5
1.0
1.5
2.0
2.5
3.0
3.5
4.0
4.5
5.0
5.5
Apr. June Aug. Oct. Dec. Feb.2012 2013
DE1YR
IT1YR
ES1YR
marginal lending rate cut to 0.75%
05 July
2012
Source: Bloomberg.
Chart 32 Correlation between Italian/Spanish and Belgian/Dutch/French/German Treasury bill yields before and after the July 2012 ECB rate cut
before
after
a) Italy b) Spain
-0.9
-0.8
-0.7
-0.6
-0.5
-0.4
-0.3
-0.2
-0.1
0.0
-0.9
-0.8
-0.7
-0.6
-0.5
-0.4
-0.3
-0.2
-0.1
0.0
BE DE FR NL
-0.8
-0.6
-0.4
-0.2
0.0
0.2
0.4
-1.0
-0.8
-0.6
-0.4
-0.2
0.0
0.2
0.4
-1.0
BE DE FR NL
Source: Bloomberg.Notes: The correlations are computed based on the yields fi rst difference to address possible non-stationarity issues. The period corresponds to three months before and three months after the rate cut.
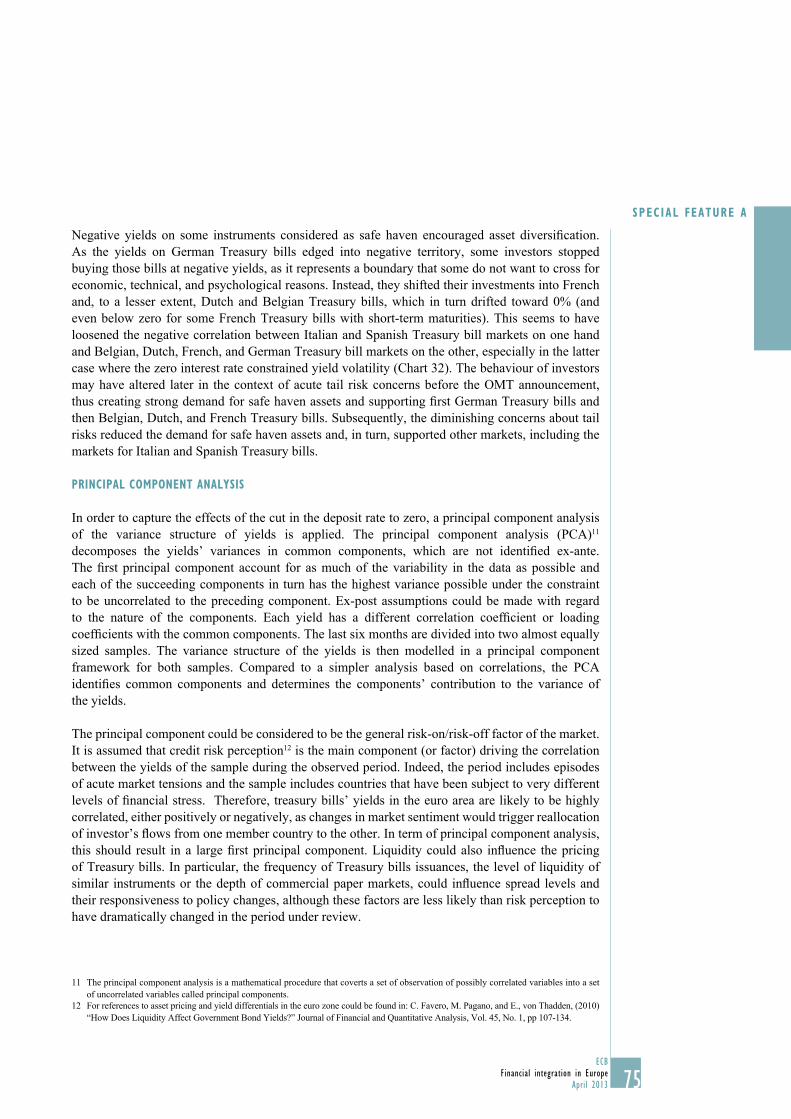
75ECB
Financial integration in Europe
April 2013
SPECIAL FEATURE A
Negative yields on some instruments considered as safe haven encouraged asset diversifi cation.
As the yields on German Treasury bills edged into negative territory, some investors stopped
buying those bills at negative yields, as it represents a boundary that some do not want to cross for
economic, technical, and psychological reasons. Instead, they shifted their investments into French
and, to a lesser extent, Dutch and Belgian Treasury bills, which in turn drifted toward 0% (and
even below zero for some French Treasury bills with short-term maturities). This seems to have
loosened the negative correlation between Italian and Spanish Treasury bill markets on one hand
and Belgian, Dutch, French, and German Treasury bill markets on the other, especially in the latter
case where the zero interest rate constrained yield volatility (Chart 32). The behaviour of investors
may have altered later in the context of acute tail risk concerns before the OMT announcement,
thus creating strong demand for safe haven assets and supporting fi rst German Treasury bills and
then Belgian, Dutch, and French Treasury bills. Subsequently, the diminishing concerns about tail
risks reduced the demand for safe haven assets and, in turn, supported other markets, including the
markets for Italian and Spanish Treasury bills.
PRINCIPAL COMPONENT ANALYSIS
In order to capture the effects of the cut in the deposit rate to zero, a principal component analysis
of the variance structure of yields is applied. The principal component analysis (PCA)11
decomposes the yields’ variances in common components, which are not identifi ed ex-ante.
The fi rst principal component account for as much of the variability in the data as possible and
each of the succeeding components in turn has the highest variance possible under the constraint
to be uncorrelated to the preceding component. Ex-post assumptions could be made with regard
to the nature of the components. Each yield has a different correlation coeffi cient or loading
coeffi cients with the common components. The last six months are divided into two almost equally
sized samples. The variance structure of the yields is then modelled in a principal component
framework for both samples. Compared to a simpler analysis based on correlations, the PCA
identifi es common components and determines the components’ contribution to the variance of
the yields.
The principal component could be considered to be the general risk-on/risk-off factor of the market.
It is assumed that credit risk perception12 is the main component (or factor) driving the correlation
between the yields of the sample during the observed period. Indeed, the period includes episodes
of acute market tensions and the sample includes countries that have been subject to very different
levels of fi nancial stress. Therefore, treasury bills’ yields in the euro area are likely to be highly
correlated, either positively or negatively, as changes in market sentiment would trigger reallocation
of investor’s fl ows from one member country to the other. In term of principal component analysis,
this should result in a large fi rst principal component. Liquidity could also infl uence the pricing
of Treasury bills. In particular, the frequency of Treasury bills issuances, the level of liquidity of
similar instruments or the depth of commercial paper markets, could infl uence spread levels and
their responsiveness to policy changes, although these factors are less likely than risk perception to
have dramatically changed in the period under review.
11 The principal component analysis is a mathematical procedure that coverts a set of observation of possibly correlated variables into a set
of uncorrelated variables called principal components.
12 For references to asset pricing and yield differentials in the euro zone could be found in: C. Favero, M. Pagano, and E., von Thadden, (2010)
“How Does Liquidity Affect Government Bond Yields?” Journal of Financial and Quantitative Analysis, Vol. 45, No. 1, pp 107-134.
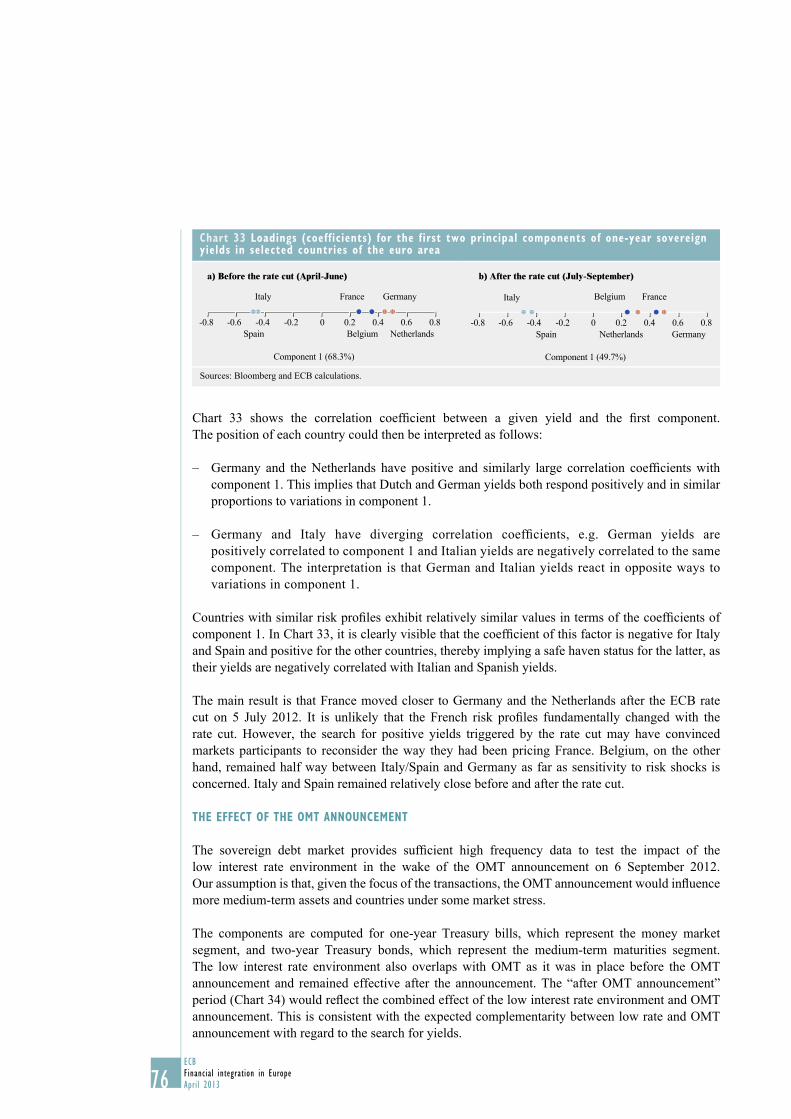
76ECB
Financial integration in Europe
April 2013
Chart 33 shows the correlation coeffi cient between a given yield and the fi rst component.
The position of each country could then be interpreted as follows:
Germany and the Netherlands have positive and similarly large correlation coeffi cients with –
component 1. This implies that Dutch and German yields both respond positively and in similar
proportions to variations in component 1.
Germany and Italy have diverging correlation coeffi cients, e.g. German yields are –
positively correlated to component 1 and Italian yields are negatively correlated to the same
component. The interpretation is that German and Italian yields react in opposite ways to
variations in component 1.
Countries with similar risk profi les exhibit relatively similar values in terms of the coeffi cients of
component 1. In Chart 33, it is clearly visible that the coeffi cient of this factor is negative for Italy
and Spain and positive for the other countries, thereby implying a safe haven status for the latter, as
their yields are negatively correlated with Italian and Spanish yields.
The main result is that France moved closer to Germany and the Netherlands after the ECB rate
cut on 5 July 2012. It is unlikely that the French risk profi les fundamentally changed with the
rate cut. However, the search for positive yields triggered by the rate cut may have convinced
markets participants to reconsider the way they had been pricing France. Belgium, on the other
hand, remained half way between Italy/Spain and Germany as far as sensitivity to risk shocks is
concerned. Italy and Spain remained relatively close before and after the rate cut.
THE EFFECT OF THE OMT ANNOUNCEMENT
The sovereign debt market provides suffi cient high frequency data to test the impact of the
low interest rate environment in the wake of the OMT announcement on 6 September 2012.
Our assumption is that, given the focus of the transactions, the OMT announcement would infl uence
more medium-term assets and countries under some market stress.
The components are computed for one-year Treasury bills, which represent the money market
segment, and two-year Treasury bonds, which represent the medium-term maturities segment.
The low interest rate environment also overlaps with OMT as it was in place before the OMT
announcement and remained effective after the announcement. The “after OMT announcement”
period (Chart 34) would refl ect the combined effect of the low interest rate environment and OMT
announcement. This is consistent with the expected complementarity between low rate and OMT
announcement with regard to the search for yields.
Chart 33 Loadings (coefficients) for the first two principal components of one-year sovereign yields in selected countries of the euro area
a) Before the rate cut (April-June) b) After the rate cut (July-September)
Spain Belgium Netherlands
GermanyItaly France
-0.8 -0.6 -0.4 -0.2 0 0.2 0.4 0.6 0.8
Component 1 (68.3%)
-0.8 -0.6 -0.4 -0.2 0 0.2 0.4 0.6 0.8
Component 1 (49.7%)
Spain
Belgium
Netherlands Germany
Italy France
Sources: Bloomberg and ECB calculations.

77ECB
Financial integration in Europe
April 2013
SPECIAL FEATURE A
Jurisdictions under some market stress were more infl uenced by the OMT announcement associated
with the low interest rate environment. The rate cut left Treasury bill yields’ loading practically
unchanged for Italy and Spain (Chart 33), while the OMT announcement reduced the loading
for both Italian and Spanish Treasury bond and bill yields (Chart 34). This is consistent with the
interpretation that the principal component in this analysis refl ects the riskiness of the assets and
that the OMT announcement, as is the predominant view of market participants, reduced the tail
risks in respect of these sovereigns.
Some jurisdiction under less market stress also saw a change in their loadings after the OMT
announcement. Belgium Treasury bills’ yields loading moved closer to France and Germany.
The loading for the Netherlands declined however. This could refl ect a decline in the demand for
safe haven after the OMT announcement, which could have supported a strong positive correlation
between Dutch and German yields before OMT announcement. On the other hand, for two-year
Treasury bonds, loading for both Belgium and France moved closer to the German and the Dutch
ones. This is consistent with the interpretation that the OMT announcement could have had a
stronger infl uence on longer maturity bonds’ yields.
4 SHORT-TERM REPO MARKET
How is the low interest rate environment affecting collateralised market segmentation in practice?
High demand for highly rated collateral added to internal and external regulatory constraints that
force some investors to hold highly rated collateral would tend to push the repo rate to zero or
into negative territory for safe haven jurisdictions, thereby increasing the safe haven penalty and
encouraging asset diversifi cation.
This section focuses on three-month repo rates. The secured market is the largest segment
of the euro interbank market (see the latest Money Market Survey, published by the ECB in
September 2012), in particular as the credit risk inherent in transactions is reduced compared to
unsecured transactions.
Chart 34 Principal component loadings for Treasury bill and Treasury bond yields between selected euro area countries
One-year T-bill yieldsBefore OMT announcement (July-September)
Two-year T-bill yieldsBefore OMT announcement (July-September)
Spain Netherlands Germany
FranceItaly Belgium
-0.8 -0.6 -0.4 -0.2 0 0.2 0.4 0.6 0.8
Component 1 (49.7%)
SpainNetherlandsGermany
France ItalyBelgium
-0.8 -0.6 -0.4 -0.2 0 0.2 0.4 0.6 0.8
Component 1 (59.1%)
After OMT announcement (September – November) After OMT announcement (September – November)
Spain Netherlands Germany
FranceItaly Belgium
-0.8 -0.6 -0.4 -0.2 0 0.2 0.4 0.6 0.8
Component 1 (61.4%)
Spain Netherlands Germany
FranceItaly Belgium
-0.8 -0.6 -0.4 -0.2 0 0.2 0.4 0.6 0.8
Component 1 (57.6%)
Sources: Bloomberg and ECB calculations.

78ECB
Financial integration in Europe
April 2013
REPO SPREADS ACROSS COUNTRIES
The spread between French, Italian, German and
Spanish three-month repo rates narrowed after
the fi rst and second three-year LTROs. Repo
rates started diverging during the second half of
2011, with French and German rates declining
and Italian and Spanish rates increasing
markedly as the sovereign debt crisis intensifi ed.
During the intensifi cation of the crisis, market
participants were increasingly concerned that
even solvent banks could become illiquid and
hence insolvent. The decision to introduce the
three-year LTROs and the extensive use made
of them alleviated some of these concerns. The
corresponding surge in liquidity compressed
the spread between French/German and Italian/
Spanish repo rates back to their historical levels.
The rate cut in December 2011, along with
the marked increase in excess liquidity, also
contributed to the reduction in spreads as a result
of a more active search for yield (Chart 35).
The latest rate cut (July 2012) supported the
narrowing of the spread initiated by the liquidity
increase. The cut in the deposit facility rate to
zero temporarily pushed French and German
repo rates into negative territory against the
backdrop of the low rate environment and strong demand for “safe haven” instruments. Italian and
Spanish repo rates also declined mechanically following the rate cut, but a spread remained vis-
à-vis the French and German rates. This spread, which was trending upward just before the latest
rate cut in July 2012, declined gradually afterwards, possibly refl ecting a “slow motion” search
for yields, as excess liquidity and low interest rates persisted over time and maturing investments
needed to be rolled over only gradually.
The spread narrowed between German repo rates and French/Belgian/Dutch repo rates. The French
repo rate converged with those in Germany, especially after the second three-year LTRO, when
excess liquidity increased to historically high levels for the euro area. There were no noticeable
spreads between German and Dutch repo rates.
PRINCIPAL COMPONENT ANALYSIS
In the following, the principal component analysis referred to above is applied to the three-month
repo rates. For this analysis the fi rst three-year LTRO, which contributed to the low interest rate
environment, is included, as it appears to have had a non-negligible infl uence on the repo rate
(Chart 35). The reference period is thus split into four periods of equal duration (two months
each) before and after the fi rst three-year LTRO on 21 December 2011 and before and after the
ECB rate cut on 11 July 2012. As there is insuffi cient data for Belgian repos, Belgium is not
included in the analysis.
Chart 35 Repo rates and Repo rate spreads 1) in some euro area countries
-0.2
0.0
0.2
0.4
0.6
0.8
1.0
1.2
1.4
1.6
1.8
-0.2
0.0
0.2
0.4
0.6
0.8
1.0
1.2
1.4
1.6
1.821 December 2011
01 March 2012
05 July 2012
June Sep. Dec. Mar. Dec. Mar.June Sep.
Spread (in percentage)
Germany
Italy
Spain
France
Netherlands
2011 2012 2013
Source: Bloomberg.Note: Collateral is government securities in the respective jurisdictions included in the General Collateral.1) Spread is the max-min difference between the rates plotted in the chart.
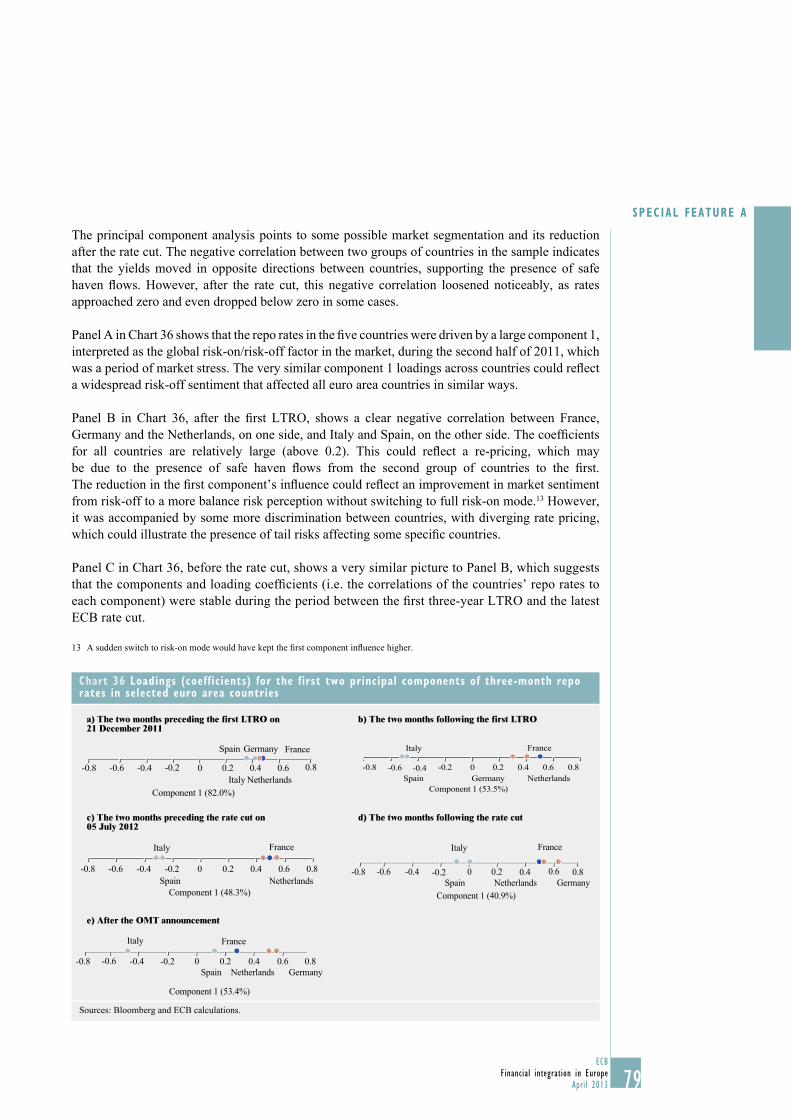
79ECB
Financial integration in Europe
April 2013
SPECIAL FEATURE A
The principal component analysis points to some possible market segmentation and its reduction
after the rate cut. The negative correlation between two groups of countries in the sample indicates
that the yields moved in opposite directions between countries, supporting the presence of safe
haven fl ows. However, after the rate cut, this negative correlation loosened noticeably, as rates
approached zero and even dropped below zero in some cases.
Panel A in Chart 36 shows that the repo rates in the fi ve countries were driven by a large component 1,
interpreted as the global risk-on/risk-off factor in the market, during the second half of 2011, which
was a period of market stress. The very similar component 1 loadings across countries could refl ect
a widespread risk-off sentiment that affected all euro area countries in similar ways.
Panel B in Chart 36, after the fi rst LTRO, shows a clear negative correlation between France,
Germany and the Netherlands, on one side, and Italy and Spain, on the other side. The coeffi cients
for all countries are relatively large (above 0.2). This could refl ect a re-pricing, which may
be due to the presence of safe haven fl ows from the second group of countries to the fi rst.
The reduction in the fi rst component’s infl uence could refl ect an improvement in market sentiment
from risk-off to a more balance risk perception without switching to full risk-on mode.13 However,
it was accompanied by some more discrimination between countries, with diverging rate pricing,
which could illustrate the presence of tail risks affecting some specifi c countries.
Panel C in Chart 36, before the rate cut, shows a very similar picture to Panel B, which suggests
that the components and loading coeffi cients (i.e. the correlations of the countries’ repo rates to
each component) were stable during the period between the fi rst three-year LTRO and the latest
ECB rate cut.
13 A sudden switch to risk-on mode would have kept the fi rst component infl uence higher.
Chart 36 Loadings (coefficients) for the first two principal components of three-month repo rates in selected euro area countries
a) The two months preceding the first LTRO on 21 December 2011
b) The two months following the first LTRO
Spain
Netherlands
Germany
Italy
France
-0.8 -0.6 -0.4 -0.2 0 0.2 0.4 0.6 0.8
Component 1 (82.0%)
Spain NetherlandsGermany
Italy France
-0.8 -0.6 -0.4 -0.2 0 0.2 0.4 0.6 0.8
Component 1 (53.5%)
c) The two months preceding the rate cut on 05 July 2012
d) The two months following the rate cut
Spain Netherlands
Italy France
-0.8 -0.6 -0.4 -0.2 0 0.2 0.4 0.6 0.8
Component 1 (48.3%)Spain Netherlands Germany
Italy France
-0.8 -0.6 -0.4 -0.2 0 0.2 0.4 0.6 0.8
Component 1 (40.9%)
e) After the OMT announcement
Spain Netherlands Germany
Italy France
-0.8 -0.6 -0.4 -0.2 0 0.2 0.4 0.6 0.8
Component 1 (53.4%)
Sources: Bloomberg and ECB calculations.

80ECB
Financial integration in Europe
April 2013
Panel D in Chart 36, after the latest ECB rate cut, shows a signifi cant decrease in the coeffi cients
for Italy and Spain, pointing to a loosening in the negative correlations between Italian and Spanish
repo rates and those of the rest of the sample. The drop in repo rate volatility after the latest ECB
rate cut in France, Germany and the Netherlands reduced their negative correlation with Italy and
Spain. As mentioned before, the loss in correlation might be due to the effect of the boundary of a
0% interest rate and investors’ reluctance to move further into negative territory.
The OMT announcement appears to have had a much less discernible impact on short-term repo
rates. The angle with Germany computed as in the previous section did not signifi cantly change
and, in some cases, even seems to have increased. This is consistent with our assumption that the
OMT announcement would have a more signifi cant impact on maturities longer than money market
duration and on countries or instruments marked by a perceived riskier credit profi le.
The analysis of the repo rates sheds some light on the interplay between the fi rst three-year LTRO
and the ECB rate cut. Before the fi rst three-year LTRO, most countries appear to have been affected
by a generalised risk-off sentiment. After the fi rst three-year LTRO and until the ECB rate cut
on 11 July 2012, pricing between countries seems to have diverged, refl ecting a more balanced
market sentiment associated with a more selective approach by investors to credit risk depending
on countries. After the ECB rate cut, the zero lower bound came into play, encouraging the search
for positive yields outside safe haven jurisdiction and thus mitigating market segmentation.
5 SHORT-TERM UNSECURED MARKET
How is the low interest rate environment affecting the unsecured interbank market segmentation
in practice? As long as the Eurosystem offered a positive deposit rate, market participants with
access to the ECB deposit facility would receive in the “last resort” a non-zero positive return on
liquidity. They were thus able to accept some deposits at below the deposit facility rate, but still at
a positive rate, from market participants with no-access to the Eurosystem deposit facility, and then
deposit them with the Eurosystem at a slim margin without risk or lend to the best counterparties in
the market. Since the deposit facility rate was cut to zero, the banks could either search for higher
yields by using their credit limits more extensively or impose negative interest rates on some of
their clients to preserve their margins in the deposit market.
THE UNSECURED INTERBANK MARKET IN A LOW INTEREST RATE ENVIRONMENT
The data available to assess the impact of the low interest rate environment on the unsecured
interbank market are limited. Only EONIA data are both available for interbank deposit transactions
and provide timely information on the average market lending rate and volume. However, country
by country data on rates and volumes are not available, which limits the use that could be done of
EONIA data in term of market segmentation analysis.
Persistent excess liquidity created the conditions for the convergence of overnight interbank
rates by pushing them towards the ECB deposit rate. Besides the infl uence of the actual levels
of excess liquidity,14 the persistence of large excess liquidity volumes appear to have slowly but
14 Excess liquidity is defi ned as banks’ reserves in the Eurosystem current account and deposit facility minus the minimum reserve
requirement and banks’ reserves placed on term deposits in the Eurosystem.

81ECB
Financial integration in Europe
April 2013
SPECIAL FEATURE A
surely compressed the EONIA-ECB deposit rate
spread towards zero,15 leading to a convergence
across countries to the lowest interest rate levels
with few exceptions. As shown in Chart 37, the
EONIA-ECB deposit spread gradually trended
downwards in the low interest rate environment,
refl ecting the progressive adjustment of the
different euro area market segments to the
prevailing liquidity conditions. In statistical
terms, the pattern of the EONIA-ECB deposit
rate spread meets the statistical criterion of a
deterministic trend, meaning it has followed,
until end 2012, a predictable decreasing linear
development with very limited deviations. This
corroborates anecdotal evidence pointing to
differences in the speed of market participants’
responses to the low interest rate environment,
depending on their internal credit policies and
bargaining power in their respective segments.
The market appears to converge over time,
with some delays, under the infl uence of excess
liquidity. However, it could be noted that given
the current low transaction volumes underlying
EONIA, the described development might not
be extended to the rest of the money market.
Chart 37 shows the EONIA-ECB deposit rate spread over time. The x-axis represents
the number of days that had elapsed since a particular event: the red dots represent
EONIA-ECB deposit rate spreads between the fi rst 3-year LTRO and the ECB rate cut on 5 July 2012;
the blue dots represent EONIA-ECB deposit rate spreads since ECB rate cut on 5 July 2012;
and the green dots represent the EONIA-ECB deposit rate spreads since the 3-year LTRO fi rst
repayment announcement on 25 January 2013. During these two periods, excess liquidity does not
seem to affect the level of the spread, although it may have had an impact on the spread volatility.
The level of the spread seems to be mainly a function of the time elapsed under a given interest –
rate period, supporting the idea of a gradual adjustment of the rate to excess liquidity conditions.
The regression line during the 0% Eurosystem deposit rate period, which followed the second –
three-year LTRO and the increase of excess liquidity to historically high levels, has a better fi t
(i.e. a higher R-square) than the regression line of the previous period, refl ecting less dispersion
around the linear trend. However, the period that followed the start of the repayment option
showed more volatility in the EONIA rate as excess liquidity declined.
The slope of the trend, however, remained very similar, which corroborates earlier fi ndings –
(Section 2) that indicated low spread elasticity to excess liquidity for very high levels of
excess liquidity.
15 The spread could not be negative as long as banks could deposit their liquidity with the ECB.
Chart 37 EONIA-ECB deposit rate spread evolution in a low interest rate context
(in basis points)
y = -0.0475x + 13.806
R² = 0.7653
y = -0.0424x + 12.186
R² = 0.929y = -0.0412x + 7.4909
R² = 0.3826
0
2
4
6
8
10
12
14
16
18
20
0
2
4
6
8
10
12
14
16
18
20
0 20 40 60 80 100 120 140 160
ECB deposit rate 0.25% (from 8 December 2011)
ECB deposit rate 0% (from 5 July 2012)
3-year LTRO 1 first repayment announcement
(from 26 January 2013)
linear (ECB deposit rate 0.25%
(from 8 December 2011))
linear (ECB deposit rate 0% (from 5 July 2012))
linear (3-year LTRO 1 first repayment announcement
(from 25 January 2013))
days
Sources: Thomson Reuters and ECB calculations.
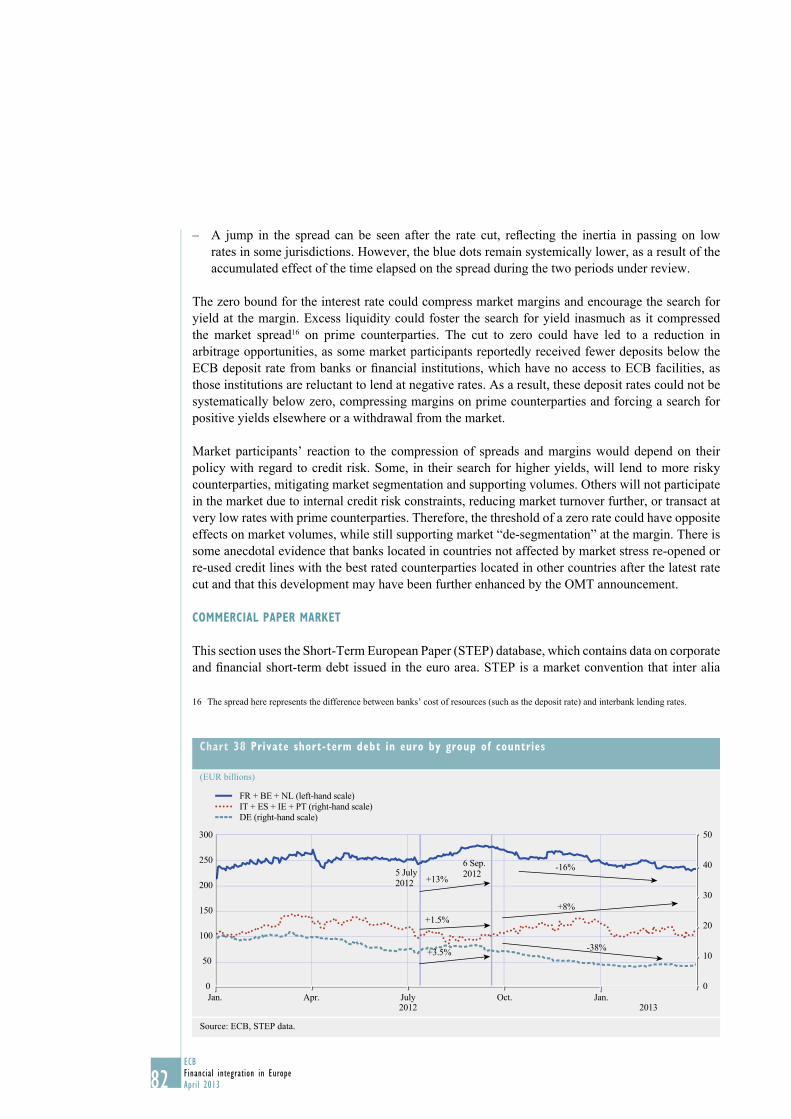
82ECB
Financial integration in Europe
April 2013
A jump in the spread can be seen after the rate cut, refl ecting the inertia in passing on low –
rates in some jurisdictions. However, the blue dots remain systemically lower, as a result of the
accumulated effect of the time elapsed on the spread during the two periods under review.
The zero bound for the interest rate could compress market margins and encourage the search for
yield at the margin. Excess liquidity could foster the search for yield inasmuch as it compressed
the market spread16 on prime counterparties. The cut to zero could have led to a reduction in
arbitrage opportunities, as some market participants reportedly received fewer deposits below the
ECB deposit rate from banks or fi nancial institutions, which have no access to ECB facilities, as
those institutions are reluctant to lend at negative rates. As a result, these deposit rates could not be
systematically below zero, compressing margins on prime counterparties and forcing a search for
positive yields elsewhere or a withdrawal from the market.
Market participants’ reaction to the compression of spreads and margins would depend on their
policy with regard to credit risk. Some, in their search for higher yields, will lend to more risky
counterparties, mitigating market segmentation and supporting volumes. Others will not participate
in the market due to internal credit risk constraints, reducing market turnover further, or transact at
very low rates with prime counterparties. Therefore, the threshold of a zero rate could have opposite
effects on market volumes, while still supporting market “de-segmentation” at the margin. There is
some anecdotal evidence that banks located in countries not affected by market stress re-opened or
re-used credit lines with the best rated counterparties located in other countries after the latest rate
cut and that this development may have been further enhanced by the OMT announcement.
COMMERCIAL PAPER MARKET
This section uses the Short-Term European Paper (STEP) database, which contains data on corporate
and fi nancial short-term debt issued in the euro area. STEP is a market convention that inter alia
16 The spread here represents the difference between banks’ cost of resources (such as the deposit rate) and interbank lending rates.
Chart 38 Private short-term debt in euro by group of countries
(EUR billions)
0
10
20
30
40
50
0
50
150
100
200
250
300
+13%
-16%
+8%
+1.5%
+3.5%-38%
2012Apr. July Oct. Jan.Jan.
2013
FR + BE + NL (left-hand scale)
IT + ES + IE + PT (right-hand scale)
DE (right-hand scale)
6 Sep.
20125 July
2012
Source: ECB, STEP data.
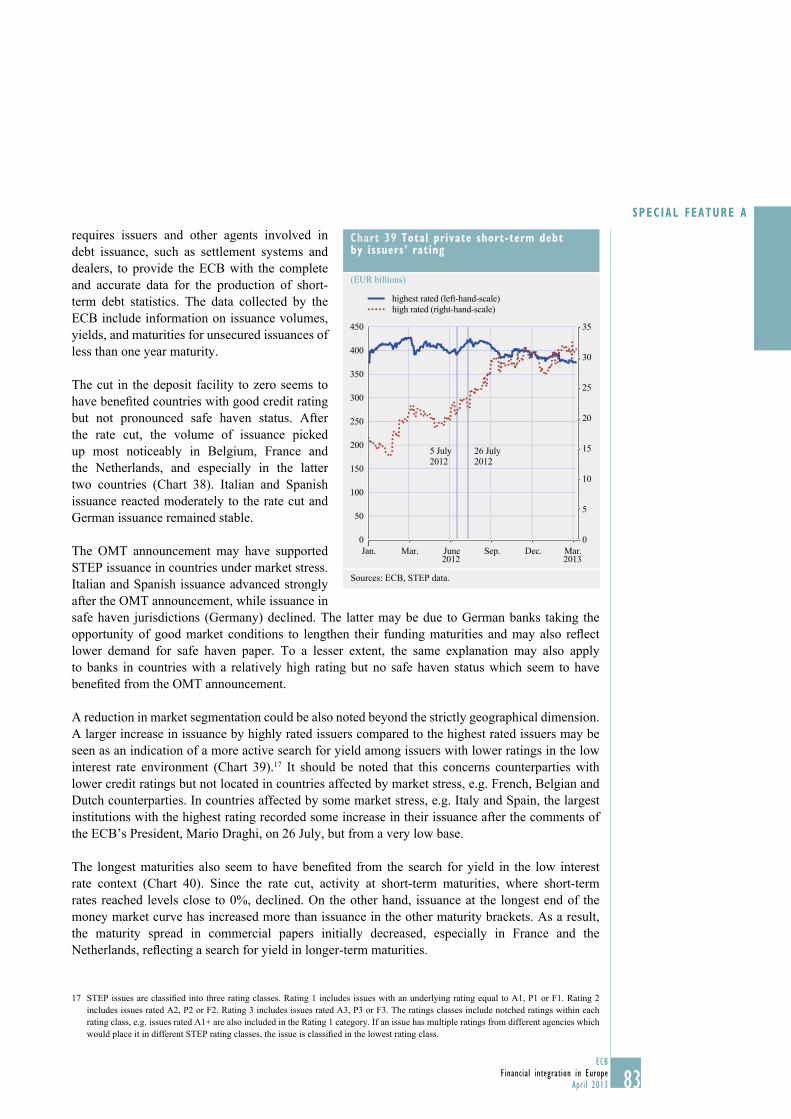
83ECB
Financial integration in Europe
April 2013
SPECIAL FEATURE A
requires issuers and other agents involved in
debt issuance, such as settlement systems and
dealers, to provide the ECB with the complete
and accurate data for the production of short-
term debt statistics. The data collected by the
ECB include information on issuance volumes,
yields, and maturities for unsecured issuances of
less than one year maturity.
The cut in the deposit facility to zero seems to
have benefi ted countries with good credit rating
but not pronounced safe haven status. After
the rate cut, the volume of issuance picked
up most noticeably in Belgium, France and
the Netherlands, and especially in the latter
two countries (Chart 38). Italian and Spanish
issuance reacted moderately to the rate cut and
German issuance remained stable.
The OMT announcement may have supported
STEP issuance in countries under market stress.
Italian and Spanish issuance advanced strongly
after the OMT announcement, while issuance in
safe haven jurisdictions (Germany) declined. The latter may be due to German banks taking the
opportunity of good market conditions to lengthen their funding maturities and may also refl ect
lower demand for safe haven paper. To a lesser extent, the same explanation may also apply
to banks in countries with a relatively high rating but no safe haven status which seem to have
benefi ted from the OMT announcement.
A reduction in market segmentation could be also noted beyond the strictly geographical dimension.
A larger increase in issuance by highly rated issuers compared to the highest rated issuers may be
seen as an indication of a more active search for yield among issuers with lower ratings in the low
interest rate environment (Chart 39).17 It should be noted that this concerns counterparties with
lower credit ratings but not located in countries affected by market stress, e.g. French, Belgian and
Dutch counterparties. In countries affected by some market stress, e.g. Italy and Spain, the largest
institutions with the highest rating recorded some increase in their issuance after the comments of
the ECB’s President, Mario Draghi, on 26 July, but from a very low base.
The longest maturities also seem to have benefi ted from the search for yield in the low interest
rate context (Chart 40). Since the rate cut, activity at short-term maturities, where short-term
rates reached levels close to 0%, declined. On the other hand, issuance at the longest end of the
money market curve has increased more than issuance in the other maturity brackets. As a result,
the maturity spread in commercial papers initially decreased, especially in France and the
Netherlands, refl ecting a search for yield in longer-term maturities.
17 STEP issues are classifi ed into three rating classes. Rating 1 includes issues with an underlying rating equal to A1, P1 or F1. Rating 2
includes issues rated A2, P2 or F2. Rating 3 includes issues rated A3, P3 or F3. The ratings classes include notched ratings within each
rating class, e.g. issues rated A1+ are also included in the Rating 1 category. If an issue has multiple ratings from different agencies which
would place it in different STEP rating classes, the issue is classifi ed in the lowest rating class.
Chart 39 Total private short-term debt by issuers’ rating
(EUR billions)
5 July
2012
26 July
2012
0
5
10
15
20
25
30
35
0
50
100
150
200
250
300
350
400
450
Jan. Mar. June Sep. Dec. Mar.
highest rated (left-hand-scale)
high rated (right-hand-scale)
2012 2013
Sources: ECB, STEP data.
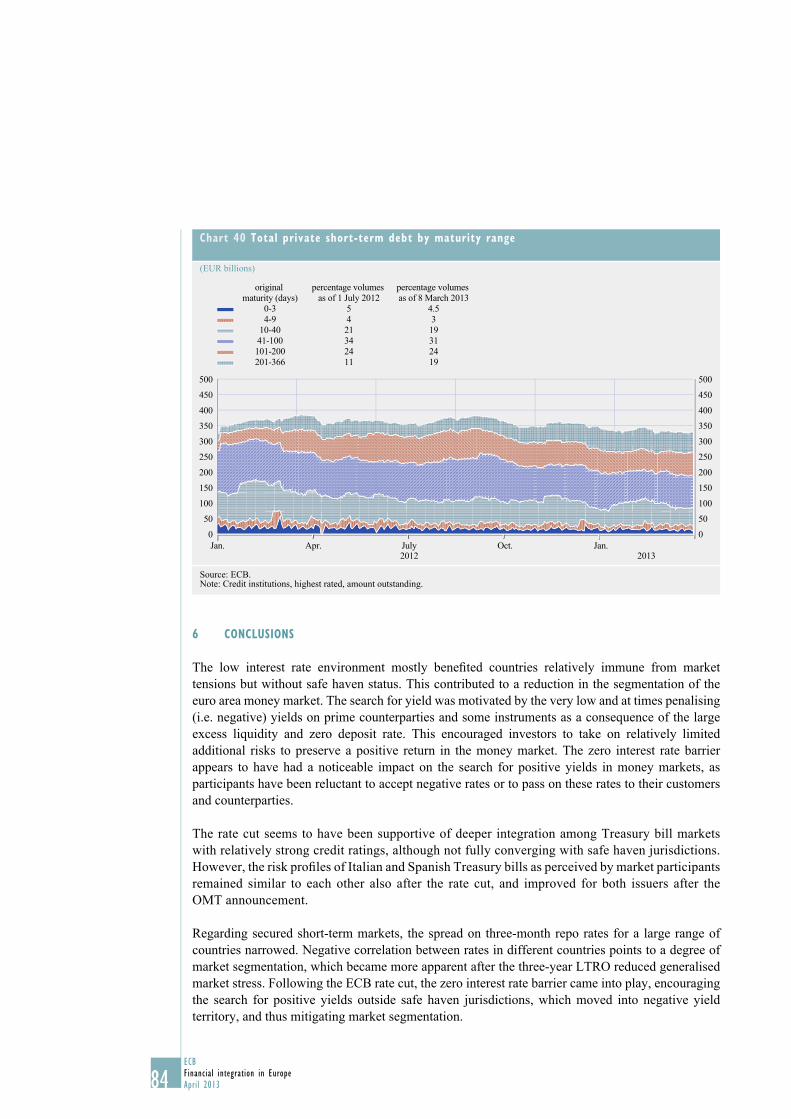
84ECB
Financial integration in Europe
April 2013
6 CONCLUSIONS
The low interest rate environment mostly benefi ted countries relatively immune from market
tensions but without safe haven status. This contributed to a reduction in the segmentation of the
euro area money market. The search for yield was motivated by the very low and at times penalising
(i.e. negative) yields on prime counterparties and some instruments as a consequence of the large
excess liquidity and zero deposit rate. This encouraged investors to take on relatively limited
additional risks to preserve a positive return in the money market. The zero interest rate barrier
appears to have had a noticeable impact on the search for positive yields in money markets, as
participants have been reluctant to accept negative rates or to pass on these rates to their customers
and counterparties.
The rate cut seems to have been supportive of deeper integration among Treasury bill markets
with relatively strong credit ratings, although not fully converging with safe haven jurisdictions.
However, the risk profi les of Italian and Spanish Treasury bills as perceived by market participants
remained similar to each other also after the rate cut, and improved for both issuers after the
OMT announcement.
Regarding secured short-term markets, the spread on three-month repo rates for a large range of
countries narrowed. Negative correlation between rates in different countries points to a degree of
market segmentation, which became more apparent after the three-year LTRO reduced generalised
market stress. Following the ECB rate cut, the zero interest rate barrier came into play, encouraging
the search for positive yields outside safe haven jurisdictions, which moved into negative yield
territory, and thus mitigating market segmentation.
Chart 40 Total private short-term debt by maturity range
(EUR billions)
0
50
100
150
200
250
300
350
400
450
500
0
50
100
150
200
250
300
350
400
450
500
Jan.2012 2013
Jan.Apr. July Oct.
0-3
10-40
41-100
101-200
4-9
201-366
original
maturity (days)
percentage volumes
as of 1 July 2012
21
34
24
4
11
5
percentage volumes
as of 8 March 2013
19
31
24
3
19
4.5
Source: ECB.Note: Credit institutions, highest rated, amount outstanding.

85ECB
Financial integration in Europe
April 2013
SPECIAL FEATURE A
Regarding the short-term interbank market, the spread between EONIA and the deposit facility
rate remained low but resilient, even if excess liquidity is gradually compressing it. The banks’
margin compression due to the zero rate may have stirred a brisker search for yield, depending on
counterparties’ internal limit constraints.
STEP data on commercial paper point to increased issuance after the rate cut from counterparties
with lower credit ratings but not located in countries affected by market stress, e.g. French, Belgian
and Dutch counterparties. It also points to an increased search for yield through maturity extension.
Italian and Spanish issuances increased somewhat, but only after the OMT announcement.
The OMT announcement supported the low interest rate environment in improving market
integration. With regard to fi nancial integration, low interest rates appeared to support the
convergence of prices or rates in markets with similar or close risk profi les, but had little impact on
markets with higher perceived risk profi les. For these assets, the observed effects seem to have been
more infl uenced by the OMT announcement. The ECB’s commitment seems to have reduced the
perceived riskiness of many euro area assets and extended the search for yield to a more diverse set
of instruments and countries, thereby contributing to a convergence in rates. It also led to a decline
in the need for safe haven assets, which also supported market convergence.
The results of this study should be interpreted cautiously. Since the introduction of the full allotment
at fi xed rate, the Eurosystem, in large part, replaced the money market as refl ected in the sharp
decrease in money market turnover, especially in the longer maturities. Without the Eurosystem
participation in the market, developments in term of euro area money market segmentation could
have been different.
86ECB
Financial integration in Europe
April 2013
B. THE INTEGRATION OF THE EURO RETAIL PAYMENTS MARKET – SEPA AND BEYOND18
The aim of the Single Euro Payments Area (SEPA) is to enable individuals, businesses and public administrations to make cashless payments in euro throughout Europe from a single payment account anywhere in Europe using a single set of payments instruments as easily, effi ciently and safely as they can make them today at the national level.The creation of SEPA has led to a number of improvements in terms of both the effi ciency and the security of cashless retail payments. Further benefi ts are expected to emerge once the migration process has been fi nalised.From a macroeconomic perspective, the realisation of a more effi cient retail payments market through SEPA can facilitate trade, increase competition and innovation, foster fi nancial integration, and add to the completion of the single currency (and monetary union). Thus, it is an important tool for strengthening EU competitiveness and growth.By 1 February 2014, domestic credit transfer and direct debit schemes in the euro area will have to be replaced by truly pan-European ones. Moreover, industry and regulators are working towards the realisation of a SEPA for cards. Last, but not least, innovative retail payment solutions in the domain of internet and mobile payments are emerging to accommodate e-commerce and changing customer needs in the digital era.In the last few years, many non-EU countries have shown great interest in the development of pan-European retail payment solutions as a possible model for modernising their retail payment infrastructures. This shows that the importance of SEPA as a major project for fi nancial integration reaches well beyond the euro area and Europe.
1 WHY SEPA IS A MAJOR DRIVER OF EURO AREA FINANCIAL INTEGRATION
AND HOW IT HAS EVOLVED
The integration of the retail payments market is deeply embedded in the general economic, social
and political context of Europe. For the past 50 years, increasing economic integration has strongly
supported political reconciliation and social stability in Europe. In 1957 the Treaty of Rome laid the
cornerstone for the creation of a single economic market with the free movement of people, goods,
capital and services. The Single Market was realised in 1992. In the same year, the Maastricht
Treaty set out to create Economic and Monetary Union (EMU) as the next stage of integration,
providing the legal foundation for a single European currency. In 1999 the single currency, the euro,
was introduced. The exchange rates of the currencies of the Member States initially participating in
the third stage of EMU were irrevocably fi xed, and the conduct of a single monetary policy under
the responsibility of the ECB began. In 2002, the single currency became a tangible reality with the
introduction of euro banknotes and coins. Today, 332 million Europeans in 17 countries can pay
using the same banknotes and coins everywhere in the euro area.
Over the years, trade in goods and services between EU countries has been growing steadily.
Unfortunately, making payments for goods and services traded across borders has remained slower,
more cumbersome and much more expensive than making national payments. This is due to the
fact that retail payments are based on national payment instruments, national standards and national
payment systems. For cross-border payments, these national instruments, standards and systems
cannot be used. Consequently, corporates active in several European countries have had to maintain
This Special Feature was prepared by: M. Hempel and R.B. Choudhury prepared Box 1.18
87ECB
Financial integration in Europe
April 2013
SPECIAL FEATURE B
accounts in all the countries in which they do business. For all these years, what has been missing is
a “single market for cashless payments” that allows payments for goods and services traded across
Europe to be made at the same cost and in the same simple and effi cient way that is possible at the
national level.
A single, harmonised market for cashless retail payments not only makes cross-border payments
less costly and less cumbersome to consumers, merchants and corporates, it also gives them greater
choice, by opening up the provision of retail payment services to cross-border competition. Payment
service providers, retail payment infrastructures and (professional) users may fi nd opportunities for
consolidation, interoperability, realising economies of scale and reducing operational costs.
The origins of the SEPA initiative can be traced back to the late 1990s. In 1999, the Eurosystem,
in line with its statutory task of promoting the smooth operation of payment systems, as laid down
in Article 127(2) of the Treaty on the Functioning of the European Union 19 and Article 3.1 of the
Protocol on the Statute of the ESCB and of the ECB,20 drew up a set of objectives for cross-border
retail payments, calling on the banking and payment service industry to fulfi l these objectives
within a given period.21 Additional pressure was put on the banking and payment service industry
by Regulation (EC) No 2560/2001 on cross-border payments in euro.22 The Regulation eliminated
price differences for end-users between cross-border and domestic retail payments in euro, provided
certain conditions were met. This now applies to credit transfers, direct debits, cash withdrawals at
cash dispensers, and payments using debit and credit cards.
The banking sector responded in 2002 with a roadmap entitled “Euroland: Our Single Payments
Area!”, and established the European Payments Council (EPC). The EPC is the decision-making
and coordination body of the European banking industry in relation to payments. It consists of
74 members representing banks, banking communities and payment institutions active in the EU,
Iceland, Norway, Liechtenstein, Monaco and Switzerland. The EPC develops the payment schemes
and frameworks which help to realise the integration of the euro retail payments market.
Overall, the aim of SEPA is to enable individuals, businesses and public administrations to make
cashless payments in euro throughout Europe from a single payment account anywhere in Europe
using a single set of payments instruments as easily, effi ciently and safely as they can make them
today at the national level. For that purpose, the EPC created the SEPA credit transfer (SCT) and
the SEPA direct debit (SDD) rulebooks and the SEPA cards framework.
Given that SEPA is closely linked to the political and social ambition of a more integrated,
competitive and innovative Europe, it soon became clear that the actual migration to the use of
SEPA instruments required a closer involvement of actors on the demand side, a broader governance
structure and legislative support from the regulators. Whereas the harmonisation of the legal
environment for payment services has been achieved mainly by means of the Payment Services
Directive (PSD) 23 and the harmonisation of rules and standards has been undertaken by the banking
See Consolidated versions of the Treaty on European Union and the Treaty on the Functioning of the European Union 19
(OJ C 115, 9.5.2008, p. 1).
The Protocol on the Statute of the European System of Central Banks and of the European Central Bank is annexed to and forms an 20
integral part of the Treaty on the European Union and the Treaty on the Functioning of the European Union.
See 21 Improving cross-border retail payment services – the Eurosystem’s view, ECB, September 1999.
Regulation (EC) No 2560/2001 of the European Parliament and of the Council of 19 December 2001 on cross-border payments in euro 22
(OJ L 344, 28.12.2001, p. 13) – repealed by Regulation (EC) No 924/2009.
Directive 2007/64/EC of the European Parliament and of the Council of 13 November 2007 on payment services in the internal market 23
(OJ L 319 of 5.12.2007, p. 1).
88ECB
Financial integration in Europe
April 2013
industry, the Eurosystem has contributed as a facilitator by promoting private sector action, helping
to overcome coordination problems, seeking to involve all relevant stakeholders and, in cooperation
with the European Commission, setting public policy objectives. It has provided guidance to the
payments industry and other stakeholders through a wide range of activities (e.g. reports, speeches,
conferences and discussion fora), provided information and support to EU legislators, and issued
opinions on legal initiatives. This helped pave the way for the banking industry to deliver the SCT
and SDD schemes in 2008 and 2009.
To ensure that migration to the SEPA schemes takes place in a timely manner, in its 6th SEPA
Progress Report, issued on 24 November 2008, the Eurosystem drew attention to the need to set an
ambitious but realistic end-date for the migration to the SCT and SDD schemes. Following intense
debate between the Eurosystem, the European Commission and the market, the SEPA migration end-
date Regulation 24 was adopted by the European Parliament and the Council and entered into force
in March 2012. The regulation lays down rules for the initiation and processing of credit transfers
and direct debits denominated in euro within the European Union. It also defi nes a clear timeline
for the implementation of these rules. For the euro area, the fi nal deadline is 1 February 2014.
The deadline for euro-denominated payments in non-euro area EU countries is 31 October 2016.
By these dates, existing national euro credit transfer and direct debit schemes will have been phased
out and replaced by the SEPA-compliant alternatives. The ECB had welcomed and supported the
legislative proposal in its Opinion of 7 April 2011.25
The ECB investigated the social and private costs of cash and retail payment instruments and
published its study in September 2012.26 The study, which was conducted in cooperation with
13 NCBs and was the fi rst European study in this area, established that the social costs are
substantial, amounting to €45 billion, or 0.96% of GDP, for the 13 EU countries covered.
Extrapolating the results to cover the 27 EU Member States, the social costs of retail payment
instruments are close to 1% of GDP or €130 billion. Private costs are those incurred by individual
participants in the payments chain – including items such as transportation of cash, management of
electronic transactions, acquisition of new customers, credit risk analysis, provision of terminals,
fraud prevention, and fees paid to other participants in the payment chain. Social costs are defi ned
as the aggregate costs to society as a whole, which, by defi nition, excludes the fees paid to other
participants in the payment chain. Half of these social costs are incurred by banks and interbank
infrastructure providers, while retailers bear 46%. The social costs related to central banks and
cash-in-transit companies account for 3% and 1% respectively.
Based on a representative sample, the study fi nds that cash payments account for nearly half of the
total social costs. As the most commonly used payment method, cash payments have on average the
lowest social costs per transaction, followed closely by debit card payments. However, debit card
payments have on average the lowest social costs per euro transaction value. Cheques are the most
expensive form of payment. The unit cost for the respective instruments in the different countries
depends on characteristics specifi c to each country’s payment system, on the market size and level
of development, and on payment behaviour. Economies of scale seem to be present in the provision
of retail payment services for almost all payment instruments.
Regulation (EU) No 260/2012 of the European Parliament and of the Council of 14 March 2012 establishing technical and business 24
requirements for credit transfers and direct debits in euro and amending Regulation (EC) No 924/2009 (OJ L 94, 30.3.2012, p. 22).
The regulation has EEA relevance.
Opinion of the European Central Bank on a proposal for a Regulation establishing technical requirements for credit transfers and direct 25
debits in euro (CON/2011/32).
Schmiedel, H., Kostova, G. and Ruttenberg, W., “The social and private costs of retail payment instruments: a European perspective”, 26
Occasional Paper Series, No 137, ECB, September 2012.

89ECB
Financial integration in Europe
April 2013
SPECIAL FEATURE B
The results from the present study may trigger a constructive debate about which policy measures
and payment instruments are suitable for improving social welfare and realising potential cost
savings along the transaction value chain. It also indicates that the decision by the banking industry
not to support the cross-border use of cheques in SEPA was a wise one.
2 MAJOR BENEFITS FROM THE CREATION OF SEPA
The creation of SEPA has led to a number of improvements in terms of both effi ciency and security.
Before SEPA, domestic and cross-border retail payments were based on different standards,
different rules and different procedures. Consumers had to use different forms and provide different
account details depending on whether they wanted to make a credit transfer within their home
country or to a payment recipient in another euro area country. Consumers also had to use different
Table 1 SEPA key facts, figures and dates
Geographical coverage EU 27 + Iceland, Liechtenstein, Monaco, Norway and Switzerland
Number of payments affected by SEPA in the euro area About 17 billion credit transfers, 18 billion direct debits and
22 billion card payments per year (Statistical Data Warehouse 2011)
Legal basis Directive 2007/64/EC on payment services in the internal market (the Payment Services Directive)
Regulation (EC) No 924/2009 on cross-border payments in the Community and repealing Regulation (EC) No 2560/2001
Regulation (EU) No 260/2012 establishing technical and business requirements for credit transfers and direct debits in euro and
amending Regulation (EC) No 924/2009
SEPA instruments SEPA credit transfer (SCT) provides customers with a single means of transferring funds regardless of whether it involves a domestic
or a cross-border payment.
SEPA direct debit (SDD) makes it possible, for the fi rst time, to charge directly an account in one European country for services provided
by a company based in another European country.
SEPA for cards will enable consumers to use the same cards they use in their own country for purchases and cash withdrawals anywhere
in Europe more conveniently; for merchants, accepting cards will become easier and more attractive.
SEPA standards ISO 20022 XML
IBAN (BIC no longer required for domestic payments after 1 February 2014 or for cross-border payments after 1 February 2016)
EMV and other standards for cards, payment terminals and ATMs
SEPA documentation SEPA credit transfer Rulebook and Implementation Guidelines by the EPC
SEPA direct debit Rulebooks (Core and Business-to-Business) and Implementation Guidelines by the EPC
SEPA Cards Framework by the EPC
SEPA Cards Standardisation Volume, published by the EPC and maintained and endorsed by the Cards Stakeholders Group (CSG)
SEPA credit transfer launch date and current level of usage 28 January 2008; 34.9% of credit transfers in the euro area are SCT (December 2012)
SEPA direct debit launch date and current level of usage 2 November 2009; 1.9% of direct debits in the euro area are SDD (December 2012)
Reachability Deadline for payment service providers to ensure that all payee payment accounts reachable for national credit transfers and all payer
payment accounts reachable for national direct debits are also reachable via EU-wide SCT or SDD schemes
31 March 2012
Migration deadline for SCT and SDD within the euro area; no BIC (business identifi er code) to be required for national payments1 February 2014
No BIC to be required for cross-border payments; niche products migration complete1 February 2016
Migration deadline for SCT and SDD for non-euro area SEPA countries31 October 2016

90ECB
Financial integration in Europe
April 2013
cards depending on whether they were in their home country or abroad. Citizens working abroad
for some time needed to have different bank accounts in their home country and their working
country. Cross-border direct debits did not exist.
In SEPA, one payment account, one type of credit transfer, one type of direct debit and one
card – limited only by brand acceptance on the part of the merchant – suffi ce for making payments.
This brings a large potential for effi ciency gains for everybody involved in the payments chain,
including retail payments infrastructures providing processing, clearing or settlement services.
SEPA will help corporates to optimise the handling of payments through the adoption of a single
format in the back-offi ce procedures and the integration with other advanced services such as
e-invoicing or automated reconciliation. Banks will be able to offer their services more easily to
customers throughout the euro area. They will also gain in effi ciency thanks to the management of
all payments, national and cross border, on a common platform.
As regards the pricing of retail payment services, the Regulation on cross-border payments
eliminated differences in charges for cross-border and national payments in euro. As a result,
average fees for cross-border transfers declined by 90% between 2001 and 2005.27 However,
across countries, the fee structure for payments is still far from homogenous. This may be one
of the reasons why usage of non-cash payment instruments varies so widely, with the number of
cashless payment transactions per capita in Nordic countries being fi ve to six times as high as in
some southern European countries. However, it is expected that once SEPA migration is fi nalised,
more price convergence between countries will materialise. Wider competition is a key factor here.
For instance, direct debit creditors (e.g. utility companies) may be induced to move their direct
debits to a payment service provider from another country if that service provider offers a better
deal. This was not possible in the past.
The creation of SEPA, supported by the new legal framework introduced by the PSD, has also
brought down execution times for retail payments. Since the early 1990s, average execution times
for retail payments in the EU have decreased from about fi ve days to no more than one day. In fact,
since 1 January 2012, the PSD has obliged payment service providers to make funds accessible to
the recipient by the end of the next business day after a payment order is received. Thus, consumers
can be assured access to their funds on day D+1. In some European countries, even faster payment
services with almost immediate availability are being offered or are currently under development.
Ensuring the security of retail payments is a key factor for consumers and businesses in establishing
their trust and confi dence in retail payment instruments. Card fraud in particular has generated many
negative headlines in the press and potentially undermines the trust and confi dence of consumers
and businesses.
In SEPA, the total level of card fraud amounted to €1.26 billion in 2010. Card fraud in relative
terms (i.e. the share of fraud in the overall value of all transactions) fell from 0.045% in 2007 to
0.040% in 2010, after having reached 0.050% in 2009.28 The main reasons why fraud at automated
teller machines (ATMs) and point-of-sale (POS) terminals was lower in 2010 than in 2007 are the
improvements in the security of cards and the underlying payment infrastructure. The most
See “Commission Staff Working Document addressed to the European Parliament and to the Council on the impact of Regulation (EC) 27
No 2560/2001 on bank charges for national payments”, European Commission, July 2006, available on the European Commission’s
website (http://ec.europa.eu).
See 28 Report on card fraud, ECB, July 2012.

91ECB
Financial integration in Europe
April 2013
SPECIAL FEATURE B
important enhancement was the wider adoption
of EMV, a chip-based standard. This offers
stronger security features than conventional
magnetic stripes both for the physical card
(since, unlike the stripes, the chip cannot easily
be duplicated) and for the technological
infrastructure behind the transaction. The
adoption of these safety features has been
recommended by the ECB and forms part of
the SEPA migration.
However, card-not-present transactions
(i.e. card payments via mail, telephone or the
internet) do not benefi t from these security
enhancements, and in this domain fraud has
been on an upward trend in both absolute and
relative terms (see also the text on SecuRe Pay
in Section 4 below).
From a macroeconomic perspective, the
realisation of a more effi cient retail payments
market through SEPA can facilitate trade, increase competition and innovation, foster fi nancial
integration, and add to the completion of the single currency (and monetary union). Thus, it is an
important tool for strengthening EU competitiveness and growth.
Furthermore, an effi cient retail payments market is associated with higher bank stability, as retail
banking and retail payments activities generate regular and stable revenue streams for banks.
From a cost/benefi t perspective, banks perform better in countries with more developed retail
payment services.29
3 THE REMAINING CHALLENGES IN SEPA
The SEPA migration countdown is running fast. By 1 February 2014, domestic credit transfers
and direct debits in the euro area will have to be replaced by truly pan-European ones. Despite
the legal certainty provided by the SEPA migration end-date Regulation, and despite all the
efforts made so far by public authorities, the fi nancial industry, individual end-users and end-user
groups, this process can by no means be taken for granted and additional actions need to be taken.
Communication will play a key role in ensuring successful migration.
The migration fi gures speak for themselves. In December 2012, SCT had a 34.9% share of credit
transfers in the euro area.30 At individual country level, fi gures vary greatly. In some countries, SCT
migration is fi nalised or almost fi nalised (e.g. Finland, Slovenia and Luxembourg). In others, it is
far advanced (e.g. Belgium and Greece). However, a considerable number of countries have opted
to migrate in one big move, which is not without its challenges.
Hasan, I., Schmiedel, H. and Song, L., “Return to retail banking and payments”, 29 Working Paper Series, No 1135, ECB, December 2009.
See Chart 33 in the Statistical Annex.30
Chart 41 EMV transactions in the euro area
(percentage of total transactions at POS terminals)
0
20
40
60
80
100
0
20
40
60
80
100
EMV transactions in the euro area
2008 2009 2010 2011 2012
Source: ECB.

92ECB
Financial integration in Europe
April 2013
This is even truer for SDD. In December 2012, SDD had only a 1.9% share of direct debits in the
euro area.31 With the exception of a few countries in which there has been noticeable progress
(e.g. Belgium, Greece, Malta and Austria), SDD migration will have to move from virtually zero
now to 100% by 1 February 2014.
But migration is about more than fi gures, technicalities and IT systems. It also has to address issues
deeply rooted in the mind-sets of individuals. For example, a consumer currently using direct
debits in his own country has to be perfectly comfortable with the notion that a creditor (such as an
electricity provider or mobile phone company) may debit his account via a bank in another SEPA
country. If this is not accepted, one of the principal goals of SEPA will not be fully achieved,
namely the elimination of differentiation between national and cross-border payments in euro.
Beyond the migration to SCT and SDD, another important area in which further work is clearly
needed is SEPA for cards. In general, the requirements which the European card market (or, indeed,
any well-functioning and competitive card market) must fulfi l, irrespective of the number of card
schemes offered in the market, are: i) the separation of card schemes and processing entities,
ii) the creation of a framework for the processing of card transactions, iii) cards standardisation,
iv) no geographic restrictions on issuing, acquiring and/or licensing, and v) the establishment of a
certifi cation framework for cards and terminals. The work currently under way in these areas must be
fi nalised by the industry in line with guidance of the Eurosystem and the European Commission.
Card payments are one of the key issues in the European Commission’s Green Paper “Towards an
integrated European market for card, internet and mobile payments” which was published in January
2012 for public consultation.32 The Eurosystem provided its reaction to the Green Paper in March
2012.33 It is expected that in 2013 the European Commission will launch legal initiatives relating to
cards as a follow up in the context of the Single Market Act II,34 the Green Paper and the forthcoming
review of the PSD.
To improve governance of SEPA, in particular the involvement of corporates, consumers and
merchants, the Eurosystem promoted the creation of a European social forum for retail payments.
This led to the establishment of the SEPA Council in 2010. The SEPA Council consists of high level
representatives from both the demand and supply sides of the European retail payments market.
Its objective is to foster consensus on the next steps towards the realisation of SEPA and an integrated
retail payments market. The SEPA Council is co-chaired by the ECB and the European Commission.
SEPA is a major European project for fi nancial integration. Successful migration is a key issue
for its credibility as well as for future projects. The Eurosystem is committed to support SEPA
migration through active communication at national and European level.
See Chart 33 in the Statistical Annex.31
Green Paper – Towards an integrated European market for card, internet and mobile payments, COM(2011) 941 fi nal, 11 January 2012.32
“Eurosystem reaction to the Commission’s Green Paper ‘Towards an integrated European market for card, internet and mobile payments’”, 33
ECB, 23 March 2012, available on the ECB’s website.
Communication from the Commission to the European Parliament, the Council, the European Economic and Social Committee and the 34
Committee of the Regions – Single Market Act II – Together for new growth, COM(2012) 573 fi nal, 3 October 2012.
93ECB
Financial integration in Europe
April 2013
SPECIAL FEATURE B
4 LOOKING FORWARD TO THE NEXT GENERATION OF RETAIL PAYMENTS
Beyond the core SEPA payment instruments, innovative retail payment solutions in the domain
of internet and mobile payments are emerging to accommodate changing customer needs in the
digital era – being online anytime, anywhere, with any device. However, with the exception of a
few successful national initiatives, the development, rollout and usage of genuine internet payment
solutions have not kept pace with the rapid growth of e-commerce. In the fi eld of mobile payments,
smaller pilot projects have been organised in several European countries, sometimes followed by
actual deployments. Overall, the Eurosystem is concerned that too little attention is being paid to
technical standardisation and business interoperability, which will be key factors of success also in
these areas of SEPA, thus possibly recreating the same fragmentation which SEPA was designed to
eliminate.
Strong governance is needed in the retail payments market to overcome the current fragmentation
and push for adequate Europe-wide solutions (irrespective of country of origin). Strong governance
is also needed because innovative services relating to payments are often provided outside the
banking industry by licensed and non-licensed entities. Payment initiation services provided by
third parties are rapidly gaining in importance and are the subject of extensive debate. The extent of
payment account access, the appropriate legal and regulatory framework, the need for contractual
agreements, costs related to providing access, data protection and consumer rights are issues that
need to be addressed at policy level in order to create and maintain a level playing fi eld for all types
of payment service providers.
Regardless of the type of service, ensuring the safety and reliability of innovative payment products
and payment initiation channels is of primary importance. Customer and payment data need to
be properly protected, and fraud needs to be prevented at all stages of the payment chain. In fact,
security is one of the features that can “make or break” innovative payment solutions.
In April 2012, the European Forum on the Security of Retail Payments (SecuRe Pay), a voluntary
cooperation among overseers and supervisors of payment service providers in the EU, launched a
public consultation on recommendations for the security of internet payments. The fi nal version
was published in January 2013.35 These harmonised, minimum security recommendations will
be integrated into the existing supervisory and oversight framework. As a next step, SecuRe
Pay will complement these recommendations with recommendations to improve the security of
payment account access services provided by third parties, on which a public consultation was
launched in January 2013. Last, but not least, SecuRe Pay has also started addressing the security
of mobile payments.
Obviously, the development of innovative retail payment solutions is not limited by the borders of
either the euro area or the EU. At the global level, the ECB and seven NCBs contributed to the
work of the Committee on Payment and Settlement Systems (CPSS), whose Working Group on
Innovations in Retail Payments produced a report which was published in May 2012.36 The report
provides an overview of innovative retail payment activities in CPSS countries and other selected
countries, identifi es a number of exogenous and endogenous factors that could serve as drivers for
retail payment innovations or as barriers to them, gives some pointers as to what can be expected
over the next fi ve years and identifi es a number of issues for central banks in connection with their
Recommendations for the security of internet payments35 , ECB, January 2013.
Innovations in retail payments – Report of the Working Group on Innovations in Retail Payments36 , Committee on Payment and Settlement
Systems, May 2012.
94ECB
Financial integration in Europe
April 2013
various tasks and responsibilities as catalysts, overseers and/or operators of payment systems.
The ECB and the seven NCBs will also actively contribute to the work of a new CPSS Working
Group on non-banks in retail payments. In addition, the ECB is one of the fi rst public authorities to
have published a report on virtual currency schemes.37
As they seek to strengthen the formal fi nancial sector, and improve fi nancial inclusion and effi ciency,
many non-EU countries have shown great interest in the development of pan-European retail
payment solutions as a possible model for modernising their own retail payment infrastructure. This
shows that the importance of SEPA as a major project for fi nancial integration reaches well beyond
the euro area and Europe.
Virtual currency schemes37 , ECB, October 2012.
Box 1
SEPA AND THE ECB’S PAYMENTS STATISTICS
In 1992, the Committee of Governors of the central banks of the Member States of the European
Economic Community published the fi rst statistics on payment systems in the European
Community, covering the period 1989-1990.1 In the following years, this publication, commonly
referred to as the “Blue Book”, was regularly updated with statistical addenda for subsequent
periods. However, since 2006, the ECB has published a comprehensive set of payments statistics
encompassing EU and euro area aggregates, as well as individual country data on payments
instruments, terminals and infrastructures in time-series format. A major enhancement is that
all the time-series are based on harmonised defi nitions starting from the year 2000. The data are
available with an annual frequency and published around nine months after the year to which
they refer. The latest vintage spans the period 2000 to 2011.2 Payments statistics are collected
from the Eurosystem on the basis of Guideline ECB/2007/9 on monetary, fi nancial institutions
and markets statistics; the main reporting agents are credit institutions, interbank funds transfer
systems (IFTSs)/processors and, to a lesser extent, payments institutions (and other payment
service providers) as well as card schemes and trade associations.
To date, the payments statistics provide a relatively complete coverage of the European cashless
retail payments market. They have been used for a variety of purposes, including as an input for
monitoring the ongoing process of fi nancial integration in the euro area. As the aim of SEPA
is to harmonise the facilities offered to customers in the fi eld of retail payments, and as its
implementation is under way and other developments are gaining in signifi cance in the European
payments landscape, it has become necessary to review the scope and content of the current
data collection so as to ensure that the payments statistics remain relevant and in line with the
evolving needs of users.
1 “Payment Systems in EC Member States”, prepared by an ad hoc working group on EC payment systems, Committee of Governors of
the central banks of the Member States of the European Economic Community, September 1992.
2 See ECB press releases on payments statistics, available on the ECB’s website at http://www.ecb.europa.eu/press/pr/stats/paysec/html/
index.en.html.
95ECB
Financial integration in Europe
April 2013
SPECIAL FEATURE B
On this basis, a “merits and costs procedure”3 was launched at the end of 2011. Such a procedure
is required when the production of new or substantially enhanced statistics is expected to have a
signifi cant impact on reporting agents. This is the case with payments statistics, where, on account
of the need to keep pace with and monitor developments in the area of payments, the following
categories of changes in the reporting framework were identifi ed: i) methodological changes;
ii) geographical breakdowns; iii) monitoring of non-SEPA transactions; iv) breakdowns by type
of initiation; and v) new information on payment service providers and payment services.
The merits and costs procedure is a structured exercise, with both quantitative and qualitative
elements. It helps set priorities and facilitates discussion with users and reporting agents.
It commences with the defi nition of new statistical requirements and ends with a fi nal decision
to be taken by the ECB Governing Council. Subsequently, it is planned that the enhanced set of
payments statistics will be collected from the year 2015 onwards, covering data for the reference
period 2014 onwards, thereby enabling all SEPA-compliant transactions to be identifi ed and
reported from the date of completion of SEPA migration. Transitional provisions may be applied
in 2014 to ensure continuity with the current time-series.
3 See “Quality assurance procedures within the ECB statistical function”, available on the ECB’s website at http://www.ecb.int/pub/pdf/
other/ecbstatisticsqualityassuranceprocedure200804en.pdf?961c97a04730565d43a600962ebb8a2a.
96ECB
Financial integration in Europe
April 2013
C. SECTORAL ACCOUNTS AND REBALANCING IN THE EURO AREA38
In a fi nancially integrated area comprising several countries, fi nancial defi cits (or surpluses) of a given sector in any country can, in principle, be fi nanced (or invested) equally well in any other country within the area. Following this line of reasoning, cross-country patterns in sectoral fi nancial balances can provide a complementary perspective on fi nancial integration. This Special Feature builds on the similar one already published in the 2012 Financial Integration Report, examining how aggregate and sectoral savings-investment imbalances have developed in euro area countries in the more recent quarters.The analysis suggests that the build-up of external defi cits and surpluses across euro area countries refl ected not only growth differentials, but also rising competitiveness imbalances, particularly measured by unit labour costs. This posed a challenge when cross-border funding dried up and the imbalances could no longer be fi nanced easily from the rest of the area.The growing unit labour cost gap indeed pointed at cumulative wage growth in excess of what could be supported by productivity gains, accordingly putting downward pressures on business margins that deteriorated in the external defi cit countries. These trends have been partially reversed in recent times in some external defi cit countries, notably those under an EU/IMF programme or under stress, with some further unwinding of imbalances in 2012.
1 INTRODUCTION
The traditional approach to international fi nance analysis, which uses balance of payments current
account data to measure imbalances across countries, can be enhanced by looking at sectoral accounts data
(“fl ow-of-funds” data), which show the contributions of the various domestic sectors to the external
defi cit/surplus. Using the euro area sectoral accounts (EAA), Chart 42.1 breaks down the euro
area external balance into the defi cits and surpluses (i.e. the net fi nancial balances, or net lending/
net borrowing) 39 of households, non-fi nancial corporations (NFCs), fi nancial corporations and
government sectors. Chart 42.1 illustrates that the 2006-08 boom was characterised in the euro area
by a strong increase in private sector net borrowing (mostly NFCs), which was then rapidly reversed
in 2008-10. This reversal found a counterpart in a considerable increase in net borrowing of the
government sector, in the absence of any signifi cant improvement in the euro area external balance.
In recent quarters, the external balance of the euro area improved, turning positive, refl ecting a
renewed swing into surplus by corporations and lower government defi cits.
However, these developments at euro area level mask developments within the area. In particular,
one may ask whether the fi nancial balances described above might refl ect a signifi cant “home bias”
(with, for example, defi cits in some sectors in a given country being fi nanced by surpluses in other
sectors resident in the same country).
38 This Special Feature was prepared by: Ph. de Rougemont, D. Sondermann and B. Pierluigi.
39 The net lending/net borrowing, or fi nancial surplus/defi cit, of a sector is the balance of its capital account and measures the excess of saving
and net capital transfers received over capital investments (net lending), or vice versa (net borrowing). It is also the difference between
the revenue and expenditure of each sector. It is also the balance of the fi nancial accounts of the sector, which measures the difference
between transactions in fi nancial assets and transactions in liabilities. See, for instance, Box 1 “Concepts used in sectoral accounts” in the
article entitled “The fi nancial crisis in the light of the euro area accounts: a fl ow-of-funds perspective” in the October 2011 issue of the
ECB’s Monthly Bulletin.
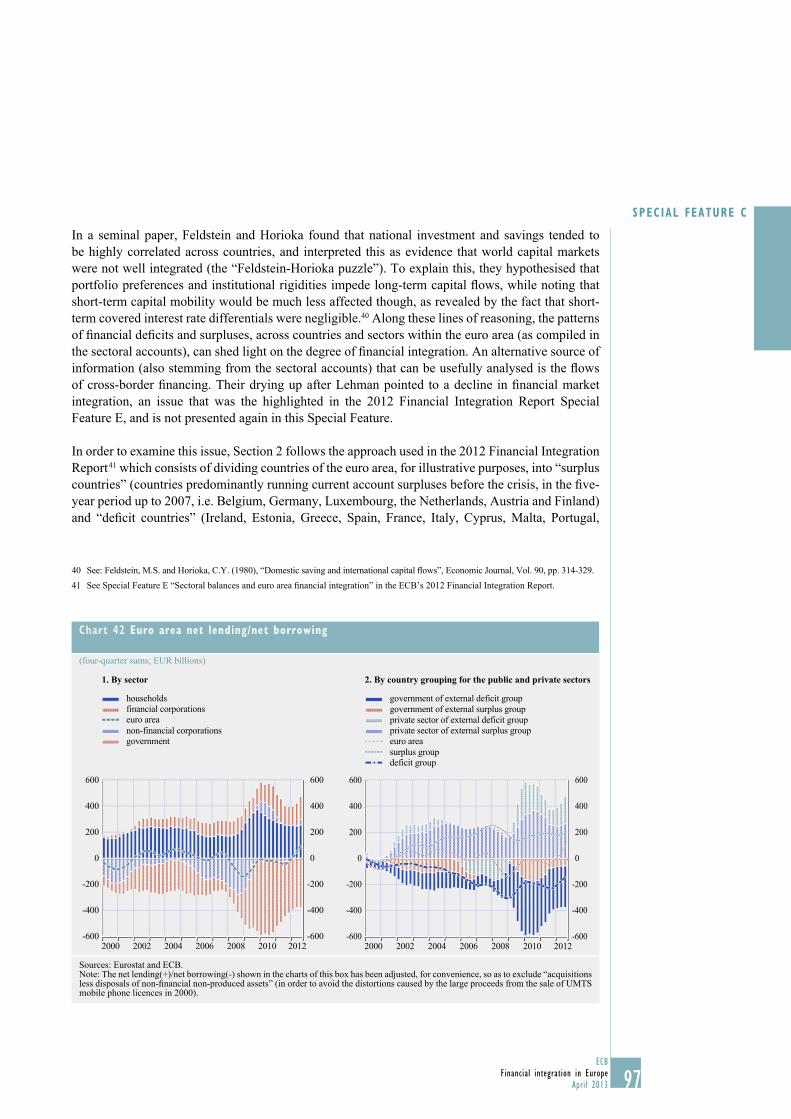
97ECB
Financial integration in Europe
April 2013
SPECIAL FEATURE C
In a seminal paper, Feldstein and Horioka found that national investment and savings tended to
be highly correlated across countries, and interpreted this as evidence that world capital markets
were not well integrated (the “Feldstein-Horioka puzzle”). To explain this, they hypothesised that
portfolio preferences and institutional rigidities impede long-term capital fl ows, while noting that
short-term capital mobility would be much less affected though, as revealed by the fact that short-
term covered interest rate differentials were negligible.40 Along these lines of reasoning, the patterns
of fi nancial defi cits and surpluses, across countries and sectors within the euro area (as compiled in
the sectoral accounts), can shed light on the degree of fi nancial integration. An alternative source of
information (also stemming from the sectoral accounts) that can be usefully analysed is the fl ows
of cross-border fi nancing. Their drying up after Lehman pointed to a decline in fi nancial market
integration, an issue that was the highlighted in the 2012 Financial Integration Report Special
Feature E, and is not presented again in this Special Feature.
In order to examine this issue, Section 2 follows the approach used in the 2012 Financial Integration
Report 41 which consists of dividing countries of the euro area, for illustrative purposes, into “surplus
countries” (countries predominantly running current account surpluses before the crisis, in the fi ve-
year period up to 2007, i.e. Belgium, Germany, Luxembourg, the Netherlands, Austria and Finland)
and “defi cit countries” (Ireland, Estonia, Greece, Spain, France, Italy, Cyprus, Malta, Portugal,
40 See: Feldstein, M.S. and Horioka, C.Y. (1980), “Domestic saving and international capital fl ows”, Economic Journal, Vol. 90, pp. 314-329.
41 See Special Feature E “Sectoral balances and euro area fi nancial integration” in the ECB’s 2012 Financial Integration Report.
Chart 42 Euro area net lending/net borrowing
(four-quarter sums; EUR billions)
1. By sector 2. By country grouping for the public and private sectors
-600
-400
-200
0
200
400
600
-600
-400
-200
0
200
400
600
2000 2002 2004 2006 2008 2010 2012
households
non-financial corporations
financial corporations
government
euro area
-600
-400
-200
0
200
400
600
-600
-400
-200
0
200
400
600
government of external deficit group
government of external surplus group
private sector of external deficit group
private sector of external surplus group
euro area
surplus groupdeficit group
2000 2002 2004 2006 2008 2010 2012
Sources: Eurostat and ECB.Note: The net lending(+)/net borrowing(-) shown in the charts of this box has been adjusted, for convenience, so as to exclude “acquisitions less disposals of non-fi nancial non-produced assets” (in order to avoid the distortions caused by the large proceeds from the sale of UMTS mobile phone licences in 2000).
98ECB
Financial integration in Europe
April 2013
Slovakia and Slovenia). 42 Subsections focus on the sectoral defi cit/surplus differentials between
surplus and defi cit countries, on the distinction between savings/investment differentials, and on
corporate margins.43 Section 3 looks at the countries in detail to determine the extent to which the
imbalances previously identifi ed have been corrected.
2 REGIONAL ANALYSIS OF SECTORAL ACCOUNTS
2.1 SECTORAL AND GEOGRAPHIC IMBALANCES
Chart 42.2 shows the fi nancial balances of the two country groupings defi ned above, distinguishing
between government sector and private sector balances.44 The green and blue dashed lines show
external balances for each grouping (broadly corresponding to the current account surplus for each
group). The red dashed line shows the total euro area external balance, as in Chart 42.1.
In the boom period that preceded the most acute phase of the fi nancial crisis and was characterised
by solid growth and wide macro imbalances in the euro area, increasing negative balances in the
defi cit countries, largely driven by the private sector in some of those countries, were matched
by strongly positive net private sector balances in the surplus countries. This fi nding could be
consistent with increased capital market integration45 and suggests that, during that period, a marked
(and unsustainable) economic expansion in the defi cit group was increasingly being fi nanced by
savings originating in the surplus group. This is confi rmed by a separate analysis on gross fi nancial
transactions (see the 2012 Financial Integration Report, in particular Chart 63).46 At the same time,
this could also be evidence of unsustainable “regional” booms facilitated by interest rates gradually
falling, owing to arbitrage, towards the average interest rate in the EMU, which with insight proved
excessively low for domestic conditions prevalent then in defi cit countries. In such a case, one
may expect capital fl ows from surplus countries (with still below EMU average interest rate) to
defi cit countries (with still higher than average interest rate). In this context, these developments
could thus also refl ect the adverse impact of “regional” demand booms and supply rigidities on
competitiveness in a context of insuffi ciently integrated labour and goods markets.
After 2008 the fi nancial defi cits of the private sectors of the defi cit countries sharply turned into
surpluses, accompanied by higher surpluses in the surplus countries, albeit to a lesser extent,
and matched by higher government defi cits across the board. On the one hand, this points to an
ongoing adjustment process, with increased saving and deleveraging in the private sector adversely
impacting on government accounts, particularly in the external defi cit countries, in a context of
impaired competitiveness. Impaired competitiveness limits the ability to offset the adverse impact
42 Each grouping is in fact rather heterogeneous in itself, comprising countries with very large external defi cits or surpluses and others with
nearly balanced current account positions. In addition, the countries differ considerably in other respects, such as the fi scal position or the
presence of specifi c boom-bust cycles. Obviously, the composition of the group is closely tied to the reference period and would change
over time. Germany, for instance, would have been in the “external defi cit group” if the exercise had been conducted in earlier years,
while Italy and France would have been in the surplus group.
43 See the box entitled “A sectoral account perspective of imbalances in the euro area” in the February 2012 issue of the ECB’s Monthly
Bulletin.
44 Private sector is defi ned here as the sum of all sectors other than the government sector.
45 For instance, Blanchard, O.J. and Giavazzi, F. suggested that such a process was at work in the case of Portugal and Greece in “Current
Account Defi cits in the Euro Area: The End of the Feldstein-Horioka Puzzle?” in Perry, G. and Brainard, W. (eds.), Brookings Papers on
Economic Activity, September 2002. Later on, Blanchard (2007) interpreted the considerable net borrowing as a sign of unsustainable
boom in “Adjustment in the euro area. The diffi cult case of Portugal”, Portoguese Economic Journal, 6.
46 See Special Feature E “Sectoral balances and euro area fi nancial integration” in the ECB’s 2012 Financial Integration Report.

99ECB
Financial integration in Europe
April 2013
SPECIAL FEATURE C
of deleveraging on domestic demand by increasing demand from non-residents. On the other hand,
it can also be interpreted as a sign of a drying up of cross-border fi nancing (as documented in
the 2012 Financial Integration Report Special Feature E), with an accompanying decline in fi nancial
market integration, as suggested by other indicators discussed in this report. At the euro area level,
in the absence of an improvement in the external balance (the solid central dashed line in Chart 42),
the counterpart to mounting private sector surpluses was rising government defi cits, in particular in
the defi cit countries, as a manifestation of the “paradox of thrift”.47
In more recent quarters, the euro area external balance turned into a surplus, an improvement
resulting mainly from developments in defi cit countries, primarily refl ecting falling activity and
increasing surpluses in the private sector (and to a lesser extent reduced government defi cits). The
external balance of the surplus countries hardly changed, perhaps as a result of a relatively tight
macroeconomic policy stance.
A more detailed sectoral decomposition of the differences in private sector balances between the
two country groupings can be seen in Chart 43 (here expressed in percentage of GDP). Overall, the
heterogeneity between country groupings seems most pronounced in the case of NFCs. Whereas the
NFCs in the external defi cit group maintained a traditional net borrowing position throughout the
period, those in the external surplus group experienced atypical, long-lasting net lending positions
beginning in 2003, positions of the kind that can be observed during recessions or that in principle
can be associated with strong foreign direct investment abroad. However, these net lending positions
were in practice more balanced by loans abroad (interbank) or portfolio investments.
47 It should be noted that this fundamental accounting constraint does not, in itself, indicate the direction of causality, i.e. whether the government
defi cits resulted from increased private surpluses/saving or, alternatively, whether the latter reacted to increased government defi cits.
Chart 43 Net lending/net borrowing by country grouping
(four-quarter sums; percentages of GDP)
government
financial corporations
non-financial corporations
households
total economy
1. External surplus group 2. External deficit group
-10
-8
-6
-4
-2
0
2
4
6
8
10
-10
-8
-6
-4
-2
0
2
4
6
8
10
2002 2003 2005 2007 2009 2011-10
-8
-6
-4
-2
0
2
4
6
8
10
-10
-8
-6
-4
-2
0
2
4
6
8
10
2002 2003 2005 2007 2009 2011
Sources: Eurostat and ECB.Note: The net lending(+)/net borrowing(-) shown in the charts of this box has been adjusted, for convenience, so as to exclude “acquisitions less disposals of non-fi nancial non-produced assets” (in order to avoid the distortions caused by the large proceeds from the sale of UMTS mobile phone licences in 2000).
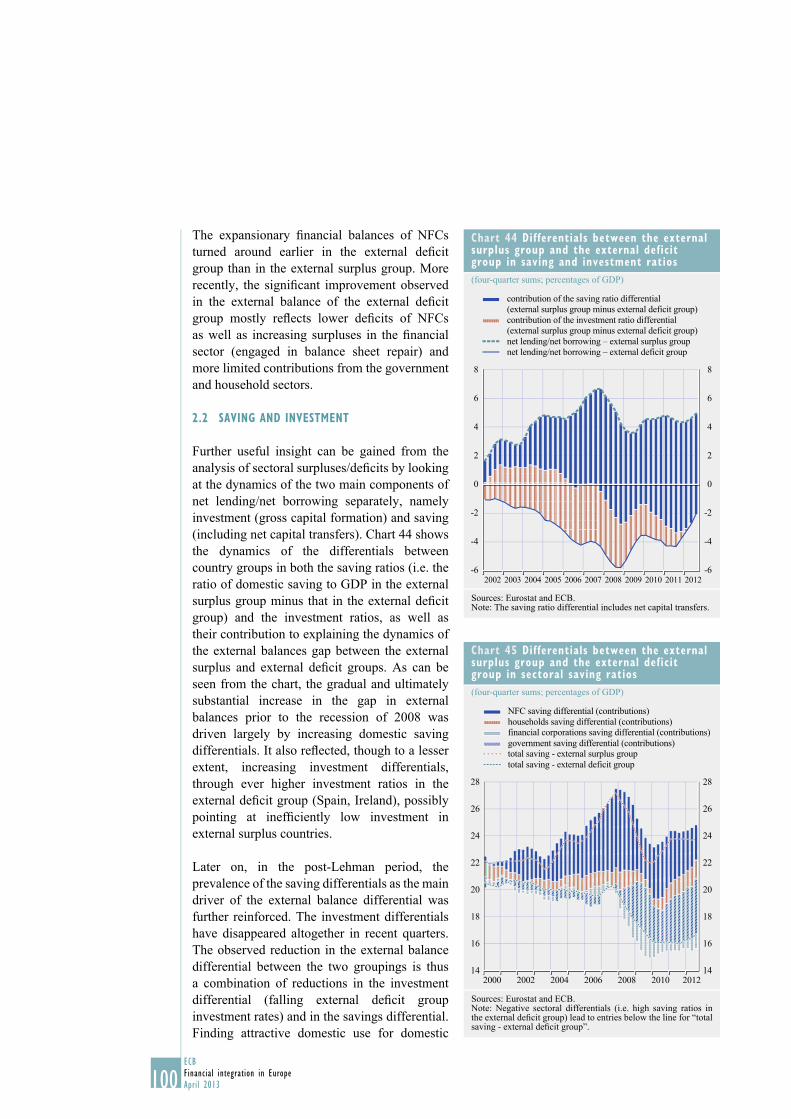
100ECB
Financial integration in Europe
April 2013
The expansionary fi nancial balances of NFCs
turned around earlier in the external defi cit
group than in the external surplus group. More
recently, the signifi cant improvement observed
in the external balance of the external defi cit
group mostly refl ects lower defi cits of NFCs
as well as increasing surpluses in the fi nancial
sector (engaged in balance sheet repair) and
more limited contributions from the government
and household sectors.
2.2 SAVING AND INVESTMENT
Further useful insight can be gained from the
analysis of sectoral surpluses/defi cits by looking
at the dynamics of the two main components of
net lending/net borrowing separately, namely
investment (gross capital formation) and saving
(including net capital transfers). Chart 44 shows
the dynamics of the differentials between
country groups in both the saving ratios (i.e. the
ratio of domestic saving to GDP in the external
surplus group minus that in the external defi cit
group) and the investment ratios, as well as
their contribution to explaining the dynamics of
the external balances gap between the external
surplus and external defi cit groups. As can be
seen from the chart, the gradual and ultimately
substantial increase in the gap in external
balances prior to the recession of 2008 was
driven largely by increasing domestic saving
differentials. It also refl ected, though to a lesser
extent, increasing investment differentials,
through ever higher investment ratios in the
external defi cit group (Spain, Ireland), possibly
pointing at ineffi ciently low investment in
external surplus countries.
Later on, in the post-Lehman period, the
prevalence of the saving differentials as the main
driver of the external balance differential was
further reinforced. The investment differentials
have disappeared altogether in recent quarters.
The observed reduction in the external balance
differential between the two groupings is thus
a combination of reductions in the investment
differential (falling external defi cit group
investment rates) and in the savings differential.
Finding attractive domestic use for domestic
Chart 44 Differentials between the external surplus group and the external deficit group in saving and investment ratios
(four-quarter sums; percentages of GDP)
-6
-4
-2
0
2
4
6
8
-6
-4
-2
0
2
4
6
8
2002 2003 2004 2005 2006 2007 2008 2009 2010 2011 2012
contribution of the saving ratio differential
(external surplus group minus external deficit group)
contribution of the investment ratio differential
(external surplus group minus external deficit group)
net lending/net borrowing – external surplus group
net lending/net borrowing – external deficit group
Sources: Eurostat and ECB.Note: The saving ratio differential includes net capital transfers.
Chart 45 Differentials between the external surplus group and the external deficit group in sectoral saving ratios
(four-quarter sums; percentages of GDP)
14
16
18
20
22
24
26
28
14
16
18
20
22
24
26
28
2000 2002 2004 2006 2008 2010 2012
NFC saving differential (contributions)
households saving differential (contributions)financial corporations saving differential (contributions)
government saving differential (contributions)total saving - external surplus group
total saving - external deficit group
Sources: Eurostat and ECB.Note: Negative sectoral differentials (i.e. high saving ratios in the external defi cit group) lead to entries below the line for “total saving - external defi cit group”.
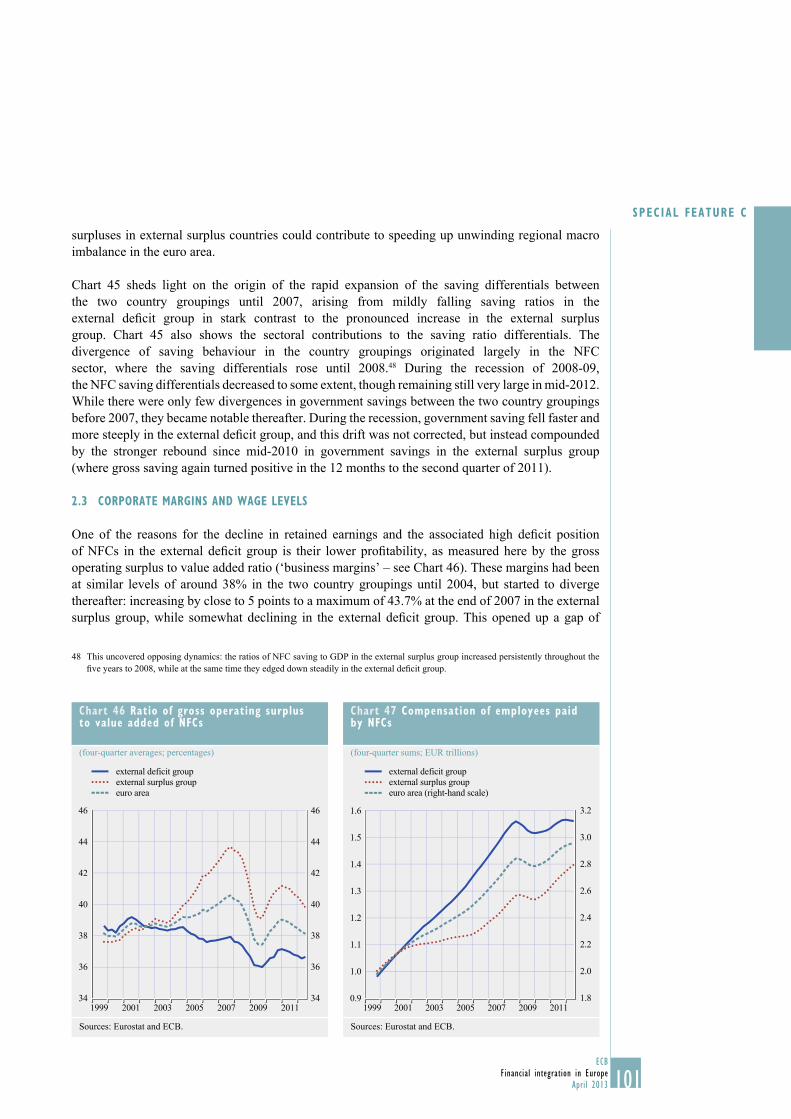
101ECB
Financial integration in Europe
April 2013
SPECIAL FEATURE C
surpluses in external surplus countries could contribute to speeding up unwinding regional macro
imbalance in the euro area.
Chart 45 sheds light on the origin of the rapid expansion of the saving differentials between
the two country groupings until 2007, arising from mildly falling saving ratios in the
external defi cit group in stark contrast to the pronounced increase in the external surplus
group. Chart 45 also shows the sectoral contributions to the saving ratio differentials. The
divergence of saving behaviour in the country groupings originated largely in the NFC
sector, where the saving differentials rose until 2008.48 During the recession of 2008-09,
the NFC saving differentials decreased to some extent, though remaining still very large in mid-2012.
While there were only few divergences in government savings between the two country groupings
before 2007, they became notable thereafter. During the recession, government saving fell faster and
more steeply in the external defi cit group, and this drift was not corrected, but instead compounded
by the stronger rebound since mid-2010 in government savings in the external surplus group
(where gross saving again turned positive in the 12 months to the second quarter of 2011).
2.3 CORPORATE MARGINS AND WAGE LEVELS
One of the reasons for the decline in retained earnings and the associated high defi cit position
of NFCs in the external defi cit group is their lower profi tability, as measured here by the gross
operating surplus to value added ratio (‘business margins’ – see Chart 46). These margins had been
at similar levels of around 38% in the two country groupings until 2004, but started to diverge
thereafter: increasing by close to 5 points to a maximum of 43.7% at the end of 2007 in the external
surplus group, while somewhat declining in the external defi cit group. This opened up a gap of
48 This uncovered opposing dynamics: the ratios of NFC saving to GDP in the external surplus group increased persistently throughout the
fi ve years to 2008, while at the same time they edged down steadily in the external defi cit group.
Chart 46 Ratio of gross operating surplus to value added of NFCs
(four-quarter averages; percentages)
34
36
38
40
42
44
46
34
36
38
40
42
44
46
1999 2001 2003 2005 2007 2009 2011
external deficit group
external surplus group
euro area
Sources: Eurostat and ECB.
Chart 47 Compensation of employees paid by NFCs
(four-quarter sums; EUR trillions)
1.8
2.0
2.2
2.4
2.6
2.8
3.0
3.2
0.9
1.0
1.1
1.2
1.3
1.4
1.5
1.6
1999 2001 2003 2005 2007 2009 2011
external deficit group
external surplus group
euro area (right-hand scale)
Sources: Eurostat and ECB.

102ECB
Financial integration in Europe
April 2013
almost 6 percentage points, which narrowed temporarily during the 2008-09 recession, but started
to widen again during the subsequent recovery. More recently, the gaps have narrowed somewhat,
as business margins in the external surplus group tended to fall slightly faster than in the external
defi cit group amidst the slowdown in activity. However, as of the third quarter of 2012, NFC
margins remain generally depressed in the external defi cit group, standing 3.1 percentage points
lower than in the external surplus group.
One of the main reasons for the lower corporate margins of the external defi cit group compared to the
external surplus group is to be found in the far larger increase in wages paid by businesses in the period
from 2000 to 2010 in the former group than in the latter (see Chart 47), an increase over and beyond what
would have been justifi ed by stronger output growth (both higher productivity and employment gains)
in those countries. Indeed, changes in total compensation of employees can be exactly decomposed (by
defi nition) into output growth in volume terms and changes in unit labour costs (ULC).
2.4 FROM COMPENSATION OF EMPLOYEES TO UNIT LABOUR COSTS
Chart 48 decomposes the evolution of the gap in compensation of employees between the external
surplus group and the external defi cit group (seen in the previous section) into a volume of activity
component and a ULC component. This is done in this section for the whole economy, rather than
only for NFCs, in the absence of volume indicators for NFC value added. Looking at the whole
economy may distort results, as developments in public wages can be signifi cantly different from
private wages. If the latter impacts directly on cost competitiveness, the former still impacts on it,
though indirectly (e.g. forcing increases in taxes to fund government expenditure).
In the external defi cit group, ULC rose by 28% in the ten years to 2010, compared with an increase
of less than 11% in the external surplus group. This gap refl ects wage growth in the external defi cit
group over the past ten years that exceeded that in the external surplus group by a large margin,
Chart 48 Index of compensation of employees (total economy) in the two country groupings, and the contributions of volume growth and ULC changes to the evolution of the gap
(index: March 2000 = 100)
100
110
120
130
140
150
160
100
110
120
130
140
150
160
unit labour costs growth differential (contribution)
GDP volume growth differential (contribution)
wages bill in external surplus groupwages bill in external deficit group
Jan. Nov. Jan. Nov. Jan. Nov.Mar.
2000 2001
Sep.
2002
July
2003
May
2004
Mar.
2005 2006
Sep.
2007
July
2008
May
2009
Mar.
2010 2011
Sep.
2012
Sources: Eurostat and ECB.

103ECB
Financial integration in Europe
April 2013
SPECIAL FEATURE C
leading to a loss of cost competitiveness. This in turn somewhat compressed corporate margins in
the external defi cit group, as businesses could not pass on all the cost increases in full, especially
in the case of exposed tradable goods and services.49 This macro perspective could be refi ned by
looking more specifi cally at the tradable goods, or at exporting fi rms (which typically have higher
productivity than the other fi rms).
Since 2010, the differential in the wage bill reduced somewhat between the two groups, refl ecting
to a large extent a differential in economic growth as well as some reduction in ULC differentials.
This aggregate picture for the two country groupings, however, conceals signifi cant differences
among external defi cit countries, as the next section shows.
3 REBALANCING OF PRICE/COST COMPETITIVENESS IN EURO AREA COUNTRIES
As stressed in the previous section, euro area countries have witnessed growing labour
cost differentials since the inception of Economic and Monetary Union (Chart 49). These
differentials were related, in the defi cit countries, to the accumulation of domestic imbalances
and corresponding excessive wage growth, but also to persistent weakness in productivity and
trend growth.50
Since 2008 a price/cost competitiveness
adjustment51 process has been underway in the
external defi cit countries that had accumulated
signifi cant imbalances. This is refl ected in falling
ULC, particularly in the euro area countries
under a full EU/IMF-programme (i.e. Greece,
Ireland and Portugal), and to a lesser extent
Spain. However, up until 2011 the adjustment
was mainly achieved via signifi cant labour
shedding, rather than via a signifi cant reduction
in wages, while unit labour costs have continued
to rise in France and Italy.
The unwinding of macroeconomic imbalances
in the euro area continued in 2012.52 Most of
the euro area countries that had experienced
excessive domestic demand and substantial
losses in price and cost competitiveness prior to
the inception of the crisis have improved their
49 Even if the higher nominal wage increases in the external defi cit group refl ected, merely or mostly, higher domestic infl ation, this
nonetheless caused a deterioration in competitiveness and thus additional pressures on the margins of businesses exposed to international
competitors (including those in the other grouping of the euro area).
50 In a number of countries, the change in ULC over 1999-2008 may present a distorted picture owing to a number of factors: (1) mere
composition effects, such as change in employment encompassing less productive workers or sectors (less educated workers, construction),
as unemployment rate fell to very low levels; (2) the starting point of 1999 may have been of high competitiveness; (3) transfer pricing
that may distort data; (4) increased intermediated inputs (via off-shoring).
51 Non-price competitiveness is also important for assessing overall competitiveness, such as taking into account quality (when not included
in hedonic adjustments in national accounts), increases in varieties, among other factors.
52 European Commission forecast for 2012.
Chart 49 Unit labour costs (total economy)
(index: 1999 = 100)
90
100
110
120
130
140
150
90
100
110
120
130
140
150
EA
DE
IE
GR
ES
FR
IT
PT
1999 2001 2003 2005 2007 2009 2011
Source: European Commission, 2012: forecast.
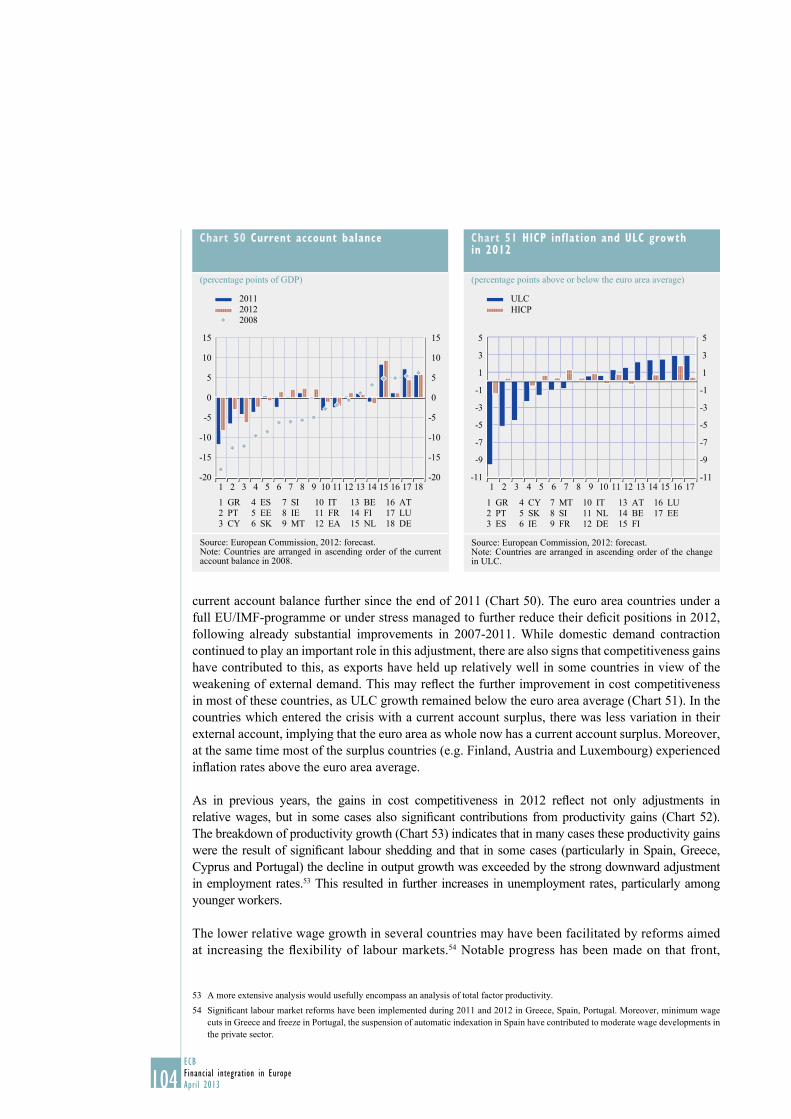
104ECB
Financial integration in Europe
April 2013
current account balance further since the end of 2011 (Chart 50). The euro area countries under a
full EU/IMF-programme or under stress managed to further reduce their defi cit positions in 2012,
following already substantial improvements in 2007-2011. While domestic demand contraction
continued to play an important role in this adjustment, there are also signs that competitiveness gains
have contributed to this, as exports have held up relatively well in some countries in view of the
weakening of external demand. This may refl ect the further improvement in cost competitiveness
in most of these countries, as ULC growth remained below the euro area average (Chart 51). In the
countries which entered the crisis with a current account surplus, there was less variation in their
external account, implying that the euro area as whole now has a current account surplus. Moreover,
at the same time most of the surplus countries (e.g. Finland, Austria and Luxembourg) experienced
infl ation rates above the euro area average.
As in previous years, the gains in cost competitiveness in 2012 refl ect not only adjustments in
relative wages, but in some cases also signifi cant contributions from productivity gains (Chart 52).
The breakdown of productivity growth (Chart 53) indicates that in many cases these productivity gains
were the result of signifi cant labour shedding and that in some cases (particularly in Spain, Greece,
Cyprus and Portugal) the decline in output growth was exceeded by the strong downward adjustment
in employment rates.53 This resulted in further increases in unemployment rates, particularly among
younger workers.
The lower relative wage growth in several countries may have been facilitated by reforms aimed
at increasing the fl exibility of labour markets.54 Notable progress has been made on that front,
53 A more extensive analysis would usefully encompass an analysis of total factor productivity.
54 Signifi cant labour market reforms have been implemented during 2011 and 2012 in Greece, Spain, Portugal. Moreover, minimum wage
cuts in Greece and freeze in Portugal, the suspension of automatic indexation in Spain have contributed to moderate wage developments in
the private sector.
Chart 50 Current account balance
(percentage points of GDP)
-20
-15
-10
-5
0
5
10
15
-20
-15
-10
-5
0
5
10
15
2011
2012
2008
1 2 3 4 5 6 7 8 9 10 11 12 13 14 15 16 17 18
1 GR
2 PT
3 CY
4 ES
5 EE
6 SK
7 SI
8 IE
9 MT
10 IT
11 FR
12 EA
13 BE
14 FI
15 NL
16 AT
17 LU
18 DE
Source: European Commission, 2012: forecast.Note: Countries are arranged in ascending order of the current account balance in 2008.
Chart 51 HICP inflation and ULC growth in 2012
(percentage points above or below the euro area average)
-11
-9
-7
-5
-3
-1
1
3
5
-11
-9
-7
-5
-3
-1
1
3
5
ULC
HICP
1 2 3 4 5 6 7 8 9 10 11 12 13 14 15 16 17
1 GR
2 PT
3 ES
4 CY
5 SK
6 IE
7 MT
8 SI
9 FR
10 IT
11 NL
12 DE
13 AT
14 BE
15 FI
16 LU
17 EE
Source: European Commission, 2012: forecast.Note: Countries are arranged in ascending order of the change in ULC.

105ECB
Financial integration in Europe
April 2013
SPECIAL FEATURE C
in particular in some countries with relatively low levels of labour market fl exibility, which
in many cases are also the countries facing the largest adjustment needs. This has allowed the
cyclical compression of domestic demand to hold down wage growth. As some of the reforms
taken within the year will only take full effect with some lag, further adjustment may be expected
going forward.
Chart 52 Change in ULC and components between 2011 and 2012
(relative to the euro area average; percentage points)
-12
-10
-8
-6
-4
-2
0
2
4
6
-12
-10
-8
-6
-4
-2
0
2
4
6
EEGR PT ES IE CY SI SK NL FR MT DE IT AT FI BE LU
compensation per employee
productivity (inverted sign)
ULC
Source: European Commission, 2012: forecast.Note: Countries are arranged in ascending order of the change in the ULC in 2012.
Chart 53 Productivity growth and contributions from GDP and employment between 2011 and 2012
(relative to the euro area average; percentage points)
-8
-6
-4
-2
0
2
4
6
-8
-6
-4
-2
0
2
4
6
LU
GDP growth
employment growth
productivity (GDP minus employment) growth
ES SK GR IE CY EE PT FR BE FI DE AT SI MT NL IT
Source: European Commission, 2012: forecast.Note: Countries are arranged in descending order of productivity growth.

106ECB
Financial integration in Europe
April 2013
Despite the adjustments seen in relative ULC growth, the overall price adjustment has been
much less pronounced in 2012 (Chart 51). This can be attributed partly to the countries’ fi scal
consolidation efforts, which involved increasing indirect taxes and administered prices, thereby
exerting upward pressure on prices. In addition, the limited price adjustment may also refl ect
simultaneous increases in profi t margins in selected external defi cit countries, although not France,
Italy, Ireland or Slovenia (Chart 54). The interpretation of the current dynamics of profi t margins
(mark-ups) requires a degree of caution (apart from the usual statistical caveats), given that in the
2008-09 crisis, euro area countries, especially those currently adjusting past imbalances, witnessed
a signifi cant contraction in their profi t margins on the back of very resilient wage dynamics. This
implies that some euro area countries are still experiencing a partial rebound of their profi t margins
from earlier troughs. Moreover, composition effects (e.g. only profi table fi rms have been able to
survive the crisis) and capital deepening (via labour shedding and an increase in the cost of capital
vis-à-vis wage costs) might also explain the current recovery in profi t margins. However, the current
rise in profi t margins in some countries (if confi rmed) could also refl ect a lack of competition in
certain sectors of the economy, allowing fi rms to earn excessive rents as they are not forced through
competition to pass on the improvements in labour costs to fi nal prices. Product market reforms
strengthening competition would in this case be particularly important.
It should also be noted that amongst the countries that witnessed the largest increase in mark-up
after the 2008 crisis, some nonetheless suffered from low rates of return on invested capital, below
the euro area average in the case of Greece and Portugal. Rates of return are closer proxy to measure
the actual profi tability of fi rms – and the possible existence of economic rents – than mark-ups.
In addition, other factors than lack of competition in sheltered sectors can drive the evolution
of total-economy mark-ups, such as particularly high uncertainty for business prospects due
to political and social developments, drastic increases in fi nancial costs, as well as pronounced
fi nancial constraints.
Chart 54 Contribution to the GDP deflator from ULC, profit margins and taxes
(average annual percentage growth 2008-2012)
-2
-1
0
1
2
3
4
-2
-1
0
1
2
3
4
LU MT CY FI EE BE AT SI GR IT FR SK EA NL DE ES PT IE
indirect taxes
profit margins
ULC
GDP deflator
Source: European Commission, 2012: forecast.Note: The impact of indirect taxes does not only refl ect the infl uence of tax legislation but also of taxes basis (e.g. with some results driven in some countries by the housing boom reversal). Countries are arranged in descending order of the change in the GDP defl ator.
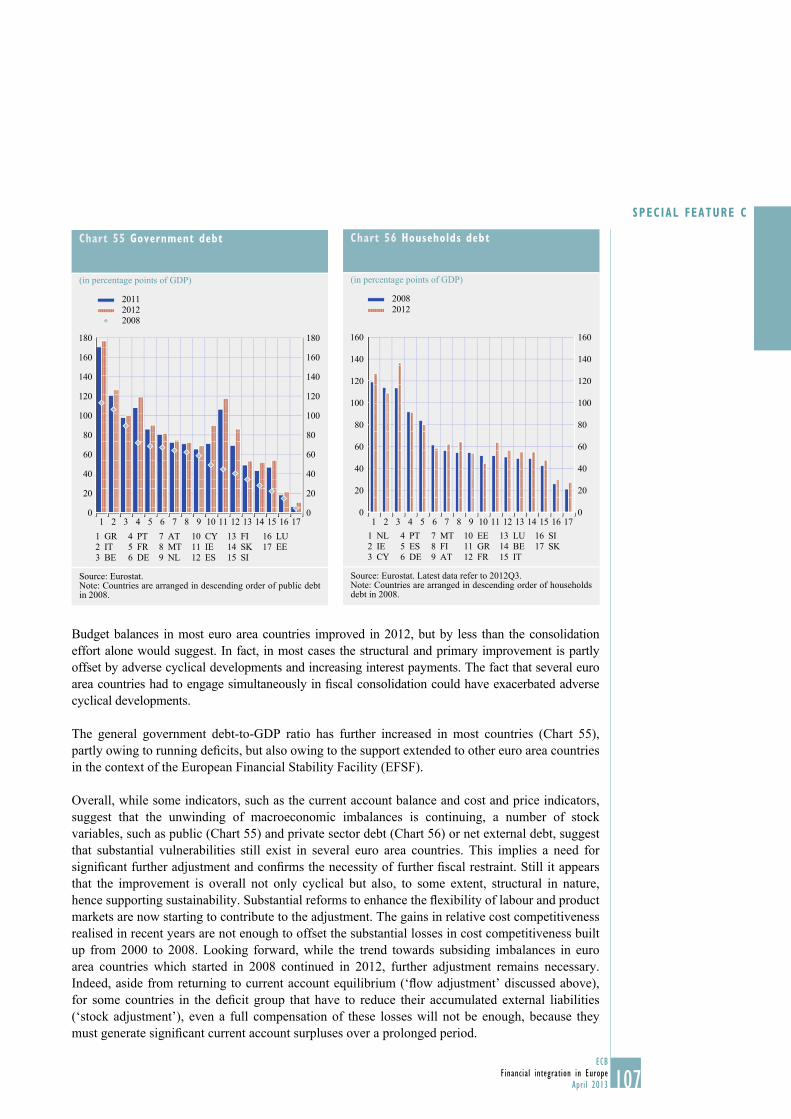
107ECB
Financial integration in Europe
April 2013
SPECIAL FEATURE C
Budget balances in most euro area countries improved in 2012, but by less than the consolidation
effort alone would suggest. In fact, in most cases the structural and primary improvement is partly
offset by adverse cyclical developments and increasing interest payments. The fact that several euro
area countries had to engage simultaneously in fi scal consolidation could have exacerbated adverse
cyclical developments.
The general government debt-to-GDP ratio has further increased in most countries (Chart 55),
partly owing to running defi cits, but also owing to the support extended to other euro area countries
in the context of the European Financial Stability Facility (EFSF).
Overall, while some indicators, such as the current account balance and cost and price indicators,
suggest that the unwinding of macroeconomic imbalances is continuing, a number of stock
variables, such as public (Chart 55) and private sector debt (Chart 56) or net external debt, suggest
that substantial vulnerabilities still exist in several euro area countries. This implies a need for
signifi cant further adjustment and confi rms the necessity of further fi scal restraint. Still it appears
that the improvement is overall not only cyclical but also, to some extent, structural in nature,
hence supporting sustainability. Substantial reforms to enhance the fl exibility of labour and product
markets are now starting to contribute to the adjustment. The gains in relative cost competitiveness
realised in recent years are not enough to offset the substantial losses in cost competitiveness built
up from 2000 to 2008. Looking forward, while the trend towards subsiding imbalances in euro
area countries which started in 2008 continued in 2012, further adjustment remains necessary.
Indeed, aside from returning to current account equilibrium (‘fl ow adjustment’ discussed above),
for some countries in the defi cit group that have to reduce their accumulated external liabilities
(‘stock adjustment’), even a full compensation of these losses will not be enough, because they
must generate signifi cant current account surpluses over a prolonged period.
Chart 55 Government debt
(in percentage points of GDP)
0
20
40
60
80
100
120
140
160
180
0
20
40
60
80
100
120
140
160
180
1 2 3 4 5 6 7 8 9 10 11 12 13 14 15 16 17
1 GR
2 IT
3 BE
4 PT
5 FR
6 DE
7 AT
8 MT
9 NL
10 CY
11 IE
12 ES
13 FI
14 SK
15 SI
16 LU
17 EE
2011
2012
2008
Source: Eurostat.Note: Countries are arranged in descending order of public debt in 2008.
Chart 56 Households debt
(in percentage points of GDP)
0
20
40
60
80
100
120
140
160
0
20
40
60
80
100
120
140
160
2008
2012
1 2 3 4 5 6 7 8 9 10 11 12 13 14 15 16 17
1 NL
2 IE
3 CY
4 PT
5 ES
6 DE
7 MT
8 FI
9 AT
10 EE
11 GR
12 FR
13 LU
14 BE
15 IT
16 SI
17 SK
Source: Eurostat. Latest data refer to 2012Q3.Note: Countries are arranged in descending order of households debt in 2008.
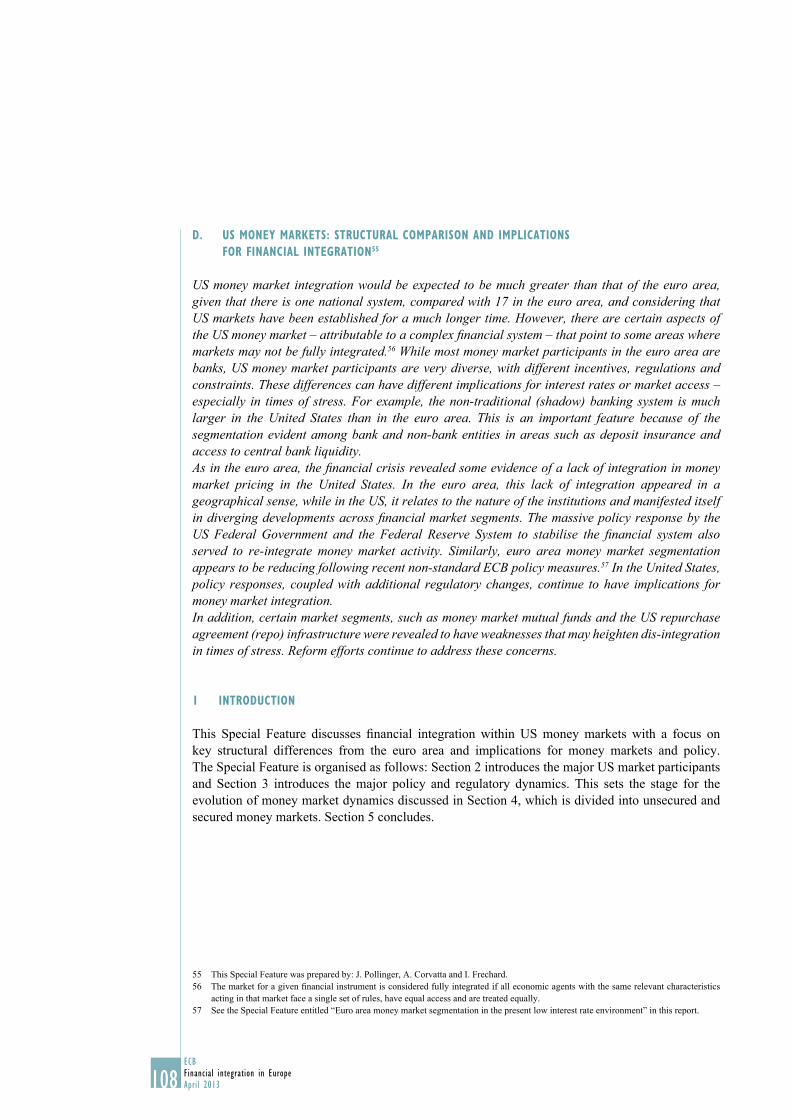
108ECB
Financial integration in Europe
April 2013
D. US MONEY MARKETS: STRUCTURAL COMPARISON AND IMPLICATIONS
FOR FINANCIAL INTEGRATION55
US money market integration would be expected to be much greater than that of the euro area, given that there is one national system, compared with 17 in the euro area, and considering that US markets have been established for a much longer time. However, there are certain aspects of the US money market – attributable to a complex fi nancial system – that point to some areas where markets may not be fully integrated.56 While most money market participants in the euro area are banks, US money market participants are very diverse, with different incentives, regulations and constraints. These differences can have different implications for interest rates or market access – especially in times of stress. For example, the non-traditional (shadow) banking system is much larger in the United States than in the euro area. This is an important feature because of the segmentation evident among bank and non-bank entities in areas such as deposit insurance and access to central bank liquidity.As in the euro area, the fi nancial crisis revealed some evidence of a lack of integration in money market pricing in the United States. In the euro area, this lack of integration appeared in a geographical sense, while in the US, it relates to the nature of the institutions and manifested itself in diverging developments across fi nancial market segments. The massive policy response by the US Federal Government and the Federal Reserve System to stabilise the fi nancial system also served to re-integrate money market activity. Similarly, euro area money market segmentation appears to be reducing following recent non-standard ECB policy measures.57 In the United States, policy responses, coupled with additional regulatory changes, continue to have implications for money market integration. In addition, certain market segments, such as money market mutual funds and the US repurchase agreement (repo) infrastructure were revealed to have weaknesses that may heighten dis-integration in times of stress. Reform efforts continue to address these concerns.
1 INTRODUCTION
This Special Feature discusses fi nancial integration within US money markets with a focus on
key structural differences from the euro area and implications for money markets and policy.
The Special Feature is organised as follows: Section 2 introduces the major US market participants
and Section 3 introduces the major policy and regulatory dynamics. This sets the stage for the
evolution of money market dynamics discussed in Section 4, which is divided into unsecured and
secured money markets. Section 5 concludes.
This Special Feature was prepared by: J. Pollinger, A. Corvatta and I. Frechard.55
The market for a given fi nancial instrument is considered fully integrated if all economic agents with the same relevant characteristics 56
acting in that market face a single set of rules, have equal access and are treated equally.
See the Special Feature entitled “Euro area money market segmentation in the present low interest rate environment” in this report.57

109ECB
Financial integration in Europe
April 2013
SPECIAL FEATURE D
2 OVERVIEW OF US FINANCIAL SYSTEM STRUCTURE
BANKS
Nearly all US banking assets are controlled by bank holding companies, i.e. corporations which
control one or more banks.58 US bank holding companies own more than USD 15 trillion in total
assets, which span across entity types. Bank holding companies comprise more than 90% of the
assets of the top 30 brokers and dealers and approximately 40% of the assets of money market
mutual funds (henceforth, money market funds) and the top 20 insurance companies.59
Assets held in non-bank subsidiaries account for a growing share of total bank holding company
assets, with around 30% of aggregate banking industry assets currently held by non-bank
subsidiaries.60 Borrowing costs may vary signifi cantly among different subsidiaries of the same
holding company, especially when comparing bank and non-bank subsidiaries, refl ecting frictions
in a bank’s ability to transfer funds internally. Regulation limits the fl ow of funds and capital
across subsidiaries. For example, regulations require a bank holding company to act as a “source of
strength” for its commercial banking subsidiaries, but limit the extent to which a banking subsidiary
can support non-banking subsidiaries.61
Domestic banks can be divided into larger money centre banks, funded by both deposits and capital
market activities, and smaller regional and community lenders with larger deposit bases relative
to total liabilities. Banks and savings institutions, regardless of size, have part of their deposits –
particularly retail deposits – insured by the Federal Deposit Insurance Corporation (FDIC).62
Depository institutions also have access to central bank liquidity through the Federal Reserve
System’s discount window.
By contrast, non-bank broker-dealers rely on capital markets for their funding and do not have
access to central bank liquidity. However, the largest broker-dealers set up bank holding companies
during the fi nancial crisis to obtain such access. In general, broker-dealer models were – and
remain – heavily dependent on activities such as repos. Among the set of banks and broker-dealers
are Federal Reserve-designated primary dealers, which are authorised to trade directly with the
Federal Reserve and are subject to signifi cant requirements and obligations.63 There are currently
21 primary dealers. This implies a different market structure from the euro area. In the United
States there is a tiered system in which certain fi nancial institutions – the primary dealers – have
access to Federal Reserve operations, while other fi nancial institutions rely on the primary dealers
for the distribution of central bank liquidity. In the euro area all monetary fi nancial institutions can
have direct access to Eurosystem open market operations and standing facilities.
Typically, a large US parent bank holding company will own a number of domestic bank subsidiaries engaged in lending and deposit-58
taking as well as non-banking and foreign subsidiaries engaged in a broader range of business activities. See Avharam, D., Selvaggi, P.
and Vickery, J. (2012), “A Structural View of U.S. Bank Holding Companies”, FRBNY Economic Policy Review, Federal Reserve Bank
of New York.
Cetorelli, N. (2012), “A Principle for Forward-Looking Monitoring of Financial Intermediation: Follow the Banks!”, 59 Liberty Street Economics Blog, Federal Reserve Bank of New York.
Avharam, Selvaggi and Vickery (2012), op. cit., highlight the trend in recent decades towards enlarging the scope of bank holding 60
company activities. However, they note that recent legislation (Volcker, Dodd-Frank) prohibits bank holding companies from engaging
in proprietary trading and limits investments in other areas, such as hedge funds.
McAndrews, J. (2009), “Segmentation in the U.S. Dollar Money Markets During the Financial Crisis”, Federal Reserve Bank of 61
New York.
The National Credit Union Administration insures deposits at credit unions.62
Current primary dealers are listed on the website of the Federal Reserve Bank of New York at http://www.newyorkfed.org/markets/63
pridealers_current.html.

110ECB
Financial integration in Europe
April 2013
In addition to US domestic banks, foreign banks are large wholesale market borrowers and have an important presence in the United States. The US branches and agencies or non-bank subsidiaries
of foreign banking organisations (FBOs) account for close to USD 2 trillion of banking assets,
representing 15% of total banking assets.64 FBOs can access the Federal Reserve System’s discount
window. However, most FBOs are not allowed to offer retail deposits insured by the FDIC. Instead,
the most important sources of funding for FBOs are large time deposits and market borrowings,
including repos and commercial paper (CP). Market borrowings are more important for FBOs
(32% of total liabilities) than for domestic banks (10% of total liabilities).65 For both domestic
banks and FBOs, more than 90% of market borrowings are supplied by non-bank entities.
The banking sector has experienced increased differentiation in terms of both long and short-
term ratings. Changes in counterparty credit risk represent a normal market dynamic and need
not signal a lack of integration, although increased counterparty credit differentiation can lead
to a reduction in the volume of money market supplied funding (as lenders are more hesitant to
extend funding) and price (as the set of active market participants becomes more distilled towards
higher-quality names).
Deregulation of restrictions on interstate banking and branching in the US from the late-1970s
to the mid-1990s led to a substantially more integrated national banking system as measured by
the share of the banking system held by banks from other states.66 Recent IMF analysis highlights
that the share of the banking system held by banks from other states is much higher than similar
cross-country holdings in the euro area.67
Just as TARGET2, the Eurosystem’s interbank settlement and payment system, refl ects developments
among national central bank balances in the euro area, the Federal Reserve’s Interdistrict Settlement
Account data refl ect developments among the twelve regional Federal Reserve Bank districts that
make up the Federal Reserve System. Interdistrict settlement balances rose considerably during the
fi nancial crisis, in some cases reaching magnitudes similar to TARGET2 balances.68
Financial institutions are distributed differently among districts; for example, the second district
includes New York, where many of the largest domestic banks and FBOs are located, and liquidity
operations are carried out by the Federal Reserve Bank of New York. Balances are settled on a
lagged basis once per year, through an adjustment of the relative shares of the System Open Market
Account of the Federal Reserve System.69
Overall, traditional banking entities in the United States represent a smaller share of the total
fi nancial system than in the euro area, where banks continue to be the main fi nancial intermediaries
(see Table 2).
Federal Reserve H.8 Release, reported in the Offi ce of Financial Research 2012 Annual Report.64
Federal Reserve H.8 Release.65
Morgan, D., Rime, B., and Strahan, P. (2003), “Bank Integration and State Business Cycles”, National Bureau of Economic Research 66
Working Paper 9704. The authors fi nd that the share of integrated bank assets increased from around 10 percent in 1976 prior to state-
level deregulation to around 60 percent of a state’s banking assets in 1994 when interstate banking was federally mandated.
Laeven, L. and Tressel, T. (2013), “The European Union: Financial Integration and Fragmentation in the European Union”, European 67
Union Financial Sector Assessment Program Technical Note, IMF Country Report No. 13/71, March 2013.
Bindseil, U., Cour-Thimann, P. and König, P. (2012), “TARGET2 and Cross-border Interbank Payments during the Financial Crisis”, 68
CESifo Forum Special Issue, p. 83-92. For further discussion of TARGET2 balances and developments during the crisis see Box 4 in the
October 2011 issue of the ECB’s Monthly Bulletin.
The Federal Reserve System dynamics are discussed in more detail in Lubik, T. and Rhodes, K. (2012), “TARGET2: Symptom, Not 69
Cause, of Eurozone Woes”, Economic Brief, No 12-08, Federal Reserve Bank of Richmond, pp. 1-5.
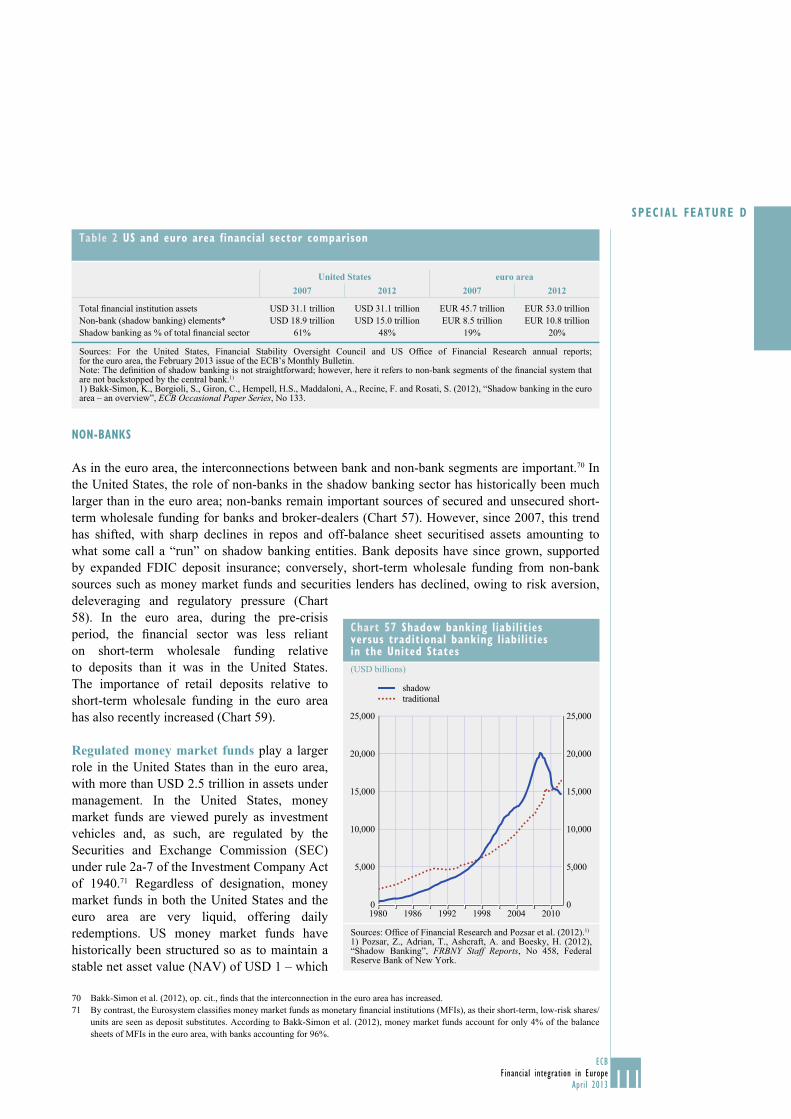
111ECB
Financial integration in Europe
April 2013
SPECIAL FEATURE D
NON-BANKS
As in the euro area, the interconnections between bank and non-bank segments are important.70 In
the United States, the role of non-banks in the shadow banking sector has historically been much
larger than in the euro area; non-banks remain important sources of secured and unsecured short-
term wholesale funding for banks and broker-dealers (Chart 57). However, since 2007, this trend
has shifted, with sharp declines in repos and off-balance sheet securitised assets amounting to
what some call a “run” on shadow banking entities. Bank deposits have since grown, supported
by expanded FDIC deposit insurance; conversely, short-term wholesale funding from non-bank
sources such as money market funds and securities lenders has declined, owing to risk aversion,
deleveraging and regulatory pressure (Chart
58). In the euro area, during the pre-crisis
period, the fi nancial sector was less reliant
on short-term wholesale funding relative
to deposits than it was in the United States.
The importance of retail deposits relative to
short-term wholesale funding in the euro area
has also recently increased (Chart 59).
Regulated money market funds play a larger
role in the United States than in the euro area,
with more than USD 2.5 trillion in assets under
management. In the United States, money
market funds are viewed purely as investment
vehicles and, as such, are regulated by the
Securities and Exchange Commission (SEC)
under rule 2a-7 of the Investment Company Act
of 1940.71 Regardless of designation, money
market funds in both the United States and the
euro area are very liquid, offering daily
redemptions. US money market funds have
historically been structured so as to maintain a
stable net asset value (NAV) of USD 1 – which
Bakk-Simon et al. (2012), op. cit., fi nds that the interconnection in the euro area has increased.70
By contrast, the Eurosystem classifi es money market funds as monetary fi nancial institutions (MFIs), as their short-term, low-risk shares/71
units are seen as deposit substitutes. According to Bakk-Simon et al. (2012), money market funds account for only 4% of the balance
sheets of MFIs in the euro area, with banks accounting for 96%.
Table 2 US and euro area financial sector comparison
United States euro area2007 2012 2007 2012
Total fi nancial institution assets USD 31.1 trillion USD 31.1 trillion EUR 45.7 trillion EUR 53.0 trillion
Non-bank (shadow banking) elements* USD 18.9 trillion USD 15.0 trillion EUR 8.5 trillion EUR 10.8 trillion
Shadow banking as % of total fi nancial sector 61% 48% 19% 20%
Sources: For the United States, Financial Stability Oversight Council and US Offi ce of Financial Research annual reports; for the euro area, the February 2013 issue of the ECB’s Monthly Bulletin.Note: The defi nition of shadow banking is not straightforward; however, here it refers to non-bank segments of the fi nancial system that are not backstopped by the central bank.1)
1) Bakk-Simon, K., Borgioli, S., Giron, C., Hempell, H.S., Maddaloni, A., Recine, F. and Rosati, S. (2012), “Shadow banking in the euro area – an overview”, ECB Occasional Paper Series, No 133.
Chart 57 Shadow banking liabilities versus traditional banking liabilities in the United States
(USD billions)
0
5,000
10,000
15,000
20,000
25,000
0
5,000
10,000
15,000
20,000
25,000
1980 1986 1992 1998 2004 2010
shadow
traditional
Sources: Offi ce of Financial Research and Pozsar et al. (2012).1)
1) Pozsar, Z., Adrian, T., Ashcraft, A. and Boesky, H. (2012), “Shadow Banking”, FRBNY Staff Reports, No 458, Federal Reserve Bank of New York.
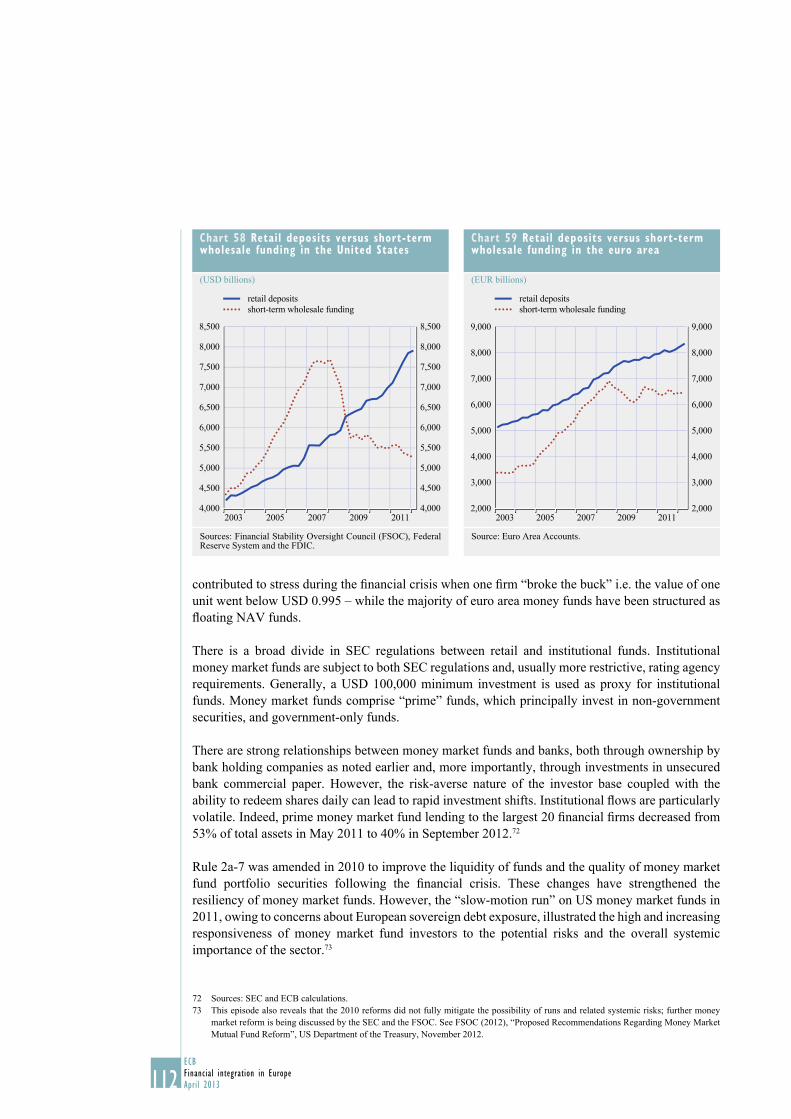
112ECB
Financial integration in Europe
April 2013
contributed to stress during the fi nancial crisis when one fi rm “broke the buck” i.e. the value of one
unit went below USD 0.995 – while the majority of euro area money funds have been structured as
fl oating NAV funds.
There is a broad divide in SEC regulations between retail and institutional funds. Institutional
money market funds are subject to both SEC regulations and, usually more restrictive, rating agency
requirements. Generally, a USD 100,000 minimum investment is used as proxy for institutional
funds. Money market funds comprise “prime” funds, which principally invest in non-government
securities, and government-only funds.
There are strong relationships between money market funds and banks, both through ownership by
bank holding companies as noted earlier and, more importantly, through investments in unsecured
bank commercial paper. However, the risk-averse nature of the investor base coupled with the
ability to redeem shares daily can lead to rapid investment shifts. Institutional fl ows are particularly
volatile. Indeed, prime money market fund lending to the largest 20 fi nancial fi rms decreased from
53% of total assets in May 2011 to 40% in September 2012.72
Rule 2a-7 was amended in 2010 to improve the liquidity of funds and the quality of money market
fund portfolio securities following the fi nancial crisis. These changes have strengthened the
resiliency of money market funds. However, the “slow-motion run” on US money market funds in
2011, owing to concerns about European sovereign debt exposure, illustrated the high and increasing
responsiveness of money market fund investors to the potential risks and the overall systemic
importance of the sector.73
Sources: SEC and ECB calculations.72
This episode also reveals that the 2010 reforms did not fully mitigate the possibility of runs and related systemic risks; further money 73
market reform is being discussed by the SEC and the FSOC. See FSOC (2012), “Proposed Recommendations Regarding Money Market
Mutual Fund Reform”, US Department of the Treasury, November 2012.
Chart 58 Retail deposits versus short-term wholesale funding in the United States
(USD billions)
4,000
4,500
5,000
5,500
6,000
6,500
7,000
7,500
8,000
8,500
4,000
4,500
5,000
5,500
6,000
6,500
7,000
7,500
8,000
8,500
2003 2005 2007 2009 2011
retail deposits
short-term wholesale funding
Sources: Financial Stability Oversight Council (FSOC), Federal Reserve System and the FDIC.
Chart 59 Retail deposits versus short-term wholesale funding in the euro area
(EUR billions)
2,000
3,000
4,000
5,000
6,000
7,000
8,000
9,000
2,000
3,000
4,000
5,000
6,000
7,000
8,000
9,000
2003 2005 2007 2009 2011
retail deposits
short-term wholesale funding
Source: Euro Area Accounts.
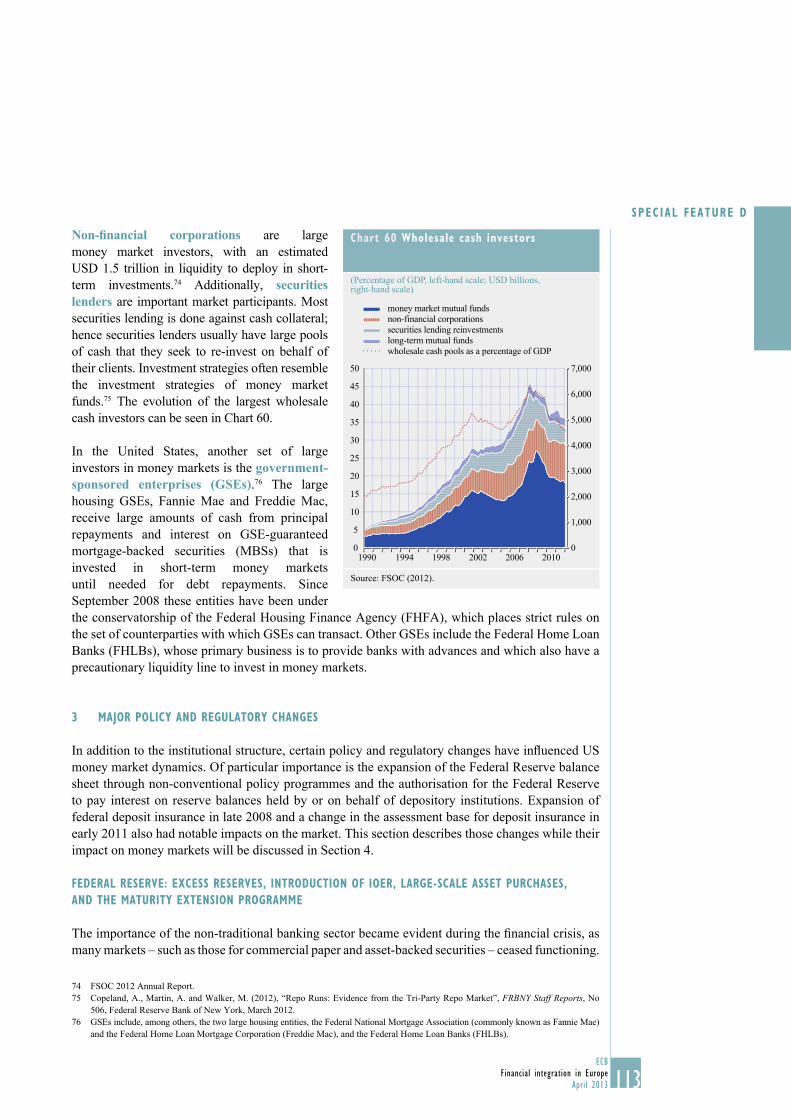
113ECB
Financial integration in Europe
April 2013
SPECIAL FEATURE D
Non-fi nancial corporations are large
money market investors, with an estimated
USD 1.5 trillion in liquidity to deploy in short-
term investments.74 Additionally, securities lenders are important market participants. Most
securities lending is done against cash collateral;
hence securities lenders usually have large pools
of cash that they seek to re-invest on behalf of
their clients. Investment strategies often resemble
the investment strategies of money market
funds.75 The evolution of the largest wholesale
cash investors can be seen in Chart 60.
In the United States, another set of large
investors in money markets is the government-sponsored enterprises (GSEs).76 The large
housing GSEs, Fannie Mae and Freddie Mac,
receive large amounts of cash from principal
repayments and interest on GSE-guaranteed
mortgage-backed securities (MBSs) that is
invested in short-term money markets
until needed for debt repayments. Since
September 2008 these entities have been under
the conservatorship of the Federal Housing Finance Agency (FHFA), which places strict rules on
the set of counterparties with which GSEs can transact. Other GSEs include the Federal Home Loan
Banks (FHLBs), whose primary business is to provide banks with advances and which also have a
precautionary liquidity line to invest in money markets.
3 MAJOR POLICY AND REGULATORY CHANGES
In addition to the institutional structure, certain policy and regulatory changes have infl uenced US
money market dynamics. Of particular importance is the expansion of the Federal Reserve balance
sheet through non-conventional policy programmes and the authorisation for the Federal Reserve
to pay interest on reserve balances held by or on behalf of depository institutions. Expansion of
federal deposit insurance in late 2008 and a change in the assessment base for deposit insurance in
early 2011 also had notable impacts on the market. This section describes those changes while their
impact on money markets will be discussed in Section 4.
FEDERAL RESERVE: EXCESS RESERVES, INTRODUCTION OF IOER, LARGE-SCALE ASSET PURCHASES,
AND THE MATURITY EXTENSION PROGRAMME
The importance of the non-traditional banking sector became evident during the fi nancial crisis, as
many markets – such as those for commercial paper and asset-backed securities – ceased functioning.
FSOC 2012 Annual Report.74
Copeland, A., Martin, A. and Walker, M. (2012), “Repo Runs: Evidence from the Tri-Party Repo Market”, 75 FRBNY Staff Reports, No
506, Federal Reserve Bank of New York, March 2012.
GSEs include, among others, the two large housing entities, the Federal National Mortgage Association (commonly known as Fannie Mae) 76
and the Federal Home Loan Mortgage Corporation (Freddie Mac), and the Federal Home Loan Banks (FHLBs).
Chart 60 Wholesale cash investors
(Percentage of GDP, left-hand scale; USD billions, right-hand scale)
0
1,000
2,000
3,000
4,000
5,000
6,000
7,000
0
5
10
15
20
25
30
35
40
45
50
1990 1994 1998 2002 2006 2010
money market mutual funds
non-financial corporations
securities lending reinvestments
long-term mutual funds
wholesale cash pools as a percentage of GDP
Source: FSOC (2012).
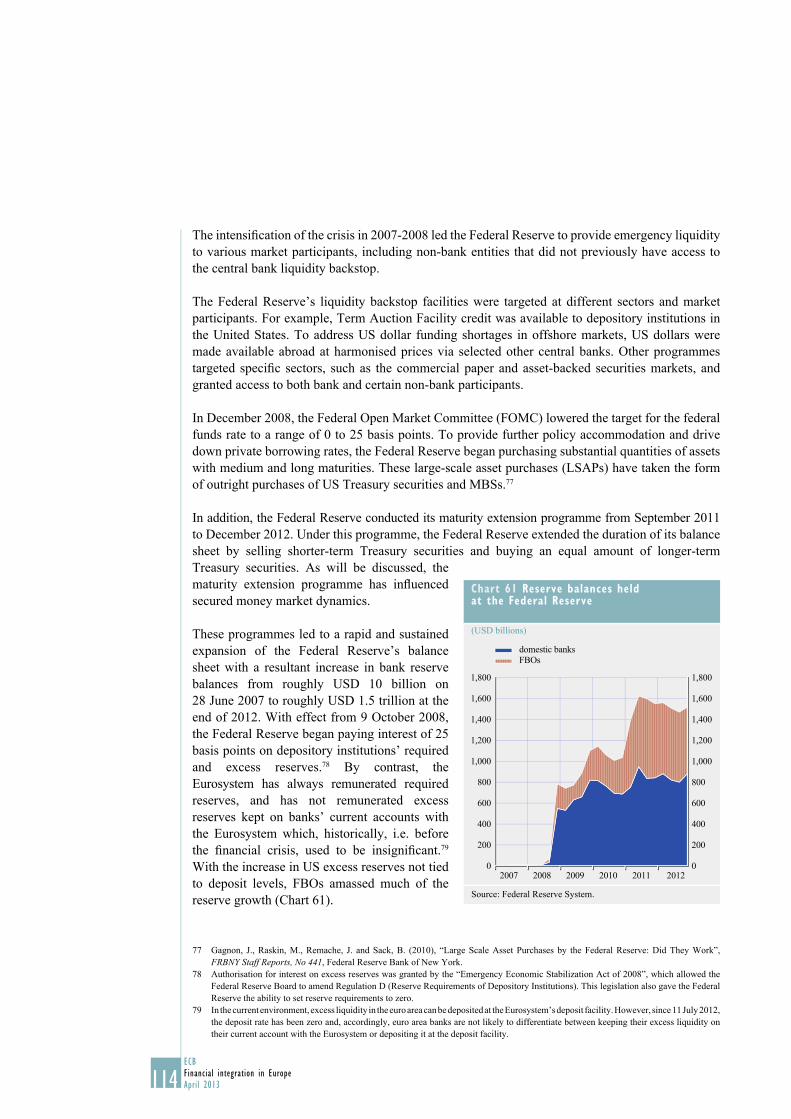
114ECB
Financial integration in Europe
April 2013
The intensifi cation of the crisis in 2007-2008 led the Federal Reserve to provide emergency liquidity
to various market participants, including non-bank entities that did not previously have access to
the central bank liquidity backstop.
The Federal Reserve’s liquidity backstop facilities were targeted at different sectors and market
participants. For example, Term Auction Facility credit was available to depository institutions in
the United States. To address US dollar funding shortages in offshore markets, US dollars were
made available abroad at harmonised prices via selected other central banks. Other programmes
targeted specifi c sectors, such as the commercial paper and asset-backed securities markets, and
granted access to both bank and certain non-bank participants.
In December 2008, the Federal Open Market Committee (FOMC) lowered the target for the federal
funds rate to a range of 0 to 25 basis points. To provide further policy accommodation and drive
down private borrowing rates, the Federal Reserve began purchasing substantial quantities of assets
with medium and long maturities. These large-scale asset purchases (LSAPs) have taken the form
of outright purchases of US Treasury securities and MBSs.77
In addition, the Federal Reserve conducted its maturity extension programme from September 2011
to December 2012. Under this programme, the Federal Reserve extended the duration of its balance
sheet by selling shorter-term Treasury securities and buying an equal amount of longer-term
Treasury securities. As will be discussed, the
maturity extension programme has infl uenced
secured money market dynamics.
These programmes led to a rapid and sustained
expansion of the Federal Reserve’s balance
sheet with a resultant increase in bank reserve
balances from roughly USD 10 billion on
28 June 2007 to roughly USD 1.5 trillion at the
end of 2012. With effect from 9 October 2008,
the Federal Reserve began paying interest of 25
basis points on depository institutions’ required
and excess reserves.78 By contrast, the
Eurosystem has always remunerated required
reserves, and has not remunerated excess
reserves kept on banks’ current accounts with
the Eurosystem which, historically, i.e. before
the fi nancial crisis, used to be insignifi cant.79
With the increase in US excess reserves not tied
to deposit levels, FBOs amassed much of the
reserve growth (Chart 61).
Gagnon, J., Raskin, M., Remache, J. and Sack, B. (2010), “Large Scale Asset Purchases by the Federal Reserve: Did They Work”, 77
FRBNY Staff Reports, No 441, Federal Reserve Bank of New York.
Authorisation for interest on excess reserves was granted by the “Emergency Economic Stabilization Act of 2008”, which allowed the 78
Federal Reserve Board to amend Regulation D (Reserve Requirements of Depository Institutions). This legislation also gave the Federal
Reserve the ability to set reserve requirements to zero.
In the current environment, excess liquidity in the euro area can be deposited at the Eurosystem’s deposit facility. However, since 11 July 2012, 79
the deposit rate has been zero and, accordingly, euro area banks are not likely to differentiate between keeping their excess liquidity on
their current account with the Eurosystem or depositing it at the deposit facility.
Chart 61 Reserve balances held at the Federal Reserve
(USD billions)
0
200
400
600
800
1,000
1,200
1,400
1,600
1,800
0
200
400
600
800
1,000
1,200
1,400
1,600
1,800
2007 2008 2009 2010 2011 2012
domestic banks
FBOs
Source: Federal Reserve System.
115ECB
Financial integration in Europe
April 2013
SPECIAL FEATURE D
Non-depository institutions, such as money market funds, GSEs and FHLBs do not qualify for
interest on reserves. As will be discussed in more detail in this Special Feature, the massive
provision of excess liquidity and introduction of interest on excess reserves (IOER) infl uenced
money markets.
The provision of excess liquidity is similar to what has happened in the euro area, where the ECB
has taken extraordinary policy measures to improve market functioning and repair the monetary
transmission mechanism. These include full-allotment main refi nancing operations, three-year
longer-term refi nancing operations (LTROs) and measures to increase Eurosystem collateral
availability, which similarly expanded the ECB balance sheet.
FDIC: BROADENING OF THE DEPOSIT INSURANCE ASSESSMENT BASE
FDIC deposit insurance is paid for through fees paid by depository institutions. The FDIC broadened
the assessment base for FDIC deposit insurance premia on 1 April 2011 from domestic deposits
to total assets less average Tier 1 capital.80 The expanded deposit insurance assessment base now
includes reserve balances held at the Federal Reserve. This thus acts as a quasi-tax on all assets,
including reserve balances, for banks that have deposit insurance.
At the same time, the FDIC charge for large and complex institutions was set higher than for
smaller banks. In essence, the FDIC charge served to incentivise banks not to rely on short-term
unsecured loans (e.g. fed funds, CP) and secured debt (e.g. repos), as these instruments are now
effectively taxed by the FDIC at the same rate as domestic deposits, even though they are not
insured by the FDIC. The new FDIC assessment regime, while intended to better protect taxpayers
from large bank failures due to riskier activity, distorted activity in the short-term rates markets
through which the Federal Reserve traditionally implements monetary policy, as discussed in more
detail in Section 4.
FDIC: TRANSACTION ACCOUNT GUARANTEE PROGRAMME
In October 2008, to help prevent retail and corporate deposit outfl ows, the FDIC increased deposit
insurance to USD 250,000 from USD 100,000 and temporarily removed the insurance limit for all
non-interest-bearing transaction accounts. The unlimited FDIC guarantee on these accounts
particularly encouraged infl ows into non-interest bearing deposits at domestic banks, particularly at
the largest institutions, leading to USD 1.4 trillion in “excess” insured deposits above the
USD 250,000 guarantee level.81
The programme expired at the end of 2012. Market participants expected that cash fl ight out of banks
and into money market instruments, such as money market funds might occur, with corresponding
predictions that such fl ows could lead to lower short-term money market rates. Market analysts
estimated that even a drop in deposits by only 10-20% (equating to USD 140 to 280 billion) would
push short-term yields lower. The expiration of the Transaction Account Guarantee Programme
appears to have slightly increased the amount of cash to repo markets, although overall bank
deposits have not meaningfully decreased in early 2013.
As mandated by the Dodd-Frank Act (July 2010).80
Quarterly Banking Profi le81 , Third Quarter 2012, FDIC, 30 September 2012.

116ECB
Financial integration in Europe
April 2013
4 US MONEY MARKET DYNAMICS
In both unsecured and secured short-term markets, the combination of risk aversion and policy and
regulatory changes has altered quantity and pricing metrics. There are broad parallels with euro area
money market dynamics, but also some differences in terms of the level of fi nancial integration.
UNSECURED MONEY MARKETS – FED FUNDS
Federal funds, or “fed funds”, are unsecured loans of reserve balances at Federal Reserve Banks
that institutions make to one another. The weighted average rate at which overnight transactions
occur is called the effective fed funds rate.82 The Federal Open Market Committee (FOMC) used to
use the fed funds market as its primary tool for implementing monetary policy by setting a target
level for the fed funds rate.83 The monetary policy transmission mechanism through changes in the
fed funds rate directly affects the level of economic stimulus. Interest rates paid on other short-
term fi nancial securities (e.g. CP and Treasury bills) often move in parallel with the fed funds rate
and yields on long-term assets (e.g. corporate bonds and Treasury notes) are determined in part by
expectations for the fed funds rate in the future.
The market for fed funds is an over-the-counter market in which the size and interest rate of a trade
are negotiated bilaterally, either through a broker or on a direct bilateral basis. As directed by the
FOMC, the Federal Reserve Bank of New York Markets Desk “creates the conditions in reserve
markets” so that market participants trade at this level.84 Participants in the fed funds market include
commercial banks, savings banks and credit unions, the US branches, agencies and non-bank
subsidiaries of foreign banks (FBOs), federal agencies (GSEs), and government securities dealers.85
Prior to the fi nancial crisis, many relatively small institutions accumulated reserves in excess of
requirements and lent fed funds to larger banks. Before IOER, institutions with excess reserves
wanted a return and those with a reserve defi cit needed to borrow to meet the requirement.86
Since the fi nancial crisis, the elevated level of reserves and the introduction of IOER, in addition to
market frictions and shifts from unsecured into secured transactions, have contributed to a decline
in fed funds trading. Data on the volume of fed funds trades is not published, although Federal
Reserve research papers provide estimates.87 By one measure, the average daily fed funds trading
declined by nearly 70% between 2008 and 2010. This reduction in volume was driven by a fall in
the average daily number of transactions in the fi nal two and a half hours of trading each day, from
740 in 2008 to less than 200 in 2010, signalling that banks have little need for late day re-allocation
to meet their reserve requirements.88
Volume-weighted average rate of brokered overnight fed funds published on the website of the Federal Reserve Bank of New York 82
(http://www.newyorkfed.org/markets/omo/dmm/historical/fedfunds/ff.cfm), along with the high and low and standard deviation.
Instead of a target level, the FOMC defi ned a target range of 0-25 percent for the fed funds rate on 16 December 2012, which is still 83
effective at the time of writing. Other tools such as LSAPs and forward policy guidance are now used in conjunction with fed funds.
Source: FOMC meeting minutes.84
Participants in this market are determined by Regulation D of the Federal Reserve System.85
Banks may also be motivated to acquire reserves for the clearing of fi nancial transactions, as payments are made from the same account 86
in which banks hold reserves.
Research estimates rely on an algorithm based on the work of Furfi ne (1999) to identify fed funds trades among Fedwire cleared 87
transactions. However, more recent research calls this method into question. See Armantier, O. and Copeland, A. (2012) “Assessing the
Quality of ‘Furfi ne-Based’ Algorithms”, FRBNY Staff Reports, No 575, Federal Reserve Bank of New York, October 2012.
Afonso, G. and Lagos, R. (2012), “An Empirical Study of Trade Dynamics in the Fed Funds Market”, 88 FRBNY Staff Reports, No 550,
Federal Reserve Bank of New York, February 2012. Please note, this research relies on the Furfi ne method and may not be representative
of actual market activity.
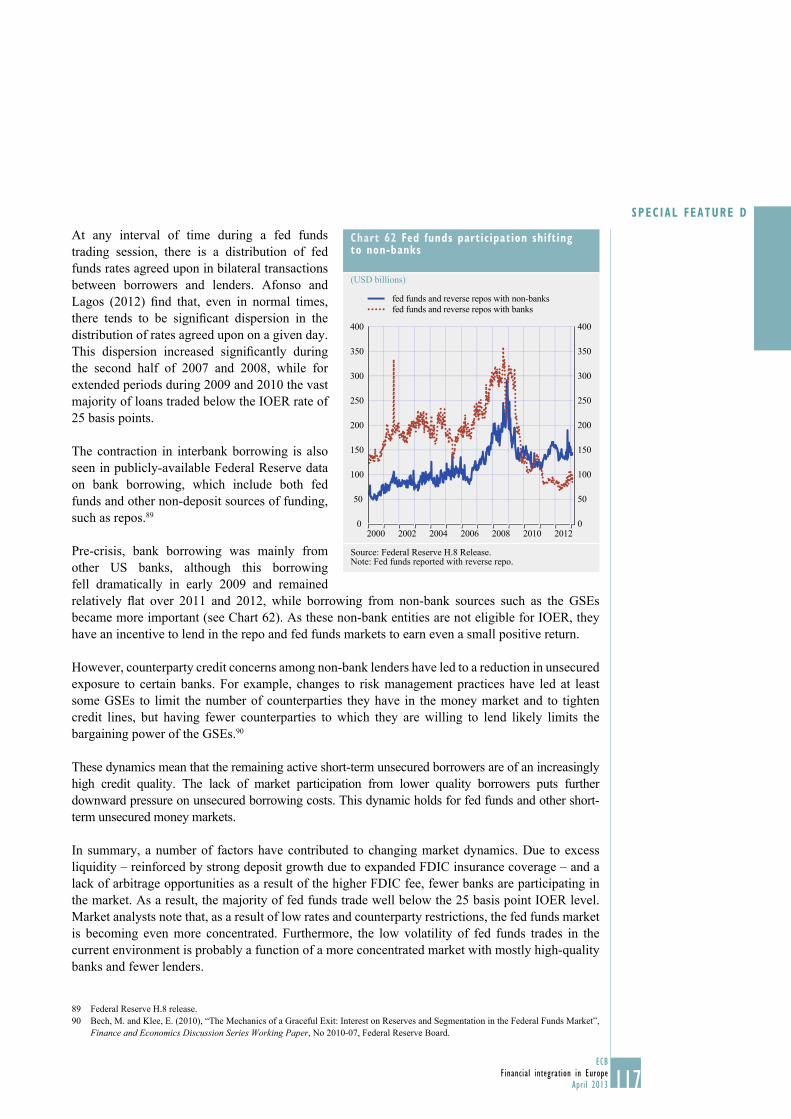
117ECB
Financial integration in Europe
April 2013
SPECIAL FEATURE D
At any interval of time during a fed funds
trading session, there is a distribution of fed
funds rates agreed upon in bilateral transactions
between borrowers and lenders. Afonso and
Lagos (2012) fi nd that, even in normal times,
there tends to be signifi cant dispersion in the
distribution of rates agreed upon on a given day.
This dispersion increased signifi cantly during
the second half of 2007 and 2008, while for
extended periods during 2009 and 2010 the vast
majority of loans traded below the IOER rate of
25 basis points.
The contraction in interbank borrowing is also
seen in publicly-available Federal Reserve data
on bank borrowing, which include both fed
funds and other non-deposit sources of funding,
such as repos.89
Pre-crisis, bank borrowing was mainly from
other US banks, although this borrowing
fell dramatically in early 2009 and remained
relatively fl at over 2011 and 2012, while borrowing from non-bank sources such as the GSEs
became more important (see Chart 62). As these non-bank entities are not eligible for IOER, they
have an incentive to lend in the repo and fed funds markets to earn even a small positive return.
However, counterparty credit concerns among non-bank lenders have led to a reduction in unsecured
exposure to certain banks. For example, changes to risk management practices have led at least
some GSEs to limit the number of counterparties they have in the money market and to tighten
credit lines, but having fewer counterparties to which they are willing to lend likely limits the
bargaining power of the GSEs.90
These dynamics mean that the remaining active short-term unsecured borrowers are of an increasingly
high credit quality. The lack of market participation from lower quality borrowers puts further
downward pressure on unsecured borrowing costs. This dynamic holds for fed funds and other short-
term unsecured money markets.
In summary, a number of factors have contributed to changing market dynamics. Due to excess
liquidity – reinforced by strong deposit growth due to expanded FDIC insurance coverage – and a
lack of arbitrage opportunities as a result of the higher FDIC fee, fewer banks are participating in
the market. As a result, the majority of fed funds trade well below the 25 basis point IOER level.
Market analysts note that, as a result of low rates and counterparty restrictions, the fed funds market
is becoming even more concentrated. Furthermore, the low volatility of fed funds trades in the
current environment is probably a function of a more concentrated market with mostly high-quality
banks and fewer lenders.
Federal Reserve H.8 release.89
Bech, M. and Klee, E. (2010), “The Mechanics of a Graceful Exit: Interest on Reserves and Segmentation in the Federal Funds Market”, 90
Finance and Economics Discussion Series Working Paper, No 2010-07, Federal Reserve Board.
Chart 62 Fed funds participation shifting to non-banks
(USD billions)
0
50
100
150
200
250
300
350
400
0
50
100
150
200
250
300
350
400
2000 2002 2004 2006 2008 2010 2012
fed funds and reverse repos with non-banks
fed funds and reverse repos with banks
Source: Federal Reserve H.8 Release.Note: Fed funds reported with reverse repo.
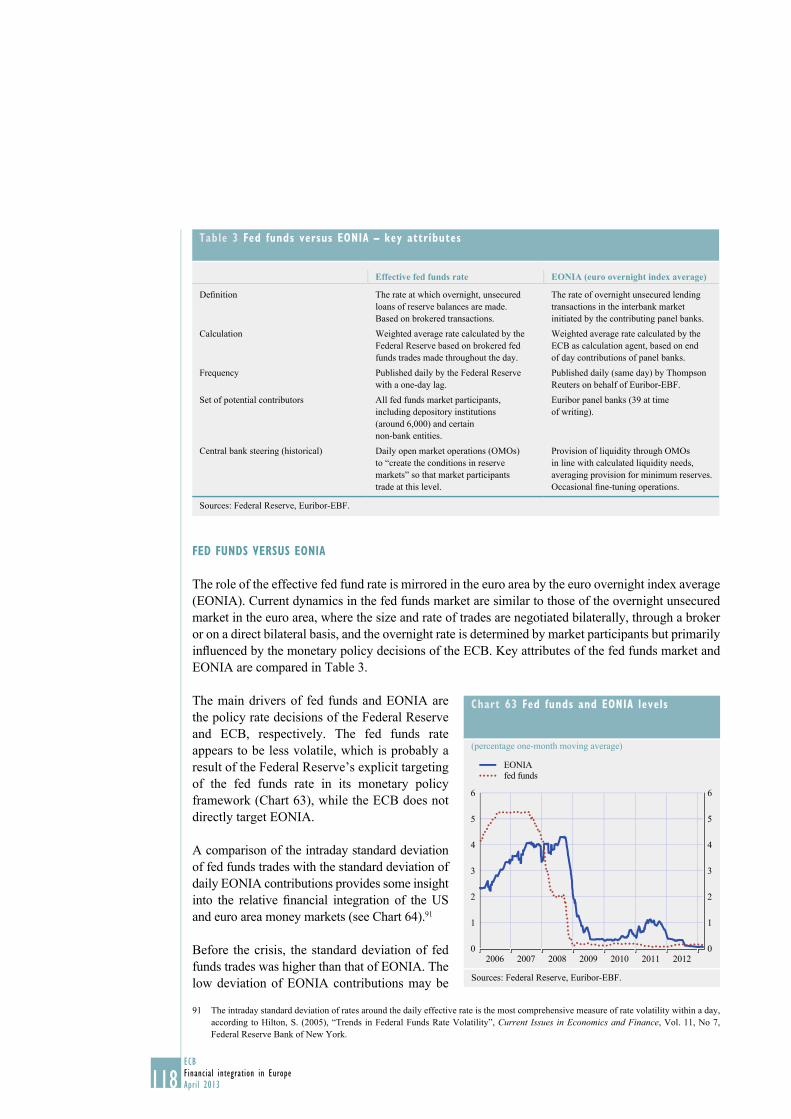
118ECB
Financial integration in Europe
April 2013
FED FUNDS VERSUS EONIA
The role of the effective fed fund rate is mirrored in the euro area by the euro overnight index average
(EONIA). Current dynamics in the fed funds market are similar to those of the overnight unsecured
market in the euro area, where the size and rate of trades are negotiated bilaterally, through a broker
or on a direct bilateral basis, and the overnight rate is determined by market participants but primarily
infl uenced by the monetary policy decisions of the ECB. Key attributes of the fed funds market and
EONIA are compared in Table 3.
The main drivers of fed funds and EONIA are
the policy rate decisions of the Federal Reserve
and ECB, respectively. The fed funds rate
appears to be less volatile, which is probably a
result of the Federal Reserve’s explicit targeting
of the fed funds rate in its monetary policy
framework (Chart 63), while the ECB does not
directly target EONIA.
A comparison of the intraday standard deviation
of fed funds trades with the standard deviation of
daily EONIA contributions provides some insight
into the relative fi nancial integration of the US
and euro area money markets (see Chart 64).91
Before the crisis, the standard deviation of fed
funds trades was higher than that of EONIA. The
low deviation of EONIA contributions may be
The intraday standard deviation of rates around the daily effective rate is the most comprehensive measure of rate volatility within a day, 91
according to Hilton, S. (2005), “Trends in Federal Funds Rate Volatility”, Current Issues in Economics and Finance, Vol. 11, No 7,
Federal Reserve Bank of New York.
Table 3 Fed funds versus EONIA – key attributes
Effective fed funds rate EONIA (euro overnight index average)
Defi nition The rate at which overnight, unsecured
loans of reserve balances are made.
Based on brokered transactions.
The rate of overnight unsecured lending
transactions in the interbank market
initiated by the contributing panel banks.
Calculation Weighted average rate calculated by the
Federal Reserve based on brokered fed
funds trades made throughout the day.
Weighted average rate calculated by the
ECB as calculation agent, based on end
of day contributions of panel banks.
Frequency Published daily by the Federal Reserve
with a one-day lag.
Published daily (same day) by Thompson
Reuters on behalf of Euribor-EBF.
Set of potential contributors All fed funds market participants,
including depository institutions
(around 6,000) and certain
non-bank entities.
Euribor panel banks (39 at time
of writing).
Central bank steering (historical) Daily open market operations (OMOs)
to “create the conditions in reserve
markets” so that market participants
trade at this level.
Provision of liquidity through OMOs
in line with calculated liquidity needs,
averaging provision for minimum reserves.
Occasional fi ne-tuning operations.
Sources: Federal Reserve, Euribor-EBF.
Chart 63 Fed funds and EONIA levels
(percentage one-month moving average)
0
1
2
3
4
5
6
0
1
2
3
4
5
6
2006 2007 2008 2009 2010 2011 2012
EONIA
fed funds
Sources: Federal Reserve, Euribor-EBF.

119ECB
Financial integration in Europe
April 2013
SPECIAL FEATURE D
attributable particularly to the broad provision
of liquidity through the Eurosystem framework
and the averaging provision of reserve holdings
within a maintenance period.
The standard deviation of fed funds trades
increased markedly from the second half of
2007 to early 2009. Since then, fed funds have
settled into a lower and more stable range
compared to the pre-crisis period. As discussed,
this is attributable to the increased concentration
of higher-quality borrowers and lenders. Also,
the very low fed funds rate level close to the
zero bound currently serves to limit dispersion,
as there is no economic reason to trade at
negative rates.
The dispersion in EONIA increased at various
stages of stress in the euro area, refl ecting
counterparty credit risk concerns among panel
banks, which, given the euro area sovereign
debt crisis, are also closely connected to
country risk concerns (see Chapter 1 of this report). This dispersion fell substantially following
the announcements of three-year LTROs for end-2011 and early 2012 and fell further following the
25 basis point interest rate cut in July 2012.
The motivations for trading overnight are similar in both economies, i.e. meeting reserve
requirements, creating liquidity buffers and earning interest. In the euro area, the accumulation
of a sizeable excess liquidity has largely reduced the fi rst two motivations, and the setting of the
deposit facility remuneration rate to zero, by allowing the overnight rate to also move close to zero,
has eliminated the third motivation. As discussed in Special Feature A, this very low interest rate
environment has contributed to a decline in overnight unsecured interbank trading volumes.
OTHER UNSECURED MARKETS
Eurodollar deposits represent the other major overnight US dollar money market segment.
Eurodollar deposits are US dollar-denominated deposits held in a bank or bank branch outside of
the United States.92 By defi nition, US domestic banks – including agencies and branches of foreign
banks in the United States – cannot directly borrow in the Eurodollar market. However, non-US
offi ces can accept Eurodollars and transfer the funds to US affi liates, where they have the same
impact on reserve requirements.93
A broader and more diverse set of participants is eligible to transact in Eurodollars than in fed
funds. This includes affi liates of US domestic and foreign banks (as both borrowers and lenders)
The practice of accepting USD-denominated deposits outside the United States fi rst began in Europe, but has now spread to all global 92
fi nancial centres.
Although Eurodollar liabilities are included as reservable liabilities, they have been assigned a required reserve ratio of zero since 1990, 93
making them similar to fed funds in terms of reserve requirements. Fed funds are not included as a reservable liability for the purpose of
reserve requirements.
Chart 64 Fed funds and EONIA dispersion
(basis points)
2006 2007 2008 2009 2010 2011 2012 2013
EONIA
fed funds
10
0
20
30
40
50
60
70
80
90
100
10
0
20
30
40
50
60
70
80
90
100
Sources: Federal Reserve, Euribor-EBF.Notes: Dispersion is computed as the daily standard deviation of contributions.

120ECB
Financial integration in Europe
April 2013
and a wider set of lenders, including money market funds and non-fi nancial corporations, both
domestic and foreign. There are no available data on Eurodollar volumes, but it is estimated that
the Eurodollar market has grown from about half to about twice the size of the federal funds market
since the mid-1980s.94
Some European banks also maintain branches in the United States that enable them to trade in
both Eurodollars and fed funds, as do US banks that maintain a segregated set of foreign accounts
(international banking facilities). Because of this partial overlap in the parent institutions, arbitrage
opportunities help to keep the Eurodollar and fed funds markets integrated. Indeed, research shows
that Eurodollar deposits and fed funds purchases are integrated, especially when market liquidity
is strong. However, while these markets are integrated in normal times, there was some divergence
during the fi nancial crisis.95 Differences between the set of participants transacting in these two
overnight market segments and their varied access to domestic deposits and central bank liquidity
can lead to differentiated money market pricing in times of market stress and low liquidity.
At the beginning of the fi nancial crisis, a decoupling between domestic and international USD
funding conditions exacerbated tensions in unsecured funding markets. However, Eurodollar trades
made in New York and fed funds trades did not become as untethered from one another as the
overnight USD London-Interbank Offered Rate (LIBOR) and fed funds (Chart 65).96
Given that USD LIBOR refl ects funding
conditions for certain non-US banks within
the panel, this signals some segmentation
between US and non-US banks. The fl ow of
deposits to domestic banks, supported by the
expanded FDIC insurance guarantee, may also
have lowered money market supply for foreign
institutions. In addition, the USD-EUR FX
swap basis widened markedly over this period,
further highlighting the importance of time zone
or geographical segmentation.97 Indeed, USD
LIBOR continues to exhibit more volatility than
fed funds or Eurodollars.
Similarly, foreign banks and corporates are
important market participants in the short-term
US commercial paper (CP) market. Among
unsecured (i.e. non asset-backed) commercial
paper, foreign issuance represents approximately
40% of total fi nancial CP outstanding and 20%
of total non-fi nancial CP outstanding.98 By
Bartolini, L., Hilton, S. and Prati, A. (2006), “Money Market Integration”, 94 IMF Working Paper, No 06/207.
McAndrews (2009), op. cit.95
As per the British Bankers’ Association website: The rate at which an individual contributor panel bank could borrow funds, were it to do 96
so by asking for and then accepting interbank offers in reasonable market size, just prior to 11.00am London time.
The central bank swap lines, which were utilised to beyond USD 500 billion in early 2009, are credited with moderating the divergence 97
in unsecured rates between fed funds and Eurodollar markets and helping to reduce the USD-EUR FX swap basis.
CP data is published on the Federal Reserve System’s website and derived from data supplied by the DTCC: http://www.federalreserve.98
gov/releases/cp/default.htm.
Chart 65 Various unsecured spreads to fed funds
(basis points)
-50
0
50
100
150
250
200
2007 2008 2009 2010 2011 2012 2013-50
0
50
100
150
250
200
LIBOR O/N – fed funds
Eurodollar – fed funds
commercial paper – fed funds
Sources: Federal Reserve and Wrightson ICAP.Notes: Spreads computed as one-month moving average. Commercial paper represents non asset-backed issuance from AA-rated non-fi nancial fi rms.

121ECB
Financial integration in Europe
April 2013
SPECIAL FEATURE D
contrast, the comparable short-term European
paper (STEP) market in the euro area is very
concentrated, with an estimated 93% of issuance
by euro area fi rms.99 The euro area is also largely
concentrated in one jurisdiction, France, which
accounts for half of euro area commercial paper,
whereas other countries’ commercial paper
markets are not as developed.100
The US commercial paper market has exhibited
reduced volumes and rates of unsecured funding
that have largely tracked fed funds. Commercial
paper outstanding peaked at USD 2.2 trillion
in July 2007 and stood at approximately
USD 1.0 trillion as of mid-March 2012. The
decline is attributable to risk aversion towards
fi nancial institutions that account for the
majority of CP issuance, reinforced by ratings
downgrades. In essence, the market has become
more concentrated.
In the United States, money market funds are currently the most active lenders of unsecured
short-term funds, including commercial paper. The role of regulatory pressure and risk aversion
in lowering unsecured short-term rates for money market funds is evident. Changes to SEC 2a-7
guidelines in 2010 have pushed money market funds towards top tier names. Specifi cally, SEC
guidelines have reduced the amount of second tier securities that a money market fund can hold. In
addition, downgrades of fi nancial institutions and their short-term programme ratings have shrunk
the universe of eligible securities. These pressures are thus leading to both lower money market
pricing and lower volumes, as market access is limited for lower-quality counterparties.
Money market fund risk aversion towards euro area banks over 2011-12 is refl ected in SEC data
(Chart 66). The shift from euro area banks to other non-US banks does not indicate a home bias,
but rather suggests that perceived risks from the euro area are driving money funds towards other
international banks, particularly those from Canada and Japan.
In addition, there are a number of other important unsecured US money market instruments,
including Treasury bills and agency discount notes. Short-term maturities in these actively traded,
high-quality debt markets show the same dynamics of very low rates.
SECURED MONEY MARKETS
During the crisis, volumes cleared on US repo infrastructure declined markedly relative to euro area
repo market volumes, signalling that differences in infrastructure can have potential ramifi cations
for the quantity of money market supply (see the US and euro area repo infrastructure box below). In addition, collateral shifted to safe US Treasury and agency collateral, as repos in
corporate and structured products were essentially no longer possible. These trends persisted
Source: ECB.99
Further discussion of euro area commercial paper can be found elsewhere in this report and in the ECB’s 2012 Money Market Study.100
Chart 66 Prime money market fund shifts in bank exposure, by region
(USD billions)
0
100
200
300
400
500
600
US Canada euroarea
otherEurope
Japan Australia/New
Zealand
other
0
100
200
300
400
500
600
December 2010
January 2013
Sources: SEC data and ECB calculations.
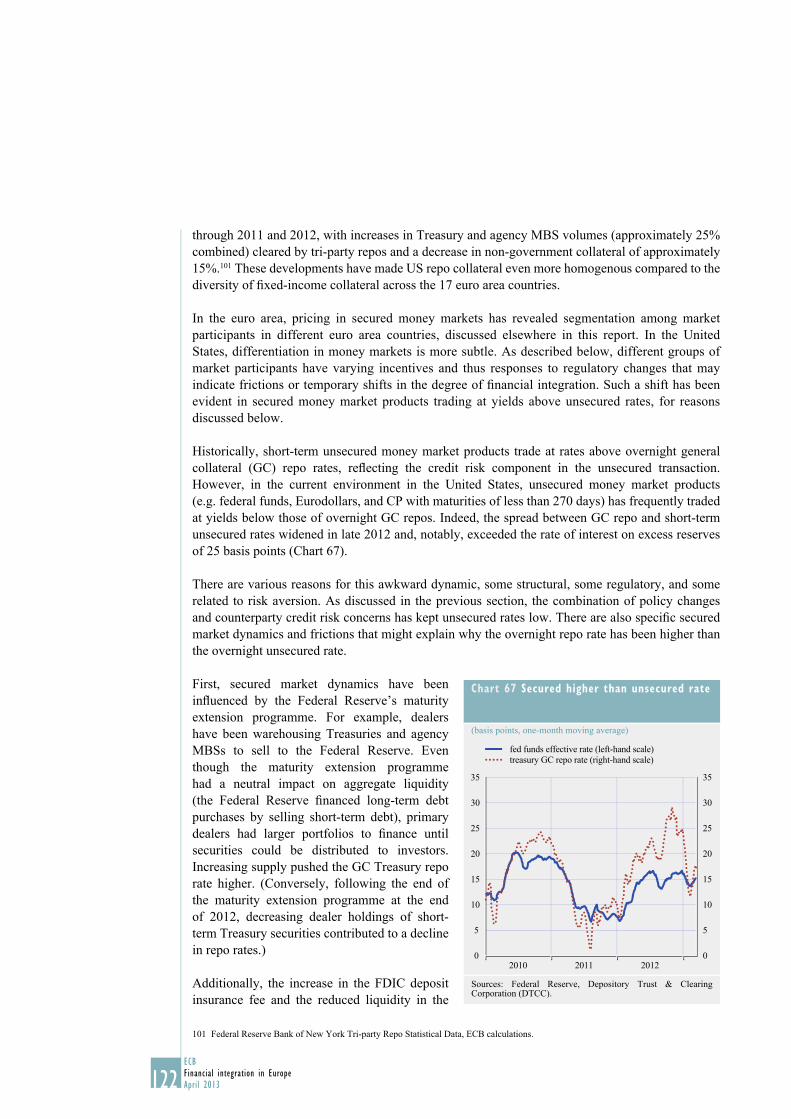
122ECB
Financial integration in Europe
April 2013
through 2011 and 2012, with increases in Treasury and agency MBS volumes (approximately 25%
combined) cleared by tri-party repos and a decrease in non-government collateral of approximately
15%.101 These developments have made US repo collateral even more homogenous compared to the
diversity of fi xed-income collateral across the 17 euro area countries.
In the euro area, pricing in secured money markets has revealed segmentation among market
participants in different euro area countries, discussed elsewhere in this report. In the United
States, differentiation in money markets is more subtle. As described below, different groups of
market participants have varying incentives and thus responses to regulatory changes that may
indicate frictions or temporary shifts in the degree of fi nancial integration. Such a shift has been
evident in secured money market products trading at yields above unsecured rates, for reasons
discussed below.
Historically, short-term unsecured money market products trade at rates above overnight general
collateral (GC) repo rates, refl ecting the credit risk component in the unsecured transaction.
However, in the current environment in the United States, unsecured money market products
(e.g. federal funds, Eurodollars, and CP with maturities of less than 270 days) has frequently traded
at yields below those of overnight GC repos. Indeed, the spread between GC repo and short-term
unsecured rates widened in late 2012 and, notably, exceeded the rate of interest on excess reserves
of 25 basis points (Chart 67).
There are various reasons for this awkward dynamic, some structural, some regulatory, and some
related to risk aversion. As discussed in the previous section, the combination of policy changes
and counterparty credit risk concerns has kept unsecured rates low. There are also specifi c secured
market dynamics and frictions that might explain why the overnight repo rate has been higher than
the overnight unsecured rate.
First, secured market dynamics have been
infl uenced by the Federal Reserve’s maturity
extension programme. For example, dealers
have been warehousing Treasuries and agency
MBSs to sell to the Federal Reserve. Even
though the maturity extension programme
had a neutral impact on aggregate liquidity
(the Federal Reserve fi nanced long-term debt
purchases by selling short-term debt), primary
dealers had larger portfolios to fi nance until
securities could be distributed to investors.
Increasing supply pushed the GC Treasury repo
rate higher. (Conversely, following the end of
the maturity extension programme at the end
of 2012, decreasing dealer holdings of short-
term Treasury securities contributed to a decline
in repo rates.)
Additionally, the increase in the FDIC deposit
insurance fee and the reduced liquidity in the
Federal Reserve Bank of New York Tri-party Repo Statistical Data, ECB calculations.101
Chart 67 Secured higher than unsecured rate
(basis points, one-month moving average)
0
5
10
15
20
25
30
35
0
5
10
15
20
25
30
35
2010 2011 2012
fed funds effective rate (left-hand scale)
treasury GC repo rate (right-hand scale)
Sources: Federal Reserve, Depository Trust & Clearing Corporation (DTCC).
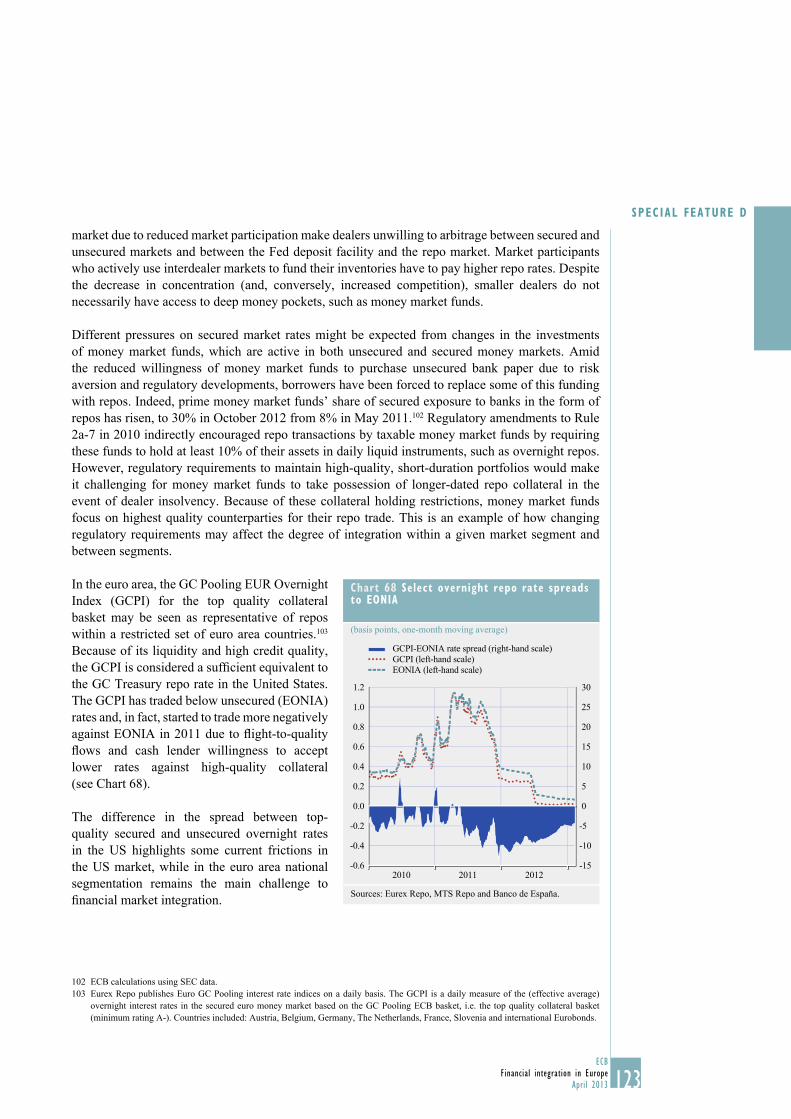
123ECB
Financial integration in Europe
April 2013
SPECIAL FEATURE D
market due to reduced market participation make dealers unwilling to arbitrage between secured and
unsecured markets and between the Fed deposit facility and the repo market. Market participants
who actively use interdealer markets to fund their inventories have to pay higher repo rates. Despite
the decrease in concentration (and, conversely, increased competition), smaller dealers do not
necessarily have access to deep money pockets, such as money market funds.
Different pressures on secured market rates might be expected from changes in the investments
of money market funds, which are active in both unsecured and secured money markets. Amid
the reduced willingness of money market funds to purchase unsecured bank paper due to risk
aversion and regulatory developments, borrowers have been forced to replace some of this funding
with repos. Indeed, prime money market funds’ share of secured exposure to banks in the form of
repos has risen, to 30% in October 2012 from 8% in May 2011.102 Regulatory amendments to Rule
2a-7 in 2010 indirectly encouraged repo transactions by taxable money market funds by requiring
these funds to hold at least 10% of their assets in daily liquid instruments, such as overnight repos.
However, regulatory requirements to maintain high-quality, short-duration portfolios would make
it challenging for money market funds to take possession of longer-dated repo collateral in the
event of dealer insolvency. Because of these collateral holding restrictions, money market funds
focus on highest quality counterparties for their repo trade. This is an example of how changing
regulatory requirements may affect the degree of integration within a given market segment and
between segments.
In the euro area, the GC Pooling EUR Overnight
Index (GCPI) for the top quality collateral
basket may be seen as representative of repos
within a restricted set of euro area countries.103
Because of its liquidity and high credit quality,
the GCPI is considered a suffi cient equivalent to
the GC Treasury repo rate in the United States.
The GCPI has traded below unsecured (EONIA)
rates and, in fact, started to trade more negatively
against EONIA in 2011 due to fl ight-to-quality
fl ows and cash lender willingness to accept
lower rates against high-quality collateral
(see Chart 68).
The difference in the spread between top-
quality secured and unsecured overnight rates
in the US highlights some current frictions in
the US market, while in the euro area national
segmentation remains the main challenge to
fi nancial market integration.
ECB calculations using SEC data.102
Eurex Repo publishes Euro GC Pooling interest rate indices on a daily basis. The GCPI is a daily measure of the (effective average) 103
overnight interest rates in the secured euro money market based on the GC Pooling ECB basket, i.e. the top quality collateral basket
(minimum rating A-). Countries included: Austria, Belgium, Germany, The Netherlands, France, Slovenia and international Eurobonds.
Chart 68 Select overnight repo rate spreads to EONIA
(basis points, one-month moving average)
-15
-10
-5
0
5
10
15
20
25
30
-0.6
-0.4
-0.2
0.0
0.2
0.4
0.6
0.8
1.0
1.2
2010 2011 2012
GCPI-EONIA rate spread (right-hand scale)
GCPI (left-hand scale)
EONIA (left-hand scale)
Sources: Eurex Repo, MTS Repo and Banco de España.
124ECB
Financial integration in Europe
April 2013
5 CONCLUSIONS
The diversity of market participants within the US institutional structure signals some degree of
the potential for money market segmentation in the sense of having diverging developments in
different segments of this market, particularly in times of stress.
There are differences in access to central bank liquidity among banks and non-bank entities.
While it has decreased in size, the non-bank or shadow banking system in the United States
continues to play an important role in short-term funding markets.
There are also differences in the provision of deposit insurance among domestic banks compared
to foreign banks. Some depository institutions that have central bank access do not arbitrage the
difference between short-term money market rates and interest on excess reserves because of a
higher assessment fee on their deposit insurance base. Excess liquidity – reinforced by strong
deposit growth on account of expanded FDIC insurance coverage – further reduces incentives to
participate in the short-term unsecured markets.
In normal times, an overlapping set of market participants in different markets can help to keep
markets integrated through arbitrage opportunities, although this can break down in times of
heightened risk aversion.
Integration of several market segments has benefi ted from expansionary and accommodative
policies following periods of severe stresses, but these policies also have consequences for the
composition of market participants. The changing participation of market participants in certain
US money market segments could point to further diverging developments across markets in future
periods of stress. However, the frictions experienced in the United States are not as large as the
fragmentation along national lines in the euro area.
Box 2
REPO INFRASTRUCTURE
In general, the market for general collateral repurchase agreements (GC repos) is viewed as a
safer and more reliable source of funding than uncollateralised money markets.1 However, the
near bankruptcy of Bear Stearns in March 2008 and the subsequent collapse of Lehman Brothers
in September 2008 triggered a global decline in repo volumes, with a particularly sharp decrease
in repos cleared on the US key infrastructure – tri-party repos. Given that infrastructure can play
a critical role in fostering greater integration within the fi nancial system,2 it is worth comparing
the US repo infrastructure with that of the euro area. The main difference is that, in the United
States, GC repos are cleared by two clearing banks, while in the euro area they are settled by
central securities depositories (CSDs).
1 A general collateral repo is a repurchase agreement in which the lender of funds is willing to accept any of a variety of Treasury,
Agency and other securities as collateral.
2 See “Strengthening repo clearing and settlement arrangements,” Bank for International Settlement/Committee on Payment and
Settlement Systems (September 2010) and ECB’s Euro money market study Box 4 (December 2010).
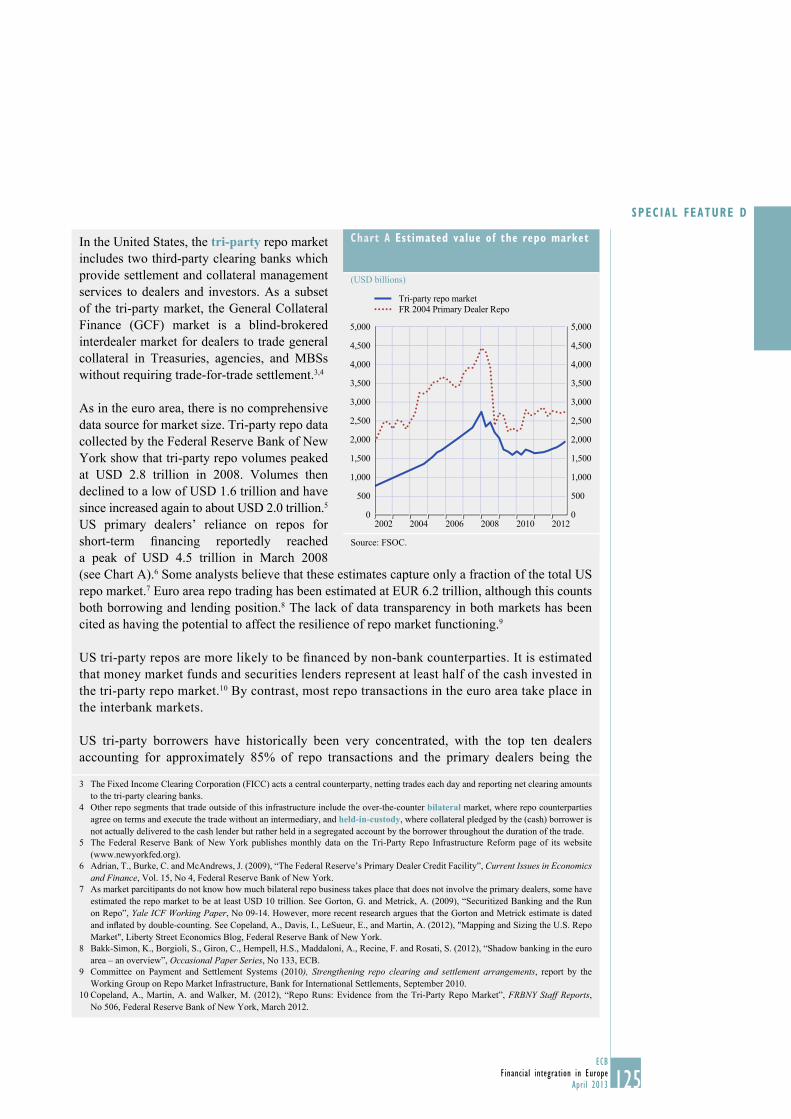
125ECB
Financial integration in Europe
April 2013
SPECIAL FEATURE D
In the United States, the tri-party repo market
includes two third-party clearing banks which
provide settlement and collateral management
services to dealers and investors. As a subset
of the tri-party market, the General Collateral
Finance (GCF) market is a blind-brokered
interdealer market for dealers to trade general
collateral in Treasuries, agencies, and MBSs
without requiring trade-for-trade settlement.3,4
As in the euro area, there is no comprehensive
data source for market size. Tri-party repo data
collected by the Federal Reserve Bank of New
York show that tri-party repo volumes peaked
at USD 2.8 trillion in 2008. Volumes then
declined to a low of USD 1.6 trillion and have
since increased again to about USD 2.0 trillion.5
US primary dealers’ reliance on repos for
short-term fi nancing reportedly reached
a peak of USD 4.5 trillion in March 2008
(see Chart A).6 Some analysts believe that these estimates capture only a fraction of the total US
repo market.7 Euro area repo trading has been estimated at EUR 6.2 trillion, although this counts
both borrowing and lending position.8 The lack of data transparency in both markets has been
cited as having the potential to affect the resilience of repo market functioning.9
US tri-party repos are more likely to be fi nanced by non-bank counterparties. It is estimated
that money market funds and securities lenders represent at least half of the cash invested in
the tri-party repo market.10 By contrast, most repo transactions in the euro area take place in
the interbank markets.
US tri-party borrowers have historically been very concentrated, with the top ten dealers
accounting for approximately 85% of repo transactions and the primary dealers being the
3 The Fixed Income Clearing Corporation (FICC) acts a central counterparty, netting trades each day and reporting net clearing amounts
to the tri-party clearing banks.
4 Other repo segments that trade outside of this infrastructure include the over-the-counter bilateral market, where repo counterparties
agree on terms and execute the trade without an intermediary, and held-in-custody, where collateral pledged by the (cash) borrower is
not actually delivered to the cash lender but rather held in a segregated account by the borrower throughout the duration of the trade.
5 The Federal Reserve Bank of New York publishes monthly data on the Tri-Party Repo Infrastructure Reform page of its website
(www.newyorkfed.org).
6 Adrian, T., Burke, C. and McAndrews, J. (2009), “The Federal Reserve’s Primary Dealer Credit Facility”, Current Issues in Economics and Finance, Vol. 15, No 4, Federal Reserve Bank of New York.
7 As market parcitipants do not know how much bilateral repo business takes place that does not involve the primary dealers, some have
estimated the repo market to be at least USD 10 trillion. See Gorton, G. and Metrick, A. (2009), “Securitized Banking and the Run
on Repo”, Yale ICF Working Paper, No 09-14. However, more recent research argues that the Gorton and Metrick estimate is dated
and infl ated by double-counting. See Copeland, A., Davis, I., LeSueur, E., and Martin, A. (2012), "Mapping and Sizing the U.S. Repo
Market", Liberty Street Economics Blog, Federal Reserve Bank of New York.
8 Bakk-Simon, K., Borgioli, S., Giron, C., Hempell, H.S., Maddaloni, A., Recine, F. and Rosati, S. (2012), “Shadow banking in the euro
area – an overview”, Occasional Paper Series, No 133, ECB.
9 Committee on Payment and Settlement Systems (2010), Strengthening repo clearing and settlement arrangements, report by the
Working Group on Repo Market Infrastructure, Bank for International Settlements, September 2010.
10 Copeland, A., Martin, A. and Walker, M. (2012), “Repo Runs: Evidence from the Tri-Party Repo Market”, FRBNY Staff Reports,
No 506, Federal Reserve Bank of New York, March 2012.
Chart A Estimated value of the repo market
(USD billions)
0
500
1,000
1,500
2,000
2,500
3,000
3,500
4,000
4,500
5,000
0
500
1,000
1,500
2,000
2,500
3,000
3,500
4,000
4,500
5,000
2002 2004 2006 2008 2010 2012
Tri-party repo market
FR 2004 Primary Dealer Repo
Source: FSOC.

126ECB
Financial integration in Europe
April 2013
most active borrowers.11 However, the
concentration in the tri-party market appears
to be declining, which market participants
attribute to regulatory pressure to reduce
reliance on overnight repo fi nancing.
Furthermore, some analysts expect that
this could become a trend as dealers aim
for compliance with Basel III’s Liquidity
Coverage Ratio (LCR) (see Chart B).
The fi nancial crisis highlighted weaknesses in
the US tri-party repo infrastructure, as it was
revealed that the two tri-party banks are the
largest creditors in the tri-party repo market
on each business day. This is the direct result
of the clearing banks’ practice of unwinding
all maturing (overnight) and non-maturing
(term) repos at the start of the processing day
and settling new repos near the close of the
processing day.12 The extension of signifi cant
amounts of intraday credit – the exposure of a clearing bank to a single dealer can routinely
exceed USD 100 billion – creates vulnerabilities for the repo infrastructure itself and for repo
market counterparties. As a result, there are various reform efforts underway.13
In the United States, an alternative process in place of unwinds could be achieved by substituting
collateral (including cash) into repo deals without unwinding them. However, the process of
collateral allocation is complex and poses time constraints. For example, in the current market
infrastructure, the tri-party collateral allocation process takes several hours, in part because most
dealers also trade in the GCF repo market and may wait for GCF trades to settle before completing
their tri-party repo allocations – an example of segmentation between market infrastructures.
The US structure compares with the infrastructure environment in the euro area, where certain
national systems did not experience a reduction in tri-party repos during the crisis. Specifi cally,
greater resilience was demonstrated during the fi nancial crisis by euro area repo transactions
cleared by central counterparties than by bilateral and tri-party repos.14 By contrast, in the United
States, the clearing of repos by central counterparties is limited, and there is greater reliance on
the clearing bank infrastructure.
Through the day collateral substitution is prevalent in European tri-party repo markets. In German
(Euro GC pooling segment), French (Euro GC) and Swiss repo markets, CSDs are aligned
and integrated with central eligibility criteria and operations, allowing the re-use of collateral
previously received in interbank repos for central bank liquidity. By contrast, US clearing banks
11 Federal Reserve Bank of New York (2010), “Tri-Party Repo Infrastructure Reform”, White Paper, May 2010.
12 Thus, a “term repo” is effectively an interrupted sequence of overnight repos.
13 For a fuller discussion of repo market dynamics, risks, and reforms, see Copeland, A., Duffi e, D., Martin, A. and McLaughlin, S. (2012),
“Key Mechanics of the U.S. Tri-Party Repo Market”, Economic Policy Review, Federal Reserve Bank of New York, forthcoming,
Committee on Payment and Settlement Systems (2010), op. cit., and, Copeland, A., Martin, A. and Walker, M. (2010), “The tri-party
repo market before the 2010 reforms”, FRBNY Staff Reports, No 477, Federal Reserve Bank of New York, November 2010.
14 Committee on Payment and Settlement Systems (2010), op. cit,; see also Box 4 in the ECB’s 2010 Euro Money Market Study.
Chart B Market share of top three tri-partyrepo dealers
(percentage)
20
25
30
35
40
45
50
20
25
30
35
40
45
50
Q2 Q3 Q4 Q3 Q4Q1 Q2 Q3 Q4Q1 Q2
treasury
agency MBS
2010 2011 2012
Source: Federal Reserve.

127ECB
Financial integration in Europe
April 2013
SPECIAL FEATURE D
have offered some automated collateral substitution capabilities to US tri-party repo market
participants only since June 2011.15
In the United States, the Federal Reserve provides intraday credit to banks including the two
clearing banks, which can then provide intraday credit to their participants. In France and
Germany, the CSD provides an automated mechanism whereby a repo participant can receive
automatic intraday credit from the central bank.
Efforts continue in United States to improve repo infrastructure, spearheaded by the Federal
Reserve. In the euro area, the removal of residual geographical segmentation in securities
settlement in the euro area is expected to benefi t from the forthcoming implementation of the
TARGET2Securities project. Even more signifi cantly, the removal of the repatriation requirement
from the Correspondent Central Bank Model (CCBM) and the implementation of cross-border
tri-party collateral management services within the Eurosystem’s collateral framework in 2014
represent enhancements to central bank services that will foster fi nancial integration and increase
liquidity of the euro area repo market. The process of integration would be completed by the full
interoperability between market facilities for tri-party repo services. The Eurosystem is working
with the industry in order to achieve such integration as soon as possible.
15 Copeland et al. (2012), op. cit.

1ECB
Financial integration in Europe
April 2013S
FINANCIAL INTEGRATION INDICATORS 2013
EXPLANATION OF COUNTRY GROUPINGS S3
MONEY MARKET INDICATORS
Price-based indicators
Chart 1 Cross-country standard deviation of average unsecured interbank lending
rates across euro area countries (EONIA, EURIBOR) S4
Chart 2 Daily volumes and 30-day moving averages for the EONIA panel S5
Chart 3 Cross-country standard deviation of average interbank repo rates across
euro area countries (EUREPO) S6
Quantity-based indicators
Chart 4 Borrowing activity in the euro area secured and unsecured markets S7
Chart 5 Geographical counterparty breakdown for secured and unsecured transactions S8
Chart 6 Recourse to the ECB’s market operations and standing facilities S9
Chart 7 Use of cross-border collateral in Eurosystem monetary policy operations S10
Other indicator
Chart 8 TARGET2’s share of inter-Member State payments in terms of volume
and value S10
SECURITIES MARKET INDICATORS
Price-based indicators
Chart 9 Dispersion in fi ve-year CDS premia across the euro area S12
Chart 10 Country and sector dispersions in euro area equity returns S13
Chart 11 Proportion of variance in euro area country equity returns explained
by euro area and US stock market shocks S14
Chart 12 Euro area and US shock spillover intensity in individual euro area countries S15
Chart 13 Dispersion of euro area ten-year sovereign bond yields S16
Chart 14 Sovereign and bank CDS premia – euro area and United States S17
Chart 15 Equity and government bond market integration based on common
factor portfolios S18
Chart 16 Equity market segmentation in distressed and non-distressed countries S19
Quantity-based indicators
Chart 17 Share of MFI cross-border holdings of debt securities issued by euro area
and EU corporates and sovereigns S19
Chart 18 Investment funds’ holdings of debt securities issued in other euro area
countries and the rest of the world S20
Chart 19 Investment funds’ holdings of equity issued in other euro area countries
and the rest of the world S20
Chart 20 The degree of cross-border holdings of equity issued by euro area residents S21
STATISTICAL ANNEX

2ECB
Financial integration in Europe
April 2013 S
STAT IST ICAL ANNEX
BANKING MARKET INDICATORS
Structural indicator
Chart 21 Dispersion of the total assets of foreign branches and subsidiaries of euro area
banks across euro area countries S22
Activity-based indicators
Chart 22 MFI loans to non-MFIs: outstanding amounts by residency of counterparty S23
Chart 23 MFI loans to MFIs: outstanding amounts by residency of counterparty S23
Chart 24 MFI holdings of securities issued by MFIs: outstanding amounts by residency
of counterparty S23
Chart 25 MFI deposits from MFIs: outstanding amounts by residency of counterparty S23
Chart 26 Interest rates on new loans to euro area non-fi nancial corporations S24
Chart 27 Interest rates on MFI deposits for households in the euro area S25
Chart 28 MFI loans to non-fi nancial corporations S25
Chart 29 Standard deviation of banks’ CDS premia by country group S26
Survey-based indicator
Chart 30 Changes in credit standards S27
Price-based indicators
Chart 31 Cross-country standard deviation of MFI interest rates on new loans
to non-fi nancial corporations S27
Chart 32 Cross-country standard deviation of MFI interest rates on loans to households S28
Other indicator
Chart 33 Credit transfer and direct debit transactions processed in SEPA format in the
euro area S29
DEVELOPMENT INDICATORS
Chart 34 Size of capital markets S30
Chart 35 Debt securities issued by non-fi nancial corporations S31
Chart 36 Venture capital fi nance S31
Chart 37 Private equity investments by independent funds S31
Chart 38 Pricing of global and regional information in the stock market S32
3ECB
Financial integration in Europe
April 2013S
EXPLANATION OF THE COUNTRY GROUPINGS
In this year’s fi nancial integration report, some fi nancial integration indicators show not only the
average across all euro area countries, but also a distinction between two groups of countries.
The reason is that some fi nancial integration phenomena can only be presented effectively when
fi nancial market developments of country groups are compared with each other. A simple average
across all countries could hide or blur important fi nancial integration developments for some
indicators in the statistical annex, in particular in the money markets.
To make the distinction between country groups, a clear fi nancial market criterion was selected in
order to achieve an objective result which does not involve discretion. The grouping of countries is
based on long-term sovereign interest rates for bonds with a remaining maturity of approximately
ten years. The calculation of the average spread against the German long term sovereign interest
rate is based on monthly data between January 2007 and November 2012. This factual criterion,
which is simple and should thus be interpreted with due caution, leads to the following country
groups:
• Countries with the highest sovereign interest rates: Cyprus, Greece, Ireland, Italy, Portugal,
Slovenia and Spain. In the statistical annex, this group of countries is called “countries under
fi nancial stress” or “distressed countries”.
• Countries with the lowest and intermediate rates: Austria, Belgium, Estonia, Finland, France,
Germany, Luxembourg, Malta, the Netherlands and Slovakia. In the statistical annex, this group
of countries is called “non-distressed countries”.
Some fi nancial integration indicators broken down by country grouping do not incorporate all the
countries mentioned above, as data is sometimes not available for all countries. Where this is the
case, the description of the respective indicator explains which countries are included.
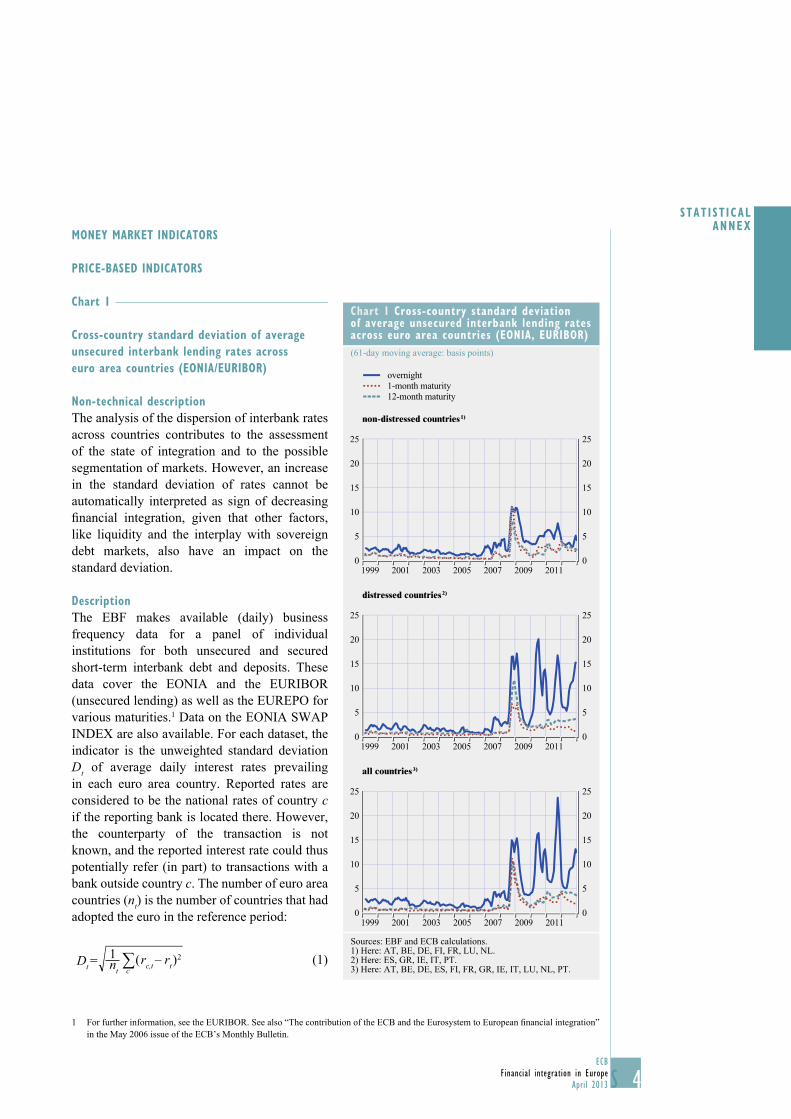
4ECB
Financial integration in Europe
April 2013 S
STAT IST ICAL ANNEX
MONEY MARKET INDICATORS
PRICE-BASED INDICATORS
Chart 1
Cross-country standard deviation of average
unsecured interbank lending rates across
euro area countries (EONIA/EURIBOR)
Non-technical description
The analysis of the dispersion of interbank rates
across countries contributes to the assessment
of the state of integration and to the possible
segmentation of markets. However, an increase
in the standard deviation of rates cannot be
automatically interpreted as sign of decreasing
fi nancial integration, given that other factors,
like liquidity and the interplay with sovereign
debt markets, also have an impact on the
standard deviation.
Description
The EBF makes available (daily) business
frequency data for a panel of individual
institutions for both unsecured and secured
short-term interbank debt and deposits. These
data cover the EONIA and the EURIBOR
(unsecured lending) as well as the EUREPO for
various maturities.1 Data on the EONIA SWAP
INDEX are also available. For each dataset, the
indicator is the unweighted standard deviation
Dt of average daily interest rates prevailing
in each euro area country. Reported rates are
considered to be the national rates of country c
if the reporting bank is located there. However,
the counterparty of the transaction is not
known, and the reported interest rate could thus
potentially refer (in part) to transactions with a
bank outside country c. The number of euro area
countries (nt) is the number of countries that had
adopted the euro in the reference period:
Dt = ( rc,t – rt )21
nt∑
c (1)
1 For further information, see the EURIBOR. See also “The contribution of the ECB and the Eurosystem to European fi nancial integration”
in the May 2006 issue of the ECB’s Monthly Bulletin.
Chart 1 Cross-country standard deviation of average unsecured interbank lending rates across euro area countries (EONIA, EURIBOR)
(61-day moving average: basis points)
overnight
1-month maturity
12-month maturity
non-distressed countries 1)
0
5
10
15
20
25
0
5
10
15
20
25
1999 2001 2003 2005 2007 2009 2011
distressed countries 2)
0
5
10
15
20
25
0
5
10
15
20
25
1999 2001 2003 2005 2007 2009 2011
all countries 3)
0
5
10
15
20
25
0
5
10
15
20
25
1999 2001 2003 2005 2007 2009 2011
Sources: EBF and ECB calculations.1) Here: AT, BE, DE, FI, FR, LU, NL.2) Here: ES, GR, IE, IT, PT.3) Here: AT, BE, DE, ES, FI, FR, GR, IE, IT, LU, NL, PT.

5ECB
Financial integration in Europe
April 2013S
where rc,t is the unweighted average of the interest rate ri,tc reported by each of the panel banks mc at
time t in country c:
rc,t = r ci,t
1mc∑ (2)
The euro area average rt is calculated as the unweighted average of the national average interest
rates rc,t. The data are smoothed by calculating a 61 (business) day centred moving average of the
standard deviation, transformed into monthly fi gures and taking the end-of-month observation of
the smoothed series. For indicative series prices (EURIBOR, EUREPO), the data are corrected for
obvious outliers. The computed indicator has a monthly frequency.
Additional information
The EONIA is the effective overnight reference rate for the euro. The banks contributing to the EONIA
are the same as the EURIBOR panel banks (composed of banks resident in the euro area and in other EU
Member States, as well as some international banks). The EURIBOR is the rate at which euro interbank
term deposits are offered by one prime bank to another within the euro area.
Chart 2
Daily volumes and 30-day moving averages for
the EONIA panel
Non-technical description
A lower daily number of banks trading in the
EONIA interbank market, besides being a
signal of possible increasing fragmentation of
the market, has an impact on the values of the
indicators calculated above.
Description
This chart shows the number of banks in the
EONIA panel for which a price is available on a
given date. The centred 30-day moving average
is also displayed.
Chart 2 Daily volumes and 30-day moving averages for the EONIA panel
(EUR million)
0
10,000
20,000
30,000
40,000
50,000
60,000
70,000
80,000
90,000
0
10,000
20,000
30,000
40,000
50,000
60,000
70,000
80,000
90,000
1999 2001 2003 2005 2007 2009 2011
daily volumes
daily volumes: 30 days moving average
Sources: EBF and ECB calculations.

6ECB
Financial integration in Europe
April 2013 S
STAT IST ICAL ANNEX
Chart 3
Cross-country standard deviation of average
interbank repo rates across euro area countries
(EUREPO)
Non-technical description
The analysis of the dispersion of interbank rates
across countries contributes to the assessment
of the state of integration and to the possible
segmentation of markets. However an increase
in the standard deviation of rates cannot be
automatically interpreted as sign of decreasing
fi nancial integration, given that other factors,
like liquidity and the interplay with sovereign
debt markets, also have an impact on the
standard deviation.
Description
The EBF makes available (daily) business
frequency data for a panel of individual
institutions for both unsecured and secured
short-term interbank debt and deposits. These
data cover the EONIA and the EURIBOR
(unsecured lending) as well as the EUREPO
for various maturities.1 Data on the EONIA
SWAP INDEX are also available. For each
dataset, the indicator is the unweighted
standard deviation Dt of average daily
interest rates prevailing in each euro area
country. Reported rates are considered to
be the national rates of country c if the
reporting bank is located there. However,
the counterparty of the transaction is not
known, and the reported interest rate could
thus potentially refer (in part) to transactions
with a bank outside country c. The number
of euro area countries nt is the number of
countries that had adopted the euro in the
reference period:
Dt = ( rc,t – rt )21
nt∑
c (3)
where rc,t is the unweighted average of the
interest rate ri,tc reported by each of the panel
banks mc at time t in country c:
rc,t = r ci,t
1mc∑ (4)
Chart 3 Cross-country standard deviation of average interbank repo rates across euro area countries (EUREPO)
(61-day moving average: basis points)
1-month maturity
12-month maturity
non-distressed countries 1)
0
1
2
3
4
5
6
7
8
9
1
2
3
4
5
6
7
8
9
10
0
10
2003 20052004 2006 2008 20092007 2010 2011 2012
distressed countries 2)
0
1
2
3
4
5
6
7
8
9
10
0
1
2
3
4
5
6
7
8
9
10
2003 2004 2005 2006 2007 2008 2009 2010 2011 2012
all countries 3)
2003 2008 2009 2010 2011 201220062004 2005 20070
1
2
3
4
5
6
8
7
9
10
0
1
2
3
4
5
6
8
7
9
10
Sources: EBF and ECB calculations.1) AT, BE, DE, FI, FR, LU and NL.2) ES, GR, IE, IT and PT.3) AT, BE, DE, ES, FI, FR, GR, IE, IT, LU, NL and PT.
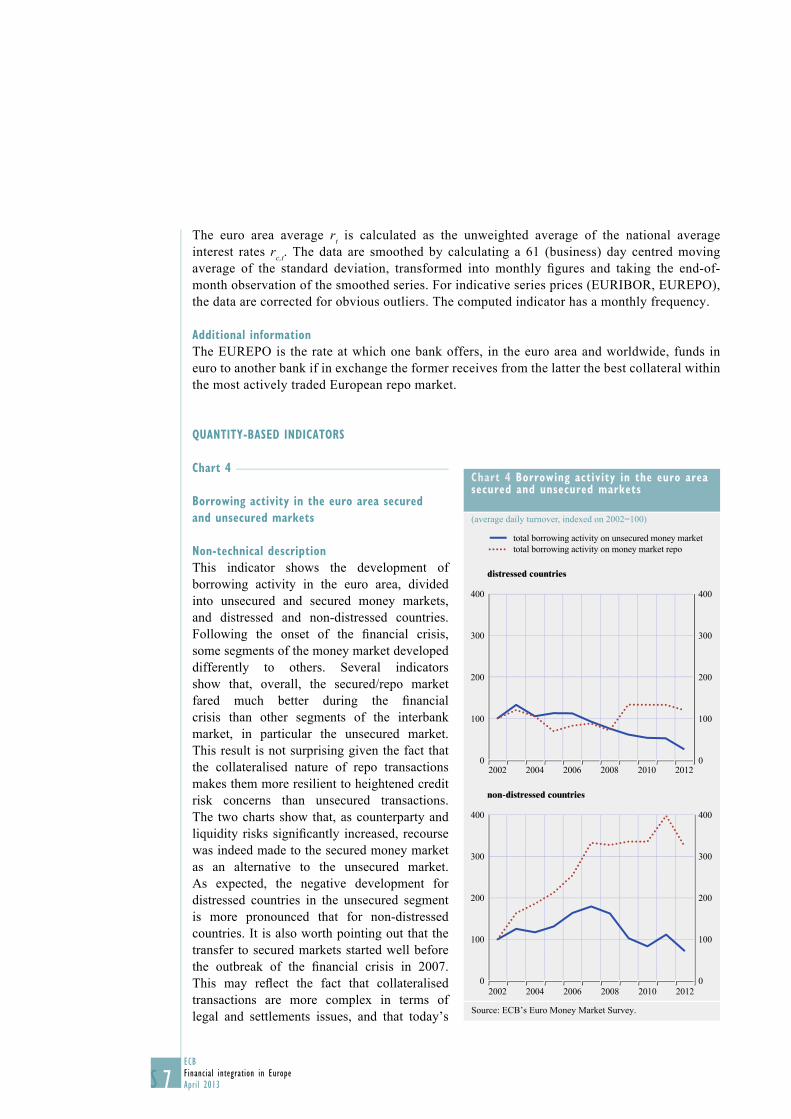
7ECB
Financial integration in Europe
April 2013S
The euro area average rt is calculated as the unweighted average of the national average
interest rates rc,t. The data are smoothed by calculating a 61 (business) day centred moving
average of the standard deviation, transformed into monthly fi gures and taking the end-of-
month observation of the smoothed series. For indicative series prices (EURIBOR, EUREPO),
the data are corrected for obvious outliers. The computed indicator has a monthly frequency.
Additional information
The EUREPO is the rate at which one bank offers, in the euro area and worldwide, funds in
euro to another bank if in exchange the former receives from the latter the best collateral within
the most actively traded European repo market.
QUANTITY-BASED INDICATORS
Chart 4
Borrowing activity in the euro area secured
and unsecured markets
Non-technical description
This indicator shows the development of
borrowing activity in the euro area, divided
into unsecured and secured money markets,
and distressed and non-distressed countries.
Following the onset of the fi nancial crisis,
some segments of the money market developed
differently to others. Several indicators
show that, overall, the secured/repo market
fared much better during the fi nancial
crisis than other segments of the interbank
market, in particular the unsecured market.
This result is not surprising given the fact that
the collateralised nature of repo transactions
makes them more resilient to heightened credit
risk concerns than unsecured transactions.
The two charts show that, as counterparty and
liquidity risks signifi cantly increased, recourse
was indeed made to the secured money market
as an alternative to the unsecured market.
As expected, the negative development for
distressed countries in the unsecured segment
is more pronounced that for non-distressed
countries. It is also worth pointing out that the
transfer to secured markets started well before
the outbreak of the fi nancial crisis in 2007.
This may refl ect the fact that collateralised
transactions are more complex in terms of
legal and settlements issues, and that today’s
Chart 4 Borrowing activity in the euro area secured and unsecured markets
(average daily turnover, indexed on 2002=100)
total borrowing activity on money market repo
total borrowing activity on unsecured money market
distressed countries
400
300
200
100
0
400
300
200
100
02002 2004 2006 2008 2010 2012
non-distressed countries
400
300
200
100
0
400
300
200
100
02002 2004 2006 2008 2010 2012
Source: ECB’s Euro Money Market Survey.

8ECB
Financial integration in Europe
April 2013 S
STAT IST ICAL ANNEX
non-distressed countries were sophisticated enough in early 2000 to conduct these types of
transaction.
Description
The data for these charts are related to the Euro Money Market Survey, conducted annually by the
ECB with panel banks who report their activity in the different segments of the money market.
To compute the data, we fi rst divided the banks in two sub-panels: distressed countries and
non-distressed countries. Then for each sub-panel we add the total borrowing activity on
unsecured markets (blue line) and the total borrowing activity on repo markets (red line).
The initial numbers correspond to the average daily turnover in the second quarter of each
year, with 2002 as the base year.
Chart 5
Geographical counterparty breakdown
for secured and unsecured transactions
Non-technical description
The charts display the shares in percentage
points of different geographical locations of
counterparties in transactions in the money
markets. Secured and unsecured transactions
are combined, but the development is
mainly driven by secured transactions,
as this market segment is larger than the
unsecured market. The charts show that
the share of domestic transactions is higher
for distressed countries, while the share of
transactions with other euro area countries
is higher for non-distressed countries. Thus,
non-distressed countries are more able to
conduct cross-border transactions which
highlight fi nancial fragmentation between the
groups of countries. The increased exposure
to domestic counterparties in 2012 for both
groups refl ects the continuing concerns about
the sovereign debt crisis and its spillover to
the respective banking systems.
Description
The data for these charts are related to the
Euro Money Market Survey, conducted
annually by the ECB with panel banks who
report their activity in the different segments
of the money market. In the survey, the
banks report their activity in the secured and
Chart 5 Geographical counterparty breakdown for secured and unsecured transactions
(percentage of total transactions)
other
euro areadomestic
distressed countries
0
20
40
60
80
100
0
20
40
60
80
100
2002 2004 2006 2008 2010 2012
non-distressed countries
0
20
40
60
80
100
0
20
40
60
80
100
2002 2004 2006 2008 2010 2012
Source: ECB’s Euro Money Market Survey.
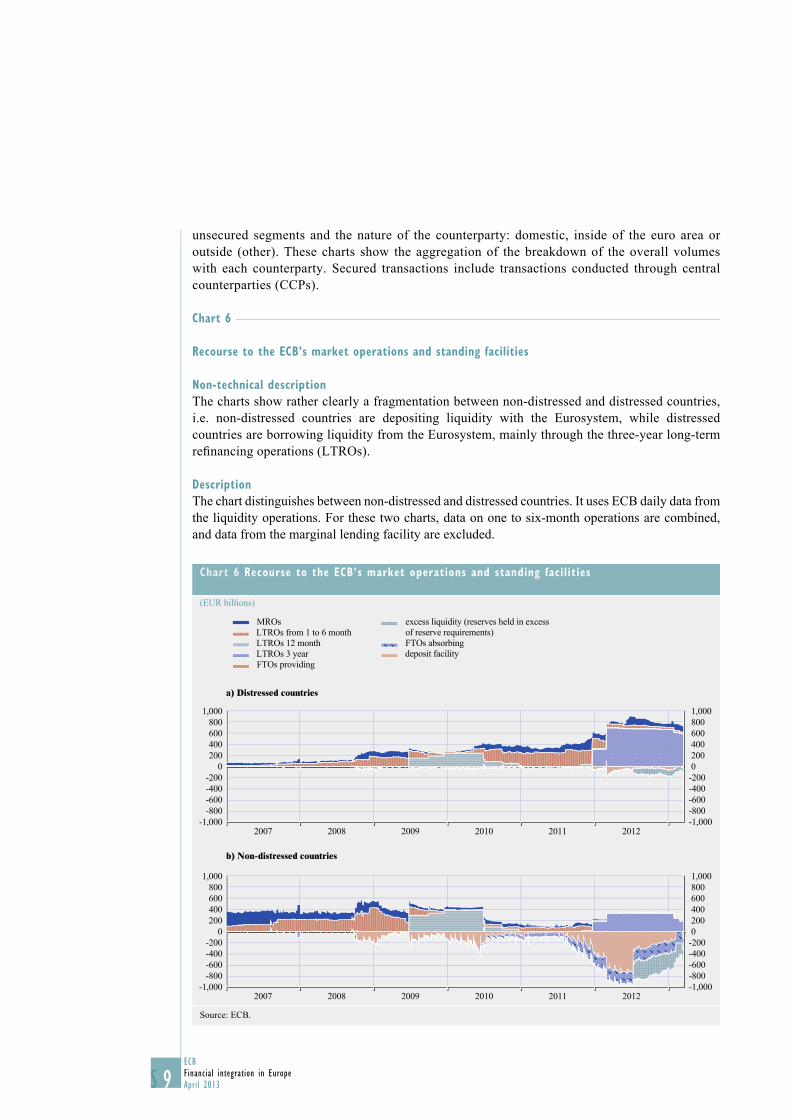
9ECB
Financial integration in Europe
April 2013S
unsecured segments and the nature of the counterparty: domestic, inside of the euro area or
outside (other). These charts show the aggregation of the breakdown of the overall volumes
with each counterparty. Secured transactions include transactions conducted through central
counterparties (CCPs).
Chart 6
Recourse to the ECB’s market operations and standing facilities
Non-technical description
The charts show rather clearly a fragmentation between non-distressed and distressed countries,
i.e. non-distressed countries are depositing liquidity with the Eurosystem, while distressed
countries are borrowing liquidity from the Eurosystem, mainly through the three-year long-term
refi nancing operations (LTROs).
Description
The chart distinguishes between non-distressed and distressed countries. It uses ECB daily data from
the liquidity operations. For these two charts, data on one to six-month operations are combined,
and data from the marginal lending facility are excluded.
Chart 6 Recourse to the ECB’s market operations and standing facilities
(EUR billions)
MROs
LTROs from 1 to 6 month
LTROs 12 month
LTROs 3 year
FTOs providing
excess liquidity (reserves held in excess
of reserve requirements)
FTOs absorbing
deposit facility
a) Distressed countries
-800
-600
-400
-200
0
200
400
600
800
1,000
-1,000
-800
-600
-400
-200
0
200
400
600
800
1,000
2007 2008 2009 2010 2011 2012-1,000
b) Non-distressed countries
-1,000
-800
-600
-400
-200
0
200
400
600
800
1,000
-1,000
-800
-600
-400
-200
0
200
400
600
800
1,000
2007 2008 2009 2010 2011 2012
Source: ECB.

10ECB
Financial integration in Europe
April 2013 S
STAT IST ICAL ANNEX
Chart 7
Use of cross-border collateral in
Eurosystem monetary policy operations
Non-technical description
Since the start of the fi nancial turmoil, there has
been a trend away from posting cross-border
collateral and towards greater use of domestic
collateral in Eurosystem liquidity-providing
operations, in particular for distressed countries.
This trend has intensifi ed since the onset of the
euro area sovereign debt crisis. The greater use
of domestic collateral can be attributed both
to an increasing home bias among investors
and to an increase in the use of self-originated
marketable assets as collateral.
Description
The chart distinguishes between distressed and
non-distressed countries. It uses weekly data
from the Use of Collateral Database (UCDB)
and combines the residence information on the
counterparty and the issuer of the asset.
Additional information
An asset is regarded as being used on a cross-border basis when the issuer of the asset and the
counterparty using it as collateral with the Eurosystem reside in different jurisdictions.
OTHER INDICATOR
Chart 8
TARGET2’s share of inter-Member State
payments in terms of volume and value
Non-technical description
The chart presents the share of cross-border
payments in the overall traffi c settled in
TARGET2 (both in terms of number and value
of payments). The share of the number of cross-
border payments grew since 2008 following the
launch of the TARGET2 single shared platform,
as the new system offered banks further
opportunities to centralise their payments
processing.
Chart 8 TARGET2’s share of inter-Member State payments in terms of volume and value
(percentage of total payments)
0
5
10
15
20
25
30
35
40
45
0
5
10
15
20
25
30
35
40
45
value of payments number of payments
1999
2000
2001
2002
2003
2009
2010
2011
2012
2004
2005
2006
2007
2008
Source: ECB.
Chart 7 Use of cross-border collateral in Eurosystem monetary policy operations
(percentage of total collateral use)
0
10
20
30
40
50
60
70
80
0
10
20
30
40
50
60
70
80
2008 2009 2010 2011 2012
distressed countries
non-distressed countries
Source: ECB.

11ECB
Financial integration in Europe
April 2013S
As regards the share of cross-border payments in value terms, the drop observed in 2008 mainly
results from a change in the calculation methodology. In subsequent years, the strained market
activity following the fi nancial crisis explains why it has not grown in a way similar to the
cross-border share in number of payment.
Description
The fi rst indicator shows the share by value of payments between EU Member States (inter-Member
State payments) in the total value of payments processed in TARGET2. With the exception of some
irregular increases/decreases recorded in 2000, 2001 and 2008 (following closure of other euro
payment systems or changes in the statistical method), a general increase can be observed up to
2007, refl ecting the positive contribution of TARGET1 to the integration of large-value payment
activities. However, from 2008 onwards, the share remains roughly stable or declines slightly,
owing to a deterioration in market conditions with, in particular, fewer cross-border money market
transactions being settled in TARGET2. While these money market transactions are relatively small
in number, their average value is much higher than that of other payments, which is why market
conditions affect the cross-border share in terms of value more than in terms of volume.
The second indicator shows the share by number of payments between EU Member States
(inter-Member State payments) in the total number of payments processed in TARGET2. The
graph shows a general increase in this indicator, in particular from 2008 onwards. Before 2008,
in the decentralised TARGET1 system, multi-country banks (or banking groups) had accounts in
most countries in which they operated. Consequently, a large share of the traffi c they generated
in TARGET1 was treated as “domestic”. In TARGET2, these banking groups concentrate their
intraday liquidity management and their payment processing in one account, usually with the
national central bank of the country in which they have their head offi ce. For that reason, a higher
share of their payments traffi c is now “cross-border”.
In spite of the fact that both indicators include transactions in connection with monetary policy
operations, their impact on the trends is considered negligible. In principle, as such transactions
are treated as “domestic”, they would typically increase the value of domestic payments, thereby
reducing the cross-border share. However, the impact of these operations is extremely limited
compared to the average daily turnover of TARGET2, which amounts €2.7 trillion. Even the
LTROs do not signifi cantly change the overall picture, as the value they generate in TARGET on
one specifi c day is marginal when spread over an entire year.
Additional information
TARGET is the real-time gross settlement system for the euro. A second-generation system
(TARGET2) operating on a single shared platform was launched in November 2007 and fully
replaced the former decentralised system in May 2008. In TARGET2, an “inter-Member State
payment” is a payment between counterparties who maintain accounts with different national
central banks participating in TARGET2. An “intra-Member State payment” is a payment between
counterparties who maintain accounts with the same national central bank.

12ECB
Financial integration in Europe
April 2013 S
STAT IST ICAL ANNEX
SECURITIES MARKET INDICATORS
PRICE-BASED INDICATORS
Chart 9
Dispersion in five-year CDS premia across
the euro area
Non-technical description
We consider here the dispersion of credit
default swap (CDS) premia of different sectors
to highlight the degree of dispersion of the
cost of funding for different entities at euro
area level (while the CDS premium primarily
refl ects the cost of insuring debt against
default, the premium can also be regarded as a
proxy for the cost of funding). The higher the
dispersion is at industry level for the euro area
(so removing possible country specialisations
that could bias the dispersion), the lower
the integration is for the fi nancing of these
entities (sovereigns, banks and telecoms) at
euro area level.
Description
These indicators are computed as the standard deviation of fi ve-year CDS premia for different sectors
at the euro area level. The three sectors considered are sovereigns, telecommunications and banks to
constitute groups of homogenous entities with comparable credit risk at the euro area level.
Additional information/notes
The data do not include Greece and Ireland. Greece is excluded owing to very high sovereign CDS
premia, and Ireland is excluded owing to the very high CDS premia of its telecommunications
company.
“Sovereign” includes Austria, France, Germany, Italy, the Netherlands, Portugal and Spain.
Commercial banks include ABN AMRO (NL), Alpha Bank (GR), Allied Irish Banks (IE), Banca
Monte dei Paschi di Siena (IT), Banca Popolare di Milano (IT), Banco Comercial Português (PT),
Banco Sabadell (ES), Banco Espirito Santo (PT), Banco Santander Central Hispano (ES), Erste
Bank der österreichischen Sparkassen (AT), Bank of Ireland (IE), Bayerische HypoVereinbank
(DE), BNP Paribas (FR), Commerzbank (DE), Crédit Agricole (FR), Deutsche Bank (DE), Dexia
Group (BE), EFG Eurobank Ergasias (GR), Fortis NL (NL), Intesa Sanpaolo SPA (IT), Mediobanca
(IT), Natixis (FR), National Bank of Greece (GR), Nordea Bank (FI), Piraeus Group Finance PLC
(GR), Société Générale (FR) and UniCredito Italiano (IT).
“Telecom” includes Deutsche Telekom (DE), France Telecom (FR), Hellenic Telecommunications
Organization (GR), KPN (NL), Portugal Telecom (PT), Telecom Italia (IT), Telefōnica (ES) and
Telekom Austria (AT).
Chart 9 Dispersion in five-year CDS premia across the euro area
(daily data; basis points)
0
100
200
300
400
500
600
700
0
100
200
300
400
500
600
700
2004 2005 2006 2007 2008 2009 2010 2011 2012
banks (excluding Ireland and Greece)
sovereign (excluding Ireland and Greece)
telecom (excluding Ireland and Greece)
Sources: Thomson Reuters and ECB calculations.

13ECB
Financial integration in Europe
April 2013S
Chart 10
Country and sector dispersions
in euro area equity returns
Non-technical description
This chart presents the dispersion in equity
returns, across sectors and across countries, in the
euro area for a period of over 35 years to refl ect
structural changes in the aggregate euro area
equity market. Under full fi nancial segmentation,
limited diversifi cation opportunities for investors
mean that they demand a high return for holding
shares in undiversifi ed fi rms, so cross-country
dispersion (which refl ects not only cross-border
fragmentation, but also the different sectoral
composition of each country’s economy) should
be high relative to cross-sectoral dispersion (which
also refl ects the different performance of the
underlying sectors). By contrast, in an integrated
fi nancial market, there is no fi nancial premium
on sectoral or geographical diversifi cation
and greater specialisation is affordable. This
should reduce the gap between cross-country
and cross-sectoral dispersions. Assuming
sectoral compositions and performances
remain constant over the sample period, three periods can be distinguished:
1) the pre-EMU period in which cross-country dispersion was signifi cantly higher than cross-sectoral
dispersion; 2) the pre-crisis EMU period after 1999 in which cross-country fragmentation has been
eliminated and the two dispersions get closer; 3) the crisis period, in which fragmentation has
increased, as shown by the increase in both dispersion indicators as of 2007.
Description
This indicator is derived by calculating the cross-sectional dispersions in both sector and country
index returns for the euro area countries. Data are calculated from January 1973 onwards. They
include (reinvested) dividends and are denominated in euro. The indicator has a monthly frequency.
The cross-sectional dispersions are fi ltered using the Hodrick-Prescott smoothing technique,
which provides a smooth estimate of the long-term trend component of the series. The smoothing
parameter λ is equal to 14,400.
Additional information
This indicator is based on an approach fi rst presented by Adjaouté and Danthine,
see Adjaouté, K. and Danthine, J.P. (2003), “European Financial Integration and Equity Returns:
A Theory-based Assessment”, in Gaspar, V. et al. (eds.), Second ECB Central Banking Conference: The transformation of the European fi nancial system, ECB, May 2003.
Chart 10 Country and sector dispersions in euro area equity returns
(percentages)
0
1
2
3
4
5
6
0
1
2
3
4
5
6
1976 1981 1986 1991 1996 2001 2006 2011
sector
country
Sources: Thomson Reuters and ECB calculations. Note: Cross-sectional dispersions are fi ltered.
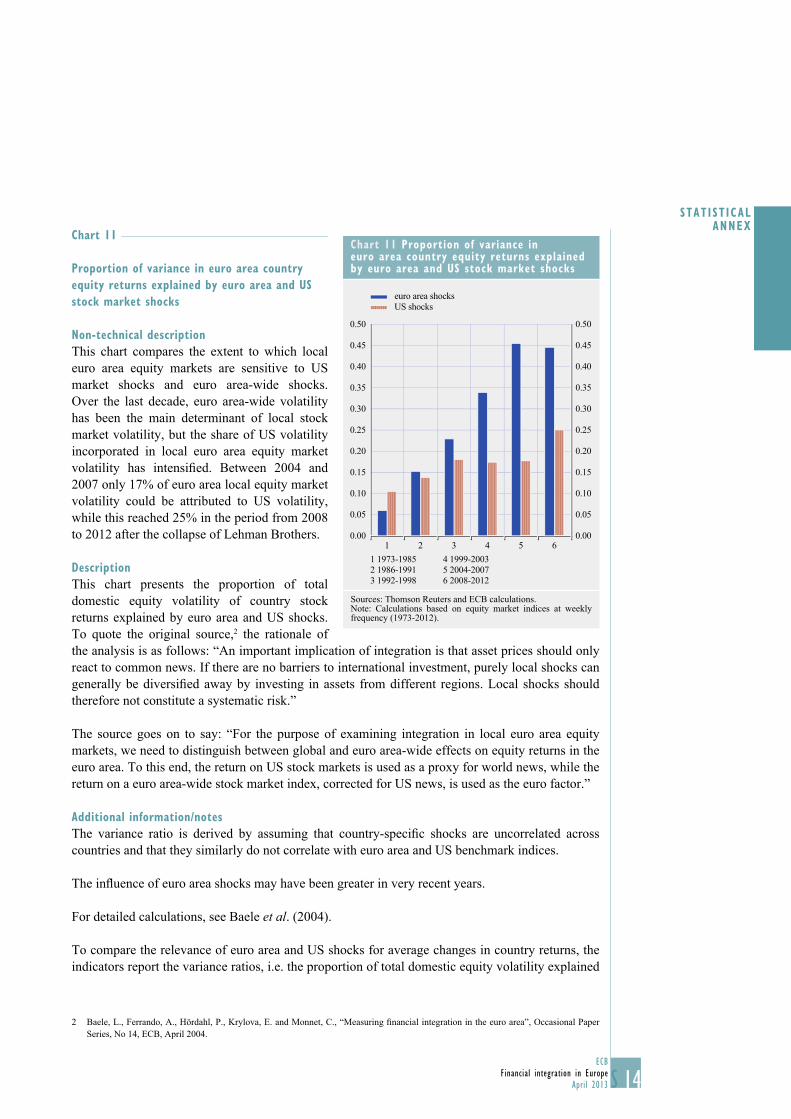
14ECB
Financial integration in Europe
April 2013 S
STAT IST ICAL ANNEX
Chart 11
Proportion of variance in euro area country
equity returns explained by euro area and US
stock market shocks
Non-technical description
This chart compares the extent to which local
euro area equity markets are sensitive to US
market shocks and euro area-wide shocks.
Over the last decade, euro area-wide volatility
has been the main determinant of local stock
market volatility, but the share of US volatility
incorporated in local euro area equity market
volatility has intensifi ed. Between 2004 and
2007 only 17% of euro area local equity market
volatility could be attributed to US volatility,
while this reached 25% in the period from 2008
to 2012 after the collapse of Lehman Brothers.
Description
This chart presents the proportion of total
domestic equity volatility of country stock
returns explained by euro area and US shocks.
To quote the original source,2 the rationale of
the analysis is as follows: “An important implication of integration is that asset prices should only
react to common news. If there are no barriers to international investment, purely local shocks can
generally be diversifi ed away by investing in assets from different regions. Local shocks should
therefore not constitute a systematic risk.”
The source goes on to say: “For the purpose of examining integration in local euro area equity
markets, we need to distinguish between global and euro area-wide effects on equity returns in the
euro area. To this end, the return on US stock markets is used as a proxy for world news, while the
return on a euro area-wide stock market index, corrected for US news, is used as the euro factor.”
Additional information/notes
The variance ratio is derived by assuming that country-specifi c shocks are uncorrelated across
countries and that they similarly do not correlate with euro area and US benchmark indices.
The infl uence of euro area shocks may have been greater in very recent years.
For detailed calculations, see Baele et al. (2004).
To compare the relevance of euro area and US shocks for average changes in country returns, the
indicators report the variance ratios, i.e. the proportion of total domestic equity volatility explained
2 Baele, L., Ferrando, A., Hördahl, P., Krylova, E. and Monnet, C., “Measuring fi nancial integration in the euro area”, Occasional Paper
Series, No 14, ECB, April 2004.
Chart 11 Proportion of variance in euro area country equity returns explained by euro area and US stock market shocks
0.00
0.05
0.10
0.15
0.20
0.25
0.30
0.35
0.40
0.45
0.50
0.00
0.05
0.10
0.15
0.20
0.25
0.30
0.35
0.40
0.45
0.50
1 2 3 4 5 6
1 1973-1985
2 1986-1991
3 1992-1998
4 1999-2003
5 2004-2007
6 2008-2012
euro area shocks
US shocks
Sources: Thomson Reuters and ECB calculations.Note: Calculations based on equity market indices at weekly frequency (1973-2012).

15ECB
Financial integration in Europe
April 2013S
by euro area and US shocks respectively. The model-based indicator is derived by assuming that
the total variance of individual country-specifi c returns is given by:
σc,t =2 βt
2us σus,t hc,t + βt
2eu σeu,t + 2 2 (5)
where hc,t is the variance of the local shock component. The euro area variance ratio is then
given by:
VRc,t =βt
2eueu σeu,t
2
σc,t2
(6)
and the US variance ratio by a corresponding equation. The conditional variances are obtained
using a standard asymmetric GARCH (1,1) model.
For each period, the indicators report the unweighted average of the relative importance of
euro area-wide factors, other than US equity market fluctuations, for the variance of individual
euro area countries’ equity market indices (the “variance ratio”), and the unweighted average
of the relative importance of US equity market fluctuations for the variance of euro area
equity markets.
Data refer to Datastream market indices, and have been calculated on a weekly basis since
January 1973.
Chart 12
Euro area and US shock spillover intensity
in individual euro area countries
Non-technical description
This chart compares the extent to which local
euro area equity markets are sensitive to US
market shocks and euro area-wide shocks. Over
the last decade, euro area-wide shocks have
been transmitted almost one-to-one to local euro
area equity markets, which can be interpreted
as sign of strong integration of equity markets
among euro area countries. Transmission of
US shocks (which can be seen as a proxy for
global shocks) has intensifi ed since the collapse
of Lehman Brothers: between 2004 and 2007
almost 40% of US shocks were transmitted to
euro area markets, but this has risen to 60%
since Lehman.
Description
Empirical evidence suggests that equity returns are driven to a signifi cant extent by global factors.
For this reason, both euro area-wide shocks and US shocks (as a proxy for global factors) are
included in the assessment of common news. To calculate the relative importance of euro area-
wide and US stock market fl uctuations for local stock market returns, the stock market returns of
Chart 12 Euro area and US shock spillover intensity in individual euro area countries
0.0
0.2
0.4
0.6
0.8
1.0
0.0
0.2
0.4
0.6
0.8
1.0
euro area shock spillover intensitiesUS shock spillover intensities
1973-
1985
1986-
1991
1992-
1998
1999-
2003
2004-
2007
2008-
2012
Sources: Thomson Reuters and ECB calculations.Note: Calculations based on equity market indices at weekly frequency (1973-2012).

16ECB
Financial integration in Europe
April 2013 S
STAT IST ICAL ANNEX
individual countries are modelled as having both an expected component and an unexpected one,
εc,t. The unexpected component is then decomposed into a purely local shock (ec,t) and a reaction to
euro area news (εeu,t) and world (US) news (εus,t):
εc,t = βc,t us εus,t ec,t + βc,t
euεeu,t + (7)
The expected return is obtained by relating euro area and US returns to a constant term and to the
returns in the previous period. The conditional variance of the error terms is governed by a bivariate
asymmetric GARCH (1,1) model.
β represents the country-dependent sensitivity to euro area or US market changes (of the unexpected
component). The analysis is performed over the periods 1973-1985, 1986-1991, 1992-1998, 1999-
2003, 2003-2008 and 2008-2012. The reported indicator is the cross-country unweighted average
of country-specifi c sensitivities (betas). A reported beta close to one in the chart indicates that on
average all euro area countries respond to the corresponding shock (from either the euro area or the
United States). In a well-integrated euro area, the beta associated to the euro area shock should be
close to one.
Additional information
To distinguish global shocks from purely euro area shocks, it is assumed that euro area equity
market developments are partly driven by events in the US market. It is furthermore assumed that
the proportion of local returns that is not explained by common factors is entirely attributable to
local news.
Chart 13
Dispersion of euro area ten-year sovereign
bond yields
Non-technical description
The chart presents the average evolution and
dispersion of euro area sovereign bond yields.
In a well-integrated market, there should be low
dispersion, because investors will not demand
such a high premium to compensate for the risk
of idiosyncratic shocks, while in a fragmented
market, dispersion is higher.
Description
The shaded areas represent the min-max range
and the interquartile range of individual bond
yields for the country composition of the euro
area as in 2011. The yields for Greece, Cyprus,
Estonia, Luxembourg, Malta and Slovenia
are excluded owing to infrequent or a lack of
observations.
Chart 13 Dispersion of euro area ten-year sovereign bond yields
(percentages)
0
2
4
6
8
10
12
14
16
18
0
2
4
6
8
10
12
14
16
18
min-max range
interquartile range
average distressed
average euro area
1990 1995 2000 2005 2010
Sources: Bloomberg and ECB calculations.

17ECB
Financial integration in Europe
April 2013S
Chart 14
Sovereign and bank CDS premia – euro area
and United States
Non-technical description
A tight link between sovereign and bank
creditworthiness is clearly visible in the high
degree of correlation between sovereign CDS
premia and bank CDS premia in euro area
countries. This high correlation illustrates
the self-reinforcing loop between bank and
sovereign risks, with doubts about the solvency
of the sovereigns feeding doubts about the
solvency of the banks, and vice versa. Such
dynamics are much weaker in the United States
where the CDS premia of sovereigns and banks
are less correlated.
The self-reinforcing loop between bank and
sovereign risk, characterised by tight bank-
sovereign linkages (in particular in non-AAA-
rated euro area countries), is one of the causes
of the increasing heterogeneity of sovereign
bond yields (particularly the divergence
between AAA-rated countries and non-AAA-
rated countries). This phenomenon (tight bank-
sovereign linkages on the periphery) has an
impact on bond market integration in the euro
area (and consequently on the integration of the
funding markets for corporates and banks).
Description
The euro area bank CDS premium is calculated
as a weighted average of CDS premia for the
main euro area banks (one bank per country
weighted by the national capital key), and the
euro area sovereign CDS premium is calculated
as a weighted average of national sovereign
CDS premia. For the United States, the bank
CDS premium is calculated as the median of
CDS premia for the eight largest US banks
and the sovereign CDS premium is the CDS
premium for the US sovereign. All the CDS premia considered are at the fi ve-year maturity.
Each point on the chart represents one day, while each colour represents one quarter (from 2010
Q1 to 2012 Q4). Any point on the diagonal line would indicate a one-for-one relationship between
bank and sovereign CDS premia.
Chart 14 Sovereign and bank CDS premia – euro area and United States
(basis points; Q1 2010 – Q1 2013)
2011 Q1
2010 Q1
2010 Q22010 Q3
2010 Q4
2011 Q2
2011 Q32011 Q4
2012 Q1
2012 Q2
2012 Q3
2012 Q4
2013 Q1
y-axis: bank CDSs
x-axis: sovereign CDSs
euro area
0
50
100
150
200
250
300
350
400
450
500
0
50
100
150
200
250
300
350
400
450
500
0 50 100 150 200 250 300 350 400 450 500
United States
0 50 100 150 200 250 300 350 400 450 500
0
50
100
150
200
250
300
350
400
450
500
0
50
100
150
200
250
300
350
400
450
500
Sources: Thomson Reuters and ECB calculations.
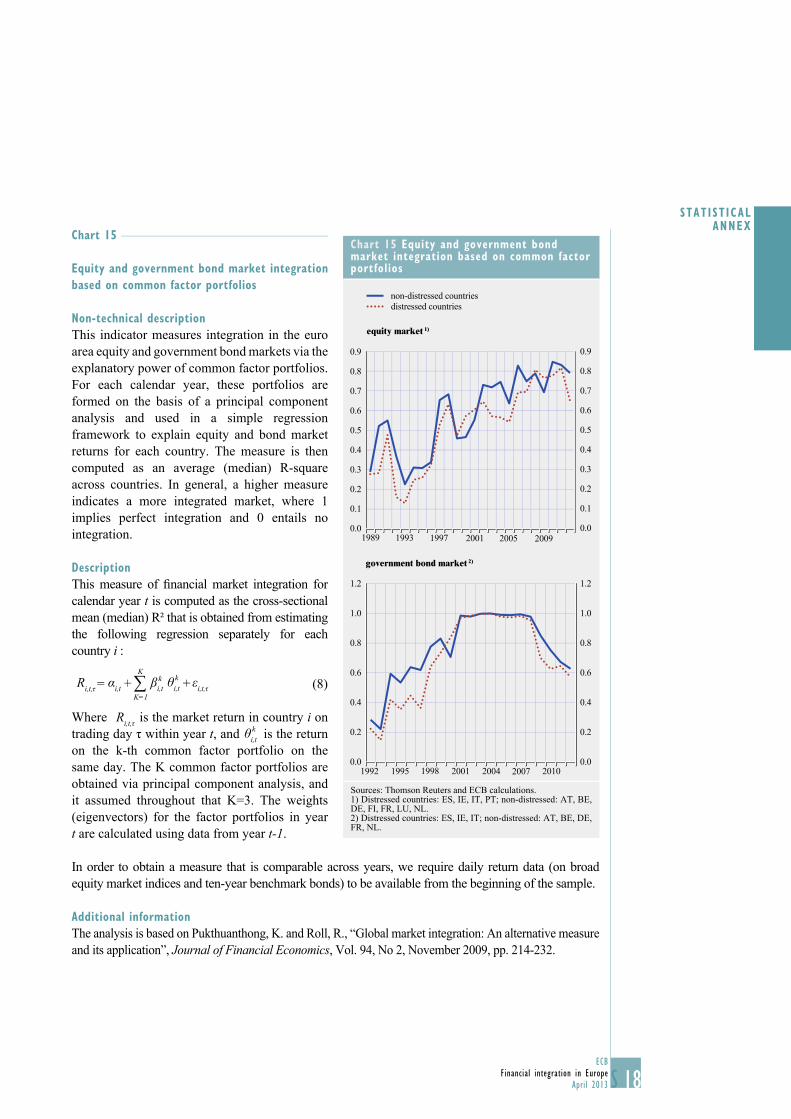
18ECB
Financial integration in Europe
April 2013 S
STAT IST ICAL ANNEX
Chart 15
Equity and government bond market integration
based on common factor portfolios
Non-technical description
This indicator measures integration in the euro
area equity and government bond markets via the
explanatory power of common factor portfolios.
For each calendar year, these portfolios are
formed on the basis of a principal component
analysis and used in a simple regression
framework to explain equity and bond market
returns for each country. The measure is then
computed as an average (median) R-square
across countries. In general, a higher measure
indicates a more integrated market, where 1
implies perfect integration and 0 entails no
integration.
Description
This measure of fi nancial market integration for
calendar year t is computed as the cross-sectional
mean (median) R² that is obtained from estimating
the following regression separately for each
country i :
Ri,t,τ = αi,t +∑K
K=1
kβi,t θi,t k
+ εi,t,τ (8)
Where Ri,t,τ is the market return in country i on
trading day τ within year t, and θi,t k
is the return
on the k-th common factor portfolio on the
same day. The K common factor portfolios are
obtained via principal component analysis, and
it assumed throughout that K=3. The weights
(eigenvectors) for the factor portfolios in year
t are calculated using data from year t-1.
In order to obtain a measure that is comparable across years, we require daily return data (on broad
equity market indices and ten-year benchmark bonds) to be available from the beginning of the sample.
Additional information
The analysis is based on Pukthuanthong, K. and Roll, R., “Global market integration: An alternative measure
and its application”, Journal of Financial Economics, Vol. 94, No 2, November 2009, pp. 214-232.
Chart 15 Equity and government bond market integration based on common factor portfolios
non-distressed countries
distressed countries
equity market 1)
0.0
0.1
0.2
0.3
0.4
0.5
0.6
0.7
0.8
0.9
0.0
0.1
0.2
0.3
0.4
0.5
0.6
0.7
0.8
0.9
1989 1993 1997 2001 2005 2009
government bond market 2)
0.0
0.2
0.4
0.6
0.8
1.0
1.2
0.0
0.2
0.4
0.6
0.8
1.0
1.2
1992 1995 1998 2001 2004 2007 2010
Sources: Thomson Reuters and ECB calculations.1) Distressed countries: ES, IE, IT, PT; non-distressed: AT, BE, DE, FI, FR, LU, NL.2) Distressed countries: ES, IE, IT; non-distressed: AT, BE, DE, FR, NL.
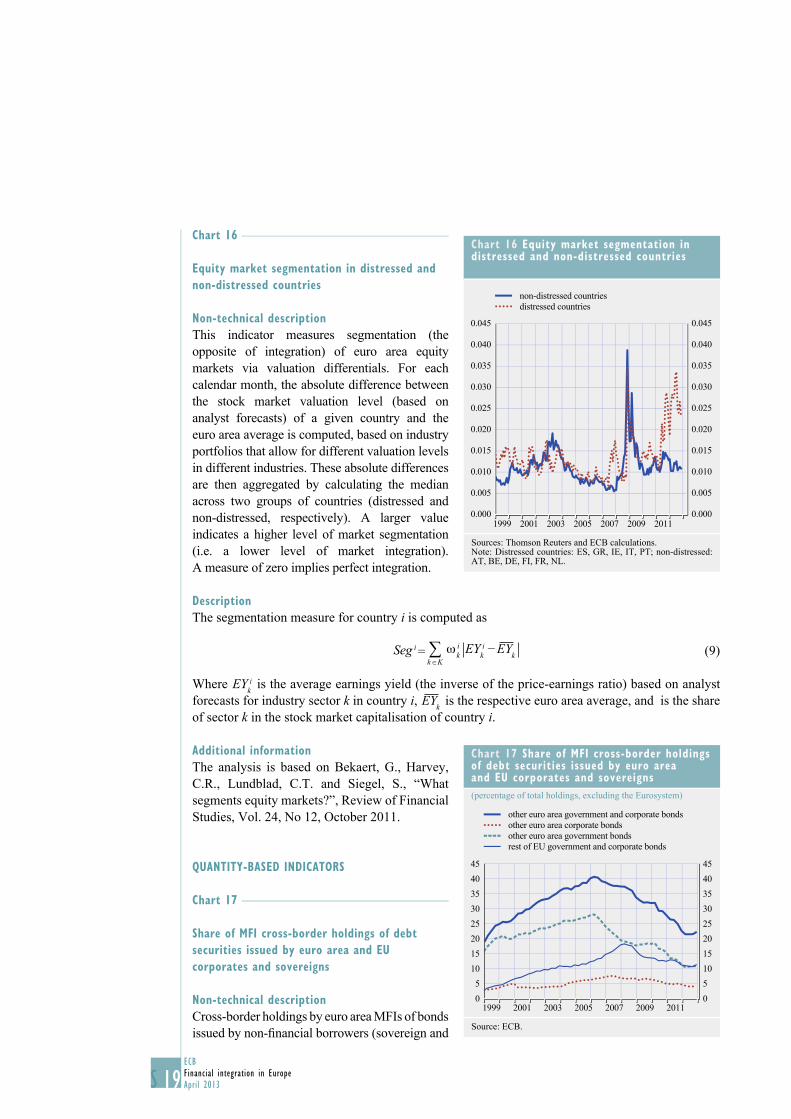
19ECB
Financial integration in Europe
April 2013S
Chart 16
Equity market segmentation in distressed and
non-distressed countries
Non-technical description
This indicator measures segmentation (the
opposite of integration) of euro area equity
markets via valuation differentials. For each
calendar month, the absolute difference between
the stock market valuation level (based on
analyst forecasts) of a given country and the
euro area average is computed, based on industry
portfolios that allow for different valuation levels
in different industries. These absolute differences
are then aggregated by calculating the median
across two groups of countries (distressed and
non-distressed, respectively). A larger value
indicates a higher level of market segmentation
(i.e. a lower level of market integration).
A measure of zero implies perfect integration.
Description
The segmentation measure for country i is computed as
Seg i = ∑
k ∈ Kω i
k EY ik
– EYk (9)
Where EY ik is the average earnings yield (the inverse of the price-earnings ratio) based on analyst
forecasts for industry sector k in country i, EYk is the respective euro area average, and is the share
of sector k in the stock market capitalisation of country i.
Additional information
The analysis is based on Bekaert, G., Harvey,
C.R., Lundblad, C.T. and Siegel, S., “What
segments equity markets?”, Review of Financial
Studies, Vol. 24, No 12, October 2011.
QUANTITY-BASED INDICATORS
Chart 17
Share of MFI cross-border holdings of debt
securities issued by euro area and EU
corporates and sovereigns
Non-technical description
Cross-border holdings by euro area MFIs of bonds
issued by non-fi nancial borrowers (sovereign and
Chart 16 Equity market segmentation in distressed and non-distressed countries
0.000
0.005
0.010
0.015
0.020
0.025
0.030
0.035
0.040
0.045
0.000
0.005
0.010
0.015
0.020
0.025
0.030
0.035
0.040
0.045
1999 2001 2003 2005 2007 2009 2011
non-distressed countries
distressed countries
Sources: Thomson Reuters and ECB calculations.Note: Distressed countries: ES, GR, IE, IT, PT; non-distressed: AT, BE, DE, FI, FR, NL.
Chart 17 Share of MFI cross-border holdings of debt securities issued by euro area and EU corporates and sovereigns
(percentage of total holdings, excluding the Eurosystem)
0
5
10
15
20
25
30
35
40
45
0
5
10
15
20
25
30
35
40
45
other euro area government and corporate bonds
other euro area corporate bonds
other euro area government bonds
rest of EU government and corporate bonds
1999 2001 2003 2005 2007 2009 2011
Source: ECB.

20ECB
Financial integration in Europe
April 2013 S
STAT IST ICAL ANNEX
corporate) of other euro area countries are a relevant quantity indicator of fi nancial integration. The
indicator points to decreasing integration in these markets in recent years.
Description
See Charts 22 to 25 in the banking section.
Additional information
See Charts 22 to 25 in the banking section.
Chart 18-19
Non-technical description
These two indicators are used to assess the contribution of institutional investors to fi nancial
integration in the euro area.
Description
The fi rst indicator shows the share of euro area investment funds’ total holdings of all securities other
than shares (including money market paper) issued by residents of euro area countries other than the
country in which the investment fund is located and by residents of the rest of the world (RoW). The
second indicator provides the same measure for the share of euro area investment funds’ combined
holdings of all shares and other equity (excluding investment fund shares/units) issued by residents of
the euro area outside the country in which the investment fund is located and by residents of the rest of
the world.
The compositions of the two areas are those prevailing during the reference period.
Additional information
These two indicators are constructed on the basis of the balance sheets of euro area investment
funds (other than money market funds, which are included in the MFI balance sheet statistics).
Chart 18 Investment funds’ holdings of debt securities issued in other euro area countries and the rest of the world
(percentage of total holdings of debt securities)
20
25
30
35
40
45
50
20
25
30
35
40
45
50
other euro area countries
rest of the world
1999 2001 2003 2005 2007 2009 2011
Source: ECB.
Chart 19 Investment funds’ holdings of equity issued in other euro area countries and the rest of the world
(percentage of total holdings of equity)
0
10
20
30
40
50
60
70
0
10
20
30
40
50
60
70
other euro area countries
rest of the world
1999 2001 2003 2005 2007 2009 2011
Source: ECB.

21ECB
Financial integration in Europe
April 2013S
A complete list of euro area investment funds is published on the ECB’s website. Further information
on these investment fund statistics can be found in the Manual on investment fund statistics. Since
December 2008 harmonised statistical information has been collected and compiled on the basis of
Regulation ECB/2007/8 concerning statistics on the assets and liabilities of investment funds.
Chart 20
The degree of cross-border holdings of equity
issued by euro area residents
Non-technical description
This chart shows the degree of cross-border
holdings of equity securities among euro area
countries. This indicator measures the degree of
stock market integration at the euro area level.
Description
Intra-euro area is defi ned as the share of equity
issued by euro area residents and held by other
euro area residents (excluding central banks):
Outstockij,t ∑j ≠
i ∑
i
TOutstocki,t+ –MKTi,t ∑i
∑i
TInstocki,t ∑i
i, j ∈{euro area countries}
(10)
where Outstockij denotes the value of equity
issued by residents of euro area country i and
held by residents of euro area country j; MKTi stands for stock market capitalisation in country i; TOutstocki is the total foreign equity held by country i and TInstocki is the total foreign liabilities of
country i.Extra-euro area is defi ned as the share of euro area equity held by non-residents of the euro area
(excluding central banks). The measure takes the following form:
Outstockir,t ∑r
∑i
TOutstockr,t+ –MKTr,t ∑r
∑r
TInstockr,t ∑r
i ∈{euro area countries}
r ∈{rest of the world }
(11)
where Outstockir denotes the value of equity issued by residents of euro area country i and held by
non-residents of the euro area r (rest of the world); MKTr stands for market capitalisation in country
r; TOutstockr is the total foreign equity held by country r and TInstockr is the total foreign liabilities
of country r. The computed indicator has an annual frequency.
Chart 20 The degree of cross-border holdings of equity issued by euro area residents
(percentages)
10
20
30
40
50
10
20
30
40
50
intra-euro area stressed
countries
non-stressed
countries
1997
2001
2002
2003
2004
2005
2006
2007
2008
20092010
2011
Sources: IMF, Thomson Reuters and ECB calculations.Note: Intra-euro area is defi ned as the share of equity issued by euro area residents and held by residents of other euro area countries (excluding central banks).

22ECB
Financial integration in Europe
April 2013 S
STAT IST ICAL ANNEX
BANKING MARKET INDICATORS
STRUCTURAL INDICATOR
Chart 21
Dispersion of the total assets of foreign
branches and subsidiaries of euro area banks
across euro area countries
Non-technical description
This indicator describes the development over
time of the assets of foreign branches and
subsidiaries of euro area banks within euro
area countries other than the home country as a
share of the total assets of the euro area banking
sector, with higher shares implying higher cross-
border activity. Overall, this share continues
to be rather limited across the majority of
countries. However, it is noteworthy that, owing
to the crisis, the median degree of cross-border
penetration of banking institutions has fallen in
recent years.
Description
The share of total assets of foreign branches and
subsidiaries over total assets of the national banking system is calculated for each country of the
euro area. Then, the level and dispersion of these country shares are described by the following
measures: the fi rst quartile (25th percentile), the median (50th percentile) and the third quartile
(75th percentile).
These computed indicators have an annual frequency. The composition of the euro area is that
applicable during the respective reference period.
Chart 21 Dispersion of the total assets of foreign branches and subsidiaries of euro area banks across euro area countries
(percentage of the total assets of the euro area banking sector)
0
10
20
30
40
0
10
20
30
40
1999 2001 2003 2005 2007 2009 2011
interquartilemedian
Source: ECB.
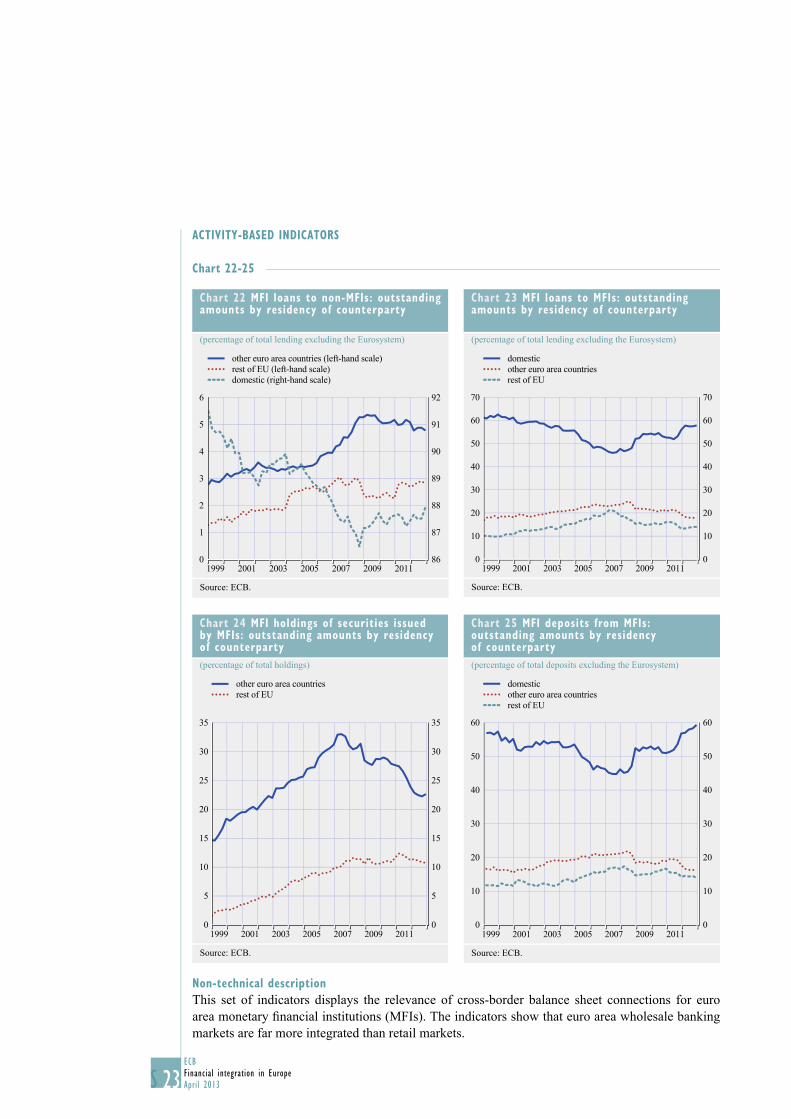
23ECB
Financial integration in Europe
April 2013S
ACTIVITY-BASED INDICATORS
Chart 22-25
Non-technical description
This set of indicators displays the relevance of cross-border balance sheet connections for euro
area monetary fi nancial institutions (MFIs). The indicators show that euro area wholesale banking
markets are far more integrated than retail markets.
Chart 22 MFI loans to non-MFIs: outstanding amounts by residency of counterparty
(percentage of total lending excluding the Eurosystem)
86
87
88
89
90
91
92
0
1
2
3
4
5
6
other euro area countries (left-hand scale)
rest of EU (left-hand scale)
domestic (right-hand scale)
1999 2001 2003 2005 2007 2009 2011
Source: ECB.
Chart 23 MFI loans to MFIs: outstanding amounts by residency of counterparty
(percentage of total lending excluding the Eurosystem)
0
10
20
30
40
50
60
70
0
10
20
30
40
50
60
70
domestic
other euro area countries
rest of EU
1999 2001 2003 2005 2007 2009 2011
Source: ECB.
Chart 24 MFI holdings of securities issued by MFIs: outstanding amounts by residency of counterparty
(percentage of total holdings)
0
5
10
15
20
25
30
35
0
5
10
15
20
25
30
35
other euro area countries
rest of EU
1999 2001 2003 2005 2007 2009 2011
Source: ECB.
Chart 25 MFI deposits from MFIs: outstanding amounts by residency of counterparty
(percentage of total deposits excluding the Eurosystem)
0
10
20
30
40
50
60
0
10
20
30
40
50
60
1999 2001 2003 2005 2007 2009 2011
domestic
other euro area countries
rest of EU
Source: ECB.

24ECB
Financial integration in Europe
April 2013 S
STAT IST ICAL ANNEX
Description
The indicators in Charts 22 and 23 show loans granted by euro area MFIs (excluding the
Eurosystem) to non-MFIs and other MFIs, broken down by residency of counterparty. The
compositions of the euro area and the rest of the EU are those applicable during the respective
reference periods. In Chart 24, a similar indicator is shown for securities issued by euro area
MFIs and held by euro area and other EU MFIs. In Chart 25, a similar indicator is shown for
deposits placed in the euro area by non-MFIs. Inter-MFI borrowing and lending is also
conducted through CCPs. In cases where these CCPs are not themselves MFIs, these volumes
are not included in the inter-MFI loans and deposits in Charts 23 and 25. (For more information,
see Box 3 of the September 2012 issue of the ECB’s Monthly Bulletin.)
These indicators have a quarterly frequency.
Additional information
These indicators are constructed on the basis of the national aggregated MFI balance sheet statistics
reported to the ECB at monthly and quarterly frequencies. These data cover the MFI sector excluding
the Eurosystem and also include data on money market funds (MMFs). It is not yet possible to
derive indicators that strictly refer to banking markets. Consequently, as MMFs typically invest
in inter-MFI deposits and short-term securities, the indicators displaying data for these assets are
somewhat affected by the MMFs’ balance sheet items.
These balance sheet items are transmitted on a non-consolidated basis. This means that the positions
with foreign counterparties include those with foreign branches and subsidiaries.
Chart 26
Interest rates on new loans to euro area
non-financial corporations
Non-technical description
An important aspect of the gains from
increasing fi nancial integration is that lower
fi nancing costs reached a signifi cant level
of convergence across countries. The strong
convergence across countries in bank rates
charged to non-fi nancial corporations for new
loans is clearly visible.
Description
This indicator displays the average of MFI
interest rates (MIRs) on new business reported
to the ECB.
Additional information
These statistics are based on MIRs on new
business reported to the ECB at monthly
frequency since January 2003.
Chart 26 Interest rates on new loans to euro area non-financial corporations
(percentages)
0
2
4
6
8
10
12
0
2
4
6
8
10
12
average for the euro area (changing composition)
average for distressed countries
average for non-distressed countries
1997 1999 2001 2003 2005 2007 2009 2011
Source: ECB.Note: All euro area countries, changing composition. Latest observation: September 2012.

25ECB
Financial integration in Europe
April 2013S
Chart 27
Interest rates on MFI deposits for households in
the euro area
Non-technical description
This chart shows the dispersion of deposit rates
in the euro area. The increasing dispersion
highlights the fragmentation of retail markets.
Chart 28
MFI loans to non-financial corporations
Non-technical description
Persistent divergence between groups of
countries suggests increasing disparities
in borrowers’ demand and/or access to
credit across euro area countries, refl ecting
differences in economic environment and
outlook as well as potential disparities in the
state of their banking systems and domestic
sovereign risk.
Description
Annual percentage changes; adjusted for loan
sales and securitisation from 2009 onwards.
Chart 27 Interest rates on MFI deposits for households in the euro area
(percentages)
0
1
2
3
4
5
6
0
1
2
3
4
5
6
2003 2004 2005 2006 2007 2008 2009 2010 2011 2012
euro area average
interquartile range
full range across countries
Sources: ECB and ECB calculations.Notes: The deposit rates are aggregated using outstanding amounts. Latest observation: September 2012.
Chart 28 MFI loans to non-financial corporations
(annual loan growth; percentages)
-10
-5
0
5
10
15
20
25
-10
-5
0
5
10
15
20
25
2004 2005 2006 2007 2008 2009 2010 2011 2012
euro area
distressed countries
non-distressed countries
Source: ECB.

26ECB
Financial integration in Europe
April 2013 S
STAT IST ICAL ANNEX
Chart 29
Standard deviation of banks’ CDS premia by
country group
Non-technical description
The cross-country variance of CDS premia
charged by investors for bank debt should
provide a signal on fi nancial integration. It
must, however, be kept in mind that CDS prices
also depend on a range of other factors, such as
risk, liquidity, and the correlation between CDS
premia for banks and sovereign CDS premia.
Description
For each group of countries, the indicator is the
unweighted standard deviation of the average
of banks’ daily CDS premia in each euro area
country.
Additional information
This indicator is based on CDS prices available
for banks on the EONIA panel.
SURVEY-BASED INDICATOR
Chart 30
Changes in credit standards
Non-technical description
Persistent divergence in the level of credit standards between groups of countries suggests ongoing
disparities in borrowers’ access to credit across euro area countries.
Description
Changes in credit standards are given as net percentages of replies, i.e. percentage of banks
indicating a tightening of credit standards minus percentage of banks indicating an easing of credit
standards; country aggregate results are weighted by aggregate lending volumes.
Chart 29 Standard deviation of banks’ CDS premia by country group
(basis points)
0
100
200
300
400
500
600
700
800
900
0
100
200
300
400
500
600
700
800
900
Jan. Nov. Oct. Sep. Aug. July June May Apr. Mar.
2004 2005 2006 2007 2008 2009 2010 2011 2012
distressed countries
non-distressed countries
Sources: Bloomberg, Thomson Reuters, Credit Market Analysis Ltd (CMA) and ECB calculations.Note: Distressed countries: ES, GR, IE, IT, PT; non-distressed countries: AT, BE, DE, FR, NL.
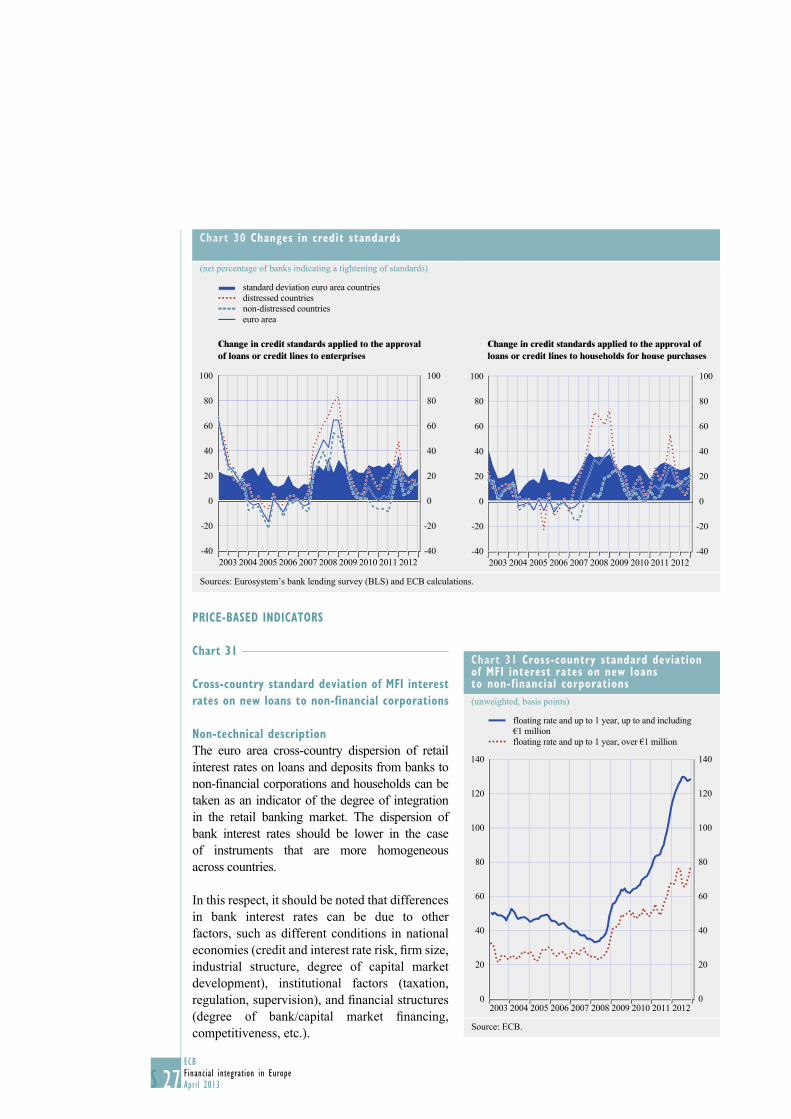
27ECB
Financial integration in Europe
April 2013S
PRICE-BASED INDICATORS
Chart 31
Cross-country standard deviation of MFI interest
rates on new loans to non-financial corporations
Non-technical description
The euro area cross-country dispersion of retail
interest rates on loans and deposits from banks to
non-fi nancial corporations and households can be
taken as an indicator of the degree of integration
in the retail banking market. The dispersion of
bank interest rates should be lower in the case
of instruments that are more homogeneous
across countries.
In this respect, it should be noted that differences
in bank interest rates can be due to other
factors, such as different conditions in national
economies (credit and interest rate risk, fi rm size,
industrial structure, degree of capital market
development), institutional factors (taxation,
regulation, supervision), and fi nancial structures
(degree of bank/capital market fi nancing,
competitiveness, etc.).
Chart 31 Cross-country standard deviation of MFI interest rates on new loans to non-financial corporations
(unweighted, basis points)
0
20
40
60
80
100
120
140
0
20
40
60
80
100
120
140
floating rate and up to 1 year, up to and including
€1 million
floating rate and up to 1 year, over €1 million
2003 2004 2005 2006 2007 2008 2009 2010 2011 2012
Source: ECB.
Chart 30 Changes in credit standards
(net percentage of banks indicating a tightening of standards)
standard deviation euro area countries
distressed countries
non-distressed countries
euro area
Change in credit standards applied to the approval of loans or credit lines to enterprises
Change in credit standards applied to the approval of loans or credit lines to households for house purchases
-40
-20
0
20
40
60
80
100
-40
-20
0
20
40
60
80
100
2003 20052004 20072006 20092008 2010 2011 2012
-40
-20
0
20
40
60
100
80
-40
-20
0
20
40
60
100
80
2003 20052004 20072006 20092008 2011 20122010
Sources: Eurosystem’s bank lending survey (BLS) and ECB calculations.
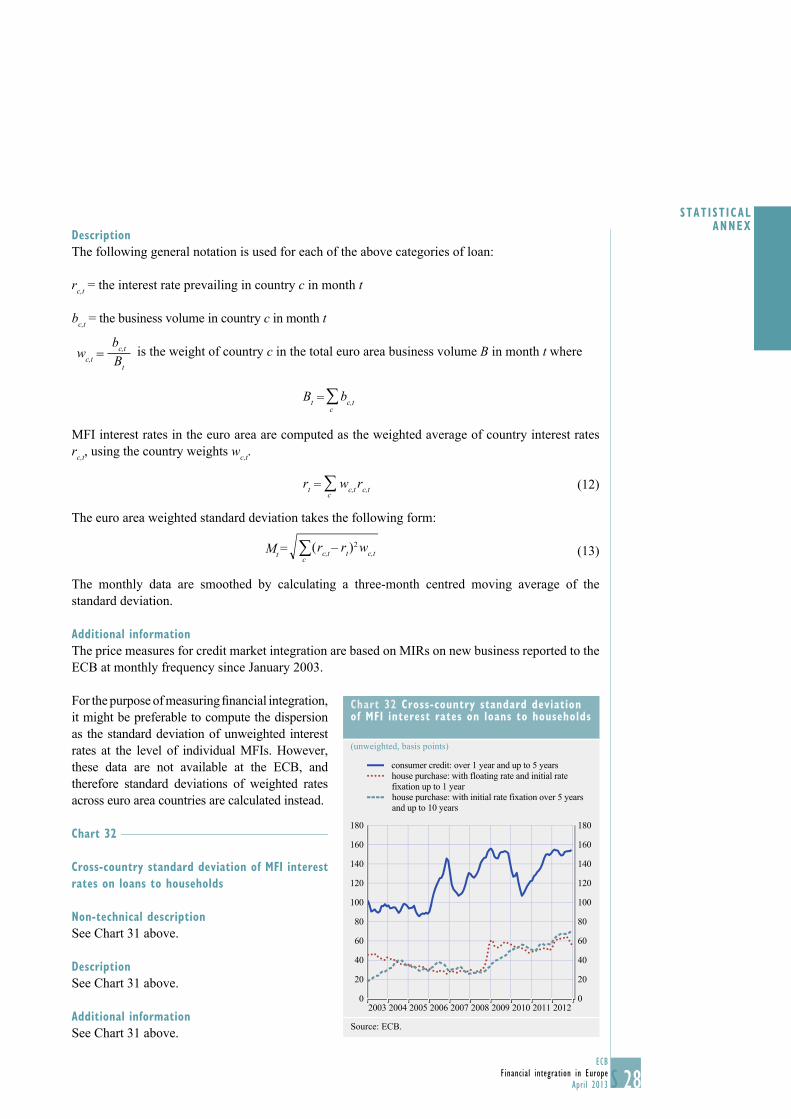
28ECB
Financial integration in Europe
April 2013 S
STAT IST ICAL ANNEX
Description
The following general notation is used for each of the above categories of loan:
rc,t = the interest rate prevailing in country c in month t
bc,t = the business volume in country c in month t
wc,t =bc,t
Bt
is the weight of country c in the total euro area business volume B in month t where
Bt = bc,t ∑c
MFI interest rates in the euro area are computed as the weighted average of country interest rates
rc,t, using the country weights wc,t.
rt = wc,t rc,t ∑c
(12)
The euro area weighted standard deviation takes the following form:
Mt = ( rc,t – rt )2
wc,t ∑c
(13)
The monthly data are smoothed by calculating a three-month centred moving average of the
standard deviation.
Additional information
The price measures for credit market integration are based on MIRs on new business reported to the
ECB at monthly frequency since January 2003.
For the purpose of measuring fi nancial integration,
it might be preferable to compute the dispersion
as the standard deviation of unweighted interest
rates at the level of individual MFIs. However,
these data are not available at the ECB, and
therefore standard deviations of weighted rates
across euro area countries are calculated instead.
Chart 32
Cross-country standard deviation of MFI interest
rates on loans to households
Non-technical description
See Chart 31 above.
Description
See Chart 31 above.
Additional information
See Chart 31 above.
Chart 32 Cross-country standard deviation of MFI interest rates on loans to households
(unweighted, basis points)
0
20
40
60
80
100
120
140
160
180
0
20
40
60
80
100
120
140
160
180
2003 2004 2005 2006 2007 2008 2009 2010 2011 2012
consumer credit: over 1 year and up to 5 years
house purchase: with floating rate and initial rate
fixation up to 1 year
house purchase: with initial rate fixation over 5 years
and up to 10 years
Source: ECB.
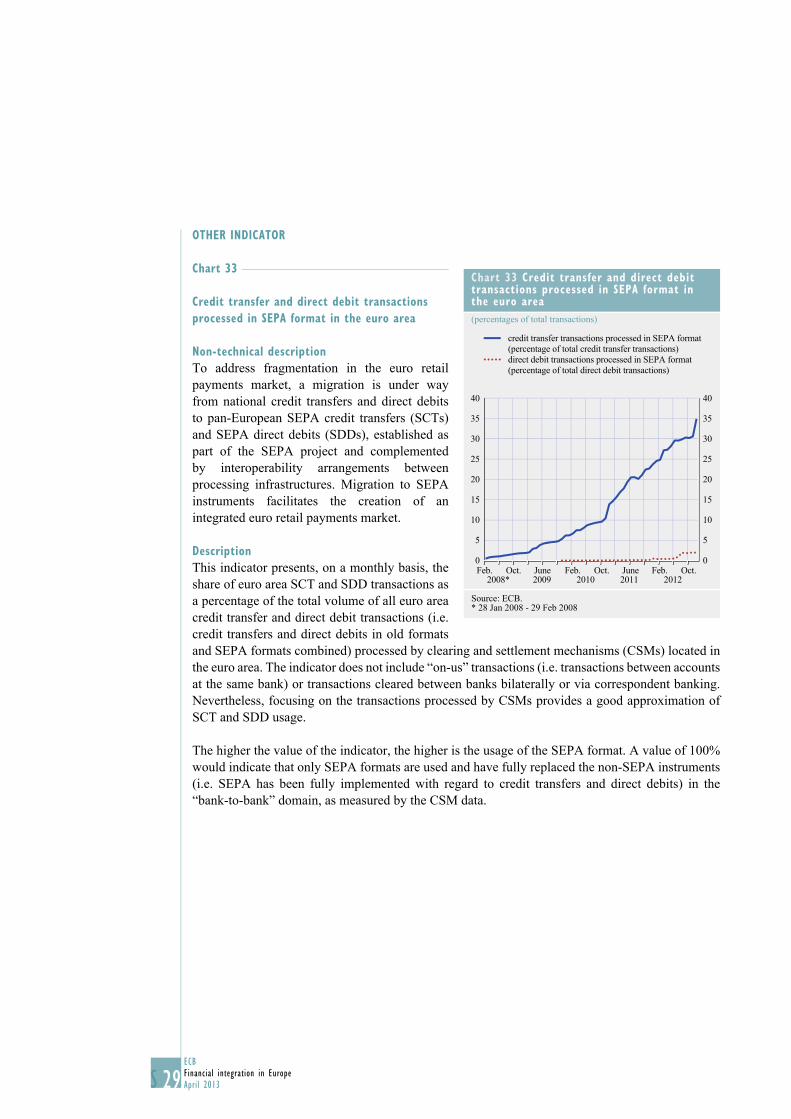
29ECB
Financial integration in Europe
April 2013S
OTHER INDICATOR
Chart 33
Credit transfer and direct debit transactions
processed in SEPA format in the euro area
Non-technical description
To address fragmentation in the euro retail
payments market, a migration is under way
from national credit transfers and direct debits
to pan-European SEPA credit transfers (SCTs)
and SEPA direct debits (SDDs), established as
part of the SEPA project and complemented
by interoperability arrangements between
processing infrastructures. Migration to SEPA
instruments facilitates the creation of an
integrated euro retail payments market.
Description
This indicator presents, on a monthly basis, the
share of euro area SCT and SDD transactions as
a percentage of the total volume of all euro area
credit transfer and direct debit transactions (i.e.
credit transfers and direct debits in old formats
and SEPA formats combined) processed by clearing and settlement mechanisms (CSMs) located in
the euro area. The indicator does not include “on-us” transactions (i.e. transactions between accounts
at the same bank) or transactions cleared between banks bilaterally or via correspondent banking.
Nevertheless, focusing on the transactions processed by CSMs provides a good approximation of
SCT and SDD usage.
The higher the value of the indicator, the higher is the usage of the SEPA format. A value of 100%
would indicate that only SEPA formats are used and have fully replaced the non-SEPA instruments
(i.e. SEPA has been fully implemented with regard to credit transfers and direct debits) in the
“bank-to-bank” domain, as measured by the CSM data.
Chart 33 Credit transfer and direct debit transactions processed in SEPA format in the euro area
(percentages of total transactions)
0
5
10
15
20
25
30
35
40
0
5
10
15
20
25
30
35
40
2008* 2009 2010 2011 2012
credit transfer transactions processed in SEPA format
(percentage of total credit transfer transactions)
direct debit transactions processed in SEPA format
(percentage of total direct debit transactions)
Feb. Oct. June Feb. Oct. June Feb. Oct.
Source: ECB.* 28 Jan 2008 - 29 Feb 2008
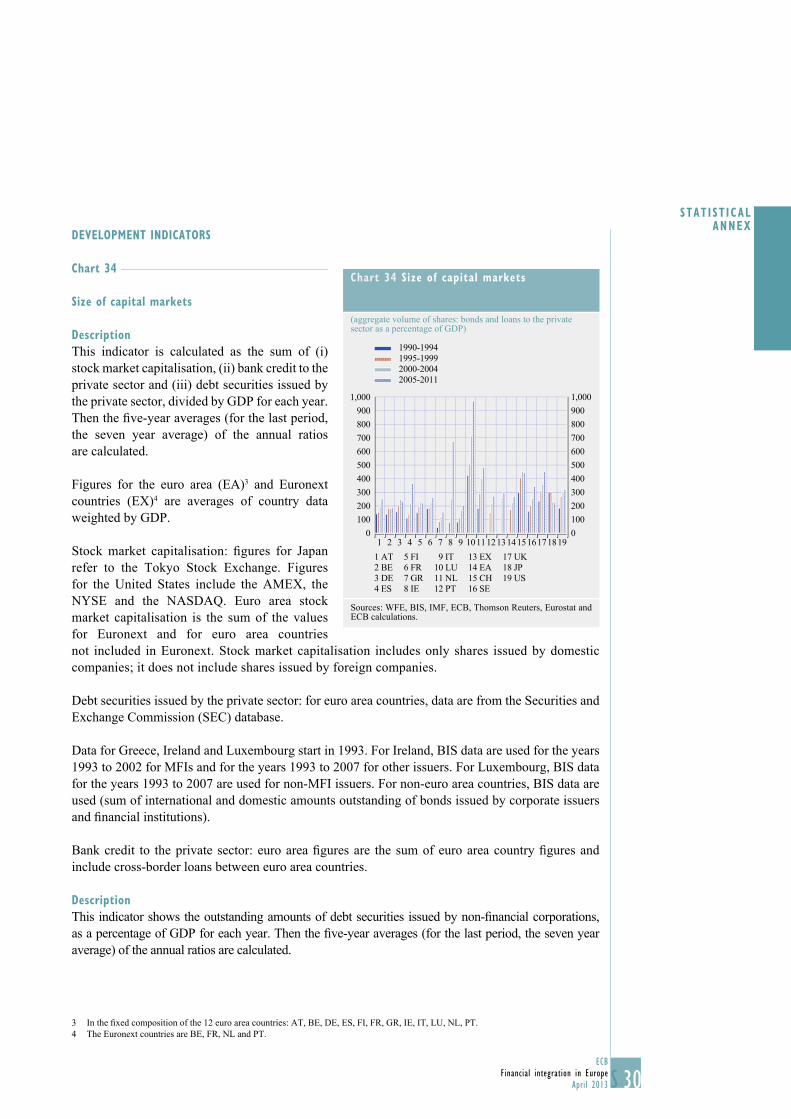
30ECB
Financial integration in Europe
April 2013 S
STAT IST ICAL ANNEX
DEVELOPMENT INDICATORS
Chart 34
Size of capital markets
Description
This indicator is calculated as the sum of (i)
stock market capitalisation, (ii) bank credit to the
private sector and (iii) debt securities issued by
the private sector, divided by GDP for each year.
Then the fi ve-year averages (for the last period,
the seven year average) of the annual ratios
are calculated.
Figures for the euro area (EA)3 and Euronext
countries (EX)4 are averages of country data
weighted by GDP.
Stock market capitalisation: fi gures for Japan
refer to the Tokyo Stock Exchange. Figures
for the United States include the AMEX, the
NYSE and the NASDAQ. Euro area stock
market capitalisation is the sum of the values
for Euronext and for euro area countries
not included in Euronext. Stock market capitalisation includes only shares issued by domestic
companies; it does not include shares issued by foreign companies.
Debt securities issued by the private sector: for euro area countries, data are from the Securities and
Exchange Commission (SEC) database.
Data for Greece, Ireland and Luxembourg start in 1993. For Ireland, BIS data are used for the years
1993 to 2002 for MFIs and for the years 1993 to 2007 for other issuers. For Luxembourg, BIS data
for the years 1993 to 2007 are used for non-MFI issuers. For non-euro area countries, BIS data are
used (sum of international and domestic amounts outstanding of bonds issued by corporate issuers
and fi nancial institutions).
Bank credit to the private sector: euro area fi gures are the sum of euro area country fi gures and
include cross-border loans between euro area countries.
Description
This indicator shows the outstanding amounts of debt securities issued by non-fi nancial corporations,
as a percentage of GDP for each year. Then the fi ve-year averages (for the last period, the seven year
average) of the annual ratios are calculated.
3 In the fi xed composition of the 12 euro area countries: AT, BE, DE, ES, FI, FR, GR, IE, IT, LU, NL, PT.
4 The Euronext countries are BE, FR, NL and PT.
Chart 34 Size of capital markets
(aggregate volume of shares: bonds and loans to the private sector as a percentage of GDP)
0
100
200
300
400
500
600
700
800
900
1,000
0
100
200
300
400
500
600
700
800
900
1,000
1990-1994
1995-1999
2000-2004
2005-2011
1 2 3 4 5 6 7 8 9 10111213141516171819
1 AT
2 BE
3 DE
4 ES
5 FI
6 FR
7 GR
8 IE
9 IT
10 LU
11 NL
12 PT
13 EX
14 EA
15 CH
16 SE
17 UK
18 JP
19 US
Sources: WFE, BIS, IMF, ECB, Thomson Reuters, Eurostat and ECB calculations.

31ECB
Financial integration in Europe
April 2013S
Chart 35
Debt securities issued by non-financial
corporations
Data for the euro area countries come from the SEC
database. For Ireland and Luxembourg, BIS data
are used. Data for Greece, Ireland and Luxembourg
start in 1993. For non-euro area countries,
BIS data are used (the sum of international and
domestic amounts outstanding of bonds issued by
corporate issuers).
Chart 36-37
Description
Independent private equity investment is
provided by private equity fi rms that are
not themselves owned by another fi nancial
institution. The data cover investments made by
companies in each country. No data are available
for Luxembourg, Malta, Slovenia or Japan.
Data for Greece are not available for 1993 and 1994. Euro area fi gures are averages of country
data weighted by GDP.
Chart 37 Private equity investments by independent funds
(percentage share of total private equity investments)
0.0
0.2
0.4
0.6
0.8
1.0
1.2
0.0
0.2
0.4
0.6
0.8
1.0
1.2
1996-19992000-2003
2004-2007
2008-2011
1 2 3 4 5 6 7 8 9 10 11 12 13 14 15 16
ATBEDEES
1234
FI5678
FRGRIE
9 101112
ITNLPTEA
13141516
CHDKSEUK
Sources: European Private Equity and Venture Capital Association and ECB calculations.
Chart 36 Venture capital finance
(percentages of GDP)
0.00
0.02
0.04
0.06
0.08
0.10
0.12
0.00
0.02
0.04
0.06
0.08
0.10
0.12
1996-1999
2000-2003
2004-2007
2008-2011
1 AT2 BE3 DE
5 FI6 FR
4 ES8 IE9 IT
7 GR11 PT12 EA
10 NL14 DK15 SE
13 CH17 US16 UK
1 2 3 4 5 6 7 8 9 10 11 12 13 14 15 16 17
Sources: European Private Equity and Venture Capital Association, PricewaterhouseCoopers, Eurostat and ECB calculations.
Chart 35 Debt securities issued by non-financial corporations
(percentages of GDP)
40
35
30
25
20
15
10
5
0
40
35
30
25
20
15
10
5
0
1990-1994
1995-1999
2000-2004
2005-2011
1 2 3 4 5 6 7 8 9 10 11 12 13 14 15 16 17 18 19
1 AT
2 BE
3 DE
4 ES
5 FI
6 FR
7 GR
8 IE
9 IT
10 LU
11 NL
12 PT
13 EX
14 EA
15 CH
16 SE
17 UK
18 JP
19 US
Sources: BIS, ECB, Eurostat, IMF and ECB calculations.

32ECB
Financial integration in Europe
April 2013 S
STAT IST ICAL ANNEX
Chart 38
Pricing of global and regional information in the
stock market
Description
Average R² statistics for each country are
obtained by regressing fi rms’ stock returns on
market factors, i.e. the returns on domestic,
euro area, US and emerging countries’ stock
market indices. Typically, low indicator values
suggest that the stock returns contain more
fi rm-specifi c information. Euro area fi gures are
averages of country R² statistics weighted by
stock market capitalisation.
Chart 38 Pricing of global and regional information in the stock market
(R2 statistics)
0.00
0.05
0.10
0.15
0.20
0.25
0.30
0.35
0.40
0.45
0.50
0.00
0.05
0.10
0.15
0.20
0.25
0.30
0.35
0.40
0.45
0.50
1 2 3 4 5 6 7 8 9 10 11 12 13 14 15 16 17 18
1 AT
2 BE
3 DE
4 ES
5 FI
6 FR
7 GR
8 IE
9 IT
10 LU
11 NL
12 PT
13 EA
14 CH
15 SE
16 UK
17 JP
18 US
1990-1994
1995-1999
2000-2004
2005-2012
Sources: Thomson Reuters and ECB calculations.

EURO
PEAN
CEN
TRAL
BAN
K
iNAN
CiAL
iNT
EgRA
TiON
iN
EURO
PE
APRi
L 20
13