financial literacy and retirement readiness … of trustees/financial... · among public sector...
TRANSCRIPT
Prudential Retirement
Financial Literacy and Retirement Readiness StudyNorth Carolina
June 12, 2014
Global Strategic Research For Plan Sponsor or Financial Professional Use Only0257382-00001-00
Executive Summary
Financial Goals
Not run out of money in retirement is the most important financial goal among North Carolina residents, followed by afford medical care in retirement and maintaining desired lifestyle in retirementfollowed by afford medical care in retirement, and maintaining desired lifestyle in retirement
North Carolina residents place a higher importance in achieving financial goals than U.S. consumers overall
Confidence in achieving the top financial goals are among the lowest---only a third of North Carolina residents f l fid t th t th hi th l f t i t f i ti tfeel confident that they can achieve the goal of not running out of money in retirement
Financial Literacy
As with the rest of the country, financial literacy is a relevant issue in North CarolinaAs with the rest of the country, financial literacy is a relevant issue in North Carolina More than a quarter of working age and retired North Carolina residents lack the basic knowledge of
investing and saving for retirement Many do not have a good grasp of fundamental concepts of economics and finance---only about half are
able to answer 4 or more financial literacy questions correctly
Many North Carolina residents -- even those currently retired -- do not feel fully prepared to make financial decisions Fewer than 30% of retirees say they feel well-prepared for financial decision making. This is significantly
lower among younger age cohortsg y g g
Global Strategic Research 1For Plan Sponsor or Financial Professional Use Only

Executive Summary
Financial literacy in North Carolina is lower among men, public employees, those who are less affluent, younger, less educated, do not have a retirement account or do not currently work with an advisor
Among public sector workers, millennials, women and those less affluent exhibit the lowest levels of financial literacy
Pursuit of initiatives that are focused on improving financial literacy remains highly relevant Fi i l lit t th l ’ fid i hi i th i t i t t fi i l l l d Financial literacy strengthens people’s confidence in achieving their most important financial goals, leads to better portfolio decisions and can help prepare more people for retirement
Retirement Readiness
Similar to total US, North Carolina rates a C when it comes to retirement readiness
A third are below average or failing when it comes to retirement planning In particular, women in North Carolina are more vulnerable---39% rated their retirement planning below
f ili ( d t 27% f )average or failing (compared to 27% for men)
Retirement readiness is lower among women, younger workers, less affluent and those who do not have a retirement account
Among public sector workers, women, younger workers and less affluent are the least prepared for retirement
Global Strategic Research 2For Plan Sponsor or Financial Professional Use Only

Executive Summary
There is a strong need to promote better financial practices related to saving and planning for retirement Less than a third are saving with a goal in mind More than 6-in-10 are less than 20% of saving the amount they need for retirement
There is an opportunity to provide solutions that can help North Carolina residents plan and secure a steady income stream in retirement Despite expectations of working and living longer, very few are taking steps around estimating income
and expenses in retirementand expenses in retirement Less than a third are confident of being able to generate income for the duration of their retirement. This
is lowest among Gen X and non-affluent Current retiree experience in North Carolina points to the strong impact that longevity, healthcare
cost/illness, market volatility and inflation can have in retirement. A solution that addresses these risks d t i di id l th t ti t ld b ll i dand puts an individual on a path to a secure retirement would be well-received
Global Strategic Research 3For Plan Sponsor or Financial Professional Use Only

Study Background and Methodology
• The Financial Literacy and Retirement Readiness Study was conducted using an online survey among 1,302 adult Americans nationwide and 636 North Carolina residentsAll ti i t t th f ll i it i• All participants met the following criteria:• Age 21 and up• Some involvement in household financial decisions• Employed full-time or part-time, self-employed, stay at home parent, or retiredEmployed full time or part time, self employed, stay at home parent, or retired• Students and those who are unemployed where excluded in the non-retiree sample
• The survey was fielded between October 31 and December 2, 2013 by the Financial Services Group of Lightspeed ResearchR lt i ht d b d i d l t ( bli i t ) t li t• Results were weighted by gender, age, income and employee type (public vs. private) to ensure alignment with actual proportions in the population
• The study looks at financial literacy from a variety of perspectives using self-perceived information as well as actual performance on basic financial knowledge questions
• A significant portion of the research was focused on measuring current level of retirement planning and readiness. The study also captures overall financial capability, whether or not people are saving, if they are clear on what their goal should be, and if they are taking the right steps to achieve a successful retirement
• Additional insights were derived by looking at attitudes towards risk, money and saving, sources of i f ti d f fi i l d iinformation, and use of financial advisors
Global Strategic Research 4For Plan Sponsor or Financial Professional Use Only

Survey Participant Characteristics – North Carolina
Gender (%) Household Income (%) Marital Status (%)
Male 48%
Female 52%
Age (%)
U d 35 26%
Less than $25,000 23%
$25,000 to $49,999 26%
$50,000 to $74,999 18%
$75,000 to $99,999 12%
Single, never married 22%
Married 58%
Living with a domestic partner 6%
Divorced/separated 11%Under 35 26%
35 - 44 17%
45 - 54 19%
55 - 64 20%
6 19%
, ,
$100,000 to $124,999 10%
$125,000 to $149,999 6%
$150,000 or more 6%
Widowed 4%
Highest Level of Education (%)
Some high school 3%65+ 19%
Employment (%)
Retired 24%
Employed full-time 47%
Value of savings and investable assets
(%)
Less than $25,000 46%$25,000 to $49,999 11%$50,000 to $74,999 7%
High school graduate 17%
Some college 36%
Four-year college degree 30%
Master's or professional degree 14%p y
Employed part-time 9%
Stay at home parent 11%
Self-employed/small business owner 9%
Employee Type (%)
$75,000 to $99,999 4%$100,000 to $124,999 5%$125,000 to $149,999 2%$150,000 to $174,999 2%$175,000 to $199,999 3%
Retiree Status (%)
No, fully retired (not working at all) 93%
Yes, retired but still working full-time 0%Employee Type (%)
Public 29%
Private 71%
$175,000 to $199,999 3%$200,000 to $224,999 3%$225,000 to 249,999 2%$250,000 to $499,999 8%$500,000 to $1,999,999 6%$2 million or more 2%
Yes, retired but working part-time 7%
Other 1%
Global Strategic Research
$2 million or more 2%
5For Plan Sponsor or Financial Professional Use Only

Survey Participant Characteristics – North Carolina (Cont’d)
Race (%) Industry (%)Professional scientific & technical
Financial Responsibilities (current)
(%)
White/Caucasian 85%
Black or African American 11%
Latino, Spanish or Hispanic origin 1%
Asian or Pacific Islander 1%
Professional, scientific, & technical services & management of companies & enterprises
10%
Educational services 9%
Retail trade 9%
(current)
Spouse/ domestic partner 57%
Children 35%
Grandchildren 4%
Parents/In-laws 6%
Native American or Alaskan Native 0%
Mixed ethnicity or multiracial 1%
Other 1%
Healthcare & social assistance 9%
Manufacturing 9%
Public administration, government 5%
Construction 5%
Grandparents 0%
Other 1%
None 32%
Financial Responsibilities (expected during retirement)
(%)
Spouse/ domestic partner 57%Children 26%
Total Household Debt (%)
Less than $1,000 21%
$1,000 to $4,999 11%
$5,000 to $9.999 6%
Finance & insurance 5%
Information 4%
Accommodation & food services 3%
T t ti d h i 3%Grandchildren 7%Parents/In-laws 7%Grandparents 2%Other 1%None 33%
$ , $
$10,000 to $24,999 15%
$25,000 to $49,999 15%
$50,000 to $99,999 16%
$100,000 to $249,999 15%
$250 000 $499 999 2%
Transportation and warehousing 3%
Arts, entertainment & recreation 2%
Other Services 2%
Administrative & support & waste management & remediation services 2%None 33% $250,000 to $499,999 2%
$500,000 or more 1%
management & remediation services
Wholesale trade 2%
Real estate & rental & leasing 1%
Agriculture, forestry, fishing and hunting, & mining & utilities 1%
Global Strategic Research
Other 21%
6For Plan Sponsor or Financial Professional Use Only

Financial priorities of North Carolina residents reflect a strong focus on achieving retirement security
Not run out of money in retirement is the most important financial goal among North Carolina residents, followed by afford medical care in retirement, and maintaining desired lifestyle in retirement
Saving for retirement is an important goal particularly among younger residents -- 78% see it as important, compared to 65% of North Carolina residents overall Among retirees protecting existing savings comes out high on the list of
North Carolina Nationwide
Important Financial Goals
to 65% of North Carolina residents overall. Among retirees, protecting existing savings comes out high on the list of priorities
Not run out of money in ret 80% 75%
Afford medical/healthcare in ret 72% 68%
Have income to maintain desired ret lifestyle 70% 66%
Not become a burden to loved ones in ret 69% 64%Not become a burden to loved ones in ret 69% 64%
Pay for unexpected expenses in ret 68% 65%
Save for retirement 65% 58%
Protecting existing investments and savings 60% 55%
Reduce debt 59% 54%
Second most important goal (78%) among the younger population
Relatively more important tiReduce debt 59% 54%
Financial security to my loved ones if I die 58% 52%
Afford nursing home care 42% 39%
Save for major purchase other than home 40% 39%
among retirees
Support family members 37% 31%
Fund education for children/grandchildren 34% 28%
Save to purchase a home (primary) 30% 27%
Leave inheritance 29% 25%
Global Strategic Research
Give to charity 25% 20%
7For Plan Sponsor or Financial Professional Use Only

Confidence in achieving the most important financial goals are among the lowest
• Only 33% are confident that they will achieve the goal of not running out of money in retirement. This is lower among women, private sector workers, those who are less affluent, and those far off from retirement
Confidence in Achieving Top Financial GoalsConfidence in achieving top goal of ‘not
running out of money in retirement’
l33%
36%
37%
Not run out of money in retirement
Afford medical/health care in retirement
Have income to maintain desired ret lifestyle
35%
31%
28%
Male
Female
30+ yrs from ret
37%
33%
39%
Not become a burden to loved ones in retirement
Pay for unexpected expenses in ret
Save for retirement
24%
36%
49%
10 to <30 yrs from ret
<10 yrs from ret
Retiree
37%
45%
38%
Protecting existing investments and savings
Reduce debt
Financial security to my loved ones if I die
44%
33%
42%
Public
Private
Affluent
26%Afford nursing home care in retirement
42%
28%
Affluent
Non‐Affluent
Global Strategic Research 8For Plan Sponsor or Financial Professional Use Only

Financial Literacy in North Carolina
• More than a fifth of working age and retired North Carolina residents lack the basic knowledge of investing and saving for retirement; 16% are beginners and ill-equipped to make financial decisions
• Many do not have a good grasp of fundamental concepts of economics and finance---only about half are able to answer 4 or more financial literacy questions correctly
Knowledge of Different Financial Areas
very good(B)
average(C)
failing(F)
excellent(A)
below average (D)
Financial Knowledge*
correctincorrectdon’t know
answer 4 or more financial literacy questions correctly
4%
5%
5%
8%
28%
28%
38%
28%
25%
31%
Managing Money
Managing Debt
8%
17%
35%
13%
20%
6%
79%
64%
59%
Interest Rate
Inflation
Risk
(B)(C)(F) (A)average (D)
6%
15%
18%
17%
35%
34%
18%
24%
6%
10%
Investing
Saving for Retirement
35%
11%
34%
6%
6%
29%
59%
84%
37%
Risk
Mortgage
Bond Pricing
Level of Preparedness to Make Wise Financial Decisions
Financial Knowledge Summary(# of Correct Answers)
72%
49%
16% 27% 37% 19% 5% 8%15%
23% 28%21%
0 1 2 3 4 5
very well prepared
need help in a few areasbeginner
need to catch up in many areas
# of correct
Global Strategic Research
0 1 2 3 4 5answers
*Questions are consistent with National Financial Capability Study by the Finra Investor Education Foundation
9For Plan Sponsor or Financial Professional Use Only

Financial literacy in North Carolina varies widely across different segments
• Financial literacy is lower among women, public employees, those who are less affluent, younger, less educated, do not have a retirement account, or do not currently work with an advisor
knowledge ofinvesting
knowledge ofsaving for retirement
preparedness to make financial decision
24%
34%
Total
Male
investing g decision
34%
47%
19%
24%15%
% excellent or very good % excellent or very good % very well prepared
Total
Male
Total
Male
14%
20%
28%
Female
Public
Private
Gender
Employee Type
22%
30%40%
15%
19%21%
Female
Public
Private
Female
Public
Private
38%
15%
21%
19%
Affluent
Non affluent
Millennials
Gen XAge
Affluence59%
20%
30%27%
22%18%
14%17%
Affluent
Non affluent
Millennials
Gen X
Boomer
Affluent
Non affluent
Millennials
Gen X
Boomer24%
40%
19%
21%
Boomer
Mature
High school
College
Age
Education
37%61%
19%32%
22%30%
19%19%
Boomer
Mature
High school
College
Boomer
Mature
High school
College
42%
15%
29%
Masters
Do not have ret acctHave ret acct
59%
18%44%
21%
20%19%
Masters
Do not have ret acctHave ret acct
Masters
Do not have ret acctHave ret acct
Global Strategic Research
15%
39%
Without advisorWith advisor
21%58%
20%19%
Without advisorWith advisor
Without advisorWith advisor
10For Plan Sponsor or Financial Professional Use Only

Among public sector workers, financial literacy tends to be lower among women, those who are younger and less affluent
Preparedness to make financial decisions
Actual Financial Knowledge% answered 4 or more financial
Financial Literacy Among Public Sector Employees
% very well prepared literacy questions correctly
Total 19% 47%
Male 26% 62%
Female 13% 36%
Affluent 20% 68%
Non affluent 18% 34%
Millennials 10% 15%
Gen X 21% 44%
Boomer 19% 54%
Mature 23% 72%
Global Strategic Research 11For Plan Sponsor or Financial Professional Use Only

Retirement Readiness – North Carolina
• A third are below average or failing when it comes to retirement planning• Financial literacy is associated with better retirement planning (or conversely, lower levels of financial literacy is associated
with lower retirement readiness)
Level of Retirement Planning Financial Literacy and Retirement Readiness
35%
32%excellent (A)/ very good (B)
average(C)
19% 35% 46%more literate*
excellent (A)/ very good (B)
average(C)
below average (D)/ failing (F)
C
Average Grade
33%below average (D)/
failing (F)
46% 35% 19%less literate*
*more literate = answered 4 or more financial literacy questions correctly; less literate = answered 3 or less correctly
TotalNorth Carolina 10 years to ret
Low level of retirement planning is evident even among those who are closer to retirement
How many think they have < 20% of what they need for
retirement?63% 32%
How many are currently not i f ti t? 31% 20%
Global Strategic Research
saving for retirement? 31% 20%
12For Plan Sponsor or Financial Professional Use Only

Retirement readiness is lower among women, younger workers, less affluent and those who do not have a retirement account
Level of Retirement Planning
• Public sector workers are in a slightly better position vs. private sector counterparts when it comes to retirement planning
33% 35% 32%North Carolina
very good/excellentaverage
below average/ failing Similar patterns in retirement readiness are
observed when looking at specific demographic segments within public sector workers
27%
39%
43%
37%
34%
37%
36%
27%
20%
Male
Female
30+ yrs from retvery good/excellent
M l 44%
Level of Retirement Planning among Public Sector Workers
36%
31%
17%
41%
33%
28%
23%
36%
55%
y
10 to <30 yrs from ret
< 10 years from ret
Retirees
Male 44%Female 32%
Millennials 23%Gen X 23%
21%
33%
12%
41%
33%
30%
38%
34%
58%
Public employees
Private employees
Affluent
Boomers 44%Matures 67%
Affluent 54%Non-Affluent 27%
12%
44%
54%
30%
39%
33%
58%
17%
13%
Affluent
Non‐Affluent
Do not have ret acct
Do not have ret acct 27%Have ret acct 44%
Global Strategic Research
18% 37% 45%Have ret acct
13For Plan Sponsor or Financial Professional Use Only

Very few are saving with a specific goal in mind
• Close to a third are not saving at all for retirement; majority have less than 20% of what they think they will need for retirement
Total North Carolina
Pre-retirees < 20% vs. Saving Amount Needed for Retirement
31% 22% 35% 12%
Household Saving Behavior
Goal-orientedNot saving at all Casual Determined
63%
58%
Total North Carolina
Male
Total North Carolina
Male
31%
29%
22%
23%
35%
36%
12%
12%
67%
84%
Female
30+ yrs from ret
Female
30+ yrs from ret
32%
36%
22%
17%
35%
37%
12%
10%
60%
32%
10 to <30 yrs from ret
< 10 years from ret
10 to <30 yrs from ret
< 10 years from ret
31%
20%
24%
25%
34%
38%
11%
17%
49%
64%
Public employees
Private employees
Public employees
Private employees
16%
29%
31%
20%
43%
36%
10%
15%
Global Strategic Research 14For Plan Sponsor or Financial Professional Use Only

Views on Retirement Age and Longevity
• As with total US, North Carolinians expect to work and live longer• Millennials are the most optimistic when it comes to retirement age---expecting to retire at an earlier age vs. Gen X and
Boomers; Boomers expect to live the longest • Despite expectations of a longer life, average life expectancy remains lower than age of oldest person known
Expected Retirement Age and Years in Retirement
secondary data
Despite expectations of a longer life, average life expectancy remains lower than age of oldest person known
Total Male Female Millennials Gen X Boomer
Expected Retirement Age 66.64 66.72 66.54 64.84 67.24 66.95
E ti t d Y i R ti t 22 52 21 11 24 13 22 02 19 50 23 55
average retirement age is 64• men – 64 • women - 62
secondary data (based on census estimates for
total US):
Estimated Years in Retirement 22.52 21.11 24.13 22.02 19.50 23.55
Calculated Life Expectancy 89.16 87.83 90.67 86.86 86.74 90.50
average life expectancy is 79• men – 76 • women - 81
Age of Oldest Person Known 93.59 93.89 93.31 92.24 92.46 94.43
Global Strategic Research 15For Plan Sponsor or Financial Professional Use Only

Estimated Amount Needed in Retirement
• On average, North Carolina residents estimate the monthly income needed for retirement at a little over $3,000. This varies by segment with men, millennials, higher income, private sector workers and those with a retirement account having a higher estimate
• Estimates from those who are more financially literate do not differ by much vs. the State average
Total Amount Needed in Retirement
Monthly Amount Needed in Retirement
Average Annual % of Total HH Income
• Compared to other segments, those without a retirement account and with lower HH income have the lowest rate of retirement saving
Expected Amount Needed in Retirement
in Retirement(estimate in US$)
Needed in Retirement(estimate in US$)
Total HH Income Saved for Retirement
Total 858,885 3,040 10
Male 1,006,693 3,244 11Female 723,411 2,851 9
Millennials 1,394,410 3,140 9Gen X 1,012,922 2,760 10Boomers 565,101 2,972 12
<$25K 539,411 1,901 5$ 539, ,90$25K to <$50K 725,211 2,972 9$50K to <$75K 1,018,714 3,327 11$75K to <$100K 744,084 3,375 12$100K to <$125K 858,721 3,128 15$125K+ 1,637,285 4,544 15
Public 605,379 2,511 14Private 1,010,521 3,418 11
Does not own a retirement acct 675,306 2,801 8Own a retirement acct 986,468 3,204 12
Global Strategic Research
986,468 3,204 12
More literate 959,946 3,116 10Less literate 763,415 2,967 10
16For Plan Sponsor or Financial Professional Use Only

Efforts to improve financial literacy in North Carolina can help strengthen people’s confidence in achieving important goals
Financial Literacy and Confidence in Achieving Top Retirement Goals
35%
30%
36%
36%
more literate
less literate
Not run out of money in ret
Afford medical/health care in ret
34%
34%
40%
41%Have income to maintain desired ret lifestyle
Not become a burden to loved ones in ret
33%
29%
43%
37%Have cushion to pay for unexpected expenses in ret
Financial security to my loved ones if I die or become disabled
24%
33%
28%Afford nursing home care in ret
Global Strategic Research 17For Plan Sponsor or Financial Professional Use Only

Financial literacy promotes better portfolio decisions
Financial Literacy and Products Used to Save for Retirement
44%Employer sponsored plan (e g 401K 403b 457)
Financial Literacy and Products Used to Save for Retirement
66%
less literate more literate
20%
17%
44%Employer-sponsored plan (e.g., 401K, 403b, 457)
Employer-sponsored pension plan
Individual Retirement Account (IRA) NOT employer-sponsored 51%
34%
66%
10%
5%
38%Cash (checking, money market, CDs or savings accounts)
Individual bonds
Individual stocks 31%
12%
55%
3%
8%
10%Individual stocks
Mutual funds
Exchange Traded Funds (ETFs) 7%
33%
31%
16%
24%
5%Annuities
Life insurance
Primary residence 46%
37%
18%
Global Strategic Research
7%Other properties/real estate investment 13%
18For Plan Sponsor or Financial Professional Use Only

A strong case can be made about the need to help North Carolina residents plan and secure a steady income during retirement• Very few North Carolina residents have done any planning around income or expenses in retirement• Less than a third are confident of being able to generate income for the duration of their retirement. This is lowest among
Gen X and less affluent
Steps Taken Steps Plan to Take in 5 Years
Financial Planning Steps Taken/Plan to Take
very/ somewhataverage
less/ not at all
Confidence in “being able to generate income in retirement”
(among non-retirees)
21%
20%
23%
32%Estimate income from social security
Estimate income needed in retirement
26%
19%
25%
45%
42%
46%
29%
39%
29%
North Carolina
Public
Private
20%
14%
21%
21%Study options re: when to draw from social security
Estimate expenses in retirement
25%
23%
29%
46%
45%
44%
29%
32%
27%
Private
Male
Female
19%
18%
19%
19%Establish savings goal for retirement
Estimate # of years your money will last in ret
27%
31%
21%
42%
47%
42%
31%
21%
37%
Millennials
Gen X
Boomers
18%16%Look into ways to convert your ret
savings into income stream
15%
32%
44%
45%
40%
23%
Affluent
Non‐Affluent
Global Strategic Research 19For Plan Sponsor or Financial Professional Use Only

Healthcare cost is a big concern and is most likely to have a negative impact in retirement
• Income solutions can help alleviate potential impact of healthcare cost in retirement, while at the same providing added benefits to address concerns around market volatility and inflation
What elements are pre-retirees most concerned about in terms of
having a negative impact on
What elements do retirees say has had a negative impact on their
retirement?
Top Financial Concerns among North Carolina Residents
g g pretirement? retirement?
• Healthcare costs (56%)
• Changes to social security (52%)
• Healthcare costs (30%)
• Illness or disability (27%
HEALTHCARE COSTSmy health
• Inflation (43%)
• Illness or disability (39%)
• Market volatility (34%)
• Inflation (26%)
• Low interest rates affecting ability to meet savings targets (25%)
• Market volatility (22%)
Household Expenses
Household Debt
Household Spending
my finances
f Future of Social Securitymy future
National Debt, Inflationthe economy
Global Strategic Research 20For Plan Sponsor or Financial Professional Use Only

Learning from Retirees
• More than half of retirees wished they saved more and earlier; a fifth would have wanted to have invested more aggressively and maximized benefits of employer retirement plan
• Specific advice to pre-retirees from retirees follow a similar theme
Things Wished Had Done Differently
- “Start putting away money early, no matter how old you are”- “Start saving at an earlier age. Save on a schedule so as to make
it a habit DON'T CARRY DEBT ”
Start saving earlier
Advice to Pre-Retirees(among retirees)
53%Saved more
it a habit. DON T CARRY DEBT.- “Start saving for retirement as soon as you start working.”- “Start saving now, small amounts if necessary, but start.”- “Start saving young! Get advice on what to do with savings”
- “Save as much as you possibly can because costs of everything is going up
Save more20%
51%Started saving earlier
Invested more aggressively
going up- “Save more and plan ahead.”- “Save as much as you can for the future can throw us some nasty
curves”- “If you want to live well in retirement, it requires giving up things
now!”Seek financial advise
17%
18%Maximized benefits from employer ret plan
Studied financial products options more
- “Get a financial planner ASAP”- “Spend less then you earn and get a financial advisor”
Seek financial advise
- “Contribute maximum to employee sponsored plans.”- “Make a financially secure retirement a priority Consider investing in
Maximize benefits from employer retirement plan12%
14%Asked for more advice
Consulted a financial advisor
- Make a financially secure retirement a priority. Consider investing in your retirement just like any other monthly bill or you'll never have the extra funding to begin.”
- “Own your home free of debt.”- “Pay off mortgage before retirement.”
“Reduce debt spending”
Reduce debt7%
8%Communicated more with my spouse
about ret goals
Retired later
Global Strategic Research
- Reduce debt spending
21For Plan Sponsor or Financial Professional Use Only
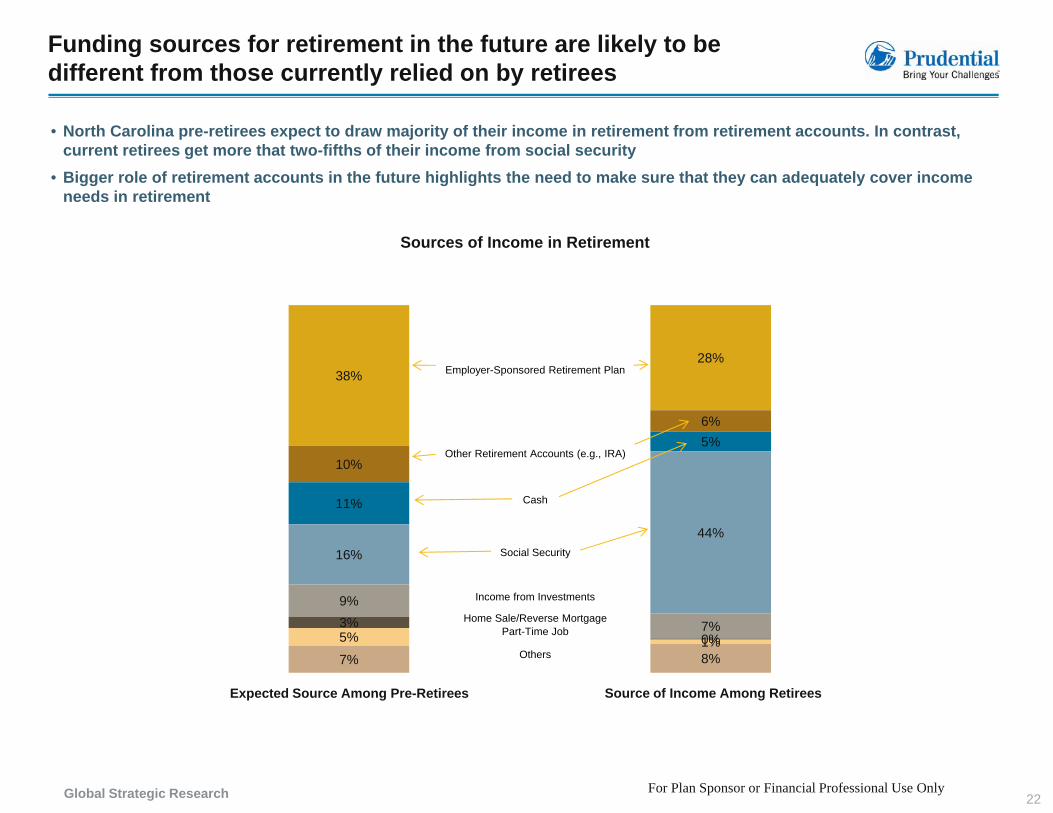
Funding sources for retirement in the future are likely to be different from those currently relied on by retirees
• North Carolina pre-retirees expect to draw majority of their income in retirement from retirement accounts. In contrast, current retirees get more that two-fifths of their income from social security
• Bigger role of retirement accounts in the future highlights the need to make sure that they can adequately cover income needs in retirement
Sources of Income in Retirement
38%28%
Employer-Sponsored Retirement Plan
10%
6%
11%
5%Other Retirement Accounts (e.g., IRA)
Cash
16%44%
9%
Social Security
Income from Investments
Expected Source Among Pre-Retirees Source of Income Among Retirees
7%3%0%5% 1%
7% 8%
Home Sale/Reverse MortgagePart-Time Job
Others
Global Strategic Research 22For Plan Sponsor or Financial Professional Use Only

Sources of information for financial planning vary depending on goals; family and friends are among the key influencers
Main Sources of Information
• Advisors are the main source of information when it comes to investing• Employers play a secondary role behind traditional media and web sources
General Finance Investing Retirement Planning
• Family/friends (40%)• Web (34%)• Traditional Media (31%)• Bank/Credit Union (30%)
g
• Advisor (35%)• Family/friends (28%)• Web (33%)• Traditional Media (30%)
g
• Family/friends (44%)• Web (34%)• Traditional Media (31%)• Advisor (30%)Bank/Credit Union (30%)
• Advisor (28%)• Employer/co-workers (21%)
Traditional Media (30%)• Banks/Credit Union (25%)• Employer/co-workers (18%)
Advisor (30%)• Employer/co-workers (28%)• Banks/Credit Union (25%)
Reliance on family and friends for information is higher among millennials
Retirees and affluent consumers see advisors as their main source of financial information
Global Strategic Research 23For Plan Sponsor or Financial Professional Use Only

Disclosures
Retirement products and services are provided by Prudential Retirement Insurance and AnnuityCompany (PRIAC), Hartford, CT, a Prudential Financial company.
© 2014 Prudential Financial, Inc. and its related entities. Prudential, the Prudential logo, the Rocksymbol and Bring Your Challenges are service marks of Prudential Financial, Inc., andits related entities, registered in many jurisdictions worldwide.
Global Strategic Research 24For Plan Sponsor or Financial Professional Use Only