financial management assignment report
TRANSCRIPT

Financial Management and Control Assignment PGBM01
TABLE OF CONTENTS
No Contents Page No
1 Executive Summary2
2 Part A financial ratios Analysis3-6
3 Part B Analysis of four different appraisal method7-8
4 Part C Break even Analysis and its limitation9-12
5 Part D Main Sources of finance, Budget as planning and control, relevance of committed fixed cost
13-16
6 References / Bibliography17
7 Appendices18-20
University of Sunderland, Business School Page 1

Financial Management and Control Assignment PGBM01
EXECUTIVE SUMMARY
This report of Financial Management and control is base on four
parts. The first analyse the Arrowbell Company’s performance in
relation to profitability; liquidity; asset utilisation and investors
ratios.
Second part describes the feasibility to invest in the new machine
in the light of four different appraisal method taught during the
module and critical evaluation of these methods.
Third part analyze cost volume relationship and criticize the
assumptions of the breakeven analysis in the light of the reality of
today’s business environments.
Fourth Part describes The main sources of finance available to
business and the advantages and disadvantages of each source,
Budgeting as a means of planning and control, relevance of
committed fixed cost within short term decision making. The
calculations are available in Appendices.
University of Sunderland, Business School Page 2
Financial Management and Control Assignment PGBM01
PART A
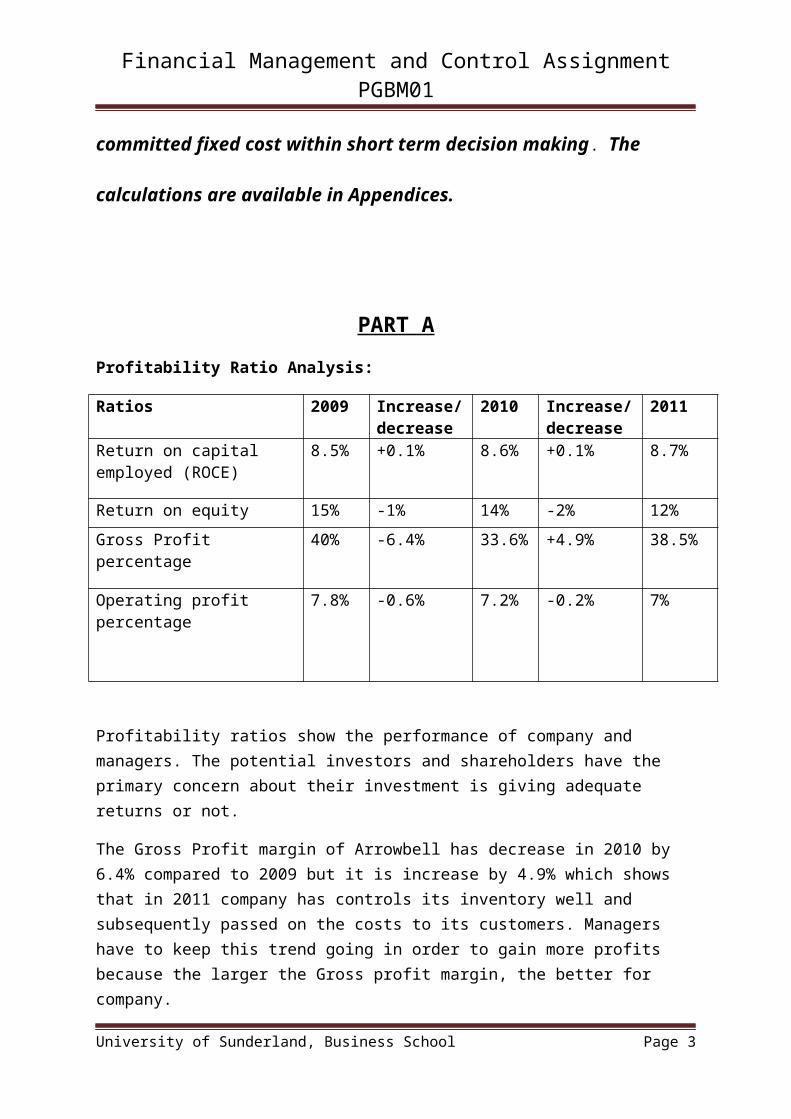
Profitability Ratio Analysis:
Ratios 2009 Increase/decrease
2010 Increase/decrease
2011
Return on capital employed (ROCE)
8.5% +0.1% 8.6% +0.1% 8.7%
Return on equity 15% -1% 14% -2% 12%
Gross Profit percentage 40% -6.4% 33.6% +4.9% 38.5%
Operating profit percentage 7.8% -0.6% 7.2% -0.2% 7%
Profitability ratios show the performance of company and managers. The potential investors and shareholders have the primary concern about their investment is giving adequate returns or not.
The Gross Profit margin of Arrowbell has decrease in 2010 by 6.4% compared to 2009 but it is increase by 4.9% which shows that in 2011 company has controls its inventory well and subsequently passed on the costs to its customers. Managers have to keep this trend going in order to gain more profits because the larger the Gross profit margin, the better for company.
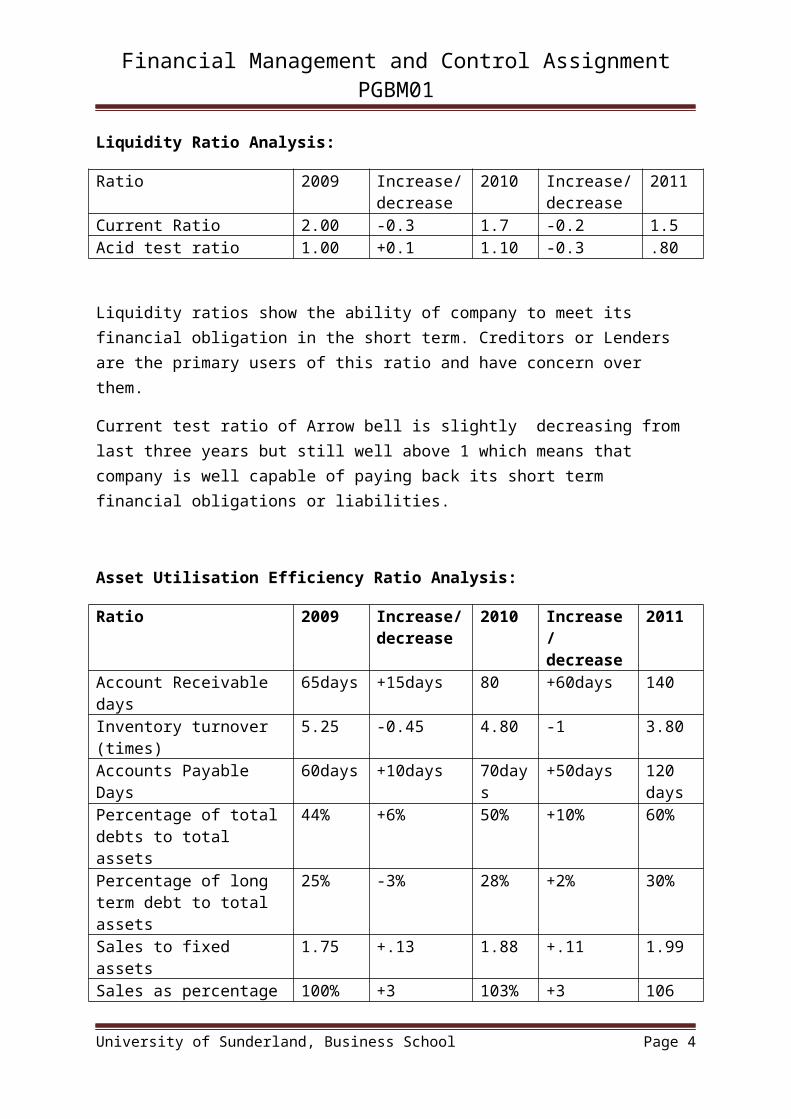
Liquidity Ratio Analysis:
Ratio 2009 Increase/decrease
2010 Increase/decrease
2011
Current Ratio 2.00 -0.3 1.7 -0.2 1.5Acid test ratio 1.00 +0.1 1.10 -0.3 .80
Liquidity ratios show the ability of company to meet its financial obligation in the short term. Creditors or Lenders are the primary users of this ratio and have concern over them.
Current test ratio of Arrow bell is slightly decreasing from last three years but still well above 1 which means that company is well capable of paying back its short term financial obligations or liabilities.
University of Sunderland, Business School Page 3
Financial Management and Control Assignment PGBM01
Asset Utilisation Efficiency Ratio Analysis:
Ratio 2009 Increase/decrease
2010 Increase/decrease
2011
Account Receivable days 65days +15days 80 +60days 140Inventory turnover (times) 5.25 -0.45 4.80 -1 3.80Accounts Payable Days 60days +10days 70days +50days 120
daysPercentage of total debts to total assets
44% +6% 50% +10% 60%
Percentage of long term debt to total assets
25% -3% 28% +2% 30%
Sales to fixed assets 1.75 +.13 1.88 +.11 1.99Sales as percentage of 2009 sales
100% +3 103% +3 106
Assets efficiency ratios show the usage of the company’s assets, how the assets have been utilized, in other words these ratio shows how efficiently the company’s assets are managed. Management have the main concern over these ratios because these ratios show the efficiency of managers in using assets.
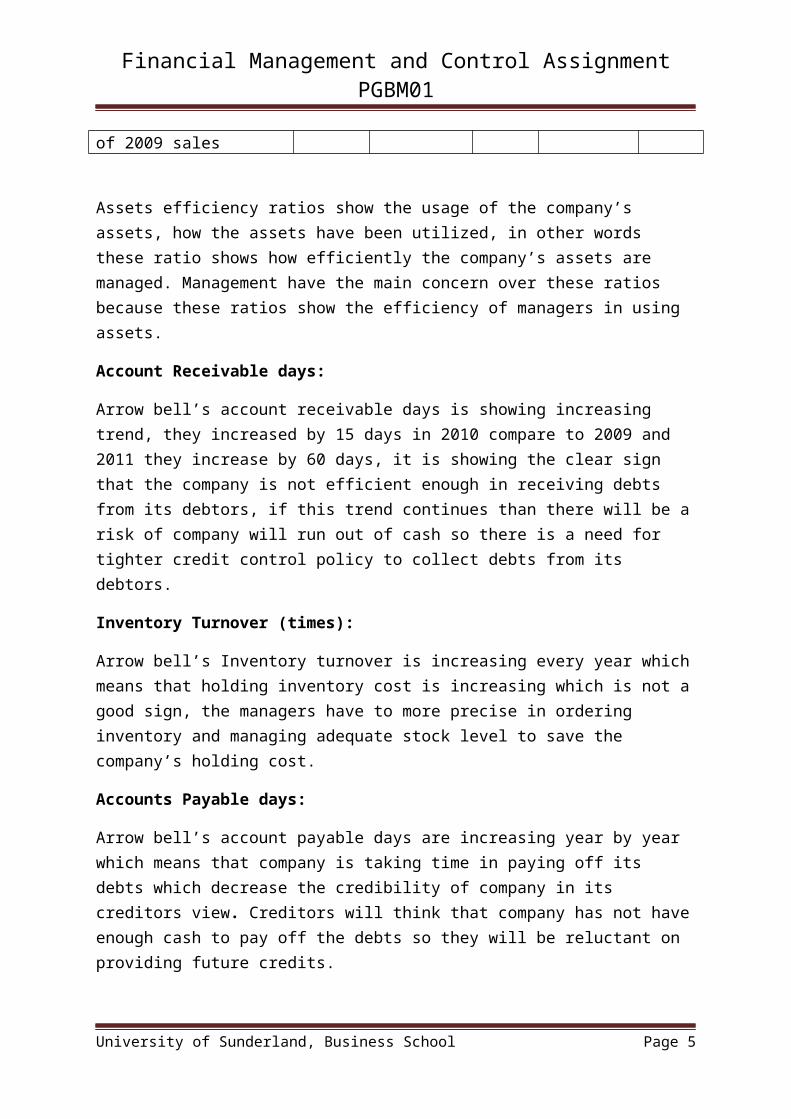
Account Receivable days:
Arrow bell’s account receivable days is showing increasing trend, they increased by 15 days in 2010 compare to 2009 and 2011 they increase by 60 days, it is showing the clear sign that the company is not efficient enough in receiving debts from its debtors, if this trend continues than there will be a risk of company will run out of cash so there is a need for tighter credit control policy to collect debts from its debtors.
Inventory Turnover (times):
Arrow bell’s Inventory turnover is increasing every year which means that holding inventory cost is increasing which is not a good sign, the managers have to more precise in ordering inventory and managing adequate stock level to save the company’s holding cost.
Accounts Payable days:
Arrow bell’s account payable days are increasing year by year which means that company is taking time in paying off its debts which decrease the credibility of company in its creditors view. Creditors will think that company has not have enough cash to pay off the debts so they will be reluctant on providing future credits.
University of Sunderland, Business School Page 4
Financial Management and Control Assignment PGBM01
Percentage of Total debts Over Total Assets:
Percentage of total debts over total asset of Arrow bell’s Company is increasing year by year which shows that the company’s debts are increasing over its total assets, this trend has to be stopped and managers should have to be very careful when making borrowing decisions.
GEARING RATIO ANALYSIS:
Ratio 2009 Increase/decrease
2010 Increase/Decrease
2011
Gearing ratio 40% +2% 42% +6% 48%Interest cover 12 -2 10 -3 7
A gearing ratio is a financial ratio that compares some measure of owner's equity to borrowed funds. Gearing, as a financial term, is a comparison between how much of a firm’s activities are funded by borrowed funds as compared to owner's funds. As such, the gearing ratio is a measure of the firm's financial leverage or risk. It is also an indirect measure of the company's business risk.
INVESTMENT RATIO ANALYSIS:
Ratio 2009 Increase/decrease
2010 Increase/decrease
2011
EPS (earnings per share) 0.55 +0.25 0.80 +0.40 1.20Operating cash flow per share
1.50 +0.35 1.85 +0.25 2.10
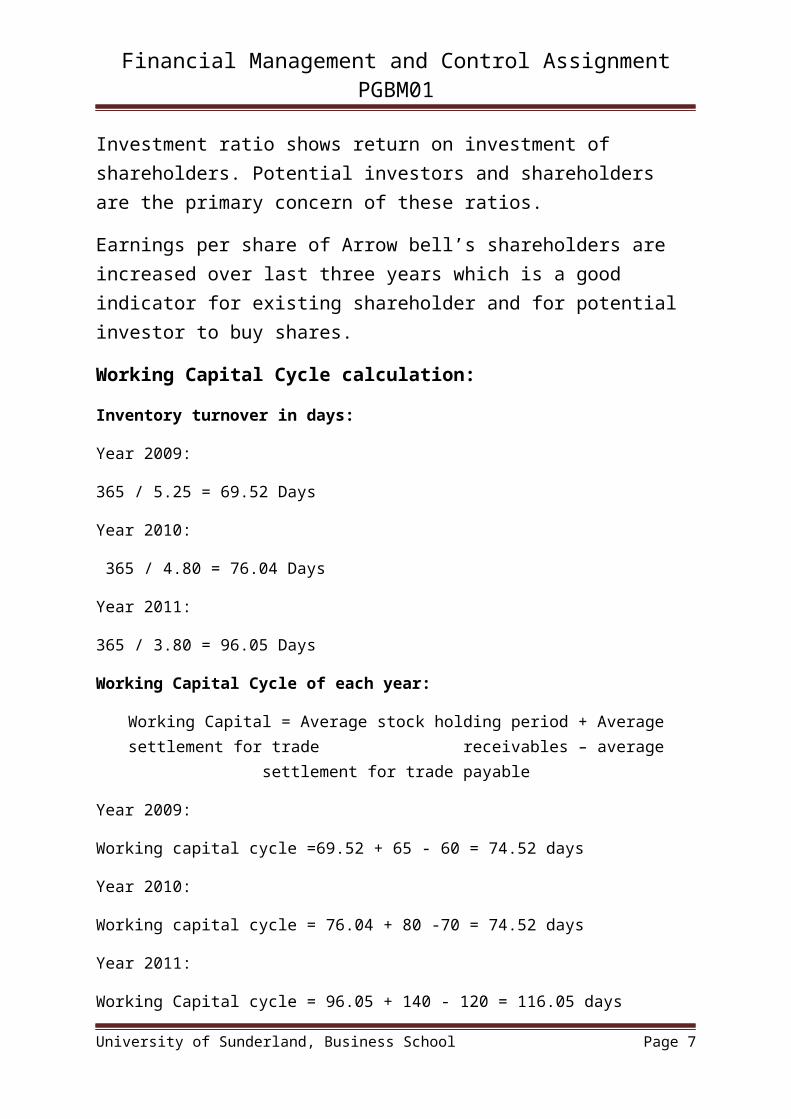
Investment ratio shows return on investment of shareholders. Potential investors and shareholders are the primary concern of these ratios.
Earnings per share of Arrow bell’s shareholders are increased over last three years which is a good indicator for existing shareholder and for potential investor to buy shares.
Working Capital Cycle calculation:
Inventory turnover in days:
Year 2009:
365 / 5.25 = 69.52 Days
Year 2010:
365 / 4.80 = 76.04 Days
University of Sunderland, Business School Page 5

Financial Management and Control Assignment PGBM01
Year 2011:
365 / 3.80 = 96.05 Days
Working Capital Cycle of each year:
Working Capital = Average stock holding period + Average settlement for trade receivables – average settlement for trade payable
Year 2009:
Working capital cycle =69.52 + 65 - 60 = 74.52 days
Year 2010:
Working capital cycle = 76.04 + 80 -70 = 74.52 days
Year 2011:
Working Capital cycle = 96.05 + 140 - 120 = 116.05 days
Working Capital Analysis of Arrow bells ltd:
The working capital cycle measures the amount of time that elapses between the moment when the business begins investing money in a product or service, and the moment the business receives payment for that product or service.
The above calculation shows that working capital cycle of Arrowbell’s company is
increased by 41.55 days which means its takes Arrow bell longer to get the cash in
the business to pay off its debts. This is the sign of concern for the management,
they should make some efforts to reduce the inventory holding period and be
efficient in collecting payments from its debtors.
University of Sunderland, Business School Page 6
Financial Management and Control Assignment PGBM01
PART B (a)
Recommendation:
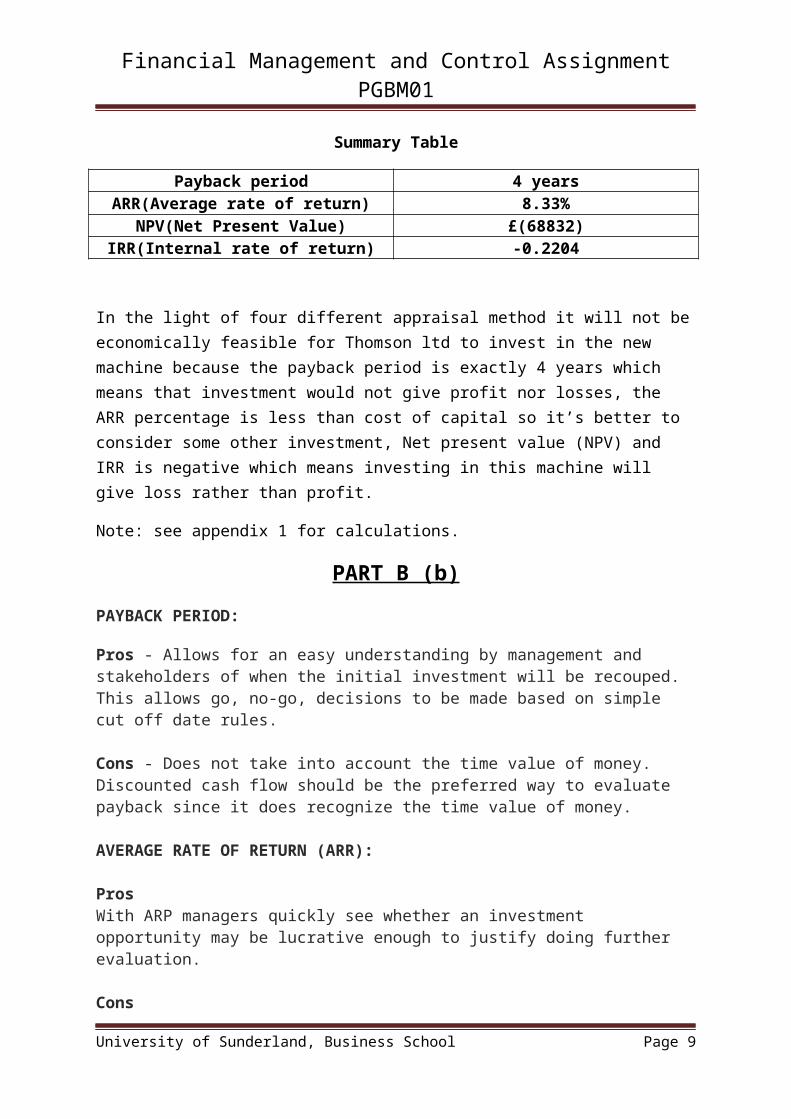
Summary Table
Payback period 4 yearsARR(Average rate of return) 8.33%
NPV(Net Present Value) £(68832)IRR(Internal rate of return) -0.2204
In the light of four different appraisal method it will not be economically feasible for Thomson ltd to invest in the new machine because the payback period is exactly 4 years which means that investment would not give profit nor losses, the ARR percentage is less than cost of capital so it’s better to consider some other investment, Net present value (NPV) and IRR is negative which means investing in this machine will give loss rather than profit.
Note: see appendix 1 for calculations.
PART B (b)
PAYBACK PERIOD: Pros - Allows for an easy understanding by management and stakeholders of when the initial investment will be recouped. This allows go, no-go, decisions to be made based on simple cut off date rules.
Cons - Does not take into account the time value of money. Discounted cash flow should be the preferred way to evaluate payback since it does recognize the time value of money. AVERAGE RATE OF RETURN (ARR):
ProsWith ARP managers quickly see whether an investment opportunity may be lucrative enough to justify doing further evaluation.
ConsThe biggest drawback in using the ARP is it does not take into account the time value of money. This is the concept that money is worth a known amount today, but there is no certainty what the same amount of money will be worth in the future.
University of Sunderland, Business School Page 7

Financial Management and Control Assignment PGBM01
NET PRESENT VALUE (NPV): Pros - Accounts for the fact that the value of a dollar today is more than the value of a dollar received a year from now - that's the time value of money concept. It also recognizes the risk associated with future cash flow - it's less certain.
Cons - Does not give visibility into how long a project will take to generate a positive NPV due to the calculations simplicity. Our NPV rule tells us to accept all investments where the NPV is greater than zero. However, the measure doesn't tell us when a positive NPV is achieved. Fortunately, there is another measure that can help overcome this weakness - the calculation of internal rates of return. INTERNAL RATE OF RETURN (IRR):
Pros - It is based on discounted cash flows - so accounts for the time value of money, the measure provides excellent guidance on a project's value and associated risk
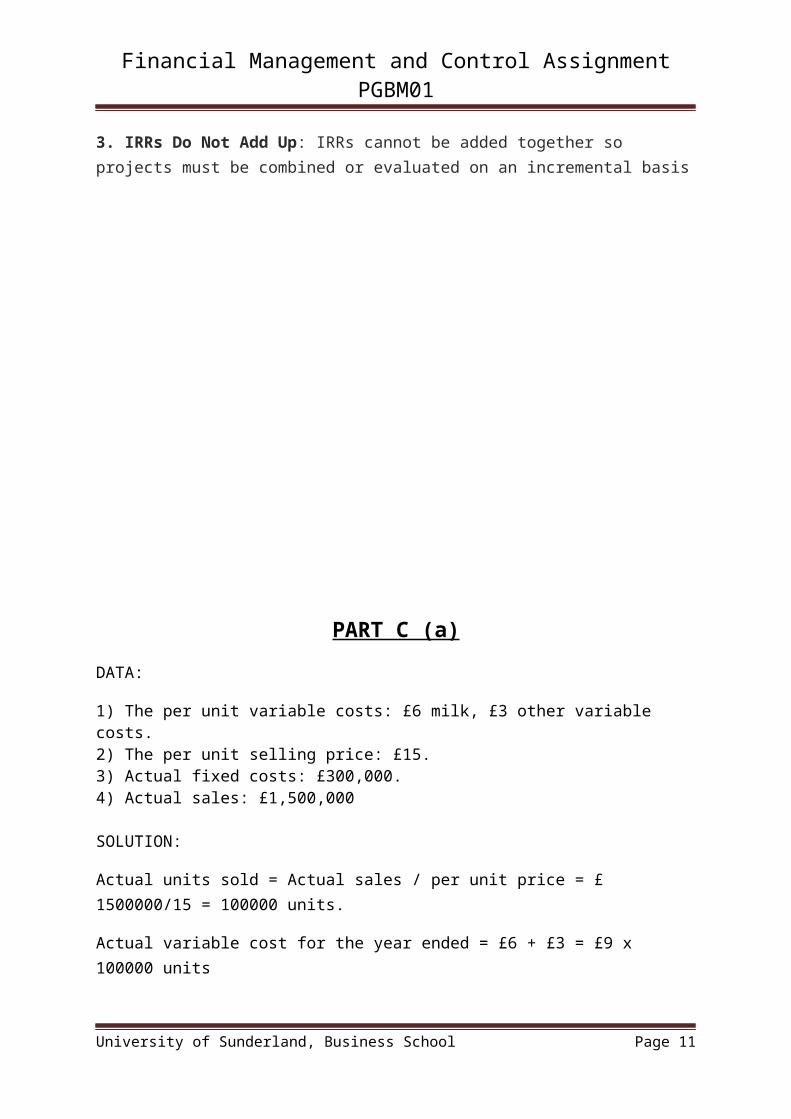
Cons - There are three pitfalls1. Multiple or no Rates of Return: if you're evaluating a project that has more than one change in sign for the cash flow stream, then the project may have multiple IRRs or no IRR at all.2. Changes in Discount Rates: the IRR rule tell us to accept projects where the IRR is greater than the opportunity cost of capital or WACC. But if this discount rate changes each year then it's impossible to make this comparison.3. IRRs Do Not Add Up: IRRs cannot be added together so projects must be combined or evaluated on an incremental basis
University of Sunderland, Business School Page 8
Financial Management and Control Assignment PGBM01
PART C (a)
DATA:
1) The per unit variable costs: £6 milk, £3 other variable costs.2) The per unit selling price: £15.3) Actual fixed costs: £300,000.4) Actual sales: £1,500,000
SOLUTION:
Actual units sold = Actual sales / per unit price = £ 1500000/15 = 100000 units.
Actual variable cost for the year ended = £6 + £3 = £9 x 100000 units
= £900000
INCOME STATEMENT FOR THE YEAR JUST ENDED
Sales £1500000
Less Variable cost £ 900000
Contribution £ 600000
Less Fixed cost £ 300000
Operating profit £ 300000
Breakeven Quantity calculation:
Sales = Variable cost + Fixed cost + Profits
15Q = 9Q + 300000 + 0
15Q – 9Q = 300000
6Q = 300000
Q = 300000 / 6 = 50000 units
Break even quantity is 50000 units
The value of Breakeven Quantity = 50000 units x £15 = £750000
University of Sunderland, Business School Page 9

Financial Management and Control Assignment PGBM01
Margin of safety calculation:
Margin of safety units = Actual unit sold – Break even quantity
= 100000 – 50000
= 50000 units
Value of Margin and safety = margin of safety units x selling price
= 50000 units x £15
= £750000
PART C (b)
Variable Cost 5% increase in Milk price = 5% x 6 = £ 0.3
Variable Cost after 5% increase in Milk price = £ 0.3 + £6 = £6.3
Total Variable cost Milk & other variable = £6.3 + £3 = £ 9.3
Still maintain the last year’s contribution margin ratio
Selling price =?
Variable cost (9.3) = 60%
Contribution cost (Y) = 40%
Calculate (Y)
40 x 9.3/ 60(Y)
Y= £6.2
New Selling Price = Variable cost + Contribution Margin
New Selling Price = £ 9.3+ £ 6.2
New Selling Price = £15.5
Variable cost = £ 9.3
Contribution Margin = £ 6.02
University of Sunderland, Business School Page 10
Financial Management and Control Assignment PGBM01
Planning To achieve a net Profit of £ 300,000
El-Domyati Co
Expected Income Statement
Sales (£15.5 New Units price x 96,774.19 units) £1,500,000
Less: Variable Expenses
Variable Cost (Milk) £630,000
Other Variable Cost £300,000
Total Variable Expenses £930,000
Contribution Margin £600,000
Less: Fixed Cost £300,000
Operating Profit £300,000
PART C (c)
University of Sunderland, Business School Page 11

Financial Management and Control Assignment PGBM01
LIMITATIONS OF BREAK EVEN ANALYSIS:
Linearity:
The first limitation is that revenues and costs are assumed to be linear. That means
the selling price per unit would never change and every customer would pay exactly
the same price per unit. It also means that variable costs would be exactly the same
for every unit. There is no provision for discounts to be received on materials
purchased or fluctuating overtime premium to be paid to employees who work
different quantities of extra hours.
Relevant range:
The company would always operate within the relevant range. There would never be
a need to increase or decrease capacity.
Productivity:
Productivity or technological changes would not occur to change the behaviour of
costs from variable to fixed. Over the history of business, technology and productivity
have not been static. The shift from labour-intensive to capital-intensive industry
converted some formerly variable costs to fixed costs. The same change in cost
behaviour (away from variable to fixed) has occurred in retail and service businesses
as technology has reduced or replaced human labour with bar code readers and
computer software.
Inventory:
There would be no change in the amount of inventory carried by the company. The
quantity of units sold would always equal the quantity purchased and/or produced.
For manufacturing firms, generally accepted accounting principles divide the costs of
production between unsold inventory (on the balance sheet) and sold units (on the
income statement). This cost allocation presents no problem for variable costs.
However, it is a problem with regard to fixed production costs when the quantity of
goods produced is not the same as the quantity sold. Cost-volume-profit analysis
requires that all fixed costs be accumulated for use in the analysis.
Inflation:
University of Sunderland, Business School Page 12

Financial Management and Control Assignment PGBM01
There would be no inflation or deflation. Inflation and deflation tend to make fixed
costs appear variable. When performing a cost analysis of utilities (such as water,
electricity, and natural gas) or fuel (gasoline, for example), the actual units
consumed may be used in lieu of the pound cost to eliminate the effects of inflation
or deflation.
Sales mix. If the company sells more than one product or service, the sales mix
would remain constant.
PART D (a)
Main Sources of Finance Available to a Business:
Sources of finance available to a business are classified into two groups
1) Internal sources of Finance2) External sources of Finance
Internal Sources of Finance:
In internal financing, the sources of finance obtained from inside of the business organization whereas Usually internal financing has no cost to the business, while the external source that a third party involved, and contain more cost for the business. Funds can be raised by
-Holding the profits instead of dividing to the shareholders for reinvesting in the business
-A tight credit control policy can be adapted to raised funds by chasing Debtors
- By delaying payments to creditors till the Due date can be use to raised funds in short term
-Reduces inventory level
External Sources of Finance (short term):
Bank Overdraft:
Bank overdraft is a short term credit facility provided by banks for its current account holders. This facility allows businesses to withdraw more money than their bank account balances hold. Interest has to be paid on the amount overdrawn. Bank overdraft is the ideal source of finance for short-term cashflow problems
Debt Factoring:
University of Sunderland, Business School Page 13

Financial Management and Control Assignment PGBM01
This is where the factoring company pays a proportion of the salesinvoice of the business within a short time-frame to the business. Theremainder of the money is paid to the business when the factoring company receives the money from the business’s debtor. The remainder of the money will be paid only after deducting the factoring company’s service charges. Some factoring companies even offer to maintain the sales ledger of the business. Factoring is of two types: Recourse factoring and Non-recourse factoring.
Invoice Discounting:
In invoice discounting the client company send out a copy of the invoice to the invoice discounting firm. The client then receives a portion of the invoice value. In contrast to factoring, the client company collects the money from its debtors. Once the payment is received it is deposited in a bank account controlled by the invoice discounter. The invoice discounter will then pay the remainder of the invoice less any charges to the client.
External sources of Finance (long term):
Issuing Ordinary shares:
Ordinary shares also known as equity shares are a unit of investment in a company. Ordinary shareholders have the privilege of receiving a part of company profits via dividends which is based on the value of shares held by the shareholder and the profit made for the year by the company. They also have the right to vote at general meetings of the company. Companies can issue ordinary shares in order to raise finance for long-term financial needs.
Long term loans / Debentures:
Debentures are issued in order to raise debt capital. Debentureholders are not owners but long-term creditors of the company.Debenture holders receive a fixed rate of interest annually whether the company makes a profit or loss. Debentures are issued only for a timeperiod and thus the company must pay the amount back to the debentureholders at the end of the agreed period. Debentures can be secured,unsecured, fixed or floating.
Preference shares:
Preference shares are another type of shares. Preference shareholders receive a fixed rate of dividends before the ordinary shareholders are paid. Preference shareholders do not have the right to vote at general meetings of the company. Preference shares are also an ownership capital source of finance. There are several types of preference shares. Some of them are Cumulative preference share, Redeemable preference share, Participating preference share and Convertible preference share.
University of Sunderland, Business School Page 14

Financial Management and Control Assignment PGBM01
Finance leases:
In a lease the leasing company buys the asset on behalf of thebusiness and the asset is then provided for the business to its use. Unlike a hire purchase the ownership of the asset remains with the leasing company. The business pays a rent throughout the leasing period. The leasing firm is known as the lessor and the customer as lessee.
Hire Purchase:
Hire purchase allows a business to use an asset without paying the full amount to purchase the asset. The hire purchase firm buys the asseton behalf of the business and gives the business the sole usage of the asset.
PART D (b)
Budget as a Mean of Planning:
Budget is an important tool in developing objectives, plays a crucial role in setting up goals and in planning how firm will reach their ultimate goals.
Budgets are also used in controlling the performance of organisations by comparing actual and budgeted performance.
Advantages:
Budgeting coordinates activities across different departments. Budgets specify the revenues, resources and activities required to carry out
the strategic plan for the coming year. Budgets improve communication between management and employees. Budgets provide an excellent record of organisational activities. Budgets improve resources allocation, because all requests are justified and
clarified. Budgets provide a tool for corrective action through reallocation.
Disadvantages:
The budgets cause problem when applied mechanically and rigidly. Budgets can demotivate employees if they are arbitrarily imposed on them i.e.
from top down, employees will not understand the reason for budgeted expenditures and will not committed to them.
Perception of unfairness can be cause by budgets. Competition of resources and politics can be caused by budgets. Rigid budget reduces initiatives and innovation at lower level as it difficult to
attain money for new ideas.
Conclusion:
University of Sunderland, Business School Page 15

Financial Management and Control Assignment PGBM01
It is generally accepted that effective budgeting is to establish goals which are difficult to achieve but attainable. Therefore budget can be a useful tool to control in attaining organisational goals for a skill manager who understands budget and how to set them.
PART D (c)
RELEVANCE OF COMMITTED FIXED COST WITHIN SHORT TERM DECISION LIKE DETERMINING OPTIMAL MIXES OF PRODUCTS:
In the decision of determining the optimal mix of product there is no relevance of
committed fixed cost because these cost are already committed and it has to be paid
regardless whether the firms produce one product or more than one product;
variable cost is relevant in such type of short term decision making because it is
directly proportional to the production of different products.
Committed fixed costs are those cost which the management of an organization has
a long-term responsibility to pay. Examples include rent on a long-term lease and
depreciation on an asset with an extended life etc. and this cost doesn’t change as
whether firms produces one or different kinds of products, this types of cost remains
constant.
A committed fixed cost has a long future planning horizon which is usually more than
one year. These types of costs include company’s investment in assets such as
facilities and equipment. Once these costs have been acquired, the company is
required to make future payments.
However on the other hand the fixed cost which has short future planning horizon
usually under a year is called discretionary fixed cost. These types of costs arise
from annual decisions of management to spend in specific fixed cost areas, such as
marketing and research.
University of Sunderland, Business School Page 16