financial modeling - an introduction to financial ...ghergu/summerschool/osullivan.pdf · financial...
TRANSCRIPT

Financial ModelingAn introduction to financial modelling and financial options
Conall O’Sullivan
Banking and FinanceUCD Smurfit School of Business
31 May / UCD Maths Summer School

Outline
IntroductionFinancial ModelingBasics of Financial ModelingDerivatives

Outline
IntroductionFinancial ModelingBasics of Financial ModelingDerivatives

A Quick Look at BubblesThe Tulip Crash Netherlands, 1634-1637
Tulips were brought from Turkey to the Netherlands in1593. After some time tulips contracted a nonfatal viruscalled mosaic, which did not kill the population but causedflames of colours. This made the flower unique.

A Quick Look at BubblesThe Tulip Crash Netherlands, 1634-1637
Tulips were brought from Turkey to the Netherlands in1593. After some time tulips contracted a nonfatal viruscalled mosaic, which did not kill the population but causedflames of colours. This made the flower unique.
Thus, tulips began to rise in price. Everyone began to dealin bulbs, essentially speculating on the tulip market.
The true bulb buyers filled up their inventories, soincreasing scarcity and demand.
Soon prices were rising so fast and high that people weretrading their land, life savings to get more tulip bulbs.
The originally overpriced tulips enjoyed a twenty-foldincrease in value - in one month.

The Tulip Crash Netherlands, 1634-1637
The prices were not an accurate reflection of the value of atulip bulb.

The Tulip Crash Netherlands, 1634-1637
The prices were not an accurate reflection of the value of atulip bulb.
This is called a speculative bubble, and typically somepeople decided to sell and crystallize their profits.

The Tulip Crash Netherlands, 1634-1637
The prices were not an accurate reflection of the value of atulip bulb.
This is called a speculative bubble, and typically somepeople decided to sell and crystallize their profits.
A domino effect of progressively lower prices took place,as everyone tried to sell while not many were buying.
Dealers refused to honour contracts and people began torealize that they traded their homes for some bulbs.
The government attempted to step in and halt the panicand the crash, but that did not work out well.
Even the people who locked in their profit early sufferedunder the following depression.

Outline
IntroductionFinancial ModelingBasics of Financial ModelingDerivatives

Interest RatesSafe Money
The simplest concept in finance is the time value of money. $1 today is worth more than $1 in a year’s time. There are several types of interest
There is simple and compound interest. Simple interest iswhen the interest you receive is based only on the amountyou initially invest, whereas compound interest is when youalso get interest on your interest.
Interest typically comes in two forms, discretelycompounded and continuously compounded.
Invest $1 in a bank at a discrete interest rate of r (assumedto be constant), paid once per year.
At the end of one year your bank account will contain1 × (1 + r).

Interest Rates
Now suppose you receive m interest payments at a rate ofrm per annum.
After one year you will have (1 + rm )m.
Suppose these interest payments come at increasinglyfrequent intervals, but at an increasingly smaller interestrate (we will take the limit m → ∞). This will give acontinuously paid rate of interest.
The expression above becomes
(1 +rm)m = em log(1+r/m)
→ er
That is how much money you will have in the bank afterone year if the interest is continuously compounded.
And similarly, after a time t you will have an amount ert .

Interest Rates Suppose M(t) in the bank at time t , how much does this
increase with time? If you check your account at time t and again a short
period later, time t + dt , the amount will have increased by
M(t + dt)− M(t) =dMdt
× dt + . . . (Taylor series expansion).
The interest you receive must be proportional to theamount you have, M, the interest rate r and the time-step,dt . Thus,
dMdt
dt = rM(t)dt ⇒dMdt
= rM(t).
If you have $M(0) initially, then the solution isM(t) = M(0)ert .
Conversely, if you know you will get $1 at time T in thefuture, its value at an earlier time t is simply e−r(T−t).

Financial InstrumentsEquities
A basic financial instrument often referred to as equity, stock orshares.
This is the ownership of a small piece of a company. The price is determined by the value of the company and
by the expectations of the performance of the company. These expectations are seen in the bid and ask behaviour
in the market. The expectations give an uncertainty to the future price
development of the stock. The exact profit is known only at the date of selling. The real value of the stock is sometimes a bit higher,
sometimes a bit lower than the expected value. The amount in which the stock price development can
differ from the expected value is determined by theso-called volatility.

Volatility
What does it mean? A statistical measure of the tendency of a market or
security price to rise or fall sharply within a period of time.Volatility is typically calculated by using variance of theprice or return. A highly volatile market means that priceshave huge swings in very short periods of time.
Security: An instrument representing ownership (stocks), adebt agreement (bonds), or the rights to ownership(derivatives).
Return: The gain or loss of a security in a particular period.The return consists of the income and the capital gainsrelative on an investment. It is usually quoted as apercentage.

Volatility
Figure: Volatility

Exchanges
Shares of larger companies are quoted on regulated stockexchanges, so that they can be bought and sold freely.
Figure: London Stock Exchange

Security Prices Prices have a large element of randomness. This does not
mean that we cannot model stock prices, but it does meanthat the modelling must be done in a probabilistic sense.
A well known and often used model for generating assetprices via a stochastic differential equation is referred to asgeometric Brownian motion.
Figure: FTSE 100 Stock Index Over Last 30 Years
Mar82 Sep87 Mar93 Sep98 Feb04 Aug09 Feb150
1000
2000
3000
4000
5000
6000
7000

FTSE 100 The graphs below depicts the FTSE over the course of a
single trading day (11/05/2004)!
Figure: FTSE 100 Stock Index
07:12:0008:24:0009:36:0010:48:0012:00:0013:12:0014:24:0015:36:0016:48:0018:00:004410
4415
4420
4425
4430
4435
4440
4445
4450
4455
4460

Modeling Asset Prices When investing, the main concern is that the return on the
investment is satisfactory. Suppose we have given asset St
, then
Return =Stock tomorrow - Stock today
Stock today=
St+δt − St
St
Lets see this in practise. Below is the returns of the FTSE100 over last 30 years.
Mar82 Sep87 Mar93 Sep98 Feb04 Aug09 Feb15−0.15
−0.1
−0.05
0
0.05
0.1
Figure: FTSE 100 Stock Index Returns

Modeling Asset Prices
From the data in this example we find that the mean is0.00028543 (0.0285%) and the standard deviation is0.0121 (1.21%).
−0.2 −0.15 −0.1 −0.05 0 0.05 0.1 0.150
200
400
600
800
1000
1200
1400
Figure: FTSE 100 Histogram

Randomness of the stock prices
Daily returns for assets look like noise! What can be then done? We can model the noise! Definition: Wiener Process:
A stochastic process Wt for t ∈ [0,∞) is called a WienerProcess (or Brownian motion) if the following conditionsare satisfied:
It starts at zero: W0 = 0, It has stationary, independent increments, For every t > 0, Wt has a normal distribution with mean 0
and variance t , It has a.s. continuous paths with NO JUMPS.

Weiner Processes
A sample of trajectories from a Weiner process
Mar82 Sep87 Mar93 Sep98 Feb04 Aug09 Feb15−0.5
0
0.5
1
1.5
2
2.5
3
3.5
Figure: FTSE 100: Simulations
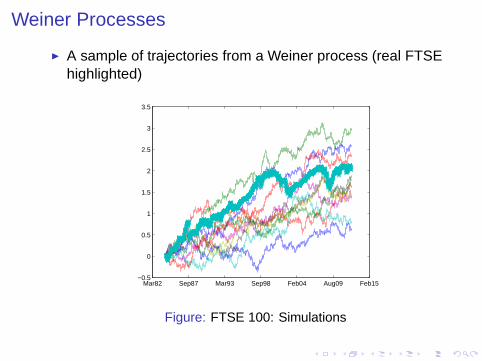
Weiner Processes
A sample of trajectories from a Weiner process (real FTSEhighlighted)
Mar82 Sep87 Mar93 Sep98 Feb04 Aug09 Feb15−0.5
0
0.5
1
1.5
2
2.5
3
3.5
Figure: FTSE 100: Simulations

Stochastic Processes
Suppose we observe the stock price of Company Y at everyfixed instance t from some initial time t0 till today tn and wedenote T = [t0, tn].
We can interpret the observed stock values as a realisationXt(ω) of the random variable Xt .
We need a model which takes into account almostcontinuous realisations of the stock prices.
Definition: Stochastic ProcessA stochastic process Xt is a collection of random variables
(Xt , t ∈ T ) = (Xt(ω), t ∈ T , ω ∈ Ω)

Stochastic Processes
We note that a stochastic process Xt is a function of twovariables:
for a fixed time t it’s a variable Xt = Xt(ω), ω ∈ Ω
for a fixed random outcome ω ∈ Ω, it’s a function of timeXt = Xt(ω), t ∈ T

Modeling Asset Prices
The most popular Stochastic Process for generating prices isthe Geometric Brownian Motion process (GBM):
dSt = µStdt + σStdWt ,
which can be translated to:
St+δt − St
St= µδt + σ(Wt+δt − Wt)
where µδt is the deterministic return σdWt is the random change with dWt a sample from a
normal distribution with mean 0 and variance δt .

Outline
IntroductionFinancial ModelingBasics of Financial ModelingDerivatives
Derivatives
It was only on 26th April 1973 that options were firstofficially traded on an exchange. It was then that TheChicago Board Options Exchange (CBOE) first createdstandardised, listed options.
Initially there were just calls on 16 stocks. Puts weren’tintroduced until 1977.
In the US options are traded on CBOE, the AmericanStock Exchange, the Pacific Stock Exchange and thePhiladelphia Stock Exchange.
Worldwide, there are over 50 exchanges on which optionsare traded.

Derivatives
OptionIs a contract written by a seller, that gives the right (but not theobligation) to the holder to trade the underlying asset in thefuture at a previously agreed price.
Option styles: European option- an option that may be only exercised on
expiration; American option - an option that may be exercised on any
trading day (also on the expiration); Barrier option - option which is exercised, for example, only
if security’s price reaches some trigger level during the lifeof the option.

Derivatives
Most popular options are Call and Put options: At a prescribedtime in the future, (maturity: T):
Call Option: The holder of the option may purchase aprescribed asset (shares, stocks : S) for a prescribedamount (strike: K ) and the writer of the contract must sellthe asset, if the holder decides to buy it.
Put Option: The holder of the option may sell a prescribedasset (shares, stocks : S) for a prescribed amount (strike:K) and the writer of the contract must buy the asset, if theholder decides to sell it.

Option Payoffs
The value of European call option at expiry T is given by:
C(T ,ST ) = max(ST − K ,0)
The value of European put option at expiry T is given by:
P(T ,ST ) = max(K − ST ,0)

Option Payoffs

Option Payoffs

Option Payoffs

Option Payoffs

Valuing Options
What determines the value of an option? what is the asset price today St? how long there is until expiry T − t? how volatile is the asset St?
General principles: The longer the time to expiry, the more time there is for the
asset to rise or fall; The more the asset is volatile the higher the chance that it
will rise or fall;

Valuing Options
For K = 100 which call option is more expensiveCA < CB,CA > CB,CA = CB? To find the answer we follow thereasoning of replicating an option.

Binomial Pricing Model
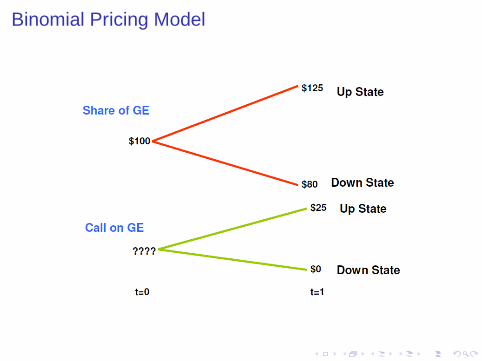
Consider the following example: The stock of GE today (t = 0) is $100. You analyse the firm and conclude that one year from now
(t = 1) the stock will sell for either $125 (a rise of 25%) or $80 (a drop of 20%). The risk free rate is 8% compounded continuously.
Binomial Pricing Model
Consider a call option on GE Let us say that the call’s exercise price is $100 and that the
expiration date is one year from now. One year from now, the call will have a value of either $25
(if GE sells at $125) or $0 (if GE sells at $80).
Binomial Pricing Model

Binomial Pricing Model
Three investments are of interest for us: Stock Option Risk-free bond
Payoffs and prices of different instruments
Replicating Portfolio
The Call Option on GE can be valued by finding a portfoliothat replicates the payoff of the Call in all states of nature.
The replicating portfolio will look as follows: A position in GE stock A position in a risk free bond
The replicating portfolio will generate the same cash flowsas a call and hence they must have the same value.
The portfolio’s cost will be the fair value of the option.

Replicating Portfolio
The two portfolios (Portfolio A: Holding a Call and PortfolioB: Stock and risk free bond) must have the same valueotherwise there will be an arbitrage opportunity.
This will happen if the investor could buy the cheaper ofthe two alternatives and sell the more expensive one.

Replicating Portfolio
Consider a portfolio with shares of GE and risk free bonds.What are the payoffs of such a portfolio?
In the Up State: $125Ns + $108.33Nb
In the Down State: $80Ns + $108.33Nb

Replicating Portfolio
Composition of the Replicating Portfolio: Consider aportfolio with Ns shares of GE and Nb risk-free bonds
In the Up State: $125Ns + $108.33Nb = $25 In the Down State: $80Ns + $108.33Nb = 0 Solving the two equations simultaneously
(125 − 80)Ns = 25 ⇒ Ns = 0.5556
Substituting in either equation yields
Nb = −0.4103

Replicating Portfolio
What is the meaning of the numbers we have just obtained? The investor can replicate the payoffs from the call by short
selling $41.03 of the risk-free bond and buying 0.5556 shares of GE stock. The payoffs will confirm this...

Replicating Portfolio

Replicating Portfolio
Cost of building the replicating portfolio? $55.56 must be spent to purchase .5556 shares of GE at
$100 per share $41.03 income is provided by the bonds (i.e. this money is
borrowed) Total cost is:
$55.56 − $41.03 = $14.53

Value of the Option
The main conclusion is the value of the option is given by
C = S0Ns + KNb
where S0 is the share price K is the value of the bond purchased (in this example
K = $100) and Ns and Nb are the number of units of the stock and the
bond purchased to replicate the option.

Value of the OptionIn reality option prices are valued using multiperiod binomialmodels or continuous time stochastic processes

Summary
The first main topic was the modeling of stock prices in aprobabilistic fashion.
The second main topic was derivatives pricing using thevery simple binomoial option pricing model.
Those interested should consider the MSc QuantitativeFinance at Smurfit Business School.
Email me [email protected] for more information.