financial modeling spreadsheets. lesson goals swbat maneuver around excel and enter data swbat use...
TRANSCRIPT

Financial ModelingSpreadsheets

Lesson Goals
• SWBAT maneuver around Excel and enter data• SWBAT use the SUM function• SWBAT use the basic algebra functions

Excel
• Excel is a spreadsheet program• A spreadsheet is a matrix of cells where some cells are inputs and other cells
use functions to provide outputs based on input cells• Horizontal vectors are known as rows and are numbered• Vertical vectors are known as columns and are lettered• You can maneuver around Excel entirely using the keyboard, primarily with the
left, right, up, and down arrow keys, along with the Ctrl, PgUp, and PgDn keys
• E.g. Try to go to the last cell in the bottom right corner of your spreadsheet using only the keys listed above
Inputs
• Entering inputs or values in Excel is quite simple – just use your keys to put a value in a cell and hit Enter• Inputs can be numbers or text, but generally we will deal with numbers
• Typically we color inputs that are numbers blue• Easiest way to do this is with a set of macros, a program that modifies Excel
shortcuts to perform a common task• Second easiest way is to modify the ribbon by hitting Alt+t+o• Third easiest way is to go to the format menu by hitting Alt+o+e

Outputs
• Anything that is not an input in Excel uses some function to come up with an output• When programming a function in Excel you must begin with the “=“
sign
• E.g. Try using the SUM function to sum up a column of cells. To select cells without using your mouse hold down the shift key. You can still use Ctrl to bounce to the end of a contiguous row or column

Basic Functions
• Sum – sums up a set• PEMDAS – works just like your calculator• Min – chooses the lowest value in a set• Max – chooses the highest value in a set• If – Outputs one value if a condition is true, and another if a condition is
false; can be nested• And – returns “TRUE” if all conditions are true, and “FALSE” otherwise
[NEXT TIME]• Or – returns “TRUE” if any conditions are true, and “FALSE” otherwise
[NEXT TIME]

Min / Max
• Using the same set of numbers as before, use the min function to determine the lowest value in the set and the max function to determine the highest value in the set

If
• Enter the numbers -10, -8, 4, -17, 12, and 19 in a contiguous column
• Write an if statement in the adjacent column’s cells that returns 1 if the adjacent cell is positive and 0 if the adjacent cell is negative• Write an if statement in another column that returns the cell if the
adjacent cell is positive and 0 if the adjacent cell is negative• Can you think of a real-life scenario where you might use either of
these functions?

HW
• Read pg. 4-12• Pg. 16 # 1-2

Financial ModelingFormatting I

Lesson Goals
• SWBAT format columns, rows, and cells• SWBAT print format

And / Or
• Write an if statement that returns “Huzzah!” if all of your previous column’s cells are positive, and “Gadzooks!” if they are not• Write an if statement that returns “Hoozah!” if any of your previous
column’s cells are positive, and “Flagellum!” if none of them are

Formatting columns and rows
• Column formatting: Alt+o+c+w• Row formatting: Alt+o+r+e (rarely)• Print formatting: Alt+p+s+p, Alt+v+p
• E.g. Try print formatting some of the work we did yesterday as a group
• Please print format and print out all your assessments going forward

HW
• Pg. 16 # 3-5

Financial ModelingFuture Value and Present Value

Lesson Goals
• SWBAT discount cash flows• SWBAT solve for the present value (NPV according to Excel,
incorrectly) of a stream of cash flows

FV and PV for a Cash Flow
• F=P(1+r)t
• In English, “If I put $P into this investment today, it will grow at a rate of r. After t years I will have F.”
• Therefore, P=F/(1+r)t
• In English, “If I know that I will get $F in t years, and I know that similar investments earn r in that time period, I would pay P for it today.”
• Math note: these functions are inverses of one another.

Modeling FV
• Hadley’s Hamburger Hut sells $150 of hamburgers in its first year in business (assume 2014). She projects that revenue will grow 10% per year in the future. Project in Excel, using all proper color formatting conventions, revenue for the next five years for HHH.

Modeling PV of a Single Year
• You are a financial analyst and you predict HHH will have cash flows (note, this is VERY different from sales!) of $25 per year for the next 5 years
(a) What does this mean HHH’s cash costs will be each year, based on your projections of revenue from last slide?
(b) Find the present value of each year’s cash flow assuming that comparable investments earn a 10% rate of return.

PV of a Stream of Cash Flows
• In Excel we can find the present value of a future stream of cash flows by using the inappropriately named “NPV” function• This is NOT what NPV is! The function should be called “PV” but PV does
something else already• We’ll define “real” NPV next time
• Use the NPV function to do the same thing you did using the single cash-flow PV formula.

HW
• Read pg. 14-16• Pg. 22 # 1-2

Financial ModelingIRR

Lesson Goals
• SWBAT calculate IRR for a payment and stream of cash flows• SWBAT relate IRR to the NPV of an investment

Net Present Value
• The net present value of an investment is the present value of all its cash flows, including the purchase of the investment• Recall that the NPV function in Excel ignores the purchase price
• For stocks, you know the stock price and how many shares are outstanding in the company, so therefore we know the market capitalization, or the purchase price of the company
• Market cap = Price / Share * # Shares
E.g. (non-public stock)• Chase is the owner of a public car dealership called Chase’s Chevys. Below are their projected cash flows for the
next 10 years, after which Chase thinks the business can be sold for 6x its cash flow at that point.• $150, $128, $167, $200, $250, $200, $36, $267, $283, $300
• Assume that you can buy Chase out of his business today for 6x year 1 cash flow, and comparable investments earn a 10% rate of return.
(a) Find the net present value of purchasing Chase’s Chevys.(b) Should you buy the business? Explain.(c) If the discount rate were 25%, should you buy the business? Explain.

IRR
• The internal rate of return is the rate of return for a given purchase price at which the NPV=$0• Simply put, the IRR tells you the “rate” you are earning when the
price is given

Problems with IRR
• Ignores size of investment – a $1 investment could look “as good” as a $100 bn investment• Assumes cash can be reinvested at the same rate of return• Still need to compare to cost of capital – how will I know whether 8%
is a “good” IRR?• Not usually a big deal but can happen: IRR can actually take on
multiple values if there are some negative future cash flows

Market Capitalization
• Find the share price of MSFT by going to http://finance.yahoo.com and getting MSFT’s share price• Find the number of shares of MSFT by going to http://www.sec.gov
More search options (top right corner) MSFT latest 10-Q (quarterly report) shares on front page of 10-Q• Multiply the two and compare it to the market cap on Yahoo! Finance
– are they the same?

HW
• Pg. 22 # 3-5

Financial ModelingBeta and Regression
Lesson Goals
• SWBAT perform a regression analysis• SWBAT calculate the beta of a stock

Regression Refresher
• A regression line is a best-fit line• It is created by minimizing the sum of the squares of the errors between the
line and the points (don’t need to know)
• Assume you had the points (1,1), (2,2), (3,3), and (4,4). What should the regression line be?• Assume you had the points (1,2), (2,3), (3,4), and (4,5). Now what
should the regression line be?• Test your hypothesis with the SLOPE function and the INTERCEPT
function

Beta
• The beta of a stock is its average % change in price per 1% change in the S&P 500 (the market)
• Beta=1 indicates the stock moves 1% when the market moves 1%• Beta<1 indicates the stock moves <1% when the market moves 1%• Beta>1 indicates that the stock moves >1% when the market moves 1%
• Generally speaking, higher beta stocks are riskier and lower beta stocks are less risky, but note this does not have to be true• Higher beta simply means a stock moves more with the market – e.g. gold stocks are
plenty risky but can have low beta

Calculating Beta
• Get the % changes in price of a stock from the last five years• Get the % changes in the market from the last five years on
corresponding dates• Find the slope of the regression line through the points

Using Beta
• Later we will discuss a model called the Capital Asset Pricing Model that will use beta to give us the appropriate discount rate, r, for future cash flows on stocks

HW
• Pg. 25 # 1-5

Financial ModelingThe Income Statement
Lesson Goals
• SWBAT enter data from a company’s income statement and format the statement for printing

The Income Statement
• The income statement of a company shows its accounting sales, costs, and earnings in a period (usually a quarter or a year)• The key values listed in each time period are called the line items of
the income statement• The I/S is meant to reflect the “economics” of a company and not its
actual cash flows in a given year• Downloadable at http://www.sec.gov or company web site, found in a
company’s 10-K (annual) and 10-Q (quarterly) reports

Formatting tips for the I/S
• Show all line items, but you must list at least the following:• Revenue (Sales)• - COGS• + D&A
• Often not explicitly on the I/S – need to go to cash flow statement and back this out of COGS• = Gross Profit• - SG&A• = EBITDA• - D&A (now subtract it!)• = EBIT or operating income• - Interest Expense (we’ll come back to this later)• = Pre-tax Income• - Taxes• = Net Income
• Obey all the color rules for inputs and outputs• Print format it onto one page!
HW
• Read pg. 24-25• Download three years of income statement data for any company on
the NYSE at www.sec.gov. Try to enter the income statement into Excel while obeying all the formatting conventions. Print format your work and print it out.

Financial ModelingIncome Statement Projections

Lesson Goals
• SWBAT project an income statement

Top-down vs. Bottom-up
• Top-down projections are projections based on a combination of growth rates and margins, which assume certain line items are a certain percentage of, usually, revenue• Bottom-up projections are projections based on explicit quantity and
price/unit or cost/unit values• Bottom-up modeling tends to be the ideal, but top-down modeling is
significantly easier

Top-down Modeling
• Create a drivers box, which includes Sales Growth, Gross Margin, EBITDA Margin, and D&A as a % of Sales• Based on historical data for each of these, drive your income
statement from yesterday for the next five years, making sure to note your rationale somewhere (alt i m)
Bottom-up Modeling
• Hadley’s Hamburger Hut International has capacity to sell 100 mm burgers per year going forward. She currently sells 75 mm burgers per year at $2.99 per burger. She has fixed labor and machinery costs of ~$100 mm per year and total costs excluding D&A of ~$240 mm per year. Project a simple income statement through the EBITDA line for HHHI for the next 5 years.

HW
• Read pg. 30-37• Pg. 37 # 1-4• Optional: Pg. 37 # 5 (though this will help some of you with your
assessment drivers)

Financial ModelingThe Balance Sheet

Lesson Goals
• SWBAT enter and project a balance sheet

The Balance Sheet
• A balance sheet comprises a company’s assets and liabilities, in order of decreasing liquidity, at the end of a financial statement period
• Key line items:• Assets
• Cash, which includes money on hand, in the bank, and often marketable securities (CA)• Accounts Receivable• Inventory, which is the value of items for sale stored on shelves (CA)• PP&E, or property, plant, and equipment, which are the durable physical assets needed to run a company (LTA)
• Liabilities• Accounts Payable, which are amounts owed to vendors (CL)• Debt, which comprises interest-bearing agreements to lenders (LTL)
• Equity• Equity is a “liability” to one’s owners – it is the amount “left over” after paying one’s payables and debts to vendors and
lenders, and is the “property” of your shareholders
• A=L+E!

Drivers
• Drivers of the major line items listed previously include:• DSO, or days sales outstanding, or A/R days• DSO=Accounts Receivable / Sales * 365, i.e. the average number of days of
sales in the form of credit over the course of a year
• DII, or days in inventory, or Inventory days• DII=Inventory / Sales* 365, i.e. the average number of days of inventory on
shelves over the course of the year
• DPO, or days payable outstanding, or A/P days• DPO=Accounts Payable / COGS * 365, i.e. the average number of days of
payables in the form of credit over the course of a year

“Open Items” on the B/S
• We will need the cash flow statement to properly model long-term assets, liabilities, and equity:• PP&E=Last year’s PP&E+Capex-Depreciation• Debt=Last year’s debt-paydowns+draws• Equity=Last year’s equity+NI-Dividends

HW
• Pg. 46 # 1-5
Financial ModelingProjecting the Balance Sheet

Lesson Goals
• SWBAT project the line items of a balance sheet

Projecting Line Items
• Use DSO, DII, and DPO to project your balance sheet
• Eventually, we will project the other line items, and we can start the calculations for now:• Cash=Ending Cash from Cash Flow Statement• PP&E=Last year’s PP&E+Capex-Depreciation• Debt=Last year’s Debt-Paydowns+Draws• Equity=Last year’s Equity+NI-Dividends

How the B/S affects the CF Statement• As current assets OTHER THAN CASH rise, how does this affect your
cash balance?• As current liabilities rise, how does this affect your cash balance?

How one line-item can affect all three statements• Frequently we ask how one line item changing will affect all three
statements, e.g. depreciation• Imagine depreciation increases by $100• On the income statement (don’t forget taxes!): Net income goes…
• On the balance sheet: Cash goes…, PP&E goes…, Equity goes…
• On the cash flow statement: Cash from Operations goes…

HW
• Finish projecting your company’s balance sheet

Financial ModelingThe Cash Flow Statement

Lesson Goals
• SWBAT enter and project operating and investing cash flows

Statement of Cash Flows
• Three parts:• OCF=NI+D&A-Change in WC• ICF=-Capex+Asset Sales• FCF=-Paydowns+Draws-Dividends

HW
• Read pg. 48-53• Pg. 54 #1-2

Financial ModelingBack to the BS and Debt Paydown

Lesson Goals
• SWBAT project the “rest” of the BS and the IS• SWBAT project debt paydowns and draws

Financing Cash Flows
• FCF=(-Paydowns+Draws)-Dividends• Project dividends, or payments of cash to shareholders, using the
payout ratio, which is the company’s usual dividend / net income• Alternatively, use the investor relations page and see what the company says
it is planning!• For some companies (ahem, Apple), you need to read rumors and see if any
big shareholders are pushing for a (special) dividend• If this isn’t enough, some companies are required BY LAW to have a certain
payout ratio (REITs)
• Paydowns of debt and draws on revolving credit lines are more complicated (next few slides)
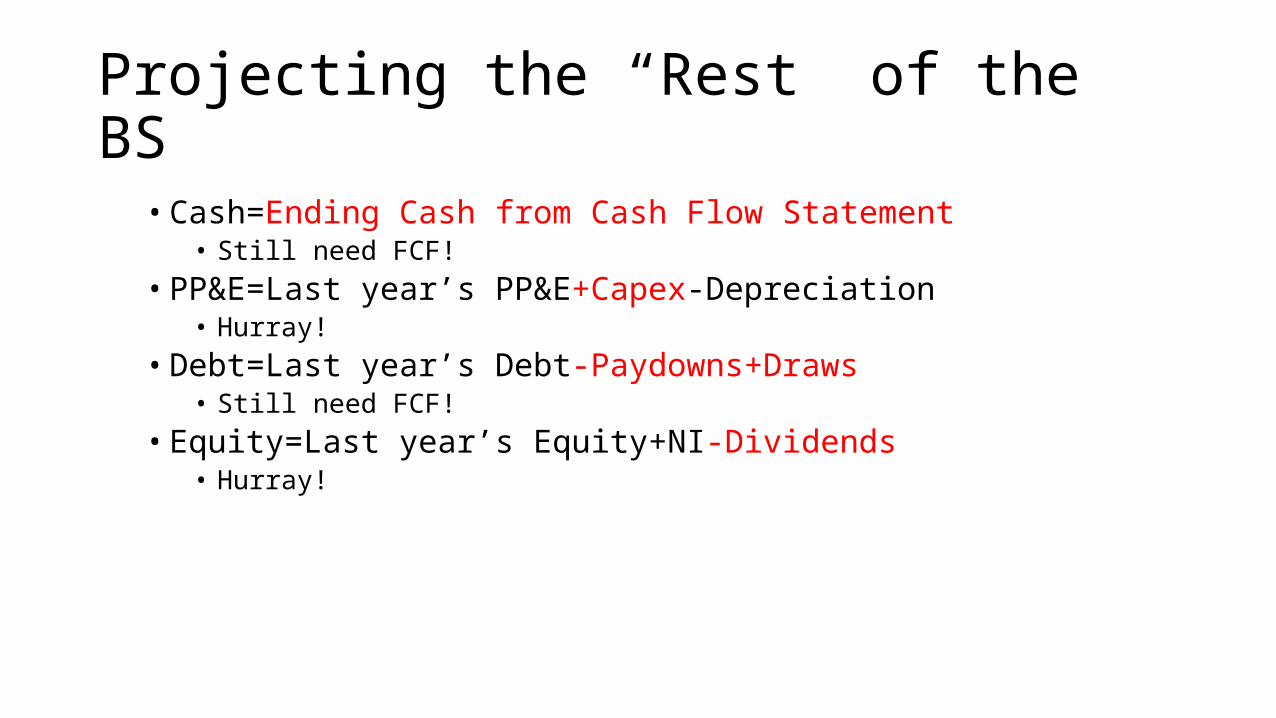
Projecting the “Rest” of the BS
• Cash=Ending Cash from Cash Flow Statement• Still need FCF!
• PP&E=Last year’s PP&E+Capex-Depreciation• Hurray!
• Debt=Last year’s Debt-Paydowns+Draws• Still need FCF!
• Equity=Last year’s Equity+NI-Dividends• Hurray!

Projecting the “Rest” of the IS
• Interest expense=Debt at beginning of period * Interest Rate
• May have multiple tranches, or issues, of debt with different rates, but can simplify for now by looking at the combined interest paid / total debt in past periods
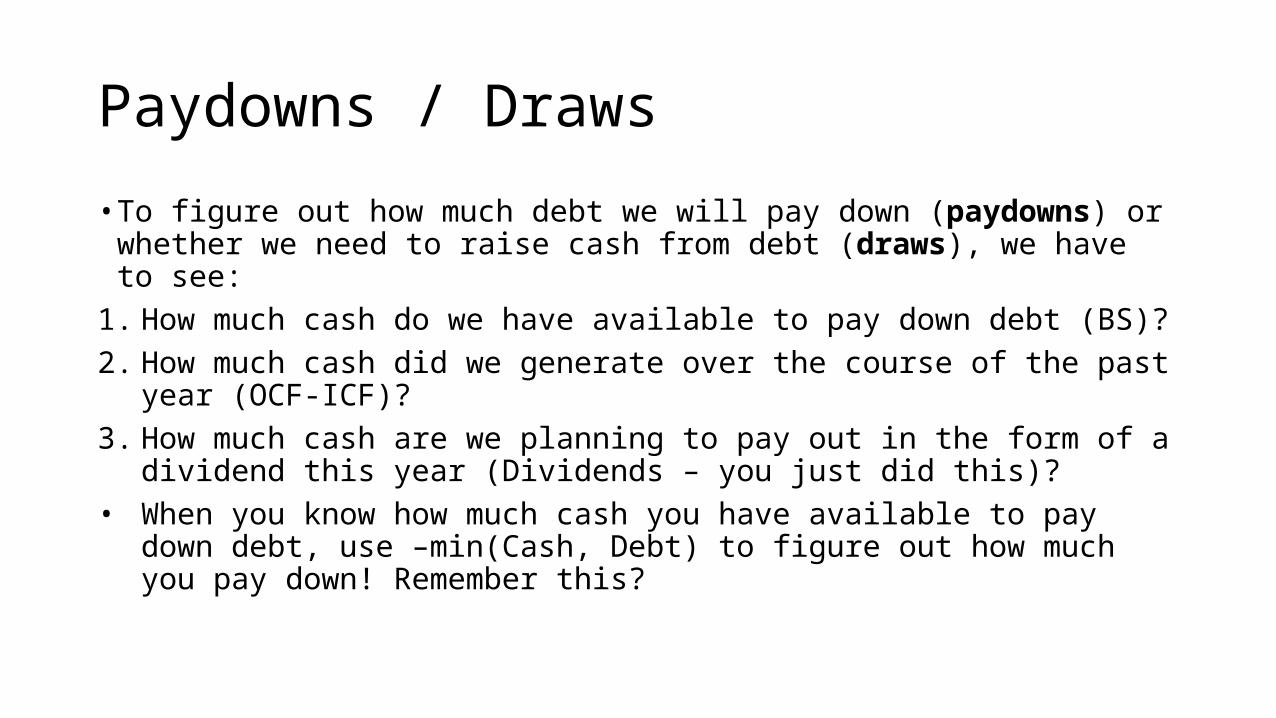
Paydowns / Draws
• To figure out how much debt we will pay down (paydowns) or whether we need to raise cash from debt (draws), we have to see:
1. How much cash do we have available to pay down debt (BS)?2. How much cash did we generate over the course of the past year
(OCF-ICF)?3. How much cash are we planning to pay out in the form of a
dividend this year (Dividends – you just did this)?• When you know how much cash you have available to pay down
debt, use –min(Cash, Debt) to figure out how much you pay down! Remember this?

HW
• Pg. 53 #3-4

Financial ModelingLinking the Three Statements

Lesson Goals
• SWBAT link the three-statement operating model together
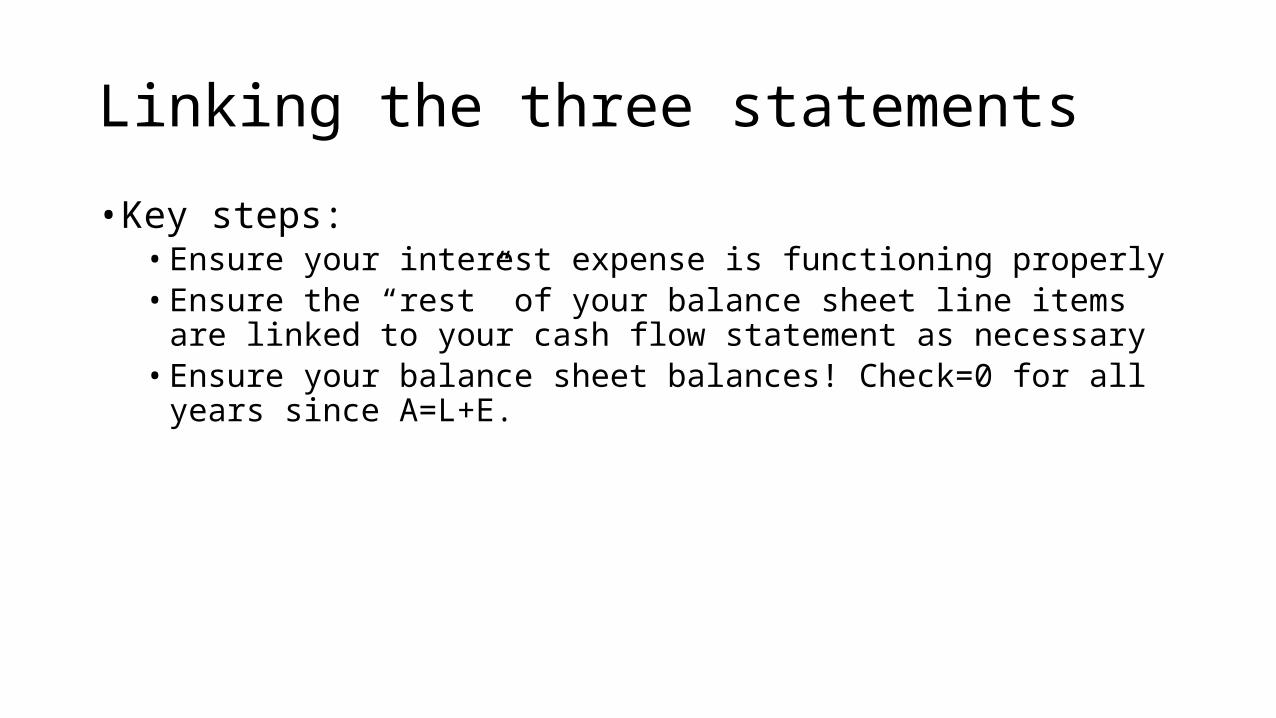
Linking the three statements
• Key steps:• Ensure your interest expense is functioning properly• Ensure the “rest” of your balance sheet line items are linked to your cash flow
statement as necessary• Ensure your balance sheet balances! Check=0 for all years since A=L+E.
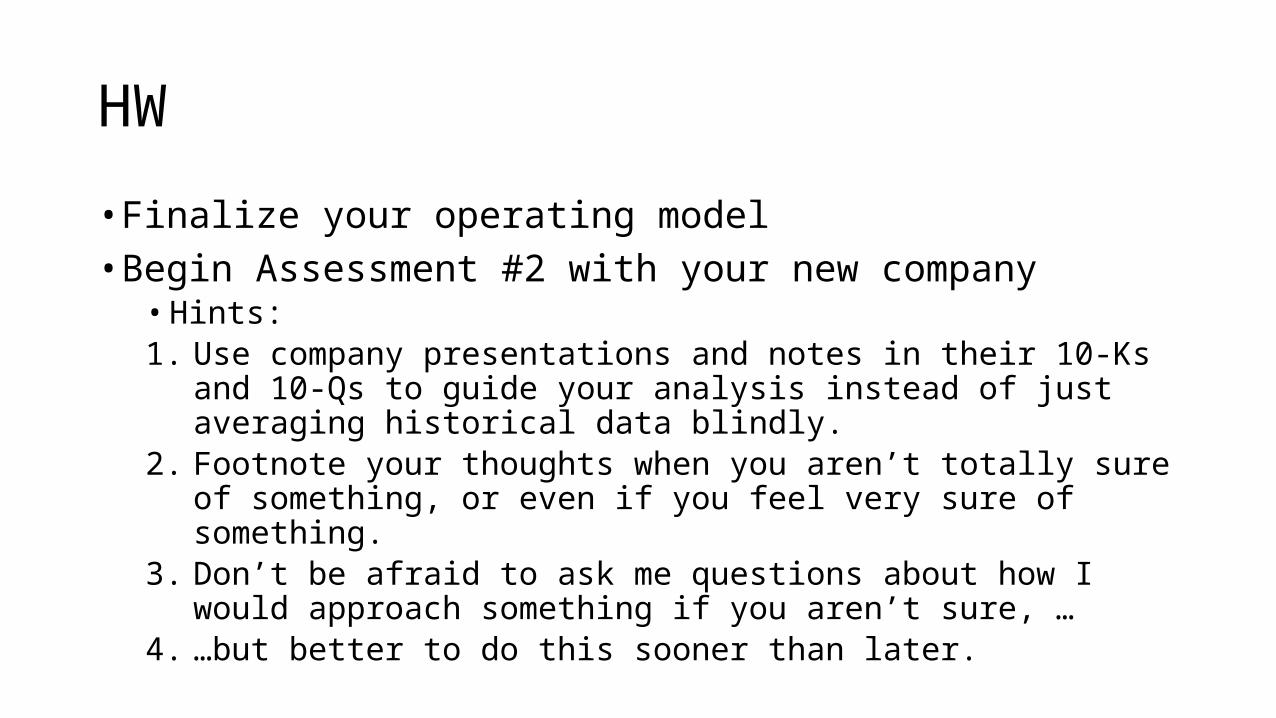
HW
• Finalize your operating model• Begin Assessment #2 with your new company• Hints: 1. Use company presentations and notes in their 10-Ks and 10-Qs to guide
your analysis instead of just averaging historical data blindly. 2. Footnote your thoughts when you aren’t totally sure of something, or even
if you feel very sure of something. 3. Don’t be afraid to ask me questions about how I would approach something
if you aren’t sure, …4. …but better to do this sooner than later.

Financial ModelingThe Capital Asset Pricing Model

Lesson Goals
• SWBAT determine an appropriate discount rate

We have projections…now what?
• A company’s value is the net present value of its future cash flows• Need two things:1. Projections of cash flows
1. To shareholders OR2. To all stakeholders
2. A discount rate, r, to determine the present value of the future cash flows

Determining r
• The discount rate can be determined by a model called the Capital Asset Pricing Model, or CAPM
• The major idea behind this model is that the return on a stock should be based on its beta relative to the market’s risk premium• The risk premium is the expected return on the market, i.e. the S&P 500,
minus the risk-free rate; it varies, but I think of 2-6% as the historical range

Equity Risk Premium History

Calculating ri
• Find the beta for the company you projected for your latest assessment and calculate a reasonable range of ri you would use to discount its future cash flows

HW
• Pg. 60 # 1-5

Financial ModelingThe Discounted Cash Flow Model: Discounting Projected CFs

Lesson Goals
• SWBAT calculate the net present value of their (5 years of) projected cash flows

Cash Flow
• The levered free cash flow of a company is the money to shareholders in each period (say, one year)• For valuation purposes, we define this to be the value created for
shareholders; in other words, the cash doesn’t actually have to be dividended to be LFCF• LFCF=NI+D&A-Change in WC-Capex+Asset Sales• Sometimes, LFCF=NI+D&A-Capex• In the long run, LFCF=NI! (more on this later)

Discounting LFCF
• Once you have an appropriate discount rate for a stock, you can use it to discount your projected LFCF• Note this only gives you part of the value of the stock, since you are
only projecting the first 5 years of LFCF, and the stock is assumed to live on infinitely• To value the rest of the stock, we will need to come up with a value
for beyond 5 years, known as a terminal value (next time)

HW
• Read pg. 60-61• Project five years of LFCF for your company, and use an appropriate
range of r to discount its projected LFCF and come up with a range of values

Financial ModelingThe Discounted Cash Flow Model: The Terminal Value

Lesson Goals
• SWBAT solve for the value of the terminal value

Terminal Value
• While we have projected five years of cash flows, we assume, usually, that a company is infinite-lived• Mathematically we can show that the terminal value of a company
has a present value of:

Valuing a Stock and Solving for a Target Price• Similar to when you had a range of discount rates for the projected
cash flows, we want to have the same range of discount rates, as well as a range of long-term growth rates• What range of LT growth rates might be appropriate? (May vary by company,
but usually…)
• Adding these two matrices together gives us a target market capitalization• Dividing by the number of shares in the company gives us a target
price

Issues with Terminal Value
• Assumes company is mature by five years (or whenever projections stop)• Assumes interest expense does not fluctuate much in the future, and
that capital structure, the mix of debt and equity in the company, remains stable

HW
• Pg. 66 #1-3

Financial ModelingUnlevered FCF and WACC (2-3 days)
Lesson Goals
• SWBAT project unlevered free cash flows• SWBAT calculate WACC
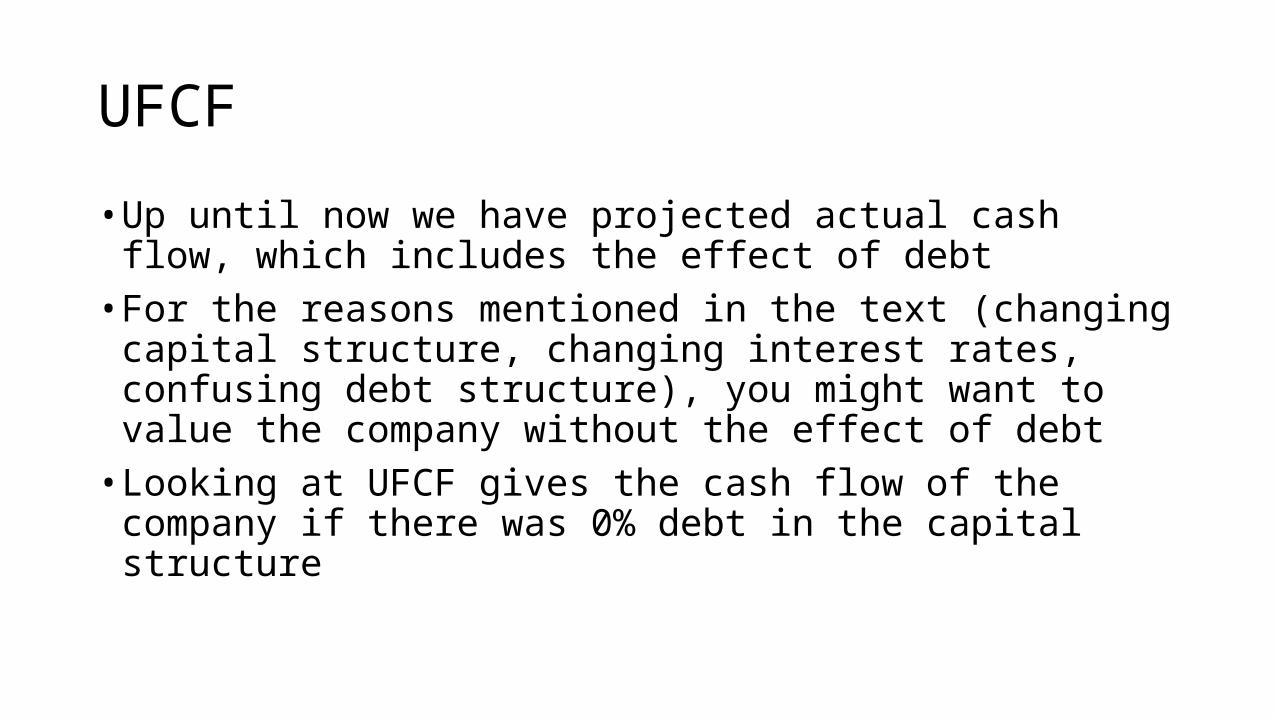
UFCF
• Up until now we have projected actual cash flow, which includes the effect of debt• For the reasons mentioned in the text (changing capital structure,
changing interest rates, confusing debt structure), you might want to value the company without the effect of debt• Looking at UFCF gives the cash flow of the company if there was 0%
debt in the capital structure

Calculating UFCF
• UFCF=EBIT(1-Tax Rate)+D&A-Change in WC-Capex+Asset Sales• Long-run UFCF=Terminal Value=EBIT(1-Tax Rate)

Discounting UFCF
• Since we are no longer looking at cash flows to the equity but to the whole company, we can no longer just discount cash flows by return on equity• Need a weighted average of return on equity and return on debt
(interest rate)
Valuation
• Using WACC to discount UFCFs with the same capital structure as in LFCF ought to give identical valuation (why?)• Compare UFCF to LFCF valuations and make sure they’re close!

HW
• Pg. 71 # 1-4

Financial ModelingIntroduction to Public Comparables
Lesson Goals
• SWBAT calculate P/E for a company

Public Comparables
• Public comparables or public comps are companies that are alike, usually in the following ways:• Industry• Business purpose• Geography• Sales growth rate• Margins• Perceived or actual product quality

Valuation with Public Comps
• In theory, if two firms are identical in every way, we ought to pay the same multiple of price per unit of earnings for each firm• Caveats:• No two firms are exactly alike price multiple• Different leverage earnings• One-time items earnings• Different tax situations/jurisdictions earnings• Non-core earnings earnings

Spreading comps
• Lay out in columns:• Net debt
• Will use this later and good reference for leverage differences between firms• Market cap
• Price * shares• EV• Net Income
• Price / share * shares• EBITDA
• Will use later• P/E• EV/EBITDA (later)

HW
• Pg. 80 #1

Financial ModelingP/E Valuation
Lesson Goals
• SWBAT value a company based on P/E ratios of comparables

P/E Valuation
• Once you have established an average P/E ratio, can use your company’s normalized earnings to establish a target price/share• Need normalized earnings, with no one-time or unusual items! Will
do an example of this next time• Calculate a price target for your company based on your comps• Would you buy or sell based on this target?

Assumptions in P/E Valuation
• Growth is the same• If g is higher, P/E should be higher
• Quality of earnings is the same• If margins are higher, P/E should be higher• If leverage is higher, P/E should be higher
• Business risk is the same• If business is riskier, P/E should be lower

Normalizing Earnings to Apply a P/E Multiple1. [Eliminate all one-time and unusual items – NEXT TIME]2. Project earnings in a steady state year (sometime in the future,
usually 1-5 years), just as you have always done3. Apply P/E multiple to future earnings
4. Discount share price back to present using ri (7-13%ish usually works too)

HW
• Pg. 80 #2
Financial ModelingNormalizing Earnings for Unusual Items

Lesson Goals
• SWBAT normalize earnings for one-time and unusual items

Common Types of One-Time and Unusual Items• Unusual increases in the price of a good (especially natural resources)
unusually high revenues• Unusual increases in cost of goods sold (especially natural resources)
unusually high COGS• Temporary variations from the typical industry cost structure
• SG&A as % of sales very high (probably shrinks over time?)• Consider including EBITDA Margin (or some other margin) in comps
• Any jumps in the interest expense or interest income lines• Example from UTX Q1 2014 earnings presentation (appendix has adjusted
earnings vs. those found on 10-Q): http://www.utc.com/StaticFiles/UTC/StaticFiles/2014-04-22_earnings.pdf

Normalizing Earnings
• Normalize earnings for your company for one-time and unusual items (finish tonight)

HW
• Pg. 80 #3

Financial ModelingP/E with Forward Earnings

Lesson Goals
• SWBAT solve for FY1-3 P/E and use these ratios to value a company

Forward Year 1 and Forward Year 2
• We discussed the possibility of applying a current-year P/E multiple to future earnings for a company, and then discounting value back to present day• Alternatively, you can find FY1 and FY2 earnings for your comps, and
then apply these multiples to the relevant projected year for your company• Example from UTX Q1 2014 earnings presentation, found on its IR
page: http://www.utc.com/StaticFiles/UTC/StaticFiles/2014-04-22_earnings.pdf

Using FY1 and FY2
• Find FY1 and FY2 for your comps• Use either management presentations or make your own projections based
on previous sales growth
• Finish tonight

HW
• Pg. 80 #4

Financial ModelingEnterprise Value to EBITDA
Lesson Goals
• SWBAT construct a comp set using the EV/EBITDA ratio

EV/EBITDA
• From an equity investor’s standpoint, the EV/EBITDA ratio adjusts for three major issues with P/E ratio:
1. Companies make different capitalization decisions, and we want to view a company in a leverage-neutral way
2. Ignores non-cash D&A3. Ignores potential other non-core earnings below the EBIT line (like
interest income for a non-financial, extinguishment of debt, and “Other” lines)
Other benefits
1. Ignores temporary tax differences between companies (T in EBITDA)2. Debt investors can use EV/EBITDA too because EBITDA is a proxy for
cash flow prior to any interest being paid

EV / (EBITDA-Capex)
• An alternative to just using EBITDA, includes necessary cash outflow for maintenance capex (should try to not include growth capex if possible)
Normalization and Forward Years
• Works analogously to P/E, except don’t need to worry about any of the line items that fall below EBITDA• Additional worry if using EBITDA-Capex, because should really focus
on maintenance Capex for a business (often 2-5% of sales, but critically depends on industry)

HW
• Pg. 84 #1-2

Financial ModelingSegment Valuation

Lesson Goals
• SWBAT value a company by segment using a hybrid multiple model
Segment Valuation
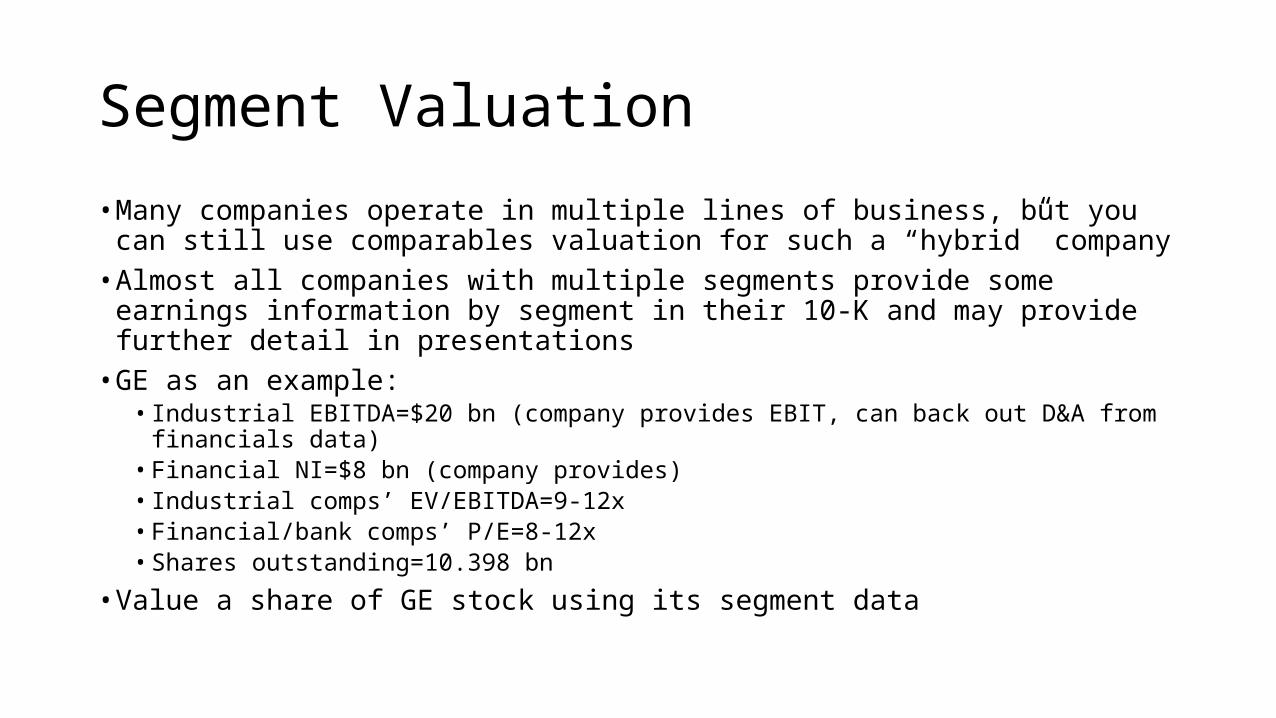
• Many companies operate in multiple lines of business, but you can still use comparables valuation for such a “hybrid” company• Almost all companies with multiple segments provide some earnings information
by segment in their 10-K and may provide further detail in presentations• GE as an example:
• Industrial EBITDA=$20 bn (company provides EBIT, can back out D&A from financials data)• Financial NI=$8 bn (company provides)• Industrial comps’ EV/EBITDA=9-12x• Financial/bank comps’ P/E=8-12x• Shares outstanding=10.398 bn
• Value a share of GE stock using its segment data

What if data isn’t all there?
• GUESS!• If you have sales by segment, can use a % of sales approach to guess
at EBITDA and net income by segment• Use EV/EBITDA for most companies, but P/E always for financials• P/E is also probably preferable for companies with no debt, like most
tech and retail companies

HW
• Pg. 84 #3 (if not finished in class)• Complete projects for Monday

Financial ModelingAcquisition Comparables

Lesson Goals
• SWBAT create acquisition comparables and use them to value a company

Acquisition Comps
• Analogous to public comps, except looking for 100% (or major stake) purchases made in the last 3-5 years within industry• Find deals using a search engine or a database• May be difficult to get all details to generate P/E, but EV/EBITDA is
more likely• Proceed with analysis same as you did with public comps• Get at least 5 deals for analysis, just as you got 5 public comps

Case Study: Food Retail Industry
• http://www.streetinsider.com/Hot+M+and+A/Cerberus+to+Acquire+Safeway+%28SWY%29+for+%2440Share/9256503.html• Given: Price/Share• Since SWY public as of announcement, can determine implied P/E and
EV/EBITDA

HW
• Pg. 86 # 1-3

Financial ModelingIntroduction to Options
Lesson Goals
• SWBAT define a derivative and an option• SWBAT determine the intrinsic value of a call option and a put option

Derivatives and Options
• A derivative is a financial asset whose value derives from the value of some underlying asset• The notional amount, or the total value of underlying assets represented
by derivatives contracts, of all outstanding contracts globally as of the end of 2014 was $630 trillion• These contracts had market value, or value at which you could actually
sell these agreements, of $21 trillion• These are really big numbers! The market value of all derivatives is
~1.25x the gross domestic product of the United States and is greater than the U.S. debt. The notional amount of all derivatives would take 37 years of U.S. income to purchase, or 8 years of income GLOBALLY
(American) Options
• There are two main kinds of options related to equity, call options and put options• A call option gives the holder of the option the right to purchase the
stock at a set price known as the strike price up to a certain expiration date• A put option gives the holder of the option the right to sell the stock
at the strike price up to a certain expiration date• Many people refer to put options as “insurance” – why?

Intrinsic Value
• A call option has intrinsic value when its strike price is less than the trading price of the stock• A put option has intrinsic value when its strike price is greater than
the trading price of the stock• E.g. You purchase one GOOG May 15, 2015 $500 call (http://
finance.yahoo.com/q?s=GOOG150515C00500000). Based on today’s trading price of $538.92, the call option has intrinsic value of $38.92.
Option Value
• However there is a chance the stock moves higher before the expiration date. So options will always trade above their intrinsic value up until the expiration date. This remaining value is known as option value, and you need some statistics and calculus to build a Black-Scholes model and find this value.

HW
• Pick a stock and one of its calls and one of its puts. Find the intrinsic value and the implied option value of the call and the put based on where the option is trading today.

Financial ModelingPayoff Graphs

Lesson Goals
• SWBAT construct payoff graphs for calls and puts

Payoff Graphs

Put-Call Parity
• Figure out a way to replicate the purchase of a stock using only calls and puts• You should conclude that C-P=S-K, roughly, though since you don’t put
up the value of K today (the notional amount) to buy the option, you should discount that back from the expiration date• Therefore if you know either the value of a call option at a certain
strike, you know the value of its corresponding put option, and vice versa

Put-Call Parity Example
• As of 5/9/15:• http://finance.yahoo.com/q/op?s=VALE+Options• VALE spot price=$7.63• $7.00 VALE 5/15 call=$0.735 (bid-ask is $0.73-$0.74)• By put-call parity, C-P=S-D(K), so:• $0.74-P=$7.63-$7.00 it’s only a few trading days until it expires, so forget
discounting!• Therefore, P=$0.11, according to put-call parity.• Actual market price of $7.00 VALE 5/15 put=$0.125 (bid-ask is $0.11-$0.14)• It works!
HW
• Test out put-call parity on a pair of options. Did it work?