financial partners capital management, llc fpcm
TRANSCRIPT
Financial Partners Capital Management, LLC
FPCM
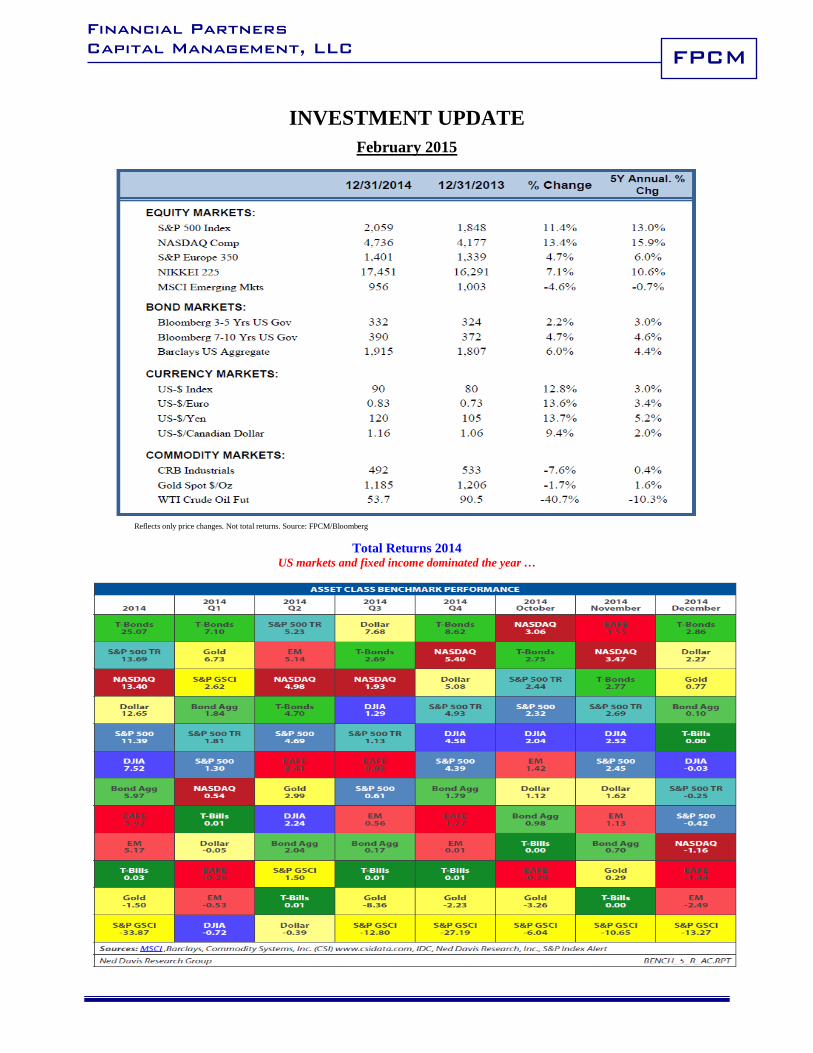
INVESTMENT UPDATE February 2015
Reflects only price changes. Not total returns. Source: FPCM/Bloomberg
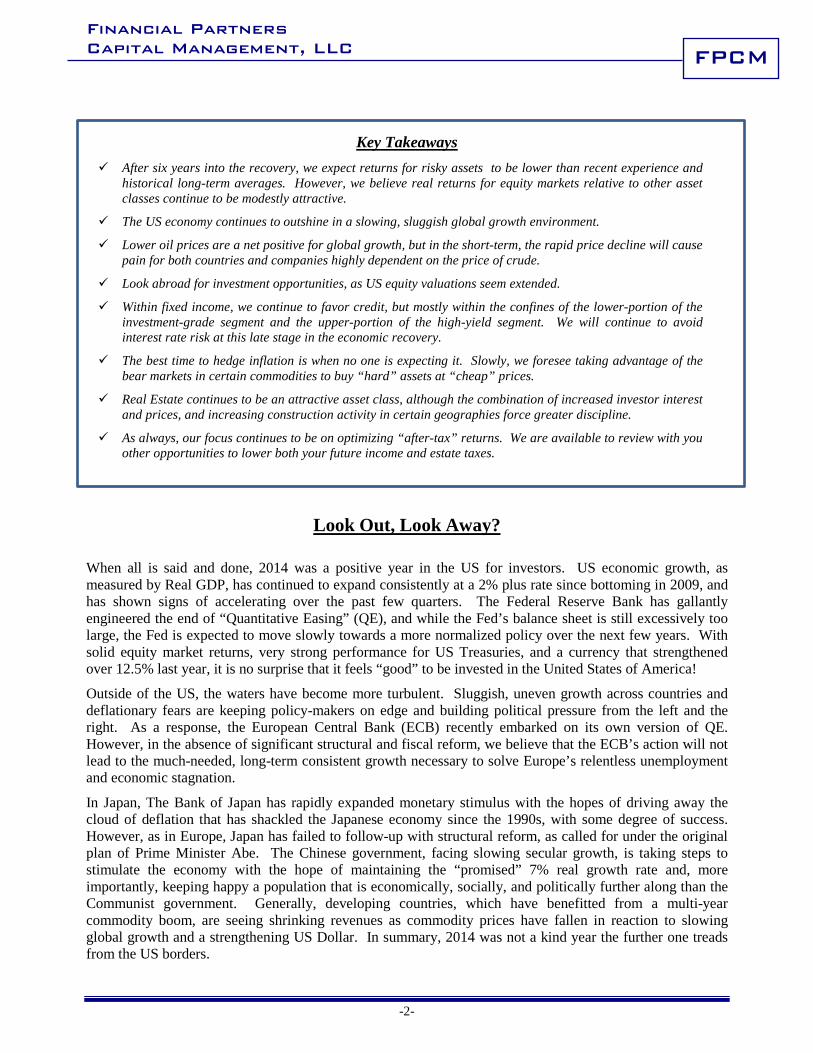
Total Returns 2014 US markets and fixed income dominated the year …
Financial Partners Capital Management, LLC
-2-
FPCM
Key Takeaways After six years into the recovery, we expect returns for risky assets to be lower than recent experience and
historical long-term averages. However, we believe real returns for equity markets relative to other asset classes continue to be modestly attractive.
The US economy continues to outshine in a slowing, sluggish global growth environment.
Lower oil prices are a net positive for global growth, but in the short-term, the rapid price decline will cause pain for both countries and companies highly dependent on the price of crude.
Look abroad for investment opportunities, as US equity valuations seem extended.
Within fixed income, we continue to favor credit, but mostly within the confines of the lower-portion of the investment-grade segment and the upper-portion of the high-yield segment. We will continue to avoid interest rate risk at this late stage in the economic recovery.
The best time to hedge inflation is when no one is expecting it. Slowly, we foresee taking advantage of the bear markets in certain commodities to buy “hard” assets at “cheap” prices.
Real Estate continues to be an attractive asset class, although the combination of increased investor interest and prices, and increasing construction activity in certain geographies force greater discipline.
As always, our focus continues to be on optimizing “after-tax” returns. We are available to review with you other opportunities to lower both your future income and estate taxes.
Look Out, Look Away?
When all is said and done, 2014 was a positive year in the US for investors. US economic growth, as measured by Real GDP, has continued to expand consistently at a 2% plus rate since bottoming in 2009, and has shown signs of accelerating over the past few quarters. The Federal Reserve Bank has gallantly engineered the end of “Quantitative Easing” (QE), and while the Fed’s balance sheet is still excessively too large, the Fed is expected to move slowly towards a more normalized policy over the next few years. With solid equity market returns, very strong performance for US Treasuries, and a currency that strengthened over 12.5% last year, it is no surprise that it feels “good” to be invested in the United States of America!
Outside of the US, the waters have become more turbulent. Sluggish, uneven growth across countries and deflationary fears are keeping policy-makers on edge and building political pressure from the left and the right. As a response, the European Central Bank (ECB) recently embarked on its own version of QE. However, in the absence of significant structural and fiscal reform, we believe that the ECB’s action will not lead to the much-needed, long-term consistent growth necessary to solve Europe’s relentless unemployment and economic stagnation.
In Japan, The Bank of Japan has rapidly expanded monetary stimulus with the hopes of driving away the cloud of deflation that has shackled the Japanese economy since the 1990s, with some degree of success. However, as in Europe, Japan has failed to follow-up with structural reform, as called for under the original plan of Prime Minister Abe. The Chinese government, facing slowing secular growth, is taking steps to stimulate the economy with the hope of maintaining the “promised” 7% real growth rate and, more importantly, keeping happy a population that is economically, socially, and politically further along than the Communist government. Generally, developing countries, which have benefitted from a multi-year commodity boom, are seeing shrinking revenues as commodity prices have fallen in reaction to slowing global growth and a strengthening US Dollar. In summary, 2014 was not a kind year the further one treads from the US borders.
Financial Partners Capital Management, LLC
-3-
FPCM
Investing is like driving. The last thing you want to do is drive through the rear-view mirror! Looking into the future, the allocation of your investment capital across the available investment opportunities is what will drive future returns and wealth creation. While the US economy is expected to expand at a low-single digit rate, S&P earnings growth should be tepid (mid-single digit), and the prospect of significant price/earnings multiple expansion, while possible, is not highly probable. US fixed income will continue to be anchored by abnormally low short-term rates, relative yield advantage versus other sovereign bonds, continued demand from captive investors (such as insurance companies, financial institutions and pension plans), and low levels of new bond issuance. In an environment where most of the “easy” money has been made in the US, it makes sense to think about seeking value outside of the US.
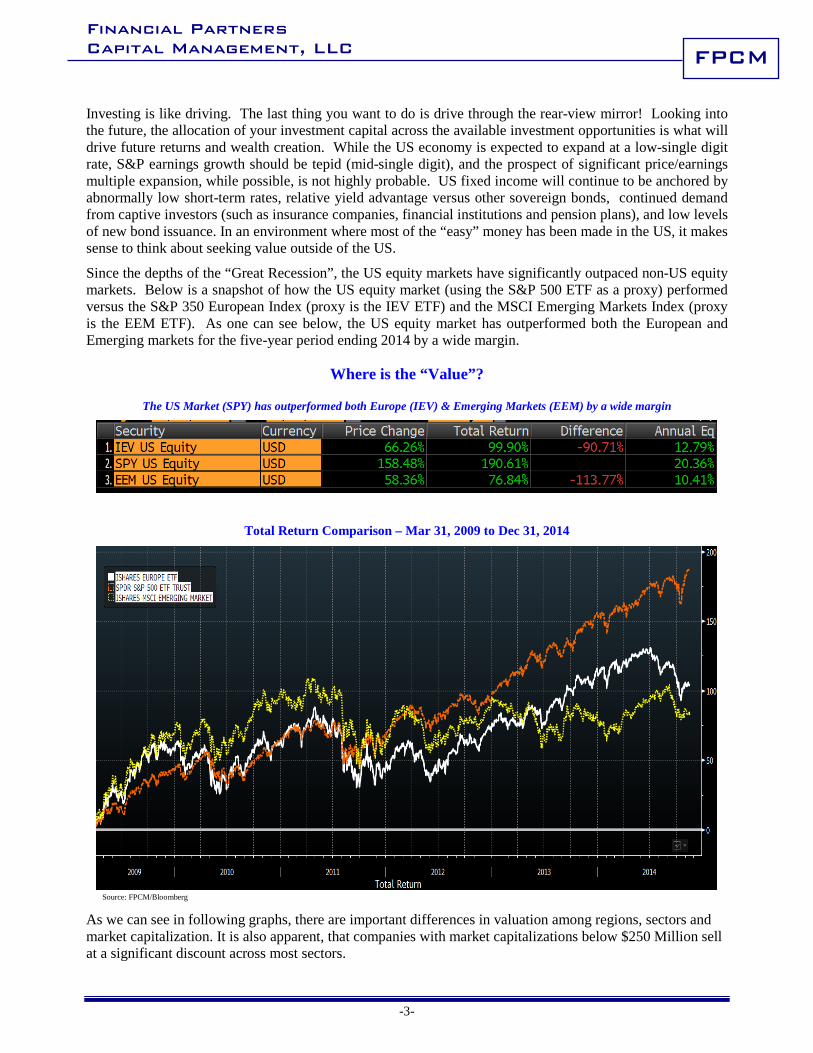
Since the depths of the “Great Recession”, the US equity markets have significantly outpaced non-US equity markets. Below is a snapshot of how the US equity market (using the S&P 500 ETF as a proxy) performed versus the S&P 350 European Index (proxy is the IEV ETF) and the MSCI Emerging Markets Index (proxy is the EEM ETF). As one can see below, the US equity market has outperformed both the European and Emerging markets for the five-year period ending 2014 by a wide margin.
Where is the “Value”?
The US Market (SPY) has outperformed both Europe (IEV) & Emerging Markets (EEM) by a wide margin
Total Return Comparison – Mar 31, 2009 to Dec 31, 2014
Source: FPCM/Bloomberg
As we can see in following graphs, there are important differences in valuation among regions, sectors and market capitalization. It is also apparent, that companies with market capitalizations below $250 Million sell at a significant discount across most sectors.
Financial Partners Capital Management, LLC
-4-
FPCM
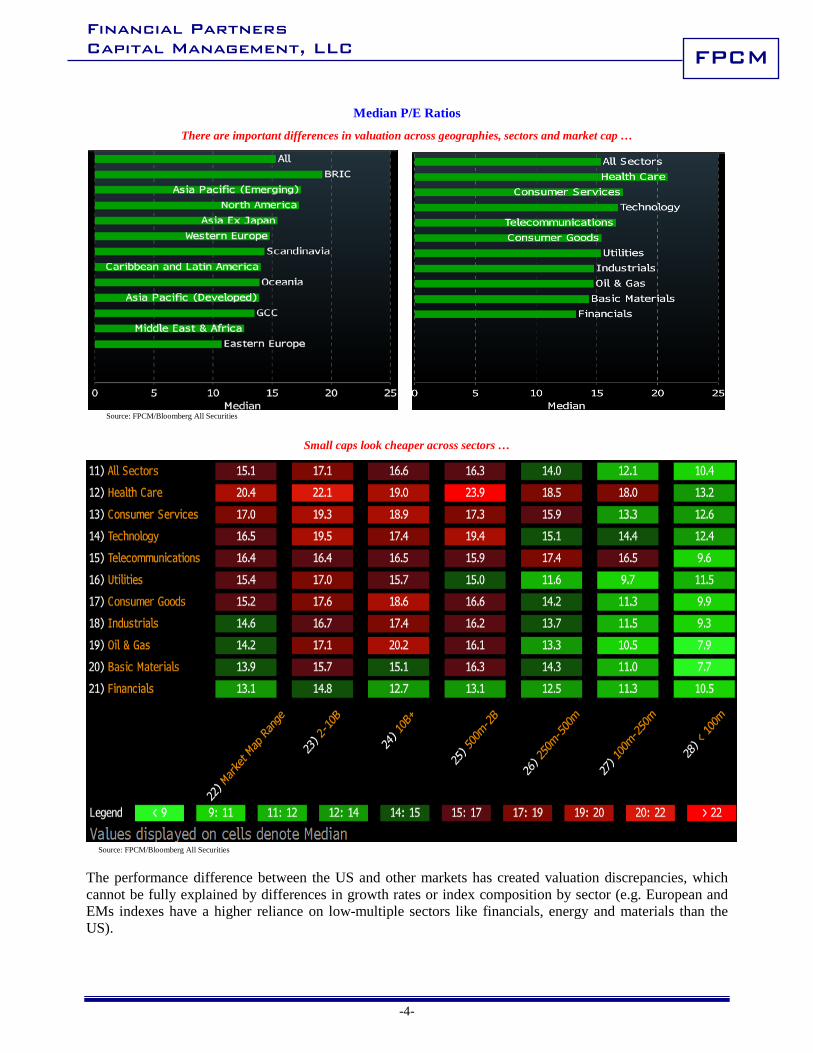
Median P/E Ratios
There are important differences in valuation across geographies, sectors and market cap …
Source: FPCM/Bloomberg All Securities
Small caps look cheaper across sectors …
Source: FPCM/Bloomberg All Securities
The performance difference between the US and other markets has created valuation discrepancies, which cannot be fully explained by differences in growth rates or index composition by sector (e.g. European and EMs indexes have a higher reliance on low-multiple sectors like financials, energy and materials than the US).
Financial Partners Capital Management, LLC
-5-
FPCM
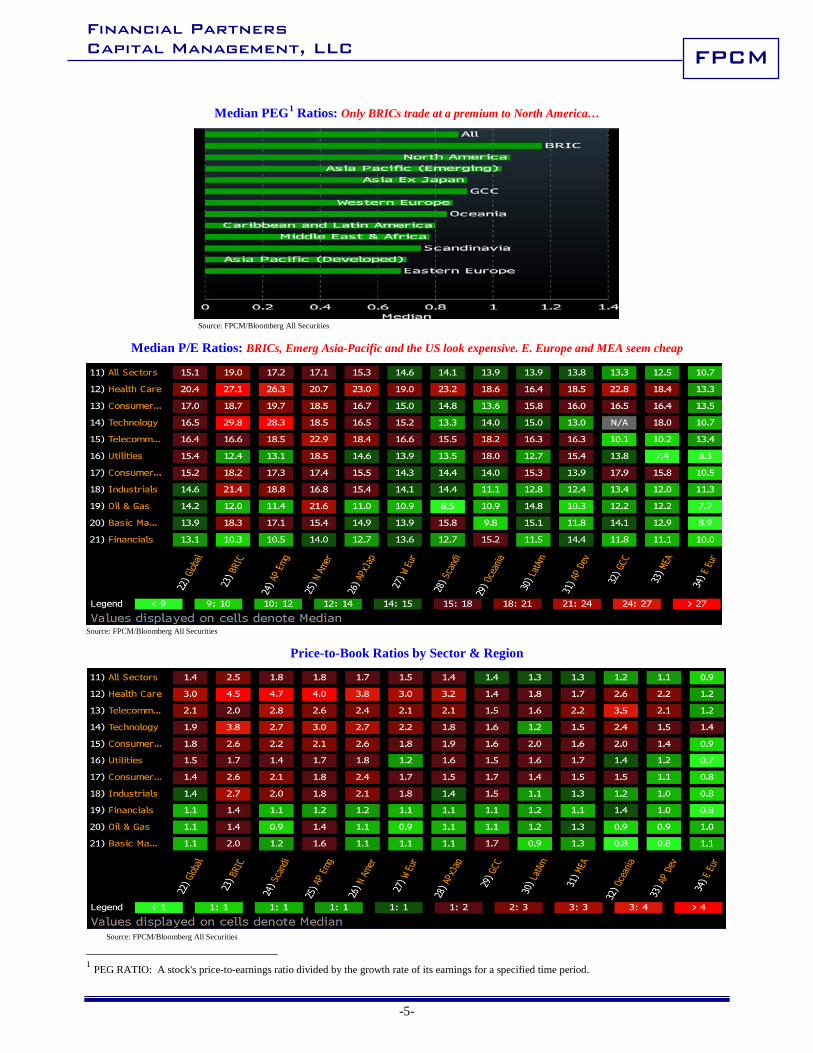
Median PEG1 Ratios: Only BRICs trade at a premium to North America…
Source: FPCM/Bloomberg All Securities
Median P/E Ratios: BRICs, Emerg Asia-Pacific and the US look expensive. E. Europe and MEA seem cheap
Source: FPCM/Bloomberg All Securities
Price-to-Book Ratios by Sector & Region
Source: FPCM/Bloomberg All Securities 1 PEG RATIO: A stock's price-to-earnings ratio divided by the growth rate of its earnings for a specified time period.
Financial Partners Capital Management, LLC
-6-
FPCM
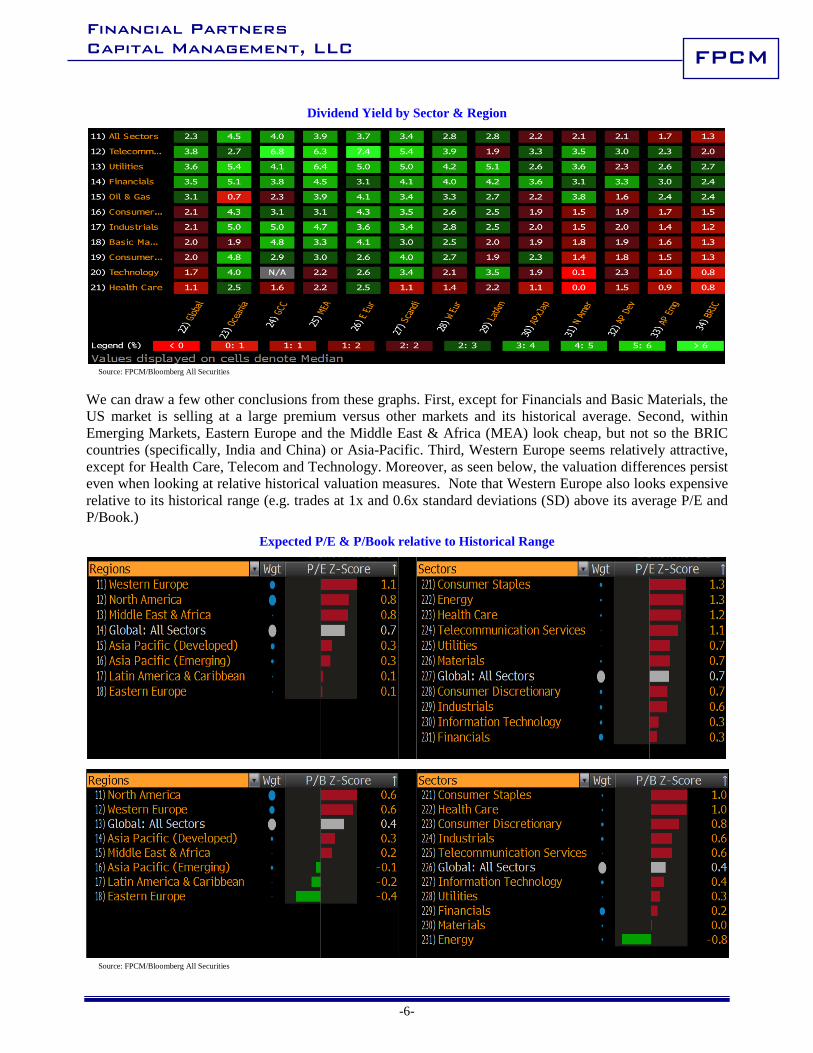
Dividend Yield by Sector & Region
Source: FPCM/Bloomberg All Securities
We can draw a few other conclusions from these graphs. First, except for Financials and Basic Materials, the US market is selling at a large premium versus other markets and its historical average. Second, within Emerging Markets, Eastern Europe and the Middle East & Africa (MEA) look cheap, but not so the BRIC countries (specifically, India and China) or Asia-Pacific. Third, Western Europe seems relatively attractive, except for Health Care, Telecom and Technology. Moreover, as seen below, the valuation differences persist even when looking at relative historical valuation measures. Note that Western Europe also looks expensive relative to its historical range (e.g. trades at 1x and 0.6x standard deviations (SD) above its average P/E and P/Book.)
Expected P/E & P/Book relative to Historical Range
Source: FPCM/Bloomberg All Securities
Financial Partners Capital Management, LLC
-7-
FPCM
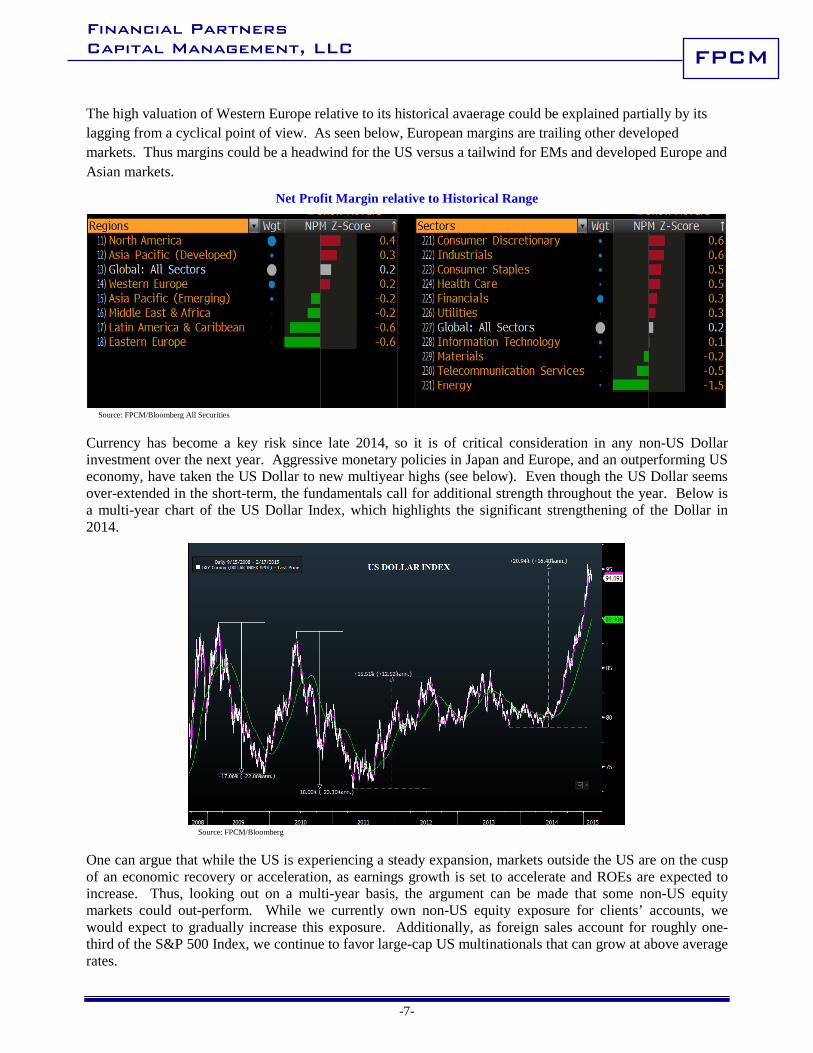
The high valuation of Western Europe relative to its historical avaerage could be explained partially by its lagging from a cyclical point of view. As seen below, European margins are trailing other developed markets. Thus margins could be a headwind for the US versus a tailwind for EMs and developed Europe and Asian markets.
Net Profit Margin relative to Historical Range
Source: FPCM/Bloomberg All Securities
Currency has become a key risk since late 2014, so it is of critical consideration in any non-US Dollar investment over the next year. Aggressive monetary policies in Japan and Europe, and an outperforming US economy, have taken the US Dollar to new multiyear highs (see below). Even though the US Dollar seems over-extended in the short-term, the fundamentals call for additional strength throughout the year. Below is a multi-year chart of the US Dollar Index, which highlights the significant strengthening of the Dollar in 2014.
Source: FPCM/Bloomberg
One can argue that while the US is experiencing a steady expansion, markets outside the US are on the cusp of an economic recovery or acceleration, as earnings growth is set to accelerate and ROEs are expected to increase. Thus, looking out on a multi-year basis, the argument can be made that some non-US equity markets could out-perform. While we currently own non-US equity exposure for clients’ accounts, we would expect to gradually increase this exposure. Additionally, as foreign sales account for roughly one-third of the S&P 500 Index, we continue to favor large-cap US multinationals that can grow at above average rates.
Financial Partners Capital Management, LLC
-8-
FPCM
A Note about Performance in 2014: There has been much media comments about how most investment managers under-performed the S&P 500 in 2014. Regrettably, we were in this group. While we measure our investment performance over a multi-year basis (and we hope you do the same), we would like to take the opportunity to reflect on our equity investment performance in 2014. Equity performance was positive in our portfolios, yet our performance relative to the S&P 500 Index was sub-par. Even though we would like to out-perform the Index each and every year, it is unrealistic to achieve this, and there will be years in which we significantly out-perform (for example, in 2012), and years in which we under-perform (for example, in 2014). As always, we manage portfolios over a long-term investment horizon with a focus on delivering long-term outperformance.
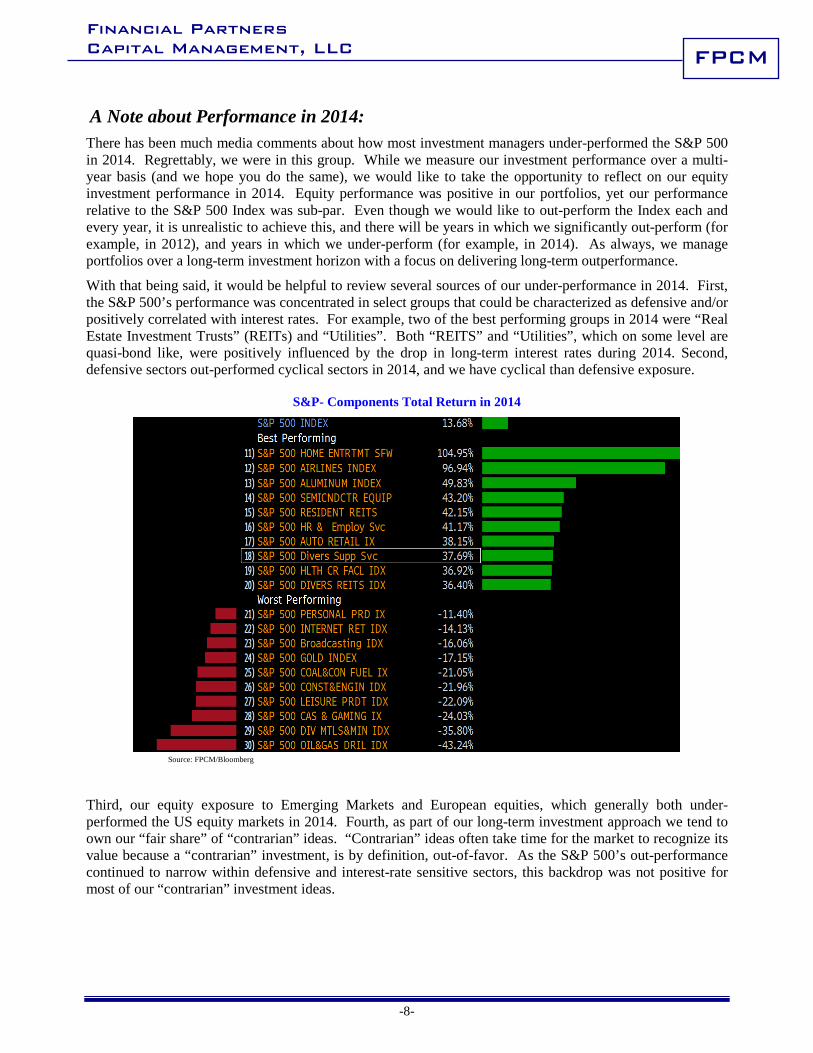
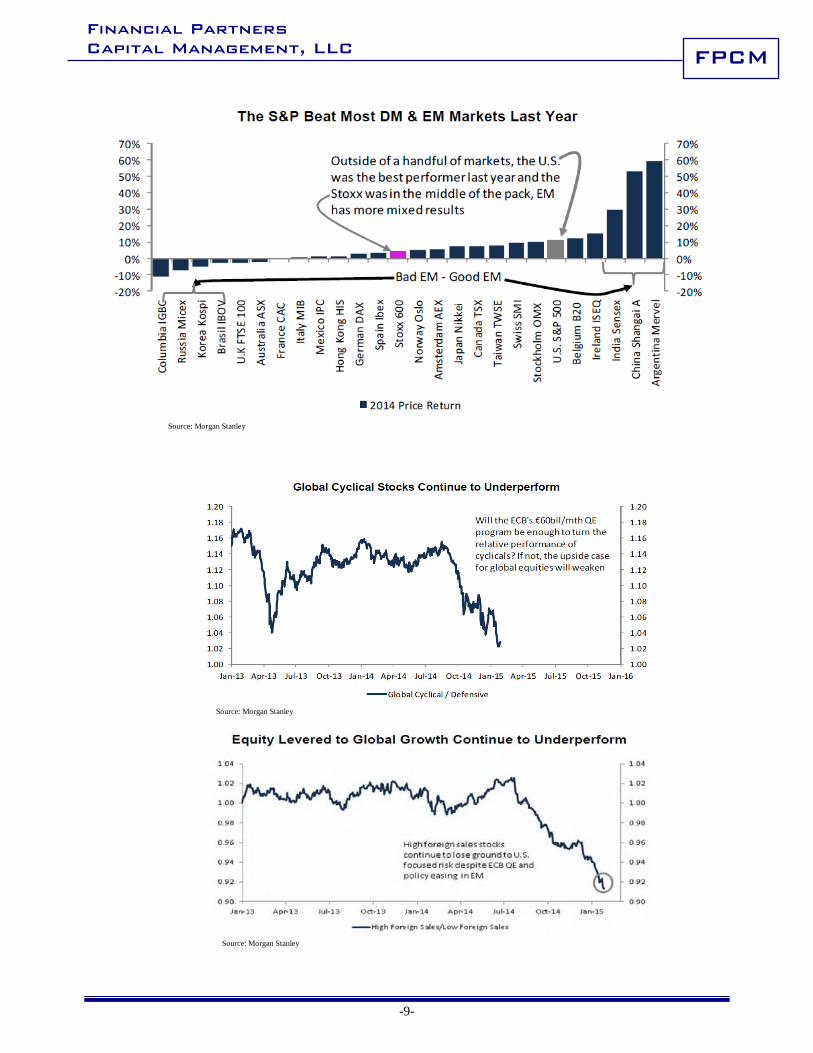
With that being said, it would be helpful to review several sources of our under-performance in 2014. First, the S&P 500’s performance was concentrated in select groups that could be characterized as defensive and/or positively correlated with interest rates. For example, two of the best performing groups in 2014 were “Real Estate Investment Trusts” (REITs) and “Utilities”. Both “REITS” and “Utilities”, which on some level are quasi-bond like, were positively influenced by the drop in long-term interest rates during 2014. Second, defensive sectors out-performed cyclical sectors in 2014, and we have cyclical than defensive exposure.
S&P- Components Total Return in 2014
Source: FPCM/Bloomberg
Third, our equity exposure to Emerging Markets and European equities, which generally both under-performed the US equity markets in 2014. Fourth, as part of our long-term investment approach we tend to own our “fair share” of “contrarian” ideas. “Contrarian” ideas often take time for the market to recognize its value because a “contrarian” investment, is by definition, out-of-favor. As the S&P 500’s out-performance continued to narrow within defensive and interest-rate sensitive sectors, this backdrop was not positive for most of our “contrarian” investment ideas.
Financial Partners Capital Management, LLC
-9-
FPCM
Source: Morgan Stanley
Source: Morgan Stanley
Source: Morgan Stanley
Financial Partners Capital Management, LLC
-10-
FPCM
As always, we
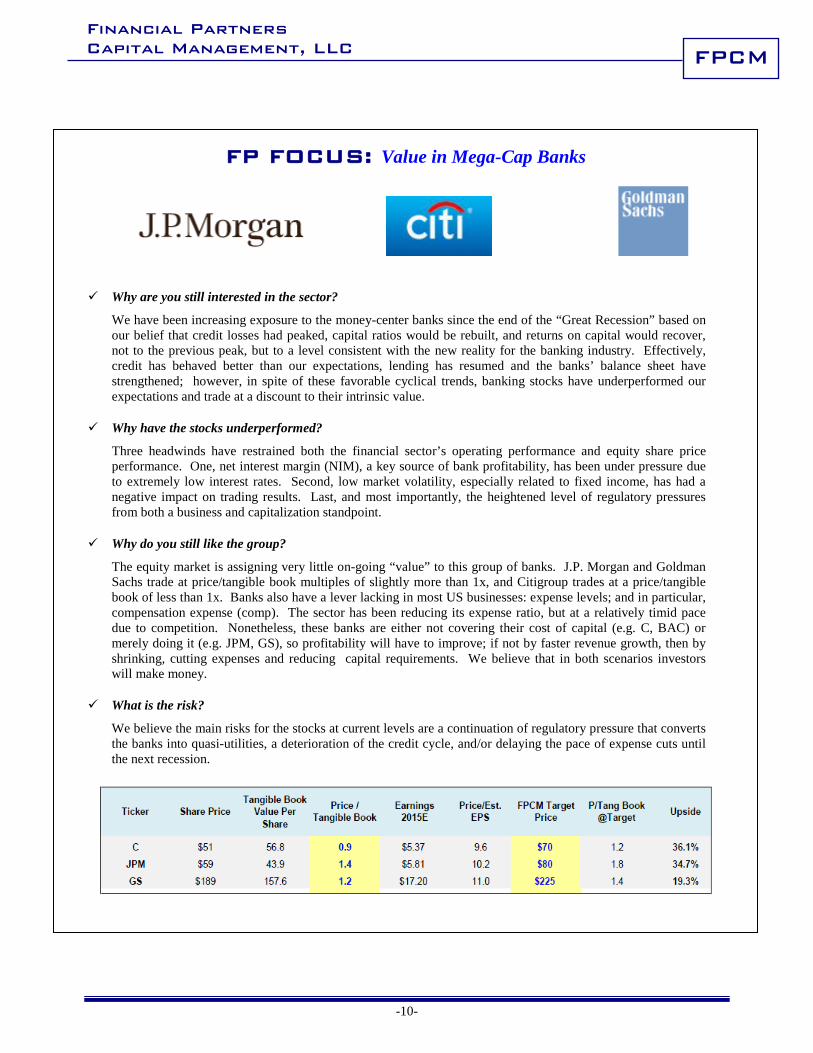
FP FOCUS: Value in Mega-Cap Banks
Why are you still interested in the sector?
We have been increasing exposure to the money-center banks since the end of the “Great Recession” based on our belief that credit losses had peaked, capital ratios would be rebuilt, and returns on capital would recover, not to the previous peak, but to a level consistent with the new reality for the banking industry. Effectively, credit has behaved better than our expectations, lending has resumed and the banks’ balance sheet have strengthened; however, in spite of these favorable cyclical trends, banking stocks have underperformed our expectations and trade at a discount to their intrinsic value.
Why have the stocks underperformed?
Three headwinds have restrained both the financial sector’s operating performance and equity share price performance. One, net interest margin (NIM), a key source of bank profitability, has been under pressure due to extremely low interest rates. Second, low market volatility, especially related to fixed income, has had a negative impact on trading results. Last, and most importantly, the heightened level of regulatory pressures from both a business and capitalization standpoint.
Why do you still like the group?
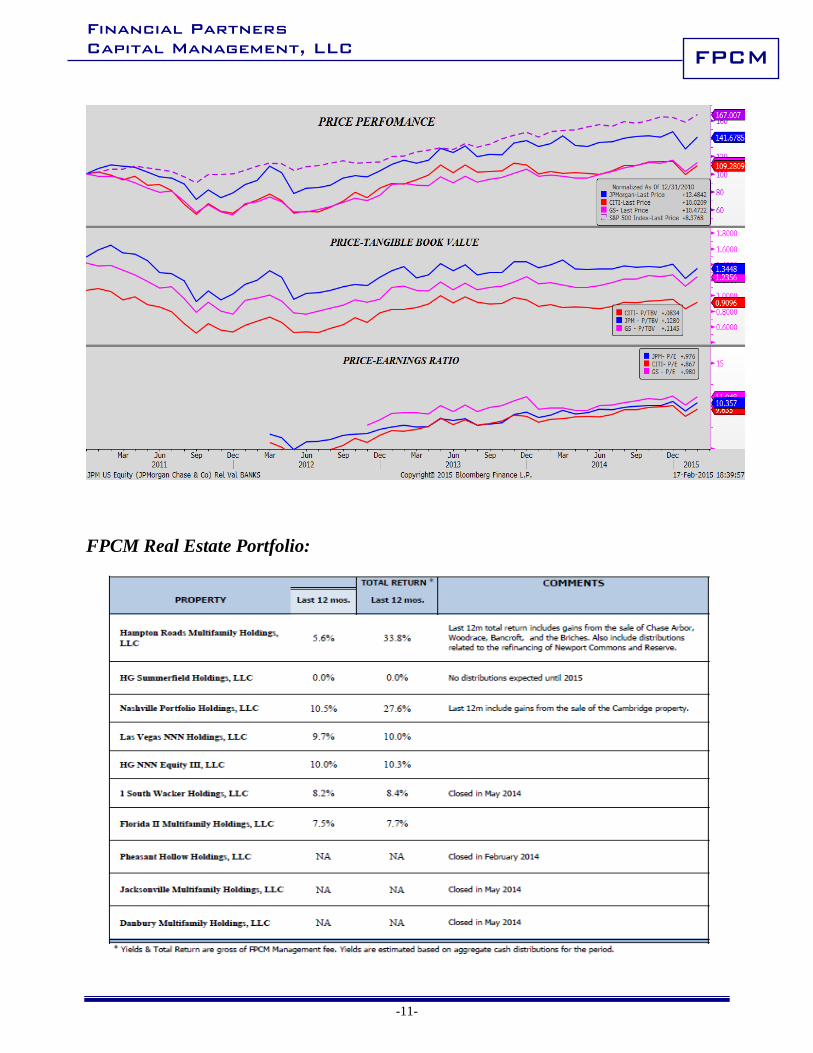
The equity market is assigning very little on-going “value” to this group of banks. J.P. Morgan and Goldman Sachs trade at price/tangible book multiples of slightly more than 1x, and Citigroup trades at a price/tangible book of less than 1x. Banks also have a lever lacking in most US businesses: expense levels; and in particular, compensation expense (comp). The sector has been reducing its expense ratio, but at a relatively timid pace due to competition. Nonetheless, these banks are either not covering their cost of capital (e.g. C, BAC) or merely doing it (e.g. JPM, GS), so profitability will have to improve; if not by faster revenue growth, then by shrinking, cutting expenses and reducing capital requirements. We believe that in both scenarios investors will make money.
What is the risk?
We believe the main risks for the stocks at current levels are a continuation of regulatory pressure that converts the banks into quasi-utilities, a deterioration of the credit cycle, and/or delaying the pace of expense cuts until the next recession.
Financial Partners Capital Management, LLC
-11-
FPCM
FPCM Real Estate Portfolio:
Financial Partners Capital Management, LLC
-12-
FPCM
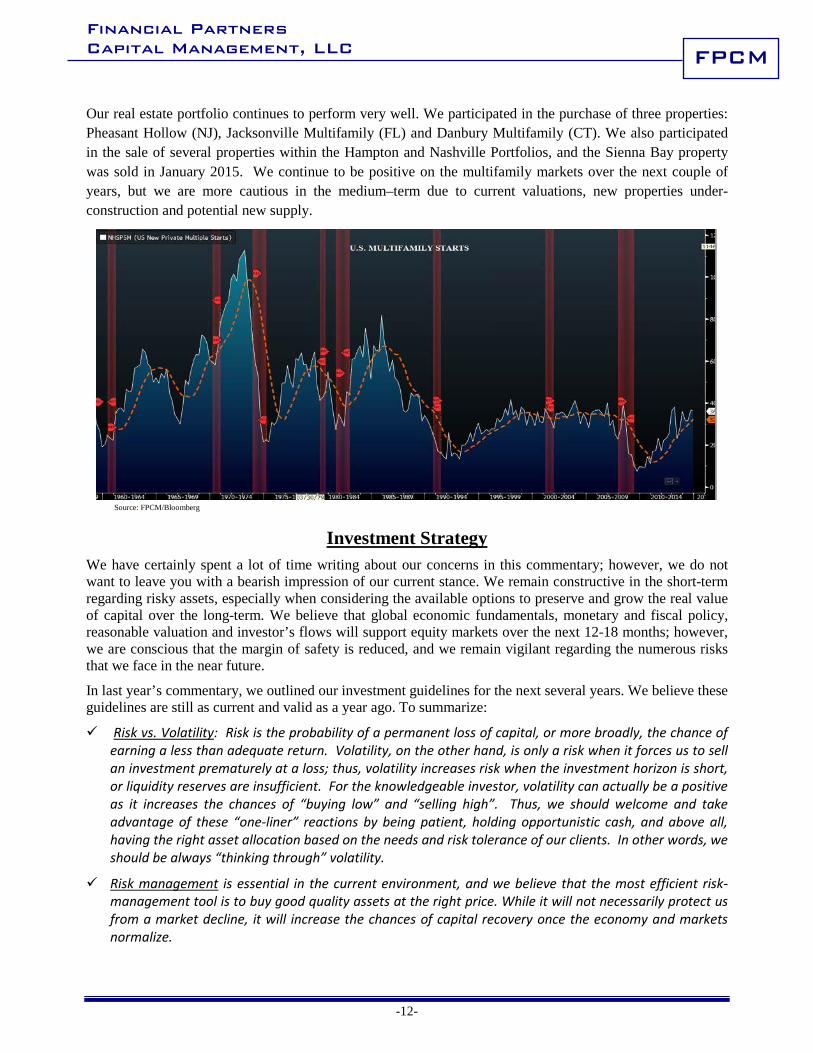
Our real estate portfolio continues to perform very well. We participated in the purchase of three properties: Pheasant Hollow (NJ), Jacksonville Multifamily (FL) and Danbury Multifamily (CT). We also participated in the sale of several properties within the Hampton and Nashville Portfolios, and the Sienna Bay property was sold in January 2015. We continue to be positive on the multifamily markets over the next couple of years, but we are more cautious in the medium–term due to current valuations, new properties under-construction and potential new supply.
Source: FPCM/Bloomberg
Investment Strategy We have certainly spent a lot of time writing about our concerns in this commentary; however, we do not want to leave you with a bearish impression of our current stance. We remain constructive in the short-term regarding risky assets, especially when considering the available options to preserve and grow the real value of capital over the long-term. We believe that global economic fundamentals, monetary and fiscal policy, reasonable valuation and investor’s flows will support equity markets over the next 12-18 months; however, we are conscious that the margin of safety is reduced, and we remain vigilant regarding the numerous risks that we face in the near future.
In last year’s commentary, we outlined our investment guidelines for the next several years. We believe these guidelines are still as current and valid as a year ago. To summarize:
Risk vs. Volatility: Risk is the probability of a permanent loss of capital, or more broadly, the chance of earning a less than adequate return. Volatility, on the other hand, is only a risk when it forces us to sell an investment prematurely at a loss; thus, volatility increases risk when the investment horizon is short, or liquidity reserves are insufficient. For the knowledgeable investor, volatility can actually be a positive as it increases the chances of “buying low” and “selling high”. Thus, we should welcome and take advantage of these “one-liner” reactions by being patient, holding opportunistic cash, and above all, having the right asset allocation based on the needs and risk tolerance of our clients. In other words, we should be always “thinking through” volatility.
Risk management is essential in the current environment, and we believe that the most efficient risk-management tool is to buy good quality assets at the right price. While it will not necessarily protect us from a market decline, it will increase the chances of capital recovery once the economy and markets normalize.
Financial Partners Capital Management, LLC
-13-
FPCM
Reaching for yield should continue to permeate investors’ minds, which in our view carries the equivalent risk of “picking up nickels in-front of a steamroller”. Liquidity will be essential as “crises” will re-appear from time-to-time, and the ability to invest while others are panicking should generate excess returns.
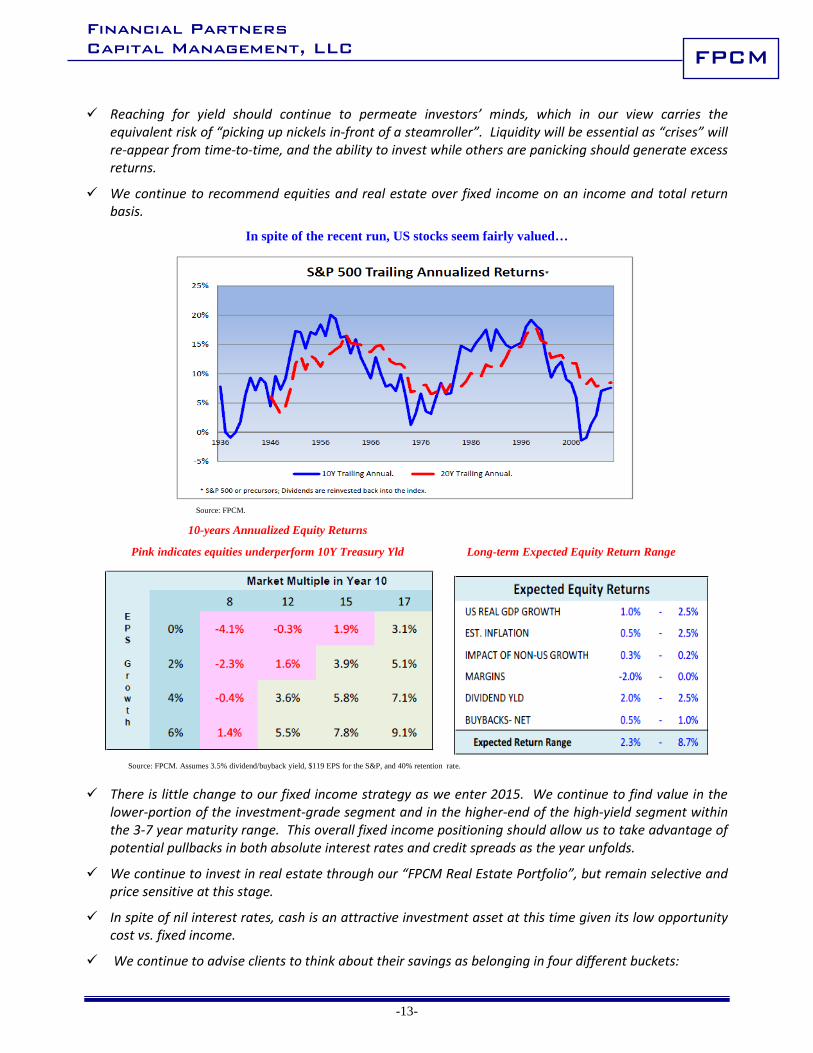
We continue to recommend equities and real estate over fixed income on an income and total return basis.
In spite of the recent run, US stocks seem fairly valued…
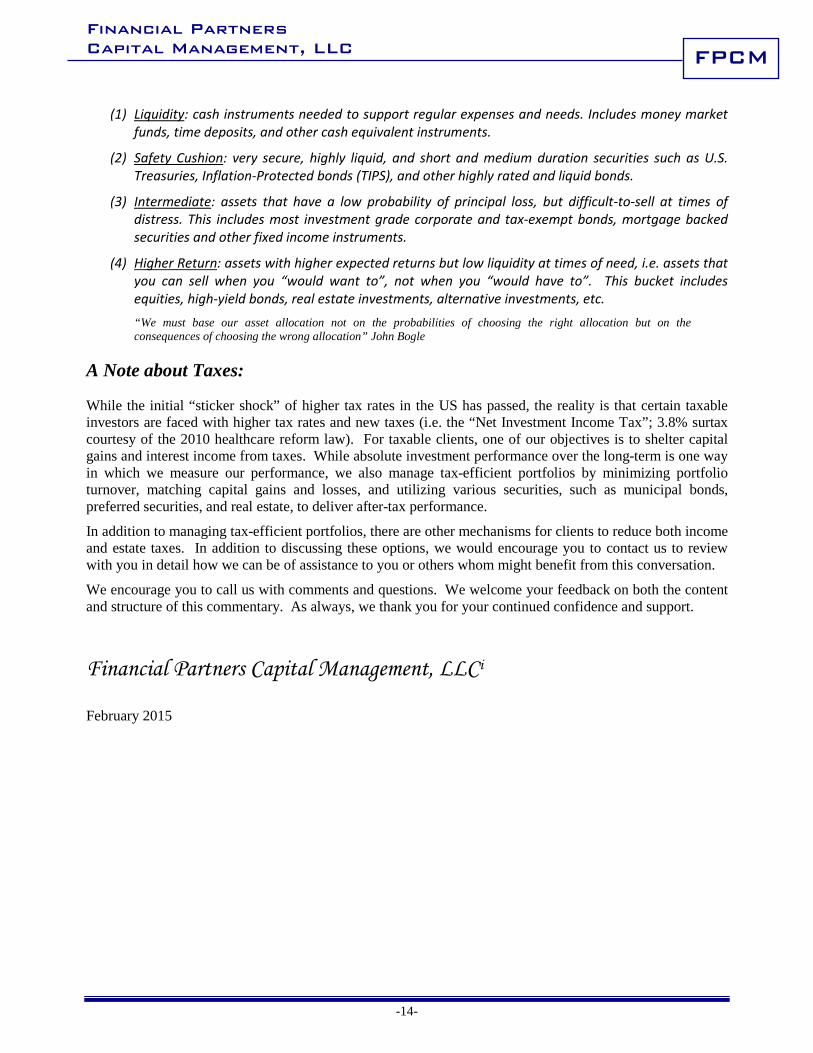
Source: FPCM. 10-years Annualized Equity Returns
Pink indicates equities underperform 10Y Treasury Yld Long-term Expected Equity Return Range
Source: FPCM. Assumes 3.5% dividend/buyback yield, $119 EPS for the S&P, and 40% retention rate.
There is little change to our fixed income strategy as we enter 2015. We continue to find value in the lower-portion of the investment-grade segment and in the higher-end of the high-yield segment within the 3-7 year maturity range. This overall fixed income positioning should allow us to take advantage of potential pullbacks in both absolute interest rates and credit spreads as the year unfolds.
We continue to invest in real estate through our “FPCM Real Estate Portfolio”, but remain selective and price sensitive at this stage.
In spite of nil interest rates, cash is an attractive investment asset at this time given its low opportunity cost vs. fixed income.
We continue to advise clients to think about their savings as belonging in four different buckets:
Financial Partners Capital Management, LLC
-14-
FPCM
(1) Liquidity: cash instruments needed to support regular expenses and needs. Includes money market funds, time deposits, and other cash equivalent instruments.
(2) Safety Cushion: very secure, highly liquid, and short and medium duration securities such as U.S. Treasuries, Inflation-Protected bonds (TIPS), and other highly rated and liquid bonds.
(3) Intermediate: assets that have a low probability of principal loss, but difficult-to-sell at times of distress. This includes most investment grade corporate and tax-exempt bonds, mortgage backed securities and other fixed income instruments.
(4) Higher Return: assets with higher expected returns but low liquidity at times of need, i.e. assets that you can sell when you “would want to”, not when you “would have to”. This bucket includes equities, high-yield bonds, real estate investments, alternative investments, etc. “We must base our asset allocation not on the probabilities of choosing the right allocation but on the consequences of choosing the wrong allocation” John Bogle
A Note about Taxes:
While the initial “sticker shock” of higher tax rates in the US has passed, the reality is that certain taxable investors are faced with higher tax rates and new taxes (i.e. the “Net Investment Income Tax”; 3.8% surtax courtesy of the 2010 healthcare reform law). For taxable clients, one of our objectives is to shelter capital gains and interest income from taxes. While absolute investment performance over the long-term is one way in which we measure our performance, we also manage tax-efficient portfolios by minimizing portfolio turnover, matching capital gains and losses, and utilizing various securities, such as municipal bonds, preferred securities, and real estate, to deliver after-tax performance.
In addition to managing tax-efficient portfolios, there are other mechanisms for clients to reduce both income and estate taxes. In addition to discussing these options, we would encourage you to contact us to review with you in detail how we can be of assistance to you or others whom might benefit from this conversation.
We encourage you to call us with comments and questions. We welcome your feedback on both the content and structure of this commentary. As always, we thank you for your continued confidence and support.
Financial Partners Capital Management, LLCi
February 2015
Financial Partners Capital Management, LLC
-15-
FPCM
INVESTMENT “BALANCE SHEET”
CONCERNS
The recovery process tends to be very slow and fragile after recessions caused by financial crises. Moreover, the perception of a “slow recovery” might be the result of comparing the current situation to that of the 1980-2005 period, a period characterized by increasing leverage, globalization, deregulation, and lower tax rates.
The recovery has been aided by artificially low interest rates in most countries. Short-term rates will eventually have to rise. The fear of unwinding the current super-loose monetary policy could be very disruptive to the markets.
Europe, Japan, China and emerging economies have slowed down. Emerging economies are very important for developed economies and a significant slowdown could derail the fragile recovery.
The Fed is expected to reverse course and start raising interest rates by mid-to late-2015, but normalization of monetary policy is expected to take longer than usual
The unemployment picture has improved, but labor participation is at a record low. Populist actions detrimental to the economy in the long-term could increase significantly if this situation were to continue for a longer period of time.
Lower productivity, aging of the population and labor participation are important long-term headwinds for global economic growth.
Currency volatility has increased significantly over the past few months. “Race-to-the-bottom” is a “race” that nobody can win. Too much strength in the US Dollar could create important economic and financial distortions.
Geo-political uncertainty continues to increase: Iran, Syria, Afghanistan, Iraq, ISIS, Yemen, Libya, Ukraine, North Korea…The list continues to grow….
The credit situation has improved across the globe, but developed economies continue to be over-leveraged, which increases economic risk, and limits the effectiveness of monetary and fiscal policy. Deleveraging should continue to be a headwind for a long period of time.
The sustainability of the Euro will remain in question as long as the fundamental productivity differences within the Euro community remain in place. The crisis centers on Greece for now, but it could easily expand to Spain, Italy and others.
Valuation: Equity valuations are, at best, at fair levels, and that is taking into account the “subsidy” from lower-than-normal interest rates.
Potential for “new” crisis: (↓ risk decreasing; ↑ risk increasing)
⇒ Geo-political surprise ↑↑ ⇒ Economic deterioration in China ↑ ⇒ Currency turmoil ↑
Long-term Concerns:
⇒ Developed economies fail to deal with its long-term fiscal problems ⇒ How will central banks eventually shrink their balance sheets? ⇒ Upturn in inflationary expectations ↓ ⇒ Increased Regulation ↑ ↑ ⇒ Rise in “Populism” ↑
Financial Partners Capital Management, LLC
-16-
FPCM
POSITIVES
It is well known that this recovery has been sub-par, especially with regard to employment and income, relative to the depth of the recession and prior upturns. On the other hand, the recovery on the industrial side has been better than average and household net worth is above the 2007 peak. Moreover, the best scenario we can probably hope for is slow economic growth. It would help the continuation of the deleveraging process while keeping pressure on politicians on the fiscal front; however, a bit higher inflation rate would also go a long way in helping this trend
Except for the risk of serious external shocks, it is difficult to foresee another deep recession at this time because the typical down levers (capital expenditure, housing, auto production, inventories, excess leverage) are not in over-extended territory yet.
Consumer spending should continue to grow thanks to increasing employment, lower oil prices, a recovery in U.S. household wealth, and the end of consumer de-leveraging. The positive wealth effect should also support consumer spending outside the US.
Economic growth has accelerated in the US, albeit expected to stay on avg. in the 2-3%+ range. A weaker Euro and Yen, lower oil prices and monetary stimulus should support the European and Japanese economy in the short-term.
Dovish monetary policy across most of the world should support economic growth and financial markets in the short-term (BoJ, ECB, BoE, India, China and now Canada). In the US, the Federal Reserve is likely to continue to keep interest rates extremely low until at least 2017. Low short-term rates and ample liquidity should help sustain the recovery in the short-term, and keep a lid on long-term rates.
We have probably passed in this cycle the peak in fiscal restraint.
Even though financing is not widely available, conditions in the credit markets have improved considerably and credit spreads are back to pre-crisis levels.
The rate of inflation is expected to remain low in the short- and medium-term.
US corporate balance sheets are in very good shape. Free cash flow is plentiful, return-on-capital is high, and leverage is low.
i This commentary might contain forward-looking statements, which involve risks and uncertainties. Actual results may differ significantly from the results described in the forward-looking statements. The information contained herein is for illustrative purposes only and should not be considered an offer to sell or a solicitation of any offer to buy interests in any particular investment. Opinions and estimates expressed herein reflect the current judgment of Financial Partners Capital Management (FPCM), and are based on information obtained from sources, which are believed to be reliable, but FPCM does not offer any guarantees as to its accuracy or completeness. Nor are they intended as a forecast or guarantee of future results. The information is not necessarily updated on a regular basis; when it is, the date of the change(s) will be noted. In addition, opinions and estimates are subject to change without notice. FPCM, its officers, directors, employees, customers, or affiliates may have a position, long or short, in the securities mentioned herein and/or related securities, and from time to time may increase or decrease such position or take a contra position. FPCM may have other relationships with any company mentioned in this commentary. Past performance is not a guarantee of future results. No future or current client should assume that the future performance of any specific investment, strategy or product referred to directly or indirectly will be profitable or equal to any corresponding indicated performance levels. Reproduction without written permission is prohibited.