financial performance analysis of teletalk bd ltd
TRANSCRIPT

WELCOME TO MYPRESENTATION

Financial Performance Analysis of Teletalk Bangladesh Limited
A B M Fahad ZituID: UG01-20-09-046

Company Overview
Ratio Analysis
Findings
Comparison
SWOT Analysis
Recommendation

Overview of Teletalk Bangladesh Limited
• TBL is a public limited company in Bangladesh
• It was established on 26 December, 2004• Head Office- House No. 41, Road No. 27,
Banani, Dhaka, Bangladesh• Managing Director-Md. Mujibur Rahman• 100% state owned mobile operator• Authorized Capital- Tk. 20,000,000,000 • Company has decided to go for IPO of
TK.600 crore in the capital market• Subscriber near 2 million
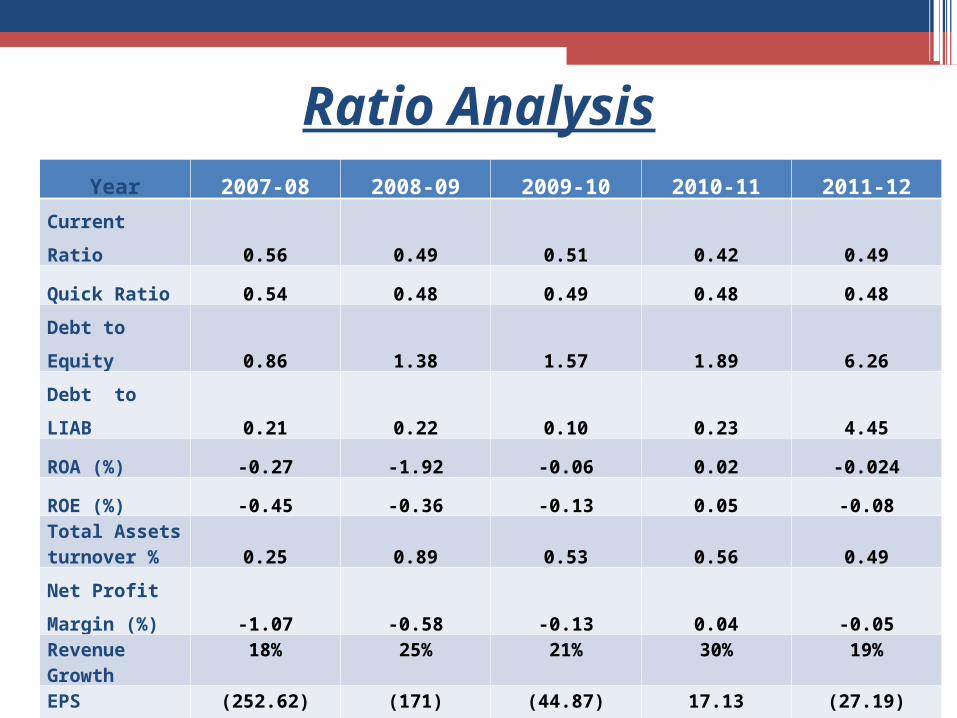
Ratio AnalysisYear 2007-08 2008-09 2009-10 2010-11 2011-12
Current Ratio 0.56 0.49 0.51 0.42 0.49
Quick Ratio 0.54 0.48 0.49 0.48 0.48
Debt to Equity 0.86 1.38 1.57 1.89 6.26
Debt to LIAB 0.21 0.22 0.10 0.23 4.45
ROA (%) -0.27 -1.92 -0.06 0.02 -0.024
ROE (%) -0.45 -0.36 -0.13 0.05 -0.08Total Assetsturnover % 0.25 0.89 0.53 0.56 0.49
Net Profit
Margin (%) -1.07 -0.58 -0.13 0.04 -0.05Revenue Growth
18% 25% 21% 30% 19%
EPS (252.62) (171) (44.87) 17.13 (27.19)
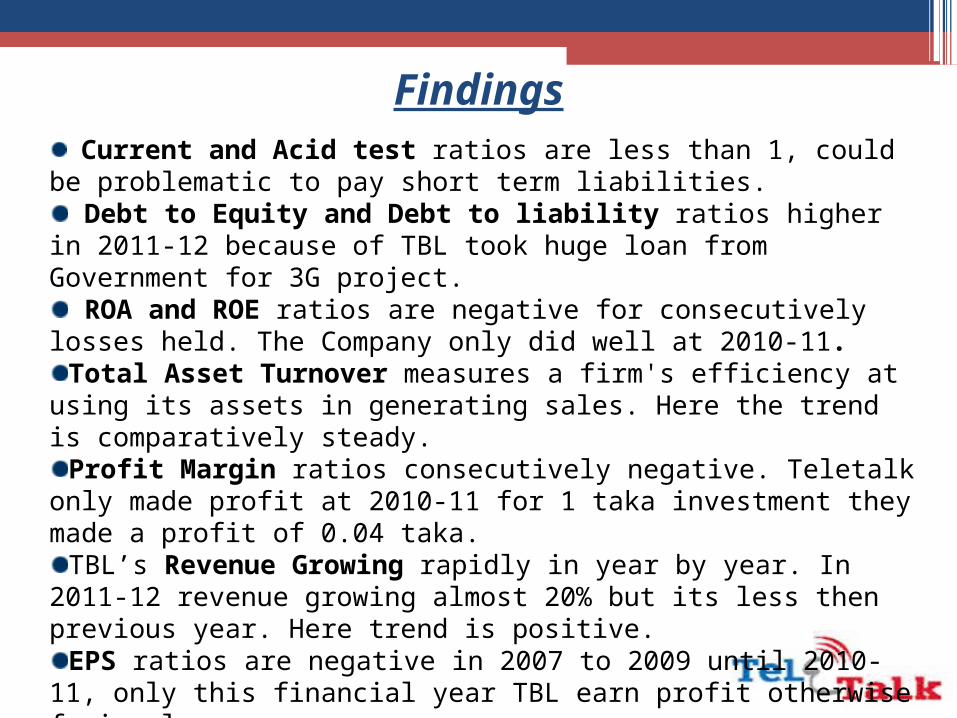
Findings Current and Acid test ratios are less than 1, could be problematic to
pay short term liabilities. Debt to Equity and Debt to liability ratios higher in 2011-12 because
of TBL took huge loan from Government for 3G project. ROA and ROE ratios are negative for consecutively losses held. The
Company only did well at 2010-11.Total Asset Turnover measures a firm's efficiency at using its assets
in generating sales. Here the trend is comparatively steady.Profit Margin ratios consecutively negative. Teletalk only made profit at
2010-11 for 1 taka investment they made a profit of 0.04 taka.TBL’s Revenue Growing rapidly in year by year. In 2011-12 revenue
growing almost 20% but its less then previous year. Here trend is positive.
EPS ratios are negative in 2007 to 2009 until 2010-11, only this financial year TBL earn profit otherwise facing losses.

ComparisonRatios GP Blink Robi TeletalkCurrent Ratio 0.55 0.43 0.33 0.49
Quick Ratio 0.40 0.37 0.38 0.49
Debt to Equity Ratio 0.25 0.28 0.32 2.39
ROA 0.12 0.07 0.05 -0.45
ROE 0.33 0.28 0.18 -0.19
Profit Margin Ratio 0.17 -0.02 -0.002 -0.358
Revenue Growth 19% 21% 20% 23%
EPS 11 - - -85
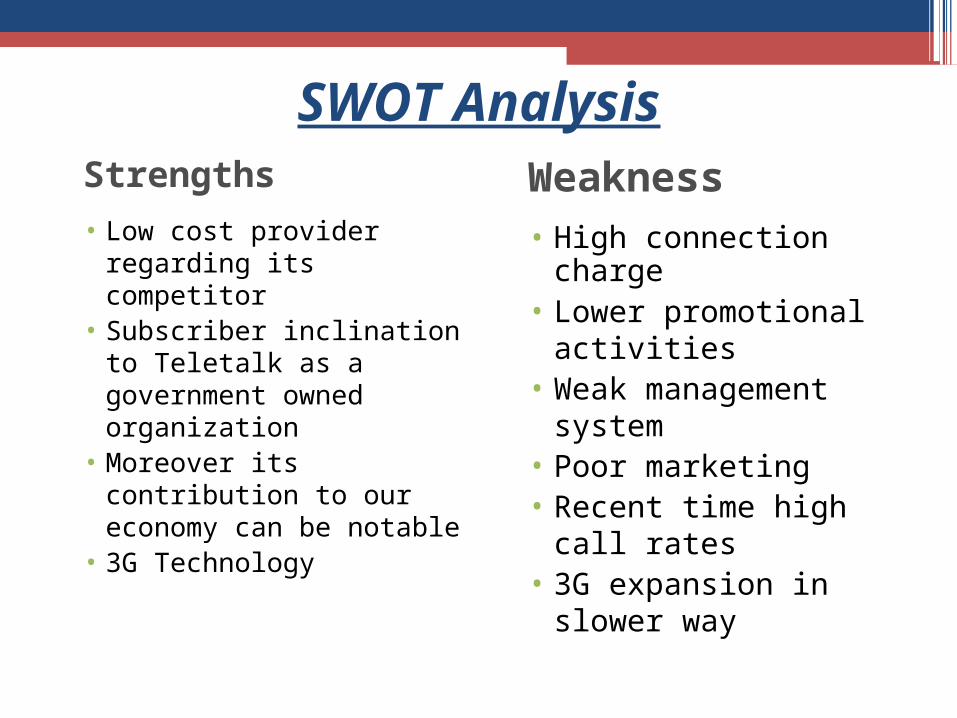
SWOT AnalysisStrengths• Low cost provider
regarding its competitor
• Subscriber inclination to Teletalk as a government owned organization
• Moreover its contribution to our economy can be notable
• 3G Technology
Weakness• High connection
charge• Lower promotional
activities• Weak management
system• Poor marketing• Recent time high call
rates• 3G expansion in
slower way

SWOT AnalysisOpportunities• Teletalk can use the
image of local and government owned organization
• Introduction of new technology and services.
• Expand 3G service in the rural area
• Teletalk can use the experience of BTTB
Threats• Strong competition
with another 5 mobile operators
• The invention of technology which is new modern and consumer oriented
• Another invisible threat is land phone operator

Recommendation• Need to increase Current Assets• Try to keep Gross Profit Margin Stable• Increasing Net Profit Margin by holding
market share• Collect Money through IPO early for
network up gradation• Develop TBL’s website• Require of rapid Revenue Growth• Accelerated gain of Earnings per Share• Assign Specialist person for co-ordination

Conclusion Teletalk has achieved great success during last
Four years in the Telecom industry including booming launch of 3G. Some Characteristics of Teletalk-
• Low Sales • High Sales Growth• Very Low Penetration • Moderate Technical Change• Many Segments• Large Competition and • Low Profit Finally TBL in introduction stage of lifecycle.

THANK YOU