financial performance of everest bank limited a thesis by
TRANSCRIPT

Financial Performance of Everest Bank Limited
A Thesis
Submitted
By
Dipak Regmi
Central Department of Management
Exam Roll No. 280242
Campus Roll. No. 29/2068/70
T U Reg. No.7-2-263-196-2007
In Partial Fulfillment of the Requirements for the Degree of
Master of Business Studies (MBS)
in the
Faculty of Management
Tribhuvan University
Kathmandu
August, 2019
ii
Declaration
I hereby declare that the work reported in this thesis entitled “Financial Performance
of Everest Bank Ltd.” submitted to Office of the Dean, Faculty of Management,
Tribhuvan University, is my original work done in the form of partial fulfillment of
the requirement for the degree of Master of Business Studies (MBS) under the
supervision of Prof. Dr. Sanjay Kumar Shrestha of Central Department of
Management Campus, T.U. Kirtipur.
………….................
Dipak Regmi
Researcher
Campus Roll. No. 29/2068/70
T U Reg. No.7-2-263-196-2007


v
Acknowledgements
This thesis has been prepared to fulfill the partial requirement for the degree of Master
of business studies (MBB) in the second-year course schedule. This thesis has been
prepared to fulfill the financial performance evaluation of Bank. It is in this context;
facilitate on understanding of various aspects to financial analysis of Everest Bank
Limited. Every chapter is presented in descriptive and analytical way. Data available
is through analyzed. One important feature of this report consists of interaction with
logical representation regarding the effect of financial performances. Sincere effort
has been made to present the subject matter in simple and descriptive manner with
appropriate data.
I would like to express my sincere and heartily gratitude to my thesis supervisor
Prof. Dr. Sanjay Kumar Shrestha of Central Department of Management,
Tribhuvan University, who guided me throughout the study. His valuable suggestions
and instruction made me present this research work in this form.
I would cordially like to express sincere thanks, formally, to all Professors and
Lecturers of Central Department of Management who help me to make this thesis
possible in my academic endeavors.
Especially I would like to thank my brothers Mr. T.N. Regmi, Mr. Jeewan K Ghimire
and Mr. Bhanu Regmi, who encouraged and instructed me to prepare this report. And,
special thanks goes to my dear brother Sagar Dahal, Amish dahal and vanja Naresh
Khatiwada. I would like to thank Everest Bank limited data Bank for giving actual
data for this work.
Similarly, my special thanks go to my wife Nelisha Mishra, my sister Januka Regmi
Kafle and my friend Chhabi Ram Luitel who facilitated me during my research work.
Furthermore, I am also thankful to my all family members and friends for their
valuable inspiration and contribution to prepare this thesis work.
Finally, it is quite probable there might some gaps and lapses that have escaped from
my notice despite my efforts to that be comprehensive according to objectives of the
study. I bear the total responsibilities for any errors discrepancies that might have
occurred in this thesis.
Thanks for all your encouragement!
Dipak Regmi

vi
Table of contents
Contents Page
Title page i
Certificate of authorship ii
Supervisor’s Recommendation iii
Approval sheet iv
Acknowledgements v
Table of contents vii
List of tables viii
List of figures x
Abbreviations xi
Chapter 1: Introduction
1.1 Background of the Study 1
1.2 Statement of the Problem 2
1.3 Objectives of the Study 3
1.4 Significance of the Study 3
1.5 Limitation of the Study 4
1.6 Scheme of the Study 4
Chapter 2: Literature Review
2.1 Conceptual Review 5
2.1.1 Concept of Financial Analysis 5
2.1.2 Importance of Financial Performance Analysis 6
2.1.3 Sources of Judging Financial Performance 8
2.1.4 Methods of Analyzing and Evaluating Financial Performance 9
2.2 Review of previous studies 11
2.2.1 Review of Journal articles 11
2.2.2 Review of Theses 12
2.3 Research gap 13
Chapter 3: Research Methodology
3.1 Research Design 15
3.2 Population and Sample 15
3.3 Source of Data 15
3.4 Data Collection Techniques 16
3.5 Data Processing 16

vii
3.6 Data Analysis Tools 16
3.6.1 Financial Tools 16
3.6.1.1 Liquidity Ratios 17
3.6.1.2 Leverage Ratio 17
3.6.1.3 Activity Ratio 18
3.6.1.4 Profitability Ratio 18
3.6.1.5.1 Earning Performance Ratio 19
3.6.1.5.2 Income and Expenditure Analysis 19
3.6.2 Statistical Tools 19
3.6.2.1 Karl Person's Coefficient of Correlation (r) 19
3.6.2.2 Probable Error of Correlation Coefficients ® 20
3.6.2.3 Least Square linear Trend 20
Chapter 4: Data Presentation and Analysis
4.1 Ratio Analysis 21
4.1.1 Liquidity Analysis 21
4.1.2 Leverage Ratio 31
4.1.3 Activity Ratio 36
4.1.4 Profitability Ratio 48
4.2 Other Indicators 54
4.3 Income and Expenditure Analysis 58
4.3.1 Income Analysis 58
4.3.2 Expenditure Analysis 60
4.4 Correlation Analysis 61
4.5 Trend Analysis 65
4.6 Major Findings of the Study 68
Chapter 5: Summary, Conclusion and Recommendations
5.1 Summary 71
5.2 Conclusion 71
5.3 Recommendations 74
Bibliography 76
Annexes 79

viii
List of tables
Tables Page
1. Table 4.1 Current Ratio 22
2. Table 4.2 Cash and Bank Balance to Current and Saving Deposit Ratio 24
3. Table 4.3 Cash and Bank Balance to Total Deposit Ratio 25
4. Table 4.4 NRB balance to current and saving deposit ratio 27
5. Table 4.5 NRB balance to fixed deposit ratio 28
6. Table 4.6 Fixed deposit to total deposit ratio 30
7. Table 4.7 Debt equity ratio 32
8. Table 4.8 Debt Asset Ratio 33
9. Table 4.9 Interest Coverage Ratio 35
10. Table 4.10 Loans and advances to total deposit ratio 37
11. Table 4.11 Loans and advanced to fixed deposit ratio 39
12. Table 4.12 Loans and advances to saving deposit ratio 41
13. Table 4.13 Investment to total deposit ratio 43
14. Table 4.14 Performing assets to total assets ratio 45
15. Table 4.15 Performing assets to total debt ratio 47
16. Table 4.16 Return on asset 49
17. Table 4.17 Return on total deposit 49
18. Table 4.18 Total interest expenses to total interest income ratio 50
19. Table 4.19 Interest earned to total asset ratio 52
20. Table 4.20 Staff expense to total income ratio 53
21. Table 4.21 Office operation expenses to total income ratio 54
22. Table 4.22 Earnings per share 55
23. Table 4.23 Dividend per Share 56
24. Table 4.24 Dividend payout ratio 57
25. Table 4.25 Price earnings ratio 57
26. Table 4.26 Income analysis 58
27. Table 4.27 Expenditure analysis 60
28. Table 4.28 Correlation analysis between total deposit and net profit 61
29. Table 4.29 Correlation analysis between performing assets and net profit 62
30. Table 4.30 Correlation analysis between total deposit and loans and
Advances. 63
31. Table 4.31 Correlation Analysis between Total Deposit and Investment 63

ix
List of tables
Tables Page
32. Table 4.32 Correlation between EPS and MVPS 64
33. Table 4.33 Correlation between DPS and MVPS 65
34. Table 4.34 Trend analysis of total deposit 65
35. Table 4.35 Trend Forecast for Next Five Years 66
36. Table 4.36 Trend analysis of net profit 67
37. Table 4.37 Net profit trend forecast for next five years 67

x
List of figures
Figure Page
1. Figure 2.1 Types of financial analysis 6
2. Figure-4.1 Current Ratio 23
3. Figure-4.2 Cash and Bank Balance with Current and Saving Deposit 24
4. Figure-4.3 Cash and Bank Balance with Total Deposit 26
5. Figure: 4.4 NRB balance to current and saving deposit ratio 27
6. Figure: 4.5 NRB balance to fixed deposit ratio 29
7. Figure-4.6 Fixed deposit with total deposit 30
8. Figure-4.7 Debt equity ratio 32
9. Figure-4.8 Debt Asset Ratio 34
10. Figure-4.9 Interest Coverage Ratio 36
11. Figure-4.10 Loans and advances to total deposit ratio 38
12. Figure-4.11 Loans and advanced to fixed deposit ratio 40
13. Figure-4.12 Loans and advances to saving deposit ratio 42
14. Figure-4.13 Investment to total deposit ratio 43
15. Figure-4.14 Performing assets to total assets ratio 45
16. Figure-4.15 Performing assets to total debt ratio 47
17. Figure-4.16 Total interest expenses to total interest income ratio 51
18. Figure-4.17 Deposit trend forecast for next five years (yc=a+bx) 66
19. Figure-4.18 Net profit trend forecast for next five years 68

xi
Abbreviations
A/C Account
ADBL Agriculture Development Bank Limited
DPR Dividend Payout Ratio
DPS Dividend per share
EBIT Earning Before Interest and Tax
EBL Everest bank Limited
EPS Earning per share
FY Fiscal Year
i.e That is
Ltd. Limited
MVPS Market value per share
NRB Nepal Ratra Bank
P/E Price Earning
PF Provident Fund
PNB Panjab National Bank
RBB Rastiya Banijya Bank
Rs. Rupees
T.U. Tribhuvan University
Chapter - 1
Introduction
1.1 Background of the study
Financial performance is the important statement of an organization. It is a decision-
making process to incur strengths or weaknesses of the organization and knowledge
of its revenue generation status. It is a mirror to look into development activities to be
undertaken by the organization or companies. It should also measure or evaluate
internal and external information of past activities, current position and future
prospects of organization or venture. Financial performance evaluation looks into the
management team of organization, its performance in future, efficiency of resource
utilization and overall position of the organization.
The initiation of formal banking system in Nepal commenced with the establishment
of Nepal Bank Limited (NBL) in 1937(1994 BS), as the first Nepalese commercial
bank. The country's central bank, Nepal Rastra Bank (NRB) was established in B.S.
2013 by Act of B.S. 2012, after nearly two decades of NBL having been in existence.
A decade after the establishment of NRB, Rastriya Banijya Bank (RBB) in B.S. 2022,
a commercial bank under the ownership of His Majesty’s Government of Nepal
(HMG/N) was established, which provides economic and financial intermediation in
the economy.
In the context of banking development, the 1980s saw a major structural change in
financial sector policies, regulations and institutional developments. HMG/N
emphasized the role of the private sector for the investment in the financial sector.
The financial sector liberalization, started already in the early eighties with the
liberalization of the interest rates, encompassed further deregulation of interest rates,
relaxation of entry barriers for domestic and foreign banks, restructuring of public
sector commercial banks and withdrawal of central bank control over their portfolio
management. These policies opened the doors for foreigners to enter into banking
sector under joint venture. Consequently, the third commercial bank in Nepal, or the
first foreign joint venture bank, was set up as Nepal Arab Bank Ltd (now called as
NABIL Bank Ltd) in 1984. Thereafter, two foreign joint venture banks, Nepal
Indosuez Bank Ltd. (now called as Nepal Investment Bank) and Nepal Grindlays
Bank Ltd (now called as Standard Chartered Bank Nepal Ltd.) was established in
1986 and 1987 respectively (http://anju.page.tl/Commercial-Bankinghtm). History has

2
proven that though the extent may vary from country to country requirement of
economic development of any country heavily relies on its banking system.
Banking institutions are important for resource mobilization and all-round
development of the country. It provides resources for economic development,
maintains economic situations of various segments and extends credit to the people.
Banks are those institutions which raise funds from depositors and then lend those
funds to needy individuals and /or institutions. They offer the widest range of
financial services especially credit, savings, and payment services and perform the
widest range of financial functions of any business firm in the economy.
Like other countries, goldsmiths, merchants and moneylenders were the ancient
bankers of Nepal. Tejarath Adda established during the tenure of then Prime Minister
Ranodip Singh (1993 B.S.) was the first step towards the institutional development
banking in Nepal. Tejarath Adda did not collect deposits from the public but provide
loans to employees and public against the bullion. (Dahal & Dahal, 2056: p10)
1.2 Statement of the problem
The adaptation of open and free market economic and financial policies has
encouraged establishment of number of banks, financial companies and co-operatives.
The competition in the banking sector is going to be higher than ever before. Banks
are prone to both external and internal threats. To exist in the competitive market,
banks are trying to introduce different schemes and advantage to the customer to hold
the greater share. These banks have contributed towards introducing new technology,
new banking systems, and deficient service delivery in the country. They have done
so in line with the trust of economic liberalization and financial sector reform i.e.
making the financial system more competitive, efficient, and profitable. In the present
scenario, the worst economic and social condition of our country largely affects the
banks’ performance in all the operational, productivity and profitability sectors, which
causes the large decline in the profit of all types of banks. In this perspective, analysis
of the Joint Venture bank's performance and to disseminate quality information
becomes more essential.
The problem of the study lies on analyzing the financial strengths and weaknesses of
Everest Bank Limited. It also aims in answering the following questions:

3
1. What is the liquidity position of the bank?
2. What is the leverage positions of the bank?
3. How effectively EBL uses its operating assets?
4. What is the level of profitability of the bank?
This study attempts to evaluate the financial performance of the bank with the help of
various financial and statistical tools. This study also attempts to recommend some
suggestions for improvement in financial performance aspect.
1.3 Objectives of the study
The main objective of the study is to evaluate the financial performance of Everest
Bank Limited with the help of ratio analysis and other portfolios. Besides, the specific
objectives of this research are as follows:
1. To find out the liquidity positions of the EBL.
2. To find out the leverage positions of the EBL.
3. To identify how effectively EBL uses its operating assets.
4. To find out the level of profitability of EBL.
1.4 Significance of the study
The study identifies significance of various groups.
a. This research helps to find liquidity position to the persons and parties such
as general readers, decision makers, brokers, traders, shareholders, financial
agencies, businessman and general public (depositors, prospective customers,
investors etc.).
b. This study finds leverage position which is used as pilot work for future
research.
c. To identify how effectively operating assets utilize by the EBL.
d. To identify financial position of Bank in term of profitability.

4
1.5 Limitation of the study
This study attempts to evaluate the financial performance of the EBL. The following
are the limitations of the study:
1. This study relies on the published financial documents such as balance sheets,
profit and loss accounts, related journals, magazines, and books. It mainly
focuses on financial performance and does not cover other aspects.
2. Only selected financial and statistical tools are used.
3. This study is based on the secondary data only.
4. This study covers out for the period of fiscal year 2013/14 to 2017/18.
1.6 Scheme of the study
This study is divided into five chapters:
Chapter 1: Introduction: This chapter explains background of the study, statement
of the problem, objectives of the study, and limitation of the study.
Chapter 2: Review of literature: This chapter consists of conceptual review and
review of related studies.
Chapter 3: Research methodology: This chapter includes research design,
population and sample, sources and types of data, data gathering
procedure and analytical tools such as financial and statistical.
Chapter 4: Data presentation and analysis: This chapter is the main body of the
research which includes financial ratios analysis, income and expenses
analysis, trend analysis and major finding of the study.
Chapter 5: Summary, conclusions and recommendations: This chapter consists of
summary of the study, conclusion of the major findings and
recommendations for further improvement.

Chapter - 2
Review of literature
This chapter mainly reviews the available literature in the field of financial
performance of joint venture bank. Pilot studies have helped the researcher choose
such area of research where there are no chance of duplication. In addition, the
chapter deals with conceptual aspects of textual facts relating to the various areas of
the research to be conducted.
Therefore, review of literature has been categorized into three groups:
Conceptual Review
Review of Related Studies
2.1 Conceptual review
As this research is related to financial performance analysis of EBL, following aspects
of analysis are reviewed in sequential manner.
Concept of financial analysis
Importance of financial performance analysis
Objectives of financial analysis
Limitation of financial analysis
Source for judging financial performance
Methods of analyzing and evaluation financial performance
2.1.1 Concept of financial analysis
Financial analysis is one of the process of identifying the financial strengths and
weakness of the firm by properly establishing relationship between the components of
balance sheet and profit and loss account and other operating data. (Pandey, 1992:
109.)
Moreover, financial analysis is both analytical and judgmental process that helps
answer the questions that have been proposed posed. Therefore, it is a means to an
end. One can stress enough that financial analysis is an aid that follows those who are
responsible for results to sound decision. (Erich, 1997: 2)
The first step involves the re-organization of rearrangement of entire financial
data as constrained in the financial statements.
The next step is the establishment of significant relationship between the
individual components of balance sheet and profit and loss A/C.

6
Finally, significant of results obtained by means financial tools is evaluated.
This requires establishment of standards against which actual are evaluated
with respect to the type of financial analysis distinction can be made either on
the basis of material used or by using modus operandi of analysis or on the
object of analysis. The following chart gives a snapshot view of it. (Kumar,
1994: 48)
Figure 2.1
Types of financial analysis
2.1.2 Importance of financial performance analysis
The analysis and interpretation of financial statement is an important accounting
activity. There are different parties interested in it. The aims and objectives of
analysis also differ significantly. The following are the uses of financial statement
analysis to different parties.
Financial executives
Top management
Creditors
Investors and Other
Types of financial analysis
According to material used
External analysis
Internal analysis
Horizontal
Vertical
According to operandi analysis
According to objective of analysis
Long term Short term
1. Solvency
2. Stability
3. Profitability
1. Working capital position
2. Profitability
3. Return analysis
7
a) Financial executives
The first party interested in the financial statement analysis is the finance department.
Such analysis provides a deep insight into the financial condition of the enterprises,
and a view of the past performance, which helps in future decision making to the
financial manager. The analysis not only gives vital information concerning the
position of the enterprises but also reflects the results of the operations (Pandey, 1992:
17).
b) Top management
The top management is also interested in the analysis of statement because it helps
them in reaching conclusions regarding.
Performance appraisal of overall business activities
Inquiry about the current financial position
Questions concerning the relationship of earning to trend in sales etc and
Questions concerning the relationship of earnings to investment
c) Creditors
The financial analysis is also very useful to creditors. They are interested to know
over all financial positions of the firm before giving loan. Moreover, they get all
information from the analysis of balance sheet and income statement of the company.
The financial performance indicates the financial position and it helps to judge the
soundness and credit worthiness of the firms (Pandey, 1992: 17).
d) Investors and others
Investors are also interested in the measurement of earning capacity of the securities.
They are concerned with cash generations capacity of an enterprise. For this purpose,
cash flow analysis and funds flow analysis have proved to be very useful. Besides, the
above-mentioned parties, the information provided by the analysis and interpretation
of various financial statements are important and useful to these groups who are
interested in the working of the business due to one and the other motive. They are
employees, unions, government, consumers and general public of the business. (Rana,
2056: 11)

8
2.1.3 Sources of judging financial performance
The firm communicates financial indication to users through financial statements and
reports. They are the means to present financial situation or position to owners,
creditors and the general public. (Pandey, 1992: 17). As these statements are used by
investors and financial analysis to examine the firms' performance resource allocation
decision. Moreover, the analysis and interpretation of financial statements depend on
the nature and type of information available therein.
Basically, there are two financial statements prepared for the purpose of external
reporting to owners, investors and creditors, which are main source for judging
financial position. They are:
a) Balance Sheet
b) Income Sheet
a) Balance sheet
The balance sheet is a document that reports the financial position of a company as of
specific point of time. It is one of the most significant financial statements for analysis
of financial performance.
In the language of accounting, the balance sheet communications information about
assets, liabilities and owner's equity for a business firm as on a specific date. It
provides a snapshot of financial position of the firm at the close of the firm's
accounting period. (Rana, 2056: 11)
Balance sheet is a screen picture of financial position of a going business at certain
moment. It is also known a statement of financial condition, position statement or
statement of resources and liabilities or statement of worth etc.
In this way, it can be said that balance sheet is a summary statement and comparative
record of the progress as downfall of the business. It shows the clear picture of the
financial position of business as well as the assets liabilities of business, the relative
proportion of borrowed and ownership capital, etc which are necessary to analyzed
and evaluated their financial position of particular period. Hence, this is one of the
important resources to examine financial weakness or strengths using different tools
of any business firm especially the banks.
b) Income statement
The second major statement for sources of financial information is income statement.
It is also known as profit and loss account. It may be defined as any systematic array

9
of revenues, expenses and other deductions, and net income of a business for a stated
period. Furthermore, income statement is an abstract portrayal of the life of the
business presenting a longitudinal picture of the gains and losses of the business, its
fortunes and misfortunes. (Kumar, 1994: 15)
In conclusion, these two financial statements, i.e. balance sheet and income statement
or profit and loss account of business firm contain useful information, so they are very
helpful to know the financial strengths and weaknesses by analyzing those
statements comparatively. They are not separate and independent statements, but are
related to each other. Thus, both have vital role in the field of financial performance
analysis.
2.1.4 Methods of analyzing and evaluating financial performance
In this analysis, various methods are used by the financial analyst. Most of the tools
depend on the nature and characteristics of related statements and available data and
information. Generally, there are financial and statistical methods to evaluate and to
analyze, which are started together.
Funds-flow analysis
Cash-flow analysis
Trend analysis
Ratio analysis
a) Funds-flow analysis
This statement is prepared to summarize the changes in assets and liabilities resulting
from financial and investment transaction during the period as well as those changes
occurred due to change in owner's equity. It is also aimed to depict the way in which
the firm used its financial sources during the period.
In other side, fund flow statement is one of the flow valuable techniques to evaluate
financial pattern. Mostly, this statement is prepared to achieve following objectives:
To provide information on all financing and investing activities of a
business.
To show the use or application of financial resources.
To show the uses financial resources provided from operation and other
sources, and
To disclose the amount and cause of all other changes in financial position.

10
b) Cash flow analysis
The main objective of cash flow analysis is to show the cause of change in cash
balances. It provides information about cash and availability of cash to management
when it is interested to know. Cash flow analysis is not only concerned with the good
or bad management of cash, it is deeply concerned with the liquidity position of the
firm. Since cash flow statement is made to show the impact of financial policies and
financial procedures on the cash position of the firm. In short, cash flow analysis is
importance in short ranges planning and it always helps the management in short term
financial decisions relating to liquidity (Kumar, 1994: 15)
c) Trend analysis
It is an important and useful technique to analyze and interpret the financial statement.
Under this technique of financial analysis, the ratios of different items for various
periods are calculated and then a comparison is made. This method is basically
helpful in making comparative study of financial management. Generally, a period of
five years is considered satisfactory. This method of analysis involves the
computation of percentage relationship that each statement item bears same to the
same items in the base of year. Trend analysis shows the direction progress upward or
downward. It is an important form of horizontal analysis of financial statements often
called as 'Pyramid Method' of ratio analysis.
Moreover, in this method, a statement is used to analyze the base of another reference
statement. Other method of analysis is the calculation of trend ratio and showing trend
value on graph paper. On the other hand, trend analysis is not out of limitations. Price
level changes may affect it and the selection of base year may create variation.
Besides, it is important for its utilities which are:
It is a simple technique. It does not involve tedious calculations and requires
trained experts.
It is a brief method to indicate the future trends.
It reduces the changes of errors as it provides the opportunity to compare the
percentages with absolute figure.
A financial analyst is able to judge the present position of the company and to
compare it with the overall trend in industry.

11
d) Ratio analysis
Ratio analysis is used for judgment financial performance of business concern over
the period of time. It helps to find out the financial positions of the firm and also
supports to provide necessary suggestion package for the betterment. Thus, economic
financial position/ performance of a firm can be fully x-rayed through ratio analysis.
In this way, the ratio analysis is widely used techniques to evaluate the financial
position and performance of a business. But there are certain problems in using ratios.
The analyst should be aware from those problems. The limitations of ratio analysis
basically are:
Ratios do not indicate immediately the point where the mistakes or errors lies.
The price level changes make the interpretation of ratios invalid.
The ratios are means not needs of financial analysis. They can be affected with
the personal ability of analysis.
Conclusions drawn with the help of ratios should be verified with other
techniques otherwise result may not perfect.
It is generally calculated from past financial statements and thus are no
indicators of future.
The number of various ratios is so large that it is very difficult task to select
same appropriate ratios for the various business units.
2.2 Review of previous studies
For the preparation of this thesis some books, report, publication, theses and articles
will be reviewed. Various master level theses conducted in different aspects of
commercial bank such as lending policy, liquidity position, interest rate structure,
capital structure, investment policy etc. are reviewed and findings of some relevant
theses have been mentioned hereunder.
2.2.1 Review of journal articles
After liberalization and globalization of the world economy the economic transactions
such as trading and commerce, industrial and banking activities have grown up
tremendously. Likewise, an international trade of the development countries has also
boosted up. But on the other hand, the increasing competitiveness has also increased
various types of risks in every business, including banking sectors, especially in

12
foreign exchange transactions. To cope with their risks, the banks in favour of their
clients have adopted strategies relating to treasury management. (Shrestha, 2055: 20)
"Commercial bank is a dealer in money and substitutes for money, such as cheque or
bill of exchange. It also provides a variety of financial services." (The New
Encyclopedia Britannica, 1985: 600)
"A Bank is a business organization that receives and hold deposits of funds from
others make loans or extend credits and transfer funds by written order of deposits'.
(The New Encyclopedia Americana, 1984: 75)
The article of Mr. Sunil Chopra concluded that Joint venture banks are already
playing an increasing dynamic and vital role in the economic development of the
country. This will undoubtedly increase with time. (Chopra, 2046: 45)
Likewise, another article of Mr. Gilles Serra concluded that the five commercial
banks were improving their services, due to the pressure of competition for the public
benefit.
2.2.2 Review of theses
Various master level theses conducted in different aspects of commercial bank such as
lending policy, liquidity position, interest rate structure, capital structure, working
capital management, investment policy etc. are reviewed and findings of some
relevant theses have been mentioned hereunder.
Aryal, O. P. (2008) through the thesis, 'Financial Performance of Everest Bank
Limited' he describes the future in banking sector that will be more competitive with
quality and speedy service. Banks have to provide quality service and they need to
attain objectives along with maintaining good financial position to sustain in market.
Bajarcharya, P. D. (2009) had conducted a research on a topic "Performance
Evaluation of Nepal Bank Ltd." The basic objectives of her study/research were to
highlight the financial performance and role of banks in the liberalized Nepalese
Economy. Her attempts of analyzing financial performance were concentrated in ratio
analysis and she derived the strength and weakness of banks as stated by calculating
ratios.
Bhandari, Mukunda (2010) through his thesis ‘A Comparative Financial Performance
Analysis of Himalayan Bank Ltd. and Everest Bank Ltd.’ He conclude that,

13
Establishment of commercial banks especially joint venture banks have continued in
response to the economic liberalization policies of the government. So, now in Nepal
there are twenty six (research period) commercial banks competing with each other in
their business. These joint venture banks are mainly concentrated themselves on
financing foreign trade, commerce and industry. This study has been mentioned
already that the research concentrates.
Shrestha, Leshkumar (2010) had conducted a research on a topic ‘A study on financial
performance of agriculture development bank limited (ADBL)’. The summary of his
study/research were to banking sector plays an important role in the economic
development of the country. It provides an effective payment and credit system,
which facilitates the channeling of funds from the surplus and deficit in the economy.
Investment operation of commercial banks is a very risky one. For this, financial
performance of commercial banks have to pay due consideration while Investment,
mobilization of fund and use of resources. A healthy development of any Commercial
bank depends upon its financial performance. A good financial performance of a bank
attracts both the borrowers and the lenders, which helps to increase the volume of
quality deposits and investment.
Zaman, Afroja (2018) had conducted his research on ‘Financial Performance Analysis
Of Jamuna Bank LTD.’ This thesis conclude that Jamuna Bank Ltd. started with a
vision to be the most efficient financial intermediary in the country and it believes that
the day is not far off when it will reach its desired goal. JBL looks forward to a new
horizon with a distinctive mission to become a highly competitive modern and
transparent institution comparable to any of its kind at home and abroad. Jamuna
Bank Limited has been working with great confidence and competing tremendously
with Government oriented bank, local commercial banks along with the multinational
banks also. Jamuna Bank Limited always tried its level best to perform financially
well.
2.3 Research gap
Many research studies have been conducted by the different students, experts and
researchers about financial performance of banks. There are numerous research
studies on financial companies and public enterprises regarding financial
performance. Some studies are related to case study of a single company and some

14
others are comparative in nature. This thesis is concerned with joint-venture bank.
This study covers the period of fiscal year 2013/14 to 2017/18. The financial and
statistical tools used by most of the researchers are ratio analysis, test of hypothesis
and regression analysis. This research includes different tools like ratio analysis,
correlation analysis and trend analysis as specific tools and analyze profitability,
utilization of assets in generating interest earning, liquidity position and deposit
sources and its contribution on profit.
This research study on “Financial Performance of EBL” is an effort to analyze in
detail the financial performance of banks as a study at present with the help of various
financial as well as statistical tools and techniques. The study can be beneficial to all
the concerned parties and people.
Chapter - 3
Research methodology
Brief description of commercial banks has been done in earlier chapter. Objective
behind this study is to evaluate the financial performance of Everest Bank Limited.
This chapter includes methods and techniques used for evaluating the financial
performance of EBL.
3.1 Research design
The objective of this research study is to examine and evaluate the financial
performance of joint venture bank especially that of EBL in order to achieve the
objective: liquidity positions of the EBL, leverage positions of the EBL, how
effectively EBL uses its operating assets and level of profitability of EBL. Both
descriptive research design has been followed. This research work followed, liquidity
ratios, leverage ratios, activity ratios and profitability ratios of the bank to find out the
financial positions of the bank. The study focuses on the examination of relationship
between those variables that influence financial decisions of the sampled, it is an ex-
post factor research. From concerned bank different information and necessary data
were collected through annual reports and financial statement published by related
bank. The data are collected from the year 2013/14 to 2017/18.
3.2 Population and sample
Population
There are twenty-eight commercial banks operating in Nepal (Key Financial
Indicators of Commercial Banks (Provisional) as on Chaitra end, 2075 (Mid-Apr
2019).
The population for this study comprises the joint venture banks. The sample consists
of one randomly selected among joint venture banks.
Sample of this study
Everest Bank Limited is selected as sample in this study.
3.3 Source of data
This study is based on secondary data. The sources of data collection are financial
statement annual reports provided by bank, articles and other related materials

16
published in newspaper, newsletters of the bank, web sites
(http://www.everestbankltd.com) and other related books.
3.4 Data collection techniques
The study has been conducted to examine and evaluate the financial performance of
EBL. For this purpose, various data are required. The researcher made visit of web
sites of EBL for collecting data from the provided annual report of last five years.
Confusions regarding the financials were solved by the account department of EBL.
The researcher obtained annual and periodic report and banking directives from Nepal
Rastra Bank, Baluwatar. Various websites were surfed to gather relevant information.
Reference materials were collected from libraries of Central Department of
Management and T. U. Central Library Kirtipur, which helped a lot in conducting the
study. The data, information, facts, and figures have been edited tabulated and
calculated before analysis. Then results were concluded and interpretations were
made.
3.5 Data processing
According to the nature of data they have been inserted into meaningful related tables.
Homogeneous data have been sorted in the table in well understandable manner.
Using financial and statistical tools data have been analyzed and interpreted.
3.6 Data analysis tools
This study is basically based on secondary data, which were firstly collected, scanned,
and tabulated under various heads. The calculated results were then compared and
interpreted. Suitable tools and proper analysis make data effective. The data collected
and processed have been analyzed using financial and statistical tools. The financial
ratio is widely used tool for the analysis and interpretation of the performance of the
data selected sample. Simple statistical analysis is used where necessary.
3.6.1 Financial tools
Financial tools are used to get the precise knowledge of a business which in turn is
fruitful in exploring the strengths and weakness of the financial policies and
strategies. These tools are used for the analysis and interpretation of financial data.
17
3.6.1.1 Liquidity ratios
A liquid asset is one that can be easily converted to cash without significant loss of its
original value. Therefore, a firm's "liquidity position" deals with the question of how
well the firm is able to meet its current obligations. Liquidity ratio is the ratio that
shows the relationship of a firm's cash and other current assets to its current liabilities.
Liquidity ratios measures the short-term solvency position of the firm. These ratios
are calculated to find the ability of banks to meet their short-term obligations which
are likely to mature in the short period of time. Depending upon special nature of
assets and service sale made by the bank following ratios are tested. (Weston, Besley
and Brigham, 1996, P-94).
The liquidity ratios are calculated on: current ratio, cash and bank balance to current
and saving deposit ratio, cash and bank balance to total deposit ratio, NRB balance to
current and saving deposit ratio, NRB balance to fixed deposit ratio and fixed deposit
to total deposit ratio.
3.6.1.2 Leverage ratio
Leverage ratios are judging the long-term financial position of the firm. It evaluates
the financial risk of long-term creditors. Greater the proportion of the owner's capital
in the capital structure lesser will be the financial risk borne by has legal obligation to
pay interest to debt holders irrespective of the profit or loss incurred by the firm.
The extent, to which a firm uses debt financing or financial leverage, has three
important implications:
1. By raising funds through debt, stockholder ownership is not diluted.
2. Creditors loud to equity, or owner supplied funds, to provide a margin of
safety, if the stockholders have provided only a small proportion of total
financing the risks of the enterprises are borne mainly by creditors.
3. If the firm earns more on investments financed with borrowed funds than it
pays in interest, the return on the owner's capital is magnified, or "leveraged".
(Weston, Besley and Brigham , (1996), P-990)
The firm should maintain optimal mix of investor's and outsider's fund for the benefit
of owners and its stability. Following ratios are used to test the optimally of capital
structure of EBL.
The leverage ratios are calculated on: debt asset ratio, debt equity ratio and interest
coverage ratio.

18
3.6.1.3 Activity ratio
This ratio measures the efficiency of the firms. Activity ratio is set of ratios that
measure how effectively a firm is managing its assets. Activity ratio is also known as
utilization ratios or turnover ratios or asset management ratios or effectively ratios.
They measure how effectively the firm uses investment and economic resources at its
command. High ratio depicts the managerial efficiency in utilizing the resources.
They show the sound profitability position of the bank. Low ratio is the result of
insufficient utilization of the resources.
To find the activity ratios of EBL are: loans and advances to total deposit ratio, loans
and advances to fixed deposit ratio, loans and advances to saving deposit ratio,
investment to total deposit ratio, performing assets to total assets ratio and performing
assets to total debt ratio.
3.6.1.4 Profitability ratio
Profit is essential for the survival of the business, so it is regarded as the engine that
drives the business and indicates economic progress. Profitability is an indicator of
efficiency of the business organization. Profitability is the net result of a number of
policies and decisions. Profitability ratio measures the managements overall
efficiency as shown by the return generated from sales and investment. A company
should earn profits to survive and grow over a long period of time. It is a fact that
sufficient profit must be earned to sustain the operations of the business to be able to
obtain funds from investors for expansion and growth, and to contribute towards the
social overheads for the welfare of society. The profitability ratios are calculated to
measure the operation efficiency of the business. Management of the business,
creditors and owners are interested in the profitability of the firm. Profitability ratios
are designed to highlight the end-result of business activities which in the imperfect
world of ours, is the sole creation of overall efficiency of business unit.
Profitability ratios of EBL are computed as: return on total asset, return on total
deposit, total interest expenses to total interest income ratio, interest earned to total
asset ratio, office operation expenses to total income ratio and staff expenses to total
income ratio
19
3.6.1.5 Other ratios
3.6.1.5.1 Earning performance ratio
The price to earnings ratio indicates the expected price of a share based on its
earnings. As a company's earnings per share being to rise, so does their market value
per share. A company with a high P/E ratio usually indicated positive future
performance and investors are willing to pay more for this company's shares.
To find the earning performance ratios of EBL are: earnings per share (EPS), dividend
payout ratio (DPR) and price earnings ratio (P/E Ratio).
3.6.1.5.2 Income and expenditure analysis
Using income and expenditure analysis major sources of income and expenses are
evaluated. This helps the analyst to conclude the areas to be focused for investment
and the possibilities for effective control over expenses.
3.6.2 Statistical tools
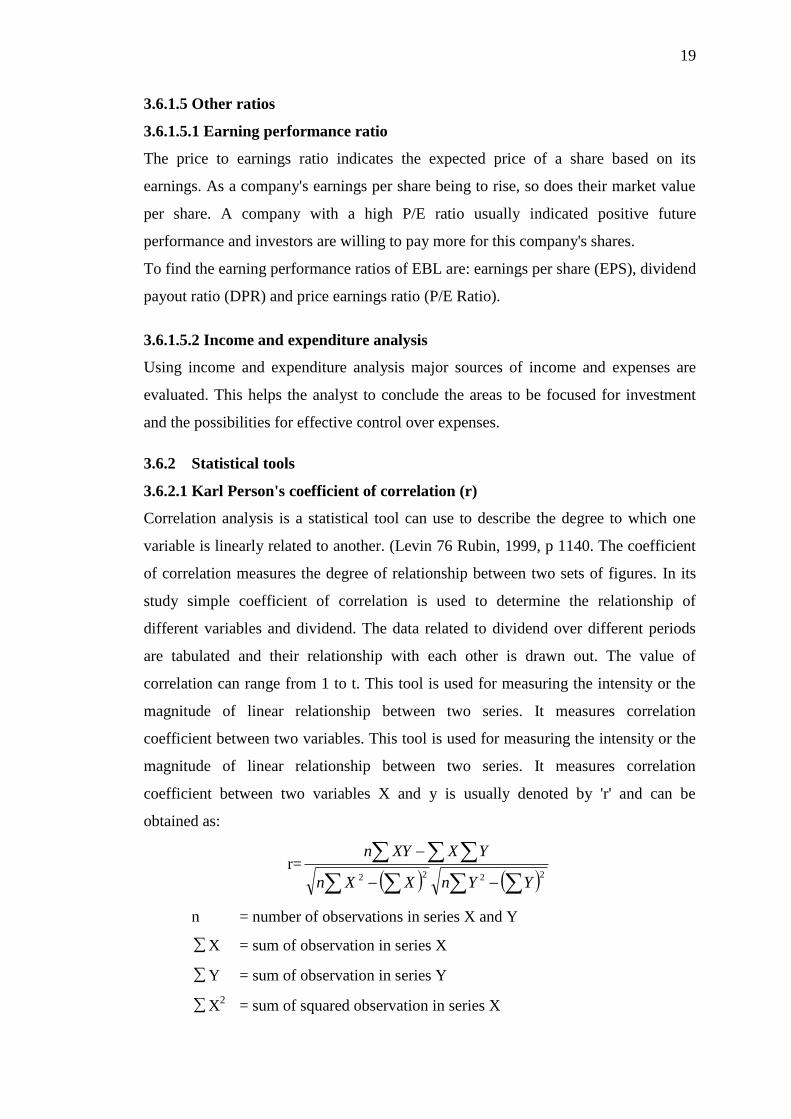
3.6.2.1 Karl Person's coefficient of correlation (r)
Correlation analysis is a statistical tool can use to describe the degree to which one
variable is linearly related to another. (Levin 76 Rubin, 1999, p 1140. The coefficient
of correlation measures the degree of relationship between two sets of figures. In its
study simple coefficient of correlation is used to determine the relationship of
different variables and dividend. The data related to dividend over different periods
are tabulated and their relationship with each other is drawn out. The value of
correlation can range from 1 to t. This tool is used for measuring the intensity or the
magnitude of linear relationship between two series. It measures correlation
coefficient between two variables. This tool is used for measuring the intensity or the
magnitude of linear relationship between two series. It measures correlation
coefficient between two variables X and y is usually denoted by 'r' and can be
obtained as:
r=
2222 YYnXXn
YXXYn
n = number of observations in series X and Y
X = sum of observation in series X
Y = sum of observation in series Y
X2 = sum of squared observation in series X

20
Y2 = sum of squared observation n series y
XY = sum of the product of observations in series X and Y
Value of r lies between -1 and +1
r = 1 implies that there is a perfect negative correlation between the
variables
r = 0 means that the variables are uncorrelated
3.6.2.2 Probable Error of Correlation Coefficients ®
Probable error of correlation coefficient tests the reliability of n observed value of
correlation coefficient. It shows the extent to which correlation coefficient is
dependable as it depends upon the condition of random sampling.
Probable error of correlation coefficient is denoted by P.E 9r) and obtained as:
P.E (r) = 0.6745 x n
r21
The probable error is used to test whether the calculated value of sample correlation
coefficient is significant or not. (Shara 7 Chaudary, 2058 b.S., p-411)
A few rules for the interpretation of the significance for correlation coefficient are as
follows;
I. if < p.E. ®, then the value of r is not significant (i.e.) insignificant
II. If > P.E. ®, then r is definitely significant
III. In other situations, nothing can be calculated with certainty
3.6.2.3 Least Square linear Trend
Trend analysis is a very useful and commonly applied tool to forecast the future event
in quantitative term on the basis of the tendencies in the dependent variable in the past
period. Straight line trend implies that irrespective of the seasonal, cyclic and irregular
fluctuation the trend value increases or decreases by absolute amount per unit of time.
The linear trend values form a series in arithmetic progression.
Mathematically
Y=a+bx
Where Y=value of dependent variable
a = Y- intercept
b = slope of the trend line
X = value of the independent variable i.e. time

21
Normal equations fitting above are
XbNaY
2XbXaXY
Since 0X
a = Y/N
b = XY/X2
Chapter - 4
Data presentation, analysis and interpretation
This chapter deals with the analysis and interpretation of data according to the
research methodology to attain the objectives of this study. During analysis data
gathered from various sources have been inserted in tabular form. Using financial and
statistical tools the data have been analyzed.
4.1 Ratio analysis
The technique of ratio analysis has considerable significance in studying the financial
stability, liquidity, profitability of the firm. It has been used to evaluate the financial
health, operating result and growth of the EBL.
4.1.1 Liquidity analysis
a. Current ratio
This ratio is called working capital ratio. It is calculated by dividing current assets by
current liabilities and 2:1 is regarded as standard. Current assets are those assets
which are convertible in cash within a year or so.
Current ratio = sLiabilitieCurrent
AssetsCurrent
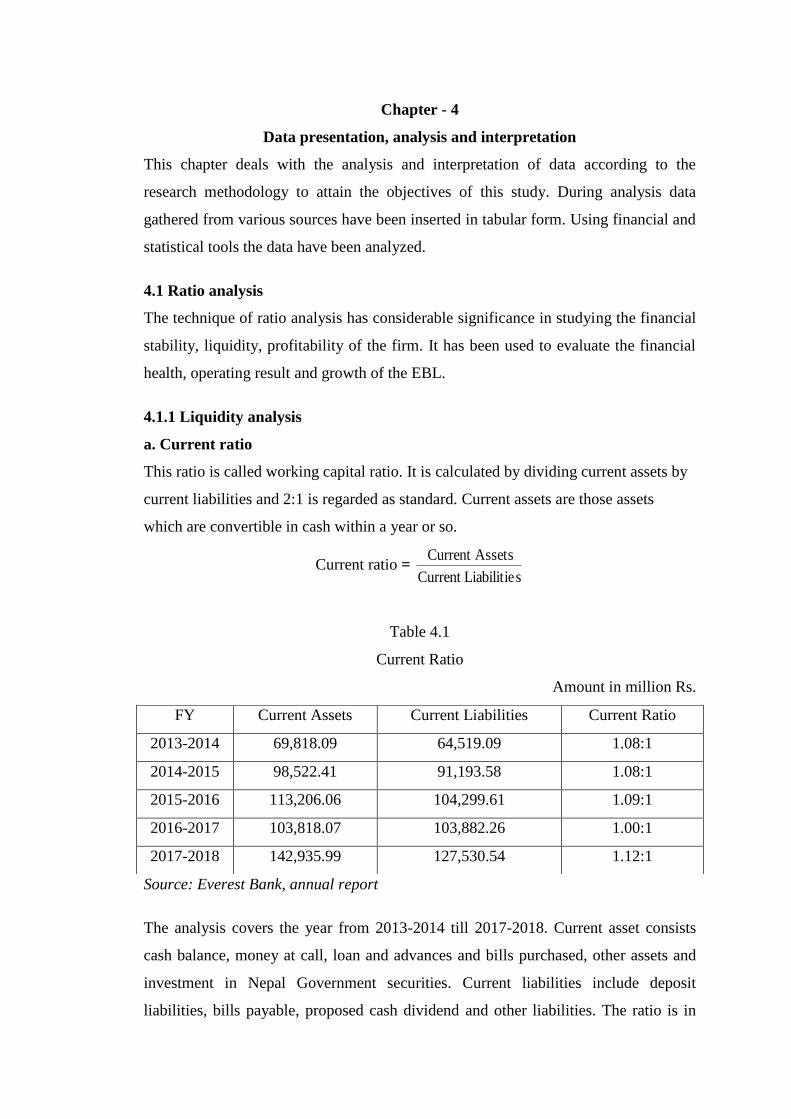
Table 4.1
Current Ratio
Amount in million Rs.
Source: Everest Bank, annual report
The analysis covers the year from 2013-2014 till 2017-2018. Current asset consists
cash balance, money at call, loan and advances and bills purchased, other assets and
investment in Nepal Government securities. Current liabilities include deposit
liabilities, bills payable, proposed cash dividend and other liabilities. The ratio is in
FY Current Assets Current Liabilities Current Ratio
2013-2014 69,818.09 64,519.09 1.08:1
2014-2015 98,522.41 91,193.58 1.08:1
2015-2016 113,206.06 104,299.61 1.09:1
2016-2017 103,818.07 103,882.26 1.00:1
2017-2018 142,935.99 127,530.54 1.12:1

23
increasing trend; except in the year 2013/14 where it is 1.08 times. The current ratio is
below the conventional standard 2:1 however looking at the nature of assets and
liabilities of the commercial banks the ratio bellows the standard may be accepted as
satisfactory. The bank may face the problem of working capital if they need to pay the
current liabilities at demand. Banks may lose their goodwill in case of delay in the
payment liabilities. Bank will have the problem in winning the confidence of current
depositors and short-term lenders. But in year 2017/18 it was closer to conventional
standard and current ratio seems to be satisfactory.
Figure - 4.1
Current Ratio
The figure 4.1 shows the trend behaviors of current assets with current liabilities of
EBL along with a trend line. According the figure current assets with current
liabilities parallel increased both. In other words, current assets with current liabilities
will increase with higher the rate for coming five years if the past trend continues.
b. Cash and bank balance to current and saving deposit analysis
It measures the ability of bank to meet its immediate obligations. The bank should
maintain adequate cash and bank balance to meet the unexpected and heavy
withdrawal of deposits.
Cash & Bank Balance to Current & Saving Deposit Ratio: =
DepositSavingCurrent
BalanceBankCash
&
&
0
20000
40000
60000
80000
100000
120000
140000
160000
2013-2014 2014-2015 2015-2016 2016-2017 2017-2018
Am
ou
nt
in m
illio
ns
Current Assets
Current Liabilities
Fiscal year

24
Table 4.2
Cash and Bank Balance to Current and Saving Deposit Ratio
Amount in million Rs.
FY Cash & Bank Balance Current & Saving Deposit Ratio
2013-2014 13,172.78 32,979.57 39.94%
2014-2015 25,116.48 39,685.55 63.29%
2015-2016 23,117.39 47,279.51 48.90%
2016-2017 21,383.49 44,423.59 48.14%
2017-2018 32,295.17 39,442.42 81.88%
Source: Everest Bank, annual report
Table 4.2 depicts that first two years the ratio was in increasing trend then it increased
to 63.29% in year 2014/15, again it falls to 48.90% in FY 2015/16. The ratio constant
to 48.14% in year 2016/17 then after in the year 2016/17 it decreased to 48.15% and
again it slightly increased to 81.88% in the year 2017/18 as cash and bank balance
increases from Rs. 21,383.49 to Rs. 32,295.17. From table 4.2 it can be observed than
EBL may not be able to meet its immediate obligation as the bank balance is
significantly lower than the current and saving deposit.
Figure: 4.2
Cash and Bank Balance with Current and Saving Deposit
The figure 4.2 shows the trend behaviors of cash and bank balance with current and
saving deposit of EBL along with a trend line. According the figure cash and bank
0
10000
20000
30000
40000
50000
60000
70000
80000
2013-2014 2014-2015 2015-2016 2016-2017 2017-2018
Am
ou
nt
in M
illio
n
Fiscal Year
Current & Saving Deposit
Cash & Bank Balance

25
balance with current and saving deposit parallel increased both. In other words, cash
and bank balance with current and saving deposit will increase with higher the rate for
coming five years if the past trend continues.
c. Cash and bank balance to total deposit analysis
It indicates the proportion of total deposit held as most liquid assets. Optimum ratio
shows the strong liquidity position of the bank. High ratio is not favorable as it affects
profitability due to idleness of high-interest bearing fund.
Cash and Bank Balance to Total Deposit Ratio=
Table 4.3
Cash and Bank Balance to Total Deposit Ratio
Amount in million Rs.
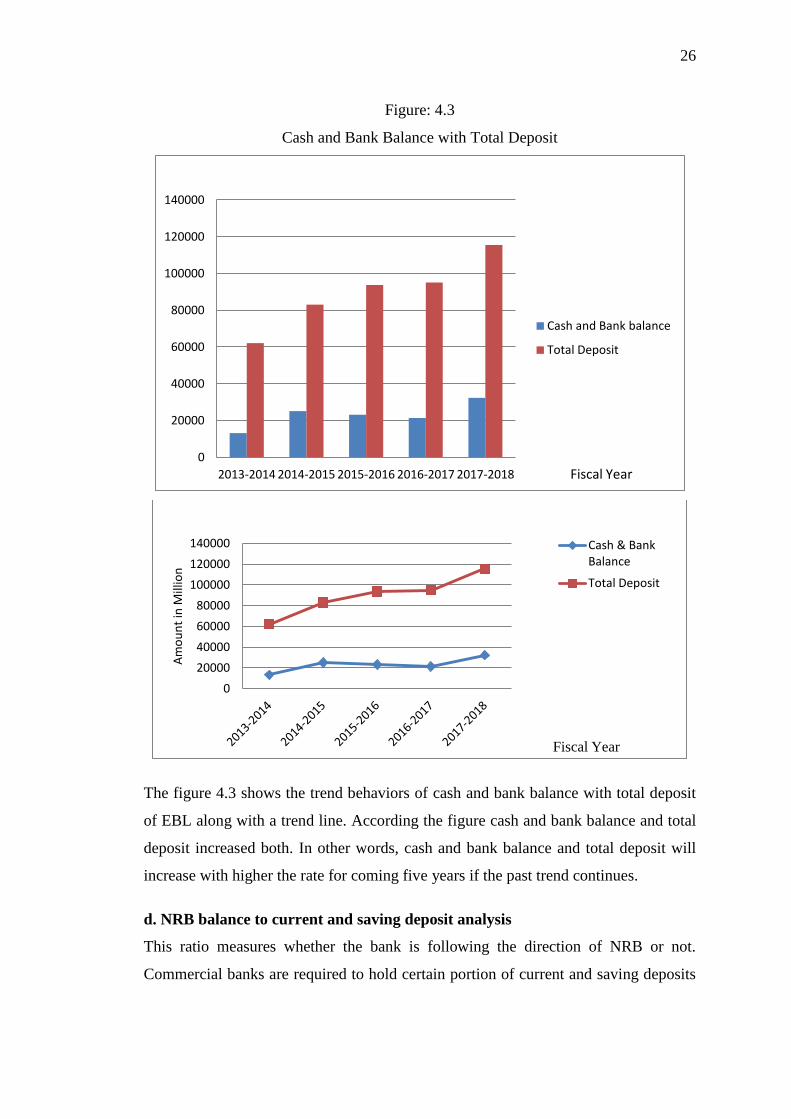
FY Cash & Bank Balance Total Deposits Ratio
2013-2014 13,172.78 62,108.14 21.21%
2014-2015 25,116.48 83,093.79 30.23%
2015-2016 23,117.39 93,735.48 24.66%
2016-2017 21,383.49 95,094.46 22.49%
2017-2018 32,295.17 115,511.71 27.96%
Source: Everest Bank, annual report
Total deposit includes current deposit, saving deposit, fixed deposit, call deposit and
other deposit. Analyzing the ratios, trend of the ratios appeared to be fluctuating. In
year 2014/15 it was in the peak and in year 2013/14 it is in its lowest point. In year
2013/14, though the total deposit has been increased to Rs. 62108.14 and cash and
bank balance to Rs. 13,172.78, it is still unsatisfactory. Highest ratio i.e. 30.23%
shows that the strong liquidity position of the bank in year 2014/15. Though high ratio
indicates its high liquidity position but it also affects profitability due to idleness of
high interest-bearing fund.
26
Figure: 4.3
Cash and Bank Balance with Total Deposit
The figure 4.3 shows the trend behaviors of cash and bank balance with total deposit
of EBL along with a trend line. According the figure cash and bank balance and total
deposit increased both. In other words, cash and bank balance and total deposit will
increase with higher the rate for coming five years if the past trend continues.
d. NRB balance to current and saving deposit analysis
This ratio measures whether the bank is following the direction of NRB or not.
Commercial banks are required to hold certain portion of current and saving deposits
0
20000
40000
60000
80000
100000
120000
140000
2013-2014 2014-2015 2015-2016 2016-2017 2017-2018 Fiscal Year
Cash and Bank balance
Total Deposit
0
20000
40000
60000
80000
100000
120000
140000
Am
ou
nt
in M
illio
n
Fiscal Year
Cash & Bank Balance
Total Deposit

27
in NRB's account. It is to ensure the smooth function and sound liquidity position of
the bank.
NRB balance to current & saving deposit ratio=
Table 4.4
NRB balance to current and saving deposit ratio
Amount in million Rs.
FY NRB Balance Current & Saving Deposit Ratio
2013-2014 9,446.92 32,979.57 28.64%
2014-2015 17,126.16 39,685.55 43.15%
2015-2016 13,356.02 47,279.51 28.25%
2016-2017 14,577.08 44,423.59 32.81%
2017-2018 26.71 39,442.42 0.07%
Source: Everest Bank, annual report
The ratio is calculated by dividing NRB deposit by current and saving deposit. The
ratio showed fluctuating trend in the period of the study. It ranged from the minimum
of 0.07% in the year 2017/18 to maximum of 43.15% in the year 2014/15. Though the
bank followed the directive of NRB, in all the years it remained higher than 8%, the
minimum standard set by NRB. In year 2014/15 the ratio was in the highest position
which reveals idle cash. Idle cash affect the profitability as it earns nothing.
Figure: 4.4
NRB balance to current and saving deposit ratio
0 5000
10000 15000 20000 25000 30000 35000 40000 45000 50000
Am
ou
nt
in M
illio
n
Fiscal Year
NRB Balance
Current & Saving Deposit
28
The figure 4.4 shows the trend behaviors of NRB balance with current and saving
deposit of EBL along with a trend line. According the figure NRB balance with
current and saving deposit downward at the end of study period both. In other words,
NRB balance with current and saving deposit will decrease with higher the rate for
coming five years if the past trend continues.
e. NRB balance to fixed deposit ratio analysis
This ratio shows the percentage of amount deposited by the bank in NRB as compared
to the fixed deposits. As per directive 2072 of NRB, this ratio should be 6%.
This ratio is computed by dividing the balance held with NRB by Fixed deposit as
follows
NRB balance to fixed deposit ratio =
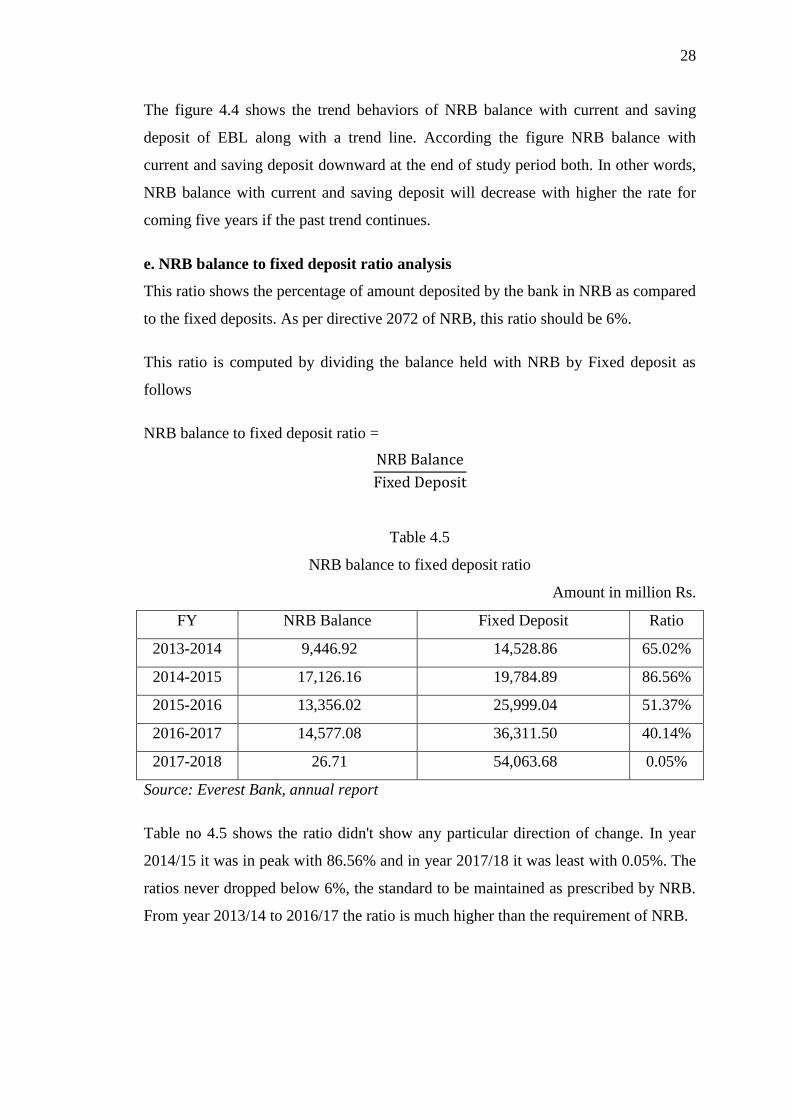
Table 4.5
NRB balance to fixed deposit ratio
Amount in million Rs.
FY NRB Balance Fixed Deposit Ratio
2013-2014 9,446.92 14,528.86 65.02%
2014-2015 17,126.16 19,784.89 86.56%
2015-2016 13,356.02 25,999.04 51.37%
2016-2017 14,577.08 36,311.50 40.14%
2017-2018 26.71 54,063.68 0.05%
Source: Everest Bank, annual report
Table no 4.5 shows the ratio didn't show any particular direction of change. In year
2014/15 it was in peak with 86.56% and in year 2017/18 it was least with 0.05%. The
ratios never dropped below 6%, the standard to be maintained as prescribed by NRB.
From year 2013/14 to 2016/17 the ratio is much higher than the requirement of NRB.

29
Figure: 4.5
NRB balance to fixed deposit ratio
The figure 4.5 shows the trend behaviors of NRB balance to fixed deposit of EBL
along with a trend line. According the figure NRB balance decreased with to fixed
deposit increased to FY 2015/16 and thereafter it followed previous trend both.
f. Fixed deposit to total deposit ratio
This ratio indicates that what percentage of total deposit has been collected in form of
fixed deposit. High ratio indicates better opportunity available to the bank to invest in
sufficient profit generating long term loans.
This ratio is computed by dividing fixed deposit by total deposit as follows;
Fixed deposit to total deposit =
0
10000
20000
30000
40000
50000
60000
2013-2014 2014-2015 2015-2016 2016-2017 2017-2018
Am
ou
nt
in M
illio
n
Fiscal year
NRB Balance
Fixed Deposit
30
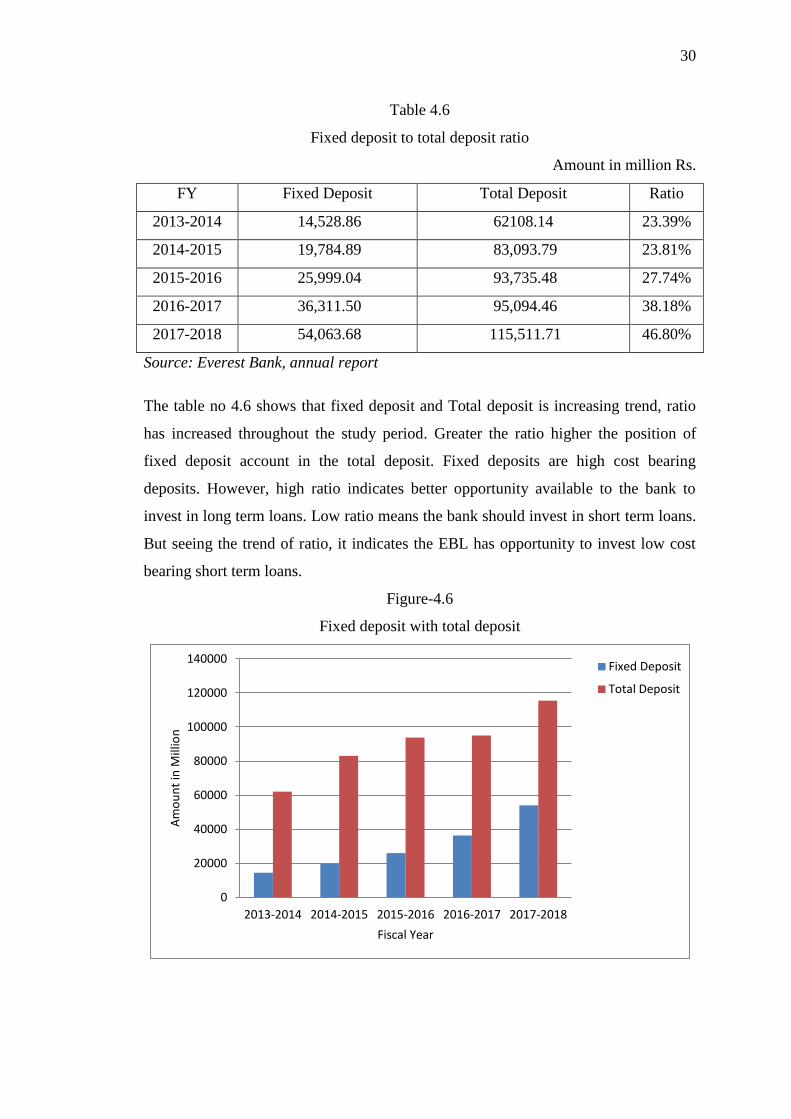
Table 4.6
Fixed deposit to total deposit ratio
Amount in million Rs.
FY Fixed Deposit Total Deposit Ratio
2013-2014 14,528.86 62108.14 23.39%
2014-2015 19,784.89 83,093.79 23.81%
2015-2016 25,999.04 93,735.48 27.74%
2016-2017 36,311.50 95,094.46 38.18%
2017-2018 54,063.68 115,511.71 46.80%
Source: Everest Bank, annual report
The table no 4.6 shows that fixed deposit and Total deposit is increasing trend, ratio
has increased throughout the study period. Greater the ratio higher the position of
fixed deposit account in the total deposit. Fixed deposits are high cost bearing
deposits. However, high ratio indicates better opportunity available to the bank to
invest in long term loans. Low ratio means the bank should invest in short term loans.
But seeing the trend of ratio, it indicates the EBL has opportunity to invest low cost
bearing short term loans.
Figure-4.6
Fixed deposit with total deposit
0
20000
40000
60000
80000
100000
120000
140000
2013-2014 2014-2015 2015-2016 2016-2017 2017-2018
Am
ou
nt
in M
illio
n
Fiscal Year
Fixed Deposit
Total Deposit

31
The figure 4.6 shows the trend behaviors of fixed deposit with total deposit of EBL
along with a trend line. According the figure fixed deposit with total deposit increased
both. In other words, fixed deposit with total deposit will increase with higher the rate
for coming five years if the past trend continues.
4.1.2 Leverage ratio
Leverage ratios are judging the long-term financial position of the firm. It evaluates
the financial risk of long-term creditors. Greater the proportion of the owner's capital
in the capital structure lesser will be the financial risk borne by has legal obligation to
pay interest to debt holders irrespective of the profit or loss incurred by the firm.
Following ratios are used to test the optimally of capital structure of EBL.
a. Debt equity ratio
It is as test of long-term solvency of the bank. Debt equity ratio measures the relative
claims of creditors and owners against the assets of the bank. This ratio indicates the
relationship between debt and equity i.e. outsiders’ funds and shareholders funds
which are sometimes called as external and internal equities. It is calculated to
measure the extent of debt financing used in the business.
This ratio is computed by dividing total debt by shareholder's equity as follows:
Debt equity ratio =
-
20,000.00
40,000.00
60,000.00
80,000.00
100,000.00
120,000.00
140,000.00
2013-2014 2014-2015 2015-2016 2016-2017 2017-2018
Am
ou
nt
in M
illio
n
Fiscal Year
Fixed Deposit
Total Deposit
32
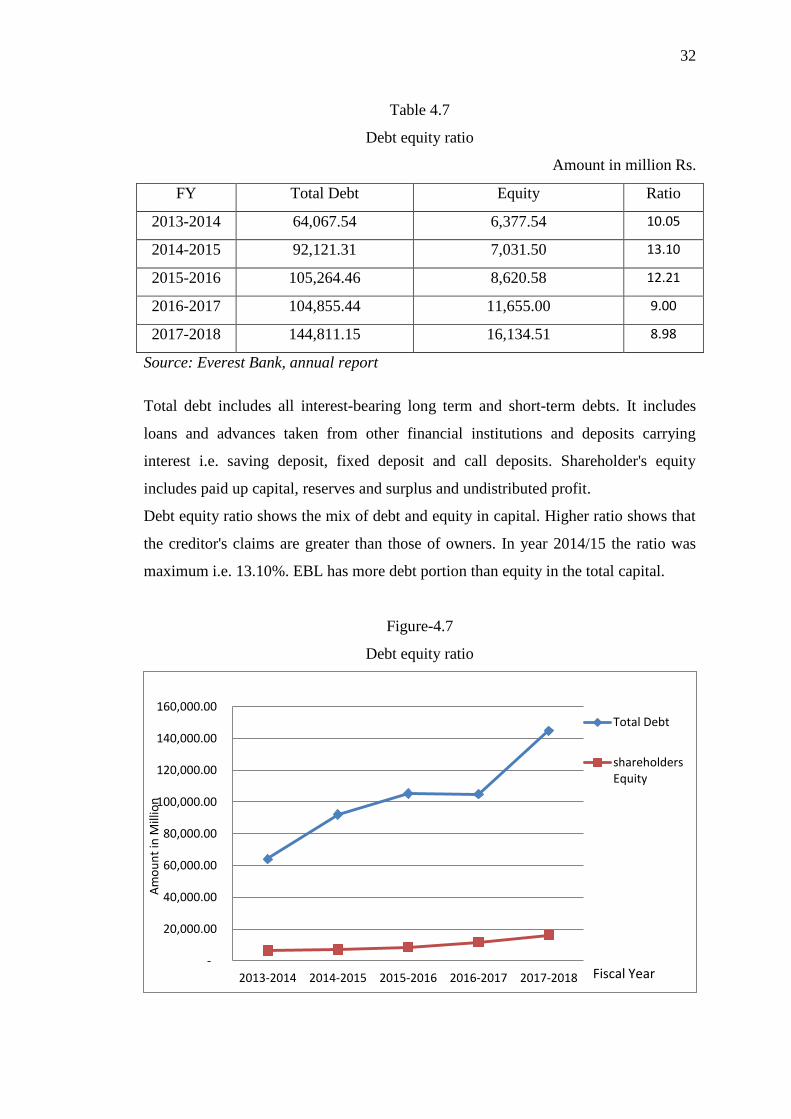
Table 4.7
Debt equity ratio
Amount in million Rs.
FY Total Debt Equity Ratio
2013-2014 64,067.54 6,377.54 10.05
2014-2015 92,121.31 7,031.50 13.10
2015-2016 105,264.46 8,620.58 12.21
2016-2017 104,855.44 11,655.00 9.00
2017-2018 144,811.15 16,134.51 8.98
Source: Everest Bank, annual report
Total debt includes all interest-bearing long term and short-term debts. It includes
loans and advances taken from other financial institutions and deposits carrying
interest i.e. saving deposit, fixed deposit and call deposits. Shareholder's equity
includes paid up capital, reserves and surplus and undistributed profit.
Debt equity ratio shows the mix of debt and equity in capital. Higher ratio shows that
the creditor's claims are greater than those of owners. In year 2014/15 the ratio was
maximum i.e. 13.10%. EBL has more debt portion than equity in the total capital.
Figure-4.7
Debt equity ratio
-
20,000.00
40,000.00
60,000.00
80,000.00
100,000.00
120,000.00
140,000.00
160,000.00
2013-2014 2014-2015 2015-2016 2016-2017 2017-2018
Am
ou
nt
in M
illio
n
Fiscal Year
Total Debt
shareholders Equity

33
The figure 4.7 shows the trend behaviors of total debt with total equity of EBL along
with a trend line. According the figure total debt with total equity increased both. In
other words, total debt with total equity will increase with higher the rate for coming
five years if the past trend continues.
b. Debt to asset analysis
This ratio measures the percentage of the firm's assets financed by creditors. Total
debt includes both current liabilities and long-term debt. Creditors prefer low debt
ratio because the lower the ratio, the greater the cushion against creditors' losses in the
event of liquidation.
The ratio is computed by dividing total debt by total assets as follows:
Debt Asset Ratio =
Table 4.8
Debt Asset Ratio
FY Total Debt Total Asset Ratio
2013-2014 64,067.54 70,445.08 90.95%
2014-2015 92,121.31 99,152.81 92.91%
2015-2016 105,264.46 113,885.05 92.43%
2016-2017 104,855.44 116,510.45 90.00%
2017-2018 144,811.15 144,811.15 100.00%
Source: Everest Bank, Annual Report
Total debt includes loans and advances taken from other financial institution and
deposit carrying interest i.e. saving deposit, fixed deposit account and call deposit.
Total assets consist of cash in hand, bank balance, money at call and short notice,
investments, loans, advances, bills purchase, fixed assets and other assets. The table
4.8 depicts the ratios from year 2013/14 to year 2015/16 the ratio is in increasing, in
year 2015/16 i.e. 92.43%. The larger portion of the bank asset has been financed
through outsider's fund. All the ratios are more than 50% which shows that more than
50% of the total asset has been financed by the outsider's fund.

34
Figure-4.8
Debt Asset Ratio
The figure 4.8 shows the trend behaviors of total debt with total assets of EBL along
with a trend line. According the figure total debt with total assets increased both. In
other words, total debt with total assets will increase with higher the rate for coming
five years if the past trend continues.
0
20000
40000
60000
80000
100000
120000
140000
160000
2013-2014 2014-2015 2015-2016 2016-2017 2017-2018
Am
ou
nt
in M
illio
n
Fiscal Year
Total Debt
Total Asset
-
20,000.00
40,000.00
60,000.00
80,000.00
100,000.00
120,000.00
140,000.00
160,000.00
2013-2014 2014-2015 2015-2016 2016-2017 2017-2018
Am
ou
nt
in M
illio
n
Fiscal Year
Total Debt
Total Asset

35
c. Interest coverage ratio
This ratio emphasizes the ability of the firm to generate enough income to cover
interest expenses. The ratio is obtained by dividing net profit before deduction on
interest and tax by interest charges as follows:
Interest Coverage Ratio=
Table 4.9
Interest Coverage Ratio
Amount in million Rs.
FY EBIT Interest Ratio
2013-2014 4,474.83 2,258.74 1.98
2014-2015 4,364.49 2,116.99 2.06
2015-2016 4,362.90 1,828.49 2.39
2016-2017 5,873.21 3,009.79 1.95
2017-2018 8,990.08 5,233.69 1.72
Source: Everest Bank, Annual Report
Earnings before interest and tax is being calculated by adding interest expenses,
provision for income tax and net profit from the profit and loss account for the
respective year of study period. Interest consists of interest paid on various deposits
and loans taken from NRB and other banks.
The ratio is fluctuating thorough out the years. It was almost static for two years
2014/15 to 2015/16 but it decreased in year 2016/17. Lower ratio indicates more use
of debt for which interest is to be paid or insufficient operation. The ratio has
increased in year 2015/16. But reviewing the trend of ratio, it is low.

36
Figure-4.9
Interest Coverage Ratio
The figure 4.9 shows the trend behaviors of EBIT with interest of EBL along with a
trend line. According the figure EBIT and interest increased both. In other words,
EBIT with interest will increase with higher the rate for coming five years if the past
trend continues.
4.1.3 Activity ratio
This ratio measures the efficiency of the firms. Activity ratio is set of ratios that
measure how effectively a firm is managing its assets. High ratio depicts the
managerial efficiency in utilizing the resources. They show the sound profitability
position of the bank. Low ratio is the result of insufficient utilization of the resources.
Following ratios are developed and calculated to find the activity ratios of EBL.
a. Loans and advances to total deposit ratio
This ratio measures the extent to which the banks are successful to mobilize their total
deposit on loan and advances. Loan and advances consist of loans, advances, cash
credit, over drafts and foreign bills purchased and discounted. The ratio indicates the
proportion of total deposits invested in loans and advances.
This ratio is obtained by dividing total loans and advances by total deposits as
follows:
Loan and advance to total deposit=
-
1,000.00
2,000.00
3,000.00
4,000.00
5,000.00
6,000.00
7,000.00
8,000.00
9,000.00
10,000.00
2013-2014 2014-2015 2015-2016 2016-2017 2017-2018
Am
ou
nt
in M
illio
n
Fiscal Year
EBIT
Interest

37
Table 4.10
Loans and advances to total deposit ratio
Amount in million Rs.
FY Loan and Advances Total Deposit Ratio
2013-2014 47,572.02 62,108.14 76.60
2014-2015 54,482.47 83,093.79 65.57
2015-2016 67,955.11 93,735.48 72.50
2016-2017 77,287.76 95,094.46 81.27
2017-2018 89,927.57 115,511.71 77.85
Source: Everest Bank, annual report
Loan and Advances consists of loans, advances, bills purchased and bills discounted.
The ratio fluctuated throughout the study period. The ratio indicated the proportion of
total deposits invested in loans and advances. In year 2016/17, 81.27% of the total
deposit was invested in loans and advances. In year 2014/15, 65.57% of the total
deposit was invested in loans and advances. This may have affected the liquidity
position of EBL. During the year 2013/14, 2016/17 and 2017/18 the ratios were
satisfactory. Too low ratio gives a picture of the ideal cash in the bank. As per
banking practice, banks maintain the ratio around 70-75%. In the year 2016/17, the
bank has the good ratio of 81.27% which shows that the bank is successful in utilizing
its deposits on loans and advances.
Figure-4.10
38
Loans and advances to total deposit ratio
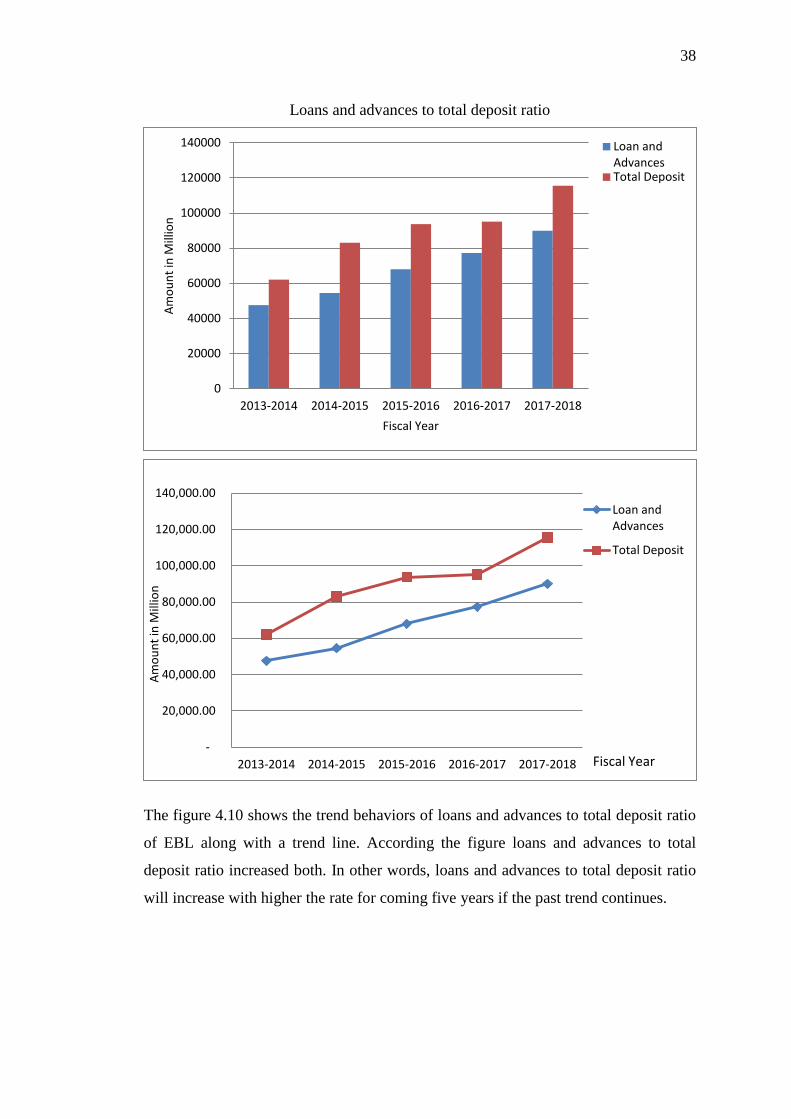
The figure 4.10 shows the trend behaviors of loans and advances to total deposit ratio
of EBL along with a trend line. According the figure loans and advances to total
deposit ratio increased both. In other words, loans and advances to total deposit ratio
will increase with higher the rate for coming five years if the past trend continues.
0
20000
40000
60000
80000
100000
120000
140000
2013-2014 2014-2015 2015-2016 2016-2017 2017-2018
Am
ou
nt
in M
illio
n
Fiscal Year
Loan and Advances Total Deposit
-
20,000.00
40,000.00
60,000.00
80,000.00
100,000.00
120,000.00
140,000.00
2013-2014 2014-2015 2015-2016 2016-2017 2017-2018
Am
ou
nt
in M
illio
n
Fiscal Year
Loan and Advances
Total Deposit

39
b. Loans and advances to fixed deposit ratio
This ratio indicates what proportion of fixed deposit has been used for loans and
advances. As fixed deposit carry high rate of interest fund so collected need to be in
such sectors which yield at least sufficient return to meet the obligation.
This ratio is computed by dividing loans and advances by fixed deposit liabilities as
follows:
Loan and advance to fixed deposit =
Table 4.11
Loans and advanced to fixed deposit ratio
Amount in million Rs.
FY Loan and Advances Fixed Deposit Ratio
2013-2014 47,572.02 14,528.86 327.43%
2014-2015 54,482.47 19,784.89 275.37%
2015-2016 67,955.11 25,999.04 261.38%
2016-2017 77,287.76 36,311.50 212.85%
2017-2018 89,927.57 54,063.68 166.34%
Source: Everest Bank, Annual Report
The ratio revealed a decreasing trend. It ranged from 327.43% in year 2013/14 to
166.34% in year 2017/18. With respect to the above ratio EBL has shown not good
performance. EBL has not utilized efficiently, the high interest-bearing fixed deposit
in the loans and advances and sector yielding satisfactory return.

40
Figure-4.11
Loans and advanced to fixed deposit ratio
The figure 4.11 shows the trend behaviors of loans and advanced to fixed deposit ratio
of EBL along with a trend line. According the figure loans and advanced to fixed
deposit ratio increased both. In other words, loans and advanced to fixed deposit ratio
will increase with higher the rate for coming five years if the past trend continues.
0
10000
20000
30000
40000
50000
60000
70000
80000
90000
100000
2013-2014 2014-2015 2015-2016 2016-2017 2017-2018
Am
ou
nt
in M
illio
n
Fiscal Year
Loan and Advances Fixed Deposit
-
10,000.00
20,000.00
30,000.00
40,000.00
50,000.00
60,000.00
70,000.00
80,000.00
90,000.00
100,000.00
2013-2014 2014-2015 2015-2016 2016-2017 2017-2018
Am
ou
nt
in M
illio
n
Fiscal Year
Loan and Advances
Fixed Deposit

41
c. Loans and advances to saving deposit ratio
Loans and advances to saving deposit ratio measures what extent of saving deposit
has been turned over to loans and advances.
This ratio is calculated by dividing loans and advances by saving deposit as follows:
Loan and advance to saving deposit=
Table 4.12
Loans and advances to saving deposit ratio
Amount in million Rs.
FY Loan and Advances Saving Deposit Ratio
2013-2014 47,572.02 26,489.44 179.59%
2014-2015 54,482.47 32,604.29 167.10%
2015-2016 67,955.11 38,649.61 175.82%
2016-2017 77,287.76 35,555.93 217.37%
2017-2018 89,927.57 38,539.47 233.34%
Source: Everest Bank, annual report
The ratio showed a decreasing to increasing trend through the study period. The ratio
slightly rises to 175.82%. It was 233.34% in year 2017/18 that came down to
175.82% in year 2015/16. It indicates insufficient utilization of saving deposit in form
of loans and advances.
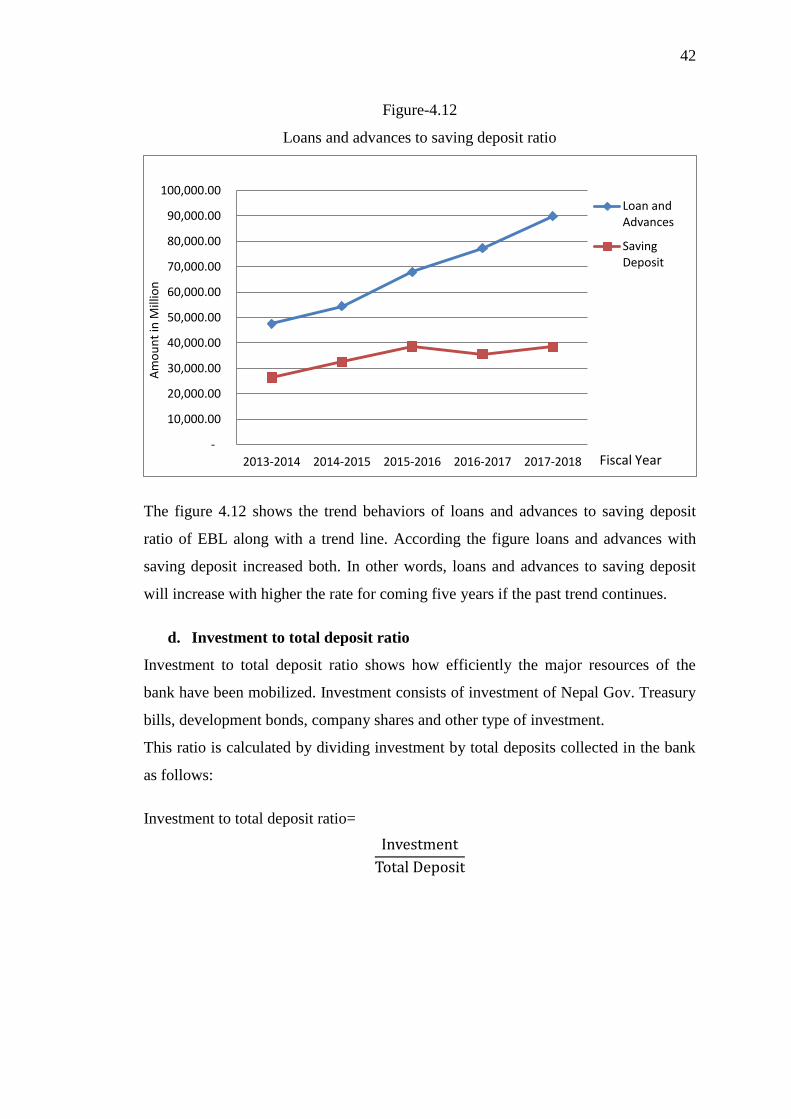
42
Figure-4.12
Loans and advances to saving deposit ratio
The figure 4.12 shows the trend behaviors of loans and advances to saving deposit
ratio of EBL along with a trend line. According the figure loans and advances with
saving deposit increased both. In other words, loans and advances to saving deposit
will increase with higher the rate for coming five years if the past trend continues.
d. Investment to total deposit ratio
Investment to total deposit ratio shows how efficiently the major resources of the
bank have been mobilized. Investment consists of investment of Nepal Gov. Treasury
bills, development bonds, company shares and other type of investment.
This ratio is calculated by dividing investment by total deposits collected in the bank
as follows:
Investment to total deposit ratio=
-
10,000.00
20,000.00
30,000.00
40,000.00
50,000.00
60,000.00
70,000.00
80,000.00
90,000.00
100,000.00
2013-2014 2014-2015 2015-2016 2016-2017 2017-2018
Am
ou
nt
in M
illio
n
Fiscal Year
Loan and Advances
Saving Deposit

43
Table 4.13
Investment to total deposit ratio
Amount in million Rs.
FY Investment Total Deposit Ratio
2013-2014 6,504.19 62,108.14 10.47%
2014-2015 15,102.67 83,093.79 18.18%
2015-2016 18,198.74 93,735.48 19.41%
2016-2017 11,964.56 95,094.46 12.58%
2017-2018 15,292.31 115,511.71 13.24%
Source: Everest Bank, annual report
Here, investment consists of investment in Nepal Government treasury bills,
development bonds, company shares etc. The ratio showed irregular pattern during
the study period. In year 2013/14 only 10.47% of the total deposit was invested in
Nepal Government treasury bills, development was invested but in year 2015/16 the
total investment is reduced to 19.41% of the total deposit.
Figure-4.13
Investment to total deposit ratio
0
20000
40000
60000
80000
100000
120000
140000
2013-2014 2014-2015 2015-2016 2016-2017 2017-2018
Am
ou
nt
in M
illio
n
Fiscal Year
Investment
Total Deposit
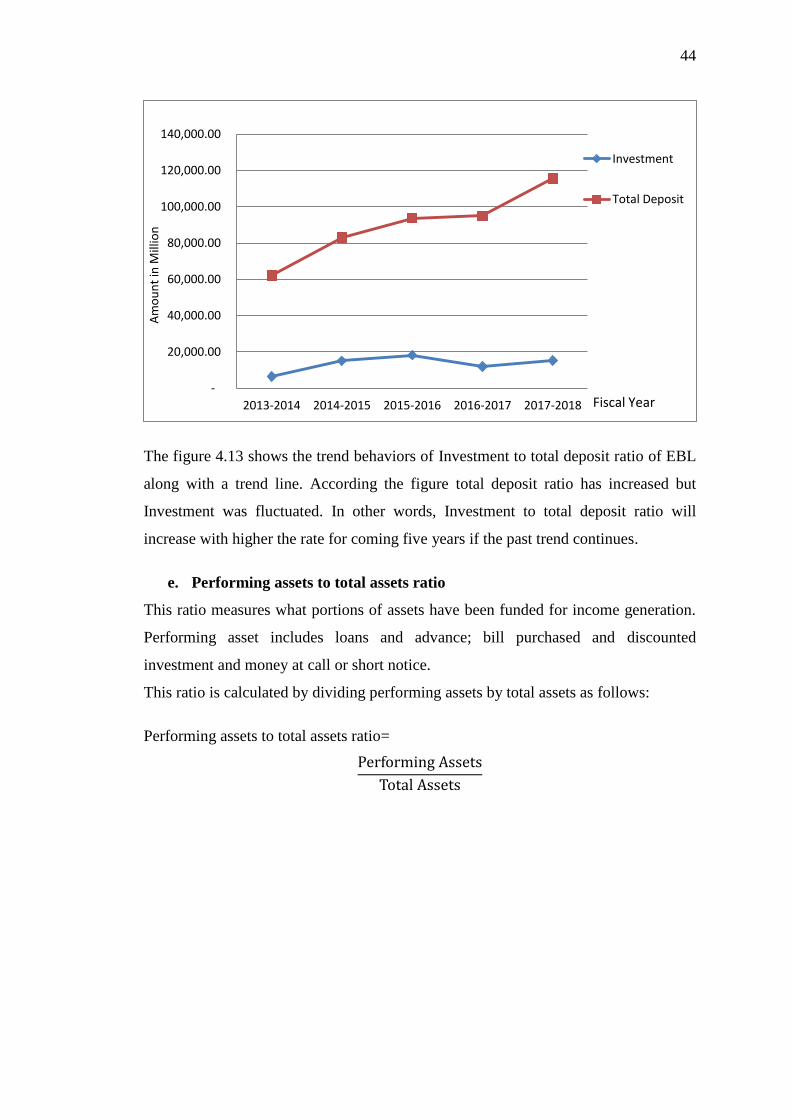
44
The figure 4.13 shows the trend behaviors of Investment to total deposit ratio of EBL
along with a trend line. According the figure total deposit ratio has increased but
Investment was fluctuated. In other words, Investment to total deposit ratio will
increase with higher the rate for coming five years if the past trend continues.
e. Performing assets to total assets ratio
This ratio measures what portions of assets have been funded for income generation.
Performing asset includes loans and advance; bill purchased and discounted
investment and money at call or short notice.
This ratio is calculated by dividing performing assets by total assets as follows:
Performing assets to total assets ratio=
-
20,000.00
40,000.00
60,000.00
80,000.00
100,000.00
120,000.00
140,000.00
2013-2014 2014-2015 2015-2016 2016-2017 2017-2018
Am
ou
nt
in M
illio
n
Fiscal Year
Investment
Total Deposit
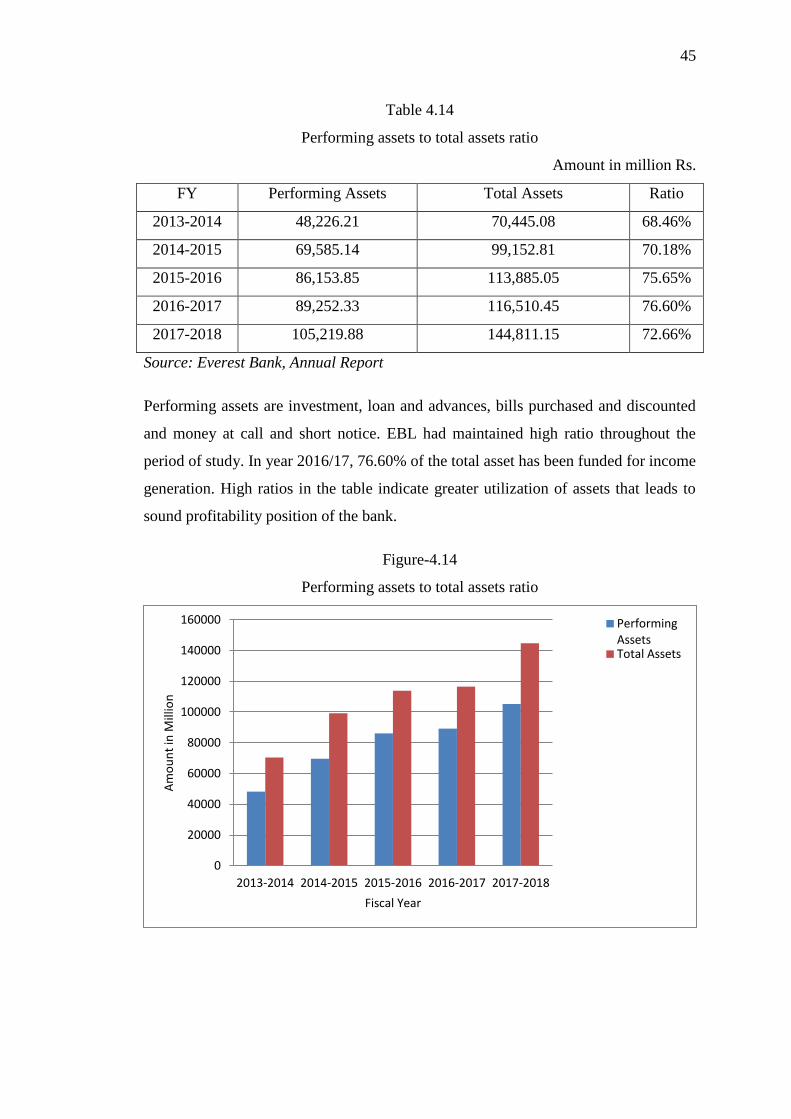
45
Table 4.14
Performing assets to total assets ratio
Amount in million Rs.
FY Performing Assets Total Assets Ratio
2013-2014 48,226.21 70,445.08 68.46%
2014-2015 69,585.14 99,152.81 70.18%
2015-2016 86,153.85 113,885.05 75.65%
2016-2017 89,252.33 116,510.45 76.60%
2017-2018 105,219.88 144,811.15 72.66%
Source: Everest Bank, Annual Report
Performing assets are investment, loan and advances, bills purchased and discounted
and money at call and short notice. EBL had maintained high ratio throughout the
period of study. In year 2016/17, 76.60% of the total asset has been funded for income
generation. High ratios in the table indicate greater utilization of assets that leads to
sound profitability position of the bank.
Figure-4.14
Performing assets to total assets ratio
0
20000
40000
60000
80000
100000
120000
140000
160000
2013-2014 2014-2015 2015-2016 2016-2017 2017-2018
Am
ou
nt
in M
illio
n
Fiscal Year
Performing Assets Total Assets

46
The figure 4.14 shows the trend behaviors of performing assets to total assets ratio of
EBL along with a trend line. According the figure performing assets to total assets
ratio increased both. In other words, performing assets to total assets ratio will
increase with higher the rate for coming five years if the past trend continues.
f. Performing assets to total debt ratio
This ratio shows the pattern of use of the fund collected from the outsider. High ratio
shows the success of bank in utilization of creditors fund in productive areas. Low
ratio shows idleness of the cost bearing resources.
This ratio is calculated dividing performing assets to total debt as follows:
Performing assets to total debt ratio =
-
20,000.00
40,000.00
60,000.00
80,000.00
100,000.00
120,000.00
140,000.00
160,000.00
2013-2014 2014-2015 2015-2016 2016-2017 2017-2018
Am
ou
nt
in M
illio
n
Fiscal Year
Performing Assets
Total Assets
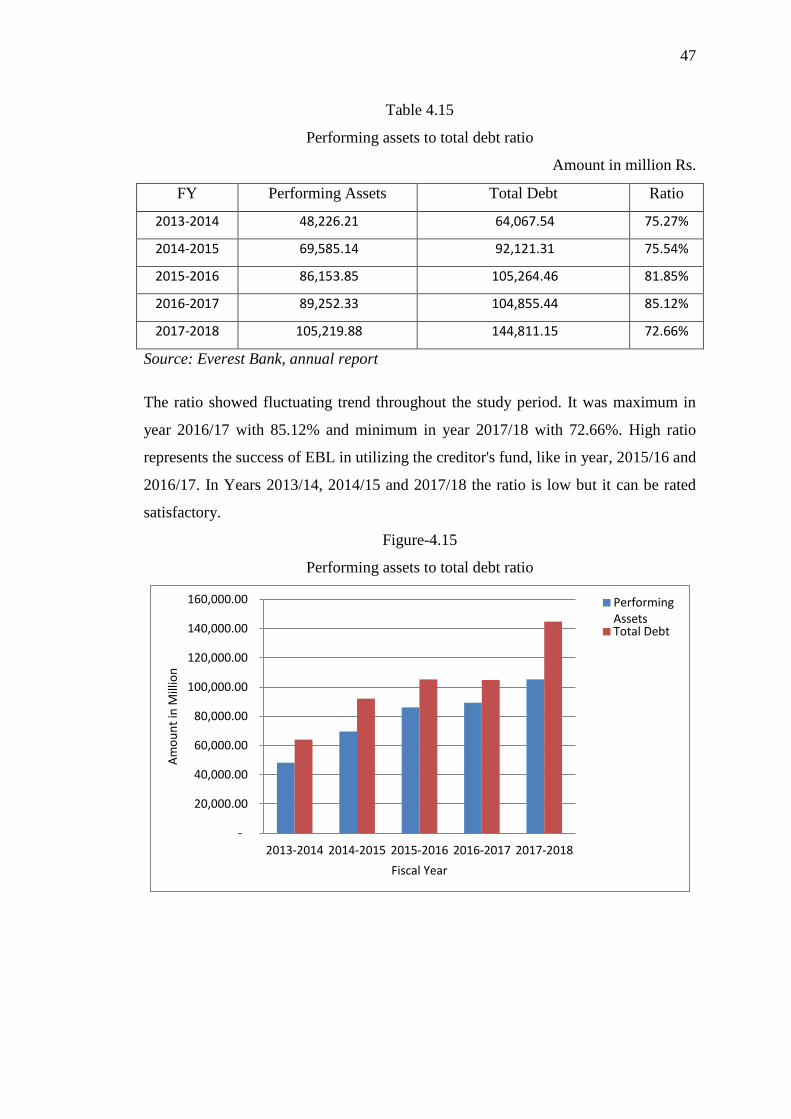
47
Table 4.15
Performing assets to total debt ratio
Amount in million Rs.
FY Performing Assets Total Debt Ratio
2013-2014 48,226.21 64,067.54 75.27%
2014-2015 69,585.14 92,121.31 75.54%
2015-2016 86,153.85 105,264.46 81.85%
2016-2017 89,252.33 104,855.44 85.12%
2017-2018 105,219.88 144,811.15 72.66%
Source: Everest Bank, annual report
The ratio showed fluctuating trend throughout the study period. It was maximum in
year 2016/17 with 85.12% and minimum in year 2017/18 with 72.66%. High ratio
represents the success of EBL in utilizing the creditor's fund, like in year, 2015/16 and
2016/17. In Years 2013/14, 2014/15 and 2017/18 the ratio is low but it can be rated
satisfactory.
Figure-4.15
Performing assets to total debt ratio
-
20,000.00
40,000.00
60,000.00
80,000.00
100,000.00
120,000.00
140,000.00
160,000.00
2013-2014 2014-2015 2015-2016 2016-2017 2017-2018
Am
ou
nt
in M
illio
n
Fiscal Year
Performing Assets Total Debt

48
The figure 4.15 shows the trend behaviors of performing assets to total debt ratio of
EBL along with a trend line. According the figure performing assets to total debt ratio
increased both. In other words, performing assets to total debt ratio will increase with
higher the rate for coming five years if the past trend continues.
4.1.4 Profitability ratio
Profitability ratio measures the managements overall efficiency as shown by the
return generated from sales and investment. A company should earn profits to survive
and grow over a long period of time. Profitability ratios are designed to highlight the
end-result of business activities which in the imperfect world of ours, is the sole
creation of overall efficiency of business unit.
Following ratios are computed to find the probability ratios of EBL.
a. Return on asset
This ratio measures the productivity of the assets. It shows the relationships of net
profit and total assets and determines how efficiently the total assets have been used
by the management. Higher ratio shows the higher return on the assets used in the
business thereby indicating effective use of the resources available and vice versa.
Return on total asset=
-
20,000.00
40,000.00
60,000.00
80,000.00
100,000.00
120,000.00
140,000.00
160,000.00
2013-2014 2014-2015 2015-2016 2016-2017 2017-2018
Am
ou
nt
in M
illio
n
Fiscal Year
Performing Assets
Total Debt
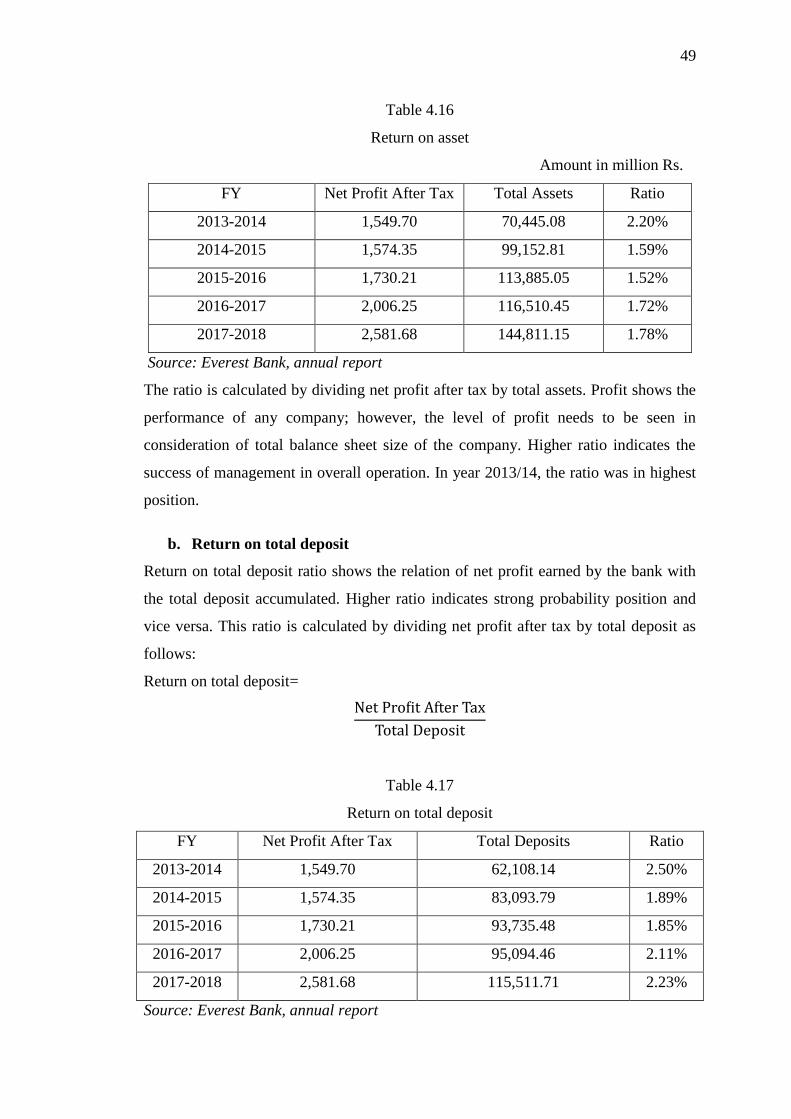
49
Table 4.16
Return on asset
Amount in million Rs.
FY Net Profit After Tax Total Assets Ratio
2013-2014 1,549.70 70,445.08 2.20%
2014-2015 1,574.35 99,152.81 1.59%
2015-2016 1,730.21 113,885.05 1.52%
2016-2017 2,006.25 116,510.45 1.72%
2017-2018 2,581.68 144,811.15 1.78%
Source: Everest Bank, annual report
The ratio is calculated by dividing net profit after tax by total assets. Profit shows the
performance of any company; however, the level of profit needs to be seen in
consideration of total balance sheet size of the company. Higher ratio indicates the
success of management in overall operation. In year 2013/14, the ratio was in highest
position.
b. Return on total deposit
Return on total deposit ratio shows the relation of net profit earned by the bank with
the total deposit accumulated. Higher ratio indicates strong probability position and
vice versa. This ratio is calculated by dividing net profit after tax by total deposit as
follows:
Return on total deposit=
Table 4.17
Return on total deposit
FY Net Profit After Tax Total Deposits Ratio
2013-2014 1,549.70 62,108.14 2.50%
2014-2015 1,574.35 83,093.79 1.89%
2015-2016 1,730.21 93,735.48 1.85%
2016-2017 2,006.25 95,094.46 2.11%
2017-2018 2,581.68 115,511.71 2.23%
Source: Everest Bank, annual report
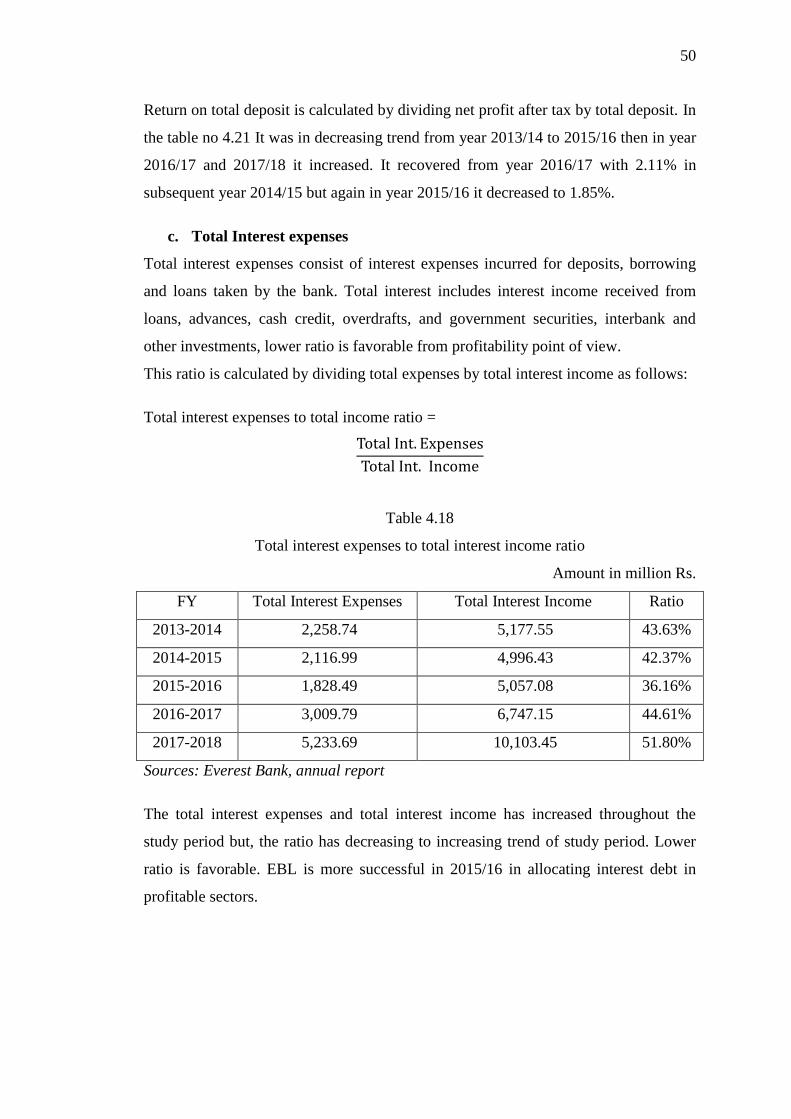
50
Return on total deposit is calculated by dividing net profit after tax by total deposit. In
the table no 4.21 It was in decreasing trend from year 2013/14 to 2015/16 then in year
2016/17 and 2017/18 it increased. It recovered from year 2016/17 with 2.11% in
subsequent year 2014/15 but again in year 2015/16 it decreased to 1.85%.
c. Total Interest expenses
Total interest expenses consist of interest expenses incurred for deposits, borrowing
and loans taken by the bank. Total interest includes interest income received from
loans, advances, cash credit, overdrafts, and government securities, interbank and
other investments, lower ratio is favorable from profitability point of view.
This ratio is calculated by dividing total expenses by total interest income as follows:
Total interest expenses to total income ratio =
Table 4.18
Total interest expenses to total interest income ratio
Amount in million Rs.
FY Total Interest Expenses Total Interest Income Ratio
2013-2014 2,258.74 5,177.55 43.63%
2014-2015 2,116.99 4,996.43 42.37%
2015-2016 1,828.49 5,057.08 36.16%
2016-2017 3,009.79 6,747.15 44.61%
2017-2018 5,233.69 10,103.45 51.80%
Sources: Everest Bank, annual report
The total interest expenses and total interest income has increased throughout the
study period but, the ratio has decreasing to increasing trend of study period. Lower
ratio is favorable. EBL is more successful in 2015/16 in allocating interest debt in
profitable sectors.

51
Figure-4.16
Total interest expenses to total interest income ratio
The figure 4.16 shows that the more portion of total interest income than total interest
expenses. This show that higher amount of interest income has collected.
d. Interest earned to total asset ratio
Interest earned to total assets ratio shows percentage of interest income as compared
to the assets of the bank. This ratio is calculated by dividing interest income by total
assets as follows:
Interest earned to total asset ratio=
-
2,000.00
4,000.00
6,000.00
8,000.00
10,000.00
12,000.00
2013-2014 2014-2015 2015-2016 2016-2017 2017-2018
Am
ou
nt
in M
illio
n
Fiscal Year
Total Interest Expenses Total Interest Income

52
Table 4.19
Interest earned to total asset ratio
Amount in million Rs.
FY Total Interest Income Total Assets Ratio
2013-2014 5,177.55 70,445.08 7.35%
2014-2015 4,996.43 99,152.81 5.04%
2015-2016 5,057.08 113,885.05 4.44%
2016-2017 6,747.15 116,510.45 5.79%
2017-2018 10,103.45 144,811.15 6.98%
Source: Everest Bank, annual report
Ratios of EBL, it has highest ratio in year 2013/14 and lowest ratio in year 2015/16.
High ratio in year 2013/14 to 2017/18 indicates the proper utilization of bank's asset
for income generating purpose than other years.
e. Staff expense to total income ratio
Staff expenses include the salary and allowances, contribution to the provident fund
and gratuity fund, staff training expenses and other allowances and expenses made to
staff. It measures the proportion of income spent for the staff whose contribution is of
great significance in the success of the bank.
This ratio is calculated by dividing staff expenses by total income as follows:
Staff expenses to total income ratio =

53
Table 4.20
Staff expense to total income ratio
Amount in million Rs.
FY Staff Expense Total Income Ratio
2013-2014 511.86 5,826.20 8.79%
2014-2015 687.51 5,834.70 11.78%
2015-2016 699.88 6,087.50 11.50%
2016-2017 882.33 7,812.60 11.29%
2017-2018 1,492.67 11,337.40 13.17%
Source: Everest Bank, annual report
Staff expenses of EBL includes salary, allowances, PF contributions, training,
uniform, medical, insurance, gratuity, Dashain expenses, leave encashment and other
staff expenses. Ratios of EBL has highest in year 2017/18 and lowest in year 2013/14.
The ratio measures the proportion of income spent for the staff whose contribution
results success of the bank. Lower ratio may have adverse effect in staff's morale
which in turn decreases profit and high ratio directly affects the profitability of bank.
f. Office operation expenses to total income ratio
Office operation expenses consists expenses incurred in house rent, water, electricity,
repairs, maintenance, legal expenses, audit expenses and other miscellaneous
expenses made in course of operation.
The ratio is calculated by dividing office operation expense by total income as
follows:
Office operation expenses to total income ratio =

54
Table 4.21
Office operation expenses to total income ratio
Amount in million Rs.
FY Office Operation Expenses Total Income Ratio
2013-2014 544.30 5,826.20 9.34%
2014-2015 555.22 5,834.70 9.52%
2015-2016 603.18 6,087.50 9.91%
2016-2017 681.02 7,812.60 8.72%
2017-2018 584.53 11,337.40 5.16%
Source: Everest Bank, annual report
Office operation expenses include expenses like rent, water and electricity, repair and
maintenance etc. Ratios of EBL has highest ratio in year 2015/16 is 9.91% and lowest
ratio in year 2017/18. Higher ratios in year 2015/16 and 2017/18 might have adverse
effect in the profitability of the bank.
4.2 Other indicators
a. Earnings per share (EPS)
It measures the profit available to the equity shareholders on per share basis, i.e. the
amount that they can get on each share held. In other words, this ratio measures the
earnings available to an equity shareholder on a per share basis. The objective of
computing this ratio is to measure the profitability of the firm on per equity share
basis. This ratio enables us to compare whether the earning based on per share basis
has changed over past period or not. Investors favor higher EPS.
This ratio is calculated by dividing total earnings available to the common share’s
holders by number of equities share outstanding as follows:
EPS=

55
Table 4.22
Earnings per share
Amount in million Rs.
FY Earnings available to shareholder No. of ordinary share EPS
2013-2014 1,549.70 18.01 86.04
2014-2015 1,574.35 20.17 78.04
2015-2016 1,730.21 26.23 65.97
2016-2017 2,006.25 45.26 44.32
2017-2018 2,581.68 80.27 32.16
Source: Everest Bank, annual report
Earnings per share is calculated by dividing earning available to common
shareholders by numbers of equity shares outstanding. Earnings per share refers to the
income available to the common shareholders. EPS in year 2017/18 remain lowest
and in year 2013/14 remained highest. High EPS reflects sound profitability position
of the bank, in this case year 2015/16 remain most favorable to the investors.
b. Dividend per share (DPS)
It gives financial soundness of the company. Only financially strong companies can
distribute dividend. Higher DPS shows the efficiency of management and vice versa.
So, the shareholders prefer high dividend. It may sometime be wise to distribute less
amount of profit if investment opportunities are available.
This ratio is calculated by dividing earnings paid to the shareholders by number of
equity share outstanding as follows:
DPS=
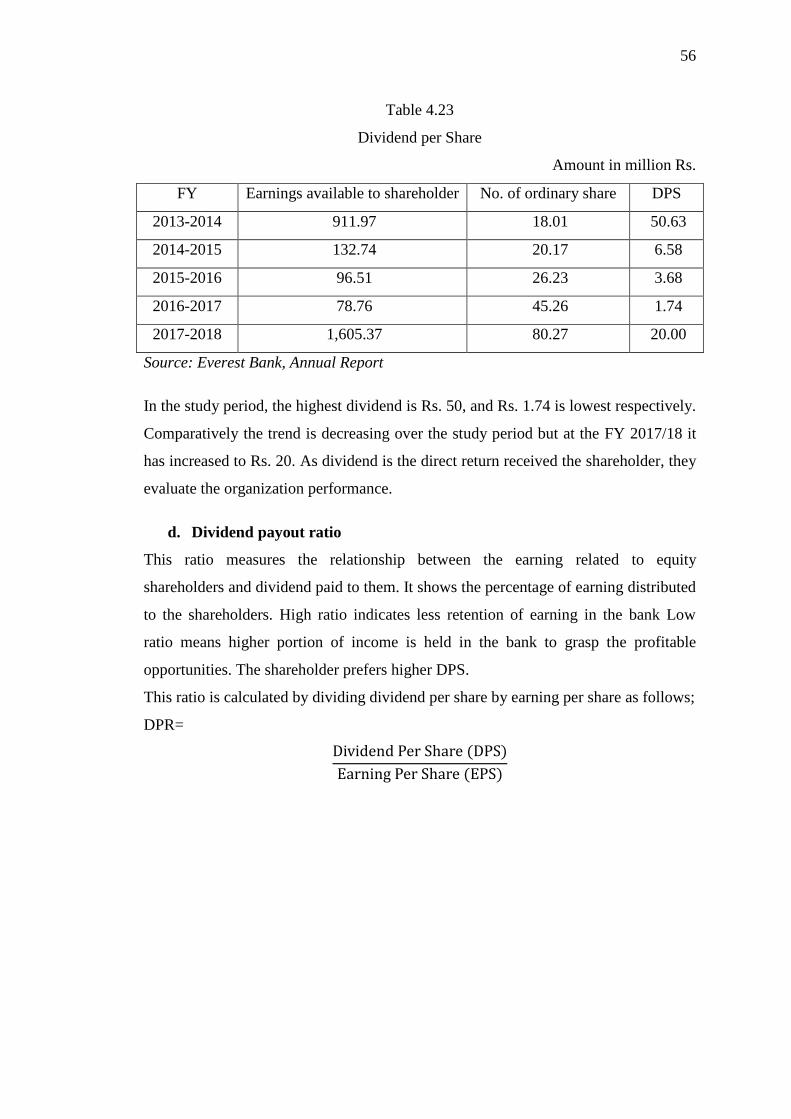
56
Table 4.23
Dividend per Share
Amount in million Rs.
FY Earnings available to shareholder No. of ordinary share DPS
2013-2014 911.97 18.01 50.63
2014-2015 132.74 20.17 6.58
2015-2016 96.51 26.23 3.68
2016-2017 78.76 45.26 1.74
2017-2018 1,605.37 80.27 20.00
Source: Everest Bank, Annual Report
In the study period, the highest dividend is Rs. 50, and Rs. 1.74 is lowest respectively.
Comparatively the trend is decreasing over the study period but at the FY 2017/18 it
has increased to Rs. 20. As dividend is the direct return received the shareholder, they
evaluate the organization performance.
d. Dividend payout ratio
This ratio measures the relationship between the earning related to equity
shareholders and dividend paid to them. It shows the percentage of earning distributed
to the shareholders. High ratio indicates less retention of earning in the bank Low
ratio means higher portion of income is held in the bank to grasp the profitable
opportunities. The shareholder prefers higher DPS.
This ratio is calculated by dividing dividend per share by earning per share as follows;
DPR=

57
Table 4.24
Dividend payout ratio
Amount in million Rs.
FY DPS EPS DPR
2013-2014 50.63 86.04 0.59
2014-2015 6.58 78.04 0.08
2015-2016 3.68 65.97 0.06
2016-2017 1.74 44.32 0.04
2017-2018 20.00 32.16 0.62
Source: Everest Bank, annual report
In term of DPR the ratio has decreased to FY 2016/17 and then the DPR has
increasing up to 0.62% throughout the study period.
e. Price earnings ratio (P/E Ratio)
It represents the investors' expectation about growth in the bank's earning. in another
words, it measures how the market is responding towards the earning performance of
the concerned institution. High ratio indicates higher expectation of the market
towards the achievement of the firm. This ratio is calculated by dividing the market
value per share by earning per share as follows:
P/E Ratio=
Table 4.25
Price earnings ratio
Amount in million Rs.
FY MVPS EPS Ratio
2013-2014 2631 86.04 30.58
2014-2015 2120 78.04 27.17
2015-2016 3385 65.97 51.31
2016-2017 1353 44.32 30.53
2017-2018 663 32.16 20.61
Source: Everest Bank, annual report

58
The P/E ratio of EBL in year 2017/18 it was 20.61% and in year in 2015/16 it
remained highest with 51.31%. Although there was increase in EPS in later years,
MVPS decreased. Though MVPS has decreased from year 2015/16 to 2017/18 but
started to recover from 2013/14. It may be due to changing scenario of banking sector
which in turn decreased P/E ratio.
4.3 Income and expenditure analysis
Using income and expenditure analysis major sources of income and expenses are
evaluated. This helps the analyst to conclude the areas to be focused for investment
and the possibilities for effective control over expenses.
4.3.1 Income analysis
Table 4.26
Income analysis
Amount in million Rs.
Year
Income
2013/14 2014/15 2015/16 2016/17 2017/18
Interest income (Rs.) 5,177.55 4,996.43 5,057.08 6,747.15 10,103.45
% 88.87% 85.63% 83.07% 86.36% 89.12%
Commission &
Discount Income
(Rs.) 254.88 303.62 285.94 346.17 945.38
% 4.37% 5.20% 4.70% 4.43% 8.34%
Foreign Income (Rs.) 67.03 87.27 112.98 94.03 195.90
% 1.15% 1.50% 1.86% 1.20% 1.73%
Other Income (Rs.) 309.48 389.01 509.80 565.45 92.64
% 5.31% 6.67% 8.37% 7.24% 0.82%
Total Income 5,826.20 5,834.70 6,087.50 7,812.60 11,337.40
Sources: Everest Bank, annual report
a. Interest Income
Interest income is the main source of income of the commercial banks. These banks
charge interest on loans and advances provided by them. Interest income also includes
interest earned from investment in government securities, interest on balance with
other banks, money at call and inter-banking lending.

59
The above table shows the interest income of EBL that remained 88.87%, 85.63%,
83.07%, 86.36%, and 89.12% in the respective year of the study period. Interest
income occupies the large portion in the total income of the bank. It seems to cover
four fifth of the total income all the time.
b. Commission and discount
Banks provide remittance facility, purchase and discount of bill of exchange, letter of
credit, guarantees, standing instructions and agency functions for which, they charge
in form of commission and discount. The table no. 4.30 shows that the commission
and discount earned by EBL in the respective year of study remained 4.37%, 5.20%,
4.70%, 4.43% and 8.34% respectively. Commission and discount in amount is in
increasing trend. But the percentage it occupies in the total income is somewhat
fluctuating. In year 2017/18 it was in highest point occupying 8.34% and it was
lowest in the year 2013/14 with 4.37%.
c. Foreign exchange fluctuation income
Transaction of foreign currency is one of the major functions of commercial banks.
JVBs can purchase and sell foreign currencies under the NRB direction. It includes
trading gain due to fluctuation in the exchange rate.
The income from fluctuation of foreign currency exchange rate is Rs. 67.03, 87.27,
112.98, 94.03 and 195.90 million that constitutes 1.15%, 1.50%, 1.86%, 1.20% and
1.73% respectively of total income earned by EBL in respective study period.
d. Other Income
Income other than above comes under other income. Other income of EBL includes
safe deposit vault rental income, telex/T.T. charges and other services charges. Other
income of EBL appeared to be 5.31%, 6.67%, 8.37%, 7.24% and 0.82% in the
respective study periods. It rose in the year 2015/16 and fluctuated in the latter years.

60
4.3.2 Expenditure analysis
Table 4.27
Expenditure analysis
Amount in million Rs.
Year
Income 2013/14 2014/15 2015/16 2016/17 2017/18
Interest expenses (Rs.) 2,258.74 2,116.99 1,828.49 3,009.79 5,233.69
% 63.87% 59.06% 54.02% 61.94% 67.79%
Staff expenses (Rs.) 511.86 687.51 699.88 882.33 1,492.67
% 14.47% 19.18% 20.68% 18.16% 19.34%
Operating Expenses (Rs.) 544.30 555.22 603.18 681.02 584.53
% 15.39% 15.49% 17.82% 14.01% 7.57%
Bonus (Rs.) 221.61 224.75 253.44 286.34 409.12
% 6.27% 6.27% 7.49% 5.89% 5.30%
Total Expenses 3,536.51 3,584.47 3,384.99 4,859.48 7,720.01
Sources: Everest Bank, annual report
Various expenses are borne by bank in course of granting services to its customer.
Banks need to pay interest for the deposits and borrowings. It has to pay salaries and
provide other facilities to its staffs. It also has to spend significant amount for day to
day operation.
a. Interest expenses
Commercial banks pay interest on various types of deposits and loan taken from other
banks and financial institution. It is the major part of the banks' expenses.
As observed the interest expenses out of total expenses of EBL recorded 63.87%,,
59.06%, 54.02%, 61.94% and 67.79% in respective study period. The highest
percentage is 67.49% in year 2017/18 and lowest is 54.02% in year 2015/16.
b. Staff expenses
In return of the services provided by the staff they need to be paid remuneration. Staff
expenses include salary, allowances, PF contributions, training expenses, uniform,
medical allowances, insurance, gratuity, Dashain allowances and leave encashment.
It is seen that the staff expenses in EBL were 14.47%, 19.18%, 20.68%, 18.16% and
19.34% of total expenses in the respective study period.

61
c. Operating expenses
Considerable amount is spent in routine work of bank. Operating expenses includes
expenses such as rent, water and electricity, repair and maintenance, insurance
premium, postage, telephone, telex, office equipment, travelling expenses, printing
and stationery, newspaper, advertisement, meeting expenses, depreciation,
amortization, security expenses etc.
Operating expenses covers 15.39%, 15.49%, 17.82%, 14.01% and 7.57% of total
expenses incurred in respective study period. In year 2015/16 it is maximum
occupying 17.82% of total expenses and in year 2017/18 it is minimum occupying
7.57% of total expenses.
d. Bonus facility
Banks pay a portion of profit to the staff as bonus which is reward for their services. It
motivates the staff but it also increases the expenses of the bank.
It depicts that expenses for bonus in EBL remained 6.27%, 6.27%, 7.49%, 5.89% and
5.30% in respective year of the study period.
4.4 Correlation analysis
a. Correlation analysis between total deposit and net profit
Table 4.28
Correlation analysis between total deposit and net profit
Amount in million Rs.
Year Deposit (x) Net profit (y)
2013-2014 62,108.14 1,549.70
2014-2015 83,093.79 1,574.35
2015-2016 93,735.48 1,730.21
2016-2017 95,094.46 2,006.25
2017-2018 115,511.71 2,581.68
Calculation: Annex-I
r = 0.88
P. Er=0.0306
Table no. 4.32 shows the coefficient of correlation and probable error of correlation
coefficient between deposit and net profit in EBL remained 0.88 and 0.0306

62
respectively. It shows higher positive correlation between two variables, deposit and
net profit. P.Er is less than r which means that the relationship between deposit and
net profit is significant. Further r>6 P.E. i.e. 0.88>0.1836. This shows that net profit
of EBL increases almost to the same degree with increase in the amount of deposit.
b. Correlation analysis between performing assets and net profit
Table 4.29
Correlation analysis between performing assets and net profit
Amount in million Rs.
Year Performing Assets (x) Net profit (y)
2013-2014 48,226.21 1,549.70
2014-2015 69,585.14 1,574.35
2015-2016 86,153.85 1,730.21
2016-2017 89,252.33 2,006.25
2017-2018 105,219.88 2,581.68
Calculation: Annex-II
r= 0.85
P. Er= 0.0368
Above table shows the coefficient of correlation and probable error of correlation
coefficient between performing assets and net profit in EBL remained 0.85 and
0.0368 respectively in the study period. Correlation coefficient appeared greater that
six times the probable error i.e. 0.85>0.2208 which indicates that the net profit and
performing assets of the bank are highly and positively related. Therefore, EBL can
raise its net profit by increasing the performing assets.
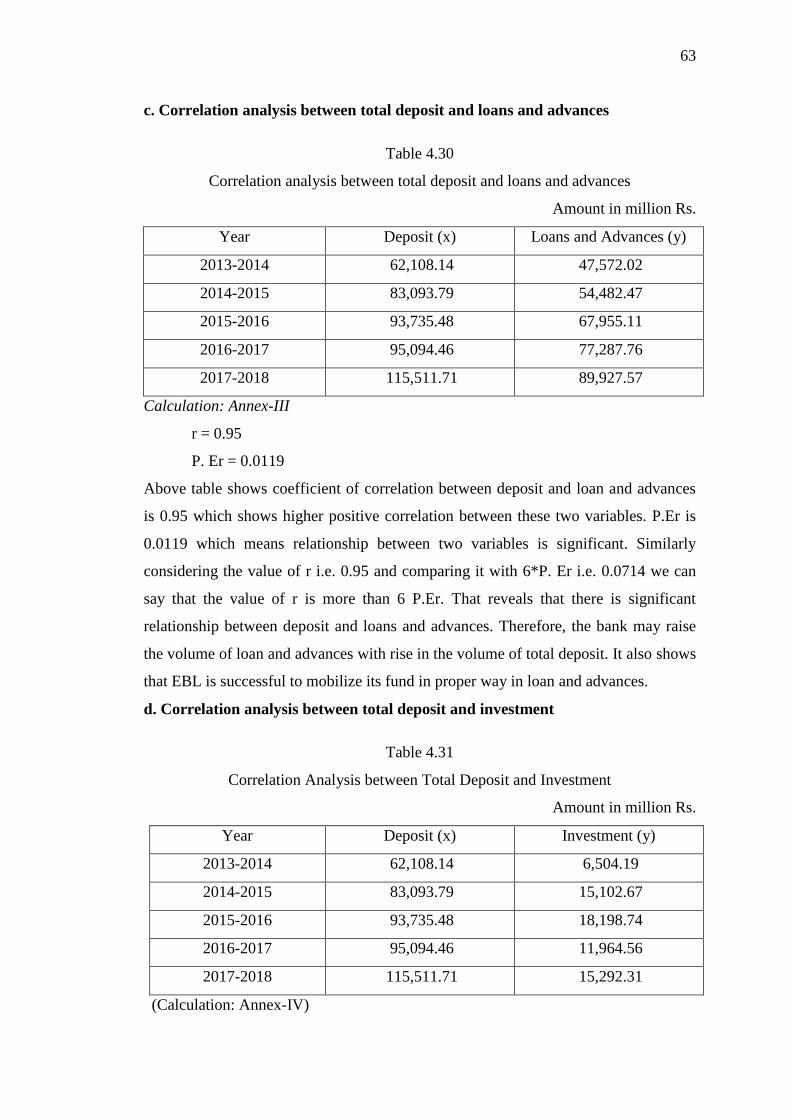
63
c. Correlation analysis between total deposit and loans and advances
Table 4.30
Correlation analysis between total deposit and loans and advances
Amount in million Rs.
Year Deposit (x) Loans and Advances (y)
2013-2014 62,108.14 47,572.02
2014-2015 83,093.79 54,482.47
2015-2016 93,735.48 67,955.11
2016-2017 95,094.46 77,287.76
2017-2018 115,511.71 89,927.57
Calculation: Annex-III
r = 0.95
P. Er = 0.0119
Above table shows coefficient of correlation between deposit and loan and advances
is 0.95 which shows higher positive correlation between these two variables. P.Er is
0.0119 which means relationship between two variables is significant. Similarly
considering the value of r i.e. 0.95 and comparing it with 6*P. Er i.e. 0.0714 we can
say that the value of r is more than 6 P.Er. That reveals that there is significant
relationship between deposit and loans and advances. Therefore, the bank may raise
the volume of loan and advances with rise in the volume of total deposit. It also shows
that EBL is successful to mobilize its fund in proper way in loan and advances.
d. Correlation analysis between total deposit and investment
Table 4.31
Correlation Analysis between Total Deposit and Investment
Amount in million Rs.
Year Deposit (x) Investment (y)
2013-2014 62,108.14 6,504.19
2014-2015 83,093.79 15,102.67
2015-2016 93,735.48 18,198.74
2016-2017 95,094.46 11,964.56
2017-2018 115,511.71 15,292.31
(Calculation: Annex-IV)

64
r = 0.942
P.Er. = 0.042
Table no 4.35 shows the coefficient of correlation between deposit and total
investment is 0.942. It shows higher positive relationship between two variables.
Correlation coefficient appeared greater than six times the probable error i.e.
0.942>6*0.042. It implies that the correlation between total deposit and investment of
the bank are correlated at significant level. Increase in the amount of deposit,
investment of the bank seems to increase.
e. Correlation between EPS and MVPS
Table 4.32
Correlation between EPS and MVPS
Amount in million Rs.
Year EPS (x) MVPS (y)
2013-2014 86.04 2,631.00
2014-2015 78.04 2,120.00
2015-2016 65.97 3,385.00
2016-2017 44.32 1,353.00
2017-2018 32.16 663.00
Calculation: Annex-V
r=0.77
P.Er= 0.0554
Table no 4.36 highlights the correlation coefficient and probable error of coefficient
between EPS and MVPS which were 0.77 and 0.0554 respectively. The correlation
coefficient lies between -1 and +1 which implies that there is perfect positive
correlation between the variables. Correlation coefficient appeared slightly greater
that six times the probable error i.e. 0.77>0.3324. So, we can strongly say that there is
significant relation between the variables.

65
f. Correlation between DPS and MVPS
Table 4.33
Correlation between DPS and MVPS
Amount in million Rs.
Year DPS (x) MVPS (y)
2013-2014 50.63 2,631.00
2014-2015 6.58 2,120.00
2015-2016 3.68 3,385.00
2016-2017 1.74 1,353.00
2017-2018 20.00 663.00
Calculation: Annex-VI
r= 0.09
P. Er= 0.1339
Table no 4.37 shows the coefficient of correlation and probable error of correlation
coefficient between DPS and MVPS in EBL remained 0.09 and 0.1339 respectively in
the study period, but correlation coefficient appeared to be less than six times the
probable error i.e. 0.09<6*0.1339 which means the value of r is insignificant.
4.5 Trend analysis
Table 4.34
Trend analysis of total deposit
Amount in million Rs.
Year (x) Deposit (y) Year (x)-5 X2 Xy
2013-2014 62,108.14 1 1 62,108.14
2014-2015 83,093.79 2 4 166,187.58
2015-2016 93,735.48 3 9 281,206.44
2016-2017 95,094.46 4 16 380,377.84
2017-2018 115,511.71 5 25 577,558.53
Total 449,543.57 55 1,467,438.53
Sources: Everest Bank, annual report

66
Table 4.35
Trend Forecast for Next Five Years
Year Forecast deposit (yc=a+bx)
2018-2019 71,635.06
2019-2020 98,315.76
2020-2021 124,996.46
2021-2022 151,677.16
2022-2023 178,357.86
Where, a=
=
= 44954.36
b=
=
= 26680.70
Figure-4.17
Deposit trend forecast for next five years (yc=a+bx)
The total deposit for next five years of EBL is increasing trend. Therefore, total
deposit of EBL will increase in higher speed for coming year of trend of past trend
continues.
-
20,000.00
40,000.00
60,000.00
80,000.00
100,000.00
120,000.00
140,000.00
160,000.00
180,000.00
200,000.00
2018-2019 2019-2020 2020-2021 2021-2022 2022-2023
Am
ou
nt
in M
illio
n
Fiscal Year
Forecasted Deposit (y)=a+bx

67
Table 4.36
Trend analysis of net profit
Year (x) Net Profit (y) X = Year (x)-y X2 Xy
2013-2014 1,549.70 1 1 1,549.70
2014-2015 1,574.35 2 4 3,148.70
2015-2016 1,730.21 3 9 5,190.62
2016-2017 2,006.25 4 16 8,024.99
2017-2018 2,581.68 5 25 12,908.41
Total 9,442.19 55 30,822.42
Table 4.37
Net profit trend forecast for next five years
Year Net Profit (yc=a+bx)
2018-2019 1,504.63
2019-2020 2,065.03
2020-2021 2,625.44
2021-2022 3,185.85
2022-2023 3,746.26
Where, a=
=
10
19.9442 = 944.22
b=
= 55
42.30822 = 560.41
yc = a + bx (2018/19)
= 944.22 + 560.41 x 1
= 1504.63

68
Figure-4.18
Net profit trend forecast for next five years
The figure 4.18 shows the trend behaviors of Net profit of EBL, Net profit is
increasing trend. Therefore, Net profit of EBL will be increasing in coming five years
if past trend continues.
4.6 Major findings of the study
The following findings have been derived from the analysis and interpretation of the
data.
1. Although EBL could not maintain conventional standard of 2:1, current ratio
seems to be satisfactory. In the final years of the study period it was closer to
the conventional standard.
2. EBL has made enough investment in Nepal Government securities like
Treasury bond, development bond and shares and debentures in the final years
of the study period.
3. Cash and bank balance to the current and saving deposit ratio seems to be
consistent. In the year 2017/18 the ratio was 81.88%. This exhibit that EBL
able to meet its immediate obligation as the bank balance is enough to the
current and saving deposit.
4. EBL is operating at high risk. In other hand in 2017/18 the ratio was 81.88%.
It shows that in the year 2017/18 EBL seemed unsuccessful to utilize the
-
500.00
1,000.00
1,500.00
2,000.00
2,500.00
3,000.00
3,500.00
4,000.00
2018-2019 2019-2020 2020-2021 2021-2022 2022-2023
Am
ou
nt
in M
illio
n
Fiscal Year
Net Profit (y)=a+bx

69
raised fund from the current and saving deposit that may have affected the
profitability adversely.
5. In the comparison of the study period 21.21% of total deposit was held as cash
and bank balance in the year 2013/14 by EBL which shows low liquidity
position. But in the year 2014/15 EBL had 30.23% of the total deposit as cash
and bank balance.
6. EBL is very inconsistent in maintaining its liquidity position.
7. NRB balance by total deposit never dropped below 8% except the year of
2017/18, the percentage to be maintained as directed by NRB. It was higher
than the prescribed percentage. EBL has maintained NRB balance to fixed
deposit ratio above the standard prescribed by NRB.
8. Nearly 30% of the total deposit is occupied by fixed deposit. In later years
2013/14 to 2015/16 the ratio fixed deposit to total deposit is less than the
remaining period. EBL has more debt than equity in the total capital as
revealed by debt equity ratio. Debt asset ratio showed that more than 90% of
the total asset had been financed by the outsider's fund.
9. Interest coverage ratio of EBL seems to be lower in all the period. This
indicates that there is excessive use of debt for which interest are to be paid.
10. EBL has been successful in utilizing its deposit on loan and advances which is
depicted by loan and advances to total deposit ratio.
11. EBL has efficiently utilized the high interest-bearing fixed deposit.
12. Loan and advances to total deposit ratio fixed deposit was inconsistent during
the study period. Overall rate can be satisfactory.
13. The investment to total deposit ratio deposit ratio showed irregular pattern
during the study period. It was high in position in year 2014/15 with 18.18%
and 19.41% in 2015/16.
14. Performing assets to total asset ratio showed that EBL has funded total assets
for income generation. EBL has utilized assets effectively.
15. Performing assets to total debt ratio was on higher side, which depicts EBL is
efficiently utilizing the creditor's fund.
16. Return on asset ratio showed that profitability with respect to financial
resources investment of the bank assets is unsatisfactory but changes in stable
manner.
70
17. Interest expenses to interest income ratio is in the higher side. On average it is
more than 40% that shows that EBL gap between interest earned and interest
paid is quite low but in later years EBL is successful in allocating interest
bearing debt in profitable sectors.
18. Total interest expenses to total asset ratio was very low throughout the study
period which shows EBL has not utilized its assets effectively for generating
income.
19. Staff expenses to total income ratio remained lower than it indicates EBL. It
indicates that EBL carried out its operation efficiently with lesser staff
expenses which is the highest in 2017/18.
20. Office operation expenses to total income ratio remained moderate in nature.
21. EBL's EPS remained decreasing trend throughout the study period. In the final
year of study period i.e. 2017/18 it was lowest position.
22. Income analysis showed that interest income remained dominant in EBL.
More than three fourth of the income was occupied by interest income
throughout the study period.
23. Expenditure analysis showed that interest expenses occupied major portion in
expenses of EBL.
24. Deposit and net profit, performing asset and net profit, total deposit and loan
and advances, total deposit and investment is found to be positively correlated
at significant level.
25. EPS and MVPS were found to be positively correlated and correlation
coefficient appeared to be less than 6 times the probable error.
26. Coefficient between DPS and MVPS in EBL remained 0.09 and 0.1339
respectively in the study period, but correlation coefficient appeared to be less
than six times the probable error i.e. 0.09<6*0.1339 which means the value of
r is insignificant.
27. The trend analysis of total deposit, loan and advances and net profit shows the
increasing trend.

Chapter - 5
Summary, conclusion and recommendations
This chapter is dedicated to provide conclusions after analyzing the financial
performance of joint venture banks named Everest Bank Limited. It also tries to
provide some suggestions and recommendations to the bank from the conclusion
derived from the study.
5.1 Summary
Financial analysis is the process of identifying the financial strengths and weakness of
the firm by properly establishing relationship between the items of balance sheet and
the profit and loss account. Ratio analysis is one of the tools used by financial analysis
for making decisions regarding credit and investments. This method utilizes the data
found in financial statements to determine a bank's standing. It will compare the
bank's ratios to its past performance as well as to bank statistics to determine risks,
trends, and to identify any peculiarities. To conduct the research work, the researcher
consulted mainly the secondary sources such as documents published by concerned
banks and also consulted the personalities of the related bank as primary sources
where as necessary. Before presenting and analyzing the data, there was also need to
review related books, prior research on the topic. Obviously, it helped the researcher
to construct conceptual framework and to analyze and interpret the secondary data
according to objective set forth previously. Then the research work was analyzed and
interpreted by financial tools such as liquidity ratio, activity turnover ratio, leverage
ratio, earning per share, profitability ratio and dividend per share as well as statistical
tools such as mean, standard deviation, CV, Probable Error and Trend analysis.
5.2 Conclusion
Establishment of commercial banks especially joint venture banks have continued in
response to the economic liberalization policies of the government. So, now in Nepal
there are twenty-eight (research period) commercial banks competing with each other
in their business. EBL, which is working as Joint Venture Bank in Nepal by providing
the quality and banking services. The various financial indicators were used for
analysis of financial data of the sampled bank. The analysis is done on the basis of
financial statement from 2013/14 to 2017/18. This study is mainly based on the

72
secondary data. The researcher has analyzed the data by using financial tools like ratio
analysis as well as statistical tools like mean, S.D. and hypothesis etc.
The liquidity positions of all the banks were strong and enough to meet their
immediate needs of cash and short-term obligations. The current ratio of EBL
is in fluctuating trend. The average mean ratio is 1.08:1, 1.08:1, 1.09:1, 1.00:1
and 1.12:1 times in the study period. These all ratio shows that the bank has
maintained the acceptable liquidity position of the bank.
The liquidity position of the bank is satisfactory because the current ratios of
the different years are about to meet to the standard. Higher current ratio
means the better liquidity position. 2:1 is considered to be an adequate ratio.
Current assets and current liabilities manage the current ratio. The cash and
bank balance to current asset of EBL fluctuated over the study period.
Interest income is the main source of income and over the years it has become
more dominant as 83.07% of total income contributed by it. The bank's
liquidity position is satisfactory. The liquid assets have increased substantially
in the review periods.
Leverage ratios are judging the long-term financial position of the firm. EBL
maintain the debt equity ratio, total debt and total assets, net profit before
interest and tax with interest has managed. EBL managed greater proportion of
the owner's capital in the capital structure lesser will be the financial risk
borne by has legal obligation to pay interest to debt holders irrespective of the
profit or loss incurred by the firm.
Cash and bank balance to the current and saving deposit ratio seems to be
consistent. This exhibit that EBL able to meet its immediate obligation as the
bank balance is enough to the current and saving deposit.
Loan and advances to total deposit ratio fixed deposit was inconsistent during
the study period. Overall rate can be satisfactory.
EBL has made enough investment in Nepal Government securities like
Treasury bond, development bond and shares and debentures in the final years
of the study period.

73
EBL is operating at high risk. Data shows EBL seemed unsuccessful to utilize
the raised fund from the current and saving deposit that may have affected the
profitability adversely.
NRB balance by total deposit maintained as directed by NRB. It was higher
than the prescribed percentage. EBL has maintained NRB balance to fixed
deposit ratio above the standard prescribed by NRB.
Profitability ratio is measurement of efficiency. It provides the degree of
success in achieving desired profit. Profitability in terms of net profit to total
assets the highest ratio in 2013/14 is 2.20 ratio, net profit to total deposit ratio,
return to net worth (shareholders equity), return on net worth ratio and net
profit margin ratio, EBL average ratio is always higher. Thus, it can be
concluded that EBL is getting good return from its investment.
EBL earned a net profit of Rs.1,549.70 million for the fiscal year 2013/14 and
this comes to be Rs. 2,581.68 million more as compared to the same period in
the previous fiscal year 2017/18. The bank's financial performance in the last
five years shows a continuous increase in its net profit.
The major expenses, for the banks EBL, are interest expenses, staff expenses,
office expenses and provision for bonus.
Return on asset ratio showed that profitability with respect to financial
resources investment of the bank assets is unsatisfactory but changes in stable
manner.
Performing assets to total asset ratio showed that EBL has funded total assets
for income generation. EBL has utilized assets effectively.
Expenditure analysis showed that interest expenses occupied major portion in
expenses of EBL.
The EPS of EBL is decreasing trend, in 2013/14 EPS is Rs. 86.04 and in
2017/18 EPS reach to Rs. 32.16 within the study period. This shows that, EBL
is found decreasing its performance in term of EPS.
The trend analysis of total deposit, loan and advances and net profit shows the
increasing trend.

74
5.3 Recommendations
Based on the analysis of this study, the below given are the recommendations to be
implemented for the further growth of bank. These suggestions will be proved to be
milestone in order to correct the existing situation.
It is suggestive to hold the fund in form of cash or cash equivalent items to the
extent of requirement. Estimation can be done on the basis of past trend and
experience, nature of depositors, and constantly analyzing the external
environment.
EBL, most of the time, maintained NRB balance to total deposit ratio and
NRB balance to fixed deposit higher than the standard prescribed by NRB.
The idle fund doesn't yield and return. It is suggested to lower the ratio and
invest the surplus in other current assets.
EBL in the later years has given more priority to invest its fund in government
securities. Though the government securities are free of risk they yield lower
interest rate. It is recommended not to give all attention to government
securities and diversify investment policy. So, EBL is recommended to invest
in loan and advances
Banking has become more and more competitive in the present days. EBL
needs to find sources of income apart from the traditional interest income to
stay competitive providing many other services to its customer.
EBL has greater portion of debt in capital. Bank should be aware of the
possible risk that may arise due to slackness in the business activities.
Staff expenses to total income ratio remained lower. Lower ratio may affect
staff’s morale which in turn decreases the profit. Though training, seminars,
conferences and other programmes efficiency of the staff can be improved.
The human resources need to be continuously developed through training and
workshops otherwise it may hamper the productivity and efficiency of the
employees besides the motivation factor. The PNB allows free training
packages in exchange of the annual TSA for the employees of the bank but the
bank has not been able to use the facility. It is also suggested to minimize the
office operation expenses.
The major part of total expenses is operating expenses. The analyzed data
proved that the EBL is comparatively, more efficient to reduce in operating as
75
well as other expenses too. EBL should minimize their expenses as far as
possible to enhance the volume of profit.
For the nation development banks should contribute from their side,
development of infrastructure and hydropower sector are not invested by
commercial banks. Banks are not interested in agricultural sector. They should
lend in these sectors.
The bank may face the problem of working capital if they need to pay the
current liabilities at demand. Banks may lose their goodwill in case of delay in
the payment liabilities. So bank should have address the problem in winning
the confidence of current depositors and short-term lenders.
The bank has the good ratio of 81.27% which shows that the bank is
successful in utilizing its deposits on loans and advances so bans should
always trying to maintaining these patterns.

76
Bibliography
Books
American Institution of Banking (1972). Principle of Banking Operation, Prentice
Hall.
Basu, A. K. (1982). Fundamentals of Banking Theory and Practices, Calcutta, A. K.
Mukarjee Publication.
Gupta, D. P. (1984). Banking System, its Role in Export Development.
Hampton, J. J. (1998). Financial Decision Making, Prentice Hall of India
I. M. Pandey (1995). Financial Management.
Kerlinger, F. N. (1983). Foundation of Behavioural Research, New Delhi, Surjeet
Publications.
Kothary C. R. (1990). Research Methodology, Methods and Techniques, 2nd
Edition,
New Delhi, Wishwa Prakashan.
Levin, I. Richard and Rubi, S. Davi (1999). Statistics for Management, Prentice Hall
of India Pvt. Ltd., New Delhi.
Mandlin, Snock (1990). Evaluation of Banking Supervision in Nepal Rastriya Bank.
P. N. Abrd and O. P. Gupta (1987). Dictionary of Commerce, New Delhi, Anmd
Publication.
Paudel, N. P. (2053 BS.). Financial Statement Analysis: An Approach to Evaluate
Bank's Performance, NRB Samchar 41st Anniversary.
Ronald, Grywinshki (1999). The New Function of Banking, Harvard Business
Review.
Sayers, R. S. (1976). Modern Banking, Oxford University Press.
Sekaran, V. (1992). Research Methods in Business, a Skill Building Approach,
Singapore, John Wiley and Sons.
Sharma. P. K. and Chaudhary, A. K. (2056 BS.). Statistical Methods, Khanal Books
Prakashan
Shrestha, M. K. (1990). Commercial Banks Comparative Performance Evaluation,
Karmachari Sanchaya Kosh Publication.
Shrestha, Shakti Prasad (2051 BS.). Financial Liberalization in Nepal, NRB
Samachar.
Srivastava, R. M. (1993). Financial Management, Pragati Prakashan.
Thapa Kiran (2008). Financial Institutions and Market. Kathmandu: Asmita
Publication.
77
Vanhorne, J. C. Wachowicz, J.M. (1997). Fundamentals of Financial Management,
Prentice Hall of India.
Weston, J. Fred, Besley, Scott & Brigham, Eugene F. (1996). Essentials of
Managerial Finance, 11 th Edition, the Dryden Press.
Wolf, H. K. & Pant, P. R. (1996). Social Science Research and Thesis Writing.
Kathmandu, Buddha Academic Enterprises Pvt. Ltd.
Wolf, Howard, K. & Pant (1990). A Handbook for Social Science Research and
Thesis writing, 2nd Edition.
Journals and newspaper
Everest Bank Limited Annual Book, Pratibimba (2017), 23rd
Anniversary
Everest Bank Limited Newsletter (2007), Volume 8.
Encyclopedia Americana (1984), Volume 3
New Encyclopedia Britannica, (1986)
Unpublished master level theses
Adhikari, Dev Raj (1993). Evaluating the Financial Performance of Nepal Bank
Limited. Kathmandu: An Unpublished Master Level Thesis, T. U.
Adhikari, Shridhar (2001). A Comparative Study of Financial Performance of
NSBIBL and EBL. Kathmandu: An Unpublished Master Level Thesis, T. U.
Aryal, O. P. (2008). Financial Performance of Everest Bank Limited. Kathmandu: An
Unpublished Master Level Thesis, T. U.
Bajarcharya, P. D. (2009). Performance Evaluation of Nepal Bank Ltd. Kathmandu:
An Unpublished Master Level Thesis, T. U.
Bhandari, Mukunda (2010). A comparative financial performance analysis of
Himalayan bank ltd. And everest bank ltd. An Unpublished Master Level
Thesis, Sankar Dev Campus T.U.
Dinesh Kumar, (2002). A Comparative Study on Fianacial Performance of Nepal
Bangaledesh Bank Limited and Everest Bank Limited. Kathmandu: An
Unpublished Master Level Thesis, T. U.
Gurung, (1995). Financial Study of Joint Venture Banks in Nepal: A Comparative
Study of Nepal Grindlays Bank and Nepal Indosuez Bank Ltd. Kathmandu:
An Unpublished Master Level Thesis, T. U.

78
Joshi, Deepak (1993). A Study of Commercial Banks of Nepal with Special Reference
to Financial Analysis of Rastriya Banijya Bank. Kathmandu: An Unpublished
Master Level Thesis, T. U.
Joshi, Keshav Raj (1989). A Study on Financial Performance of Commercial Banks.
Kathmandu: An Unpublished Master Level Thesis, T. U.
Pandey, Bishnu Dev (2000). A Study on Financial Analysis on Himalyan Bank
Limited. Kathmandu: An Unpublished Master Level Thesis, T. U.
Shrestha, Leshkumar (2010). A study on financial performance of agriculture
development bank limited (ADBL). Kathmandu: An Unpublished Master
Level Thesis, Shanker Dev Campus.
Singh, Om Krishna (2001). A Study on Resources Utilization by Nepalese
Commercial Banks. Kathmandu: An Unpublished Master Level Thesis, T. U.
Subedi, Narayan Prasad (2002). A Compartive Study of Finacial Performance
between HBL and EBL. Kathmandu: An Unpublished Master Level Thesis,
T. U.
Thapa, Jyoti (2002). Investment Policy of Commercial Banks of Nepal: A
Comparative Study of Everest Bank Limited with NABIL Bank and Bank of
Kathmandu. Kathmandu: An Unpublished Master Level Thesis, T. U.
Zaman, Afroja (2018). Financial Performance Analysis of Jamuna Bank LTD.’
India: An Unpublished Master Level thesis, BRAC Business School.

79
Annex-I
Calculation of Correlation Analysis between Total Deposit and Net Profit
Year Deposit
(x)
Net profit
(y) X
2 Y
2 ∑xy
2013-2014 62,108.14 1,549.70 3,857,420,526.84 2,401,565.63 96248888.54
2014-2015 83,093.79 1,574.35 6,904,577,929.42 2,478,585.61 130818911.2
2015-2016 93,735.48 1,730.21 8,786,340,343.56 2,993,616.35 162181787.2
2016-2017 95,094.46 2,006.25 9,042,956,518.59 4,025,030.15 190783051.3
2017-2018 115,511.71 2,581.68 13,342,954,205.01 6,665,080.80 298214466.3
Total 449,543.57 9,442.19 41,934,249,523.41 18,563,878.55 878247104.6
Pearson correlation coefficient, r
2222 )()()()(
))((
yynxxn
yxxynr
r = 0.88
Probable Error P(E)= 0.6745 1 - r2
N
P(E) = 0.0306

80
Annex-II
Calculation of Correlation Analysis between Performing Assets and Net Profit
Year Performing Assets (x)
Net profit (y) X2 Y
2 ∑xy
2013-2014 48,226.21 1,549.70 2,325,767,328.65 2,401,565.63 74736088.15
2014-2015 69,585.14 1,574.35 4,842,091,628.38 2,478,585.61 109551534.2
2015-2016 86,153.85 1,730.21 7,422,485,346.87 2,993,616.35 149063991.2
2016-2017 89,252.33 2,006.25 7,965,977,605.19 4,025,030.15 179062279.9
2017-2018 105,219.88 2,581.68 11,071,223,946.68 6,665,080.80 271644256.7
Total 398,437.41 9,442.19 33,627,545,855.77 18,563,878.55 784058150.2
Pearson correlation coefficient, r
2222 )()()()(
))((
yynxxn
yxxynr
r = 0.85
Probable Error P(E)= 0.6745 1 - r2
N
P(E) = 0.0368

81
Annex-III
Correlation Analysis between Total Deposit and Loans and Advances
Year Deposit (x) Loans and Advances
(y) X
2 Y2 ∑xy
2013-2014 62,108.14 47,572.02 3,857,420,526.84 2,263,097,487.15 2,954,609,737.54
2014-2015 83,093.79 54,482.47 6,904,577,929.42 2,968,339,016.99 4,527,154,521.75
2015-2016 93,735.48 67,955.11 8,786,340,343.56 4,617,896,570.24 6,369,804,623.18
2016-2017 95,094.46 77,287.76 9,042,956,518.59 5,973,398,486.07 7,349,638,275.30
2017-2018 115,511.71 89,927.57 13,342,954,205.01 8,086,967,768.59 10,387,686,970.33
Total 449,543.57 337,224.93 41,934,249,523.41 23,909,699,329.04 31,588,894,128.10
Pearson correlation coefficient, r
2222 )()()()(
))((
yynxxn
yxxynr
r = 0.95
Probable Error P(E)= 0.6745 1 - r2
N
P(E) = 0.0119

82
Annex-IV
Correlation Analysis between Total Deposit and Investment
Year Deposit (x) Investment
(y) X
2 Y2 ∑xy
2013-2014 62,108.14 6,504.19 3,857,420,526.84 42,304,432.52 403,962,852.71
2014-2015 83,093.79 15,102.67 6,904,577,929.42 228,090,767.90 1,254,938,437.51
2015-2016 93,735.48 18,198.74 8,786,340,343.56 331,194,135.55 1,705,867,636.93
2016-2017 95,094.46 11,964.56 9,042,956,518.59 143,150,728.23 1,137,763,512.75
2017-2018 115,511.71 15,292.31 13,342,954,205.01 233,854,874.51 1,766,441,304.20
Total 449,543.57 67,062.48 41,934,249,523.41 978,594,938.70 6,268,973,744.11
Pearson correlation coefficient, r
2222 )()()()(
))((
yynxxn
yxxynr
r = 0.69
Probable Error P(E)= 0.6745 1 - r2
N
P(E) = 0.0704

83
Annex-V
Calculation of Correlation between EPS and MVPS
Year EPS (x) MVPS (y) X2 Y
2 XY
2013-2014 86.04 2,631.00 7,402.05 6,922,161.00 226,358.45
2014-2015 78.04 2,120.00 6,090.11 4,494,400.00 165,443.01
2015-2016 65.97 3,385.00 4,352.42 11,458,225.00 223,318.14
2016-2017 44.32 1,353.00 1,964.53 1,830,609.00 59,969.01
2017-2018 32.16 663.00 1,034.46 439,569.00 21,324.08
Total 306.53 10,152.00 20,843.56 25,144,964.00 696,412.70
Pearson correlation coefficient, r
2222 )()()()(
))((
yynxxn
yxxynr
r = 0.77
Probable Error P(E)= 0.6745 1 - r2
N
P(E) = 0.0554

84
Annex-VI
Calculation of Correlation between DPS and MVPS
Year DPS (x)
MVPS (y) X2 Y
2 XY
2013-2014 50.63 2,631.00 2,563.40 6,922,161.00 133,207.53
2014-2015 6.58 2,120.00 43.30 4,494,400.00 13,949.60
2015-2016 3.68 3,385.00 13.54 11,458,225.00 12,456.80
2016-2017 1.74 1,353.00 3.03 1,830,609.00 2,354.22
2017-2018 20.00 663.00 400.00 439,569.00 13,260.00
Total 82.63 10,152.00 3,023.26 25,144,964.00 175,228.15
Pearson correlation coefficient, r
2222 )()()()(
))((
yynxxn
yxxynr
r = 0.09
Probable Error P(E)= 0.6745 1 - r2
N
P(E) = 0.1339

85
Annex-VII
Balance Sheet of EBL of FY 2014/15

86
Annex-VIII
Balance Sheet of EBL of FY 2016/17
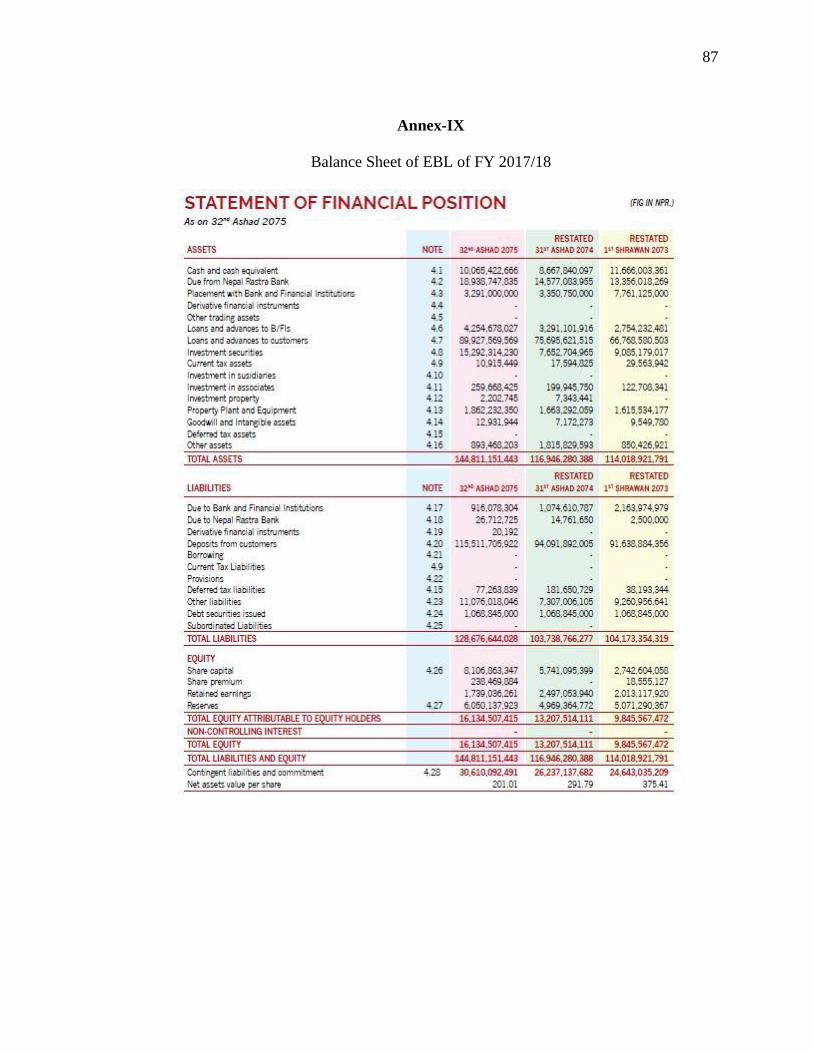
87
Annex-IX
Balance Sheet of EBL of FY 2017/18

Financial Performance of Everest
Bank Limited
Proposal for Thesis
Submitted By:
Dipak Regmi
Exam Roll No. 280242
Campus Roll. No. 29/2068/70
T U Reg. No.7-2-263-196-2007
Central Department of Management
In partial fulfillment of the requirement for the degree of Master of
Business Studies (MBS)
Submitted to:
Central Department of Management
Tribhuvan University
Kirtipur, Kathamndu
2019

Introduction:
Background of the study
The financial performance is the important statement of an organization. It is a
decision-making process to incur strengths or weaknesses of the organization and
knowing about how much revenue generated or not by an organization. It is a
mirror to look into development activities to be undertaken by the organization or
companies. Financial performance should measure or evaluate internal and external
information of past activities, current position and future prospects of organization
or Venture. To go through financial performance evaluation, we come to know
about management team of organization, utilization of resources and how much
their performance in future and also about overall profit of the organization because
profit is the only one primary measure for the success of a business organization.
The initiation of formal banking system in Nepal commenced with the
establishment of Nepal Bank Limited (NBL) in 1937, as the first Nepalese
commercial bank. The country's central bank, Nepal Rastra Bank (NRB) was
established in 1956 by Act of 1955, after nearly two decades of NBL having been
in existence. A decade after the establishment of NRB, Rastriya Banijya Bank
(RBB), a commercial bank under the ownership of His Majesty’s Government of
Nepal (HMG/N) was established, which provides economic and financial inter
mediation in the economy.
In the context of banking development, the 1980s saw a major structural
change in financial sector policies, regulations and institutional developments.
HMG/N emphasized the role of the private sector for the investment in the financial
sector. The financial sector liberalization, started already in the early eighties with
the liberalization of the interest rates, encompassed further deregulation of interest
rates, relaxation of entry barriers for domestic and foreign banks, restructuring of
public sector commercial banks and withdrawal of central bank control over their
portfolio management. These policies opened the doors for foreigners to enter into
banking sector under joint venture. Consequently, the third commercial bank in
Nepal, or the first foreign joint venture bank, was set up as Nepal Arab Bank Ltd
(now called as NABIL Bank Ltd) in 1984. Thereafter, two foreign joint venture

banks, Nepal Indosuez Bank Ltd. (now called as Nepal Investment Bank) and
Nepal Grindlays Bank Ltd (now called as Standard Chartered Bank Nepal Ltd.) was
established in 1986 and 1987 respectively (http://anju.page.tl/Commercial-
Bankinghtm). History has proven that though the extent may vary from country to
country requirement of economic development of any country heavily relies on its
banking system.
Banking institutions are important for resource mobilization and all round
development of the country. It provides resources for economic development,
maintains economic situations of various segments and extends credit to the people.
Banks are those institutions, by raising funds from depositors then loaning those
funds to needy individuals and /or institutions.
Banks are the financial institutions that offer the widest range of financial services
especially credit, savings, and payment services and perform the widest range of
financial functions of any business firm in the economy.
Like other countries, goldsmiths, merchants and moneylenders were the ancient
bankers of Nepal. Tejarath Adda established during the tenure of then Prime
Minister Ranodip Singh (1993 B.S.) was the first step towards the institutional
development banking in Nepal. Tejarath Adda did not collect deposits from the
public but provide loans to employees and public against the bullion. (Dahal &
Dahal, 2056: p10)
Statement of the problem
The adaptation of open and free market economic and financial policies has
encouraged establishment of number of banks, financial companies and co-
operatives. The competition in the banking sector is going to be higher than ever
before. Banks are prone to both external and internal threats. To exist in the
competitive market, banks are trying to introduce different schemes and advantage
to the customer to hold the greater share. These banks have contributed towards
introducing new technology, new banking systems, and deficient service delivery in
the country. They have done so in line with the trust of economic liberalization and
financial sector reform i.e. making the financial system more competitive, efficient,
and profitable. In the present scenario, the worst economic and social condition of

our country largely affects the banks’ performance in all the operational,
productivity and profitability sectors, which causes the large decline in the profit of
all types of banks. In this perspective, analysis of the Joint Venture bank's
performance and to disseminate quality information becomes more essential.
The problem of the study lies on analyzing the financial strengths and weaknesses
of Everest Bank Limited. It also aims in answering the following questions:
1. What is the liquidity position of the bank?
2. What is the leverage positions of the bank?
3. How effectively EBL uses its operating assets?
4. What is the level of profitability of the bank?
This study attempts to evaluate the financial performance of the bank with the help
of various financial and statistical tools. This study also attempts to recommend
some suggestions for improvement in financial performance aspect.
Objectives of the study
The main objective of the study is to evaluate the financial performance of Everest
Bank Limited with the help of ratio analysis and other portfolios. Besides, the
specific objectives of this research are as follows:
1. To find out the liquidity positions of the EBL.
2. To find out the leverage positions of the EBL.
3. To identify how effectively EBL uses its operating assets.
4. To find out the level of profitability of EBL.
Significance of the Study
The study identifies significance of various groups.
a. This research helps to find liquidity position to the persons and parties such
as general readers, decision makers, brokers, traders, shareholders, financial
agencies, businessman and general public (depositors, prospective customers,
investors etc.).
b. This study finds leverage position which is used as pilot work for future research.
c. To identify how effectively operating assets utilize by the EBL.
d. To identify financial position of Bank in term of profitability.
Limitations of the study
This study attempts to evaluate the financial performance of the EBL. The
following are the limitations of the study:
1. This study relies on the published financial documents such as balance sheets,
profit and loss accounts, related journals, magazines, and books. It mainly focuses
on financial performance and does not cover other aspects.
2. Only selected financial and statistical tools are used.
3. This study is based on the secondary data only.
4. This study covers out for the period of fiscal year 2013/14 to 2017/18.
Organization of the study
The study will be divided into five chapters:
Chapter 1: Introduction: This chapter explains background of the study, statement of
the problem, objectives of the study, and limitation of the study.
Chapter 2: Review of literature: This chapter consists of conceptual review and
review of related studies.
Chapter 3: Research methodology: This chapter includes research design, population
and sample, sources and types of data, data gathering procedure and
analytical tools such as financial and statistical.
Chapter 4: Data presentation and analysis: This chapter is the main body of the
research which includes financial ratios analysis, income and expenses
analysis, trend analysis and major finding of the study.
Chapter 5: Summary, conclusions and recommendations: This chapter consists of
summary of the study, conclusion of the major findings and
recommendations for further improvement.
Literature Review:
For the preparation of this proposal I consider some books, report,
publication, thesis and articles will be reviewed. Various master level theses
conducted in different aspects of commercial bank such as lending policy, liquidity
position, interest rate structure, capital structure, investment policy etc. Are
reviewed and findings of some relevant thesis have been mentioned hereunder.
Books:
This analysis evaluated involves the use of various financial statements the
first is the balance sheet, which represents a snapshot of the firm's financial position
at the moment and next is the income statement, that depicts a summary of the
firm's profitability over the time. (Vanharne and Wachhowicz, 1997: 120).
Thesis:
Bajarcharya, P. D. (2009) had conducted a research on a topic "Performance
Evaluation of Nepal Bank Ltd." The basic objectives of her study/research were to
highlight the financial performance and role of banks in the liberalized Nepalese
Economy. Her attempts of analyzing financial performance were concentrated in
ratio analysis and she derived the strength and weakness of banks as stated by
calculating ratios.
Aryal, O. P. (2008) through the thesis, 'Financial Performance of Everest
Bank Limited' he describes about the future in banking sector will be more
competitive with quality and speedy service. Banks will have to provide quality
service and is to attain objectives along with maintaining good financial position to
sustain in market.
Other:
Financial analysis (also referred to as financial statement
analysis or accounting analysis or Analysis of finance) refers to an assessment of
the viability, stability and profitability of a business. It is performed by
professionals who prepare reports using ratios that make use of information taken
from financial statements and other reports. These reports are usually presented to

top management as one of their bases in making business decisions.
(http://en.wikipedia.org/wiki/Financial_analysis)
Research Methodology:
Introduction
In this section methodology used by the researcher in this study is
presented. This section also incorporates definitions of some of the major terms
used in the study
Research Design:
To achieve the stated objectives of the study, research design keeping in mind on
the objective of the study. In fact, the research design is the conceptual structure
within which the research is conduct. General objective; of this research study is to
examine and evaluate the financial performance of joint venture bank especially
that of EBL in order to achieve the objective, both descriptive and analytical
research design has been followed. The study focuses on the examination of
relationship between those variables that influence financial decisions of the
sampled, it is an ex-post factor research. From concerned bank different
information and necessary data were collected through annual reports and financial
statement published by related bank. The data are collected from the year 2013/14
to 2017/18.
Sources of data:
This study will be based on secondary data. The sources of data collection will be:
-Financial statement annual reports provided by bank
-Articles and other related materials published in newspaper
-Newsletters of the bank
-Relate Web sites (http://www.everestbankltd.com)
-Other related books
Population and sample:
There are thirty commercial banks operating in Nepal (NRB-banking and financial
statistics 2071 Magh). The population for this study comprises the joint venture
banks. Everest Bank Limited is selected as sample in this study.
The population for this study comprises the joint venture banks. The sample
consists of one judgmentally selected bank. Everest Bank Limited is selected as
sample in this study.

References:
Aryal, O. P. (2008) Financial Performance of Everest Bank Limited. Unpublished
MBS Thesis, Shankar Dev Campus, Tribhuvan University.
Bajracharya, P. D. (2009) Performance evaluation of Nepal Bank Ltd. Unpublished
MBS Thesis, Saraswoti Multiple Campus, Tribhuvan University.
Pandey, B. D. (2000) A Study on Financial Analysis on Himalyan Bank Limited.
Unpublished MBS Thesis, Central Department of Management, Tribhuvan
University.
Pant, P. R. (2012). Social Science Research & Thesis Writing, 6th
edition.
Kathmandu: Buddha Publication.
Thapa, K., & Rana, S. B. (2013). Investment Management, 3rd
edition.
Kathmandu: Asmita Publication.
Van Horne, J. C. (2000). Financial management & policy, 11th
edition. New Delhi:
Prentice Hall of India.
Van Horne, J. C., Wachowicz, J. M. (1997). Fundamentals of Financial
Management, New Delhi: Prentice Hall of India.