financial ratios analysis dr. ahmad subagyo
TRANSCRIPT
www.ahmadsubagyo.com1
FINANCIAL RATIOS ANALYSIS
Dr. Ahmad Subagyo

www.ahmadsubagyo.com2
Financial Ratios
A popular way to analyze financial statements is by computing ratios. A ratio is a relationship between two numbers, e.g. If ratio of A:B = 30:10==> A is 3 times B.
A ratio by itself may have no meaning. Hence, a given ratio is compared to: (a) ratios from previous years – internal time series
analysis
(b) ratios of other firms/leaders in the same industry – external cross-sectional analysis

www.ahmadsubagyo.com3
Uses of Financial Ratios: Within the Firm
Identify deficiencies in a firm’s performance and take corrective action.
Evaluate employee performance and determine incentive compensation.
Compare the financial performance of different divisions within the firm.
Prepare, at both firm and division levels, financial projections.
Understand the financial performance of the firm’s competitors.
Evaluate the financial condition of a major supplier.
www.ahmadsubagyo.com4
Uses of Financial Ratios: Outside the Firm used by
Lenders in deciding whether or not to make a loan to a company.
Credit-rating agencies in determining a firm’s credit worthiness.
Investors (shareholders and bondholders) in deciding whether or not to invest in a company.
Major suppliers in deciding whether or not to grant credit terms to a company.
www.ahmadsubagyo.com5
3. Analyzing Financial Performance: 5 Key Questions

www.ahmadsubagyo.com6
Analyzing Financial Performance:
5 Key Questions
1. How liquid is the firm?
2. Is management generating adequate operating profits on the firm’s assets?
3. How is the firm financing its assets?
4. Is management providing a good return on the capital provided by the shareholders?
5. Is the management team creating shareholder value?

www.ahmadsubagyo.com7
How Liquid Is a Firm?
Liquidity measures the firm’s ability to pay its bills on time.
It indicates the ease with which non-cash assets can be converted to cash, and also the ratio of non-cash assets to current liabilities.
www.ahmadsubagyo.com8
How Liquid Is a Firm?
Liquidity is measured by two approaches:
Comparing the firm’s current assets and current liabilities
Examining the firm’s ability to convert accounts receivables and inventory into cash on a timely basis

www.ahmadsubagyo.com9

www.ahmadsubagyo.com10

www.ahmadsubagyo.com11
Measuring Liquidity: Approach 1
Compare a firm’s current assets with current liabilities
Current Ratio Acid Test or Quick Ratio

www.ahmadsubagyo.com12
Current Ratio
Compares cash and current assets that should be converted into cash during the year with the liabilities that should be paid within the year
Formula: = Current assets/Current liabilities
Davies Example: = $143M / $64M
= 1.67
www.ahmadsubagyo.com13
Interpretation (Current ratio) Davies has $2.23 in current assets for
every $1 in current liabilities.
The average is higher than the peer group’s ratio of 1.80.

www.ahmadsubagyo.com14
Acid Test or Quick Ratio
Compares cash and current assets (minus inventory) that should be converted into cash during the year with the liabilities that should be paid within the year.
Formula: = Cash and accounts receivable/Current liabilities
Davies Example= ($20M + $36M) / $64M
=0.88

www.ahmadsubagyo.com15
Interpretation (Quick Ratio) Davis has 88 cents in quick assets for
every $1 in current liabilities.
Davis is less liquid compared to its peers that have 94 cents for every $1 in current liabilities.

www.ahmadsubagyo.com16
Measuring Liquidity: Approach 2
Measures a firm’s ability to convert accounts receivable and inventory into cash Average Collection Period
Accounts Receivable Turnover
Inventory Turnover
Cash Conversion Cycle

www.ahmadsubagyo.com17
Average Collection Period
How long does it take to collect the firm’s receivables?
Formula: Accounts receivable/(Annual credit sales/365)
Davies Example:
= $36M / ($600M/365)= 21.9 days
Davis is faster than peers (25 days) in collecting the accounts receivable.
www.ahmadsubagyo.com18
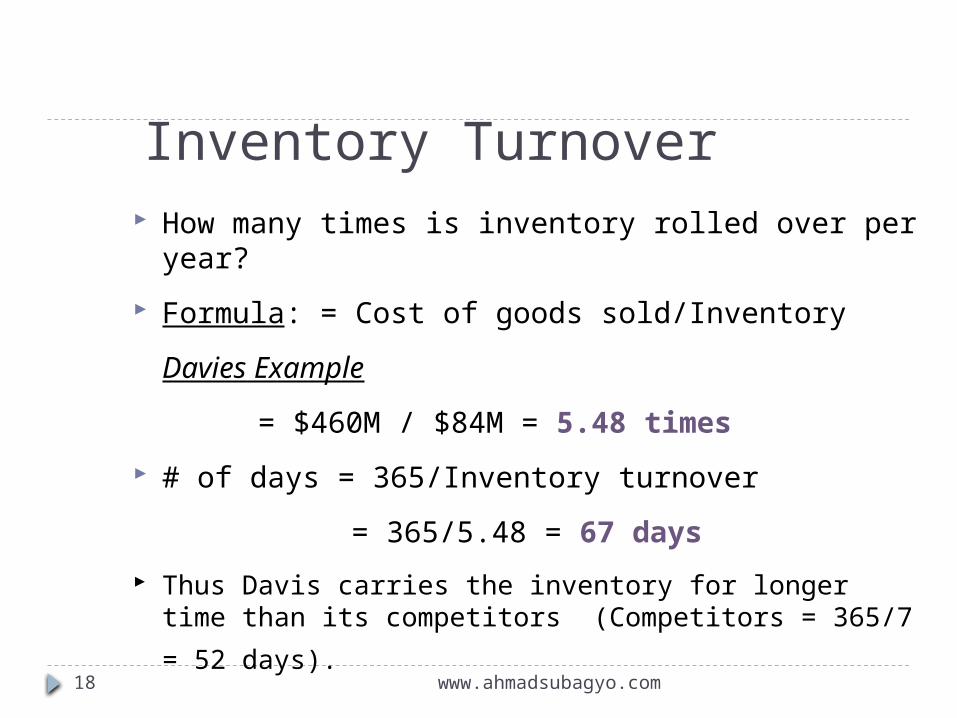
Inventory Turnover How many times is inventory rolled over per year?
Formula: = Cost of goods sold/Inventory
Davies Example
= $460M / $84M = 5.48 times
# of days = 365/Inventory turnover
= 365/5.48 = 67 days
Thus Davis carries the inventory for longer time than its
competitors (Competitors = 365/7 = 52 days).

www.ahmadsubagyo.com19
Davis vs. Peer Group: Question #1 Summary
Ratio Davis PeersCurrentRatio
1.67 1.80
QuickRatio
.88 .94
Avg. Collection Period
21.9 25
Inventory Turnover (days in inventory)
5.48 (67) 7 (52)

www.ahmadsubagyo.com20
Are the Firms’ Managers Generating Adequate Operating Profits on the Firm’s Assets?
This question focuses on the profitability of the assets in which the firm has invested. We will consider the following ratios to answer the question: Operating Return on Assets
Operating Profit Margin
Total Asset Turnover
Fixed Asset Turnover
www.ahmadsubagyo.com21
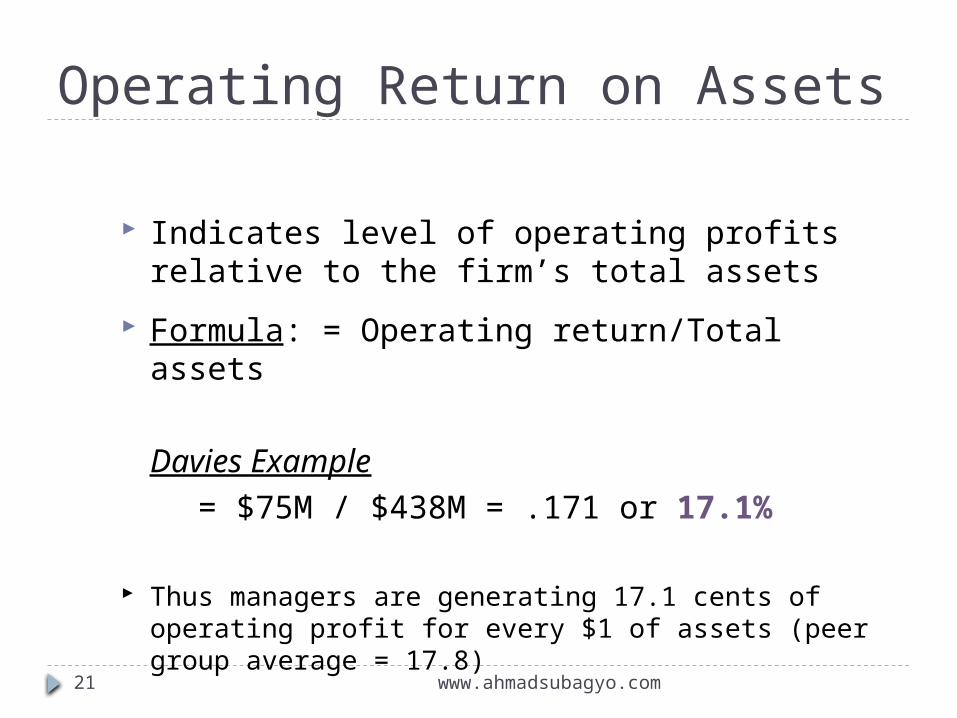
Operating Return on Assets
Indicates level of operating profits relative to the firm’s total assets
Formula: = Operating return/Total assets
Davies Example= $75M / $438M = .171 or 17.1%
Thus managers are generating 17.1 cents of operating profit for every $1 of assets (peer group average = 17.8)

www.ahmadsubagyo.com22
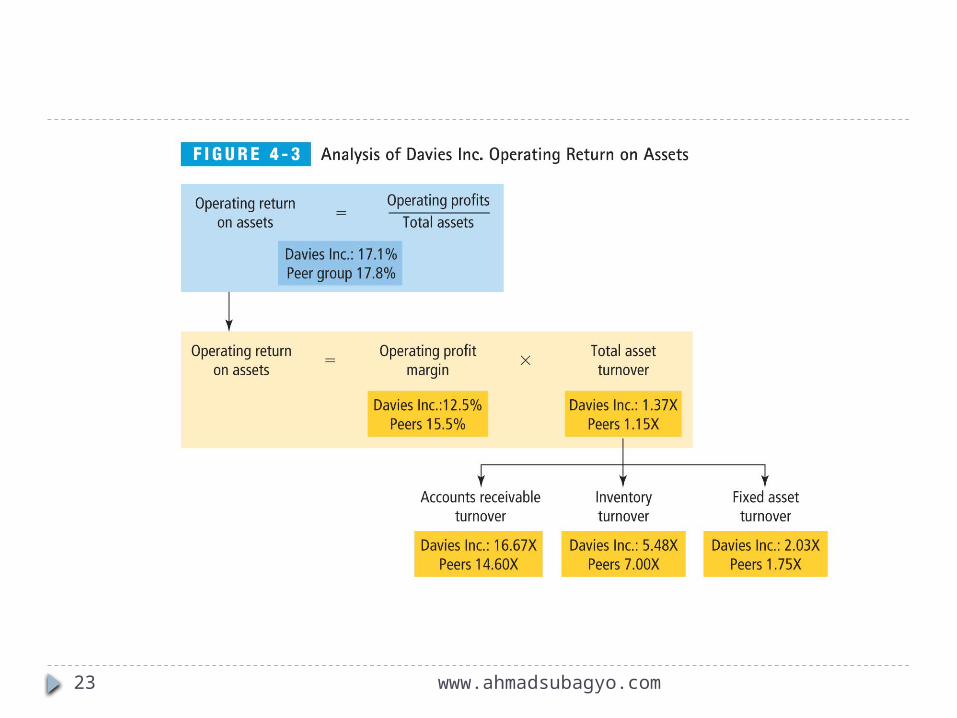
Dis-aggregation of Operating Return on Assets Operating return on assets = operating
profits/total assets
= operating profit/sales * sales/assets
=operating profit margin * total asset turnover
www.ahmadsubagyo.com23

www.ahmadsubagyo.com24
Managing Operations: Operating Profit Margin
Examines how effective the company is in managing its cost of goods sold and operating expenses that determine the operating profit.
Formula: = Operating profit/Sales
Davies Example
=$75M / $600M = .125 or 12.5%
Davies managers are not as good as peers in managing the cost of goods sold and operating expenses, as the average for peers is higher at 15.5%

www.ahmadsubagyo.com25
Managing Assets: Total Asset Turnover
How efficiently a firm is using its assets in generating sales
Formula: = Sales/Total assets
Davies Example
= $600M / $538M = 1.37X Davies is generating $1.37 in sales for every $1
invested in assets, which is higher than the peers average of $1.15.
www.ahmadsubagyo.com26
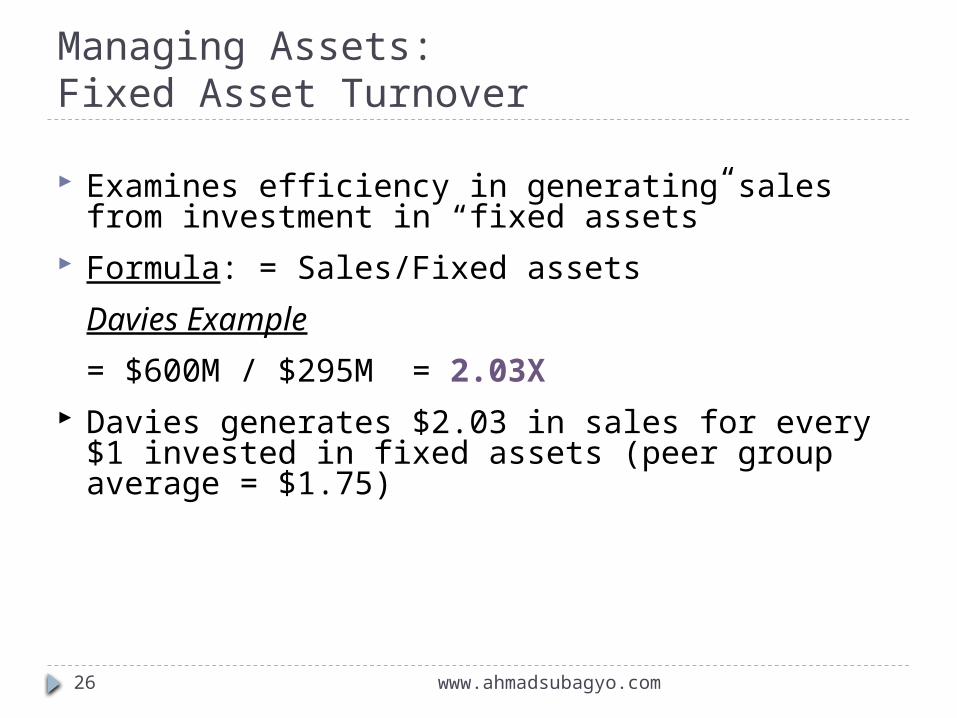
Managing Assets:Fixed Asset Turnover
Examines efficiency in generating sales from investment in “fixed assets”
Formula: = Sales/Fixed assets
Davies Example
= $600M / $295M = 2.03X Davies generates $2.03 in sales for every $1
invested in fixed assets (peer group average = $1.75)
www.ahmadsubagyo.com27
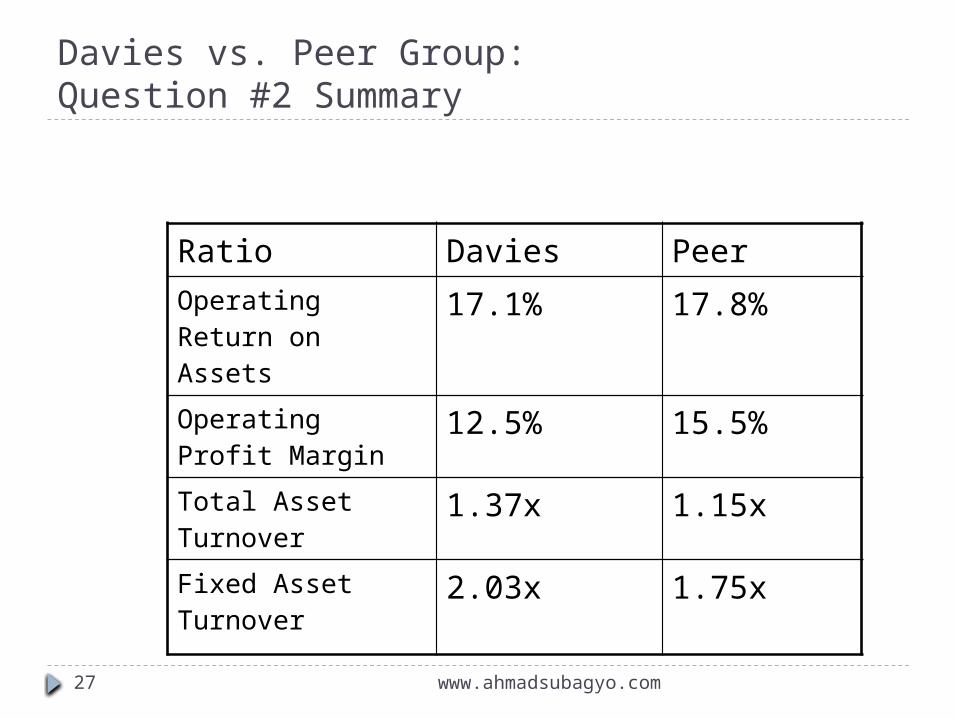
Davies vs. Peer Group:Question #2 Summary
Ratio Davies PeerOperating Return on Assets
17.1% 17.8%
Operating Profit Margin
12.5% 15.5%
Total Asset Turnover 1.37x 1.15x
Fixed Asset Turnover
2.03x 1.75x
www.ahmadsubagyo.com28
How Is the Firm Financing Its Assets?
Here we examine the question: Does the firm finance its assets by debt or equity or both? We use the following two ratios to answer the question: Debt Ratio
Times Interest Earned
www.ahmadsubagyo.com29
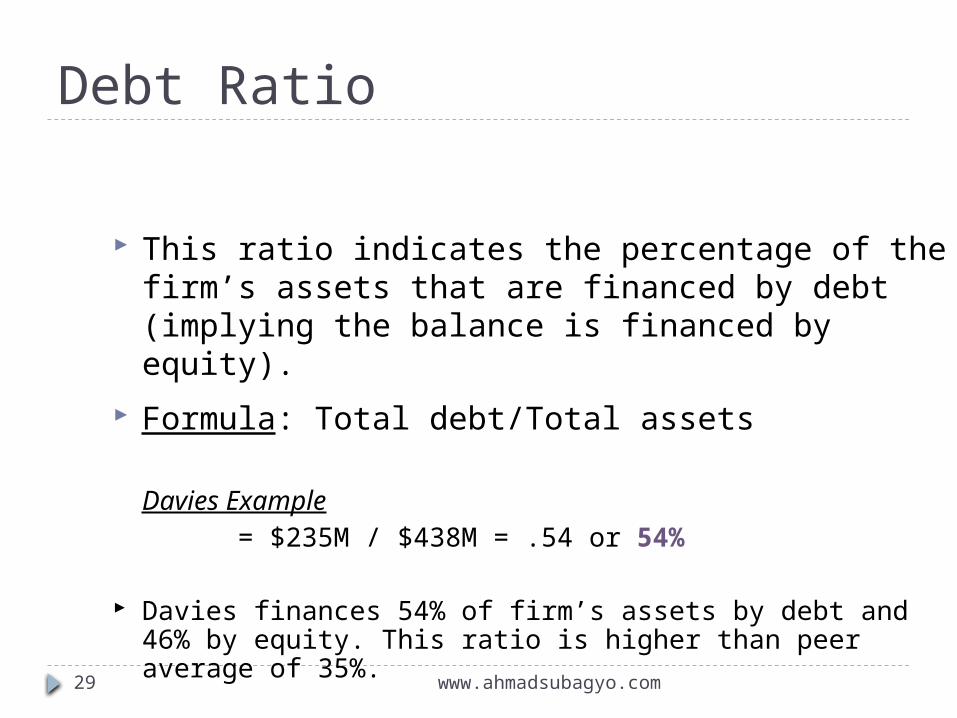
Debt Ratio
This ratio indicates the percentage of the firm’s assets that are financed by debt (implying the balance is financed by equity).
Formula: Total debt/Total assets
Davies Example= $235M / $438M = .54 or 54%
Davies finances 54% of firm’s assets by debt and 46% by equity. This ratio is higher than peer average of 35%.

www.ahmadsubagyo.com30
Times Interest Earned
This ratio indicates the amount of operating income available to service interest payments
Formula: = Operating income/Interest Davies Example
=$75M / $15M = 5.0X
Davies operating income are 5 times the annual interest expense or 20% of the operating profits goes towards servicing the debt.

www.ahmadsubagyo.com31
Davies vs. Peer Group:Question #3 Summary
Ratio Davies PeersDebt Ratio 54% 35%
Times Interest Earned
5X 7X

www.ahmadsubagyo.com32
Are the Firm’s Managers Providing a Good Return on the Capital Provided by the Shareholders? Are the earnings available to shareholders
attractive? This is analyzed by computing the firm’s accounting return on common stockholder’s investment or return on equity (ROE).
Formula:= Net income/Common equity
Note, common equity includes both common stock and retained earnings
www.ahmadsubagyo.com33
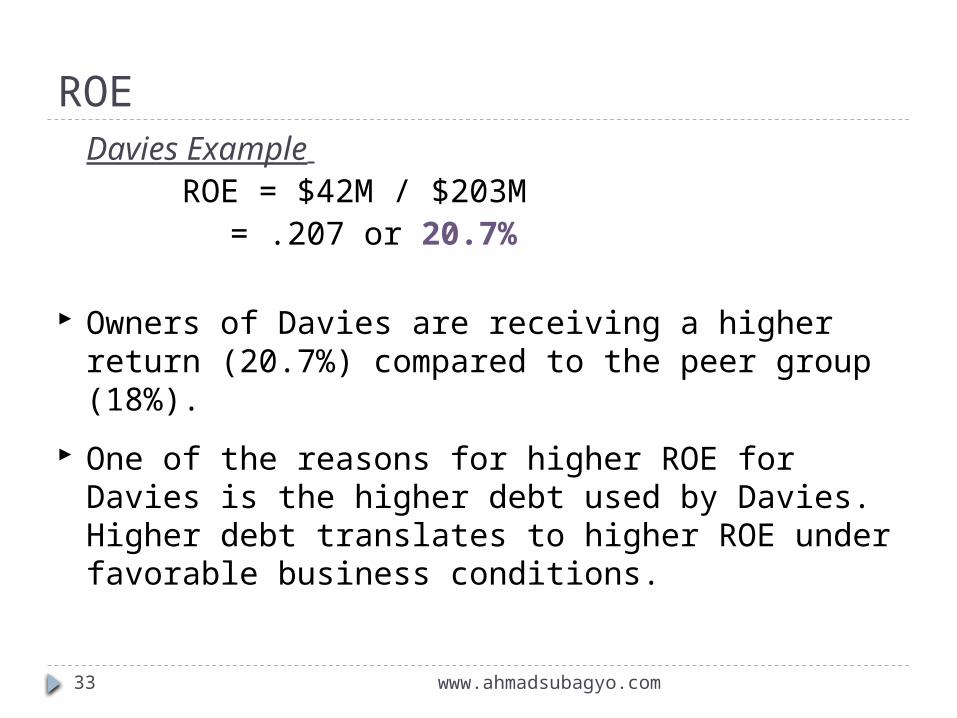
ROEDavies Example
ROE = $42M / $203M = .207 or 20.7%
Owners of Davies are receiving a higher return (20.7%) compared to the peer group (18%).
One of the reasons for higher ROE for Davies is the higher debt used by Davies. Higher debt translates to higher ROE under favorable business conditions.

www.ahmadsubagyo.com34

www.ahmadsubagyo.com35
Question #4 Summary:Davies vs. Peer Group
Ratio Davies Peers
Return onEquity
12.9% 12.0%

www.ahmadsubagyo.com36
Are the Firm’s Management Creating Shareholder Value?
We can use two approaches to answer this question:
Market value ratios (P/E)
Economic Value Added (EVA)
These ratios indicate what investors think of management’s past performance and future prospects.

www.ahmadsubagyo.com37
Price/Earnings Ratio
Measures how much investors are willing to pay for $1 of reported earnings
Formula: Price per share/Earnings per share
Davies Example
=$32.00 / $2.10 = 15.24X
Investors are willing to pay less for Davies for every dollar of earnings compared to peers ($15.24 for Davies versus $19 for peers)

www.ahmadsubagyo.com38
Price/Book Ratio Compares the market value of a share of stock
to the book value per share of the reported equity on the balance sheet.
Formula: = Price per share/Equity book value per share
Davies Example
= $32.00 / $10.15= 3.15X A ratio greater than 1 indicates that the shares are more
valuable than what the shareholders originally paid. However, the ratio is lower than the S&P average of 3.70.

www.ahmadsubagyo.com39
Economic Value Added (EVA)
How is shareholder value created?
If the firm earns a return on capital that is greater than the investors’ required rate of return.
EVA attempts to measure a firm’s economic profit, rather than accounting profit.
EVA recognizes a cost of equity in addition to the cost of debt (interest expense).
www.ahmadsubagyo.com40
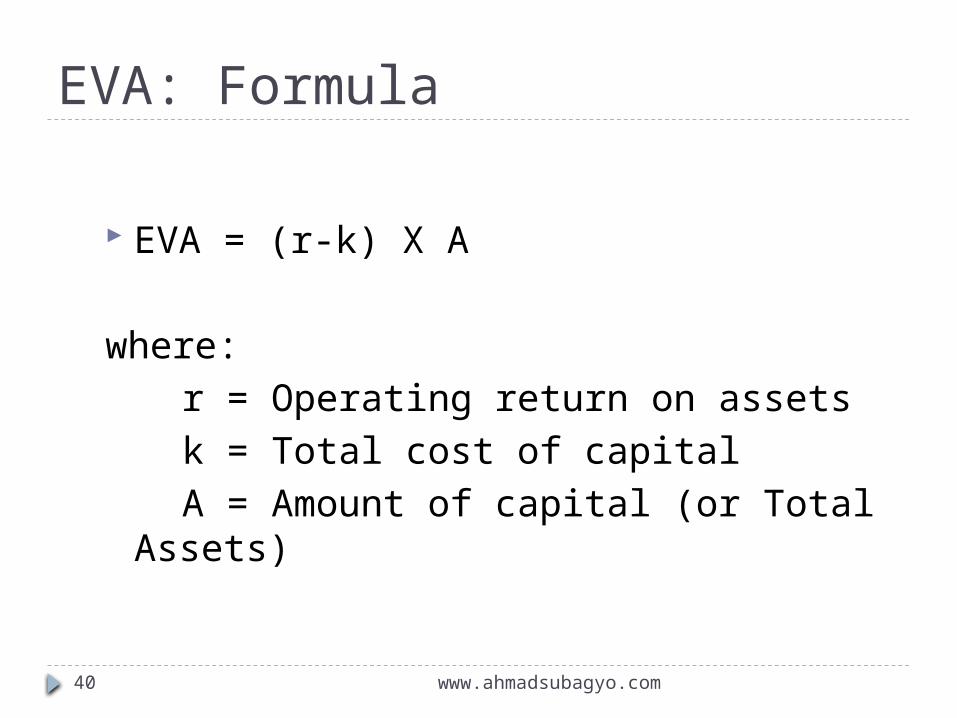
EVA: Formula
EVA = (r-k) X A
where: r = Operating return on assetsk = Total cost of capitalA = Amount of capital (or Total
Assets)

www.ahmadsubagyo.com41
EVA Example
A firm has total assets of $5,000 and has raised money from both debt and equity in equal proportion. Further, assume that cost of debt is 8% and the cost of equity is 16%. Assume the firm earns 17% operating income on its investments.
EVA = (17%-12%)* $5,000 = $250
Where, cost of capital = .5*(8%) + .5*(16%) = 12%
www.ahmadsubagyo.com42
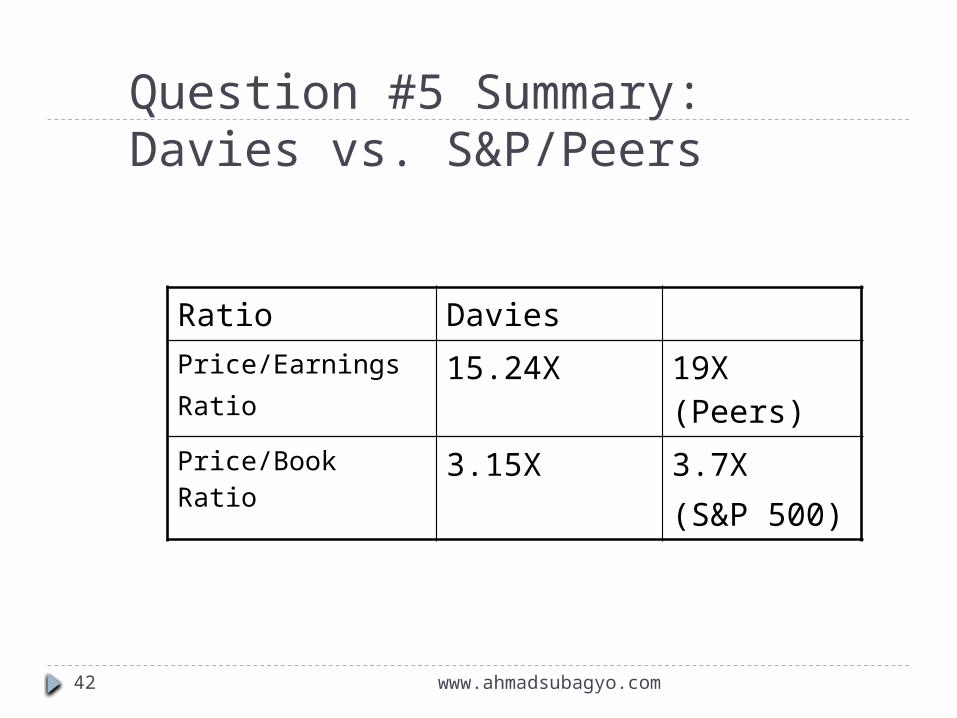
Question #5 Summary:Davies vs. S&P/Peers
Ratio DaviesPrice/EarningsRatio
15.24X 19X (Peers)
Price/Book Ratio 3.15X 3.7X(S&P 500)

www.ahmadsubagyo.com43
4.Limitations of Financial Ratio Analysis
1. Difficult to identify industry categories or comparable peers.
2. Published peer group or industry averages are only approximations.
3. Industry averages may not provide a desirable target ratio or norm.
4. Accounting practices differ widely among firms
5. A high or low ratio does not automatically lead to a specific favorable or unfavorable conclusion.
6. Seasons may bias the numbers in the financial statements.

www.ahmadsubagyo.com44
End Of Part Two